hague yearly review 2021 – executive summary
TRANSCRIPT

Hague Yearly Review 2021 – Executive Summary
International Registration of Industrial Designs

This executive brief identifies key trends in the use of the WIPO-administered Hague System for the International Registration of Industrial Designs. For fuller statistics, see the Hague Yearly Review 2021 – available in English at: www.wipo.int/ipstats

1
Key numbers for 2020
5,792 (–1.7%)International applications
6,795 (+34.8%)International registrations
24,126 (–3.2%)Designations in international applications
27,339 (+30.3%)Designations in international registrations
4,759 (+34.2%)Renewals of international registrations
44,096 (+6.3%)International registrations in force
18,580 (–15%)Designs contained in international applications
23,671 (+27.7%)Designs contained in international registrations
75,345 (–11.8%) Designs contained in designations in international applications
89,549 (+21.6%) Designs contained in designations in international registrations
21,559 (+25.1%) Designs contained in renewals of international registrations
172,217 (+5.1%) Designs contained in international registrations in force

2
After 13 consecutive years of growth, the number of designs contained in applications filed under the Hague System declined by 15% in 2020
The number of international applications for the protection of designs filed un-der the World Intellectual Property Organization (WIPO) administered Hague System amounted to 5,792 applications in 2020, representing a 1.7% decline on the previous year (figure A1). Moreover, the number of designs contained in those applications fell by 15% to 18,580 designs – the first decline since 2006 (figure A2). A considerable drop in the number of designs originating from Germany, Italy and the Republic of Korea partly accounts for the overall decrease seen in 2020.
International applications declined 1.7% in 2020 to 5,792 applications.A1. Trend in international applications, 2010–2020
Source: WIPO Statistics Database, March 2021.
2,527 2,6123,022 2,933
4,187
5,5805,256 5,451
5,895 5,792
+5.9% +3.4%+15.7% –2.9%
+42.8%
+33.3%–5.8% +3.7%
+8.1% –1.7%
0
1,000
2,000
3,000
4,000
5,000
6,000
Hag
ue a
pplic
atio
ns
and
annu
al g
row
th ra
tes
2010 2011 2012 2013 2014 2015 2016 2017 2018 2019 2020
Application year

3
Designs contained in international applications fell 15% in 2020 down to 18,580 designs. A2. Trend in the number of designs contained in international applications, 2010–2020
Source: WIPO Statistics Database, March 2021.
Applicants from at least 67 countries or territories filed one or more Hague application
The accession of Israel, Mexico and Samoa in 2020 brought the number of Hague members to 74. These 74 Hague members make it possible for applicants to obtain protection for their designs within a geographical area incorporating a total of 91 countries. The difference between the number of Hague mem-bers and the number of countries covered by the System is due to the African Intellectual Property Organization (OAPI) and the European Union (EU) being Hague members. By choosing to designate these intergovernmental organi-zations within an application, protection is sought simultaneously within all their respective member states. In 2020, around 2,290 applicants from at least 67 countries or territories filed one or more Hague international application.
11,215 11,553 12,295
14,359
16,583
18,80219,745 19,767
21,861
18,580
+3.9% +3.0% +6.4%
+16.8%
+15.5%
+13.4%+5.0% +0.1%
+10.6%
–15.0%
0
5,000
10,000
15,000
20,000
Des
igns
in H
ague
app
licat
ions
an
d an
nual
gro
wth
rate
s
2010 2011 2012 2013 2014 2015 2016 2017 2018 2019 2020
Application year

4
Germany, with 3,666 designs, continued to be the biggest source of designs for the Hague System
Despite a decrease of 18.7%, Germany, with 3,666 designs, continues to be the main source of designs for the Hague System (figure A3). The United States of America (U.S.) (2,211 designs) moved up from 6th to second position. Switzerland, the Republic of Korea and Italy ranked third, fourth and fifth, respectively, with 1,944, 1,669 and 1,231 designs. Japan – a recent member – has gradually moved up the ranking. It was the seventh largest user of the Hague System in 2020. China, which is not a member of the Hague System, ranked in ninth po-sition. Among the top 10 origins, the U.S. (+62.7%), Turkey (+34.7%) and China (+22.7%) are the only three to have registered growth in 2020.
Despite a substantial decline in applications, Germany remained the main source of designs for the Hague System, with 3,666 designs in 2020.A3. Designs contained in international applications for the top 10 origins, 2020
Source: WIPO Statistics Database, March 2021.
3,666
2,2111,944
1,669
1,231999 942 936 826
524
–18.7%
+62.7%–10.8%
–39.0%
–38.3%–28.2% –18.2% –27.8% +22.7%
+34.7%
Des
igns
in H
ague
app
licat
ions
an
d an
nual
gro
wth
rate
s
German
yU.S.
Switzerl
and
Repub
lic of
Korea
Italy
Netherl
ands
Japa
n
France
China
Turkey
Origin

5
Applicants based in Europe accounted for 64.2% of all designs filed in 2020 (figure A4). This reflects the membership of the Hague System, the vast majority of whom are European countries. However, following the recent accession of Japan and the Republic of Korea, the proportion of designs originating from Asia increased from 3.1% in 2010 to 23% in 2020. Similarly, accession by Canada and the U.S. led to an increase in North America’s share from 7.8% in 2010 to 12.8% in 2020. The combined share of Africa, Latin America and the Caribbean (LAC) and Oceania is only 0.5%.
Applicants based in Europe accounted for 64.2% of all designs filed in 2020.A4. Designs contained in international applications by region, 2010 and 2020
Note: LAC is the Latin America and the Caribbean.
Source: WIPO Statistics Database, March 2021.
86.5%Europe3.1%Asia7.8%North America0.6%Africa0.0%Oceania0.1%LAC1.9%Unknown
2010
64.2%Europe23.0%Asia12.8%North America0.3%Africa0.1%Oceania0.1%LAC0.1%Unknown
2020

6
Which companies had the most designs published in 2020?
For a fourth consecutive year, Samsung Electronics of the Republic of Korea with 859 designs published headed the list of top filers, followed by Procter & Gamble of the U.S. (623), Fonkel Meubelmarketing of the Netherlands (569), Volkswagen of Germany (524) and Beijing Xiaomi Mobile Software of China (516) (table A5). For the first time, a company from China is among the top five applicants. The top 10 applicants list is comprised of three applicants from Germany, two applicants each from the Netherlands, the Republic of Korea and the U.S., and one from China.
Lampenwelt of Germany is a new user of the Hague System and ranked in 10th spot, with 276 designs. Among the top 10 applicants, Wenko-Wenselaar of Germany (with 352 additional designs in 2020) and Beijing Xiaomi Mobile Software of China (+344 designs) registered the fastest increase in published designs recorded between 2019 and 2020.
For a fourth consecutive year, Samsung Electronics of the Republic of Korea headed the list of top filers. A5. Top Hague applicants, 2018–2020
Ranking Applicant's name Origin
Number of designs contained in published
registrations
2018 2019 2020
1 SAMSUNG ELECTRONICS CO., LTD. Republic of Korea 863 929 859
2 PROCTER & GAMBLE CO. U.S. 561 405 623
3 FONKEL MEUBELMARKETING B.V. Netherlands 408 859 569
4 VOLKSWAGEN AG Germany 268 536 524
5 BEIJING XIAOMI MOBILE SOFTWARE CO., LTD.
China14 172 516
6 LG ELECTRONICS INC. Republic of Korea 715 598 478
7 KONINKLIJKE PHILIPS ELECTRONICS N.V. Netherlands 164 371 463
8 WENKO-WENSELAAR GMBH & CO. KG Germany 282 10 362
9 MAGIC LEAP, INC. U.S. 5 63 320
10 LAMPENWELT GMBH Germany 0 0 276
Note: For confidentiality reasons, data are based on published registrations and on the publication date.
Source: WIPO Statistics Database, March 2021.

7
Where do Hague applicants seek protection for their designs?
The Hague System simplifies the process of multinational registration by creating a single international procedure for protecting a design in multiple jurisdictions. Applicants list those Hague members in whose jurisdictions they wish to protect their designs (known as “designated members”).
The EU was the most designated Hague member in international applications in 2020, with 4,149 designations containing 13,268 designs (figure A6). The EU has been the most designated member since 2010. It was followed by Switzerland (7,853 designs), the United Kingdom (U.K.) (6,494), the U.S. (5,038) and Turkey (4,665). Among top 10 designated member, the U.K. (+49%) recorded the fastest growth, whereas Norway (−33.1%) experienced the steepest decline.
Of the top 10 designated members, the U.K. had the strongest growth in designs in designations in 2020.A6. Designs contained in designations in international applications for the top 10 designated Hague members, 2020
Source: WIPO Statistics Database, March 2021.
13,268
7,8536,494
5,038 4,665
2,886 2,577 2,415 2,305 2,282
–18.9%
–17.9%+49.0%
–9.4% –20.7%
+4.4% –33.1% +12.1% –25.8% –32.0%
Des
igns
in H
ague
app
licat
ions
an
d an
nual
gro
wth
rate
s
Europe
an U
nion
Switzerl
and
U.K.U.S.
Turkey
Japa
n
Norway
Canad
a
Russia
n Fed
eratio
n
Singap
ore
Hague member

8
Which classes were most frequently specified in international applications?
Designs relating to means of transport (Class 12; 10.1%) accounted for the larg-est share of total designs in 2020, followed by recording and communication equipment (Class 14; 8.9%), packages and containers (Class 9; 8.4%), furnishing (Class 6; 7.4%) and lighting apparatus (Class 26; 6.9%). Combined, the top 10 most specified classes accounted for 65.6% of all designs in 2020 (table A7).
Among the top 10 classes, pharmaceutical and cosmetic products (+42.8%) saw a sizeable growth in 2020. This, combined with the top growth of 262% in designs relating to the prevention of accidents (class 29) and another strong 45% growth in designs relating to medical and laboratory equipment (class 24), reflects the innovation taking place as part of the collective response to the COVID-19 pandemic.
Designs related to means of transport (10.1%) accounted for the largest share of total designs in 2020.A7. Designs contained in international applications by class, 2018–2020
Class 2018 2019 2020
Growth rate (%):
2019–2020
2020 share of total (%)
Class 12: Means of transport 1,662 2,075 1,879 –9.4 10.1
Class 14: Recording and communication equipment 2,031 2,971 1,653 –44.4 8.9
Class 9: Packages and containers 1,220 1,441 1,568 8.8 8.4
Class 6: Furnishing 2,352 2,187 1,379 –36.9 7.4
Class 26: Lighting apparatus 1,196 1,357 1,278 –5.8 6.9
Class 11: Articles of adornment 866 960 1,033 7.6 5.6
Class 23: Heating and cooling equipment 1,064 1,173 998 –14.9 5.4
Class 7: Household goods 709 773 836 8.2 4.5
Class 25: Building units and construction elements 505 812 793 –2.3 4.3
Class 28: Pharmaceutical and cosmetic products 785 542 774 42.8 4.2
Source: WIPO Statistics Database, March 2021.
9
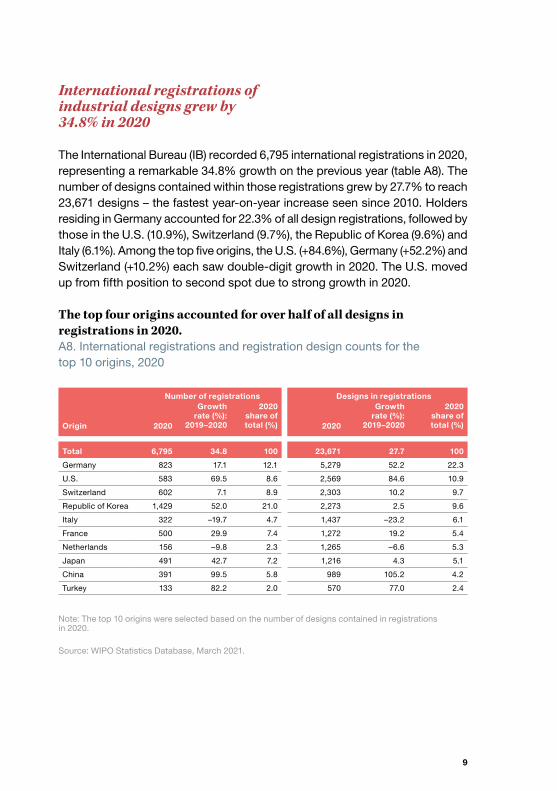
International registrations of industrial designs grew by 34.8% in 2020
The International Bureau (IB) recorded 6,795 international registrations in 2020, representing a remarkable 34.8% growth on the previous year (table A8). The number of designs contained within those registrations grew by 27.7% to reach 23,671 designs – the fastest year-on-year increase seen since 2010. Holders residing in Germany accounted for 22.3% of all design registrations, followed by those in the U.S. (10.9%), Switzerland (9.7%), the Republic of Korea (9.6%) and Italy (6.1%). Among the top five origins, the U.S. (+84.6%), Germany (+52.2%) and Switzerland (+10.2%) each saw double-digit growth in 2020. The U.S. moved up from fifth position to second spot due to strong growth in 2020.
The top four origins accounted for over half of all designs in registrations in 2020.A8. International registrations and registration design counts for the top 10 origins, 2020
Number of registrations Designs in registrations
Origin 2020
Growth rate (%):
2019–2020
2020 share of total (%) 2020
Growth rate (%):
2019–2020
2020 share of total (%)
Total 6,795 34.8 100 23,671 27.7 100
Germany 823 17.1 12.1 5,279 52.2 22.3
U.S. 583 69.5 8.6 2,569 84.6 10.9
Switzerland 602 7.1 8.9 2,303 10.2 9.7
Republic of Korea 1,429 52.0 21.0 2,273 2.5 9.6
Italy 322 –19.7 4.7 1,437 –23.2 6.1
France 500 29.9 7.4 1,272 19.2 5.4
Netherlands 156 –9.8 2.3 1,265 –6.6 5.3
Japan 491 42.7 7.2 1,216 4.3 5.1
China 391 99.5 5.8 989 105.2 4.2
Turkey 133 82.2 2.0 570 77.0 2.4
Note: The top 10 origins were selected based on the number of designs contained in registrations in 2020.
Source: WIPO Statistics Database, March 2021.

10
Registrations in force grew by 6.3% in 2020
The number of registrations in force (active registrations) rose by 6.3% in 2020, marking an eleventh consecutive year of growth. The approximately 44,100 registrations in force contained around 172,200 designs (figure A9). Both reg-istrations in force and the designs contained in those registrations are concen-trated in a small number of countries, with holders residing in Germany (25.8%), Switzerland (17.4%) and France (9.2%) together accounting for around 52.4% of all active designs in 2020 (A10).
Around 44,100 international registrations were in force in 2020 – a 6.3% increase on the previous year.A9. International registrations in force, 2010–2020
25,547 25,736 26,446 27,30129,282
32,36935,033
38,02941,497
44,096
+1.3% +0.7% +2.8% +3.2%+7.3%
+10.5%+8.2%
+8.6%+9.1%
+6.3%
0
10,000
20,000
30,000
40,000
Hag
ue re
gist
ratio
ns in
forc
e an
d an
nual
gro
wth
rate
s
2010 2011 2012 2013 2014 2015 2016 2017 2018 2019 2020
Year
Source: WIPO Statistics Database, March 2021.

11
The combined share of holders residing in Germany and Switzerland decreased from 52% in 2015 down to 43.2% in 2020.A10. Share of designs contained in international registrations in force for the top six origins, 2015 and 2020
Source: WIPO Statistics Database, March 2021.
Nine out of 10 international applications are filed in English
In 2020, 90.4% of Hague applications were filed in English, whereas French accounted for 8.6% and Spanish just 1% (figure A11). Up until 1998, over half of all filings were made in French, since when English has been the preferred language for applications. Only two Spanish-speaking countries – Mexico and Spain – are members of the Hague System, which explains the low share of applications filed in Spanish.
Nine out of 10 international applications are now filed in English. A11. Distribution of international applications by language of filing, 2010–2020
Note: International applications can be filed in English, French or Spanish.
Source: WIPO Statistics Database, March 2021.
30.3%Germany21.7%Switzerland13.1%France8.5%Italy5.4%U.S.4.2%Netherlands16.8%Others
2015
25.8%Germany17.4%Switzerland9.2%France7.4%Italy7.4%U.S.5.9%Republic of Korea26.9%Others
2020
ENGLISH FILING SHARE (%)78.7 77.9 77.2 78.0 79.5 81.9 86.6 86.7 86.2 89.3 90.4
1,000
2,000
3,000
4,000
5,000
6,000
Hag
ue a
pplic
atio
ns
2010 2011 2012 2013 2014 2015 2016 2017 2018 2019 2020
Application year
ENGLISH FRENCH SPANISH

12
The IB distributed CHF 11.14 million to designated offices in 2020
In 2020, the IB distributed 11.14 million Swiss francs (CHF) to all designated offices, representing an increase of 51.5% on 2019 (table A12). Japan received the largest share (25.6%), followed by the U.S. (21.4%), the EU (14.1%) and the Republic of Korea (10.5%).
Combined, the EU, Japan, the Republic of Korea and the U.S. received 71.5% of the CHF 11.1 million distributed to designated members in 2020.A12. Fees distributed to designated offices by the IB, 2019–2020
Office 2019 2020Growth rate (%):
2019–20202020 share of total (%)
Total 7,354,120.0 11,140,338.0 51.5 100.0
Japan 1,429,085 2,846,889 99.2 25.6
U.S. 1,837,770 2,383,249 29.7 21.4
EU 1,285,606 1,569,473 22.1 14.1
Republic of Korea 584,045 1,166,557 99.7 10.5
Canada 394,200 888,208 125.3 8.0
Switzerland 299,019 350,934 17.4 3.2
Russian Federation 237,661 262,851 10.6 2.4
Norway 114,325 121,704 6.5 1.1
African Intellectual Property Organization 52,034 110,203 111.8 1.0
Turkey 91,932 101,602 10.5 0.9
Source: WIPO Statistics Database, March 2021.


World Intellectual Property Organization34, chemin des ColombettesP.O. Box 18CH-1211 Geneva 20Switzerland
Tel: + 41 22 338 91 11Fax: + 41 22 733 54 28
For contact details of WIPO’s External Offices visit: www.wipo.int/about-wipo/en/offices
© WIPO, 2021
Attribution 3.0 IGO
(CC BY 3.0 IGO)
The CC license does not apply to
non-WIPO content in this publication.
Photo: Getty Images / Ninel Roshchina
WIPO Reference No. 930/21/ExSum/E