hai 2015 progress report pdf - centers for disease … 2015 progress report pdf - centers for...
TRANSCRIPT
NATIONAL AND STATE
HEALTHCARE ASSOCIATED INFECTIONS
PROGRESS REPORT
THIS REPORT IS BASED ON 2013 DATA, PUBLISHED JANUARY 2015

THIS REPORT IS BASED ON 2013 DATA, PUBLISHED JANUARY 2015.
NATIONAL AND STATE HEALTHCARE-ASSOCIATED INFECTIONS PROGRESS REPORT
TABLE OF CONTENTS
Executive Summary* . . . . . . . . . . . . . . . . . . . . . . . . . . . . . . . . . . . . . . . . . . . . . . . . . . . . . . 3
State Progress Landscape* . . . . . . . . . . . . . . . . . . . . . . . . . . . . . . . . . . . . . . . . . . . . . . . . . . 6
Central Line-associated Bloodstream Infections . . . . . . . . . . . . . . . . . . . . . . . . . . . . . . . . . . . . . . 7
Catheter-associated Urinary Tract Infections . . . . . . . . . . . . . . . . . . . . . . . . . . . . . . . . . . . . . . . . 9
Surgical Site Infections . . . . . . . . . . . . . . . . . . . . . . . . . . . . . . . . . . . . . . . . . . . . . . . . . 11
Hospital-onset Methicillin-resistant Staphylococcus aureus (MRSA) Bacteremia . . . . . . . . . . . . . . . . . . . . . . 15
Hospital-onset Clostridium difficile Infections . . . . . . . . . . . . . . . . . . . . . . . . . . . . . . . . . . . . . . 17
National Progress . . . . . . . . . . . . . . . . . . . . . . . . . . . . . . . . . . . . . . . . . . . . . . . . . . . . . . 19
Individual State Progress . . . . . . . . . . . . . . . . . . . . . . . . . . . . . . . . . . . . . . . . . . . . . . . . . . . 23
Alabama
Alaska
Arizona
Arkansas
California
Colorado
Connecticut
Delaware
District of Columbia
Florida
Georgia
Hawaii
Idaho
Illinois
Indiana
Iowa
Kansas
Kentucky
Louisiana
Maine
Maryland
Massachusetts
Michigan
Minnesota
Mississippi
Missouri
Montana
Nebraska
Nevada
New Hampshire
New Jersey
New Mexico
New York
North Carolina
North Dakota
Ohio
Oklahoma
Oregon
Pennsylvania
Puerto Rico
Rhode Island
South Carolina
South Dakota
Tennessee
Texas
Utah
Vermont
Virginia
Washington
West Virginia
Wisconsin
Wyoming
Call to Action . . . . . . . . . . . . . . . . . . . . . . . . . . . . . . . . . . . . . . . . . . . . . . . . . . . . . . . . 128
Technical Appendix . . . . . . . . . . . . . . . . . . . . . . . . . . . . . . . . . . . . . . . . . . . . . . . . . . . . . . 129
Glossary . . . . . . . . . . . . . . . . . . . . . . . . . . . . . . . . . . . . . . . . . . . . . . . . . . . . . . . . . . . 134
*Updated March 2015
3NATIONAL AND STATE HEALTHCARE-ASSOCIATED INFECTIONS PROGRESS REPORT
EXECUTIVE SUMMARY
Healthcare-associated infections (HAIs) are a major, yet
often preventable, threat to patient safety . The Centers
for Disease Control and Prevention (CDC) is committed
to helping all Americans receive the best and safest care . The
National and State Healthcare-Associated Infections Progress
Report (HAI Progress Report) expands and provides an update
on the previous reports detailing progress toward the ultimate
goal of eliminating healthcare-associated infections . The Report
can serve as a reference for anyone looking for information about
national and state HAI prevention progress . It is specifically
designed to be accessible to many audiences . For detailed
methods and references, please refer to the Technical Appendix
within this report . For complete data tables and a glossary of
terms, please visit CDC’s HAI Progress Report website at
www .cdc .gov/hai/progress-report .
To help improve patient safety, CDC tracks infections, responds to
outbreaks, provides infection prevention expertise and guidelines,
spearheads prevention research, and serves as the nation’s gold-
standard laboratory . CDC’s National Healthcare Safety Network
(NHSN), the nation’s healthcare-associated infection tracking
system, is critical in this work . More than 13,000 hospitals
and other healthcare facilities provide data to NHSN . This vital
information is then used for reporting, including in this HAI
Progress Report, and for care improvement by facilities, states,
regions, quality groups, and national public health agencies
including CDC .
This HAI Progress Report includes national and state-by-state
summaries of six HAI types based on 2013 data . The Report
helps measure progress toward the HAI prevention goals outlined
in the National Action Plan to Prevent Health Care-Associated
Infections: Road Map to Elimination (HAI Action Plan) set by
the U .S . Department of Health and Human Services (HHS) .
Progress is measured using the standardized infection ratio (SIR),
a summary statistic that can be used to track HAI prevention
progress over time . The individual state progress reports include
infection-specific SIRs, progress in reducing HAIs, and state
prevention efforts . These customized reports can aid in identifying
areas in need of improvement from a national level and within
specific states .
Data in this report are from acute care hospitals only . National
and state-level data include: central line-associated bloodstream
infections (CLABSI), catheter-associated urinary tract infections
(CAUTI), surgical site infections (SSI), hospital-onset Clostridium
difficile infections (C . difficile), and hospital-onset methicillin-
resistant Staphylococcus aureus (MRSA) bacteremia (bloodstream
infections) . This is the first report that includes state-specific
Note: Updated March 2015 to correct data points regarding states that performed worse than the nation

4NATIONAL AND STATE HEALTHCARE-ASSOCIATED INFECTIONS PROGRESS REPORT
information about MRSA bacteremia and C . difficile infections .
State-specific SSI data are presented for colon surgery and
abdominal hysterectomy surgery, two of the most commonly
reported surgeries .
The Report describes significant reductions reported at the
national level in 2013 for nearly all infections . Despite this
progress, the nation did not reach the 2013 goals established
by the HAI Action Plan in 2009 . More action is needed at every
level of public health and health care to improve patient safety
and eliminate infections that commonly threaten hospital
patients . CLABSI and SSI show the greatest reduction as they
closely approached the set goals . Some progress is shown in
reducing both hospital-onset MRSA bacteremia and hospital-
onset C . difficile infections . The Report shows an increase in
CAUTI, similar to last year’s report, signaling a strong need for
additional prevention efforts .
On the national level, the report found:
■ 46 percent decrease in CLABSI between 2008 and 2013
■ 19 percent decrease in SSI related to the 10 select procedures tracked in the report between 2008 and 2013
■ 6 percent increase in CAUTI between 2009 and 2013
■ 8 percent decrease in MRSA bacteremia between 2011 and 2013
■ 10 percent decrease in C . difficile infections between 2011 and 2013
On the state level:
■ 26 states performed better than the national SIR on at least two infection types
■ 16 states performed better than the national SIR on at least three infection types
■ 6 states performed better than the national SIR on at least four infection types
■ 22 states performed worse than the national SIR on at least two infection types*
■ 13 states performed worse than the national SIR on at least three infection types*
The number of states performing better than the nation by
infection type:
■ CLABSI – 16 states
■ SSI, colon surgery – 9 states
■ SSI, abdominal hysterectomy – 8 states
■ CAUTI – 19 states
*Updated March 2015 to correct data points regarding states that performed worse than the nation

5NATIONAL AND STATE HEALTHCARE-ASSOCIATED INFECTIONS PROGRESS REPORT
■ MRSA bacteremia – 19 states
■ C . difficile infections – 21 states
The number of states performing worse than the nation by
infection type:
■ CLABSI – 14 states
■ SSI, colon surgery – 13 states
■ SSI, abdominal hysterectomy – 3 states
■ CAUTI – 17 states
■ MRSA bacteremia – 12 states
■ C . difficile infections – 18 states
This report shows that although significant progress was made
in some infection types, there is much more work to be done . On
any given day, approximately one in 25 U .S . patients has at least
one infection contracted during the course of their hospital care,
demonstrating the need for improved infection control in U .S .
healthcare facilities . Steps can be taken to control and prevent
healthcare-associated infections in a variety of settings . Research
shows that when healthcare facilities, care teams, and individual
doctors and nurses are aware of infection problems and take
specific steps to prevent them, rates of some targeted HAIs (e .g .,
CLABSI) can decrease by more than 70 percent . Full engagement
between local, state and federal public health agencies and their
partners in the healthcare sector will be vital to sustaining and
extending HAI surveillance and prevention progress . CDC will
continue its prevention, tracking, lab, and guideline work to push
the country further toward the goal of eliminating HAIs .
Any comments and suggestions that would improve the
usefulness of future publications are appreciated and should be
sent to the Division of Healthcare Quality Promotion, National
Center for Emerging and Zoonotic Infectious Diseases, Centers
for Disease Control and Prevention, 1600 Clifton Road, Mailstop
A-07; Atlanta, Georgia, 30333 . E-mail can also be used:
patientsafety@cdc .gov .
6NATIONAL AND STATE HEALTHCARE-ASSOCIATED INFECTIONS PROGRESS REPORT
STATE PROGRESS LANDSCAPE
Note: Updated March 2015 to reflect Indiana data recently provided to CDC

S TAT E H A I P R O G R E S SLEGEND 2013 state SIR is significantly lower (better)
than comparison group in column header
2013 state SIR is significantly higher (worse) than comparison group in column header
or Change in 2013 state SIR compared to group in column header is not statistically significant
2013 state SIR cannot be calculated Yes
STATE
CLABSIs: CENTRAL LINE-ASSOCIATED BLOODSTREAM INFECTIONS
2013 Reporting and Validation 2013 State CLABSI SIR
# HospitalsReporting to NHSN
State Reporting Mandate
State HD+ has Access to Data
Data Checked for Quality‡
Additional In-Depth Data
Review
vs.2012
State SIR
vs.2013
Nat’l SIR
vs.2008
Nat’l Baseline
Alabama 75
Alaska 10
Arizona 56
Arkansas 48
California 350
Colorado 52
Connecticut 30
D.C. 8
Delaware 8
Florida 191
Georgia 102
Hawaii 15
Idaho 16
Illinois 148
Indiana 104
Iowa 50
Kansas 49
Kentucky 72
Louisiana 79
Maine 21
Maryland 47
Massachusetts 69
Michigan 97
Minnesota 47
Mississippi 47
Missouri 74
HD+: State Health Department Data Checked for Quality‡: State analyzed 2013 data for quality and completeness. Additional In-Depth Data Review : State reviewed medical records to determine 2013 data accuracy. THIS REPORT IS BASED ON 2013 DATA, PUBLISHED JANUARY 2015

S TAT E H A I P R O G R E S SLEGEND 2013 state SIR is significantly lower (better)
than comparison group in column header
2013 state SIR is significantly higher (worse) than comparison group in column header
or Change in 2013 state SIR compared to group in column header is not statistically significant
2013 state SIR cannot be calculated Yes
STATE
CLABSIs: CENTRAL LINE-ASSOCIATED BLOODSTREAM INFECTIONS
2013 Reporting and Validation 2013 State CLABSI SIR
# HospitalsReporting to NHSN
State Reporting Mandate
State HD+ has Access to Data
Data Checked for Quality‡
Additional In-Depth Data
Review
vs.2012
State SIR
vs.2013
Nat’l SIR
vs.2008
Nat’l Baseline
Montana 14
Nebraska 20
Nevada 23
New Hampshire 24
New Jersey 72
New Mexico 36
New York 172
North Carolina 98
North Dakota 6
Ohio 137
Oklahoma 53
Oregon 49
Pennsylvania 172
Puerto Rico 18
Rhode Island 11
South Carolina 65
South Dakota 16
Tennessee 95
Texas 281
Utah 26
Vermont 7
Virginia 81
Washington 83
West Virginia 43
Wisconsin 90
Wyoming 21
HD+: State Health Department Data Checked for Quality‡: State analyzed 2013 data for quality and completeness. Additional In-Depth Data Review : State reviewed medical records to determine 2013 data accuracy. THIS REPORT IS BASED ON 2013 DATA, PUBLISHED JANUARY 2015

S TAT E H A I P R O G R E S SLEGEND 2013 state SIR is significantly lower (better)
than comparison group in column header
2013 state SIR is significantly higher (worse) than comparison group in column header
or Change in 2013 state SIR compared to group in column header is not statistically significant
2013 state SIR cannot be calculated Yes
STATE
CAUTIs: CATHETER-ASSOCIATED URINARY TRACT INFECTIONS
2013 Reporting and Validation 2013 State CAUTI SIR
# HospitalsReporting to NHSN
State Reporting Mandate
State HD+ has Access to Data
Data Checked for Quality‡
Additional In-Depth Data
Review
vs.2012
State SIR
vs.2013
Nat’l SIR
vs.2009
Nat’l Baseline
Alabama 86
Alaska 10
Arizona 55
Arkansas 49
California 341
Colorado 52
Connecticut 31
D.C. 7
Delaware 8
Florida 190
Georgia 105
Hawaii 15
Idaho 17
Illinois 148
Indiana 110
Iowa 68
Kansas 53
Kentucky 73
Louisiana 81
Maine 21
Maryland 39
Massachusetts 69
Michigan 98
Minnesota 51
Mississippi 48
Missouri 76
HD+: State Health Department Data Checked for Quality‡: State analyzed 2013 data for quality and completeness. Additional In-Depth Data Review : State reviewed medical records to determine 2013 data accuracy. THIS REPORT IS BASED ON 2013 DATA, PUBLISHED JANUARY 2015

S TAT E H A I P R O G R E S SLEGEND 2013 state SIR is significantly lower (better)
than comparison group in column header
2013 state SIR is significantly higher (worse) than comparison group in column header
or Change in 2013 state SIR compared to group in column header is not statistically significant
2013 state SIR cannot be calculated Yes
STATE
CAUTIs: CATHETER-ASSOCIATED URINARY TRACT INFECTIONS
2013 Reporting and Validation 2013 State CAUTI SIR
# HospitalsReporting to NHSN
State Reporting Mandate
State HD+ has Access to Data
Data Checked for Quality‡
Additional In-Depth Data
Review
vs.2012
State SIR
vs.2013
Nat’l SIR
vs.2009
Nat’l Baseline
Montana 14
Nebraska 20
Nevada 24
New Hampshire 23
New Jersey 72
New Mexico 35
New York 172
North Carolina 98
North Dakota 6
Ohio 136
Oklahoma 58
Oregon 50
Pennsylvania 184
Puerto Rico 18
Rhode Island 10
South Carolina 64
South Dakota 18
Tennessee 94
Texas 289
Utah 26
Vermont 5
Virginia 81
Washington 69
West Virginia 47
Wisconsin 102
Wyoming 24
HD+: State Health Department Data Checked for Quality‡: State analyzed 2013 data for quality and completeness. Additional In-Depth Data Review : State reviewed medical records to determine 2013 data accuracy. THIS REPORT IS BASED ON 2013 DATA, PUBLISHED JANUARY 2015

S TAT E H A I P R O G R E S SLEGEND 2013 state SIR is significantly lower (better)
than comparison group in column header
2013 state SIR is significantly higher (worse) than comparison group in column header
or Change in 2013 state SIR compared to group in column header is not statistically significant
2013 state SIR cannot be calculated Yes
STATE
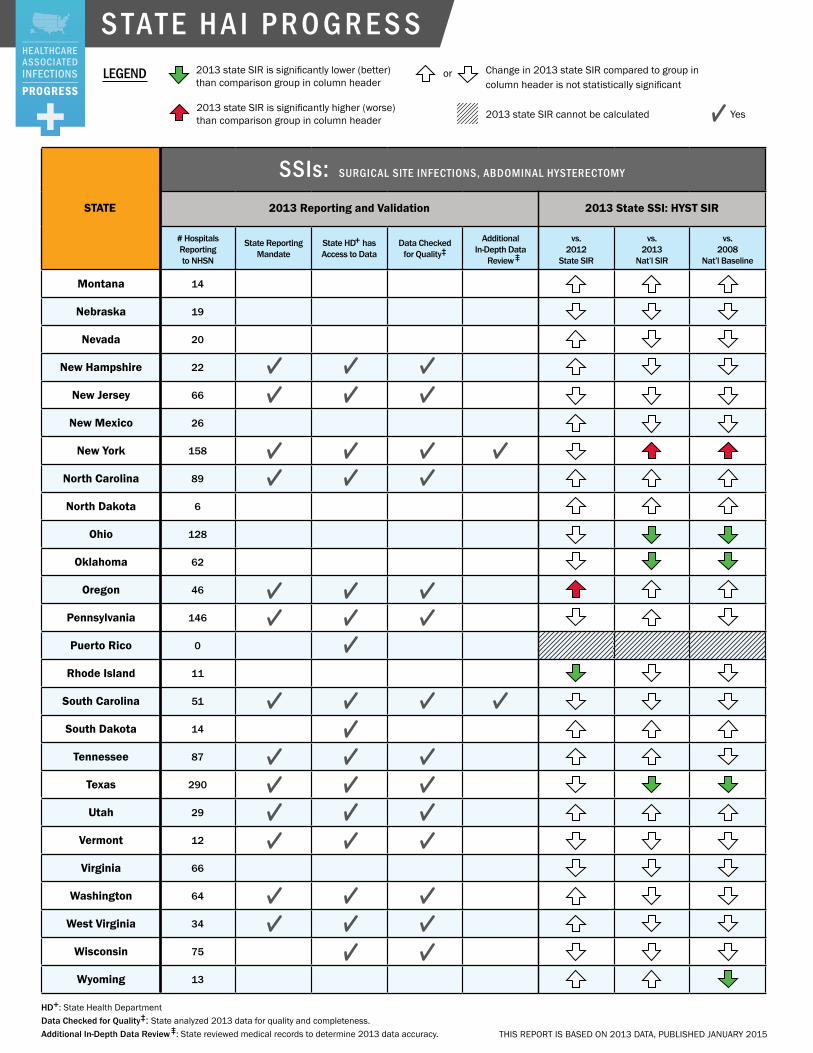
SSIs: SURGICAL SITE INFECTIONS, ABDOMINAL HYSTERECTOMY
2013 Reporting and Validation 2013 State SSI: HYST SIR
# HospitalsReporting to NHSN
State Reporting Mandate
State HD+ has Access to Data
Data Checked for Quality‡
Additional In-Depth Data
Review
vs.2012
State SIR
vs.2013
Nat’l SIR
vs.2008
Nat’l Baseline
Alabama 60
Alaska 8
Arizona 52
Arkansas 39
California 303
Colorado 56
Connecticut 29
D.C. 7
Delaware 7
Florida 172
Georgia 90
Hawaii 13
Idaho 17
Illinois 135
Indiana 98
Iowa 33
Kansas 41
Kentucky 60
Louisiana 79
Maine 19
Maryland 12
Massachusetts 57
Michigan 88
Minnesota 50
Mississippi 42
Missouri 67
HD+: State Health Department Data Checked for Quality‡: State analyzed 2013 data for quality and completeness. Additional In-Depth Data Review : State reviewed medical records to determine 2013 data accuracy. THIS REPORT IS BASED ON 2013 DATA, PUBLISHED JANUARY 2015
S TAT E H A I P R O G R E S SLEGEND 2013 state SIR is significantly lower (better)
than comparison group in column header
2013 state SIR is significantly higher (worse) than comparison group in column header
or Change in 2013 state SIR compared to group in column header is not statistically significant
2013 state SIR cannot be calculated Yes
STATE
SSIs: SURGICAL SITE INFECTIONS, ABDOMINAL HYSTERECTOMY
2013 Reporting and Validation 2013 State SSI: HYST SIR
# HospitalsReporting to NHSN
State Reporting Mandate
State HD+ has Access to Data
Data Checked for Quality‡
Additional In-Depth Data
Review
vs.2012
State SIR
vs.2013
Nat’l SIR
vs.2008
Nat’l Baseline
Montana 14
Nebraska 19
Nevada 20
New Hampshire 22
New Jersey 66
New Mexico 26
New York 158
North Carolina 89
North Dakota 6
Ohio 128
Oklahoma 62
Oregon 46
Pennsylvania 146
Puerto Rico 0
Rhode Island 11
South Carolina 51
South Dakota 14
Tennessee 87
Texas 290
Utah 29
Vermont 12
Virginia 66
Washington 64
West Virginia 34
Wisconsin 75
Wyoming 13
HD+: State Health Department Data Checked for Quality‡: State analyzed 2013 data for quality and completeness. Additional In-Depth Data Review : State reviewed medical records to determine 2013 data accuracy. THIS REPORT IS BASED ON 2013 DATA, PUBLISHED JANUARY 2015
S TAT E H A I P R O G R E S SLEGEND 2013 state SIR is significantly lower (better)
than comparison group in column header
2013 state SIR is significantly higher (worse) than comparison group in column header
or Change in 2013 state SIR compared to group in column header is not statistically significant
2013 state SIR cannot be calculated Yes
STATE
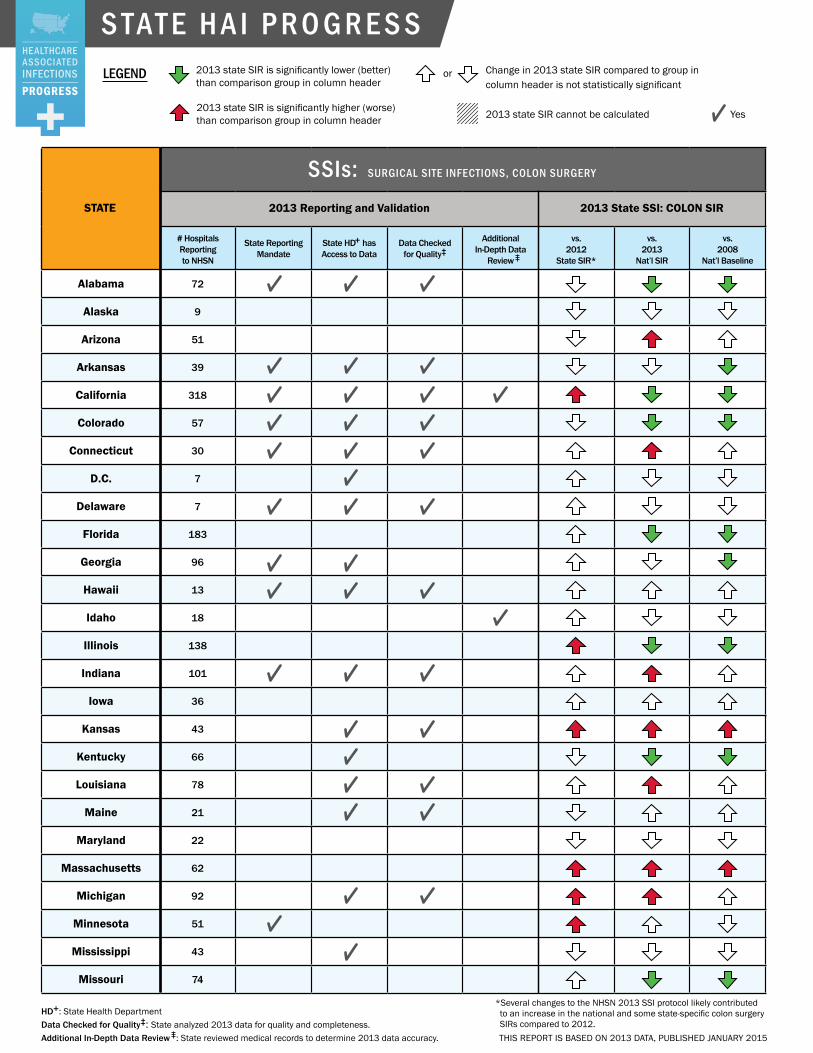
SSIs: SURGICAL SITE INFECTIONS, COLON SURGERY
2013 Reporting and Validation 2013 State SSI: COLON SIR
# HospitalsReporting to NHSN
State Reporting Mandate
State HD+ has Access to Data
Data Checked for Quality‡
Additional In-Depth Data
Review
vs.2012
State SIR*
vs.2013
Nat’l SIR
vs.2008
Nat’l Baseline
Alabama 72
Alaska 9
Arizona 51
Arkansas 39
California 318
Colorado 57
Connecticut 30
D.C. 7
Delaware 7
Florida 183
Georgia 96
Hawaii 13
Idaho 18
Illinois 138
Indiana 101
Iowa 36
Kansas 43
Kentucky 66
Louisiana 78
Maine 21
Maryland 22
Massachusetts 62
Michigan 92
Minnesota 51
Mississippi 43
Missouri 74
HD+: State Health Department Data Checked for Quality‡: State analyzed 2013 data for quality and completeness. Additional In-Depth Data Review : State reviewed medical records to determine 2013 data accuracy.
*Several changes to the NHSN 2013 SSI protocol likely contributed to an increase in the national and some state-specific colon surgery SIRs compared to 2012.THIS REPORT IS BASED ON 2013 DATA, PUBLISHED JANUARY 2015

S TAT E H A I P R O G R E S SLEGEND 2013 state SIR is significantly lower (better)
than comparison group in column header
2013 state SIR is significantly higher (worse) than comparison group in column header
or Change in 2013 state SIR compared to group in column header is not statistically significant
2013 state SIR cannot be calculated Yes
STATE
SSIs: SURGICAL SITE INFECTIONS, COLON SURGERY
2013 Reporting and Validation 2013 State SSI: COLON SIR
# HospitalsReporting to NHSN
State Reporting Mandate
State HD+ has Access to Data
Data Checked for Quality‡
Additional In-Depth Data
Review
vs.2012
State SIR*
vs.2013
Nat’l SIR
vs.2008
Nat’l Baseline
Montana 14
Nebraska 19
Nevada 22
New Hampshire 25
New Jersey 72
New Mexico 27
New York 171
North Carolina 93
North Dakota 6
Ohio 131
Oklahoma 56
Oregon 50
Pennsylvania 160
Puerto Rico 0
Rhode Island 11
South Carolina 57
South Dakota 14
Tennessee 95
Texas 285
Utah 30
Vermont 6
Virginia 75
Washington 70
West Virginia 36
Wisconsin 84
Wyoming 12
HD+: State Health Department Data Checked for Quality‡: State analyzed 2013 data for quality and completeness. Additional In-Depth Data Review : State reviewed medical records to determine 2013 data accuracy.
*Several changes to the NHSN 2013 SSI protocol likely contributed to an increase in the national and some state-specific colon surgery SIRs compared to 2012.THIS REPORT IS BASED ON 2013 DATA, PUBLISHED JANUARY 2015

S TAT E H A I P R O G R E S SLEGEND 2013 state SIR is significantly lower (better)
than comparison group in column header
2013 state SIR is significantly higher (worse) than comparison group in column header
or Change in 2013 state SIR compared to group in column header is not statistically significant
2013 state SIR cannot be calculated Yes
STATE
MRSA Bacteremia: LABORATORY IDENTIFIED HOSPITAL-ONSET BLOODSTREAM INFECTIONS
2013 Reporting and Validation 2013 State MRSA Bacteremia SIR
# HospitalsReporting to NHSN
State Reporting Mandate
State HD+ has Access to Data
Data Checked for Quality‡
Additional In-Depth Data Review
vs.2013
Nat’l SIR
vs.2011
Nat’l Baseline
Alabama 93
Alaska 11
Arizona 63
Arkansas 47
California 359
Colorado 56
Connecticut 32
D.C. 9
Delaware 8
Florida 190
Georgia 111
Hawaii 13
Idaho 21
Illinois 183
Indiana 102
Iowa 41
Kansas 59
Kentucky 71
Louisiana 101
Maine 25
Maryland 13
Massachusetts 71
Michigan 104
Minnesota 53
Mississippi 64
Missouri 82
HD+: State Health Department Data Checked for Quality‡: State analyzed 2013 data for quality and completeness. Additional In-Depth Data Review : State reviewed medical records to determine 2013 data accuracy. THIS REPORT IS BASED ON 2013 DATA, PUBLISHED JANUARY 2015

S TAT E H A I P R O G R E S SLEGEND 2013 state SIR is significantly lower (better)
than comparison group in column header
2013 state SIR is significantly higher (worse) than comparison group in column header
or Change in 2013 state SIR compared to group in column header is not statistically significant
2013 state SIR cannot be calculated Yes
STATE
MRSA Bacteremia: LABORATORY IDENTIFIED HOSPITAL-ONSET BLOODSTREAM INFECTIONS
2013 Reporting and Validation 2013 State MRSA Bacteremia SIR
# HospitalsReporting to NHSN
State Reporting Mandate
State HD+ has Access to Data
Data Checked for Quality‡
Additional In-Depth Data Review
vs.2013
Nat’l SIR
vs.2011
Nat’l Baseline
Montana 15
Nebraska 24
Nevada 23
New Hampshire 21
New Jersey 72
New Mexico 37
New York 179
North Carolina 100
North Dakota 11
Ohio 144
Oklahoma 91
Oregon 49
Pennsylvania 168
Puerto Rico 3
Rhode Island 11
South Carolina 66
South Dakota 23
Tennessee 115
Texas 359
Utah 37
Vermont 13
Virginia 84
Washington 59
West Virginia 39
Wisconsin 88
Wyoming 14
HD+: State Health Department Data Checked for Quality‡: State analyzed 2013 data for quality and completeness. Additional In-Depth Data Review : State reviewed medical records to determine 2013 data accuracy. THIS REPORT IS BASED ON 2013 DATA, PUBLISHED JANUARY 2015
S TAT E H A I P R O G R E S SLEGEND 2013 state SIR is significantly lower (better)
than comparison group in column header
2013 state SIR is significantly higher (worse) than comparison group in column header
or Change in 2013 state SIR compared to group in column header is not statistically significant
2013 state SIR cannot be calculated Yes
STATE
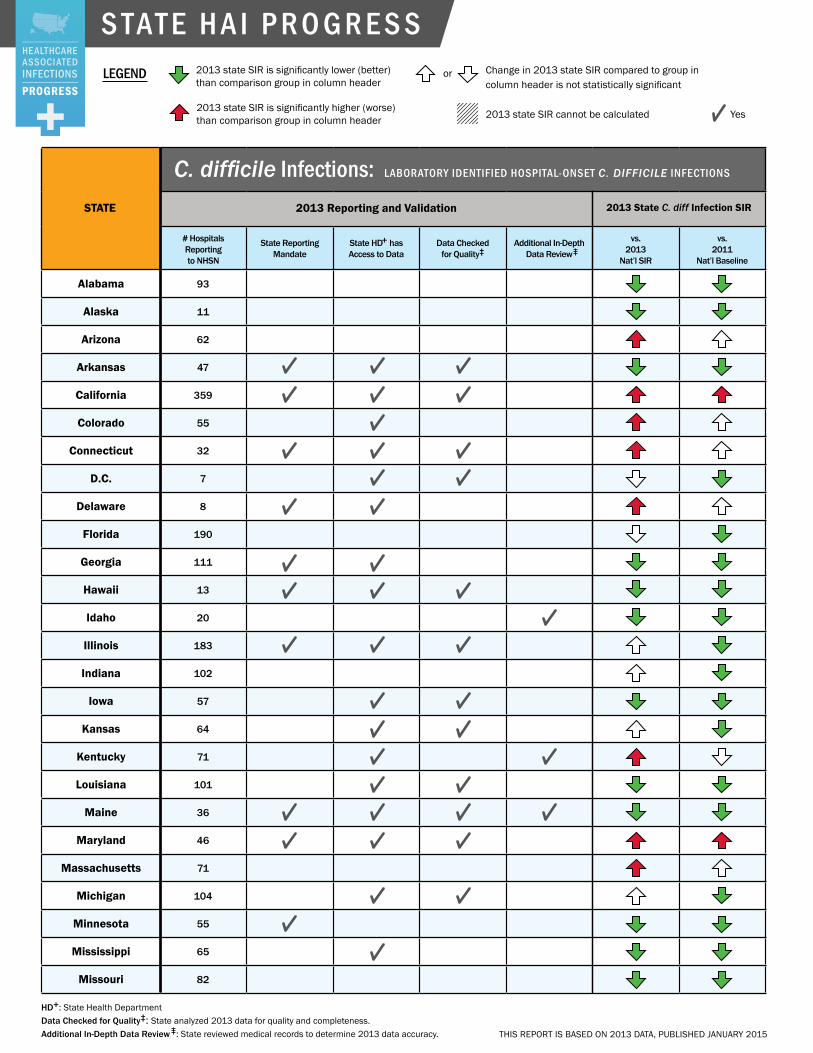
C. difficile Infections: LABORATORY IDENTIFIED HOSPITAL-ONSET C. DIFFICILE INFECTIONS
2013 Reporting and Validation 2013 State C. diff Infection SIR
# HospitalsReporting to NHSN
State Reporting Mandate
State HD+ has Access to Data
Data Checked for Quality‡
Additional In-Depth Data Review
vs.2013
Nat’l SIR
vs.2011
Nat’l Baseline
Alabama 93
Alaska 11
Arizona 62
Arkansas 47
California 359
Colorado 55
Connecticut 32
D.C. 7
Delaware 8
Florida 190
Georgia 111
Hawaii 13
Idaho 20
Illinois 183
Indiana 102
Iowa 57
Kansas 64
Kentucky 71
Louisiana 101
Maine 36
Maryland 46
Massachusetts 71
Michigan 104
Minnesota 55
Mississippi 65
Missouri 82
HD+: State Health Department Data Checked for Quality‡: State analyzed 2013 data for quality and completeness. Additional In-Depth Data Review : State reviewed medical records to determine 2013 data accuracy. THIS REPORT IS BASED ON 2013 DATA, PUBLISHED JANUARY 2015

S TAT E H A I P R O G R E S SLEGEND 2013 state SIR is significantly lower (better)
than comparison group in column header
2013 state SIR is significantly higher (worse) than comparison group in column header
or Change in 2013 state SIR compared to group in column header is not statistically significant
2013 state SIR cannot be calculated Yes
STATE
C. difficile Infections: LABORATORY IDENTIFIED HOSPITAL-ONSET C. DIFFICILE INFECTIONS
2013 Reporting and Validation 2013 State C. diff Infection SIR
# HospitalsReporting to NHSN
State Reporting Mandate
State HD+ has Access to Data
Data Checked for Quality‡
Additional In-Depth Data Review
vs.2013
Nat’l SIR
vs.2011
Nat’l Baseline
Montana 16
Nebraska 24
Nevada 22
New Hampshire 22
New Jersey 72
New Mexico 39
New York 180
North Carolina 100
North Dakota 11
Ohio 144
Oklahoma 91
Oregon 59
Pennsylvania 167
Puerto Rico 4
Rhode Island 11
South Carolina 64
South Dakota 23
Tennessee 115
Texas 359
Utah 35
Vermont 13
Virginia 84
Washington 61
West Virginia 41
Wisconsin 95
Wyoming 27
HD+: State Health Department Data Checked for Quality‡: State analyzed 2013 data for quality and completeness. Additional In-Depth Data Review : State reviewed medical records to determine 2013 data accuracy. THIS REPORT IS BASED ON 2013 DATA, PUBLISHED JANUARY 2015

19NATIONAL AND STATE HEALTHCARE-ASSOCIATED INFECTIONS PROGRESS REPORT
NATIONAL FACTSHEETS

N AT I O N A LPage 1 of 3
Healthcare-associated infections (HAIs) are infections patients can get while receiving medical treatment in a healthcare facility. Working toward the elimination of HAIs is a CDC priority. The standardized infection ratio (SIR) is a summary statistic that can be used to track HAI prevention progress over time; lower SIRs are better. The infection data are collected through CDC’s National Healthcare Safety Network (NHSN). HAI data for nearly all U.S. hospitals are published on the Hospital Compare website.
CLABSIsCENTRAL LINE-ASSOCIATED BLOODSTREAM INFECTIONS
46% LOWER COMPARED TO NAT’L BASELINE*
*Statistically significant.
When a tube is placed in a large vein and not put in correctly or kept clean, it can become a way for germs to enter the body and cause deadly infections in the blood.
U.S. hospitals reported a significant decrease in CLABSIs between 2012 and 2013.
9%Among the 2,389 hospitals in U.S. with enough data to calculate an SIR, 9% had an SIR significantly worse than the national SIR of 0.54.
CAUTIsCATHETER-ASSOCIATED URINARY TRACT INFECTIONS
6% HIGHER COMPARED TO NAT’L BASELINE*
When a urinary catheter is not put in correctly, not kept clean, or left in a patient for too long, germs can travel through the catheter and infect the bladder and kidneys.
U.S. hospitals reported a significant increase in CAUTIs between 2012 and 2013.
12% Among the 2,781 U.S. hospitals with enough data to calculate an SIR, 12% had an SIR significantly worse than the national SIR of 1.06.
MRSA BacteremiaLABORATORY IDENTIFIED HOSPITAL-ONSET BLOODSTREAM INFECTIONS
8% LOWER COMPARED TO NAT’L BASELINE*
Methicillin-resistant Staphylococcus aureus (MRSA) is bacteria usually spread by contaminated hands. In a healthcare setting, such as a hospital, MRSA can cause serious bloodstream infections.
U.S. hospitals reported a significant decrease in MRSA Bacteremia between 2012 and 2013.
7%Among the 2,002 U.S. hospitals with enough data to calculate an SIR, 7% had an SIR significantly worse than the national SIR of 0.92.
SSIsSURGICAL SITE INFECTIONS See page 3 for additional procedures
When germs get into an area where surgery is or was performed, patients can get a surgical site infection. Sometimes these infections involve only the skin. Other SSIs can involve tissues under the skin, organs, or implanted material.
SSI: Abdominal Hysterectomy 14% LOWER COMPARED TO NAT’L BASELINE*
U.S. hospitals reported no significant change in SSIs related to abdominal hysterectomy surgery between 2012 and 2013.
6%Among the 765 U.S. hospitals with enough data to calculate an SIR, 6% had an SIR significantly worse than the national SIR of 0.86.
SSI: Colon Surgery 8% LOWER COMPARED TO NAT’L BASELINE*
U.S. hospitals reported a significant increase in SSIs related to colon surgery between 2012 and 2013.
Several changes to the NHSN 2013 SSI protocol likely contributed to an increase in the national and some state- specific colon surgery SIRs compared to 2012.
7%Among the 2,030 U.S. hospitals with enough data to calculate an SIR, 7% had an SIR significantly worse than the national SIR of 0.92.
C. difficile InfectionsLABORATORY IDENTIFIED HOSPITAL-ONSET C. DIFFICILE INFECTIONS
10% LOWER COMPARED TO NAT’L BASELINE*
When a person takes antibiotics, good bacteria that protect against infection are destroyed for several months. During this time, patients can get sick from Clostridium difficile (C. difficile), bacteria that cause potentially deadly diarrhea, which can be spread in healthcare settings.
U.S. hospitals reported a significant decrease in C.difficile infections between 2012 and 2013.
13%Among the 3,557 U.S. hospitals with enough data to calculate an SIR, 13% had an SIR significantly worse than the national SIR of 0.90.
THIS REPORT IS BASED ON 2013 DATA, PUBLISHED JANUARY 2015

N AT I O N A LPage 2 of 3
HEALTHCARE-ASSOCIATED INFECTION (HAI) DATA give healthcare facilities and public health agencies knowledge to design, implement, and evaluate HAI prevention efforts.
LEGEND
2013 Nat’l SIR is significantly lower (better) than comparison group
or
Change in 2013 Nat’l SIR compared to group in column header is not statistically significant
2013 Nat’l SIR is significantly higher (worse) than comparison group in
HAI TYPE# OF U.S. HOSPITALS
THAT REPORTED DATA TO CDC’S NHSN, 2013+
2013 NAT’L SIR vs.
2012 Nat’l SIR‡
2013 NAT’L SIR vs.
Nat’l Baseline
2013 NAT’L SIR
CLABSI Nat’l Baseline: 2008
3,578 4% 46% 0.54
CAUTI Nat’l Baseline: 2009
3,640 3% 6% 1.06
SSI, Abdominal Hysterectomy Nat’l Baseline: 2008
3,182 4% 14% 0.86
SSI, Colon Surgery Nat’l Baseline: 2008
3,348 14% 8% 0.92
MRSA Bacteremia Nat’l Baseline: 2011
3,827 5% 8% 0.92
C. difficile Infections Nat’l Baseline: 2011
3,924 6% 10% 0.90
+The number of hospitals reporting for each HAI type may differ because some hospitals do not use central lines or urinary catheters, or do not perform colon or abdominal hysterectomy surgeries. ‡The 2012 Nat’l SIRs can be found in the data tables of this report. Nat’l baseline time period varies by infection type. See first column of this table for specifics.
WHAT DOES THE STANDARDIZED INFECTION RATIO (SIR) MEAN?
IF THE NATIONAL SIR IS:MORE THAN1
1LESS THAN1
There was an increase in the number of infections reported in the nation in 2013compared to the national baseline.
There were about the same number of infections reported in the nation in 2013compared to the national baseline.
There was a decrease in the number of infections reported in the nation in 2013compared to the national baseline.
Learn how your hospital is performing: www.medicare.gov/hospitalcompare For additional information:
■ 2013 HAI Progress Report: www.cdc.gov/hai/progress-report/ ■ NHSN: www.cdc.gov/nhsn ■ Preventing HAIs: www.cdc.gov/hai
THIS REPORT IS BASED ON 2013 DATA, PUBLISHED JANUARY 2015
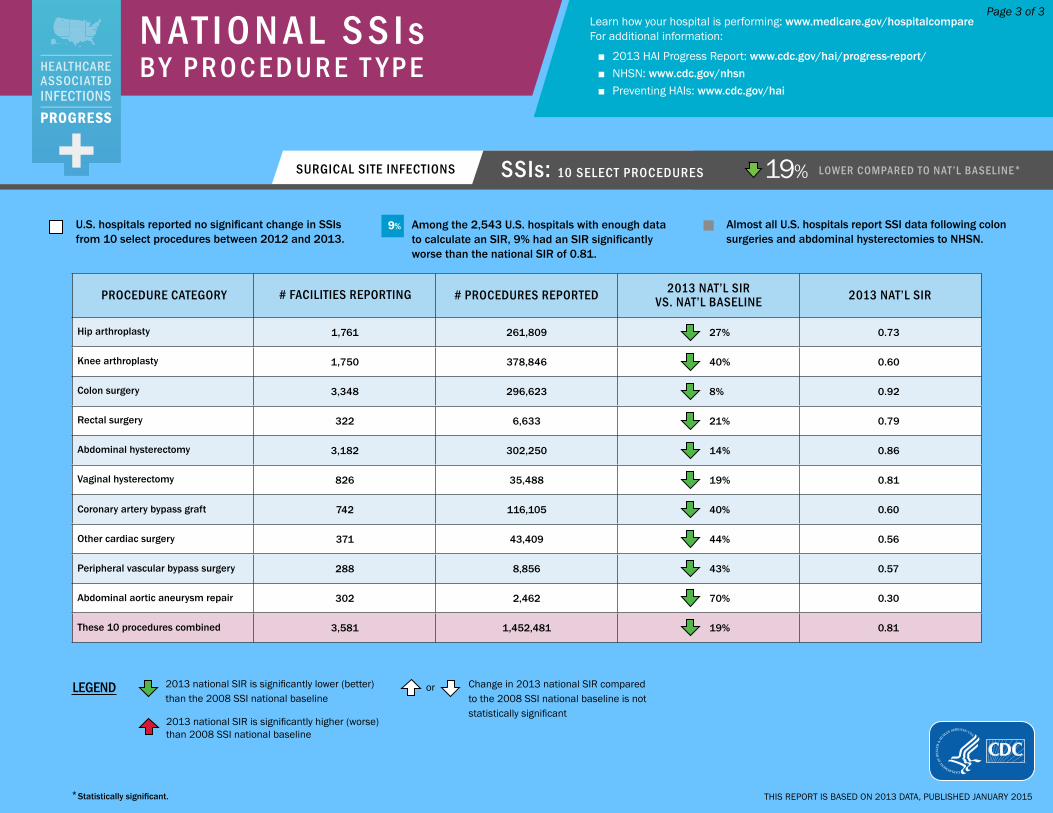
N AT I O N A L S S I s B Y P R O C E D U R E T Y P E
Page 3 of 3
SURGICAL SITE INFECTIONS SSIs: 10 SELECT PROCEDURES 19% LOWER COMPARED TO NAT’L BASELINE*
*Statistically significant.
U.S. hospitals reported no significant change in SSIs from 10 select procedures between 2012 and 2013.
9% Among the 2,543 U.S. hospitals with enough data to calculate an SIR, 9% had an SIR significantly worse than the national SIR of 0.81.
Almost all U.S. hospitals report SSI data following colon surgeries and abdominal hysterectomies to NHSN.
LEGEND 2013 national SIR is significantly lower (better) than the 2008 SSI national baseline
2013 national SIR is significantly higher (worse) than 2008 SSI national baseline
or Change in 2013 national SIR compared to the 2008 SSI national baseline is not statistically significant
PROCEDURE CATEGORY # FACILITIES REPORTING # PROCEDURES REPORTED 2013 NAT’L SIR VS. NAT’L BASELINE 2013 NAT’L SIR
Hip arthroplasty 1,761 261,809 27% 0.73
Knee arthroplasty 1,750 378,846 40% 0.60
Colon surgery 3,348 296,623 8% 0.92
Rectal surgery 322 6,633 21% 0.79
Abdominal hysterectomy 3,182 302,250 14% 0.86
Vaginal hysterectomy 826 35,488 19% 0.81
Coronary artery bypass graft 742 116,105 40% 0.60
Other cardiac surgery 371 43,409 44% 0.56
Peripheral vascular bypass surgery 288 8,856 43% 0.57
Abdominal aortic aneurysm repair 302 2,462 70% 0.30
These 10 procedures combined 3,581 1,452,481 19% 0.81
Learn how your hospital is performing: www.medicare.gov/hospitalcompare For additional information:
■ 2013 HAI Progress Report: www.cdc.gov/hai/progress-report/ ■ NHSN: www.cdc.gov/nhsn ■ Preventing HAIs: www.cdc.gov/hai
THIS REPORT IS BASED ON 2013 DATA, PUBLISHED JANUARY 2015

23NATIONAL AND STATE HEALTHCARE-ASSOCIATED INFECTIONS PROGRESS REPORT
STATE FACTSHEETS

A L A B A M AHealthcare-associated infections (HAIs) are infections patients can get while receiving medical treatment in a healthcare facility. Working toward the elimination of HAIs is a CDC priority. The standardized infection ratio (SIR) is a summary statistic that can be used to track HAI prevention progress over time; lower SIRs are better. The infection data are collected through CDC’s National Healthcare Safety Network (NHSN). HAI data for nearly all U.S. hospitals are published on the Hospital Compare website.
CLABSIsCENTRAL LINE-ASSOCIATED BLOODSTREAM INFECTIONS
33% LOWER COMPARED TO NAT’L BASELINE*
*Statistically significant.
When a tube is placed in a large vein and not put in correctly or kept clean, it can become a way for germs to enter the body and cause deadly infections in the blood.
Alabama hospitals reported no significant change in CLABSIs between 2012 and 2013.
13%Among the 39 hospitals in Alabama with enough data to calculate an SIR, 13% had an SIR significantly worse than the national SIR of 0.54.
CAUTIsCATHETER-ASSOCIATED URINARY TRACT INFECTIONS
7% LOWER COMPARED TO NAT’L BASELINE*
When a urinary catheter is not put in correctly, not kept clean, or left in a patient for too long, germs can travel through the catheter and infect the bladder and kidneys.
Alabama hospitals reported a significant increase in CAUTIs between 2012 and 2013.
6% Among the 70 hospitals in Alabama with enough data to calculate an SIR, 6% had an SIR significantly worse than the national SIR of 1.06.
MRSA BacteremiaLABORATORY IDENTIFIED HOSPITAL-ONSET BLOODSTREAM INFECTIONS
42% HIGHER COMPARED TO NAT’L BASELINE*
Methicillin-resistant Staphylococcus aureus (MRSA) is bacteria usually spread by contaminated hands. In a healthcare setting, such as a hospital, MRSA can cause serious bloodstream infections.
26%Among the 38 hospitals in Alabama with enough data to calculate an SIR, 26% had an SIR significantly worse than the national SIR of 0.92.
SSIsSURGICAL SITE INFECTIONS
When germs get into an area where surgery is or was performed, patients can get a surgical site infection. Sometimes these infections involve only the skin. Other SSIs can involve tissues under the skin, organs, or implanted material.
SSI: Abdominal Hysterectomy 39% LOWER COMPARED TO NAT’L BASELINE*
Alabama hospitals reported no significant change in SSIs related to abdominal hysterectomy surgery between 2012 and 2013.
7%Among the 14 hospitals in Alabama with enough data to calculate an SIR, 7% had an SIR significantly worse than the national SIR of 0.86.
SSI: Colon Surgery 53% LOWER COMPARED TO NAT’L BASELINE*
Alabama hospitals reported no significant change in SSIs related to colon surgery between 2012 and 2013.
Several changes to the NHSN 2013 SSI protocol likely contributed to an increase in the national and some state- specific colon surgery SIRs compared to 2012.
0%Among the 35 hospitals in Alabama with enough data to calculate an SIR, 0% had an SIR significantly worse than the national SIR of 0.92.
C. difficile InfectionsLABORATORY IDENTIFIED HOSPITAL-ONSET C. DIFFICILE INFECTIONS
37% LOWER COMPARED TO NAT’L BASELINE*
When a person takes antibiotics, good bacteria that protect against infection are destroyed for several months. During this time, patients can get sick from Clostridium difficile (C. difficile), bacteria that cause potentially deadly diarrhea, which can be spread in healthcare settings.
1%Among the 83 hospitals in Alabama with enough data to calculate an SIR, 1% had an SIR significantly worse than the national SIR of 0.90.
THIS REPORT IS BASED ON 2013 DATA, PUBLISHED JANUARY 2015

A L A B A M AHEALTHCARE-ASSOCIATED INFECTION (HAI) DATA give healthcare facilities and public health agencies knowledge to design, implement, and evaluate HAI prevention efforts.
LEGEND
2013 state SIR is significantly lower (better) than comparison group
in column header
or
Change in 2013 state SIR compared to group in column header is not statistically significant
2013 state SIR is significantly higher (worse) than comparison group in
column header
2013 state SIR cannot be calculated
HAI TYPE# OF ALABAMA
HOSPITALS THAT REPORTED DATA TO CDC’S NHSN, 2013
Total Hospitals in State: 118+
2013 STATE SIR vs.
2012 State SIR‡
2013 STATE SIR vs.
2013 Nat’l SIR
2013 STATE SIR vs.
Nat’l Baseline
2013 STATE SIR
2013 NAT’L SIR
CLABSI Nat’l Baseline: 2008
75 2% 25% 33% 0.67 0.54
CAUTI Nat’l Baseline: 2009
86 25% 12% 7% 0.93 1.06
SSI, Abdominal Hysterectomy Nat’l Baseline: 2008
60 20% 30% 39% 0.61 0.86
SSI, Colon Surgery Nat’l Baseline: 2008
72 20% 49% 53% 0.47 0.92
MRSA Bacteremia Nat’l Baseline: 2011
93 2012 SIR not available
56% 42% 1.42 0.92
C. difficile Infections Nat’l Baseline: 2011
93 2012 SIR not available
30% 37% 0.63 0.90
+Not all hospitals are required to report these infections; for example, some hospitals do not use central lines or urinary catheters, or do not perform colon or abdominal hysterectomy surgeries. ‡The state’s 2012 SIR can be found in the data tables of this report. Nat’l baseline time period varies by infection type. See first column of this table for specifics.
WHAT IS THE STANDARDIZED INFECTION RATIO?
The standardized infection ratio (SIR) is a summary statistic that can be used to track HAI prevention progress over time; lower SIRs are better. The SIR for a facility or state is adjusted to account for factors that might cause infection rates to be higher or lower, such as hospital size, teaching status, the type of patients a hospital serves, and surgery and patient characteristics.
WHAT IS ALABAMA DOING TO PREVENT HEALTHCARE-ASSOCIATED INFECTIONS?
Alabama has a state mandate to publicly report at least one HAI to NHSN.
Prevention efforts to reduce specific HAIs:
■ Central line-associated bloodstream infections ■ Catheter-associated urinary tract infections ■ Surgical site infections
■ Multidrug-resistant infections (MRSA) ■ Long-term care facilities ■ Hand hygiene ■ Antibiotic stewardship
Learn how your hospital is performing: www.medicare.gov/hospitalcompare For additional information:
■ 2013 HAI Progress Report: www.cdc.gov/hai/progress-report/ ■ NHSN: www.cdc.gov/nhsn ■ HAIs and prevention activities in Alabama: www.adph.org/hai/ ■ Alabama validation efforts: www.cdc.gov/hai/pdfs/state-progress-landscape.pdf
THIS REPORT IS BASED ON 2013 DATA, PUBLISHED JANUARY 2015
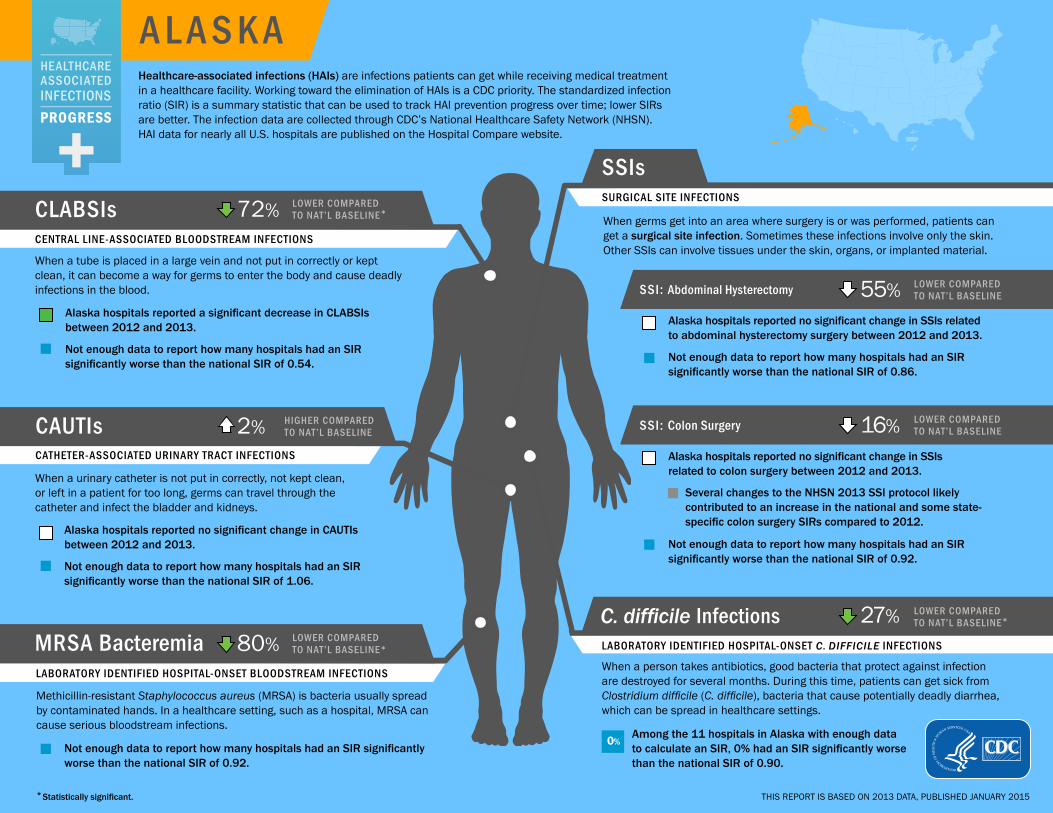
A L A S K AHealthcare-associated infections (HAIs) are infections patients can get while receiving medical treatment in a healthcare facility. Working toward the elimination of HAIs is a CDC priority. The standardized infection ratio (SIR) is a summary statistic that can be used to track HAI prevention progress over time; lower SIRs are better. The infection data are collected through CDC’s National Healthcare Safety Network (NHSN). HAI data for nearly all U.S. hospitals are published on the Hospital Compare website.
CLABSIsCENTRAL LINE-ASSOCIATED BLOODSTREAM INFECTIONS
72% LOWER COMPARED TO NAT’L BASELINE*
*Statistically significant.
When a tube is placed in a large vein and not put in correctly or kept clean, it can become a way for germs to enter the body and cause deadly infections in the blood.
Alaska hospitals reported a significant decrease in CLABSIs between 2012 and 2013.
Not enough data to report how many hospitals had an SIR significantly worse than the national SIR of 0.54.
CAUTIsCATHETER-ASSOCIATED URINARY TRACT INFECTIONS
2% HIGHER COMPARED TO NAT’L BASELINE
When a urinary catheter is not put in correctly, not kept clean, or left in a patient for too long, germs can travel through the catheter and infect the bladder and kidneys.
Alaska hospitals reported no significant change in CAUTIs between 2012 and 2013.
Not enough data to report how many hospitals had an SIR significantly worse than the national SIR of 1.06.
MRSA BacteremiaLABORATORY IDENTIFIED HOSPITAL-ONSET BLOODSTREAM INFECTIONS
80% LOWER COMPARED TO NAT’L BASELINE*
Methicillin-resistant Staphylococcus aureus (MRSA) is bacteria usually spread by contaminated hands. In a healthcare setting, such as a hospital, MRSA can cause serious bloodstream infections.
Not enough data to report how many hospitals had an SIR significantly worse than the national SIR of 0.92.
SSIsSURGICAL SITE INFECTIONS
When germs get into an area where surgery is or was performed, patients can get a surgical site infection. Sometimes these infections involve only the skin. Other SSIs can involve tissues under the skin, organs, or implanted material.
SSI: Abdominal Hysterectomy 55% LOWER COMPARED TO NAT’L BASELINE
Alaska hospitals reported no significant change in SSIs related to abdominal hysterectomy surgery between 2012 and 2013.
Not enough data to report how many hospitals had an SIR significantly worse than the national SIR of 0.86.
SSI: Colon Surgery 16% LOWER COMPARED TO NAT’L BASELINE
Alaska hospitals reported no significant change in SSIs related to colon surgery between 2012 and 2013.
Several changes to the NHSN 2013 SSI protocol likely contributed to an increase in the national and some state- specific colon surgery SIRs compared to 2012.
Not enough data to report how many hospitals had an SIR significantly worse than the national SIR of 0.92.
C. difficile InfectionsLABORATORY IDENTIFIED HOSPITAL-ONSET C. DIFFICILE INFECTIONS
27% LOWER COMPARED TO NAT’L BASELINE*
When a person takes antibiotics, good bacteria that protect against infection are destroyed for several months. During this time, patients can get sick from Clostridium difficile (C. difficile), bacteria that cause potentially deadly diarrhea, which can be spread in healthcare settings.
0%Among the 11 hospitals in Alaska with enough data to calculate an SIR, 0% had an SIR significantly worse than the national SIR of 0.90.
THIS REPORT IS BASED ON 2013 DATA, PUBLISHED JANUARY 2015

A L A S K AHEALTHCARE-ASSOCIATED INFECTION (HAI) DATA give healthcare facilities and public health agencies knowledge to design, implement, and evaluate HAI prevention efforts.
LEGEND
2013 state SIR is significantly lower (better) than comparison group
in column header
or
Change in 2013 state SIR compared to group in column header is not statistically significant
2013 state SIR is significantly higher (worse) than comparison group in
column header
2013 state SIR cannot be calculated
HAI TYPE# OF ALASKA
HOSPITALS THAT REPORTED DATA TO CDC’S NHSN, 2013
Total Hospitals in State: 26+
2013 STATE SIR vs.
2012 State SIR‡
2013 STATE SIR vs.
2013 Nat’l SIR
2013 STATE SIR vs.
Nat’l Baseline
2013 STATE SIR
2013 NAT’L SIR
CLABSI Nat’l Baseline: 2008
10 75% 48% 72% 0.28 0.54
CAUTI Nat’l Baseline: 2009
10 23% 4% 2% 1.02 1.06
SSI, Abdominal Hysterectomy Nat’l Baseline: 2008
8 20% 48% 55% 0.45 0.86
SSI, Colon Surgery Nat’l Baseline: 2008
9 47% 9% 16% 0.84 0.92
MRSA Bacteremia Nat’l Baseline: 2011
11 2012 SIR not available
78% 80% 0.20 0.92
C. difficile Infections Nat’l Baseline: 2011
11 2012 SIR not available
19% 27% 0.74 0.90
+Not all hospitals are required to report these infections; for example, some hospitals do not use central lines or urinary catheters, or do not perform colon or abdominal hysterectomy surgeries. ‡The state’s 2012 SIR can be found in the data tables of this report. Nat’l baseline time period varies by infection type. See first column of this table for specifics.
WHAT IS THE STANDARDIZED INFECTION RATIO?
The standardized infection ratio (SIR) is a summary statistic that can be used to track HAI prevention progress over time; lower SIRs are better. The SIR for a facility or state is adjusted to account for factors that might cause infection rates to be higher or lower, such as hospital size, teaching status, the type of patients a hospital serves, and surgery and patient characteristics.
WHAT IS ALASKA DOING TO PREVENT HEALTHCARE-ASSOCIATED INFECTIONS?
Prevention efforts to reduce specific HAIs:
■ Catheter-associated urinary tract infections ■ Multidrug-resistant infections (C. difficile, CRE) ■ Healthcare personnel influenza vaccination
Learn how your hospital is performing: www.medicare.gov/hospitalcompare For additional information:
■ 2013 HAI Progress Report: www.cdc.gov/hai/progress-report/ ■ NHSN: www.cdc.gov/nhsn ■ HAIs and prevention activities in Alaska: www.epi.hss.state.ak.us/id/hai/default.htm ■ Alaska validation efforts: www.cdc.gov/hai/pdfs/state-progress-landscape.pdf
THIS REPORT IS BASED ON 2013 DATA, PUBLISHED JANUARY 2015
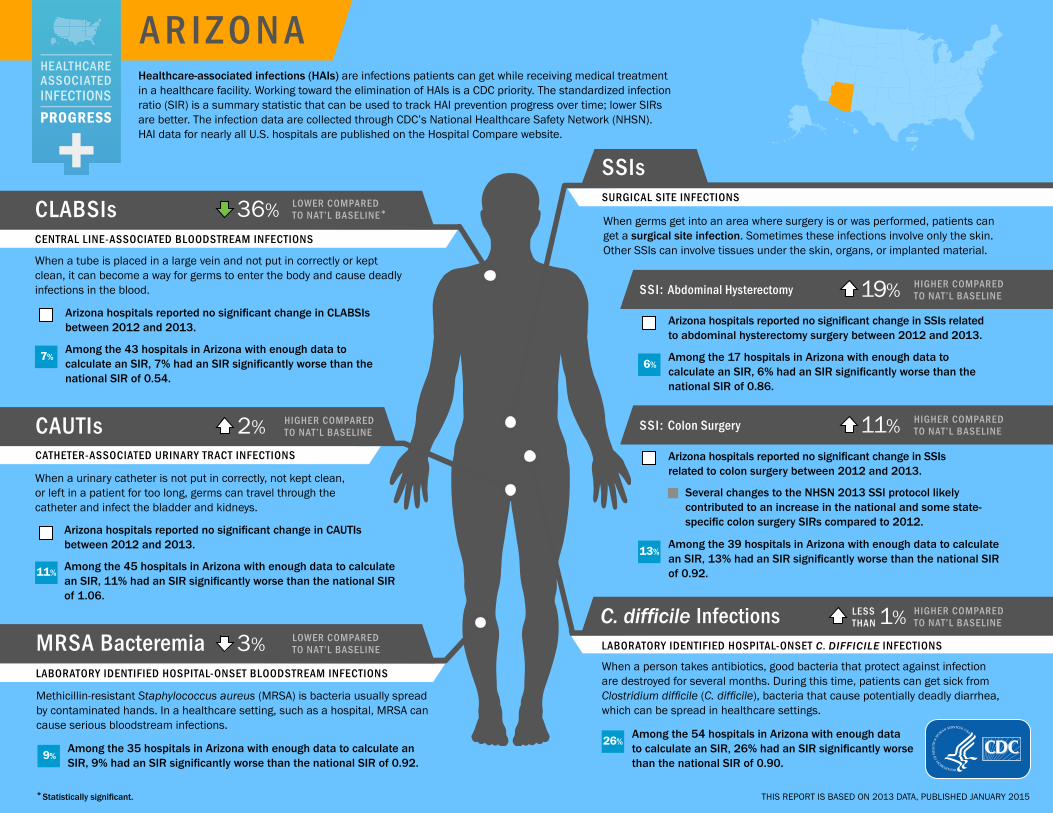
A R I Z O N AHealthcare-associated infections (HAIs) are infections patients can get while receiving medical treatment in a healthcare facility. Working toward the elimination of HAIs is a CDC priority. The standardized infection ratio (SIR) is a summary statistic that can be used to track HAI prevention progress over time; lower SIRs are better. The infection data are collected through CDC’s National Healthcare Safety Network (NHSN). HAI data for nearly all U.S. hospitals are published on the Hospital Compare website.
CLABSIsCENTRAL LINE-ASSOCIATED BLOODSTREAM INFECTIONS
36% LOWER COMPARED TO NAT’L BASELINE*
*Statistically significant.
When a tube is placed in a large vein and not put in correctly or kept clean, it can become a way for germs to enter the body and cause deadly infections in the blood.
Arizona hospitals reported no significant change in CLABSIs between 2012 and 2013.
7%Among the 43 hospitals in Arizona with enough data to calculate an SIR, 7% had an SIR significantly worse than the national SIR of 0.54.
CAUTIsCATHETER-ASSOCIATED URINARY TRACT INFECTIONS
2% HIGHER COMPARED TO NAT’L BASELINE
When a urinary catheter is not put in correctly, not kept clean, or left in a patient for too long, germs can travel through the catheter and infect the bladder and kidneys.
Arizona hospitals reported no significant change in CAUTIs between 2012 and 2013.
11% Among the 45 hospitals in Arizona with enough data to calculate an SIR, 11% had an SIR significantly worse than the national SIR of 1.06.
MRSA BacteremiaLABORATORY IDENTIFIED HOSPITAL-ONSET BLOODSTREAM INFECTIONS
3% LOWER COMPARED TO NAT’L BASELINE
Methicillin-resistant Staphylococcus aureus (MRSA) is bacteria usually spread by contaminated hands. In a healthcare setting, such as a hospital, MRSA can cause serious bloodstream infections.
9%Among the 35 hospitals in Arizona with enough data to calculate an SIR, 9% had an SIR significantly worse than the national SIR of 0.92.
SSIsSURGICAL SITE INFECTIONS
When germs get into an area where surgery is or was performed, patients can get a surgical site infection. Sometimes these infections involve only the skin. Other SSIs can involve tissues under the skin, organs, or implanted material.
SSI: Abdominal Hysterectomy 19% HIGHER COMPARED TO NAT’L BASELINE
Arizona hospitals reported no significant change in SSIs related to abdominal hysterectomy surgery between 2012 and 2013.
6%Among the 17 hospitals in Arizona with enough data to calculate an SIR, 6% had an SIR significantly worse than the national SIR of 0.86.
SSI: Colon Surgery 11% HIGHER COMPARED TO NAT’L BASELINE
Arizona hospitals reported no significant change in SSIs related to colon surgery between 2012 and 2013.
Several changes to the NHSN 2013 SSI protocol likely contributed to an increase in the national and some state- specific colon surgery SIRs compared to 2012.
13%Among the 39 hospitals in Arizona with enough data to calculate an SIR, 13% had an SIR significantly worse than the national SIR of 0.92.
C. difficile InfectionsLABORATORY IDENTIFIED HOSPITAL-ONSET C. DIFFICILE INFECTIONS
LESSTHAN 1% HIGHER COMPARED
TO NAT’L BASELINE
When a person takes antibiotics, good bacteria that protect against infection are destroyed for several months. During this time, patients can get sick from Clostridium difficile (C. difficile), bacteria that cause potentially deadly diarrhea, which can be spread in healthcare settings.
26%Among the 54 hospitals in Arizona with enough data to calculate an SIR, 26% had an SIR significantly worse than the national SIR of 0.90.
THIS REPORT IS BASED ON 2013 DATA, PUBLISHED JANUARY 2015

A R I Z O N AHEALTHCARE-ASSOCIATED INFECTION (HAI) DATA give healthcare facilities and public health agencies knowledge to design, implement, and evaluate HAI prevention efforts.
LEGEND
2013 state SIR is significantly lower (better) than comparison group
in column header
or
Change in 2013 state SIR compared to group in column header is not statistically significant
2013 state SIR is significantly higher (worse) than comparison group in
column header
2013 state SIR cannot be calculated
HAI TYPE# OF ARIZONA
HOSPITALS THAT REPORTED DATA TO CDC’S NHSN, 2013
Total Hospitals in State: 97+
2013 STATE SIR vs.
2012 State SIR‡
2013 STATE SIR vs.
2013 Nat’l SIR
2013 STATE SIR vs.
Nat’l Baseline
2013 STATE SIR
2013 NAT’L SIR
CLABSI Nat’l Baseline: 2008
56 1% 19% 36% 0.64 0.54
CAUTI Nat’l Baseline: 2009
55 6% 3% 2% 1.02 1.06
SSI, Abdominal Hysterectomy Nat’l Baseline: 2008
52 3% 38% 19% 1.19 0.86
SSI, Colon Surgery Nat’l Baseline: 2008
51 1% 22% 11% 1.11 0.92
MRSA Bacteremia Nat’l Baseline: 2011
63 2012 SIR not available
6% 3% 0.97 0.92
C. difficile Infections Nat’l Baseline: 2011
62 2012 SIR not available
11% < 1% 1.00 0.90
+Not all hospitals are required to report these infections; for example, some hospitals do not use central lines or urinary catheters, or do not perform colon or abdominal hysterectomy surgeries. ‡The state’s 2012 SIR can be found in the data tables of this report. Nat’l baseline time period varies by infection type. See first column of this table for specifics.
WHAT IS THE STANDARDIZED INFECTION RATIO?
The standardized infection ratio (SIR) is a summary statistic that can be used to track HAI prevention progress over time; lower SIRs are better. The SIR for a facility or state is adjusted to account for factors that might cause infection rates to be higher or lower, such as hospital size, teaching status, the type of patients a hospital serves, and surgery and patient characteristics.
WHAT IS ARIZONA DOING TO PREVENT HEALTHCARE-ASSOCIATED INFECTIONS?
Prevention efforts to reduce specific HAIs:
■ Catheter-associated urinary tract infections ■ Multidrug-resistant infections (MRSA, C. difficile, CRE, and others) ■ Long-term care facilities ■ Hand hygiene ■ Antibiotic stewardship ■ Healthcare personnel influenza vaccination
Learn how your hospital is performing: www.medicare.gov/hospitalcompare For additional information:
■ 2013 HAI Progress Report: www.cdc.gov/hai/progress-report/ ■ NHSN: www.cdc.gov/nhsn ■ HAIs and prevention activities in Arizona: www.azdhs.gov/phs/oids/hai/ ■ Arizona validation efforts: www.cdc.gov/hai/pdfs/state-progress-landscape.pdf
THIS REPORT IS BASED ON 2013 DATA, PUBLISHED JANUARY 2015

A R K A N S A SHealthcare-associated infections (HAIs) are infections patients can get while receiving medical treatment in a healthcare facility. Working toward the elimination of HAIs is a CDC priority. The standardized infection ratio (SIR) is a summary statistic that can be used to track HAI prevention progress over time; lower SIRs are better. The infection data are collected through CDC’s National Healthcare Safety Network (NHSN). HAI data for nearly all U.S. hospitals are published on the Hospital Compare website.
CLABSIsCENTRAL LINE-ASSOCIATED BLOODSTREAM INFECTIONS
45% LOWER COMPARED TO NAT’L BASELINE*
*Statistically significant.
When a tube is placed in a large vein and not put in correctly or kept clean, it can become a way for germs to enter the body and cause deadly infections in the blood.
Arkansas hospitals reported no significant change in CLABSIs between 2012 and 2013.
13%Among the 24 hospitals in Arkansas with enough data to calculate an SIR, 13% had an SIR significantly worse than the national SIR of 0.54.
CAUTIsCATHETER-ASSOCIATED URINARY TRACT INFECTIONS
4% HIGHER COMPARED TO NAT’L BASELINE
When a urinary catheter is not put in correctly, not kept clean, or left in a patient for too long, germs can travel through the catheter and infect the bladder and kidneys.
Arkansas hospitals reported no significant change in CAUTIs between 2012 and 2013.
12% Among the 33 hospitals in Arkansas with enough data to calculate an SIR, 12% had an SIR significantly worse than the national SIR of 1.06.
MRSA BacteremiaLABORATORY IDENTIFIED HOSPITAL-ONSET BLOODSTREAM INFECTIONS
16% HIGHER COMPARED TO NAT’L BASELINE
Methicillin-resistant Staphylococcus aureus (MRSA) is bacteria usually spread by contaminated hands. In a healthcare setting, such as a hospital, MRSA can cause serious bloodstream infections.
5%Among the 21 hospitals in Arkansas with enough data to calculate an SIR, 5% had an SIR significantly worse than the national SIR of 0.92.
SSIsSURGICAL SITE INFECTIONS
When germs get into an area where surgery is or was performed, patients can get a surgical site infection. Sometimes these infections involve only the skin. Other SSIs can involve tissues under the skin, organs, or implanted material.
SSI: Abdominal Hysterectomy 6% LOWER COMPARED TO NAT’L BASELINE
Arkansas hospitals reported no significant change in SSIs related to abdominal hysterectomy surgery between 2012 and 2013.
Not enough data to report how many hospitals had an SIR significantly worse than the national SIR of 0.86.
SSI: Colon Surgery 23% LOWER COMPARED TO NAT’L BASELINE*
Arkansas hospitals reported no significant change in SSIs related to colon surgery between 2012 and 2013.
Several changes to the NHSN 2013 SSI protocol likely contributed to an increase in the national and some state- specific colon surgery SIRs compared to 2012.
0%Among the 25 hospitals in Arkansas with enough data to calculate an SIR, 0% had an SIR significantly worse than the national SIR of 0.92.
C. difficile InfectionsLABORATORY IDENTIFIED HOSPITAL-ONSET C. DIFFICILE INFECTIONS
37% LOWER COMPARED TO NAT’L BASELINE*
When a person takes antibiotics, good bacteria that protect against infection are destroyed for several months. During this time, patients can get sick from Clostridium difficile (C. difficile), bacteria that cause potentially deadly diarrhea, which can be spread in healthcare settings.
0%Among the 46 hospitals in Arkansas with enough data to calculate an SIR, 0% had an SIR significantly worse than the national SIR of 0.90.
THIS REPORT IS BASED ON 2013 DATA, PUBLISHED JANUARY 2015

A R K A N S A SHEALTHCARE-ASSOCIATED INFECTION (HAI) DATA give healthcare facilities and public health agencies knowledge to design, implement, and evaluate HAI prevention efforts.
LEGEND
2013 state SIR is significantly lower (better) than comparison group
in column header
or
Change in 2013 state SIR compared to group in column header is not statistically significant
2013 state SIR is significantly higher (worse) than comparison group in
column header
2013 state SIR cannot be calculated
HAI TYPE# OF ARKANSAS
HOSPITALS THAT REPORTED DATA TO CDC’S NHSN, 2013
Total Hospitals in State: 87+
2013 STATE SIR vs.
2012 State SIR‡
2013 STATE SIR vs.
2013 Nat’l SIR
2013 STATE SIR vs.
Nat’l Baseline
2013 STATE SIR
2013 NAT’L SIR
CLABSI Nat’l Baseline: 2008
48 2% 2% 45% 0.55 0.54
CAUTI Nat’l Baseline: 2009
49 5% 2% 4% 1.04 1.06
SSI, Abdominal Hysterectomy Nat’l Baseline: 2008
39 16% 9% 6% 0.94 0.86
SSI, Colon Surgery Nat’l Baseline: 2008
39 21% 16% 23% 0.77 0.92
MRSA Bacteremia Nat’l Baseline: 2011
47 2012 SIR not available
27% 16% 1.16 0.92
C. difficile Infections Nat’l Baseline: 2011
47 2012 SIR not available
31% 37% 0.63 0.90
+Not all hospitals are required to report these infections; for example, some hospitals do not use central lines or urinary catheters, or do not perform colon or abdominal hysterectomy surgeries. ‡The state’s 2012 SIR can be found in the data tables of this report. Nat’l baseline time period varies by infection type. See first column of this table for specifics.
WHAT IS THE STANDARDIZED INFECTION RATIO?
The standardized infection ratio (SIR) is a summary statistic that can be used to track HAI prevention progress over time; lower SIRs are better. The SIR for a facility or state is adjusted to account for factors that might cause infection rates to be higher or lower, such as hospital size, teaching status, the type of patients a hospital serves, and surgery and patient characteristics.
WHAT IS ARKANSAS DOING TO PREVENT HEALTHCARE-ASSOCIATED INFECTIONS?
Arkansas has a state mandate to publicly report at least one HAI to NHSN.
Prevention efforts to reduce specific HAIs:
■ Central line-associated bloodstream infections ■ Catheter-associated urinary tract infections ■ Surgical site infections
■ Multidrug-resistant infections (C. difficile) ■ Hand hygiene ■ Antibiotic stewardship ■ Healthcare personnel influenza vaccination
Learn how your hospital is performing: www.medicare.gov/hospitalcompare For additional information:
■ 2013 HAI Progress Report: www.cdc.gov/hai/progress-report/ ■ NHSN: www.cdc.gov/nhsn ■ HAIs and prevention activities in Arkansas: www.healthy.arkansas.gov/programsServices/epidemiology/Pages/HAI.aspx
■ Arkansas validation efforts: www.cdc.gov/hai/pdfs/state-progress-landscape.pdf
THIS REPORT IS BASED ON 2013 DATA, PUBLISHED JANUARY 2015

C A L I F O R N I AHealthcare-associated infections (HAIs) are infections patients can get while receiving medical treatment in a healthcare facility. Working toward the elimination of HAIs is a CDC priority. The standardized infection ratio (SIR) is a summary statistic that can be used to track HAI prevention progress over time; lower SIRs are better. The infection data are collected through CDC’s National Healthcare Safety Network (NHSN). HAI data for nearly all U.S. hospitals are published on the Hospital Compare website.
CLABSIsCENTRAL LINE-ASSOCIATED BLOODSTREAM INFECTIONS
48% LOWER COMPARED TO NAT’L BASELINE*
*Statistically significant.
When a tube is placed in a large vein and not put in correctly or kept clean, it can become a way for germs to enter the body and cause deadly infections in the blood.
California hospitals reported no significant change in CLABSIs between 2012 and 2013.
12%Among the 290 hospitals in California with enough data to calculate an SIR, 12% had an SIR significantly worse than the national SIR of 0.54.
CAUTIsCATHETER-ASSOCIATED URINARY TRACT INFECTIONS
10% LOWER COMPARED TO NAT’L BASELINE*
When a urinary catheter is not put in correctly, not kept clean, or left in a patient for too long, germs can travel through the catheter and infect the bladder and kidneys.
California hospitals reported a significant increase in CAUTIs between 2012 and 2013.
11% Among the 296 hospitals in California with enough data to calculate an SIR, 11% had an SIR significantly worse than the national SIR of 1.06.
MRSA BacteremiaLABORATORY IDENTIFIED HOSPITAL-ONSET BLOODSTREAM INFECTIONS
27% LOWER COMPARED TO NAT’L BASELINE*
Methicillin-resistant Staphylococcus aureus (MRSA) is bacteria usually spread by contaminated hands. In a healthcare setting, such as a hospital, MRSA can cause serious bloodstream infections.
2%Among the 225 hospitals in California with enough data to calculate an SIR, 2% had an SIR significantly worse than the national SIR of 0.92.
SSIsSURGICAL SITE INFECTIONS
When germs get into an area where surgery is or was performed, patients can get a surgical site infection. Sometimes these infections involve only the skin. Other SSIs can involve tissues under the skin, organs, or implanted material.
SSI: Abdominal Hysterectomy 28% LOWER COMPARED TO NAT’L BASELINE*
California hospitals reported no significant change in SSIs related to abdominal hysterectomy surgery between 2012 and 2013.
1%Among the 77 hospitals in California with enough data to calculate an SIR, 1% had an SIR significantly worse than the national SIR of 0.86.
SSI: Colon Surgery 18% LOWER COMPARED TO NAT’L BASELINE*
California hospitals reported a significant increase in SSIs related to colon surgery between 2012 and 2013.
Several changes to the NHSN 2013 SSI protocol likely contributed to an increase in the national and some state- specific colon surgery SIRs compared to 2012.
5%Among the 204 hospitals in California with enough data to calculate an SIR, 5% had an SIR significantly worse than the national SIR of 0.92.
C. difficile InfectionsLABORATORY IDENTIFIED HOSPITAL-ONSET C. DIFFICILE INFECTIONS
5% HIGHER COMPARED TO NAT’L BASELINE*
When a person takes antibiotics, good bacteria that protect against infection are destroyed for several months. During this time, patients can get sick from Clostridium difficile (C. difficile), bacteria that cause potentially deadly diarrhea, which can be spread in healthcare settings.
25%Among the 325 hospitals in California with enough data to calculate an SIR, 25% had an SIR significantly worse than the national SIR of 0.90.
THIS REPORT IS BASED ON 2013 DATA, PUBLISHED JANUARY 2015

C A L I F O R N I AHEALTHCARE-ASSOCIATED INFECTION (HAI) DATA give healthcare facilities and public health agencies knowledge to design, implement, and evaluate HAI prevention efforts.
LEGEND
2013 state SIR is significantly lower (better) than comparison group
in column header
or
Change in 2013 state SIR compared to group in column header is not statistically significant
2013 state SIR is significantly higher (worse) than comparison group in
column header
2013 state SIR cannot be calculated
HAI TYPE# OF CALIFORNIA
HOSPITALS THAT REPORTED DATA TO CDC’S NHSN, 2013
Total Hospitals in State: 417+
2013 STATE SIR vs.
2012 State SIR‡
2013 STATE SIR vs.
2013 Nat’l SIR
2013 STATE SIR vs.
Nat’l Baseline
2013 STATE SIR
2013 NAT’L SIR
CLABSI Nat’l Baseline: 2008
350 3% 4% 48% 0.52 0.54
CAUTI Nat’l Baseline: 2009
341 7% 16% 10% 0.90 1.06
SSI, Abdominal Hysterectomy Nat’l Baseline: 2008
303 7% 18% 28% 0.72 0.86
SSI, Colon Surgery Nat’l Baseline: 2008
318 16% 12% 18% 0.82 0.92
MRSA Bacteremia Nat’l Baseline: 2011
359 2012 SIR not available
21% 27% 0.74 0.92
C. difficile Infections Nat’l Baseline: 2011
359 2012 SIR not available
18% 5% 1.05 0.90
+Not all hospitals are required to report these infections; for example, some hospitals do not use central lines or urinary catheters, or do not perform colon or abdominal hysterectomy surgeries. ‡The state’s 2012 SIR can be found in the data tables of this report. Nat’l baseline time period varies by infection type. See first column of this table for specifics.
WHAT IS THE STANDARDIZED INFECTION RATIO?
The standardized infection ratio (SIR) is a summary statistic that can be used to track HAI prevention progress over time; lower SIRs are better. The SIR for a facility or state is adjusted to account for factors that might cause infection rates to be higher or lower, such as hospital size, teaching status, the type of patients a hospital serves, and surgery and patient characteristics.
WHAT IS CALIFORNIA DOING TO PREVENT HEALTHCARE-ASSOCIATED INFECTIONS?
California has a state mandate to publicly report at least one HAI to NHSN. California is one of 10 state health departments participating in CDC’s Emerging Infections Program, which allows for extra surveillance and research of HAIs.
Prevention efforts to reduce specific HAIs:
■ Central line-associated bloodstream infections ■ Catheter-associated urinary tract infections
■ Surgical site infections ■ Multidrug-resistant infections (MRSA, C. difficile,
CRE, and others) ■ Long-term care facilities ■ Hand hygiene ■ Antibiotic stewardship ■ Healthcare personnel influenza vaccination
Learn how your hospital is performing: www.medicare.gov/hospitalcompare For additional information:
■ 2013 HAI Progress Report: www.cdc.gov/hai/progress-report/ ■ NHSN: www.cdc.gov/nhsn ■ HAIs and prevention activities in California: www.cdph.ca.gov/programs/hai/Pages/default.aspx ■ California validation efforts: www.cdc.gov/hai/pdfs/state-progress-landscape.pdf
THIS REPORT IS BASED ON 2013 DATA, PUBLISHED JANUARY 2015

C O L O R A D OHealthcare-associated infections (HAIs) are infections patients can get while receiving medical treatment in a healthcare facility. Working toward the elimination of HAIs is a CDC priority. The standardized infection ratio (SIR) is a summary statistic that can be used to track HAI prevention progress over time; lower SIRs are better. The infection data are collected through CDC’s National Healthcare Safety Network (NHSN). HAI data for nearly all U.S. hospitals are published on the Hospital Compare website.
CLABSIsCENTRAL LINE-ASSOCIATED BLOODSTREAM INFECTIONS
51% LOWER COMPARED TO NAT’L BASELINE*
*Statistically significant.
When a tube is placed in a large vein and not put in correctly or kept clean, it can become a way for germs to enter the body and cause deadly infections in the blood.
Colorado hospitals reported no significant change in CLABSIs between 2012 and 2013.
3%Among the 32 hospitals in Colorado with enough data to calculate an SIR, 3% had an SIR significantly worse than the national SIR of 0.54.
CAUTIsCATHETER-ASSOCIATED URINARY TRACT INFECTIONS
21% LOWER COMPARED TO NAT’L BASELINE*
When a urinary catheter is not put in correctly, not kept clean, or left in a patient for too long, germs can travel through the catheter and infect the bladder and kidneys.
Colorado hospitals reported no significant change in CAUTIs between 2012 and 2013.
3% Among the 33 hospitals in Colorado with enough data to calculate an SIR, 3% had an SIR significantly worse than the national SIR of 1.06.
MRSA BacteremiaLABORATORY IDENTIFIED HOSPITAL-ONSET BLOODSTREAM INFECTIONS
26% LOWER COMPARED TO NAT’L BASELINE*
Methicillin-resistant Staphylococcus aureus (MRSA) is bacteria usually spread by contaminated hands. In a healthcare setting, such as a hospital, MRSA can cause serious bloodstream infections.
0%Among the 27 hospitals in Colorado with enough data to calculate an SIR, 0% had an SIR significantly worse than the national SIR of 0.92.
SSIsSURGICAL SITE INFECTIONS
When germs get into an area where surgery is or was performed, patients can get a surgical site infection. Sometimes these infections involve only the skin. Other SSIs can involve tissues under the skin, organs, or implanted material.
SSI: Abdominal Hysterectomy 11% LOWER COMPARED TO NAT’L BASELINE
Colorado hospitals reported no significant change in SSIs related to abdominal hysterectomy surgery between 2012 and 2013.
0%Among the 10 hospitals in Colorado with enough data to calculate an SIR, 0% had an SIR significantly worse than the national SIR of 0.86.
SSI: Colon Surgery 29% LOWER COMPARED TO NAT’L BASELINE*
Colorado hospitals reported no significant change in SSIs related to colon surgery between 2012 and 2013.
Several changes to the NHSN 2013 SSI protocol likely contributed to an increase in the national and some state- specific colon surgery SIRs compared to 2012.
6%Among the 31 hospitals in Colorado with enough data to calculate an SIR, 6% had an SIR significantly worse than the national SIR of 0.92.
C. difficile InfectionsLABORATORY IDENTIFIED HOSPITAL-ONSET C. DIFFICILE INFECTIONS
5% HIGHER COMPARED TO NAT’L BASELINE
When a person takes antibiotics, good bacteria that protect against infection are destroyed for several months. During this time, patients can get sick from Clostridium difficile (C. difficile), bacteria that cause potentially deadly diarrhea, which can be spread in healthcare settings.
27%Among the 48 hospitals in Colorado with enough data to calculate an SIR, 27% had an SIR significantly worse than the national SIR of 0.90.
THIS REPORT IS BASED ON 2013 DATA, PUBLISHED JANUARY 2015

C O L O R A D OHEALTHCARE-ASSOCIATED INFECTION (HAI) DATA give healthcare facilities and public health agencies knowledge to design, implement, and evaluate HAI prevention efforts.
LEGEND
2013 state SIR is significantly lower (better) than comparison group
in column header
or
Change in 2013 state SIR compared to group in column header is not statistically significant
2013 state SIR is significantly higher (worse) than comparison group in
column header
2013 state SIR cannot be calculated
HAI TYPE# OF COLORADO
HOSPITALS THAT REPORTED DATA TO CDC’S NHSN, 2013
Total Hospitals in State: 94+
2013 STATE SIR vs.
2012 State SIR‡
2013 STATE SIR vs.
2013 Nat’l SIR
2013 STATE SIR vs.
Nat’l Baseline
2013 STATE SIR
2013 NAT’L SIR
CLABSI Nat’l Baseline: 2008
52 5% 8% 51% 0.49 0.54
CAUTI Nat’l Baseline: 2009
52 13% 25% 21% 0.79 1.06
SSI, Abdominal Hysterectomy Nat’l Baseline: 2008
56 9% 3% 11% 0.89 0.86
SSI, Colon Surgery Nat’l Baseline: 2008
57 3% 23% 29% 0.71 0.92
MRSA Bacteremia Nat’l Baseline: 2011
56 2012 SIR not available
19% 26% 0.74 0.92
C. difficile Infections Nat’l Baseline: 2011
55 2012 SIR not available
16% 5% 1.05 0.90
+Not all hospitals are required to report these infections; for example, some hospitals do not use central lines or urinary catheters, or do not perform colon or abdominal hysterectomy surgeries. ‡The state’s 2012 SIR can be found in the data tables of this report. Nat’l baseline time period varies by infection type. See first column of this table for specifics.
WHAT IS THE STANDARDIZED INFECTION RATIO?
The standardized infection ratio (SIR) is a summary statistic that can be used to track HAI prevention progress over time; lower SIRs are better. The SIR for a facility or state is adjusted to account for factors that might cause infection rates to be higher or lower, such as hospital size, teaching status, the type of patients a hospital serves, and surgery and patient characteristics.
WHAT IS COLORADO DOING TO PREVENT HEALTHCARE-ASSOCIATED INFECTIONS?
Colorado has a state mandate to publicly report at least one HAI to NHSN. Colorado is one of 10 state health departments participating in CDC’s Emerging Infections Program, which allows for extra surveillance and research of HAIs.
Learn how your hospital is performing: www.medicare.gov/hospitalcompare For additional information:
■ 2013 HAI Progress Report: www.cdc.gov/hai/progress-report/ ■ NHSN: www.cdc.gov/nhsn ■ HAIs and prevention activities in Colorado: www.colorado.gov/pacific/cdphe/health-care-associated-infections-hai ■ Colorado validation efforts: www.cdc.gov/hai/pdfs/state-progress-landscape.pdf
THIS REPORT IS BASED ON 2013 DATA, PUBLISHED JANUARY 2015
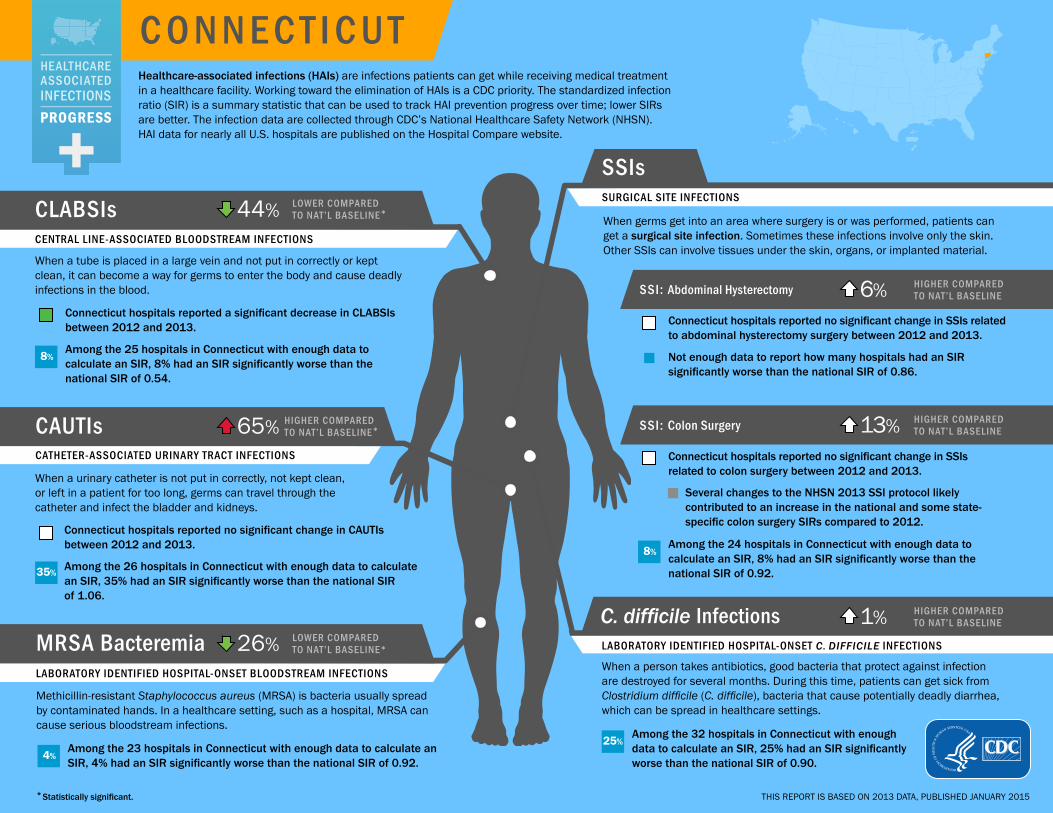
C O N N E C T I C U THealthcare-associated infections (HAIs) are infections patients can get while receiving medical treatment in a healthcare facility. Working toward the elimination of HAIs is a CDC priority. The standardized infection ratio (SIR) is a summary statistic that can be used to track HAI prevention progress over time; lower SIRs are better. The infection data are collected through CDC’s National Healthcare Safety Network (NHSN). HAI data for nearly all U.S. hospitals are published on the Hospital Compare website.
CLABSIsCENTRAL LINE-ASSOCIATED BLOODSTREAM INFECTIONS
44% LOWER COMPARED TO NAT’L BASELINE*
*Statistically significant.
When a tube is placed in a large vein and not put in correctly or kept clean, it can become a way for germs to enter the body and cause deadly infections in the blood.
Connecticut hospitals reported a significant decrease in CLABSIs between 2012 and 2013.
8%Among the 25 hospitals in Connecticut with enough data to calculate an SIR, 8% had an SIR significantly worse than the national SIR of 0.54.
CAUTIsCATHETER-ASSOCIATED URINARY TRACT INFECTIONS
65% HIGHER COMPARED TO NAT’L BASELINE*
When a urinary catheter is not put in correctly, not kept clean, or left in a patient for too long, germs can travel through the catheter and infect the bladder and kidneys.
Connecticut hospitals reported no significant change in CAUTIs between 2012 and 2013.
35% Among the 26 hospitals in Connecticut with enough data to calculate an SIR, 35% had an SIR significantly worse than the national SIR of 1.06.
MRSA BacteremiaLABORATORY IDENTIFIED HOSPITAL-ONSET BLOODSTREAM INFECTIONS
26% LOWER COMPARED TO NAT’L BASELINE*
Methicillin-resistant Staphylococcus aureus (MRSA) is bacteria usually spread by contaminated hands. In a healthcare setting, such as a hospital, MRSA can cause serious bloodstream infections.
4%Among the 23 hospitals in Connecticut with enough data to calculate an SIR, 4% had an SIR significantly worse than the national SIR of 0.92.
SSIsSURGICAL SITE INFECTIONS
When germs get into an area where surgery is or was performed, patients can get a surgical site infection. Sometimes these infections involve only the skin. Other SSIs can involve tissues under the skin, organs, or implanted material.
SSI: Abdominal Hysterectomy 6% HIGHER COMPARED TO NAT’L BASELINE
Connecticut hospitals reported no significant change in SSIs related to abdominal hysterectomy surgery between 2012 and 2013.
Not enough data to report how many hospitals had an SIR significantly worse than the national SIR of 0.86.
SSI: Colon Surgery 13% HIGHER COMPARED TO NAT’L BASELINE
Connecticut hospitals reported no significant change in SSIs related to colon surgery between 2012 and 2013.
Several changes to the NHSN 2013 SSI protocol likely contributed to an increase in the national and some state- specific colon surgery SIRs compared to 2012.
8%Among the 24 hospitals in Connecticut with enough data to calculate an SIR, 8% had an SIR significantly worse than the national SIR of 0.92.
C. difficile InfectionsLABORATORY IDENTIFIED HOSPITAL-ONSET C. DIFFICILE INFECTIONS
1% HIGHER COMPARED TO NAT’L BASELINE
When a person takes antibiotics, good bacteria that protect against infection are destroyed for several months. During this time, patients can get sick from Clostridium difficile (C. difficile), bacteria that cause potentially deadly diarrhea, which can be spread in healthcare settings.
25%Among the 32 hospitals in Connecticut with enough data to calculate an SIR, 25% had an SIR significantly worse than the national SIR of 0.90.
THIS REPORT IS BASED ON 2013 DATA, PUBLISHED JANUARY 2015

C O N N E C T I C U THEALTHCARE-ASSOCIATED INFECTION (HAI) DATA give healthcare facilities and public health agencies knowledge to design, implement, and evaluate HAI prevention efforts.
LEGEND
2013 state SIR is significantly lower (better) than comparison group
in column header
or
Change in 2013 state SIR compared to group in column header is not statistically significant
2013 state SIR is significantly higher (worse) than comparison group in
column header
2013 state SIR cannot be calculated
HAI TYPE# OF CONNECTICUT
HOSPITALS THAT REPORTED DATA TO CDC’S NHSN, 2013
Total Hospitals in State: 41+
2013 STATE SIR vs.
2012 State SIR‡
2013 STATE SIR vs.
2013 Nat’l SIR
2013 STATE SIR vs.
Nat’l Baseline
2013 STATE SIR
2013 NAT’L SIR
CLABSI Nat’l Baseline: 2008
30 22% 4% 44% 0.56 0.54
CAUTI Nat’l Baseline: 2009
31 11% 57% 65% 1.65 1.06
SSI, Abdominal Hysterectomy Nat’l Baseline: 2008
29 2% 23% 6% 1.06 0.86
SSI, Colon Surgery Nat’l Baseline: 2008
30 7% 23% 13% 1.13 0.92
MRSA Bacteremia Nat’l Baseline: 2011
32 2012 SIR not available
19% 26% 0.74 0.92
C. difficile Infections Nat’l Baseline: 2011
32 2012 SIR not available
12% 1% 1.01 0.90
+Not all hospitals are required to report these infections; for example, some hospitals do not use central lines or urinary catheters, or do not perform colon or abdominal hysterectomy surgeries. ‡The state’s 2012 SIR can be found in the data tables of this report. Nat’l baseline time period varies by infection type. See first column of this table for specifics.
WHAT IS THE STANDARDIZED INFECTION RATIO?
The standardized infection ratio (SIR) is a summary statistic that can be used to track HAI prevention progress over time; lower SIRs are better. The SIR for a facility or state is adjusted to account for factors that might cause infection rates to be higher or lower, such as hospital size, teaching status, the type of patients a hospital serves, and surgery and patient characteristics.
WHAT IS CONNECTICUT DOING TO PREVENT HEALTHCARE-ASSOCIATED INFECTIONS?
Connecticut has a state mandate to publicly report at least one HAI to NHSN. Connecticut is one of 10 state health departments participating in CDC’s Emerging Infections Program, which allows for extra surveillance and research of HAIs.
Prevention efforts to reduce specific HAIs:
■ Central line-associated bloodstream infections ■ Catheter-associated urinary tract infections
■ Surgical site infections ■ Multidrug-resistant infections (MRSA, C. difficile, CRE) ■ Long-term care facilities ■ Hand hygiene ■ Antibiotic stewardship ■ Healthcare personnel influenza vaccination
Learn how your hospital is performing: www.medicare.gov/hospitalcompare For additional information:
■ 2013 HAI Progress Report: www.cdc.gov/hai/progress-report/ ■ NHSN: www.cdc.gov/nhsn ■ HAIs and prevention activities in Connecticut: www.ct.gov/dph/cwp/view.asp?a=3136&q=417318 ■ Connecticut validation efforts: www.cdc.gov/hai/pdfs/state-progress-landscape.pdf
THIS REPORT IS BASED ON 2013 DATA, PUBLISHED JANUARY 2015

D E L A W A R EHealthcare-associated infections (HAIs) are infections patients can get while receiving medical treatment in a healthcare facility. Working toward the elimination of HAIs is a CDC priority. The standardized infection ratio (SIR) is a summary statistic that can be used to track HAI prevention progress over time; lower SIRs are better. The infection data are collected through CDC’s National Healthcare Safety Network (NHSN). HAI data for nearly all U.S. hospitals are published on the Hospital Compare website.
CLABSIsCENTRAL LINE-ASSOCIATED BLOODSTREAM INFECTIONS
29% LOWER COMPARED TO NAT’L BASELINE*
*Statistically significant.
When a tube is placed in a large vein and not put in correctly or kept clean, it can become a way for germs to enter the body and cause deadly infections in the blood.
Delaware hospitals reported a significant increase in CLABSIs between 2012 and 2013.
Not enough data to report how many hospitals had an SIR significantly worse than the national SIR of 0.54.
CAUTIsCATHETER-ASSOCIATED URINARY TRACT INFECTIONS
30% HIGHER COMPARED TO NAT’L BASELINE*
When a urinary catheter is not put in correctly, not kept clean, or left in a patient for too long, germs can travel through the catheter and infect the bladder and kidneys.
Delaware hospitals reported no significant change in CAUTIs between 2012 and 2013.
Not enough data to report how many hospitals had an SIR significantly worse than the national SIR of 1.06.
MRSA BacteremiaLABORATORY IDENTIFIED HOSPITAL-ONSET BLOODSTREAM INFECTIONS
20% HIGHER COMPARED TO NAT’L BASELINE
Methicillin-resistant Staphylococcus aureus (MRSA) is bacteria usually spread by contaminated hands. In a healthcare setting, such as a hospital, MRSA can cause serious bloodstream infections.
Not enough data to report how many hospitals had an SIR significantly worse than the national SIR of 0.92.
SSIsSURGICAL SITE INFECTIONS
When germs get into an area where surgery is or was performed, patients can get a surgical site infection. Sometimes these infections involve only the skin. Other SSIs can involve tissues under the skin, organs, or implanted material.
SSI: Abdominal Hysterectomy 15% HIGHER COMPARED TO NAT’L BASELINE
Delaware hospitals reported no significant change in SSIs related to abdominal hysterectomy surgery between 2012 and 2013.
Not enough data to report how many hospitals had an SIR significantly worse than the national SIR of 0.86.
SSI: Colon Surgery 19% LOWER COMPARED TO NAT’L BASELINE
Delaware hospitals reported no significant change in SSIs related to colon surgery between 2012 and 2013.
Several changes to the NHSN 2013 SSI protocol likely contributed to an increase in the national and some state- specific colon surgery SIRs compared to 2012.
Not enough data to report how many hospitals had an SIR significantly worse than the national SIR of 0.92.
C. difficile InfectionsLABORATORY IDENTIFIED HOSPITAL-ONSET C. DIFFICILE INFECTIONS
5% HIGHER COMPARED TO NAT’L BASELINE
When a person takes antibiotics, good bacteria that protect against infection are destroyed for several months. During this time, patients can get sick from Clostridium difficile (C. difficile), bacteria that cause potentially deadly diarrhea, which can be spread in healthcare settings.
Not enough data to report how many hospitals had an SIR significantly worse than the national SIR of 0.90.
THIS REPORT IS BASED ON 2013 DATA, PUBLISHED JANUARY 2015

D E L A W A R EHEALTHCARE-ASSOCIATED INFECTION (HAI) DATA give healthcare facilities and public health agencies knowledge to design, implement, and evaluate HAI prevention efforts.
LEGEND
2013 state SIR is significantly lower (better) than comparison group
in column header
or
Change in 2013 state SIR compared to group in column header is not statistically significant
2013 state SIR is significantly higher (worse) than comparison group in
column header
2013 state SIR cannot be calculated
HAI TYPE# OF DELAWARE
HOSPITALS THAT REPORTED DATA TO CDC’S NHSN, 2013
Total Hospitals in State: 13+
2013 STATE SIR vs.
2012 State SIR‡
2013 STATE SIR vs.
2013 Nat’l SIR
2013 STATE SIR vs.
Nat’l Baseline
2013 STATE SIR
2013 NAT’L SIR
CLABSI Nat’l Baseline: 2008
8 65% 32% 29% 0.71 0.54
CAUTI Nat’l Baseline: 2009
8 24% 23% 30% 1.30 1.06
SSI, Abdominal Hysterectomy Nat’l Baseline: 2008
7 9% 34% 15% 1.15 0.86
SSI, Colon Surgery Nat’l Baseline: 2008
7 20% 12% 19% 0.81 0.92
MRSA Bacteremia Nat’l Baseline: 2011
8 2012 SIR not available
31% 20% 1.20 0.92
C. difficile Infections Nat’l Baseline: 2011
8 2012 SIR not available
16% 5% 1.05 0.90
+Not all hospitals are required to report these infections; for example, some hospitals do not use central lines or urinary catheters, or do not perform colon or abdominal hysterectomy surgeries. ‡The state’s 2012 SIR can be found in the data tables of this report. Nat’l baseline time period varies by infection type. See first column of this table for specifics.
WHAT IS THE STANDARDIZED INFECTION RATIO?
The standardized infection ratio (SIR) is a summary statistic that can be used to track HAI prevention progress over time; lower SIRs are better. The SIR for a facility or state is adjusted to account for factors that might cause infection rates to be higher or lower, such as hospital size, teaching status, the type of patients a hospital serves, and surgery and patient characteristics.
WHAT IS DELAWARE DOING TO PREVENT HEALTHCARE-ASSOCIATED INFECTIONS?
Delaware has a state mandate to publicly report at least one HAI to NHSN.
Prevention efforts to reduce specific HAIs:
■ Central line-associated bloodstream infections ■ Catheter-associated urinary tract infections ■ Surgical site infections
■ Multidrug-resistant infections (MRSA, C. difficile, CRE) ■ Long-term care facilities ■ Hand hygiene ■ Antibiotic stewardship ■ Healthcare personnel influenza vaccination
Learn how your hospital is performing: www.medicare.gov/hospitalcompare For additional information:
■ 2013 HAI Progress Report: www.cdc.gov/hai/progress-report/ ■ NHSN: www.cdc.gov/nhsn ■ HAIs and prevention activities in Delaware: dhss.delaware.gov/dph/epi/haihomepage.html ■ Delaware validation efforts: www.cdc.gov/hai/pdfs/state-progress-landscape.pdf
THIS REPORT IS BASED ON 2013 DATA, PUBLISHED JANUARY 2015
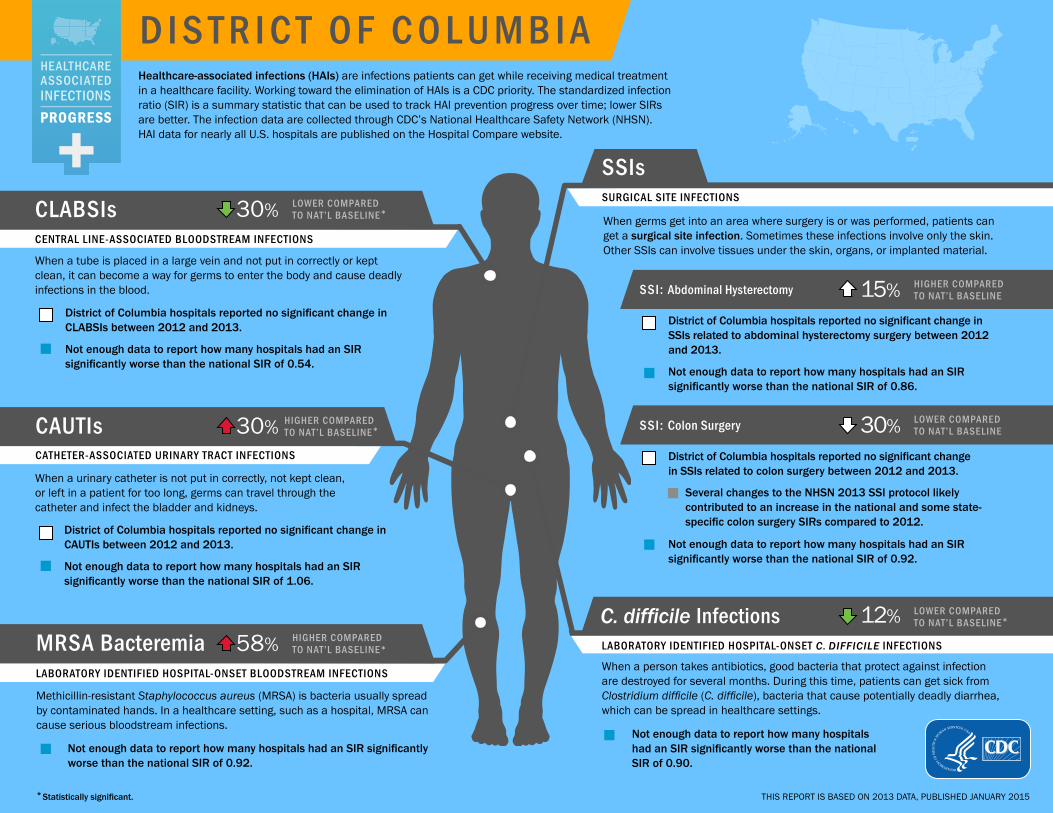
D I S T R I C T O F C O L U M B I AHealthcare-associated infections (HAIs) are infections patients can get while receiving medical treatment in a healthcare facility. Working toward the elimination of HAIs is a CDC priority. The standardized infection ratio (SIR) is a summary statistic that can be used to track HAI prevention progress over time; lower SIRs are better. The infection data are collected through CDC’s National Healthcare Safety Network (NHSN). HAI data for nearly all U.S. hospitals are published on the Hospital Compare website.
CLABSIsCENTRAL LINE-ASSOCIATED BLOODSTREAM INFECTIONS
30% LOWER COMPARED TO NAT’L BASELINE*
*Statistically significant.
When a tube is placed in a large vein and not put in correctly or kept clean, it can become a way for germs to enter the body and cause deadly infections in the blood.
District of Columbia hospitals reported no significant change in CLABSIs between 2012 and 2013.
Not enough data to report how many hospitals had an SIR significantly worse than the national SIR of 0.54.
CAUTIsCATHETER-ASSOCIATED URINARY TRACT INFECTIONS
30% HIGHER COMPARED TO NAT’L BASELINE*
When a urinary catheter is not put in correctly, not kept clean, or left in a patient for too long, germs can travel through the catheter and infect the bladder and kidneys.
District of Columbia hospitals reported no significant change in CAUTIs between 2012 and 2013.
Not enough data to report how many hospitals had an SIR significantly worse than the national SIR of 1.06.
MRSA BacteremiaLABORATORY IDENTIFIED HOSPITAL-ONSET BLOODSTREAM INFECTIONS
58% HIGHER COMPARED TO NAT’L BASELINE*
Methicillin-resistant Staphylococcus aureus (MRSA) is bacteria usually spread by contaminated hands. In a healthcare setting, such as a hospital, MRSA can cause serious bloodstream infections.
Not enough data to report how many hospitals had an SIR significantly worse than the national SIR of 0.92.
SSIsSURGICAL SITE INFECTIONS
When germs get into an area where surgery is or was performed, patients can get a surgical site infection. Sometimes these infections involve only the skin. Other SSIs can involve tissues under the skin, organs, or implanted material.
SSI: Abdominal Hysterectomy 15% HIGHER COMPARED TO NAT’L BASELINE
District of Columbia hospitals reported no significant change in SSIs related to abdominal hysterectomy surgery between 2012 and 2013.
Not enough data to report how many hospitals had an SIR significantly worse than the national SIR of 0.86.
SSI: Colon Surgery 30% LOWER COMPARED TO NAT’L BASELINE
District of Columbia hospitals reported no significant change in SSIs related to colon surgery between 2012 and 2013.
Several changes to the NHSN 2013 SSI protocol likely contributed to an increase in the national and some state- specific colon surgery SIRs compared to 2012.
Not enough data to report how many hospitals had an SIR significantly worse than the national SIR of 0.92.
C. difficile InfectionsLABORATORY IDENTIFIED HOSPITAL-ONSET C. DIFFICILE INFECTIONS
12% LOWER COMPARED TO NAT’L BASELINE*
When a person takes antibiotics, good bacteria that protect against infection are destroyed for several months. During this time, patients can get sick from Clostridium difficile (C. difficile), bacteria that cause potentially deadly diarrhea, which can be spread in healthcare settings.
Not enough data to report how many hospitals had an SIR significantly worse than the national SIR of 0.90.
THIS REPORT IS BASED ON 2013 DATA, PUBLISHED JANUARY 2015

D I S T R I C T O F C O L U M B I A
HEALTHCARE-ASSOCIATED INFECTION (HAI) DATA give healthcare facilities and public health agencies knowledge to design, implement, and evaluate HAI prevention efforts.
LEGEND
2013 state SIR is significantly lower (better) than comparison group
in column header
or
Change in 2013 state SIR compared to group in column header is not statistically significant
2013 state SIR is significantly higher (worse) than comparison group in
column header
2013 state SIR cannot be calculated
HAI TYPE# OF DISTRICT OF COLUMBIA HOSPITALS THAT REPORTED DATA TO CDC’S NHSN, 2013
Total Hospitals in State: 12+
2013 STATE SIR vs.
2012 State SIR‡
2013 STATE SIR vs.
2013 Nat’l SIR
2013 STATE SIR vs.
Nat’l Baseline
2013 STATE SIR
2013 NAT’L SIR
CLABSI Nat’l Baseline: 2008
8 9% 30% 30% 0.70 0.54
CAUTI Nat’l Baseline: 2009
7 1% 23% 30% 1.30 1.06
SSI, Abdominal Hysterectomy Nat’l Baseline: 2008
7 17% 34% 15% 1.15 0.86
SSI, Colon Surgery Nat’l Baseline: 2008
7 47% 24% 30% 0.71 0.92
MRSA Bacteremia Nat’l Baseline: 2011
9 2012 SIR not available
73% 58% 1.58 0.92
C. difficile Infections Nat’l Baseline: 2011
7 2012 SIR not available
3% 12% 0.88 0.90
+Not all hospitals are required to report these infections; for example, some hospitals do not use central lines or urinary catheters, or do not perform colon or abdominal hysterectomy surgeries. ‡The state’s 2012 SIR can be found in the data tables of this report. Nat’l baseline time period varies by infection type. See first column of this table for specifics.
WHAT IS THE STANDARDIZED INFECTION RATIO?
The standardized infection ratio (SIR) is a summary statistic that can be used to track HAI prevention progress over time; lower SIRs are better. The SIR for a facility or state is adjusted to account for factors that might cause infection rates to be higher or lower, such as hospital size, teaching status, the type of patients a hospital serves, and surgery and patient characteristics.
WHAT IS DISTRICT OF COLUMBIA DOING TO PREVENT HEALTHCARE-ASSOCIATED INFECTIONS?
District of Columbia has a state mandate to publicly report at least one HAI to NHSN.
Prevention efforts to reduce specific HAIs:
■ Central line-associated bloodstream infections ■ Catheter-associated urinary tract infections ■ Multidrug-resistant infections
(MRSA, C. difficile, CRE)
■ Hand hygiene ■ Antibiotic stewardship ■ Healthcare personnel influenza vaccination
Learn how your hospital is performing: www.medicare.gov/hospitalcompare For additional information:
■ 2013 HAI Progress Report: www.cdc.gov/hai/progress-report/ ■ NHSN: www.cdc.gov/nhsn ■ HAIs and prevention activities in District of Columbia: doh.dc.gov/page/healthcare-associated-infections ■ District of Columbia validation efforts: www.cdc.gov/hai/pdfs/state-progress-landscape.pdf
THIS REPORT IS BASED ON 2013 DATA, PUBLISHED JANUARY 2015

F L O R I D AHealthcare-associated infections (HAIs) are infections patients can get while receiving medical treatment in a healthcare facility. Working toward the elimination of HAIs is a CDC priority. The standardized infection ratio (SIR) is a summary statistic that can be used to track HAI prevention progress over time; lower SIRs are better. The infection data are collected through CDC’s National Healthcare Safety Network (NHSN). HAI data for nearly all U.S. hospitals are published on the Hospital Compare website.
CLABSIsCENTRAL LINE-ASSOCIATED BLOODSTREAM INFECTIONS
41% LOWER COMPARED TO NAT’L BASELINE*
*Statistically significant.
When a tube is placed in a large vein and not put in correctly or kept clean, it can become a way for germs to enter the body and cause deadly infections in the blood.
Florida hospitals reported no significant change in CLABSIs between 2012 and 2013.
8%Among the 170 hospitals in Florida with enough data to calculate an SIR, 8% had an SIR significantly worse than the national SIR of 0.54.
CAUTIsCATHETER-ASSOCIATED URINARY TRACT INFECTIONS
6% LOWER COMPARED TO NAT’L BASELINE*
When a urinary catheter is not put in correctly, not kept clean, or left in a patient for too long, germs can travel through the catheter and infect the bladder and kidneys.
Florida hospitals reported a significant increase in CAUTIs between 2012 and 2013.
9% Among the 180 hospitals in Florida with enough data to calculate an SIR, 9% had an SIR significantly worse than the national SIR of 1.06.
MRSA BacteremiaLABORATORY IDENTIFIED HOSPITAL-ONSET BLOODSTREAM INFECTIONS
11% HIGHER COMPARED TO NAT’L BASELINE*
Methicillin-resistant Staphylococcus aureus (MRSA) is bacteria usually spread by contaminated hands. In a healthcare setting, such as a hospital, MRSA can cause serious bloodstream infections.
11%Among the 150 hospitals in Florida with enough data to calculate an SIR, 11% had an SIR significantly worse than the national SIR of 0.92.
SSIsSURGICAL SITE INFECTIONS
When germs get into an area where surgery is or was performed, patients can get a surgical site infection. Sometimes these infections involve only the skin. Other SSIs can involve tissues under the skin, organs, or implanted material.
SSI: Abdominal Hysterectomy 10% LOWER COMPARED TO NAT’L BASELINE
Florida hospitals reported no significant change in SSIs related to abdominal hysterectomy surgery between 2012 and 2013.
6%Among the 47 hospitals in Florida with enough data to calculate an SIR, 6% had an SIR significantly worse than the national SIR of 0.86.
SSI: Colon Surgery 21% LOWER COMPARED TO NAT’L BASELINE*
Florida hospitals reported no significant change in SSIs related to colon surgery between 2012 and 2013.
Several changes to the NHSN 2013 SSI protocol likely contributed to an increase in the national and some state- specific colon surgery SIRs compared to 2012.
5%Among the 150 hospitals in Florida with enough data to calculate an SIR, 5% had an SIR significantly worse than the national SIR of 0.92.
C. difficile InfectionsLABORATORY IDENTIFIED HOSPITAL-ONSET C. DIFFICILE INFECTIONS
11% LOWER COMPARED TO NAT’L BASELINE*
When a person takes antibiotics, good bacteria that protect against infection are destroyed for several months. During this time, patients can get sick from Clostridium difficile (C. difficile), bacteria that cause potentially deadly diarrhea, which can be spread in healthcare settings.
16%Among the 184 hospitals in Florida with enough data to calculate an SIR, 16% had an SIR significantly worse than the national SIR of 0.90.
THIS REPORT IS BASED ON 2013 DATA, PUBLISHED JANUARY 2015

F L O R I D AHEALTHCARE-ASSOCIATED INFECTION (HAI) DATA give healthcare facilities and public health agencies knowledge to design, implement, and evaluate HAI prevention efforts.
LEGEND
2013 state SIR is significantly lower (better) than comparison group
in column header
or
Change in 2013 state SIR compared to group in column header is not statistically significant
2013 state SIR is significantly higher (worse) than comparison group in
column header
2013 state SIR cannot be calculated
HAI TYPE# OF FLORIDA
HOSPITALS THAT REPORTED DATA TO CDC’S NHSN, 2013
Total Hospitals in State: 237+
2013 STATE SIR vs.
2012 State SIR‡
2013 STATE SIR vs.
2013 Nat’l SIR
2013 STATE SIR vs.
Nat’l Baseline
2013 STATE SIR
2013 NAT’L SIR
CLABSI Nat’l Baseline: 2008
191 6% 11% 41% 0.59 0.54
CAUTI Nat’l Baseline: 2009
190 11% 12% 6% 0.94 1.06
SSI, Abdominal Hysterectomy Nat’l Baseline: 2008
172 7% 5% 10% 0.90 0.86
SSI, Colon Surgery Nat’l Baseline: 2008
183 9% 15% 21% 0.79 0.92
MRSA Bacteremia Nat’l Baseline: 2011
190 2012 SIR not available
23% 11% 1.11 0.92
C. difficile Infections Nat’l Baseline: 2011
190 2012 SIR not available
2% 11% 0.89 0.90
+Not all hospitals are required to report these infections; for example, some hospitals do not use central lines or urinary catheters, or do not perform colon or abdominal hysterectomy surgeries. ‡The state’s 2012 SIR can be found in the data tables of this report. Nat’l baseline time period varies by infection type. See first column of this table for specifics.
WHAT IS THE STANDARDIZED INFECTION RATIO?
The standardized infection ratio (SIR) is a summary statistic that can be used to track HAI prevention progress over time; lower SIRs are better. The SIR for a facility or state is adjusted to account for factors that might cause infection rates to be higher or lower, such as hospital size, teaching status, the type of patients a hospital serves, and surgery and patient characteristics.
WHAT IS FLORIDA DOING TO PREVENT HEALTHCARE-ASSOCIATED INFECTIONS?
Prevention efforts to reduce specific HAIs:
■ Central line-associated bloodstream infections ■ Catheter-associated urinary tract infections ■ Surgical site infections ■ Multidrug-resistant infections (C. difficile, CRE) ■ Long-term care facilities ■ Antibiotic stewardship
Learn how your hospital is performing: www.medicare.gov/hospitalcompare For additional information:
■ 2013 HAI Progress Report: www.cdc.gov/hai/progress-report/ ■ NHSN: www.cdc.gov/nhsn ■ HAIs and prevention activities in Florida: www.floridahealth.gov/diseases-and-conditions/health-care-associated-infections/index.html
■ Florida validation efforts: www.cdc.gov/hai/pdfs/state-progress-landscape.pdf
THIS REPORT IS BASED ON 2013 DATA, PUBLISHED JANUARY 2015
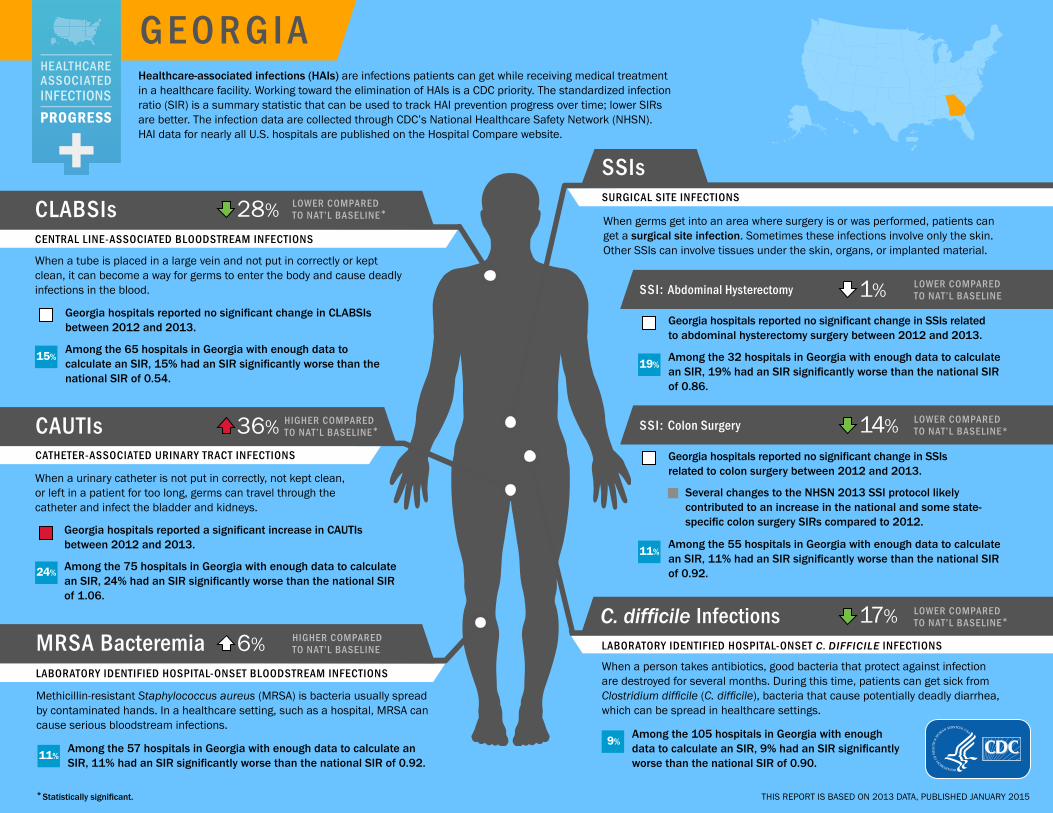
G E O R G I AHealthcare-associated infections (HAIs) are infections patients can get while receiving medical treatment in a healthcare facility. Working toward the elimination of HAIs is a CDC priority. The standardized infection ratio (SIR) is a summary statistic that can be used to track HAI prevention progress over time; lower SIRs are better. The infection data are collected through CDC’s National Healthcare Safety Network (NHSN). HAI data for nearly all U.S. hospitals are published on the Hospital Compare website.
CLABSIsCENTRAL LINE-ASSOCIATED BLOODSTREAM INFECTIONS
28% LOWER COMPARED TO NAT’L BASELINE*
*Statistically significant.
When a tube is placed in a large vein and not put in correctly or kept clean, it can become a way for germs to enter the body and cause deadly infections in the blood.
Georgia hospitals reported no significant change in CLABSIs between 2012 and 2013.
15%Among the 65 hospitals in Georgia with enough data to calculate an SIR, 15% had an SIR significantly worse than the national SIR of 0.54.
CAUTIsCATHETER-ASSOCIATED URINARY TRACT INFECTIONS
36% HIGHER COMPARED TO NAT’L BASELINE*
When a urinary catheter is not put in correctly, not kept clean, or left in a patient for too long, germs can travel through the catheter and infect the bladder and kidneys.
Georgia hospitals reported a significant increase in CAUTIs between 2012 and 2013.
24% Among the 75 hospitals in Georgia with enough data to calculate an SIR, 24% had an SIR significantly worse than the national SIR of 1.06.
MRSA BacteremiaLABORATORY IDENTIFIED HOSPITAL-ONSET BLOODSTREAM INFECTIONS
6% HIGHER COMPARED TO NAT’L BASELINE
Methicillin-resistant Staphylococcus aureus (MRSA) is bacteria usually spread by contaminated hands. In a healthcare setting, such as a hospital, MRSA can cause serious bloodstream infections.
11%Among the 57 hospitals in Georgia with enough data to calculate an SIR, 11% had an SIR significantly worse than the national SIR of 0.92.
SSIsSURGICAL SITE INFECTIONS
When germs get into an area where surgery is or was performed, patients can get a surgical site infection. Sometimes these infections involve only the skin. Other SSIs can involve tissues under the skin, organs, or implanted material.
SSI: Abdominal Hysterectomy 1% LOWER COMPARED TO NAT’L BASELINE
Georgia hospitals reported no significant change in SSIs related to abdominal hysterectomy surgery between 2012 and 2013.
19%Among the 32 hospitals in Georgia with enough data to calculate an SIR, 19% had an SIR significantly worse than the national SIR of 0.86.
SSI: Colon Surgery 14% LOWER COMPARED TO NAT’L BASELINE*
Georgia hospitals reported no significant change in SSIs related to colon surgery between 2012 and 2013.
Several changes to the NHSN 2013 SSI protocol likely contributed to an increase in the national and some state- specific colon surgery SIRs compared to 2012.
11%Among the 55 hospitals in Georgia with enough data to calculate an SIR, 11% had an SIR significantly worse than the national SIR of 0.92.
C. difficile InfectionsLABORATORY IDENTIFIED HOSPITAL-ONSET C. DIFFICILE INFECTIONS
17% LOWER COMPARED TO NAT’L BASELINE*
When a person takes antibiotics, good bacteria that protect against infection are destroyed for several months. During this time, patients can get sick from Clostridium difficile (C. difficile), bacteria that cause potentially deadly diarrhea, which can be spread in healthcare settings.
9%Among the 105 hospitals in Georgia with enough data to calculate an SIR, 9% had an SIR significantly worse than the national SIR of 0.90.
THIS REPORT IS BASED ON 2013 DATA, PUBLISHED JANUARY 2015

G E O R G I AHEALTHCARE-ASSOCIATED INFECTION (HAI) DATA give healthcare facilities and public health agencies knowledge to design, implement, and evaluate HAI prevention efforts.
LEGEND
2013 state SIR is significantly lower (better) than comparison group
in column header
or
Change in 2013 state SIR compared to group in column header is not statistically significant
2013 state SIR is significantly higher (worse) than comparison group in
column header
2013 state SIR cannot be calculated
HAI TYPE# OF GEORGIA
HOSPITALS THAT REPORTED DATA TO CDC’S NHSN, 2013
Total Hospitals in State: 166+
2013 STATE SIR vs.
2012 State SIR‡
2013 STATE SIR vs.
2013 Nat’l SIR
2013 STATE SIR vs.
Nat’l Baseline
2013 STATE SIR
2013 NAT’L SIR
CLABSI Nat’l Baseline: 2008
102 7% 35% 28% 0.72 0.54
CAUTI Nat’l Baseline: 2009
105 32% 30% 36% 1.36 1.06
SSI, Abdominal Hysterectomy Nat’l Baseline: 2008
90 13% 15% 1% 0.99 0.86
SSI, Colon Surgery Nat’l Baseline: 2008
96 5% 7% 14% 0.87 0.92
MRSA Bacteremia Nat’l Baseline: 2011
111 2012 SIR not available
16% 6% 1.06 0.92
C. difficile Infections Nat’l Baseline: 2011
111 2012 SIR not available
9% 17% 0.83 0.90
+Not all hospitals are required to report these infections; for example, some hospitals do not use central lines or urinary catheters, or do not perform colon or abdominal hysterectomy surgeries. ‡The state’s 2012 SIR can be found in the data tables of this report. Nat’l baseline time period varies by infection type. See first column of this table for specifics.
WHAT IS THE STANDARDIZED INFECTION RATIO?
The standardized infection ratio (SIR) is a summary statistic that can be used to track HAI prevention progress over time; lower SIRs are better. The SIR for a facility or state is adjusted to account for factors that might cause infection rates to be higher or lower, such as hospital size, teaching status, the type of patients a hospital serves, and surgery and patient characteristics.
WHAT IS GEORGIA DOING TO PREVENT HEALTHCARE-ASSOCIATED INFECTIONS?
Georgia has a state mandate to publicly report at least one HAI to NHSN. Georgia is one of 10 state health departments participating in CDC’s Emerging Infections Program, which allows for extra surveillance and research of HAIs.
Prevention efforts to reduce specific HAIs:
■ Central line-associated bloodstream infections ■ Catheter-associated urinary tract infections
■ Surgical site infections ■ Multidrug-resistant infections (MRSA, C. difficile, CRE) ■ Long-term care facilities ■ Antibiotic stewardship
Learn how your hospital is performing: www.medicare.gov/hospitalcompare For additional information:
■ 2013 HAI Progress Report: www.cdc.gov/hai/progress-report/ ■ NHSN: www.cdc.gov/nhsn ■ HAIs and prevention activities in Georgia: dph.georgia.gov/healthcare-associated-infections ■ Georgia validation efforts: www.cdc.gov/hai/pdfs/state-progress-landscape.pdf
THIS REPORT IS BASED ON 2013 DATA, PUBLISHED JANUARY 2015

H A W A I IHealthcare-associated infections (HAIs) are infections patients can get while receiving medical treatment in a healthcare facility. Working toward the elimination of HAIs is a CDC priority. The standardized infection ratio (SIR) is a summary statistic that can be used to track HAI prevention progress over time; lower SIRs are better. The infection data are collected through CDC’s National Healthcare Safety Network (NHSN). HAI data for nearly all U.S. hospitals are published on the Hospital Compare website.
CLABSIsCENTRAL LINE-ASSOCIATED BLOODSTREAM INFECTIONS
75% LOWER COMPARED TO NAT’L BASELINE*
*Statistically significant.
When a tube is placed in a large vein and not put in correctly or kept clean, it can become a way for germs to enter the body and cause deadly infections in the blood.
Hawaii hospitals reported no significant change in CLABSIs between 2012 and 2013.
0%Among the 13 hospitals in Hawaii with enough data to calculate an SIR, 0% had an SIR significantly worse than the national SIR of 0.54.
CAUTIsCATHETER-ASSOCIATED URINARY TRACT INFECTIONS
38% LOWER COMPARED TO NAT’L BASELINE*
When a urinary catheter is not put in correctly, not kept clean, or left in a patient for too long, germs can travel through the catheter and infect the bladder and kidneys.
Hawaii hospitals reported a significant decrease in CAUTIs between 2012 and 2013.
0% Among the 13 hospitals in Hawaii with enough data to calculate an SIR, 0% had an SIR significantly worse than the national SIR of 1.06.
MRSA BacteremiaLABORATORY IDENTIFIED HOSPITAL-ONSET BLOODSTREAM INFECTIONS
43% LOWER COMPARED TO NAT’L BASELINE*
Methicillin-resistant Staphylococcus aureus (MRSA) is bacteria usually spread by contaminated hands. In a healthcare setting, such as a hospital, MRSA can cause serious bloodstream infections.
Not enough data to report how many hospitals had an SIR significantly worse than the national SIR of 0.92.
SSIsSURGICAL SITE INFECTIONS
When germs get into an area where surgery is or was performed, patients can get a surgical site infection. Sometimes these infections involve only the skin. Other SSIs can involve tissues under the skin, organs, or implanted material.
SSI: Abdominal Hysterectomy 100% LOWER COMPARED TO NAT’L BASELINE*
Hawaii hospitals reported a significant decrease in SSIs related to abdominal hysterectomy surgery between 2012 and 2013.
Not enough data to report how many hospitals had an SIR significantly worse than the national SIR of 0.86.
SSI: Colon Surgery 3% HIGHER COMPARED TO NAT’L BASELINE
Hawaii hospitals reported no significant change in SSIs related to colon surgery between 2012 and 2013.
Several changes to the NHSN 2013 SSI protocol likely contributed to an increase in the national and some state- specific colon surgery SIRs compared to 2012.
Not enough data to report how many hospitals had an SIR significantly worse than the national SIR of 0.92.
C. difficile InfectionsLABORATORY IDENTIFIED HOSPITAL-ONSET C. DIFFICILE INFECTIONS
36% LOWER COMPARED TO NAT’L BASELINE*
When a person takes antibiotics, good bacteria that protect against infection are destroyed for several months. During this time, patients can get sick from Clostridium difficile (C. difficile), bacteria that cause potentially deadly diarrhea, which can be spread in healthcare settings.
8%Among the 13 hospitals in Hawaii with enough data to calculate an SIR, 8% had an SIR significantly worse than the national SIR of 0.90.
THIS REPORT IS BASED ON 2013 DATA, PUBLISHED JANUARY 2015

H A W A I IHEALTHCARE-ASSOCIATED INFECTION (HAI) DATA give healthcare facilities and public health agencies knowledge to design, implement, and evaluate HAI prevention efforts.
LEGEND
2013 state SIR is significantly lower (better) than comparison group
in column header
or
Change in 2013 state SIR compared to group in column header is not statistically significant
2013 state SIR is significantly higher (worse) than comparison group in
column header
2013 state SIR cannot be calculated
HAI TYPE# OF HAWAII
HOSPITALS THAT REPORTED DATA TO CDC’S NHSN, 2013
Total Hospitals in State: 27+
2013 STATE SIR vs.
2012 State SIR‡
2013 STATE SIR vs.
2013 Nat’l SIR
2013 STATE SIR vs.
Nat’l Baseline
2013 STATE SIR
2013 NAT’L SIR
CLABSI Nat’l Baseline: 2008
15 27% 54% 75% 0.25 0.54
CAUTI Nat’l Baseline: 2009
15 37% 41% 38% 0.62 1.06
SSI, Abdominal Hysterectomy Nat’l Baseline: 2008
13 100% 100% 100% 0.00 0.86
SSI, Colon Surgery Nat’l Baseline: 2008
13 6% 12% 3% 1.03 0.92
MRSA Bacteremia Nat’l Baseline: 2011
13 2012 SIR not available
38% 43% 0.57 0.92
C. difficile Infections Nat’l Baseline: 2011
13 2012 SIR not available
29% 36% 0.65 0.90
+Not all hospitals are required to report these infections; for example, some hospitals do not use central lines or urinary catheters, or do not perform colon or abdominal hysterectomy surgeries. ‡The state’s 2012 SIR can be found in the data tables of this report. Nat’l baseline time period varies by infection type. See first column of this table for specifics.
WHAT IS THE STANDARDIZED INFECTION RATIO?
The standardized infection ratio (SIR) is a summary statistic that can be used to track HAI prevention progress over time; lower SIRs are better. The SIR for a facility or state is adjusted to account for factors that might cause infection rates to be higher or lower, such as hospital size, teaching status, the type of patients a hospital serves, and surgery and patient characteristics.
WHAT IS HAWAII DOING TO PREVENT HEALTHCARE-ASSOCIATED INFECTIONS?
Hawaii has a state mandate to publicly report at least one HAI to NHSN.
Prevention efforts to reduce specific HAIs:
■ Surgical site infections ■ Hand hygiene ■ Antibiotic stewardship
Learn how your hospital is performing: www.medicare.gov/hospitalcompare For additional information:
■ 2013 HAI Progress Report: www.cdc.gov/hai/progress-report/ ■ NHSN: www.cdc.gov/nhsn ■ HAIs and prevention activities in Hawaii: health.hawaii.gov/docd/dib/healthcare-associated-infections-hais/ ■ Hawaii validation efforts: www.cdc.gov/hai/pdfs/state-progress-landscape.pdf
THIS REPORT IS BASED ON 2013 DATA, PUBLISHED JANUARY 2015

I D A H OHealthcare-associated infections (HAIs) are infections patients can get while receiving medical treatment in a healthcare facility. Working toward the elimination of HAIs is a CDC priority. The standardized infection ratio (SIR) is a summary statistic that can be used to track HAI prevention progress over time; lower SIRs are better. The infection data are collected through CDC’s National Healthcare Safety Network (NHSN). HAI data for nearly all U.S. hospitals are published on the Hospital Compare website.
CLABSIsCENTRAL LINE-ASSOCIATED BLOODSTREAM INFECTIONS
71% LOWER COMPARED TO NAT’L BASELINE*
*Statistically significant.
When a tube is placed in a large vein and not put in correctly or kept clean, it can become a way for germs to enter the body and cause deadly infections in the blood.
Idaho hospitals reported no significant change in CLABSIs between 2012 and 2013.
Not enough data to report how many hospitals had an SIR significantly worse than the national SIR of 0.54.
CAUTIsCATHETER-ASSOCIATED URINARY TRACT INFECTIONS
LESSTHAN 1% HIGHER COMPARED
TO NAT’L BASELINE
When a urinary catheter is not put in correctly, not kept clean, or left in a patient for too long, germs can travel through the catheter and infect the bladder and kidneys.
Idaho hospitals reported no significant change in CAUTIs between 2012 and 2013.
10% Among the 10 hospitals in Idaho with enough data to calculate an SIR, 10% had an SIR significantly worse than the national SIR of 1.06.
MRSA BacteremiaLABORATORY IDENTIFIED HOSPITAL-ONSET BLOODSTREAM INFECTIONS
55% LOWER COMPARED TO NAT’L BASELINE*
Methicillin-resistant Staphylococcus aureus (MRSA) is bacteria usually spread by contaminated hands. In a healthcare setting, such as a hospital, MRSA can cause serious bloodstream infections.
Not enough data to report how many hospitals had an SIR significantly worse than the national SIR of 0.92.
SSIsSURGICAL SITE INFECTIONS
When germs get into an area where surgery is or was performed, patients can get a surgical site infection. Sometimes these infections involve only the skin. Other SSIs can involve tissues under the skin, organs, or implanted material.
SSI: Abdominal Hysterectomy 28% HIGHER COMPARED TO NAT’L BASELINE
Idaho hospitals reported a significant increase in SSIs related to abdominal hysterectomy surgery between 2012 and 2013.
Not enough data to report how many hospitals had an SIR significantly worse than the national SIR of 0.86.
SSI: Colon Surgery 20% LOWER COMPARED TO NAT’L BASELINE
Idaho hospitals reported no significant change in SSIs related to colon surgery between 2012 and 2013.
Several changes to the NHSN 2013 SSI protocol likely contributed to an increase in the national and some state- specific colon surgery SIRs compared to 2012.
Not enough data to report how many hospitals had an SIR significantly worse than the national SIR of 0.92.
C. difficile InfectionsLABORATORY IDENTIFIED HOSPITAL-ONSET C. DIFFICILE INFECTIONS
33% LOWER COMPARED TO NAT’L BASELINE*
When a person takes antibiotics, good bacteria that protect against infection are destroyed for several months. During this time, patients can get sick from Clostridium difficile (C. difficile), bacteria that cause potentially deadly diarrhea, which can be spread in healthcare settings.
0%Among the 15 hospitals in Idaho with enough data to calculate an SIR, 0% had an SIR significantly worse than the national SIR of 0.90.
THIS REPORT IS BASED ON 2013 DATA, PUBLISHED JANUARY 2015

I D A H OHEALTHCARE-ASSOCIATED INFECTION (HAI) DATA give healthcare facilities and public health agencies knowledge to design, implement, and evaluate HAI prevention efforts.
LEGEND
2013 state SIR is significantly lower (better) than comparison group
in column header
or
Change in 2013 state SIR compared to group in column header is not statistically significant
2013 state SIR is significantly higher (worse) than comparison group in
column header
2013 state SIR cannot be calculated
HAI TYPE# OF IDAHO
HOSPITALS THAT REPORTED DATA TO CDC’S NHSN, 2013
Total Hospitals in State: 47+
2013 STATE SIR vs.
2012 State SIR‡
2013 STATE SIR vs.
2013 Nat’l SIR
2013 STATE SIR vs.
Nat’l Baseline
2013 STATE SIR
2013 NAT’L SIR
CLABSI Nat’l Baseline: 2008
16 11% 47% 71% 0.29 0.54
CAUTI Nat’l Baseline: 2009
17 12% 5% < 1% 1.00 1.06
SSI, Abdominal Hysterectomy Nat’l Baseline: 2008
17 > 100% 49% 28% 1.28 0.86
SSI, Colon Surgery Nat’l Baseline: 2008
18 11% 13% 20% 0.80 0.92
MRSA Bacteremia Nat’l Baseline: 2011
21 2012 SIR not available
51% 55% 0.45 0.92
C. difficile Infections Nat’l Baseline: 2011
20 2012 SIR not available
26% 33% 0.67 0.90
+Not all hospitals are required to report these infections; for example, some hospitals do not use central lines or urinary catheters, or do not perform colon or abdominal hysterectomy surgeries. ‡The state’s 2012 SIR can be found in the data tables of this report. Nat’l baseline time period varies by infection type. See first column of this table for specifics.
WHAT IS THE STANDARDIZED INFECTION RATIO?
The standardized infection ratio (SIR) is a summary statistic that can be used to track HAI prevention progress over time; lower SIRs are better. The SIR for a facility or state is adjusted to account for factors that might cause infection rates to be higher or lower, such as hospital size, teaching status, the type of patients a hospital serves, and surgery and patient characteristics.
WHAT IS IDAHO DOING TO PREVENT HEALTHCARE-ASSOCIATED INFECTIONS?
Prevention efforts to reduce specific HAIs:
■ Catheter-associated urinary tract infections ■ Multidrug-resistant infections (C. difficile) ■ Hand hygiene ■ Antibiotic stewardship ■ Healthcare personnel influenza vaccination
Learn how your hospital is performing: www.medicare.gov/hospitalcompare For additional information:
■ 2013 HAI Progress Report: www.cdc.gov/hai/progress-report/ ■ NHSN: www.cdc.gov/nhsn ■ HAIs and prevention activities in Idaho: healthandwelfare.idaho.gov/Health/DiseasesConditions/
MethicillinresistantStaphylococcusaureus(MRSA)/tabid/203/Default.aspx
■ Idaho validation efforts: www.cdc.gov/hai/pdfs/state-progress-landscape.pdf
THIS REPORT IS BASED ON 2013 DATA, PUBLISHED JANUARY 2015

I L L I N O I SHealthcare-associated infections (HAIs) are infections patients can get while receiving medical treatment in a healthcare facility. Working toward the elimination of HAIs is a CDC priority. The standardized infection ratio (SIR) is a summary statistic that can be used to track HAI prevention progress over time; lower SIRs are better. The infection data are collected through CDC’s National Healthcare Safety Network (NHSN). HAI data for nearly all U.S. hospitals are published on the Hospital Compare website.
CLABSIsCENTRAL LINE-ASSOCIATED BLOODSTREAM INFECTIONS
53% LOWER COMPARED TO NAT’L BASELINE*
*Statistically significant.
When a tube is placed in a large vein and not put in correctly or kept clean, it can become a way for germs to enter the body and cause deadly infections in the blood.
Illinois hospitals reported a significant decrease in CLABSIs between 2012 and 2013.
7%Among the 106 hospitals in Illinois with enough data to calculate an SIR, 7% had an SIR significantly worse than the national SIR of 0.54.
CAUTIsCATHETER-ASSOCIATED URINARY TRACT INFECTIONS
3% LOWER COMPARED TO NAT’L BASELINE
When a urinary catheter is not put in correctly, not kept clean, or left in a patient for too long, germs can travel through the catheter and infect the bladder and kidneys.
Illinois hospitals reported no significant change in CAUTIs between 2012 and 2013.
7% Among the 114 hospitals in Illinois with enough data to calculate an SIR, 7% had an SIR significantly worse than the national SIR of 1.06.
MRSA BacteremiaLABORATORY IDENTIFIED HOSPITAL-ONSET BLOODSTREAM INFECTIONS
29% LOWER COMPARED TO NAT’L BASELINE*
Methicillin-resistant Staphylococcus aureus (MRSA) is bacteria usually spread by contaminated hands. In a healthcare setting, such as a hospital, MRSA can cause serious bloodstream infections.
2%Among the 95 hospitals in Illinois with enough data to calculate an SIR, 2% had an SIR significantly worse than the national SIR of 0.92.
SSIsSURGICAL SITE INFECTIONS
When germs get into an area where surgery is or was performed, patients can get a surgical site infection. Sometimes these infections involve only the skin. Other SSIs can involve tissues under the skin, organs, or implanted material.
SSI: Abdominal Hysterectomy 42% LOWER COMPARED TO NAT’L BASELINE*
Illinois hospitals reported a significant decrease in SSIs related to abdominal hysterectomy surgery between 2012 and 2013.
0%Among the 38 hospitals in Illinois with enough data to calculate an SIR, 0% had an SIR significantly worse than the national SIR of 0.86.
SSI: Colon Surgery 19% LOWER COMPARED TO NAT’L BASELINE*
Illinois hospitals reported significant increase in SSIs related to colon surgery between 2012 and 2013.
Several changes to the NHSN 2013 SSI protocol likely contributed to an increase in the national and some state- specific colon surgery SIRs compared to 2012.
4%Among the 90 hospitals in Illinois with enough data to calculate an SIR, 4% had an SIR significantly worse than the national SIR of 0.92.
C. difficile InfectionsLABORATORY IDENTIFIED HOSPITAL-ONSET C. DIFFICILE INFECTIONS
9% LOWER COMPARED TO NAT’L BASELINE*
When a person takes antibiotics, good bacteria that protect against infection are destroyed for several months. During this time, patients can get sick from Clostridium difficile (C. difficile), bacteria that cause potentially deadly diarrhea, which can be spread in healthcare settings.
11%Among the 163 hospitals in Illinois with enough data to calculate an SIR, 11% had an SIR significantly worse than the national SIR of 0.90.
THIS REPORT IS BASED ON 2013 DATA, PUBLISHED JANUARY 2015

I L L I N O I SHEALTHCARE-ASSOCIATED INFECTION (HAI) DATA give healthcare facilities and public health agencies knowledge to design, implement, and evaluate HAI prevention efforts.
LEGEND
2013 state SIR is significantly lower (better) than comparison group
in column header
or
Change in 2013 state SIR compared to group in column header is not statistically significant
2013 state SIR is significantly higher (worse) than comparison group in
column header
2013 state SIR cannot be calculated
HAI TYPE# OF ILLINOIS
HOSPITALS THAT REPORTED DATA TO CDC’S NHSN, 2013
Total Hospitals in State: 207+
2013 STATE SIR vs.
2012 State SIR‡
2013 STATE SIR vs.
2013 Nat’l SIR
2013 STATE SIR vs.
Nat’l Baseline
2013 STATE SIR
2013 NAT’L SIR
CLABSI Nat’l Baseline: 2008
148 17% 13% 53% 0.47 0.54
CAUTI Nat’l Baseline: 2009
148 7% 9% 3% 0.97 1.06
SSI, Abdominal Hysterectomy Nat’l Baseline: 2008
135 36% 33% 42% 0.58 0.86
SSI, Colon Surgery Nat’l Baseline: 2008
138 32% 12% 19% 0.81 0.92
MRSA Bacteremia Nat’l Baseline: 2011
183 2012 SIR not available
23% 29% 0.72 0.92
C. difficile Infections Nat’l Baseline: 2011
183 2012 SIR not available
< 1% 9% 0.91 0.90
+Not all hospitals are required to report these infections; for example, some hospitals do not use central lines or urinary catheters, or do not perform colon or abdominal hysterectomy surgeries. ‡The state’s 2012 SIR can be found in the data tables of this report. Nat’l baseline time period varies by infection type. See first column of this table for specifics.
WHAT IS THE STANDARDIZED INFECTION RATIO?
The standardized infection ratio (SIR) is a summary statistic that can be used to track HAI prevention progress over time; lower SIRs are better. The SIR for a facility or state is adjusted to account for factors that might cause infection rates to be higher or lower, such as hospital size, teaching status, the type of patients a hospital serves, and surgery and patient characteristics.
WHAT IS ILLINOIS DOING TO PREVENT HEALTHCARE-ASSOCIATED INFECTIONS?
Illinois has a state mandate to publicly report at least one HAI to NHSN.
Prevention efforts to reduce specific HAIs:
■ Central line-associated bloodstream infections ■ Catheter-associated urinary tract infections ■ Multidrug-resistant infections (C. difficile, CRE)
■ Long-term care facilities ■ Antibiotic stewardship ■ Healthcare personnel influenza vaccination
Learn how your hospital is performing: www.medicare.gov/hospitalcompare For additional information:
■ 2013 HAI Progress Report: www.cdc.gov/hai/progress-report/ ■ NHSN: www.cdc.gov/nhsn ■ HAIs and prevention activities in Illinois: www.idph.state.il.us/patientsafety/index.htm#hai ■ Illinois validation efforts: www.cdc.gov/hai/pdfs/state-progress-landscape.pdf
THIS REPORT IS BASED ON 2013 DATA, PUBLISHED JANUARY 2015

I N D I A N AHealthcare-associated infections (HAIs) are infections patients can get while receiving medical treatment in a healthcare facility. Working toward the elimination of HAIs is a CDC priority. The standardized infection ratio (SIR) is a summary statistic that can be used to track HAI prevention progress over time; lower SIRs are better. The infection data are collected through CDC’s National Healthcare Safety Network (NHSN). HAI data for nearly all U.S. hospitals are published on the Hospital Compare website.
CLABSIsCENTRAL LINE-ASSOCIATED BLOODSTREAM INFECTIONS
31% LOWER COMPARED TO NAT’L BASELINE*
*Statistically significant.
When a tube is placed in a large vein and not put in correctly or kept clean, it can become a way for germs to enter the body and cause deadly infections in the blood.
Indiana hospitals reported no significant change in CLABSIs between 2012 and 2013.
12%Among the 58 hospitals in Indiana with enough data to calculate an SIR, 12% had an SIR significantly worse than the national SIR of 0.54.
CAUTIsCATHETER-ASSOCIATED URINARY TRACT INFECTIONS
23% HIGHER COMPARED TO NAT’L BASELINE*
When a urinary catheter is not put in correctly, not kept clean, or left in a patient for too long, germs can travel through the catheter and infect the bladder and kidneys.
Indiana hospitals reported a significant increase in CAUTIs between 2012 and 2013.
9% Among the 70 hospitals in Indiana with enough data to calculate an SIR, 9% had an SIR significantly worse than the national SIR of 1.06.
MRSA BacteremiaLABORATORY IDENTIFIED HOSPITAL-ONSET BLOODSTREAM INFECTIONS
19% LOWER COMPARED TO NAT’L BASELINE*
Methicillin-resistant Staphylococcus aureus (MRSA) is bacteria usually spread by contaminated hands. In a healthcare setting, such as a hospital, MRSA can cause serious bloodstream infections.
5%Among the 43 hospitals in Indiana with enough data to calculate an SIR, 5% had an SIR significantly worse than the national SIR of 0.92.
SSIsSURGICAL SITE INFECTIONS
When germs get into an area where surgery is or was performed, patients can get a surgical site infection. Sometimes these infections involve only the skin. Other SSIs can involve tissues under the skin, organs, or implanted material.
SSI: Abdominal Hysterectomy 16% LOWER COMPARED TO NAT’L BASELINE
Indiana hospitals reported a significant increase in SSIs related to abdominal hysterectomy surgery between 2012 and 2013.
0%Among the 17 hospitals in Indiana with enough data to calculate an SIR, 0% had an SIR significantly worse than the national SIR of 0.86.
SSI: Colon Surgery 7% HIGHER COMPARED TO NAT’L BASELINE
Indiana hospitals reported no significant change in SSIs related to colon surgery between 2012 and 2013.
Several changes to the NHSN 2013 SSI protocol likely contributed to an increase in the national and some state- specific colon surgery SIRs compared to 2012.
9%Among the 53 hospitals in Indiana with enough data to calculate an SIR, 9% had an SIR significantly worse than the national SIR of 0.92.
C. difficile InfectionsLABORATORY IDENTIFIED HOSPITAL-ONSET C. DIFFICILE INFECTIONS
9% LOWER COMPARED TO NAT’L BASELINE*
When a person takes antibiotics, good bacteria that protect against infection are destroyed for several months. During this time, patients can get sick from Clostridium difficile (C. difficile), bacteria that cause potentially deadly diarrhea, which can be spread in healthcare settings.
13%Among the 94 hospitals in Indiana with enough data to calculate an SIR, 13% had an SIR significantly worse than the national SIR of 0.90.
THIS REPORT IS BASED ON 2013 DATA, PUBLISHED JANUARY 2015

I N D I A N AHEALTHCARE-ASSOCIATED INFECTION (HAI) DATA give healthcare facilities and public health agencies knowledge to design, implement, and evaluate HAI prevention efforts.
LEGEND
2013 state SIR is significantly lower (better) than comparison group
in column header
or
Change in 2013 state SIR compared to group in column header is not statistically significant
2013 state SIR is significantly higher (worse) than comparison group in
column header
2013 state SIR cannot be calculated
HAI TYPE# OF INDIANA
HOSPITALS THAT REPORTED DATA TO CDC’S NHSN, 2013
Total Hospitals in State: 148+
2013 STATE SIR vs.
2012 State SIR‡
2013 STATE SIR vs.
2013 Nat’l SIR
2013 STATE SIR vs.
Nat’l Baseline
2013 STATE SIR
2013 NAT’L SIR
CLABSI Nat’l Baseline: 2008
104 5% 30% 31% 0.69 0.54
CAUTI Nat’l Baseline: 2009
110 16% 16% 23% 1.23 1.06
SSI, Abdominal Hysterectomy Nat’l Baseline: 2008
98 61% 2% 16% 0.84 0.86
SSI, Colon Surgery Nat’l Baseline: 2008
101 2% 16% 7% 1.07 0.92
MRSA Bacteremia Nat’l Baseline: 2011
102 2012 SIR not available
12% 19% 0.81 0.92
C. difficile Infections Nat’l Baseline: 2011
102 2012 SIR not available
1% 9% 0.92 0.90
+Not all hospitals are required to report these infections; for example, some hospitals do not use central lines or urinary catheters, or do not perform colon or abdominal hysterectomy surgeries. ‡The state’s 2012 SIR can be found in the data tables of this report. Nat’l baseline time period varies by infection type. See first column of this table for specifics.
WHAT IS THE STANDARDIZED INFECTION RATIO?
The standardized infection ratio (SIR) is a summary statistic that can be used to track HAI prevention progress over time; lower SIRs are better. The SIR for a facility or state is adjusted to account for factors that might cause infection rates to be higher or lower, such as hospital size, teaching status, the type of patients a hospital serves, and surgery and patient characteristics.
WHAT IS INDIANA DOING TO PREVENT HEALTHCARE-ASSOCIATED INFECTIONS?
Indiana has a state mandate to publicly report at least one HAI to NHSN.
Prevention efforts to reduce specific HAIs:
■ Long-term care facilities ■ Antibiotic stewardship
Learn how your hospital is performing: www.medicare.gov/hospitalcompare For additional information:
■ 2013 HAI Progress Report: www.cdc.gov/hai/progress-report/ ■ NHSN: www.cdc.gov/nhsn ■ HAIs and prevention activities in Indiana: www.in.gov/isdh/25479.htm ■ Indiana validation efforts: www.cdc.gov/hai/pdfs/state-progress-landscape.pdf
THIS REPORT IS BASED ON 2013 DATA, PUBLISHED JANUARY 2015

I O W AHealthcare-associated infections (HAIs) are infections patients can get while receiving medical treatment in a healthcare facility. Working toward the elimination of HAIs is a CDC priority. The standardized infection ratio (SIR) is a summary statistic that can be used to track HAI prevention progress over time; lower SIRs are better. The infection data are collected through CDC’s National Healthcare Safety Network (NHSN). HAI data for nearly all U.S. hospitals are published on the Hospital Compare website.
CLABSIsCENTRAL LINE-ASSOCIATED BLOODSTREAM INFECTIONS
46% LOWER COMPARED TO NAT’L BASELINE*
*Statistically significant.
When a tube is placed in a large vein and not put in correctly or kept clean, it can become a way for germs to enter the body and cause deadly infections in the blood.
Iowa hospitals reported no significant change in CLABSIs between 2012 and 2013.
6%Among the 18 hospitals in Iowa with enough data to calculate an SIR, 6% had an SIR significantly worse than the national SIR of 0.54.
CAUTIsCATHETER-ASSOCIATED URINARY TRACT INFECTIONS
12% LOWER COMPARED TO NAT’L BASELINE
When a urinary catheter is not put in correctly, not kept clean, or left in a patient for too long, germs can travel through the catheter and infect the bladder and kidneys.
Iowa hospitals reported no significant change in CAUTIs between 2012 and 2013.
6% Among the 34 hospitals in Iowa with enough data to calculate an SIR, 6% had an SIR significantly worse than the national SIR of 1.06.
MRSA BacteremiaLABORATORY IDENTIFIED HOSPITAL-ONSET BLOODSTREAM INFECTIONS
56% LOWER COMPARED TO NAT’L BASELINE*
Methicillin-resistant Staphylococcus aureus (MRSA) is bacteria usually spread by contaminated hands. In a healthcare setting, such as a hospital, MRSA can cause serious bloodstream infections.
0%Among the 21 hospitals in Iowa with enough data to calculate an SIR, 0% had an SIR significantly worse than the national SIR of 0.92.
SSIsSURGICAL SITE INFECTIONS
When germs get into an area where surgery is or was performed, patients can get a surgical site infection. Sometimes these infections involve only the skin. Other SSIs can involve tissues under the skin, organs, or implanted material.
SSI: Abdominal Hysterectomy 6% LOWER COMPARED TO NAT’L BASELINE
Iowa hospitals reported no significant change in SSIs related to abdominal hysterectomy surgery between 2012 and 2013.
Not enough data to report how many hospitals had an SIR significantly worse than the national SIR of 0.86.
SSI: Colon Surgery 13% HIGHER COMPARED TO NAT’L BASELINE
Iowa hospitals reported no significant change in SSIs related to colon surgery between 2012 and 2013.
Several changes to the NHSN 2013 SSI protocol likely contributed to an increase in the national and some state- specific colon surgery SIRs compared to 2012.
5%Among the 22 hospitals in Iowa with enough data to calculate an SIR, 5% had an SIR significantly worse than the national SIR of 0.92.
C. difficile InfectionsLABORATORY IDENTIFIED HOSPITAL-ONSET C. DIFFICILE INFECTIONS
22% LOWER COMPARED TO NAT’L BASELINE*
When a person takes antibiotics, good bacteria that protect against infection are destroyed for several months. During this time, patients can get sick from Clostridium difficile (C. difficile), bacteria that cause potentially deadly diarrhea, which can be spread in healthcare settings.
0%Among the 45 hospitals in Iowa with enough data to calculate an SIR, 0% had an SIR significantly worse than the national SIR of 0.90.
THIS REPORT IS BASED ON 2013 DATA, PUBLISHED JANUARY 2015

I O W AHEALTHCARE-ASSOCIATED INFECTION (HAI) DATA give healthcare facilities and public health agencies knowledge to design, implement, and evaluate HAI prevention efforts.
LEGEND
2013 state SIR is significantly lower (better) than comparison group
in column header
or
Change in 2013 state SIR compared to group in column header is not statistically significant
2013 state SIR is significantly higher (worse) than comparison group in
column header
2013 state SIR cannot be calculated
HAI TYPE# OF IOWA
HOSPITALS THAT REPORTED DATA TO CDC’S NHSN, 2013
Total Hospitals in State: 122+
2013 STATE SIR vs.
2012 State SIR‡
2013 STATE SIR vs.
2013 Nat’l SIR
2013 STATE SIR vs.
Nat’l Baseline
2013 STATE SIR
2013 NAT’L SIR
CLABSI Nat’l Baseline: 2008
50 17% < 1% 46% 0.54 0.54
CAUTI Nat’l Baseline: 2009
68 6% 16% 12% 0.88 1.06
SSI, Abdominal Hysterectomy Nat’l Baseline: 2008
33 22% 9% 6% 0.94 0.86
SSI, Colon Surgery Nat’l Baseline: 2008
36 12% 23% 13% 1.13 0.92
MRSA Bacteremia Nat’l Baseline: 2011
41 2012 SIR not available
52% 56% 0.44 0.92
C. difficile Infections Nat’l Baseline: 2011
57 2012 SIR not available
14% 22% 0.78 0.90
+Not all hospitals are required to report these infections; for example, some hospitals do not use central lines or urinary catheters, or do not perform colon or abdominal hysterectomy surgeries. ‡The state’s 2012 SIR can be found in the data tables of this report. Nat’l baseline time period varies by infection type. See first column of this table for specifics.
WHAT IS THE STANDARDIZED INFECTION RATIO?
The standardized infection ratio (SIR) is a summary statistic that can be used to track HAI prevention progress over time; lower SIRs are better. The SIR for a facility or state is adjusted to account for factors that might cause infection rates to be higher or lower, such as hospital size, teaching status, the type of patients a hospital serves, and surgery and patient characteristics.
WHAT IS IOWA DOING TO PREVENT HEALTHCARE-ASSOCIATED INFECTIONS?
Prevention efforts to reduce specific HAIs:
■ Central line-associated bloodstream infections ■ Catheter-associated urinary tract infections ■ Surgical site infections ■ Multidrug-resistant infections (C. difficile) ■ Long-term care facilities ■ Healthcare personnel influenza vaccination
Learn how your hospital is performing: www.medicare.gov/hospitalcompare For additional information:
■ 2013 HAI Progress Report: www.cdc.gov/hai/progress-report/ ■ NHSN: www.cdc.gov/nhsn ■ HAIs and prevention activities in Iowa: www.idph.state.ia.us/hai_prevention/default.asp ■ Iowa validation efforts: www.cdc.gov/hai/pdfs/state-progress-landscape.pdf
THIS REPORT IS BASED ON 2013 DATA, PUBLISHED JANUARY 2015

K A N S A SHealthcare-associated infections (HAIs) are infections patients can get while receiving medical treatment in a healthcare facility. Working toward the elimination of HAIs is a CDC priority. The standardized infection ratio (SIR) is a summary statistic that can be used to track HAI prevention progress over time; lower SIRs are better. The infection data are collected through CDC’s National Healthcare Safety Network (NHSN). HAI data for nearly all U.S. hospitals are published on the Hospital Compare website.
CLABSIsCENTRAL LINE-ASSOCIATED BLOODSTREAM INFECTIONS
42% LOWER COMPARED TO NAT’L BASELINE*
*Statistically significant.
When a tube is placed in a large vein and not put in correctly or kept clean, it can become a way for germs to enter the body and cause deadly infections in the blood.
Kansas hospitals reported no significant change in CLABSIs between 2012 and 2013.
10%Among the 20 hospitals in Kansas with enough data to calculate an SIR, 10% had an SIR significantly worse than the national SIR of 0.54.
CAUTIsCATHETER-ASSOCIATED URINARY TRACT INFECTIONS
12% HIGHER COMPARED TO NAT’L BASELINE*
When a urinary catheter is not put in correctly, not kept clean, or left in a patient for too long, germs can travel through the catheter and infect the bladder and kidneys.
Kansas hospitals reported no significant change in CAUTIs between 2012 and 2013.
14% Among the 28 hospitals in Kansas with enough data to calculate an SIR, 14% had an SIR significantly worse than the national SIR of 1.06.
MRSA BacteremiaLABORATORY IDENTIFIED HOSPITAL-ONSET BLOODSTREAM INFECTIONS
52% LOWER COMPARED TO NAT’L BASELINE*
Methicillin-resistant Staphylococcus aureus (MRSA) is bacteria usually spread by contaminated hands. In a healthcare setting, such as a hospital, MRSA can cause serious bloodstream infections.
0%Among the 14 hospitals in Kansas with enough data to calculate an SIR, 0% had an SIR significantly worse than the national SIR of 0.92.
SSIsSURGICAL SITE INFECTIONS
When germs get into an area where surgery is or was performed, patients can get a surgical site infection. Sometimes these infections involve only the skin. Other SSIs can involve tissues under the skin, organs, or implanted material.
SSI: Abdominal Hysterectomy 58% LOWER COMPARED TO NAT’L BASELINE*
Kansas hospitals reported no significant change in SSIs related to abdominal hysterectomy surgery between 2012 and 2013.
Not enough data to report how many hospitals had an SIR significantly worse than the national SIR of 0.86.
SSI: Colon Surgery 38% HIGHER COMPARED TO NAT’L BASELINE*
Kansas hospitals reported a significant increase in SSIs related to colon surgery between 2012 and 2013.
Several changes to the NHSN 2013 SSI protocol likely contributed to an increase in the national and some state- specific colon surgery SIRs compared to 2012.
31%Among the 16 hospitals in Kansas with enough data to calculate an SIR, 31% had an SIR significantly worse than the national SIR of 0.92.
C. difficile InfectionsLABORATORY IDENTIFIED HOSPITAL-ONSET C. DIFFICILE INFECTIONS
8% LOWER COMPARED TO NAT’L BASELINE*
When a person takes antibiotics, good bacteria that protect against infection are destroyed for several months. During this time, patients can get sick from Clostridium difficile (C. difficile), bacteria that cause potentially deadly diarrhea, which can be spread in healthcare settings.
8%Among the 51 hospitals in Kansas with enough data to calculate an SIR, 8% had an SIR significantly worse than the national SIR of 0.90.
THIS REPORT IS BASED ON 2013 DATA, PUBLISHED JANUARY 2015
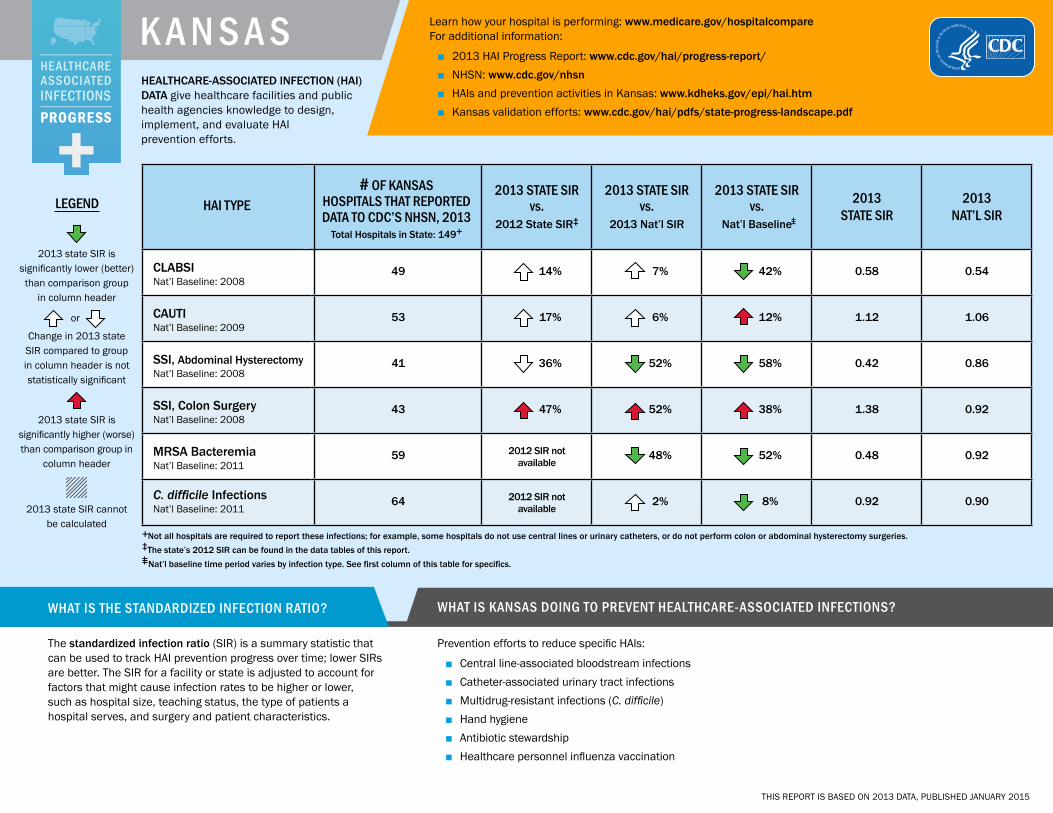
K A N S A SHEALTHCARE-ASSOCIATED INFECTION (HAI) DATA give healthcare facilities and public health agencies knowledge to design, implement, and evaluate HAI prevention efforts.
LEGEND
2013 state SIR is significantly lower (better) than comparison group
in column header
or
Change in 2013 state SIR compared to group in column header is not statistically significant
2013 state SIR is significantly higher (worse) than comparison group in
column header
2013 state SIR cannot be calculated
HAI TYPE# OF KANSAS
HOSPITALS THAT REPORTED DATA TO CDC’S NHSN, 2013
Total Hospitals in State: 149+
2013 STATE SIR vs.
2012 State SIR‡
2013 STATE SIR vs.
2013 Nat’l SIR
2013 STATE SIR vs.
Nat’l Baseline
2013 STATE SIR
2013 NAT’L SIR
CLABSI Nat’l Baseline: 2008
49 14% 7% 42% 0.58 0.54
CAUTI Nat’l Baseline: 2009
53 17% 6% 12% 1.12 1.06
SSI, Abdominal Hysterectomy Nat’l Baseline: 2008
41 36% 52% 58% 0.42 0.86
SSI, Colon Surgery Nat’l Baseline: 2008
43 47% 52% 38% 1.38 0.92
MRSA Bacteremia Nat’l Baseline: 2011
59 2012 SIR not available
48% 52% 0.48 0.92
C. difficile Infections Nat’l Baseline: 2011
64 2012 SIR not available
2% 8% 0.92 0.90
+Not all hospitals are required to report these infections; for example, some hospitals do not use central lines or urinary catheters, or do not perform colon or abdominal hysterectomy surgeries. ‡The state’s 2012 SIR can be found in the data tables of this report. Nat’l baseline time period varies by infection type. See first column of this table for specifics.
WHAT IS THE STANDARDIZED INFECTION RATIO?
The standardized infection ratio (SIR) is a summary statistic that can be used to track HAI prevention progress over time; lower SIRs are better. The SIR for a facility or state is adjusted to account for factors that might cause infection rates to be higher or lower, such as hospital size, teaching status, the type of patients a hospital serves, and surgery and patient characteristics.
WHAT IS KANSAS DOING TO PREVENT HEALTHCARE-ASSOCIATED INFECTIONS?
Prevention efforts to reduce specific HAIs:
■ Central line-associated bloodstream infections ■ Catheter-associated urinary tract infections ■ Multidrug-resistant infections (C. difficile) ■ Hand hygiene ■ Antibiotic stewardship ■ Healthcare personnel influenza vaccination
Learn how your hospital is performing: www.medicare.gov/hospitalcompare For additional information:
■ 2013 HAI Progress Report: www.cdc.gov/hai/progress-report/ ■ NHSN: www.cdc.gov/nhsn ■ HAIs and prevention activities in Kansas: www.kdheks.gov/epi/hai.htm ■ Kansas validation efforts: www.cdc.gov/hai/pdfs/state-progress-landscape.pdf
THIS REPORT IS BASED ON 2013 DATA, PUBLISHED JANUARY 2015

K E N T U C K YHealthcare-associated infections (HAIs) are infections patients can get while receiving medical treatment in a healthcare facility. Working toward the elimination of HAIs is a CDC priority. The standardized infection ratio (SIR) is a summary statistic that can be used to track HAI prevention progress over time; lower SIRs are better. The infection data are collected through CDC’s National Healthcare Safety Network (NHSN). HAI data for nearly all U.S. hospitals are published on the Hospital Compare website.
CLABSIsCENTRAL LINE-ASSOCIATED BLOODSTREAM INFECTIONS
34% LOWER COMPARED TO NAT’L BASELINE*
*Statistically significant.
When a tube is placed in a large vein and not put in correctly or kept clean, it can become a way for germs to enter the body and cause deadly infections in the blood.
Kentucky hospitals reported a significant decrease in CLABSIs between 2012 and 2013.
8%Among the 38 hospitals in Kentucky with enough data to calculate an SIR, 8% had an SIR significantly worse than the national SIR of 0.54.
CAUTIsCATHETER-ASSOCIATED URINARY TRACT INFECTIONS
21% HIGHER COMPARED TO NAT’L BASELINE*
When a urinary catheter is not put in correctly, not kept clean, or left in a patient for too long, germs can travel through the catheter and infect the bladder and kidneys.
Kentucky hospitals reported no significant change in CAUTIs between 2012 and 2013.
11% Among the 54 hospitals in Kentucky with enough data to calculate an SIR, 11% had an SIR significantly worse than the national SIR of 1.06.
MRSA BacteremiaLABORATORY IDENTIFIED HOSPITAL-ONSET BLOODSTREAM INFECTIONS
27% HIGHER COMPARED TO NAT’L BASELINE*
Methicillin-resistant Staphylococcus aureus (MRSA) is bacteria usually spread by contaminated hands. In a healthcare setting, such as a hospital, MRSA can cause serious bloodstream infections.
18%Among the 33 hospitals in Kentucky with enough data to calculate an SIR, 18% had an SIR significantly worse than the national SIR of 0.92.
SSIsSURGICAL SITE INFECTIONS
When germs get into an area where surgery is or was performed, patients can get a surgical site infection. Sometimes these infections involve only the skin. Other SSIs can involve tissues under the skin, organs, or implanted material.
SSI: Abdominal Hysterectomy 11% LOWER COMPARED TO NAT’L BASELINE
Kentucky hospitals reported no significant change in SSIs related to abdominal hysterectomy surgery between 2012 and 2013.
8%Among the 13 hospitals in Kentucky with enough data to calculate an SIR, 8% had an SIR significantly worse than the national SIR of 0.86.
SSI: Colon Surgery 24% LOWER COMPARED TO NAT’L BASELINE*
Kentucky hospitals reported no significant change in SSIs related to colon surgery between 2012 and 2013.
Several changes to the NHSN 2013 SSI protocol likely contributed to an increase in the national and some state- specific colon surgery SIRs compared to 2012.
6%Among the 36 hospitals in Kentucky with enough data to calculate an SIR, 6% had an SIR significantly worse than the national SIR of 0.92.
C. difficile InfectionsLABORATORY IDENTIFIED HOSPITAL-ONSET C. DIFFICILE INFECTIONS
3% LOWER COMPARED TO NAT’L BASELINE
When a person takes antibiotics, good bacteria that protect against infection are destroyed for several months. During this time, patients can get sick from Clostridium difficile (C. difficile), bacteria that cause potentially deadly diarrhea, which can be spread in healthcare settings.
12%Among the 69 hospitals in Kentucky with enough data to calculate an SIR, 12% had an SIR significantly worse than the national SIR of 0.90.
THIS REPORT IS BASED ON 2013 DATA, PUBLISHED JANUARY 2015

K E N T U C K YHEALTHCARE-ASSOCIATED INFECTION (HAI) DATA give healthcare facilities and public health agencies knowledge to design, implement, and evaluate HAI prevention efforts.
LEGEND
2013 state SIR is significantly lower (better) than comparison group
in column header
or
Change in 2013 state SIR compared to group in column header is not statistically significant
2013 state SIR is significantly higher (worse) than comparison group in
column header
2013 state SIR cannot be calculated
HAI TYPE# OF KENTUCKY
HOSPITALS THAT REPORTED DATA TO CDC’S NHSN, 2013
Total Hospitals in State: 116+
2013 STATE SIR vs.
2012 State SIR‡
2013 STATE SIR vs.
2013 Nat’l SIR
2013 STATE SIR vs.
Nat’l Baseline
2013 STATE SIR
2013 NAT’L SIR
CLABSI Nat’l Baseline: 2008
72 26% 24% 34% 0.67 0.54
CAUTI Nat’l Baseline: 2009
73 3% 15% 21% 1.21 1.06
SSI, Abdominal Hysterectomy Nat’l Baseline: 2008
60 12% 5% 11% 0.90 0.86
SSI, Colon Surgery Nat’l Baseline: 2008
66 4% 17% 24% 0.76 0.92
MRSA Bacteremia Nat’l Baseline: 2011
71 2012 SIR not available
40% 27% 1.27 0.92
C. difficile Infections Nat’l Baseline: 2011
71 2012 SIR not available
7% 3% 0.97 0.90
+Not all hospitals are required to report these infections; for example, some hospitals do not use central lines or urinary catheters, or do not perform colon or abdominal hysterectomy surgeries. ‡The state’s 2012 SIR can be found in the data tables of this report. Nat’l baseline time period varies by infection type. See first column of this table for specifics.
WHAT IS THE STANDARDIZED INFECTION RATIO?
The standardized infection ratio (SIR) is a summary statistic that can be used to track HAI prevention progress over time; lower SIRs are better. The SIR for a facility or state is adjusted to account for factors that might cause infection rates to be higher or lower, such as hospital size, teaching status, the type of patients a hospital serves, and surgery and patient characteristics.
WHAT IS KENTUCKY DOING TO PREVENT HEALTHCARE-ASSOCIATED INFECTIONS?
Prevention efforts to reduce specific HAIs:
■ Central line-associated bloodstream infections ■ Catheter-associated urinary tract infections ■ Surgical site infections ■ Multidrug-resistant infections (MRSA, C. difficile, CRE, and others) ■ Long-term care facilities
Learn how your hospital is performing: www.medicare.gov/hospitalcompare For additional information:
■ 2013 HAI Progress Report: www.cdc.gov/hai/progress-report/ ■ NHSN: www.cdc.gov/nhsn ■ HAIs and prevention activities in Kentucky: chfs.ky.gov/dph/epi/hai ■ Kentucky validation efforts: www.cdc.gov/hai/pdfs/state-progress-landscape.pdf
THIS REPORT IS BASED ON 2013 DATA, PUBLISHED JANUARY 2015

L O U I S I A N AHealthcare-associated infections (HAIs) are infections patients can get while receiving medical treatment in a healthcare facility. Working toward the elimination of HAIs is a CDC priority. The standardized infection ratio (SIR) is a summary statistic that can be used to track HAI prevention progress over time; lower SIRs are better. The infection data are collected through CDC’s National Healthcare Safety Network (NHSN). HAI data for nearly all U.S. hospitals are published on the Hospital Compare website.
CLABSIsCENTRAL LINE-ASSOCIATED BLOODSTREAM INFECTIONS
31% LOWER COMPARED TO NAT’L BASELINE*
*Statistically significant.
When a tube is placed in a large vein and not put in correctly or kept clean, it can become a way for germs to enter the body and cause deadly infections in the blood.
Louisiana hospitals reported no significant change in CLABSIs between 2012 and 2013.
15%Among the 47 hospitals in Louisiana with enough data to calculate an SIR, 15% had an SIR significantly worse than the national SIR of 0.54.
CAUTIsCATHETER-ASSOCIATED URINARY TRACT INFECTIONS
19% LOWER COMPARED TO NAT’L BASELINE*
When a urinary catheter is not put in correctly, not kept clean, or left in a patient for too long, germs can travel through the catheter and infect the bladder and kidneys.
Louisiana hospitals reported no significant change in CAUTIs between 2012 and 2013.
8% Among the 60 hospitals in Louisiana with enough data to calculate an SIR, 8% had an SIR significantly worse than the national SIR of 1.06.
MRSA BacteremiaLABORATORY IDENTIFIED HOSPITAL-ONSET BLOODSTREAM INFECTIONS
22% HIGHER COMPARED TO NAT’L BASELINE*
Methicillin-resistant Staphylococcus aureus (MRSA) is bacteria usually spread by contaminated hands. In a healthcare setting, such as a hospital, MRSA can cause serious bloodstream infections.
17%Among the 35 hospitals in Louisiana with enough data to calculate an SIR, 17% had an SIR significantly worse than the national SIR of 0.92.
SSIsSURGICAL SITE INFECTIONS
When germs get into an area where surgery is or was performed, patients can get a surgical site infection. Sometimes these infections involve only the skin. Other SSIs can involve tissues under the skin, organs, or implanted material.
SSI: Abdominal Hysterectomy 12% LOWER COMPARED TO NAT’L BASELINE
Louisiana hospitals reported no significant change in SSIs related to abdominal hysterectomy surgery between 2012 and 2013.
8%Among the 12 hospitals in Louisiana with enough data to calculate an SIR, 8% had an SIR significantly worse than the national SIR of 0.86.
SSI: Colon Surgery 9% HIGHER COMPARED TO NAT’L BASELINE
Louisiana hospitals reported no significant change in SSIs related to colon surgery between 2012 and 2013.
Several changes to the NHSN 2013 SSI protocol likely contributed to an increase in the national and some state- specific colon surgery SIRs compared to 2012.
6%Among the 33 hospitals in Louisiana with enough data to calculate an SIR, 6% had an SIR significantly worse than the national SIR of 0.92.
C. difficile InfectionsLABORATORY IDENTIFIED HOSPITAL-ONSET C. DIFFICILE INFECTIONS
37% LOWER COMPARED TO NAT’L BASELINE*
When a person takes antibiotics, good bacteria that protect against infection are destroyed for several months. During this time, patients can get sick from Clostridium difficile (C. difficile), bacteria that cause potentially deadly diarrhea, which can be spread in healthcare settings.
4%Among the 83 hospitals in Louisiana with enough data to calculate an SIR, 4% had an SIR significantly worse than the national SIR of 0.90.
THIS REPORT IS BASED ON 2013 DATA, PUBLISHED JANUARY 2015

L O U I S I A N AHEALTHCARE-ASSOCIATED INFECTION (HAI) DATA give healthcare facilities and public health agencies knowledge to design, implement, and evaluate HAI prevention efforts.
LEGEND
2013 state SIR is significantly lower (better) than comparison group
in column header
or
Change in 2013 state SIR compared to group in column header is not statistically significant
2013 state SIR is significantly higher (worse) than comparison group in
column header
2013 state SIR cannot be calculated
HAI TYPE# OF LOUISIANA
HOSPITALS THAT REPORTED DATA TO CDC’S NHSN, 2013
Total Hospitals in State: 172+
2013 STATE SIR vs.
2012 State SIR‡
2013 STATE SIR vs.
2013 Nat’l SIR
2013 STATE SIR vs.
Nat’l Baseline
2013 STATE SIR
2013 NAT’L SIR
CLABSI Nat’l Baseline: 2008
79 < 1% 28% 31% 0.69 0.54
CAUTI Nat’l Baseline: 2009
81 1% 24% 19% 0.81 1.06
SSI, Abdominal Hysterectomy Nat’l Baseline: 2008
79 20% 2% 12% 0.88 0.86
SSI, Colon Surgery Nat’l Baseline: 2008
78 10% 18% 9% 1.09 0.92
MRSA Bacteremia Nat’l Baseline: 2011
101 2012 SIR not available
34% 22% 1.22 0.92
C. difficile Infections Nat’l Baseline: 2011
101 2012 SIR not available
31% 37% 0.63 0.90
+Not all hospitals are required to report these infections; for example, some hospitals do not use central lines or urinary catheters, or do not perform colon or abdominal hysterectomy surgeries. ‡The state’s 2012 SIR can be found in the data tables of this report. Nat’l baseline time period varies by infection type. See first column of this table for specifics.
WHAT IS THE STANDARDIZED INFECTION RATIO?
The standardized infection ratio (SIR) is a summary statistic that can be used to track HAI prevention progress over time; lower SIRs are better. The SIR for a facility or state is adjusted to account for factors that might cause infection rates to be higher or lower, such as hospital size, teaching status, the type of patients a hospital serves, and surgery and patient characteristics.
WHAT IS LOUISIANA DOING TO PREVENT HEALTHCARE-ASSOCIATED INFECTIONS?
Prevention efforts to reduce specific HAIs:
■ Central line-associated bloodstream infections ■ Catheter-associated urinary tract infections
Learn how your hospital is performing: www.medicare.gov/hospitalcompare For additional information:
■ 2013 HAI Progress Report: www.cdc.gov/hai/progress-report/ ■ NHSN: www.cdc.gov/nhsn ■ HAIs and prevention activities in Louisiana: new.dhh.louisiana.gov/index.cfm/page/824 ■ Louisiana validation efforts: www.cdc.gov/hai/pdfs/state-progress-landscape.pdf
THIS REPORT IS BASED ON 2013 DATA, PUBLISHED JANUARY 2015

M A I N EHealthcare-associated infections (HAIs) are infections patients can get while receiving medical treatment in a healthcare facility. Working toward the elimination of HAIs is a CDC priority. The standardized infection ratio (SIR) is a summary statistic that can be used to track HAI prevention progress over time; lower SIRs are better. The infection data are collected through CDC’s National Healthcare Safety Network (NHSN). HAI data for nearly all U.S. hospitals are published on the Hospital Compare website.
CLABSIsCENTRAL LINE-ASSOCIATED BLOODSTREAM INFECTIONS
34% LOWER COMPARED TO NAT’L BASELINE*
*Statistically significant.
When a tube is placed in a large vein and not put in correctly or kept clean, it can become a way for germs to enter the body and cause deadly infections in the blood.
Maine hospitals reported a significant decrease in CLABSIs between 2012 and 2013.
Not enough data to report how many hospitals had an SIR significantly worse than the national SIR of 0.54.
CAUTIsCATHETER-ASSOCIATED URINARY TRACT INFECTIONS
72% HIGHER COMPARED TO NAT’L BASELINE*
When a urinary catheter is not put in correctly, not kept clean, or left in a patient for too long, germs can travel through the catheter and infect the bladder and kidneys.
Maine hospitals reported no significant change in CAUTIs between 2012 and 2013.
23% Among the 13 hospitals in Maine with enough data to calculate an SIR, 23% had an SIR significantly worse than the national SIR of 1.06.
MRSA BacteremiaLABORATORY IDENTIFIED HOSPITAL-ONSET BLOODSTREAM INFECTIONS
28% LOWER COMPARED TO NAT’L BASELINE
Methicillin-resistant Staphylococcus aureus (MRSA) is bacteria usually spread by contaminated hands. In a healthcare setting, such as a hospital, MRSA can cause serious bloodstream infections.
Not enough data to report how many hospitals had an SIR significantly worse than the national SIR of 0.92.
SSIsSURGICAL SITE INFECTIONS
When germs get into an area where surgery is or was performed, patients can get a surgical site infection. Sometimes these infections involve only the skin. Other SSIs can involve tissues under the skin, organs, or implanted material.
SSI: Abdominal Hysterectomy 13% LOWER COMPARED TO NAT’L BASELINE
Maine hospitals reported no significant change in SSIs related to abdominal hysterectomy surgery between 2012 and 2013.
Not enough data to report how many hospitals had an SIR significantly worse than the national SIR of 0.86.
SSI: Colon Surgery 20% HIGHER COMPARED TO NAT’L BASELINE
Maine hospitals reported no significant change in SSIs related to colon surgery between 2012 and 2013.
Several changes to the NHSN 2013 SSI protocol likely contributed to an increase in the national and some state- specific colon surgery SIRs compared to 2012.
10%Among the 10 hospitals in Maine with enough data to calculate an SIR, 10% had an SIR significantly worse than the national SIR of 0.92.
C. difficile InfectionsLABORATORY IDENTIFIED HOSPITAL-ONSET C. DIFFICILE INFECTIONS
47% LOWER COMPARED TO NAT’L BASELINE*
When a person takes antibiotics, good bacteria that protect against infection are destroyed for several months. During this time, patients can get sick from Clostridium difficile (C. difficile), bacteria that cause potentially deadly diarrhea, which can be spread in healthcare settings.
0%Among the 36 hospitals in Maine with enough data to calculate an SIR, 0% had an SIR significantly worse than the national SIR of 0.90.
THIS REPORT IS BASED ON 2013 DATA, PUBLISHED JANUARY 2015

M A I N EHEALTHCARE-ASSOCIATED INFECTION (HAI) DATA give healthcare facilities and public health agencies knowledge to design, implement, and evaluate HAI prevention efforts.
LEGEND
2013 state SIR is significantly lower (better) than comparison group
in column header
or
Change in 2013 state SIR compared to group in column header is not statistically significant
2013 state SIR is significantly higher (worse) than comparison group in
column header
2013 state SIR cannot be calculated
HAI TYPE# OF MAINE
HOSPITALS THAT REPORTED DATA TO CDC’S NHSN, 2013
Total Hospitals in State: 41+
2013 STATE SIR vs.
2012 State SIR‡
2013 STATE SIR vs.
2013 Nat’l SIR
2013 STATE SIR vs.
Nat’l Baseline
2013 STATE SIR
2013 NAT’L SIR
CLABSI Nat’l Baseline: 2008
21 30% 24% 34% 0.66 0.54
CAUTI Nat’l Baseline: 2009
21 10% 63% 72% 1.72 1.06
SSI, Abdominal Hysterectomy Nat’l Baseline: 2008
19 15% 1% 13% 0.87 0.86
SSI, Colon Surgery Nat’l Baseline: 2008
21 9% 30% 20% 1.20 0.92
MRSA Bacteremia Nat’l Baseline: 2011
25 2012 SIR not available
22% 28% 0.72 0.92
C. difficile Infections Nat’l Baseline: 2011
36 2012 SIR not available
41% 47% 0.53 0.90
+Not all hospitals are required to report these infections; for example, some hospitals do not use central lines or urinary catheters, or do not perform colon or abdominal hysterectomy surgeries. ‡The state’s 2012 SIR can be found in the data tables of this report. Nat’l baseline time period varies by infection type. See first column of this table for specifics.
WHAT IS THE STANDARDIZED INFECTION RATIO?
The standardized infection ratio (SIR) is a summary statistic that can be used to track HAI prevention progress over time; lower SIRs are better. The SIR for a facility or state is adjusted to account for factors that might cause infection rates to be higher or lower, such as hospital size, teaching status, the type of patients a hospital serves, and surgery and patient characteristics.
WHAT IS MAINE DOING TO PREVENT HEALTHCARE-ASSOCIATED INFECTIONS?
Maine has a state mandate to publicly report at least one HAI to NHSN.
Prevention efforts to reduce specific HAIs:
■ Multidrug-resistant infections (C. difficile, CRE) ■ Long-term care facilities ■ Hand hygiene ■ Antibiotic stewardship
Learn how your hospital is performing: www.medicare.gov/hospitalcompare For additional information:
■ 2013 HAI Progress Report: www.cdc.gov/hai/progress-report/ ■ NHSN: www.cdc.gov/nhsn ■ HAIs and prevention activities in Maine: www.maine.gov/dhhs/boh/ddc/hai/index.shtml ■ Maine validation efforts: www.cdc.gov/hai/pdfs/state-progress-landscape.pdf
THIS REPORT IS BASED ON 2013 DATA, PUBLISHED JANUARY 2015

M A R Y L A N DHealthcare-associated infections (HAIs) are infections patients can get while receiving medical treatment in a healthcare facility. Working toward the elimination of HAIs is a CDC priority. The standardized infection ratio (SIR) is a summary statistic that can be used to track HAI prevention progress over time; lower SIRs are better. The infection data are collected through CDC’s National Healthcare Safety Network (NHSN). HAI data for nearly all U.S. hospitals are published on the Hospital Compare website.
CLABSIsCENTRAL LINE-ASSOCIATED BLOODSTREAM INFECTIONS
49% LOWER COMPARED TO NAT’L BASELINE*
*Statistically significant.
When a tube is placed in a large vein and not put in correctly or kept clean, it can become a way for germs to enter the body and cause deadly infections in the blood.
Maryland hospitals reported no significant change in CLABSIs between 2012 and 2013.
5%Among the 39 hospitals in Maryland with enough data to calculate an SIR, 5% had an SIR significantly worse than the national SIR of 0.54.
CAUTIsCATHETER-ASSOCIATED URINARY TRACT INFECTIONS
38% HIGHER COMPARED TO NAT’L BASELINE*
When a urinary catheter is not put in correctly, not kept clean, or left in a patient for too long, germs can travel through the catheter and infect the bladder and kidneys.
Maryland hospitals reported a significant decrease in CAUTIs between 2012 and 2013.
19% Among the 36 hospitals in Maryland with enough data to calculate an SIR, 19% had an SIR significantly worse than the national SIR of 1.06.
MRSA BacteremiaLABORATORY IDENTIFIED HOSPITAL-ONSET BLOODSTREAM INFECTIONS
18% LOWER COMPARED TO NAT’L BASELINE
Methicillin-resistant Staphylococcus aureus (MRSA) is bacteria usually spread by contaminated hands. In a healthcare setting, such as a hospital, MRSA can cause serious bloodstream infections.
0%Among the 10 hospitals in Maryland with enough data to calculate an SIR, 0% had an SIR significantly worse than the national SIR of 0.92.
SSIsSURGICAL SITE INFECTIONS
When germs get into an area where surgery is or was performed, patients can get a surgical site infection. Sometimes these infections involve only the skin. Other SSIs can involve tissues under the skin, organs, or implanted material.
SSI: Abdominal Hysterectomy 29% HIGHER COMPARED TO NAT’L BASELINE
Maryland hospitals reported no significant change in SSIs related to abdominal hysterectomy surgery between 2012 and 2013.
Not enough data to report how many hospitals had an SIR significantly worse than the national SIR of 0.86.
SSI: Colon Surgery 15% LOWER COMPARED TO NAT’L BASELINE
Maryland hospitals reported no significant change in SSIs related to colon surgery between 2012 and 2013.
Several changes to the NHSN 2013 SSI protocol likely contributed to an increase in the national and some state- specific colon surgery SIRs compared to 2012.
13%Among the 15 hospitals in Maryland with enough data to calculate an SIR, 13% had an SIR significantly worse than the national SIR of 0.92.
C. difficile InfectionsLABORATORY IDENTIFIED HOSPITAL-ONSET C. DIFFICILE INFECTIONS
16% HIGHER COMPARED TO NAT’L BASELINE*
When a person takes antibiotics, good bacteria that protect against infection are destroyed for several months. During this time, patients can get sick from Clostridium difficile (C. difficile), bacteria that cause potentially deadly diarrhea, which can be spread in healthcare settings.
39%Among the 44 hospitals in Maryland with enough data to calculate an SIR, 39% had an SIR significantly worse than the national SIR of 0.90.
THIS REPORT IS BASED ON 2013 DATA, PUBLISHED JANUARY 2015

M A R Y L A N DHEALTHCARE-ASSOCIATED INFECTION (HAI) DATA give healthcare facilities and public health agencies knowledge to design, implement, and evaluate HAI prevention efforts.
LEGEND
2013 state SIR is significantly lower (better) than comparison group
in column header
or
Change in 2013 state SIR compared to group in column header is not statistically significant
2013 state SIR is significantly higher (worse) than comparison group in
column header
2013 state SIR cannot be calculated
HAI TYPE# OF MARYLAND
HOSPITALS THAT REPORTED DATA TO CDC’S NHSN, 2013
Total Hospitals in State: 59+
2013 STATE SIR vs.
2012 State SIR‡
2013 STATE SIR vs.
2013 Nat’l SIR
2013 STATE SIR vs.
Nat’l Baseline
2013 STATE SIR
2013 NAT’L SIR
CLABSI Nat’l Baseline: 2008
47 6% 4% 49% 0.51 0.54
CAUTI Nat’l Baseline: 2009
39 26% 31% 38% 1.38 1.06
SSI, Abdominal Hysterectomy Nat’l Baseline: 2008
12 40% 50% 29% 1.29 0.86
SSI, Colon Surgery Nat’l Baseline: 2008
22 2% 8% 15% 0.85 0.92
MRSA Bacteremia Nat’l Baseline: 2011
13 2012 SIR not available
10% 18% 0.82 0.92
C. difficile Infections Nat’l Baseline: 2011
46 2012 SIR not available
28% 16% 1.16 0.90
+Not all hospitals are required to report these infections; for example, some hospitals do not use central lines or urinary catheters, or do not perform colon or abdominal hysterectomy surgeries. ‡The state’s 2012 SIR can be found in the data tables of this report. Nat’l baseline time period varies by infection type. See first column of this table for specifics.
WHAT IS THE STANDARDIZED INFECTION RATIO?
The standardized infection ratio (SIR) is a summary statistic that can be used to track HAI prevention progress over time; lower SIRs are better. The SIR for a facility or state is adjusted to account for factors that might cause infection rates to be higher or lower, such as hospital size, teaching status, the type of patients a hospital serves, and surgery and patient characteristics.
WHAT IS MARYLAND DOING TO PREVENT HEALTHCARE-ASSOCIATED INFECTIONS?
Maryland has a state mandate to publicly report at least one HAI to NHSN. Maryland is one of 10 state health departments participating in CDC’s Emerging Infections Program, which allows for extra surveillance and research of HAIs.
Prevention efforts to reduce specific HAIs:
■ Central line-associated bloodstream infections ■ Catheter-associated urinary tract infections
■ Multidrug-resistant infections (C. difficile, CRE, and others)
■ Long-term care facilities ■ Hand hygiene ■ Antibiotic stewardship
Learn how your hospital is performing: www.medicare.gov/hospitalcompare For additional information:
■ 2013 HAI Progress Report: www.cdc.gov/hai/progress-report/ ■ NHSN: www.cdc.gov/nhsn ■ HAIs and prevention activities in Maryland: www.marylandqmdc.org/ ■ Maryland validation efforts: www.cdc.gov/hai/pdfs/state-progress-landscape.pdf
THIS REPORT IS BASED ON 2013 DATA, PUBLISHED JANUARY 2015

M A S S A C H U S E T T SHealthcare-associated infections (HAIs) are infections patients can get while receiving medical treatment in a healthcare facility. Working toward the elimination of HAIs is a CDC priority. The standardized infection ratio (SIR) is a summary statistic that can be used to track HAI prevention progress over time; lower SIRs are better. The infection data are collected through CDC’s National Healthcare Safety Network (NHSN). HAI data for nearly all U.S. hospitals are published on the Hospital Compare website.
CLABSIsCENTRAL LINE-ASSOCIATED BLOODSTREAM INFECTIONS
49% LOWER COMPARED TO NAT’L BASELINE*
*Statistically significant.
When a tube is placed in a large vein and not put in correctly or kept clean, it can become a way for germs to enter the body and cause deadly infections in the blood.
Massachusetts hospitals reported no significant change in CLABSIs between 2012 and 2013.
2%Among the 48 hospitals in Massachusetts with enough data to calculate an SIR, 2% had an SIR significantly worse than the national SIR of 0.54.
CAUTIsCATHETER-ASSOCIATED URINARY TRACT INFECTIONS
58% HIGHER COMPARED TO NAT’L BASELINE*
When a urinary catheter is not put in correctly, not kept clean, or left in a patient for too long, germs can travel through the catheter and infect the bladder and kidneys.
Massachusetts hospitals reported no significant change in CAUTIs between 2012 and 2013.
20% Among the 55 hospitals in Massachusetts with enough data to calculate an SIR, 20% had an SIR significantly worse than the national SIR of 1.06.
MRSA BacteremiaLABORATORY IDENTIFIED HOSPITAL-ONSET BLOODSTREAM INFECTIONS
40% LOWER COMPARED TO NAT’L BASELINE*
Methicillin-resistant Staphylococcus aureus (MRSA) is bacteria usually spread by contaminated hands. In a healthcare setting, such as a hospital, MRSA can cause serious bloodstream infections.
2%Among the 50 hospitals in Massachusetts with enough data to calculate an SIR, 2% had an SIR significantly worse than the national SIR of 0.92.
SSIsSURGICAL SITE INFECTIONS
When germs get into an area where surgery is or was performed, patients can get a surgical site infection. Sometimes these infections involve only the skin. Other SSIs can involve tissues under the skin, organs, or implanted material.
SSI: Abdominal Hysterectomy 11% HIGHER COMPARED TO NAT’L BASELINE
Massachusetts hospitals reported no significant change in SSIs related to abdominal hysterectomy surgery between 2012 and 2013.
18%Among the 11 hospitals in Massachusetts with enough data to calculate an SIR, 18% had an SIR significantly worse than the national SIR of 0.86.
SSI: Colon Surgery 22% HIGHER COMPARED TO NAT’L BASELINE*
Massachusetts hospitals reported a significant increase in SSIs related to colon surgery between 2012 and 2013.
Several changes to the NHSN 2013 SSI protocol likely contributed to an increase in the national and some state- specific colon surgery SIRs compared to 2012.
19%Among the 42 hospitals in Massachusetts with enough data to calculate an SIR, 19% had an SIR significantly worse than the national SIR of 0.92.
C. difficile InfectionsLABORATORY IDENTIFIED HOSPITAL-ONSET C. DIFFICILE INFECTIONS
1% HIGHER COMPARED TO NAT’L BASELINE
When a person takes antibiotics, good bacteria that protect against infection are destroyed for several months. During this time, patients can get sick from Clostridium difficile (C. difficile), bacteria that cause potentially deadly diarrhea, which can be spread in healthcare settings.
25%Among the 68 hospitals in Massachusetts with enough data to calculate an SIR, 25% had an SIR significantly worse than the national SIR of 0.90.
THIS REPORT IS BASED ON 2013 DATA, PUBLISHED JANUARY 2015

M A S S A C H U S E T T SHEALTHCARE-ASSOCIATED INFECTION (HAI) DATA give healthcare facilities and public health agencies knowledge to design, implement, and evaluate HAI prevention efforts.
LEGEND
2013 state SIR is significantly lower (better) than comparison group
in column header
or
Change in 2013 state SIR compared to group in column header is not statistically significant
2013 state SIR is significantly higher (worse) than comparison group in
column header
2013 state SIR cannot be calculated
HAI TYPE# OF MASSACHUSETTS
HOSPITALS THAT REPORTED DATA TO CDC’S NHSN, 2013
Total Hospitals in State: 95+
2013 STATE SIR vs.
2012 State SIR‡
2013 STATE SIR vs.
2013 Nat’l SIR
2013 STATE SIR vs.
Nat’l Baseline
2013 STATE SIR
2013 NAT’L SIR
CLABSI Nat’l Baseline: 2008
69 4% 5% 49% 0.51 0.54
CAUTI Nat’l Baseline: 2009
69 9% 51% 58% 1.58 1.06
SSI, Abdominal Hysterectomy Nat’l Baseline: 2008
57 45% 29% 11% 1.11 0.86
SSI, Colon Surgery Nat’l Baseline: 2008
62 49% 34% 22% 1.22 0.92
MRSA Bacteremia Nat’l Baseline: 2011
71 2012 SIR not available
35% 40% 0.60 0.92
C. difficile Infections Nat’l Baseline: 2011
71 2012 SIR not available
12% 1% 1.01 0.90
+Not all hospitals are required to report these infections; for example, some hospitals do not use central lines or urinary catheters, or do not perform colon or abdominal hysterectomy surgeries. ‡The state’s 2012 SIR can be found in the data tables of this report. Nat’l baseline time period varies by infection type. See first column of this table for specifics.
WHAT IS THE STANDARDIZED INFECTION RATIO?
The standardized infection ratio (SIR) is a summary statistic that can be used to track HAI prevention progress over time; lower SIRs are better. The SIR for a facility or state is adjusted to account for factors that might cause infection rates to be higher or lower, such as hospital size, teaching status, the type of patients a hospital serves, and surgery and patient characteristics.
WHAT IS MASSACHUSETTS DOING TO PREVENT HEALTHCARE-ASSOCIATED INFECTIONS?
Massachusetts has a state mandate to publicly report at least one HAI to NHSN.
Prevention efforts to reduce specific HAIs:
■ Central line-associated bloodstream infections ■ Catheter-associated urinary tract infections ■ Surgical site infections ■ Multidrug-resistant infections (MRSA, C. difficile)
■ Long-term care facilities ■ Hand hygiene ■ Antibiotic stewardship ■ Healthcare personnel influenza vaccination
Learn how your hospital is performing: www.medicare.gov/hospitalcompare For additional information:
■ 2013 HAI Progress Report: www.cdc.gov/hai/progress-report/ ■ NHSN: www.cdc.gov/nhsn ■ HAIs and prevention activities in Massachusetts: www.mass.gov/eohhs/gov/departments/dph/programs/hcq/
healthcare-quality/health-care-facilities/hospitals/ ■ Massachusetts validation efforts: www.cdc.gov/hai/pdfs/state-progress-landscape.pdf
THIS REPORT IS BASED ON 2013 DATA, PUBLISHED JANUARY 2015
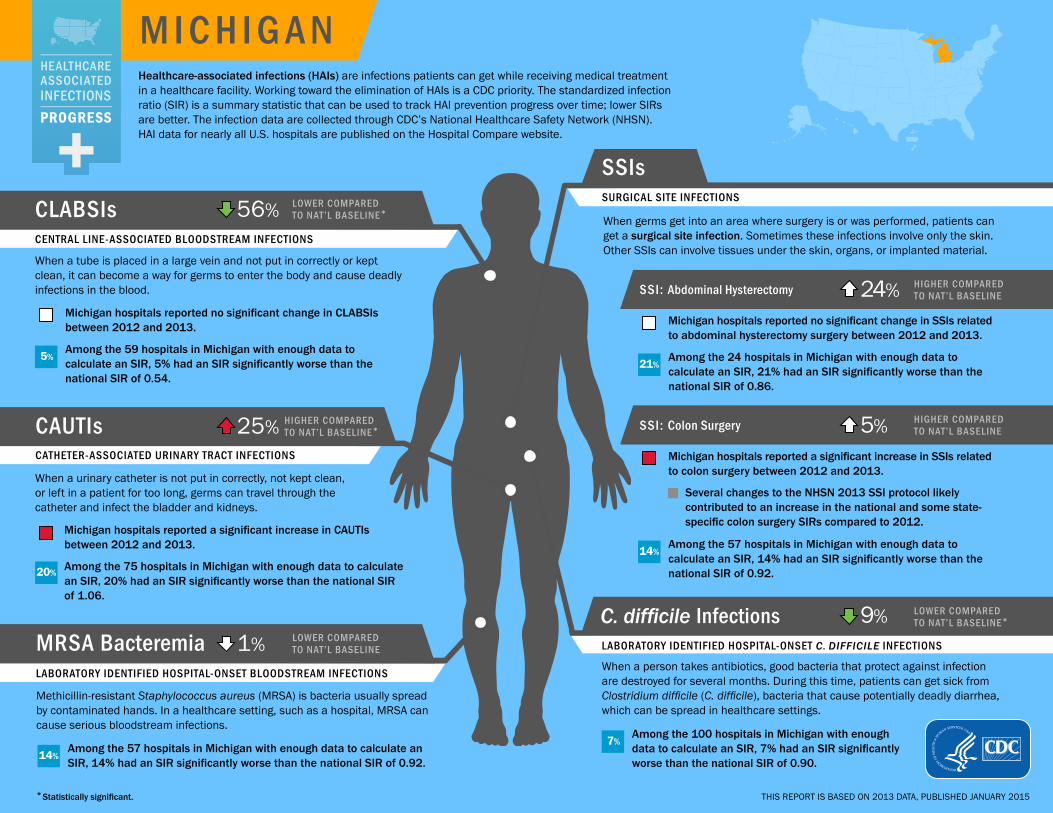
M I C H I G A NHealthcare-associated infections (HAIs) are infections patients can get while receiving medical treatment in a healthcare facility. Working toward the elimination of HAIs is a CDC priority. The standardized infection ratio (SIR) is a summary statistic that can be used to track HAI prevention progress over time; lower SIRs are better. The infection data are collected through CDC’s National Healthcare Safety Network (NHSN). HAI data for nearly all U.S. hospitals are published on the Hospital Compare website.
CLABSIsCENTRAL LINE-ASSOCIATED BLOODSTREAM INFECTIONS
56% LOWER COMPARED TO NAT’L BASELINE*
*Statistically significant.
When a tube is placed in a large vein and not put in correctly or kept clean, it can become a way for germs to enter the body and cause deadly infections in the blood.
Michigan hospitals reported no significant change in CLABSIs between 2012 and 2013.
5%Among the 59 hospitals in Michigan with enough data to calculate an SIR, 5% had an SIR significantly worse than the national SIR of 0.54.
CAUTIsCATHETER-ASSOCIATED URINARY TRACT INFECTIONS
25% HIGHER COMPARED TO NAT’L BASELINE*
When a urinary catheter is not put in correctly, not kept clean, or left in a patient for too long, germs can travel through the catheter and infect the bladder and kidneys.
Michigan hospitals reported a significant increase in CAUTIs between 2012 and 2013.
20% Among the 75 hospitals in Michigan with enough data to calculate an SIR, 20% had an SIR significantly worse than the national SIR of 1.06.
MRSA BacteremiaLABORATORY IDENTIFIED HOSPITAL-ONSET BLOODSTREAM INFECTIONS
1% LOWER COMPARED TO NAT’L BASELINE
Methicillin-resistant Staphylococcus aureus (MRSA) is bacteria usually spread by contaminated hands. In a healthcare setting, such as a hospital, MRSA can cause serious bloodstream infections.
14%Among the 57 hospitals in Michigan with enough data to calculate an SIR, 14% had an SIR significantly worse than the national SIR of 0.92.
SSIsSURGICAL SITE INFECTIONS
When germs get into an area where surgery is or was performed, patients can get a surgical site infection. Sometimes these infections involve only the skin. Other SSIs can involve tissues under the skin, organs, or implanted material.
SSI: Abdominal Hysterectomy 24% HIGHER COMPARED TO NAT’L BASELINE
Michigan hospitals reported no significant change in SSIs related to abdominal hysterectomy surgery between 2012 and 2013.
21%Among the 24 hospitals in Michigan with enough data to calculate an SIR, 21% had an SIR significantly worse than the national SIR of 0.86.
SSI: Colon Surgery 5% HIGHER COMPARED TO NAT’L BASELINE
Michigan hospitals reported a significant increase in SSIs related to colon surgery between 2012 and 2013.
Several changes to the NHSN 2013 SSI protocol likely contributed to an increase in the national and some state- specific colon surgery SIRs compared to 2012.
14%Among the 57 hospitals in Michigan with enough data to calculate an SIR, 14% had an SIR significantly worse than the national SIR of 0.92.
C. difficile InfectionsLABORATORY IDENTIFIED HOSPITAL-ONSET C. DIFFICILE INFECTIONS
9% LOWER COMPARED TO NAT’L BASELINE*
When a person takes antibiotics, good bacteria that protect against infection are destroyed for several months. During this time, patients can get sick from Clostridium difficile (C. difficile), bacteria that cause potentially deadly diarrhea, which can be spread in healthcare settings.
7%Among the 100 hospitals in Michigan with enough data to calculate an SIR, 7% had an SIR significantly worse than the national SIR of 0.90.
THIS REPORT IS BASED ON 2013 DATA, PUBLISHED JANUARY 2015

M I C H I G A NHEALTHCARE-ASSOCIATED INFECTION (HAI) DATA give healthcare facilities and public health agencies knowledge to design, implement, and evaluate HAI prevention efforts.
LEGEND
2013 state SIR is significantly lower (better) than comparison group
in column header
or
Change in 2013 state SIR compared to group in column header is not statistically significant
2013 state SIR is significantly higher (worse) than comparison group in
column header
2013 state SIR cannot be calculated
HAI TYPE# OF MICHIGAN
HOSPITALS THAT REPORTED DATA TO CDC’S NHSN, 2013
Total Hospitals in State: 157+
2013 STATE SIR vs.
2012 State SIR‡
2013 STATE SIR vs.
2013 Nat’l SIR
2013 STATE SIR vs.
Nat’l Baseline
2013 STATE SIR
2013 NAT’L SIR
CLABSI Nat’l Baseline: 2008
97 3% 19% 56% 0.44 0.54
CAUTI Nat’l Baseline: 2009
98 25% 19% 25% 1.25 1.06
SSI, Abdominal Hysterectomy Nat’l Baseline: 2008
88 15% 46% 24% 1.24 0.86
SSI, Colon Surgery Nat’l Baseline: 2008
92 21% 15% 5% 1.05 0.92
MRSA Bacteremia Nat’l Baseline: 2011
104 2012 SIR not available
8% 1% 0.99 0.92
C. difficile Infections Nat’l Baseline: 2011
104 2012 SIR not available
1% 9% 0.91 0.90
+Not all hospitals are required to report these infections; for example, some hospitals do not use central lines or urinary catheters, or do not perform colon or abdominal hysterectomy surgeries. ‡The state’s 2012 SIR can be found in the data tables of this report. Nat’l baseline time period varies by infection type. See first column of this table for specifics.
WHAT IS THE STANDARDIZED INFECTION RATIO?
The standardized infection ratio (SIR) is a summary statistic that can be used to track HAI prevention progress over time; lower SIRs are better. The SIR for a facility or state is adjusted to account for factors that might cause infection rates to be higher or lower, such as hospital size, teaching status, the type of patients a hospital serves, and surgery and patient characteristics.
WHAT IS MICHIGAN DOING TO PREVENT HEALTHCARE-ASSOCIATED INFECTIONS?
Prevention efforts to reduce specific HAIs:
■ Central line-associated bloodstream infections ■ Catheter-associated urinary tract infections ■ Surgical site infections ■ Multidrug-resistant infections (MRSA, C. difficile, CRE) ■ Long-term care facilities ■ Hand hygiene ■ Antibiotic stewardship
Learn how your hospital is performing: www.medicare.gov/hospitalcompare For additional information:
■ 2013 HAI Progress Report: www.cdc.gov/hai/progress-report/ ■ NHSN: www.cdc.gov/nhsn ■ HAIs and prevention activities in Michigan: www.michigan.gov/mdch/0,4612,7-132-2945_5104_55205---,00.html ■ Michigan validation efforts: www.cdc.gov/hai/pdfs/state-progress-landscape.pdf
THIS REPORT IS BASED ON 2013 DATA, PUBLISHED JANUARY 2015

M I N N E S O TAHealthcare-associated infections (HAIs) are infections patients can get while receiving medical treatment in a healthcare facility. Working toward the elimination of HAIs is a CDC priority. The standardized infection ratio (SIR) is a summary statistic that can be used to track HAI prevention progress over time; lower SIRs are better. The infection data are collected through CDC’s National Healthcare Safety Network (NHSN). HAI data for nearly all U.S. hospitals are published on the Hospital Compare website.
CLABSIsCENTRAL LINE-ASSOCIATED BLOODSTREAM INFECTIONS
56% LOWER COMPARED TO NAT’L BASELINE*
*Statistically significant.
When a tube is placed in a large vein and not put in correctly or kept clean, it can become a way for germs to enter the body and cause deadly infections in the blood.
Minnesota hospitals reported no significant change in CLABSIs between 2012 and 2013.
0%Among the 19 hospitals in Minnesota with enough data to calculate an SIR, 0% had an SIR significantly worse than the national SIR of 0.54.
CAUTIsCATHETER-ASSOCIATED URINARY TRACT INFECTIONS
26% HIGHER COMPARED TO NAT’L BASELINE*
When a urinary catheter is not put in correctly, not kept clean, or left in a patient for too long, germs can travel through the catheter and infect the bladder and kidneys.
Minnesota hospitals reported a significant decrease in CAUTIs between 2012 and 2013.
19% Among the 26 hospitals in Minnesota with enough data to calculate an SIR, 19% had an SIR significantly worse than the national SIR of 1.06.
MRSA BacteremiaLABORATORY IDENTIFIED HOSPITAL-ONSET BLOODSTREAM INFECTIONS
55% LOWER COMPARED TO NAT’L BASELINE*
Methicillin-resistant Staphylococcus aureus (MRSA) is bacteria usually spread by contaminated hands. In a healthcare setting, such as a hospital, MRSA can cause serious bloodstream infections.
0%Among the 23 hospitals in Minnesota with enough data to calculate an SIR, 0% had an SIR significantly worse than the national SIR of 0.92.
SSIsSURGICAL SITE INFECTIONS
When germs get into an area where surgery is or was performed, patients can get a surgical site infection. Sometimes these infections involve only the skin. Other SSIs can involve tissues under the skin, organs, or implanted material.
SSI: Abdominal Hysterectomy 2% HIGHER COMPARED TO NAT’L BASELINE
Minnesota hospitals reported no significant change in SSIs related to abdominal hysterectomy surgery between 2012 and 2013.
10%Among the 10 hospitals in Minnesota with enough data to calculate an SIR, 10% had an SIR significantly worse than the national SIR of 0.86.
SSI: Colon Surgery 2% LOWER COMPARED TO NAT’L BASELINE
Minnesota hospitals reported a significant increase in SSIs related to colon surgery between 2012 and 2013.
Several changes to the NHSN 2013 SSI protocol likely contributed to an increase in the national and some state- specific colon surgery SIRs compared to 2012.
7%Among the 28 hospitals in Minnesota with enough data to calculate an SIR, 7% had an SIR significantly worse than the national SIR of 0.92.
C. difficile InfectionsLABORATORY IDENTIFIED HOSPITAL-ONSET C. DIFFICILE INFECTIONS
17% LOWER COMPARED TO NAT’L BASELINE*
When a person takes antibiotics, good bacteria that protect against infection are destroyed for several months. During this time, patients can get sick from Clostridium difficile (C. difficile), bacteria that cause potentially deadly diarrhea, which can be spread in healthcare settings.
13%Among the 53 hospitals in Minnesota with enough data to calculate an SIR, 13% had an SIR significantly worse than the national SIR of 0.90.
THIS REPORT IS BASED ON 2013 DATA, PUBLISHED JANUARY 2015

M I N N E S O TAHEALTHCARE-ASSOCIATED INFECTION (HAI) DATA give healthcare facilities and public health agencies knowledge to design, implement, and evaluate HAI prevention efforts.
LEGEND
2013 state SIR is significantly lower (better) than comparison group
in column header
or
Change in 2013 state SIR compared to group in column header is not statistically significant
2013 state SIR is significantly higher (worse) than comparison group in
column header
2013 state SIR cannot be calculated
HAI TYPE# OF MINNESOTA
HOSPITALS THAT REPORTED DATA TO CDC’S NHSN, 2013
Total Hospitals in State: 144+
2013 STATE SIR vs.
2012 State SIR‡
2013 STATE SIR vs.
2013 Nat’l SIR
2013 STATE SIR vs.
Nat’l Baseline
2013 STATE SIR
2013 NAT’L SIR
CLABSI Nat’l Baseline: 2008
47 7% 18% 56% 0.44 0.54
CAUTI Nat’l Baseline: 2009
51 14% 19% 26% 1.26 1.06
SSI, Abdominal Hysterectomy Nat’l Baseline: 2008
50 5% 19% 2% 1.02 0.86
SSI, Colon Surgery Nat’l Baseline: 2008
51 44% 7% 2% 0.98 0.92
MRSA Bacteremia Nat’l Baseline: 2011
53 2012 SIR not available
51% 55% 0.45 0.92
C. difficile Infections Nat’l Baseline: 2011
55 2012 SIR not available
8% 17% 0.83 0.90
+Not all hospitals are required to report these infections; for example, some hospitals do not use central lines or urinary catheters, or do not perform colon or abdominal hysterectomy surgeries. ‡The state’s 2012 SIR can be found in the data tables of this report. Nat’l baseline time period varies by infection type. See first column of this table for specifics.
WHAT IS THE STANDARDIZED INFECTION RATIO?
The standardized infection ratio (SIR) is a summary statistic that can be used to track HAI prevention progress over time; lower SIRs are better. The SIR for a facility or state is adjusted to account for factors that might cause infection rates to be higher or lower, such as hospital size, teaching status, the type of patients a hospital serves, and surgery and patient characteristics.
WHAT IS MINNESOTA DOING TO PREVENT HEALTHCARE-ASSOCIATED INFECTIONS?
Minnesota has a state mandate to publicly report at least one HAI to NHSN. Minnesota is one of 10 state health departments participating in CDC’s Emerging Infections Program, which allows for extra surveillance and research of HAIs.
Prevention efforts to reduce specific HAIs:
■ Central line-associated bloodstream infections ■ Catheter-associated urinary tract infections
■ Surgical site infections ■ Multidrug-resistant infections (C. difficile) ■ Long-term care facilities ■ Antibiotic stewardship
Learn how your hospital is performing: www.medicare.gov/hospitalcompare For additional information:
■ 2013 HAI Progress Report: www.cdc.gov/hai/progress-report/ ■ NHSN: www.cdc.gov/nhsn ■ HAIs and prevention activities in Minnesota: www.health.state.mn.us/divs/idepc/dtopics/hai/index.html ■ Minnesota validation efforts: www.cdc.gov/hai/pdfs/state-progress-landscape.pdf
THIS REPORT IS BASED ON 2013 DATA, PUBLISHED JANUARY 2015

M I S S I S S I P P IHealthcare-associated infections (HAIs) are infections patients can get while receiving medical treatment in a healthcare facility. Working toward the elimination of HAIs is a CDC priority. The standardized infection ratio (SIR) is a summary statistic that can be used to track HAI prevention progress over time; lower SIRs are better. The infection data are collected through CDC’s National Healthcare Safety Network (NHSN). HAI data for nearly all U.S. hospitals are published on the Hospital Compare website.
CLABSIsCENTRAL LINE-ASSOCIATED BLOODSTREAM INFECTIONS
23% LOWER COMPARED TO NAT’L BASELINE*
*Statistically significant.
When a tube is placed in a large vein and not put in correctly or kept clean, it can become a way for germs to enter the body and cause deadly infections in the blood.
Mississippi hospitals reported a significant decrease in CLABSIs between 2012 and 2013.
35%Among the 26 hospitals in Mississippi with enough data to calculate an SIR, 35% had an SIR significantly worse than the national SIR of 0.54.
CAUTIsCATHETER-ASSOCIATED URINARY TRACT INFECTIONS
8% HIGHER COMPARED TO NAT’L BASELINE
When a urinary catheter is not put in correctly, not kept clean, or left in a patient for too long, germs can travel through the catheter and infect the bladder and kidneys.
Mississippi hospitals reported no significant change in CAUTIs between 2012 and 2013.
15% Among the 33 hospitals in Mississippi with enough data to calculate an SIR, 15% had an SIR significantly worse than the national SIR of 1.06.
MRSA BacteremiaLABORATORY IDENTIFIED HOSPITAL-ONSET BLOODSTREAM INFECTIONS
13% HIGHER COMPARED TO NAT’L BASELINE
Methicillin-resistant Staphylococcus aureus (MRSA) is bacteria usually spread by contaminated hands. In a healthcare setting, such as a hospital, MRSA can cause serious bloodstream infections.
22%Among the 23 hospitals in Mississippi with enough data to calculate an SIR, 22% had an SIR significantly worse than the national SIR of 0.92.
SSIsSURGICAL SITE INFECTIONS
When germs get into an area where surgery is or was performed, patients can get a surgical site infection. Sometimes these infections involve only the skin. Other SSIs can involve tissues under the skin, organs, or implanted material.
SSI: Abdominal Hysterectomy 16% LOWER COMPARED TO NAT’L BASELINE
Mississippi hospitals reported no significant change in SSIs related to abdominal hysterectomy surgery between 2012 and 2013.
9%Among the 11 hospitals in Mississippi with enough data to calculate an SIR, 9% had an SIR significantly worse than the national SIR of 0.86.
SSI: Colon Surgery 19% LOWER COMPARED TO NAT’L BASELINE
Mississippi hospitals reported no significant change in SSIs related to colon surgery between 2012 and 2013.
Several changes to the NHSN 2013 SSI protocol likely contributed to an increase in the national and some state- specific colon surgery SIRs compared to 2012.
0%Among the 22 hospitals in Mississippi with enough data to calculate an SIR, 0% had an SIR significantly worse than the national SIR of 0.92.
C. difficile InfectionsLABORATORY IDENTIFIED HOSPITAL-ONSET C. DIFFICILE INFECTIONS
40% LOWER COMPARED TO NAT’L BASELINE*
When a person takes antibiotics, good bacteria that protect against infection are destroyed for several months. During this time, patients can get sick from Clostridium difficile (C. difficile), bacteria that cause potentially deadly diarrhea, which can be spread in healthcare settings.
0%Among the 56 hospitals in Mississippi with enough data to calculate an SIR, 0% had an SIR significantly worse than the national SIR of 0.90.
THIS REPORT IS BASED ON 2013 DATA, PUBLISHED JANUARY 2015

M I S S I S S I P P IHEALTHCARE-ASSOCIATED INFECTION (HAI) DATA give healthcare facilities and public health agencies knowledge to design, implement, and evaluate HAI prevention efforts.
LEGEND
2013 state SIR is significantly lower (better) than comparison group
in column header
or
Change in 2013 state SIR compared to group in column header is not statistically significant
2013 state SIR is significantly higher (worse) than comparison group in
column header
2013 state SIR cannot be calculated
HAI TYPE# OF MISSISSIPPI
HOSPITALS THAT REPORTED DATA TO CDC’S NHSN, 2013
Total Hospitals in State: 111+
2013 STATE SIR vs.
2012 State SIR‡
2013 STATE SIR vs.
2013 Nat’l SIR
2013 STATE SIR vs.
Nat’l Baseline
2013 STATE SIR
2013 NAT’L SIR
CLABSI Nat’l Baseline: 2008
47 18% 44% 23% 0.77 0.54
CAUTI Nat’l Baseline: 2009
48 10% 2% 8% 1.08 1.06
SSI, Abdominal Hysterectomy Nat’l Baseline: 2008
42 36% 2% 16% 0.84 0.86
SSI, Colon Surgery Nat’l Baseline: 2008
43 1% 12% 19% 0.81 0.92
MRSA Bacteremia Nat’l Baseline: 2011
64 2012 SIR not available
23% 13% 1.13 0.92
C. difficile Infections Nat’l Baseline: 2011
65 2012 SIR not available
34% 40% 0.60 0.90
+Not all hospitals are required to report these infections; for example, some hospitals do not use central lines or urinary catheters, or do not perform colon or abdominal hysterectomy surgeries. ‡The state’s 2012 SIR can be found in the data tables of this report. Nat’l baseline time period varies by infection type. See first column of this table for specifics.
WHAT IS THE STANDARDIZED INFECTION RATIO?
The standardized infection ratio (SIR) is a summary statistic that can be used to track HAI prevention progress over time; lower SIRs are better. The SIR for a facility or state is adjusted to account for factors that might cause infection rates to be higher or lower, such as hospital size, teaching status, the type of patients a hospital serves, and surgery and patient characteristics.
WHAT IS MISSISSIPPI DOING TO PREVENT HEALTHCARE-ASSOCIATED INFECTIONS?
Prevention efforts to reduce specific HAIs:
■ Multidrug-resistant infections
Learn how your hospital is performing: www.medicare.gov/hospitalcompare For additional information:
■ 2013 HAI Progress Report: www.cdc.gov/hai/progress-report/ ■ NHSN: www.cdc.gov/nhsn ■ HAIs and prevention activities in Mississippi: www.msdh.ms.gov/msdhsite/_static/14,0,194.html ■ Mississippi validation efforts: www.cdc.gov/hai/pdfs/state-progress-landscape.pdf
THIS REPORT IS BASED ON 2013 DATA, PUBLISHED JANUARY 2015

M I S S O U R IHealthcare-associated infections (HAIs) are infections patients can get while receiving medical treatment in a healthcare facility. Working toward the elimination of HAIs is a CDC priority. The standardized infection ratio (SIR) is a summary statistic that can be used to track HAI prevention progress over time; lower SIRs are better. The infection data are collected through CDC’s National Healthcare Safety Network (NHSN). HAI data for nearly all U.S. hospitals are published on the Hospital Compare website.
CLABSIsCENTRAL LINE-ASSOCIATED BLOODSTREAM INFECTIONS
58% LOWER COMPARED TO NAT’L BASELINE*
*Statistically significant.
When a tube is placed in a large vein and not put in correctly or kept clean, it can become a way for germs to enter the body and cause deadly infections in the blood.
Missouri hospitals reported no significant change in CLABSIs between 2012 and 2013.
9%Among the 47 hospitals in Missouri with enough data to calculate an SIR, 9% had an SIR significantly worse than the national SIR of 0.54.
CAUTIsCATHETER-ASSOCIATED URINARY TRACT INFECTIONS
6% HIGHER COMPARED TO NAT’L BASELINE
When a urinary catheter is not put in correctly, not kept clean, or left in a patient for too long, germs can travel through the catheter and infect the bladder and kidneys.
Missouri hospitals reported no significant change in CAUTIs between 2012 and 2013.
17% Among the 54 hospitals in Missouri with enough data to calculate an SIR, 17% had an SIR significantly worse than the national SIR of 1.06.
MRSA BacteremiaLABORATORY IDENTIFIED HOSPITAL-ONSET BLOODSTREAM INFECTIONS
20% LOWER COMPARED TO NAT’L BASELINE*
Methicillin-resistant Staphylococcus aureus (MRSA) is bacteria usually spread by contaminated hands. In a healthcare setting, such as a hospital, MRSA can cause serious bloodstream infections.
5%Among the 43 hospitals in Missouri with enough data to calculate an SIR, 5% had an SIR significantly worse than the national SIR of 0.92.
SSIsSURGICAL SITE INFECTIONS
When germs get into an area where surgery is or was performed, patients can get a surgical site infection. Sometimes these infections involve only the skin. Other SSIs can involve tissues under the skin, organs, or implanted material.
SSI: Abdominal Hysterectomy 32% LOWER COMPARED TO NAT’L BASELINE*
Missouri hospitals reported no significant change in SSIs related to abdominal hysterectomy surgery between 2012 and 2013.
0%Among the 18 hospitals in Missouri with enough data to calculate an SIR, 0% had an SIR significantly worse than the national SIR of 0.86.
SSI: Colon Surgery 31% LOWER COMPARED TO NAT’L BASELINE*
Missouri hospitals reported no significant change in SSIs related to colon surgery between 2012 and 2013.
Several changes to the NHSN 2013 SSI protocol likely contributed to an increase in the national and some state- specific colon surgery SIRs compared to 2012.
4%Among the 47 hospitals in Missouri with enough data to calculate an SIR, 4% had an SIR significantly worse than the national SIR of 0.92.
C. difficile InfectionsLABORATORY IDENTIFIED HOSPITAL-ONSET C. DIFFICILE INFECTIONS
14% LOWER COMPARED TO NAT’L BASELINE*
When a person takes antibiotics, good bacteria that protect against infection are destroyed for several months. During this time, patients can get sick from Clostridium difficile (C. difficile), bacteria that cause potentially deadly diarrhea, which can be spread in healthcare settings.
8%Among the 78 hospitals in Missouri with enough data to calculate an SIR, 8% had an SIR significantly worse than the national SIR of 0.90.
THIS REPORT IS BASED ON 2013 DATA, PUBLISHED JANUARY 2015

M I S S O U R IHEALTHCARE-ASSOCIATED INFECTION (HAI) DATA give healthcare facilities and public health agencies knowledge to design, implement, and evaluate HAI prevention efforts.
LEGEND
2013 state SIR is significantly lower (better) than comparison group
in column header
or
Change in 2013 state SIR compared to group in column header is not statistically significant
2013 state SIR is significantly higher (worse) than comparison group in
column header
2013 state SIR cannot be calculated
HAI TYPE# OF MISSOURI
HOSPITALS THAT REPORTED DATA TO CDC’S NHSN, 2013
Total Hospitals in State: 135+
2013 STATE SIR vs.
2012 State SIR‡
2013 STATE SIR vs.
2013 Nat’l SIR
2013 STATE SIR vs.
Nat’l Baseline
2013 STATE SIR
2013 NAT’L SIR
CLABSI Nat’l Baseline: 2008
74 9% 22% 58% 0.42 0.54
CAUTI Nat’l Baseline: 2009
76 10% <1 % 6% 1.06 1.06
SSI, Abdominal Hysterectomy Nat’l Baseline: 2008
67 5% 22% 32% 0.68 0.86
SSI, Colon Surgery Nat’l Baseline: 2008
74 6% 25% 31% 0.69 0.92
MRSA Bacteremia Nat’l Baseline: 2011
82 2012 SIR not available
14% 20% 0.80 0.92
C. difficile Infections Nat’l Baseline: 2011
82 2012 SIR not available
5% 14% 0.86 0.90
+Not all hospitals are required to report these infections; for example, some hospitals do not use central lines or urinary catheters, or do not perform colon or abdominal hysterectomy surgeries. ‡The state’s 2012 SIR can be found in the data tables of this report. Nat’l baseline time period varies by infection type. See first column of this table for specifics.
WHAT IS THE STANDARDIZED INFECTION RATIO?
The standardized infection ratio (SIR) is a summary statistic that can be used to track HAI prevention progress over time; lower SIRs are better. The SIR for a facility or state is adjusted to account for factors that might cause infection rates to be higher or lower, such as hospital size, teaching status, the type of patients a hospital serves, and surgery and patient characteristics.
WHAT IS MISSOURI DOING TO PREVENT HEALTHCARE-ASSOCIATED INFECTIONS?
Prevention efforts to reduce specific HAIs:
■ Central line-associated bloodstream infections ■ Catheter-associated urinary tract infections ■ Surgical site infections ■ Multidrug-resistant infections (MRSA, C. difficile, CRE) ■ Long-term care facilities ■ Antibiotic stewardship
Learn how your hospital is performing: www.medicare.gov/hospitalcompare For additional information:
■ 2013 HAI Progress Report: www.cdc.gov/hai/progress-report/ ■ NHSN: www.cdc.gov/nhsn ■ HAIs and prevention activities in Missouri: health.mo.gov/data/hai/ ■ Missouri validation efforts: www.cdc.gov/hai/pdfs/state-progress-landscape.pdf
THIS REPORT IS BASED ON 2013 DATA, PUBLISHED JANUARY 2015

M O N TA N AHealthcare-associated infections (HAIs) are infections patients can get while receiving medical treatment in a healthcare facility. Working toward the elimination of HAIs is a CDC priority. The standardized infection ratio (SIR) is a summary statistic that can be used to track HAI prevention progress over time; lower SIRs are better. The infection data are collected through CDC’s National Healthcare Safety Network (NHSN). HAI data for nearly all U.S. hospitals are published on the Hospital Compare website.
CLABSIsCENTRAL LINE-ASSOCIATED BLOODSTREAM INFECTIONS
37% LOWER COMPARED TO NAT’L BASELINE*
*Statistically significant.
When a tube is placed in a large vein and not put in correctly or kept clean, it can become a way for germs to enter the body and cause deadly infections in the blood.
Montana hospitals reported no significant change in CLABSIs between 2012 and 2013.
Not enough data to report how many hospitals had an SIR significantly worse than the national SIR of 0.54.
CAUTIsCATHETER-ASSOCIATED URINARY TRACT INFECTIONS
32% LOWER COMPARED TO NAT’L BASELINE*
When a urinary catheter is not put in correctly, not kept clean, or left in a patient for too long, germs can travel through the catheter and infect the bladder and kidneys.
Montana hospitals reported no significant change in CAUTIs between 2012 and 2013.
0% Among the 10 hospitals in Montana with enough data to calculate an SIR, 0% had an SIR significantly worse than the national SIR of 1.06.
MRSA BacteremiaLABORATORY IDENTIFIED HOSPITAL-ONSET BLOODSTREAM INFECTIONS
50% LOWER COMPARED TO NAT’L BASELINE*
Methicillin-resistant Staphylococcus aureus (MRSA) is bacteria usually spread by contaminated hands. In a healthcare setting, such as a hospital, MRSA can cause serious bloodstream infections.
Not enough data to report how many hospitals had an SIR significantly worse than the national SIR of 0.92.
SSIsSURGICAL SITE INFECTIONS
When germs get into an area where surgery is or was performed, patients can get a surgical site infection. Sometimes these infections involve only the skin. Other SSIs can involve tissues under the skin, organs, or implanted material.
SSI: Abdominal Hysterectomy HIGHER COMPARED TO NAT’L BASELINE
Montana hospitals reported no significant change in SSIs related to abdominal hysterectomy surgery between 2012 and 2013.
Not enough data to report how many hospitals had an SIR significantly worse than the national SIR of 0.86.
SSI: Colon Surgery
1%LESSTHAN
16% LOWER COMPARED TO NAT’L BASELINE
Montana hospitals reported no significant change in SSIs related to colon surgery between 2012 and 2013.
Several changes to the NHSN 2013 SSI protocol likely contributed to an increase in the national and some state- specific colon surgery SIRs compared to 2012.
Not enough data to report how many hospitals had an SIR significantly worse than the national SIR of 0.92.
C. difficile InfectionsLABORATORY IDENTIFIED HOSPITAL-ONSET C. DIFFICILE INFECTIONS
18% LOWER COMPARED TO NAT’L BASELINE*
When a person takes antibiotics, good bacteria that protect against infection are destroyed for several months. During this time, patients can get sick from Clostridium difficile (C. difficile), bacteria that cause potentially deadly diarrhea, which can be spread in healthcare settings.
8%Among the 13 hospitals in Montana with enough data to calculate an SIR, 8% had an SIR significantly worse than the national SIR of 0.90.
THIS REPORT IS BASED ON 2013 DATA, PUBLISHED JANUARY 2015
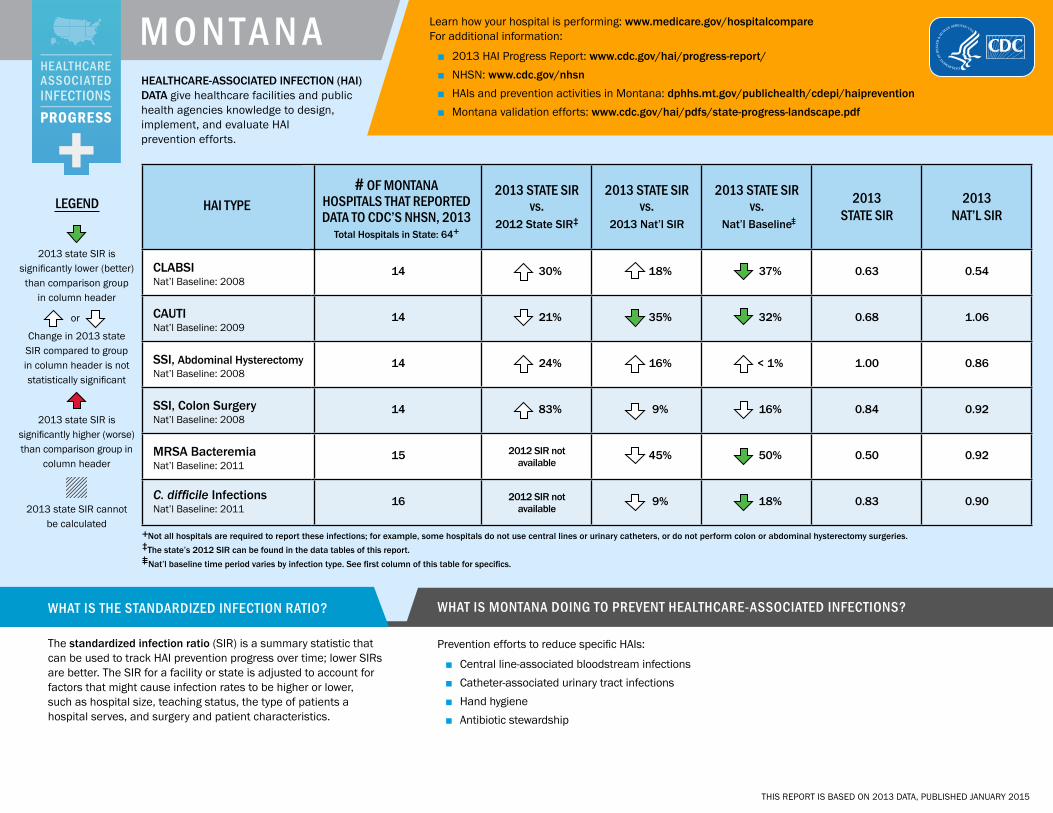
M O N TA N AHEALTHCARE-ASSOCIATED INFECTION (HAI) DATA give healthcare facilities and public health agencies knowledge to design, implement, and evaluate HAI prevention efforts.
LEGEND
2013 state SIR is significantly lower (better) than comparison group
in column header
or
Change in 2013 state SIR compared to group in column header is not statistically significant
2013 state SIR is significantly higher (worse) than comparison group in
column header
2013 state SIR cannot be calculated
HAI TYPE# OF MONTANA
HOSPITALS THAT REPORTED DATA TO CDC’S NHSN, 2013
Total Hospitals in State: 64+
2013 STATE SIR vs.
2012 State SIR‡
2013 STATE SIR vs.
2013 Nat’l SIR
2013 STATE SIR vs.
Nat’l Baseline
2013 STATE SIR
2013 NAT’L SIR
CLABSI Nat’l Baseline: 2008
14 30% 18% 37% 0.63 0.54
CAUTI Nat’l Baseline: 2009
14 21% 35% 32% 0.68 1.06
SSI, Abdominal Hysterectomy Nat’l Baseline: 2008
14 24% 16% < 1% 1.00 0.86
SSI, Colon Surgery Nat’l Baseline: 2008
14 83% 9% 16% 0.84 0.92
MRSA Bacteremia Nat’l Baseline: 2011
15 2012 SIR not available
45% 50% 0.50 0.92
C. difficile Infections Nat’l Baseline: 2011
16 2012 SIR not available
9% 18% 0.83 0.90
+Not all hospitals are required to report these infections; for example, some hospitals do not use central lines or urinary catheters, or do not perform colon or abdominal hysterectomy surgeries. ‡The state’s 2012 SIR can be found in the data tables of this report. Nat’l baseline time period varies by infection type. See first column of this table for specifics.
WHAT IS THE STANDARDIZED INFECTION RATIO?
The standardized infection ratio (SIR) is a summary statistic that can be used to track HAI prevention progress over time; lower SIRs are better. The SIR for a facility or state is adjusted to account for factors that might cause infection rates to be higher or lower, such as hospital size, teaching status, the type of patients a hospital serves, and surgery and patient characteristics.
WHAT IS MONTANA DOING TO PREVENT HEALTHCARE-ASSOCIATED INFECTIONS?
Prevention efforts to reduce specific HAIs:
■ Central line-associated bloodstream infections ■ Catheter-associated urinary tract infections ■ Hand hygiene ■ Antibiotic stewardship
Learn how your hospital is performing: www.medicare.gov/hospitalcompare For additional information:
■ 2013 HAI Progress Report: www.cdc.gov/hai/progress-report/ ■ NHSN: www.cdc.gov/nhsn ■ HAIs and prevention activities in Montana: dphhs.mt.gov/publichealth/cdepi/haiprevention ■ Montana validation efforts: www.cdc.gov/hai/pdfs/state-progress-landscape.pdf
THIS REPORT IS BASED ON 2013 DATA, PUBLISHED JANUARY 2015

N E B R A S K AHealthcare-associated infections (HAIs) are infections patients can get while receiving medical treatment in a healthcare facility. Working toward the elimination of HAIs is a CDC priority. The standardized infection ratio (SIR) is a summary statistic that can be used to track HAI prevention progress over time; lower SIRs are better. The infection data are collected through CDC’s National Healthcare Safety Network (NHSN). HAI data for nearly all U.S. hospitals are published on the Hospital Compare website.
CLABSIsCENTRAL LINE-ASSOCIATED BLOODSTREAM INFECTIONS
29% LOWER COMPARED TO NAT’L BASELINE*
*Statistically significant.
When a tube is placed in a large vein and not put in correctly or kept clean, it can become a way for germs to enter the body and cause deadly infections in the blood.
Nebraska hospitals reported no significant change in CLABSIs between 2012 and 2013.
13%Among the 16 hospitals in Nebraska with enough data to calculate an SIR, 13% had an SIR significantly worse than the national SIR of 0.54.
CAUTIsCATHETER-ASSOCIATED URINARY TRACT INFECTIONS
8% LOWER COMPARED TO NAT’L BASELINE
When a urinary catheter is not put in correctly, not kept clean, or left in a patient for too long, germs can travel through the catheter and infect the bladder and kidneys.
Nebraska hospitals reported no significant change in CAUTIs between 2012 and 2013.
11% Among the 19 hospitals in Nebraska with enough data to calculate an SIR, 11% had an SIR significantly worse than the national SIR of 1.06.
MRSA BacteremiaLABORATORY IDENTIFIED HOSPITAL-ONSET BLOODSTREAM INFECTIONS
38% LOWER COMPARED TO NAT’L BASELINE*
Methicillin-resistant Staphylococcus aureus (MRSA) is bacteria usually spread by contaminated hands. In a healthcare setting, such as a hospital, MRSA can cause serious bloodstream infections.
0%Among the 10 hospitals in Nebraska with enough data to calculate an SIR, 0% had an SIR significantly worse than the national SIR of 0.92.
SSIsSURGICAL SITE INFECTIONS
When germs get into an area where surgery is or was performed, patients can get a surgical site infection. Sometimes these infections involve only the skin. Other SSIs can involve tissues under the skin, organs, or implanted material.
SSI: Abdominal Hysterectomy 37% LOWER COMPARED TO NAT’L BASELINE
Nebraska hospitals reported no significant change in SSIs related to abdominal hysterectomy surgery between 2012 and 2013.
Not enough data to report how many hospitals had an SIR significantly worse than the national SIR of 0.86.
SSI: Colon Surgery 30% HIGHER COMPARED TO NAT’L BASELINE*
Nebraska hospitals reported no significant change in SSIs related to colon surgery between 2012 and 2013.
Several changes to the NHSN 2013 SSI protocol likely contributed to an increase in the national and some state- specific colon surgery SIRs compared to 2012.
25%Among the 12 hospitals in Nebraska with enough data to calculate an SIR, 25% had an SIR significantly worse than the national SIR of 0.92.
C. difficile InfectionsLABORATORY IDENTIFIED HOSPITAL-ONSET C. DIFFICILE INFECTIONS
39% LOWER COMPARED TO NAT’L BASELINE*
When a person takes antibiotics, good bacteria that protect against infection are destroyed for several months. During this time, patients can get sick from Clostridium difficile (C. difficile), bacteria that cause potentially deadly diarrhea, which can be spread in healthcare settings.
4%Among the 24 hospitals in Nebraska with enough data to calculate an SIR, 4% had an SIR significantly worse than the national SIR of 0.90.
THIS REPORT IS BASED ON 2013 DATA, PUBLISHED JANUARY 2015

N E B R A S K AHEALTHCARE-ASSOCIATED INFECTION (HAI) DATA give healthcare facilities and public health agencies knowledge to design, implement, and evaluate HAI prevention efforts.
LEGEND
2013 state SIR is significantly lower (better) than comparison group
in column header
or
Change in 2013 state SIR compared to group in column header is not statistically significant
2013 state SIR is significantly higher (worse) than comparison group in
column header
2013 state SIR cannot be calculated
HAI TYPE# OF NEBRASKA
HOSPITALS THAT REPORTED DATA TO CDC’S NHSN, 2013
Total Hospitals in State: 95+
2013 STATE SIR vs.
2012 State SIR‡
2013 STATE SIR vs.
2013 Nat’l SIR
2013 STATE SIR vs.
Nat’l Baseline
2013 STATE SIR
2013 NAT’L SIR
CLABSI Nat’l Baseline: 2008
20 4% 32% 29% 0.71 0.54
CAUTI Nat’l Baseline: 2009
20 5% 12% 8% 0.93 1.06
SSI, Abdominal Hysterectomy Nat’l Baseline: 2008
19 39% 27% 37% 0.63 0.86
SSI, Colon Surgery Nat’l Baseline: 2008
19 6% 41% 30% 1.30 0.92
MRSA Bacteremia Nat’l Baseline: 2011
24 2012 SIR not available
32% 38% 0.62 0.92
C. difficile Infections Nat’l Baseline: 2011
24 2012 SIR not available
32% 39% 0.61 0.90
+Not all hospitals are required to report these infections; for example, some hospitals do not use central lines or urinary catheters, or do not perform colon or abdominal hysterectomy surgeries. ‡The state’s 2012 SIR can be found in the data tables of this report. Nat’l baseline time period varies by infection type. See first column of this table for specifics.
WHAT IS THE STANDARDIZED INFECTION RATIO?
The standardized infection ratio (SIR) is a summary statistic that can be used to track HAI prevention progress over time; lower SIRs are better. The SIR for a facility or state is adjusted to account for factors that might cause infection rates to be higher or lower, such as hospital size, teaching status, the type of patients a hospital serves, and surgery and patient characteristics.
WHAT IS NEBRASKA DOING TO PREVENT HEALTHCARE-ASSOCIATED INFECTIONS?
Prevention efforts to reduce specific HAIs:
■ Central line-associated bloodstream infections ■ Catheter-associated urinary tract infections ■ Surgical site infections ■ Multidrug-resistant infections (MRSA, C. difficile, CRE) ■ Antibiotic stewardship ■ Healthcare personnel influenza vaccination
Learn how your hospital is performing: www.medicare.gov/hospitalcompare For additional information:
■ 2013 HAI Progress Report: www.cdc.gov/hai/progress-report/ ■ NHSN: www.cdc.gov/nhsn ■ HAIs and prevention activities in Nebraska: dhhs.ne.gov/Pages/default.aspx ■ Nebraska validation efforts: www.cdc.gov/hai/pdfs/state-progress-landscape.pdf
THIS REPORT IS BASED ON 2013 DATA, PUBLISHED JANUARY 2015

N E V A D AHealthcare-associated infections (HAIs) are infections patients can get while receiving medical treatment in a healthcare facility. Working toward the elimination of HAIs is a CDC priority. The standardized infection ratio (SIR) is a summary statistic that can be used to track HAI prevention progress over time; lower SIRs are better. The infection data are collected through CDC’s National Healthcare Safety Network (NHSN). HAI data for nearly all U.S. hospitals are published on the Hospital Compare website.
CLABSIsCENTRAL LINE-ASSOCIATED BLOODSTREAM INFECTIONS
37% LOWER COMPARED TO NAT’L BASELINE*
*Statistically significant.
When a tube is placed in a large vein and not put in correctly or kept clean, it can become a way for germs to enter the body and cause deadly infections in the blood.
Nevada hospitals reported no significant change in CLABSIs between 2012 and 2013.
26%Among the 19 hospitals in Nevada with enough data to calculate an SIR, 26% had an SIR significantly worse than the national SIR of 0.54.
CAUTIsCATHETER-ASSOCIATED URINARY TRACT INFECTIONS
8% HIGHER COMPARED TO NAT’L BASELINE
When a urinary catheter is not put in correctly, not kept clean, or left in a patient for too long, germs can travel through the catheter and infect the bladder and kidneys.
Nevada hospitals reported no significant change in CAUTIs between 2012 and 2013.
15% Among the 20 hospitals in Nevada with enough data to calculate an SIR, 15% had an SIR significantly worse than the national SIR of 1.06.
MRSA BacteremiaLABORATORY IDENTIFIED HOSPITAL-ONSET BLOODSTREAM INFECTIONS
21% LOWER COMPARED TO NAT’L BASELINE
Methicillin-resistant Staphylococcus aureus (MRSA) is bacteria usually spread by contaminated hands. In a healthcare setting, such as a hospital, MRSA can cause serious bloodstream infections.
6%Among the 16 hospitals in Nevada with enough data to calculate an SIR, 6% had an SIR significantly worse than the national SIR of 0.92.
SSIsSURGICAL SITE INFECTIONS
When germs get into an area where surgery is or was performed, patients can get a surgical site infection. Sometimes these infections involve only the skin. Other SSIs can involve tissues under the skin, organs, or implanted material.
SSI: Abdominal Hysterectomy 22% LOWER COMPARED TO NAT’L BASELINE
Nevada hospitals reported no significant change in SSIs related to abdominal hysterectomy surgery between 2012 and 2013.
Not enough data to report how many hospitals had an SIR significantly worse than the national SIR of 0.86.
SSI: Colon Surgery 7% HIGHER COMPARED TO NAT’L BASELINE
Nevada hospitals reported no significant change in SSIs related to colon surgery between 2012 and 2013.
Several changes to the NHSN 2013 SSI protocol likely contributed to an increase in the national and some state- specific colon surgery SIRs compared to 2012.
14%Among the 14 hospitals in Nevada with enough data to calculate an SIR, 14% had an SIR significantly worse than the national SIR of 0.92.
C. difficile InfectionsLABORATORY IDENTIFIED HOSPITAL-ONSET C. DIFFICILE INFECTIONS
17% HIGHER COMPARED TO NAT’L BASELINE*
When a person takes antibiotics, good bacteria that protect against infection are destroyed for several months. During this time, patients can get sick from Clostridium difficile (C. difficile), bacteria that cause potentially deadly diarrhea, which can be spread in healthcare settings.
38%Among the 21 hospitals in Nevada with enough data to calculate an SIR, 38% had an SIR significantly worse than the national SIR of 0.90.
THIS REPORT IS BASED ON 2013 DATA, PUBLISHED JANUARY 2015

N E V A D AHEALTHCARE-ASSOCIATED INFECTION (HAI) DATA give healthcare facilities and public health agencies knowledge to design, implement, and evaluate HAI prevention efforts.
LEGEND
2013 state SIR is significantly lower (better) than comparison group
in column header
or
Change in 2013 state SIR compared to group in column header is not statistically significant
2013 state SIR is significantly higher (worse) than comparison group in
column header
2013 state SIR cannot be calculated
HAI TYPE# OF NEVADA
HOSPITALS THAT REPORTED DATA TO CDC’S NHSN, 2013
Total Hospitals in State: 46+
2013 STATE SIR vs.
2012 State SIR‡
2013 STATE SIR vs.
2013 Nat’l SIR
2013 STATE SIR vs.
Nat’l Baseline
2013 STATE SIR
2013 NAT’L SIR
CLABSI Nat’l Baseline: 2008
23 6% 18% 37% 0.63 0.54
CAUTI Nat’l Baseline: 2009
24 9% 2% 8% 1.08 1.06
SSI, Abdominal Hysterectomy Nat’l Baseline: 2008
20 23% 9% 22% 0.78 0.86
SSI, Colon Surgery Nat’l Baseline: 2008
22 4% 16% 7% 1.07 0.92
MRSA Bacteremia Nat’l Baseline: 2011
23 2012 SIR not available
14% 21% 0.79 0.92
C. difficile Infections Nat’l Baseline: 2011
22 2012 SIR not available
30% 17% 1.17 0.90
+Not all hospitals are required to report these infections; for example, some hospitals do not use central lines or urinary catheters, or do not perform colon or abdominal hysterectomy surgeries. ‡The state’s 2012 SIR can be found in the data tables of this report. Nat’l baseline time period varies by infection type. See first column of this table for specifics.
WHAT IS THE STANDARDIZED INFECTION RATIO?
The standardized infection ratio (SIR) is a summary statistic that can be used to track HAI prevention progress over time; lower SIRs are better. The SIR for a facility or state is adjusted to account for factors that might cause infection rates to be higher or lower, such as hospital size, teaching status, the type of patients a hospital serves, and surgery and patient characteristics.
WHAT IS NEVADA DOING TO PREVENT HEALTHCARE-ASSOCIATED INFECTIONS?
Nevada has a state mandate to publicly report at least one HAI to NHSN.
Prevention efforts to reduce specific HAIs:
■ Catheter-associated urinary tract infections ■ Multidrug-resistant infections (C. difficile and others) ■ Hand hygiene ■ Antibiotic stewardship
Learn how your hospital is performing: www.medicare.gov/hospitalcompare For additional information:
■ 2013 HAI Progress Report: www.cdc.gov/hai/progress-report/ ■ NHSN: www.cdc.gov/nhsn ■ HAIs and prevention activities in Nevada: health.nv.gov/IPCInitiative_HAInfections.htm ■ Nevada validation efforts: www.cdc.gov/hai/pdfs/state-progress-landscape.pdf
THIS REPORT IS BASED ON 2013 DATA, PUBLISHED JANUARY 2015
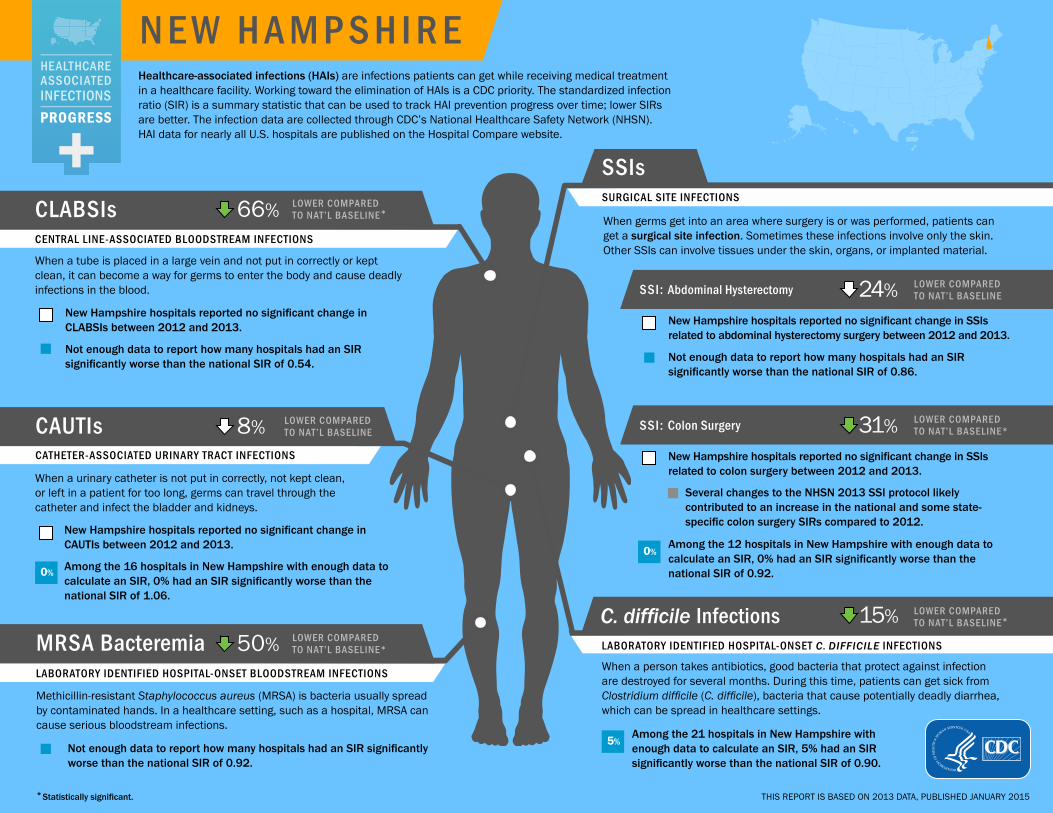
N E W H A M P S H I R EHealthcare-associated infections (HAIs) are infections patients can get while receiving medical treatment in a healthcare facility. Working toward the elimination of HAIs is a CDC priority. The standardized infection ratio (SIR) is a summary statistic that can be used to track HAI prevention progress over time; lower SIRs are better. The infection data are collected through CDC’s National Healthcare Safety Network (NHSN). HAI data for nearly all U.S. hospitals are published on the Hospital Compare website.
CLABSIsCENTRAL LINE-ASSOCIATED BLOODSTREAM INFECTIONS
66% LOWER COMPARED TO NAT’L BASELINE*
*Statistically significant.
When a tube is placed in a large vein and not put in correctly or kept clean, it can become a way for germs to enter the body and cause deadly infections in the blood.
New Hampshire hospitals reported no significant change in CLABSIs between 2012 and 2013.
Not enough data to report how many hospitals had an SIR significantly worse than the national SIR of 0.54.
CAUTIsCATHETER-ASSOCIATED URINARY TRACT INFECTIONS
8% LOWER COMPARED TO NAT’L BASELINE
When a urinary catheter is not put in correctly, not kept clean, or left in a patient for too long, germs can travel through the catheter and infect the bladder and kidneys.
New Hampshire hospitals reported no significant change in CAUTIs between 2012 and 2013.
0% Among the 16 hospitals in New Hampshire with enough data to calculate an SIR, 0% had an SIR significantly worse than the national SIR of 1.06.
MRSA BacteremiaLABORATORY IDENTIFIED HOSPITAL-ONSET BLOODSTREAM INFECTIONS
50% LOWER COMPARED TO NAT’L BASELINE*
Methicillin-resistant Staphylococcus aureus (MRSA) is bacteria usually spread by contaminated hands. In a healthcare setting, such as a hospital, MRSA can cause serious bloodstream infections.
Not enough data to report how many hospitals had an SIR significantly worse than the national SIR of 0.92.
SSIsSURGICAL SITE INFECTIONS
When germs get into an area where surgery is or was performed, patients can get a surgical site infection. Sometimes these infections involve only the skin. Other SSIs can involve tissues under the skin, organs, or implanted material.
SSI: Abdominal Hysterectomy 24% LOWER COMPARED TO NAT’L BASELINE
New Hampshire hospitals reported no significant change in SSIs related to abdominal hysterectomy surgery between 2012 and 2013.
Not enough data to report how many hospitals had an SIR significantly worse than the national SIR of 0.86.
SSI: Colon Surgery 31% LOWER COMPARED TO NAT’L BASELINE*
New Hampshire hospitals reported no significant change in SSIs related to colon surgery between 2012 and 2013.
Several changes to the NHSN 2013 SSI protocol likely contributed to an increase in the national and some state- specific colon surgery SIRs compared to 2012.
0%Among the 12 hospitals in New Hampshire with enough data to calculate an SIR, 0% had an SIR significantly worse than the national SIR of 0.92.
C. difficile InfectionsLABORATORY IDENTIFIED HOSPITAL-ONSET C. DIFFICILE INFECTIONS
15% LOWER COMPARED TO NAT’L BASELINE*
When a person takes antibiotics, good bacteria that protect against infection are destroyed for several months. During this time, patients can get sick from Clostridium difficile (C. difficile), bacteria that cause potentially deadly diarrhea, which can be spread in healthcare settings.
5%Among the 21 hospitals in New Hampshire with enough data to calculate an SIR, 5% had an SIR significantly worse than the national SIR of 0.90.
THIS REPORT IS BASED ON 2013 DATA, PUBLISHED JANUARY 2015
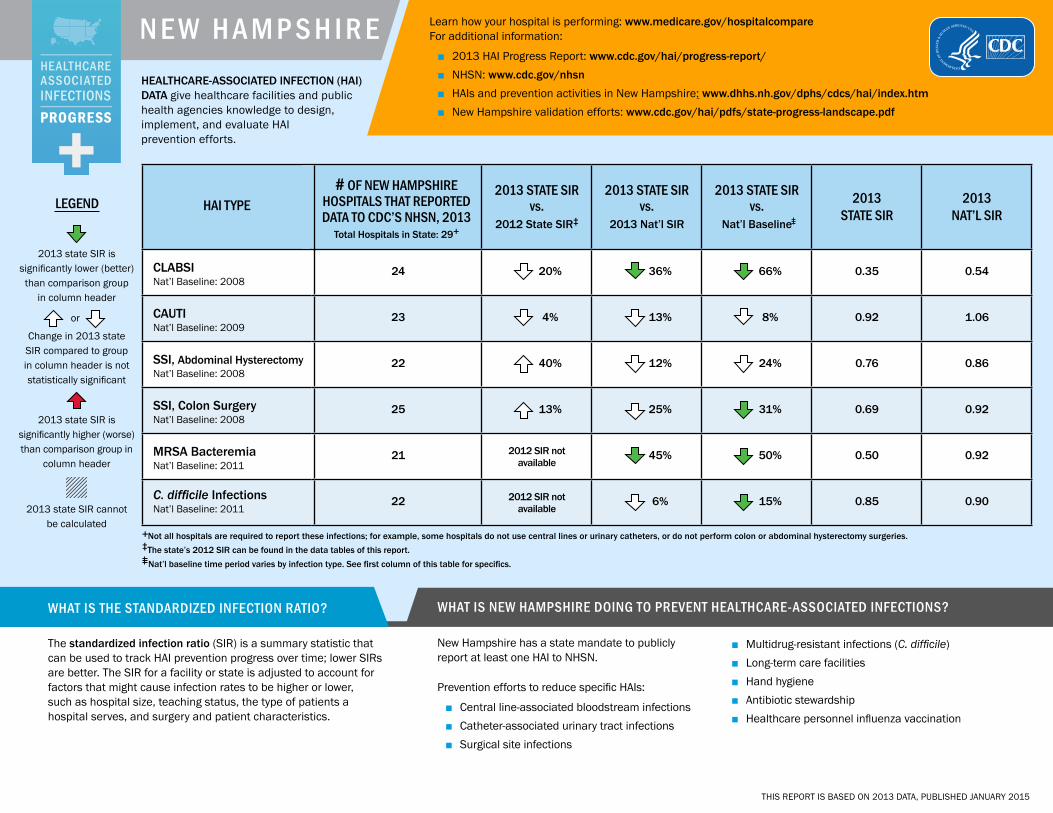
N E W H A M P S H I R EHEALTHCARE-ASSOCIATED INFECTION (HAI) DATA give healthcare facilities and public health agencies knowledge to design, implement, and evaluate HAI prevention efforts.
LEGEND
2013 state SIR is significantly lower (better) than comparison group
in column header
or
Change in 2013 state SIR compared to group in column header is not statistically significant
2013 state SIR is significantly higher (worse) than comparison group in
column header
2013 state SIR cannot be calculated
HAI TYPE# OF NEW HAMPSHIRE
HOSPITALS THAT REPORTED DATA TO CDC’S NHSN, 2013
Total Hospitals in State: 29+
2013 STATE SIR vs.
2012 State SIR‡
2013 STATE SIR vs.
2013 Nat’l SIR
2013 STATE SIR vs.
Nat’l Baseline
2013 STATE SIR
2013 NAT’L SIR
CLABSI Nat’l Baseline: 2008
24 20% 36% 66% 0.35 0.54
CAUTI Nat’l Baseline: 2009
23 4% 13% 8% 0.92 1.06
SSI, Abdominal Hysterectomy Nat’l Baseline: 2008
22 40% 12% 24% 0.76 0.86
SSI, Colon Surgery Nat’l Baseline: 2008
25 13% 25% 31% 0.69 0.92
MRSA Bacteremia Nat’l Baseline: 2011
21 2012 SIR not available
45% 50% 0.50 0.92
C. difficile Infections Nat’l Baseline: 2011
22 2012 SIR not available
6% 15% 0.85 0.90
+Not all hospitals are required to report these infections; for example, some hospitals do not use central lines or urinary catheters, or do not perform colon or abdominal hysterectomy surgeries. ‡The state’s 2012 SIR can be found in the data tables of this report. Nat’l baseline time period varies by infection type. See first column of this table for specifics.
WHAT IS THE STANDARDIZED INFECTION RATIO?
The standardized infection ratio (SIR) is a summary statistic that can be used to track HAI prevention progress over time; lower SIRs are better. The SIR for a facility or state is adjusted to account for factors that might cause infection rates to be higher or lower, such as hospital size, teaching status, the type of patients a hospital serves, and surgery and patient characteristics.
WHAT IS NEW HAMPSHIRE DOING TO PREVENT HEALTHCARE-ASSOCIATED INFECTIONS?
New Hampshire has a state mandate to publicly report at least one HAI to NHSN.
Prevention efforts to reduce specific HAIs:
■ Central line-associated bloodstream infections ■ Catheter-associated urinary tract infections ■ Surgical site infections
■ Multidrug-resistant infections (C. difficile) ■ Long-term care facilities ■ Hand hygiene ■ Antibiotic stewardship ■ Healthcare personnel influenza vaccination
Learn how your hospital is performing: www.medicare.gov/hospitalcompare For additional information:
■ 2013 HAI Progress Report: www.cdc.gov/hai/progress-report/ ■ NHSN: www.cdc.gov/nhsn ■ HAIs and prevention activities in New Hampshire: www.dhhs.nh.gov/dphs/cdcs/hai/index.htm ■ New Hampshire validation efforts: www.cdc.gov/hai/pdfs/state-progress-landscape.pdf
THIS REPORT IS BASED ON 2013 DATA, PUBLISHED JANUARY 2015

N E W J E R S E YHealthcare-associated infections (HAIs) are infections patients can get while receiving medical treatment in a healthcare facility. Working toward the elimination of HAIs is a CDC priority. The standardized infection ratio (SIR) is a summary statistic that can be used to track HAI prevention progress over time; lower SIRs are better. The infection data are collected through CDC’s National Healthcare Safety Network (NHSN). HAI data for nearly all U.S. hospitals are published on the Hospital Compare website.
CLABSIsCENTRAL LINE-ASSOCIATED BLOODSTREAM INFECTIONS
39% LOWER COMPARED TO NAT’L BASELINE*
*Statistically significant.
When a tube is placed in a large vein and not put in correctly or kept clean, it can become a way for germs to enter the body and cause deadly infections in the blood.
New Jersey hospitals reported a significant decrease in CLABSIs between 2012 and 2013.
18%Among the 68 hospitals in New Jersey with enough data to calculate an SIR, 18% had an SIR significantly worse than the national SIR of 0.54.
CAUTIsCATHETER-ASSOCIATED URINARY TRACT INFECTIONS
2% HIGHER COMPARED TO NAT’L BASELINE
When a urinary catheter is not put in correctly, not kept clean, or left in a patient for too long, germs can travel through the catheter and infect the bladder and kidneys.
New Jersey hospitals reported a significant increase in CAUTIs between 2012 and 2013.
13% Among the 71 hospitals in New Jersey with enough data to calculate an SIR, 13% had an SIR significantly worse than the national SIR of 1.06.
MRSA BacteremiaLABORATORY IDENTIFIED HOSPITAL-ONSET BLOODSTREAM INFECTIONS
14% HIGHER COMPARED TO NAT’L BASELINE*
Methicillin-resistant Staphylococcus aureus (MRSA) is bacteria usually spread by contaminated hands. In a healthcare setting, such as a hospital, MRSA can cause serious bloodstream infections.
20%Among the 65 hospitals in New Jersey with enough data to calculate an SIR, 20% had an SIR significantly worse than the national SIR of 0.92.
SSIsSURGICAL SITE INFECTIONS
When germs get into an area where surgery is or was performed, patients can get a surgical site infection. Sometimes these infections involve only the skin. Other SSIs can involve tissues under the skin, organs, or implanted material.
SSI: Abdominal Hysterectomy 17% LOWER COMPARED TO NAT’L BASELINE
New Jersey hospitals reported no significant change in SSIs related to abdominal hysterectomy surgery between 2012 and 2013.
5%Among the 21 hospitals in New Jersey with enough data to calculate an SIR, 5% had an SIR significantly worse than the national SIR of 0.86.
SSI: Colon Surgery 14% LOWER COMPARED TO NAT’L BASELINE*
New Jersey hospitals reported a significant increase in SSIs related to colon surgery between 2012 and 2013.
Several changes to the NHSN 2013 SSI protocol likely contributed to an increase in the national and some state- specific colon surgery SIRs compared to 2012.
5%Among the 57 hospitals in New Jersey with enough data to calculate an SIR, 5% had an SIR significantly worse than the national SIR of 0.92.
C. difficile InfectionsLABORATORY IDENTIFIED HOSPITAL-ONSET C. DIFFICILE INFECTIONS
2% HIGHER COMPARED TO NAT’L BASELINE
When a person takes antibiotics, good bacteria that protect against infection are destroyed for several months. During this time, patients can get sick from Clostridium difficile (C. difficile), bacteria that cause potentially deadly diarrhea, which can be spread in healthcare settings.
33%Among the 72 hospitals in New Jersey with enough data to calculate an SIR, 33% had an SIR significantly worse than the national SIR of 0.90.
THIS REPORT IS BASED ON 2013 DATA, PUBLISHED JANUARY 2015

N E W J E R S E YHEALTHCARE-ASSOCIATED INFECTION (HAI) DATA give healthcare facilities and public health agencies knowledge to design, implement, and evaluate HAI prevention efforts.
LEGEND
2013 state SIR is significantly lower (better) than comparison group
in column header
or
Change in 2013 state SIR compared to group in column header is not statistically significant
2013 state SIR is significantly higher (worse) than comparison group in
column header
2013 state SIR cannot be calculated
HAI TYPE# OF NEW JERSEY
HOSPITALS THAT REPORTED DATA TO CDC’S NHSN, 2013
Total Hospitals in State: 94+
2013 STATE SIR vs.
2012 State SIR‡
2013 STATE SIR vs.
2013 Nat’l SIR
2013 STATE SIR vs.
Nat’l Baseline
2013 STATE SIR
2013 NAT’L SIR
CLABSI Nat’l Baseline: 2008
72 13% 14% 39% 0.61 0.54
CAUTI Nat’l Baseline: 2009
72 16% 4% 2% 1.02 1.06
SSI, Abdominal Hysterectomy Nat’l Baseline: 2008
66 18% 3% 17% 0.83 0.86
SSI, Colon Surgery Nat’l Baseline: 2008
72 37% 7% 14% 0.86 0.92
MRSA Bacteremia Nat’l Baseline: 2011
72 2012 SIR not available
25% 14% 1.14 0.92
C. difficile Infections Nat’l Baseline: 2011
72 2012 SIR not available
14% 2% 1.02 0.90
+Not all hospitals are required to report these infections; for example, some hospitals do not use central lines or urinary catheters, or do not perform colon or abdominal hysterectomy surgeries. ‡The state’s 2012 SIR can be found in the data tables of this report. Nat’l baseline time period varies by infection type. See first column of this table for specifics.
WHAT IS THE STANDARDIZED INFECTION RATIO?
The standardized infection ratio (SIR) is a summary statistic that can be used to track HAI prevention progress over time; lower SIRs are better. The SIR for a facility or state is adjusted to account for factors that might cause infection rates to be higher or lower, such as hospital size, teaching status, the type of patients a hospital serves, and surgery and patient characteristics.
WHAT IS NEW JERSEY DOING TO PREVENT HEALTHCARE-ASSOCIATED INFECTIONS?
New Jersey has a state mandate to publicly report at least one HAI to NHSN.
Prevention efforts to reduce specific HAIs:
■ Central line-associated bloodstream infections ■ Catheter-associated urinary tract infections ■ Surgical site infections
■ Antibiotic stewardship ■ Healthcare personnel influenza vaccination
Learn how your hospital is performing: www.medicare.gov/hospitalcompare For additional information:
■ 2013 HAI Progress Report: www.cdc.gov/hai/progress-report/ ■ NHSN: www.cdc.gov/nhsn ■ HAIs and prevention activities in New Jersey: www.state.nj.us/health/hais/index.shtml ■ New Jersey validation efforts: www.cdc.gov/hai/pdfs/state-progress-landscape.pdf
THIS REPORT IS BASED ON 2013 DATA, PUBLISHED JANUARY 2015
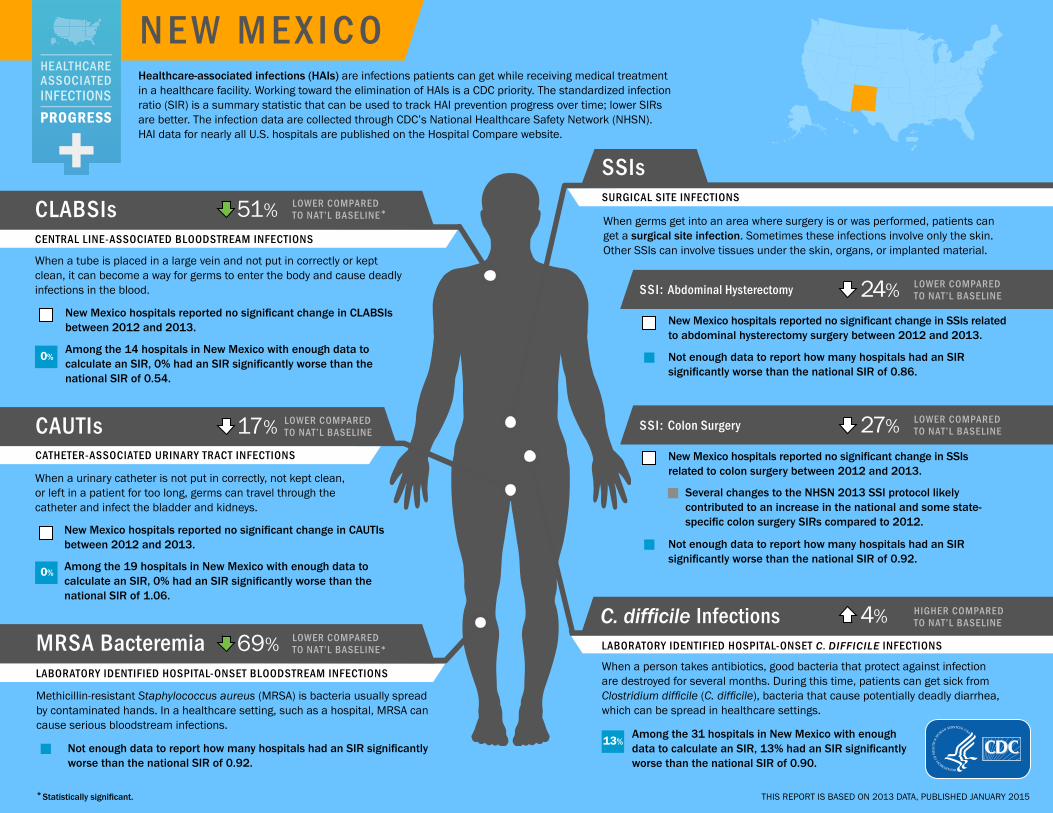
N E W M E X I C OHealthcare-associated infections (HAIs) are infections patients can get while receiving medical treatment in a healthcare facility. Working toward the elimination of HAIs is a CDC priority. The standardized infection ratio (SIR) is a summary statistic that can be used to track HAI prevention progress over time; lower SIRs are better. The infection data are collected through CDC’s National Healthcare Safety Network (NHSN). HAI data for nearly all U.S. hospitals are published on the Hospital Compare website.
CLABSIsCENTRAL LINE-ASSOCIATED BLOODSTREAM INFECTIONS
51% LOWER COMPARED TO NAT’L BASELINE*
*Statistically significant.
When a tube is placed in a large vein and not put in correctly or kept clean, it can become a way for germs to enter the body and cause deadly infections in the blood.
New Mexico hospitals reported no significant change in CLABSIs between 2012 and 2013.
0%Among the 14 hospitals in New Mexico with enough data to calculate an SIR, 0% had an SIR significantly worse than the national SIR of 0.54.
CAUTIsCATHETER-ASSOCIATED URINARY TRACT INFECTIONS
17% LOWER COMPARED TO NAT’L BASELINE
When a urinary catheter is not put in correctly, not kept clean, or left in a patient for too long, germs can travel through the catheter and infect the bladder and kidneys.
New Mexico hospitals reported no significant change in CAUTIs between 2012 and 2013.
0% Among the 19 hospitals in New Mexico with enough data to calculate an SIR, 0% had an SIR significantly worse than the national SIR of 1.06.
MRSA BacteremiaLABORATORY IDENTIFIED HOSPITAL-ONSET BLOODSTREAM INFECTIONS
69% LOWER COMPARED TO NAT’L BASELINE*
Methicillin-resistant Staphylococcus aureus (MRSA) is bacteria usually spread by contaminated hands. In a healthcare setting, such as a hospital, MRSA can cause serious bloodstream infections.
Not enough data to report how many hospitals had an SIR significantly worse than the national SIR of 0.92.
SSIsSURGICAL SITE INFECTIONS
When germs get into an area where surgery is or was performed, patients can get a surgical site infection. Sometimes these infections involve only the skin. Other SSIs can involve tissues under the skin, organs, or implanted material.
SSI: Abdominal Hysterectomy 24% LOWER COMPARED TO NAT’L BASELINE
New Mexico hospitals reported no significant change in SSIs related to abdominal hysterectomy surgery between 2012 and 2013.
Not enough data to report how many hospitals had an SIR significantly worse than the national SIR of 0.86.
SSI: Colon Surgery 27% LOWER COMPARED TO NAT’L BASELINE
New Mexico hospitals reported no significant change in SSIs related to colon surgery between 2012 and 2013.
Several changes to the NHSN 2013 SSI protocol likely contributed to an increase in the national and some state- specific colon surgery SIRs compared to 2012.
Not enough data to report how many hospitals had an SIR significantly worse than the national SIR of 0.92.
C. difficile InfectionsLABORATORY IDENTIFIED HOSPITAL-ONSET C. DIFFICILE INFECTIONS
4% HIGHER COMPARED TO NAT’L BASELINE
When a person takes antibiotics, good bacteria that protect against infection are destroyed for several months. During this time, patients can get sick from Clostridium difficile (C. difficile), bacteria that cause potentially deadly diarrhea, which can be spread in healthcare settings.
13%Among the 31 hospitals in New Mexico with enough data to calculate an SIR, 13% had an SIR significantly worse than the national SIR of 0.90.
THIS REPORT IS BASED ON 2013 DATA, PUBLISHED JANUARY 2015

N E W M E X I C OHEALTHCARE-ASSOCIATED INFECTION (HAI) DATA give healthcare facilities and public health agencies knowledge to design, implement, and evaluate HAI prevention efforts.
LEGEND
2013 state SIR is significantly lower (better) than comparison group
in column header
or
Change in 2013 state SIR compared to group in column header is not statistically significant
2013 state SIR is significantly higher (worse) than comparison group in
column header
2013 state SIR cannot be calculated
HAI TYPE# OF NEW MEXICO
HOSPITALS THAT REPORTED DATA TO CDC’S NHSN, 2013
Total Hospitals in State: 48+
2013 STATE SIR vs.
2012 State SIR‡
2013 STATE SIR vs.
2013 Nat’l SIR
2013 STATE SIR vs.
Nat’l Baseline
2013 STATE SIR
2013 NAT’L SIR
CLABSI Nat’l Baseline: 2008
36 21% 10% 51% 0.49 0.54
CAUTI Nat’l Baseline: 2009
35 14% 21% 17% 0.83 1.06
SSI, Abdominal Hysterectomy Nat’l Baseline: 2008
26 7% 12% 24% 0.76 0.86
SSI, Colon Surgery Nat’l Baseline: 2008
27 26% 20% 27% 0.74 0.92
MRSA Bacteremia Nat’l Baseline: 2011
37 2012 SIR not available
67% 69% 0.31 0.92
C. difficile Infections Nat’l Baseline: 2011
39 2012 SIR not available
15% 4% 1.04 0.90
+Not all hospitals are required to report these infections; for example, some hospitals do not use central lines or urinary catheters, or do not perform colon or abdominal hysterectomy surgeries. ‡The state’s 2012 SIR can be found in the data tables of this report. Nat’l baseline time period varies by infection type. See first column of this table for specifics.
WHAT IS THE STANDARDIZED INFECTION RATIO?
The standardized infection ratio (SIR) is a summary statistic that can be used to track HAI prevention progress over time; lower SIRs are better. The SIR for a facility or state is adjusted to account for factors that might cause infection rates to be higher or lower, such as hospital size, teaching status, the type of patients a hospital serves, and surgery and patient characteristics.
WHAT IS NEW MEXICO DOING TO PREVENT HEALTHCARE-ASSOCIATED INFECTIONS?
New Mexico has a state mandate to publicly report at least one HAI to NHSN. New Mexico is one of 10 state health departments participating in CDC’s Emerging Infections Program, which allows for extra surveillance and research of HAIs.
Prevention efforts to reduce specific HAIs:
■ Central line-associated bloodstream infections ■ Catheter-associated urinary tract infections
■ Surgical site infections ■ Multidrug-resistant infections (C. difficile, CRE) ■ Long-term care facilities ■ Hand hygiene ■ Antibiotic stewardship ■ Healthcare personnel influenza vaccination
Learn how your hospital is performing: www.medicare.gov/hospitalcompare For additional information:
■ 2013 HAI Progress Report: www.cdc.gov/hai/progress-report/ ■ NHSN: www.cdc.gov/nhsn ■ HAIs and prevention activities in New Mexico: nmhealth.org/about/erd/ideb/hai/ ■ New Mexico validation efforts: www.cdc.gov/hai/pdfs/state-progress-landscape.pdf
THIS REPORT IS BASED ON 2013 DATA, PUBLISHED JANUARY 2015
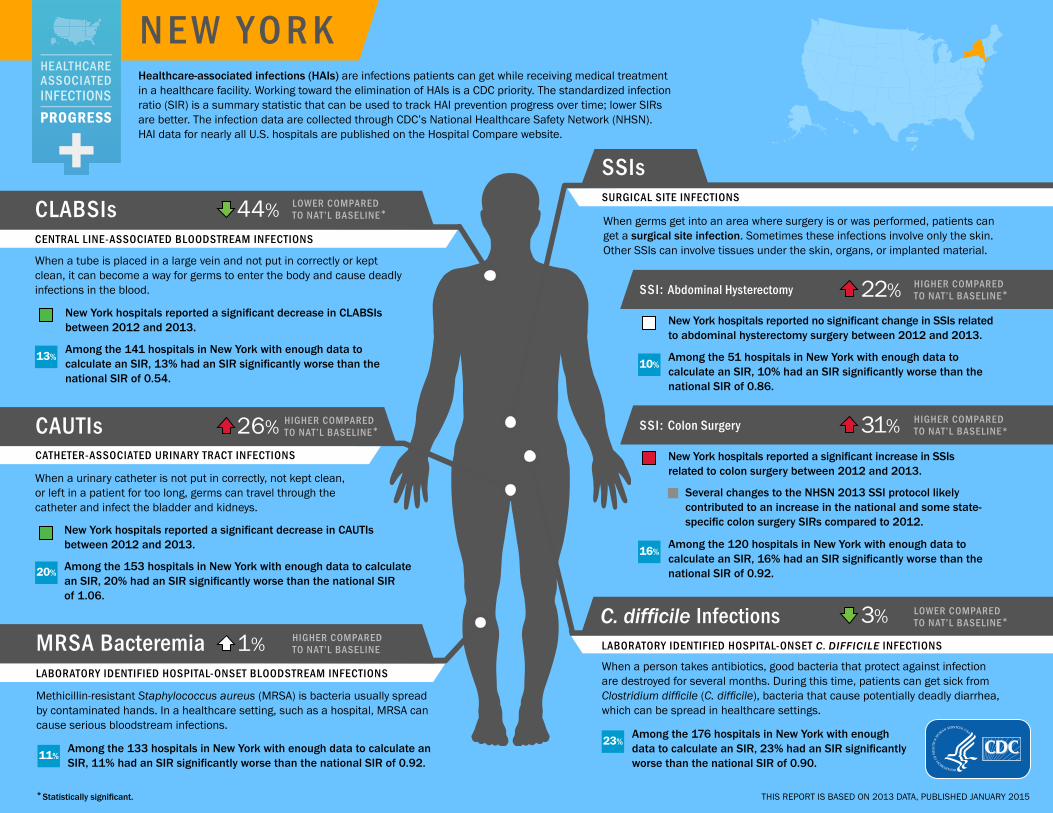
N E W Y O R KHealthcare-associated infections (HAIs) are infections patients can get while receiving medical treatment in a healthcare facility. Working toward the elimination of HAIs is a CDC priority. The standardized infection ratio (SIR) is a summary statistic that can be used to track HAI prevention progress over time; lower SIRs are better. The infection data are collected through CDC’s National Healthcare Safety Network (NHSN). HAI data for nearly all U.S. hospitals are published on the Hospital Compare website.
CLABSIsCENTRAL LINE-ASSOCIATED BLOODSTREAM INFECTIONS
44% LOWER COMPARED TO NAT’L BASELINE*
*Statistically significant.
When a tube is placed in a large vein and not put in correctly or kept clean, it can become a way for germs to enter the body and cause deadly infections in the blood.
New York hospitals reported a significant decrease in CLABSIs between 2012 and 2013.
13%Among the 141 hospitals in New York with enough data to calculate an SIR, 13% had an SIR significantly worse than the national SIR of 0.54.
CAUTIsCATHETER-ASSOCIATED URINARY TRACT INFECTIONS
26% HIGHER COMPARED TO NAT’L BASELINE*
When a urinary catheter is not put in correctly, not kept clean, or left in a patient for too long, germs can travel through the catheter and infect the bladder and kidneys.
New York hospitals reported a significant decrease in CAUTIs between 2012 and 2013.
20% Among the 153 hospitals in New York with enough data to calculate an SIR, 20% had an SIR significantly worse than the national SIR of 1.06.
MRSA BacteremiaLABORATORY IDENTIFIED HOSPITAL-ONSET BLOODSTREAM INFECTIONS
1% HIGHER COMPARED TO NAT’L BASELINE
Methicillin-resistant Staphylococcus aureus (MRSA) is bacteria usually spread by contaminated hands. In a healthcare setting, such as a hospital, MRSA can cause serious bloodstream infections.
11%Among the 133 hospitals in New York with enough data to calculate an SIR, 11% had an SIR significantly worse than the national SIR of 0.92.
SSIsSURGICAL SITE INFECTIONS
When germs get into an area where surgery is or was performed, patients can get a surgical site infection. Sometimes these infections involve only the skin. Other SSIs can involve tissues under the skin, organs, or implanted material.
SSI: Abdominal Hysterectomy 22% HIGHER COMPARED TO NAT’L BASELINE*
New York hospitals reported no significant change in SSIs related to abdominal hysterectomy surgery between 2012 and 2013.
10%Among the 51 hospitals in New York with enough data to calculate an SIR, 10% had an SIR significantly worse than the national SIR of 0.86.
SSI: Colon Surgery 31% HIGHER COMPARED TO NAT’L BASELINE*
New York hospitals reported a significant increase in SSIs related to colon surgery between 2012 and 2013.
Several changes to the NHSN 2013 SSI protocol likely contributed to an increase in the national and some state- specific colon surgery SIRs compared to 2012.
16%Among the 120 hospitals in New York with enough data to calculate an SIR, 16% had an SIR significantly worse than the national SIR of 0.92.
C. difficile InfectionsLABORATORY IDENTIFIED HOSPITAL-ONSET C. DIFFICILE INFECTIONS
3% LOWER COMPARED TO NAT’L BASELINE*
When a person takes antibiotics, good bacteria that protect against infection are destroyed for several months. During this time, patients can get sick from Clostridium difficile (C. difficile), bacteria that cause potentially deadly diarrhea, which can be spread in healthcare settings.
23%Among the 176 hospitals in New York with enough data to calculate an SIR, 23% had an SIR significantly worse than the national SIR of 0.90.
THIS REPORT IS BASED ON 2013 DATA, PUBLISHED JANUARY 2015

N E W Y O R KHEALTHCARE-ASSOCIATED INFECTION (HAI) DATA give healthcare facilities and public health agencies knowledge to design, implement, and evaluate HAI prevention efforts.
LEGEND
2013 state SIR is significantly lower (better) than comparison group
in column header
or
Change in 2013 state SIR compared to group in column header is not statistically significant
2013 state SIR is significantly higher (worse) than comparison group in
column header
2013 state SIR cannot be calculated
HAI TYPE# OF NEW YORK
HOSPITALS THAT REPORTED DATA TO CDC’S NHSN, 2013
Total Hospitals in State: 251+
2013 STATE SIR vs.
2012 State SIR‡
2013 STATE SIR vs.
2013 Nat’l SIR
2013 STATE SIR vs.
Nat’l Baseline
2013 STATE SIR
2013 NAT’L SIR
CLABSI Nat’l Baseline: 2008
172 11% 5% 44% 0.56 0.54
CAUTI Nat’l Baseline: 2009
172 7% 21% 26% 1.26 1.06
SSI, Abdominal Hysterectomy Nat’l Baseline: 2008
158 9% 45% 22% 1.22 0.86
SSI, Colon Surgery Nat’l Baseline: 2008
171 52% 47% 31% 1.31 0.92
MRSA Bacteremia Nat’l Baseline: 2011
179 2012 SIR not available
11% 1% 1.01 0.92
C. difficile Infections Nat’l Baseline: 2011
180 2012 SIR not available
9% 3% 0.97 0.90
+Not all hospitals are required to report these infections; for example, some hospitals do not use central lines or urinary catheters, or do not perform colon or abdominal hysterectomy surgeries. ‡The state’s 2012 SIR can be found in the data tables of this report. Nat’l baseline time period varies by infection type. See first column of this table for specifics.
WHAT IS THE STANDARDIZED INFECTION RATIO?
The standardized infection ratio (SIR) is a summary statistic that can be used to track HAI prevention progress over time; lower SIRs are better. The SIR for a facility or state is adjusted to account for factors that might cause infection rates to be higher or lower, such as hospital size, teaching status, the type of patients a hospital serves, and surgery and patient characteristics.
WHAT IS NEW YORK DOING TO PREVENT HEALTHCARE-ASSOCIATED INFECTIONS?
New York has a state mandate to publicly report at least one HAI to NHSN. New York is one of 10 state health departments participating in CDC’s Emerging Infections Program, which allows for extra surveillance and research of HAIs.
Prevention efforts to reduce specific HAIs:
■ Central line-associated bloodstream infections ■ Catheter-associated urinary tract infections
■ Surgical site infections ■ Multidrug-resistant infections (C. difficile, CRE) ■ Long-term care facilities ■ Antibiotic stewardship ■ Healthcare personnel influenza vaccination
Learn how your hospital is performing: www.medicare.gov/hospitalcompare For additional information:
■ 2013 HAI Progress Report: www.cdc.gov/hai/progress-report/ ■ NHSN: www.cdc.gov/nhsn ■ HAIs and prevention activities in New York: www.health.ny.gov/statistics/facilities/hospital/hospital_
acquired_infections/ ■ New York validation efforts: www.cdc.gov/hai/pdfs/state-progress-landscape.pdf
THIS REPORT IS BASED ON 2013 DATA, PUBLISHED JANUARY 2015

N O R T H C A R O L I N AHealthcare-associated infections (HAIs) are infections patients can get while receiving medical treatment in a healthcare facility. Working toward the elimination of HAIs is a CDC priority. The standardized infection ratio (SIR) is a summary statistic that can be used to track HAI prevention progress over time; lower SIRs are better. The infection data are collected through CDC’s National Healthcare Safety Network (NHSN). HAI data for nearly all U.S. hospitals are published on the Hospital Compare website.
CLABSIsCENTRAL LINE-ASSOCIATED BLOODSTREAM INFECTIONS
47% LOWER COMPARED TO NAT’L BASELINE*
*Statistically significant.
When a tube is placed in a large vein and not put in correctly or kept clean, it can become a way for germs to enter the body and cause deadly infections in the blood.
North Carolina hospitals reported no significant change in CLABSIs between 2012 and 2013.
7%Among the 60 hospitals in North Carolina with enough data to calculate an SIR, 7% had an SIR significantly worse than the national SIR of 0.54.
CAUTIsCATHETER-ASSOCIATED URINARY TRACT INFECTIONS
14% HIGHER COMPARED TO NAT’L BASELINE*
When a urinary catheter is not put in correctly, not kept clean, or left in a patient for too long, germs can travel through the catheter and infect the bladder and kidneys.
North Carolina hospitals reported no significant change in CAUTIs between 2012 and 2013.
13% Among the 77 hospitals in North Carolina with enough data to calculate an SIR, 13% had an SIR significantly worse than the national SIRof 1.06.
MRSA BacteremiaLABORATORY IDENTIFIED HOSPITAL-ONSET BLOODSTREAM INFECTIONS
6% LOWER COMPARED TO NAT’L BASELINE
Methicillin-resistant Staphylococcus aureus (MRSA) is bacteria usually spread by contaminated hands. In a healthcare setting, such as a hospital, MRSA can cause serious bloodstream infections.
2%Among the 57 hospitals in North Carolina with enough data to calculate an SIR, 2% had an SIR significantly worse than the national SIR of 0.92.
SSIsSURGICAL SITE INFECTIONS
When germs get into an area where surgery is or was performed, patients can get a surgical site infection. Sometimes these infections involve only the skin. Other SSIs can involve tissues under the skin, organs, or implanted material.
SSI: Abdominal Hysterectomy 2% HIGHER COMPARED TO NAT’L BASELINE
North Carolina hospitals reported no significant change in SSIs related to abdominal hysterectomy surgery between 2012 and 2013.
13%Among the 23 hospitals in North Carolina with enough data to calculate an SIR, 13% had an SIR significantly worse than the national SIR of 0.86.
SSI: Colon Surgery 9% LOWER COMPARED TO NAT’L BASELINE
North Carolina hospitals reported no significant change in SSIs related to colon surgery between 2012 and 2013.
Several changes to the NHSN 2013 SSI protocol likely contributed to an increase in the national and some state- specific colon surgery SIRs compared to 2012.
9%Among the 55 hospitals in North Carolina with enough data to calculate an SIR, 9% had an SIR significantly worse than the national SIR of 0.92.
C. difficile InfectionsLABORATORY IDENTIFIED HOSPITAL-ONSET C. DIFFICILE INFECTIONS
19% LOWER COMPARED TO NAT’L BASELINE*
When a person takes antibiotics, good bacteria that protect against infection are destroyed for several months. During this time, patients can get sick from Clostridium difficile (C. difficile), bacteria that cause potentially deadly diarrhea, which can be spread in healthcare settings.
6%Among the 96 hospitals in North Carolina with enough data to calculate an SIR, 6% had an SIR significantly worse than the national SIR of 0.90.
THIS REPORT IS BASED ON 2013 DATA, PUBLISHED JANUARY 2015

N O R T H C A R O L I N AHEALTHCARE-ASSOCIATED INFECTION (HAI) DATA give healthcare facilities and public health agencies knowledge to design, implement, and evaluate HAI prevention efforts.
LEGEND
2013 state SIR is significantly lower (better) than comparison group
in column header
or
Change in 2013 state SIR compared to group in column header is not statistically significant
2013 state SIR is significantly higher (worse) than comparison group in
column header
2013 state SIR cannot be calculated
HAI TYPE# OF NORTH CAROLINA
HOSPITALS THAT REPORTED DATA TO CDC’S NHSN, 2013
Total Hospitals in State: 133+
2013 STATE SIR vs.
2012 State SIR‡
2013 STATE SIR vs.
2013 Nat’l SIR
2013 STATE SIR vs.
Nat’l Baseline
2013 STATE SIR
2013 NAT’L SIR
CLABSI Nat’l Baseline: 2008
98 4% 1% 47% 0.53 0.54
CAUTI Nat’l Baseline: 2009
98 4% 8% 14% 1.14 1.06
SSI, Abdominal Hysterectomy Nat’l Baseline: 2008
89 33% 19% 2% 1.02 0.86
SSI, Colon Surgery Nat’l Baseline: 2008
93 18% 1% 9% 0.91 0.92
MRSA Bacteremia Nat’l Baseline: 2011
100 2012 SIR not available
3% 6% 0.94 0.92
C. difficile Infections Nat’l Baseline: 2011
100 2012 SIR not available
10% 19% 0.81 0.90
+Not all hospitals are required to report these infections; for example, some hospitals do not use central lines or urinary catheters, or do not perform colon or abdominal hysterectomy surgeries. ‡The state’s 2012 SIR can be found in the data tables of this report. Nat’l baseline time period varies by infection type. See first column of this table for specifics.
WHAT IS THE STANDARDIZED INFECTION RATIO?
The standardized infection ratio (SIR) is a summary statistic that can be used to track HAI prevention progress over time; lower SIRs are better. The SIR for a facility or state is adjusted to account for factors that might cause infection rates to be higher or lower, such as hospital size, teaching status, the type of patients a hospital serves, and surgery and patient characteristics.
WHAT IS NORTH CAROLINA DOING TO PREVENT HEALTHCARE-ASSOCIATED INFECTIONS?
North Carolina has a state mandate to publicly report at least one HAI to NHSN.
Prevention efforts to reduce specific HAIs:
■ Central line-associated bloodstream infections ■ Catheter-associated urinary tract infections ■ Surgical site infections ■ Antibiotic stewardship
Learn how your hospital is performing: www.medicare.gov/hospitalcompare For additional information:
■ 2013 HAI Progress Report: www.cdc.gov/hai/progress-report/ ■ NHSN: www.cdc.gov/nhsn ■ HAIs and prevention activities in North Carolina: epi.publichealth.nc.gov/cd/diseases/hai.html ■ North Carolina validation efforts: www.cdc.gov/hai/pdfs/state-progress-landscape.pdf
THIS REPORT IS BASED ON 2013 DATA, PUBLISHED JANUARY 2015

N O R T H D A K O TAHealthcare-associated infections (HAIs) are infections patients can get while receiving medical treatment in a healthcare facility. Working toward the elimination of HAIs is a CDC priority. The standardized infection ratio (SIR) is a summary statistic that can be used to track HAI prevention progress over time; lower SIRs are better. The infection data are collected through CDC’s National Healthcare Safety Network (NHSN). HAI data for nearly all U.S. hospitals are published on the Hospital Compare website.
CLABSIsCENTRAL LINE-ASSOCIATED BLOODSTREAM INFECTIONS
63% LOWER COMPARED TO NAT’L BASELINE*
*Statistically significant.
When a tube is placed in a large vein and not put in correctly or kept clean, it can become a way for germs to enter the body and cause deadly infections in the blood.
North Dakota hospitals reported no significant change in CLABSIs between 2012 and 2013.
Not enough data to report how many hospitals had an SIR significantly worse than the national SIR of 0.54.
CAUTIsCATHETER-ASSOCIATED URINARY TRACT INFECTIONS
30% LOWER COMPARED TO NAT’L BASELINE*
When a urinary catheter is not put in correctly, not kept clean, or left in a patient for too long, germs can travel through the catheter and infect the bladder and kidneys.
North Dakota hospitals reported no significant change in CAUTIs between 2012 and 2013.
Not enough data to report how many hospitals had an SIR significantly worse than the national SIR of 1.06.
MRSA BacteremiaLABORATORY IDENTIFIED HOSPITAL-ONSET BLOODSTREAM INFECTIONS
16% HIGHER COMPARED TO NAT’L BASELINE
Methicillin-resistant Staphylococcus aureus (MRSA) is bacteria usually spread by contaminated hands. In a healthcare setting, such as a hospital, MRSA can cause serious bloodstream infections.
Not enough data to report how many hospitals had an SIR significantly worse than the national SIR of 0.92.
SSIsSURGICAL SITE INFECTIONS
When germs get into an area where surgery is or was performed, patients can get a surgical site infection. Sometimes these infections involve only the skin. Other SSIs can involve tissues under the skin, organs, or implanted material.
SSI: Abdominal Hysterectomy 58% HIGHER COMPARED TO NAT’L BASELINE
North Dakota hospitals reported no significant change in SSIs related to abdominal hysterectomy surgery between 2012 and 2013.
Not enough data to report how many hospitals had an SIR significantly worse than the national SIR of 0.86.
SSI: Colon Surgery 20% HIGHER COMPARED TO NAT’L BASELINE
North Dakota hospitals reported no significant change in SSIs related to colon surgery between 2012 and 2013.
Several changes to the NHSN 2013 SSI protocol likely contributed to an increase in the national and some state- specific colon surgery SIRs compared to 2012.
Not enough data to report how many hospitals had an SIR significantly worse than the national SIR of 0.92.
C. difficile InfectionsLABORATORY IDENTIFIED HOSPITAL-ONSET C. DIFFICILE INFECTIONS
19% LOWER COMPARED TO NAT’L BASELINE*
When a person takes antibiotics, good bacteria that protect against infection are destroyed for several months. During this time, patients can get sick from Clostridium difficile (C. difficile), bacteria that cause potentially deadly diarrhea, which can be spread in healthcare settings.
Not enough data to report how many hospitals had an SIR significantly worse than the national SIR of 0.90.
THIS REPORT IS BASED ON 2013 DATA, PUBLISHED JANUARY 2015

N O R T H D A K O TAHEALTHCARE-ASSOCIATED INFECTION (HAI) DATA give healthcare facilities and public health agencies knowledge to design, implement, and evaluate HAI prevention efforts.
LEGEND
2013 state SIR is significantly lower (better) than comparison group
in column header
or
Change in 2013 state SIR compared to group in column header is not statistically significant
2013 state SIR is significantly higher (worse) than comparison group in
column header
2013 state SIR cannot be calculated
HAI TYPE# OF NORTH DAKOTA
HOSPITALS THAT REPORTED DATA TO CDC’S NHSN, 2013
Total Hospitals in State: 48+
2013 STATE SIR vs.
2012 State SIR‡
2013 STATE SIR vs.
2013 Nat’l SIR
2013 STATE SIR vs.
Nat’l Baseline
2013 STATE SIR
2013 NAT’L SIR
CLABSI Nat’l Baseline: 2008
6 2% 30% 63% 0.37 0.54
CAUTI Nat’l Baseline: 2009
6 11% 34% 30% 0.70 1.06
SSI, Abdominal Hysterectomy Nat’l Baseline: 2008
6 50% 84% 58% 1.58 0.86
SSI, Colon Surgery Nat’l Baseline: 2008
6 24% 30% 20% 1.20 0.92
MRSA Bacteremia Nat’l Baseline: 2011
11 2012 SIR not available
27% 16% 1.16 0.92
C. difficile Infections Nat’l Baseline: 2011
11 2012 SIR not available
10% 19% 0.81 0.90
+Not all hospitals are required to report these infections; for example, some hospitals do not use central lines or urinary catheters, or do not perform colon or abdominal hysterectomy surgeries. ‡The state’s 2012 SIR can be found in the data tables of this report. Nat’l baseline time period varies by infection type. See first column of this table for specifics.
WHAT IS THE STANDARDIZED INFECTION RATIO?
The standardized infection ratio (SIR) is a summary statistic that can be used to track HAI prevention progress over time; lower SIRs are better. The SIR for a facility or state is adjusted to account for factors that might cause infection rates to be higher or lower, such as hospital size, teaching status, the type of patients a hospital serves, and surgery and patient characteristics.
WHAT IS NORTH DAKOTA DOING TO PREVENT HEALTHCARE-ASSOCIATED INFECTIONS?
Prevention efforts to reduce specific HAIs:
■ Central line-associated bloodstream infections ■ Catheter-associated urinary tract infections ■ Surgical site infections ■ Multidrug-resistant infections
(MRSA, C. difficile, CRE, and others)
■ Long-term care facilities ■ Hand hygiene ■ Antibiotic stewardship ■ Healthcare personnel influenza vaccination
Learn how your hospital is performing: www.medicare.gov/hospitalcompare For additional information:
■ 2013 HAI Progress Report: www.cdc.gov/hai/progress-report/ ■ NHSN: www.cdc.gov/nhsn ■ HAIs and prevention activities in North Dakota: www.ndhealth.gov/disease/hai/ ■ North Dakota validation efforts: www.cdc.gov/hai/pdfs/state-progress-landscape.pdf
THIS REPORT IS BASED ON 2013 DATA, PUBLISHED JANUARY 2015

O H I OHealthcare-associated infections (HAIs) are infections patients can get while receiving medical treatment in a healthcare facility. Working toward the elimination of HAIs is a CDC priority. The standardized infection ratio (SIR) is a summary statistic that can be used to track HAI prevention progress over time; lower SIRs are better. The infection data are collected through CDC’s National Healthcare Safety Network (NHSN). HAI data for nearly all U.S. hospitals are published on the Hospital Compare website.
CLABSIsCENTRAL LINE-ASSOCIATED BLOODSTREAM INFECTIONS
58% LOWER COMPARED TO NAT’L BASELINE*
*Statistically significant.
When a tube is placed in a large vein and not put in correctly or kept clean, it can become a way for germs to enter the body and cause deadly infections in the blood.
Ohio hospitals reported no significant change in CLABSIs between 2012 and 2013.
3%Among the 92 hospitals in Ohio with enough data to calculate an SIR, 3% had an SIR significantly worse than the national SIR of 0.54.
CAUTIsCATHETER-ASSOCIATED URINARY TRACT INFECTIONS
8% LOWER COMPARED TO NAT’L BASELINE*
When a urinary catheter is not put in correctly, not kept clean, or left in a patient for too long, germs can travel through the catheter and infect the bladder and kidneys.
Ohio hospitals reported no significant change in CAUTIs between 2012 and 2013.
9% Among the 105 hospitals in Ohio with enough data to calculate an SIR, 9% had an SIR significantly worse than the national SIR of 1.06.
MRSA BacteremiaLABORATORY IDENTIFIED HOSPITAL-ONSET BLOODSTREAM INFECTIONS
16% LOWER COMPARED TO NAT’L BASELINE*
Methicillin-resistant Staphylococcus aureus (MRSA) is bacteria usually spread by contaminated hands. In a healthcare setting, such as a hospital, MRSA can cause serious bloodstream infections.
3%Among the 87 hospitals in Ohio with enough data to calculate an SIR, 3% had an SIR significantly worse than the national SIR of 0.92.
SSIsSURGICAL SITE INFECTIONS
When germs get into an area where surgery is or was performed, patients can get a surgical site infection. Sometimes these infections involve only the skin. Other SSIs can involve tissues under the skin, organs, or implanted material.
SSI: Abdominal Hysterectomy 36% LOWER COMPARED TO NAT’L BASELINE*
Ohio hospitals reported no significant change in SSIs related to abdominal hysterectomy surgery between 2012 and 2013.
3%Among the 39 hospitals in Ohio with enough data to calculate an SIR, 3% had an SIR significantly worse than the national SIR of 0.86.
SSI: Colon Surgery 9% LOWER COMPARED TO NAT’L BASELINE
Ohio hospitals reported a significant increase in SSIs related to colon surgery between 2012 and 2013.
Several changes to the NHSN 2013 SSI protocol likely contributed to an increase in the national and some state- specific colon surgery SIRs compared to 2012.
8%Among the 89 hospitals in Ohio with enough data to calculate an SIR, 8% had an SIR significantly worse than the national SIR of 0.92.
C. difficile InfectionsLABORATORY IDENTIFIED HOSPITAL-ONSET C. DIFFICILE INFECTIONS
7% LOWER COMPARED TO NAT’L BASELINE*
When a person takes antibiotics, good bacteria that protect against infection are destroyed for several months. During this time, patients can get sick from Clostridium difficile (C. difficile), bacteria that cause potentially deadly diarrhea, which can be spread in healthcare settings.
16%Among the 135 hospitals in Ohio with enough data to calculate an SIR, 16% had an SIR significantly worse than the national SIR of 0.90.
THIS REPORT IS BASED ON 2013 DATA, PUBLISHED JANUARY 2015

O H I OHEALTHCARE-ASSOCIATED INFECTION (HAI) DATA give healthcare facilities and public health agencies knowledge to design, implement, and evaluate HAI prevention efforts.
LEGEND
2013 state SIR is significantly lower (better) than comparison group
in column header
or
Change in 2013 state SIR compared to group in column header is not statistically significant
2013 state SIR is significantly higher (worse) than comparison group in
column header
2013 state SIR cannot be calculated
HAI TYPE# OF OHIO
HOSPITALS THAT REPORTED DATA TO CDC’S NHSN, 2013
Total Hospitals in State: 203+
2013 STATE SIR vs.
2012 State SIR‡
2013 STATE SIR vs.
2013 Nat’l SIR
2013 STATE SIR vs.
Nat’l Baseline
2013 STATE SIR
2013 NAT’L SIR
CLABSI Nat’l Baseline: 2008
137 5% 23% 58% 0.42 0.54
CAUTI Nat’l Baseline: 2009
136 2% 14% 8% 0.92 1.06
SSI, Abdominal Hysterectomy Nat’l Baseline: 2008
128 27% 26% 36% 0.64 0.86
SSI, Colon Surgery Nat’l Baseline: 2008
131 26% 1% 9% 0.91 0.92
MRSA Bacteremia Nat’l Baseline: 2011
144 2012 SIR not available
8% 16% 0.84 0.92
C. difficile Infections Nat’l Baseline: 2011
144 2012 SIR not available
3% 7% 0.93 0.90
+Not all hospitals are required to report these infections; for example, some hospitals do not use central lines or urinary catheters, or do not perform colon or abdominal hysterectomy surgeries. ‡The state’s 2012 SIR can be found in the data tables of this report. Nat’l baseline time period varies by infection type. See first column of this table for specifics.
WHAT IS THE STANDARDIZED INFECTION RATIO?
The standardized infection ratio (SIR) is a summary statistic that can be used to track HAI prevention progress over time; lower SIRs are better. The SIR for a facility or state is adjusted to account for factors that might cause infection rates to be higher or lower, such as hospital size, teaching status, the type of patients a hospital serves, and surgery and patient characteristics.
WHAT IS OHIO DOING TO PREVENT HEALTHCARE-ASSOCIATED INFECTIONS?
Ohio has a state mandate to publicly report at least one HAI to NHSN.
Prevention efforts to reduce specific HAIs:
■ Central line-associated bloodstream infections ■ Catheter-associated urinary tract infections ■ Surgical site infections ■ Multidrug-resistant infections (MRSA, C. difficile) ■ Long-term care facilities
Learn how your hospital is performing: www.medicare.gov/hospitalcompare For additional information:
■ 2013 HAI Progress Report: www.cdc.gov/hai/progress-report/ ■ NHSN: www.cdc.gov/nhsn ■ HAIs and prevention activities in Ohio: www.odh.ohio.gov/odhprograms/dis/orbitdis/hai/haimain.aspx ■ Ohio validation efforts: www.cdc.gov/hai/pdfs/state-progress-landscape.pdf
THIS REPORT IS BASED ON 2013 DATA, PUBLISHED JANUARY 2015

O K L A H O M AHealthcare-associated infections (HAIs) are infections patients can get while receiving medical treatment in a healthcare facility. Working toward the elimination of HAIs is a CDC priority. The standardized infection ratio (SIR) is a summary statistic that can be used to track HAI prevention progress over time; lower SIRs are better. The infection data are collected through CDC’s National Healthcare Safety Network (NHSN). HAI data for nearly all U.S. hospitals are published on the Hospital Compare website.
CLABSIsCENTRAL LINE-ASSOCIATED BLOODSTREAM INFECTIONS
61% LOWER COMPARED TO NAT’L BASELINE*
*Statistically significant.
When a tube is placed in a large vein and not put in correctly or kept clean, it can become a way for germs to enter the body and cause deadly infections in the blood.
Oklahoma hospitals reported no significant change in CLABSIs between 2012 and 2013.
4%Among the 27 hospitals in Oklahoma with enough data to calculate an SIR, 4% had an SIR significantly worse than the national SIR of 0.54.
CAUTIsCATHETER-ASSOCIATED URINARY TRACT INFECTIONS
23% LOWER COMPARED TO NAT’L BASELINE*
When a urinary catheter is not put in correctly, not kept clean, or left in a patient for too long, germs can travel through the catheter and infect the bladder and kidneys.
Oklahoma hospitals reported a significant increase in CAUTIs between 2012 and 2013.
5% Among the 37 hospitals in Oklahoma with enough data to calculate an SIR, 5% had an SIR significantly worse than the national SIR of 1.06.
MRSA BacteremiaLABORATORY IDENTIFIED HOSPITAL-ONSET BLOODSTREAM INFECTIONS
4% HIGHER COMPARED TO NAT’L BASELINE
Methicillin-resistant Staphylococcus aureus (MRSA) is bacteria usually spread by contaminated hands. In a healthcare setting, such as a hospital, MRSA can cause serious bloodstream infections.
10%Among the 21 hospitals in Oklahoma with enough data to calculate an SIR, 10% had an SIR significantly worse than the national SIR of 0.92.
SSIsSURGICAL SITE INFECTIONS
When germs get into an area where surgery is or was performed, patients can get a surgical site infection. Sometimes these infections involve only the skin. Other SSIs can involve tissues under the skin, organs, or implanted material.
SSI: Abdominal Hysterectomy 50% LOWER COMPARED TO NAT’L BASELINE*
Oklahoma hospitals reported no significant change in SSIs related to abdominal hysterectomy surgery between 2012 and 2013.
Not enough data to report how many hospitals had an SIR significantly worse than the national SIR of 0.86.
SSI: Colon Surgery 15% HIGHER COMPARED TO NAT’L BASELINE
Oklahoma hospitals reported a significant increase in SSIs related to colon surgery between 2012 and 2013.
Several changes to the NHSN 2013 SSI protocol likely contributed to an increase in the national and some state- specific colon surgery SIRs compared to 2012.
12%Among the 25 hospitals in Oklahoma with enough data to calculate an SIR, 12% had an SIR significantly worse than the national SIR of 0.92.
C. difficile InfectionsLABORATORY IDENTIFIED HOSPITAL-ONSET C. DIFFICILE INFECTIONS
11% LOWER COMPARED TO NAT’L BASELINE*
When a person takes antibiotics, good bacteria that protect against infection are destroyed for several months. During this time, patients can get sick from Clostridium difficile (C. difficile), bacteria that cause potentially deadly diarrhea, which can be spread in healthcare settings.
9%Among the 70 hospitals in Oklahoma with enough data to calculate an SIR, 9% had an SIR significantly worse than the national SIR of 0.90.
THIS REPORT IS BASED ON 2013 DATA, PUBLISHED JANUARY 2015

O K L A H O M AHEALTHCARE-ASSOCIATED INFECTION (HAI) DATA give healthcare facilities and public health agencies knowledge to design, implement, and evaluate HAI prevention efforts.
LEGEND
2013 state SIR is significantly lower (better) than comparison group
in column header
or
Change in 2013 state SIR compared to group in column header is not statistically significant
2013 state SIR is significantly higher (worse) than comparison group in
column header
2013 state SIR cannot be calculated
HAI TYPE# OF OKLAHOMA
HOSPITALS THAT REPORTED DATA TO CDC’S NHSN, 2013
Total Hospitals in State: 144+
2013 STATE SIR vs.
2012 State SIR‡
2013 STATE SIR vs.
2013 Nat’l SIR
2013 STATE SIR vs.
Nat’l Baseline
2013 STATE SIR
2013 NAT’L SIR
CLABSI Nat’l Baseline: 2008
53 18% 27% 61% 0.39 0.54
CAUTI Nat’l Baseline: 2009
58 24% 28% 23% 0.77 1.06
SSI, Abdominal Hysterectomy Nat’l Baseline: 2008
62 27% 43% 50% 0.50 0.86
SSI, Colon Surgery Nat’l Baseline: 2008
56 39% 25% 15% 1.15 0.92
MRSA Bacteremia Nat’l Baseline: 2011
91 2012 SIR not available
14% 4% 1.05 0.92
C. difficile Infections Nat’l Baseline: 2011
91 2012 SIR not available
1% 11% 0.89 0.90
+Not all hospitals are required to report these infections; for example, some hospitals do not use central lines or urinary catheters, or do not perform colon or abdominal hysterectomy surgeries. ‡The state’s 2012 SIR can be found in the data tables of this report. Nat’l baseline time period varies by infection type. See first column of this table for specifics.
WHAT IS THE STANDARDIZED INFECTION RATIO?
The standardized infection ratio (SIR) is a summary statistic that can be used to track HAI prevention progress over time; lower SIRs are better. The SIR for a facility or state is adjusted to account for factors that might cause infection rates to be higher or lower, such as hospital size, teaching status, the type of patients a hospital serves, and surgery and patient characteristics.
WHAT IS OKLAHOMA DOING TO PREVENT HEALTHCARE-ASSOCIATED INFECTIONS?
Oklahoma has a state mandate to publicly report at least one HAI to NHSN.
Prevention efforts to reduce specific HAIs:
■ Catheter-associated urinary tract infections
Learn how your hospital is performing: www.medicare.gov/hospitalcompare For additional information:
■ 2013 HAI Progress Report: www.cdc.gov/hai/progress-report/ ■ NHSN: www.cdc.gov/nhsn ■ HAIs and prevention activities in Oklahoma: www.ok.gov/health/Protective_Health/Medical_Facilities_Service/
Quality_Initiatives/Healthcare-Associated_Infections_Prevention_Program/ ■ Oklahoma validation efforts: www.cdc.gov/hai/pdfs/state-progress-landscape.pdf
THIS REPORT IS BASED ON 2013 DATA, PUBLISHED JANUARY 2015

O R E G O NHealthcare-associated infections (HAIs) are infections patients can get while receiving medical treatment in a healthcare facility. Working toward the elimination of HAIs is a CDC priority. The standardized infection ratio (SIR) is a summary statistic that can be used to track HAI prevention progress over time; lower SIRs are better. The infection data are collected through CDC’s National Healthcare Safety Network (NHSN). HAI data for nearly all U.S. hospitals are published on the Hospital Compare website.
CLABSIsCENTRAL LINE-ASSOCIATED BLOODSTREAM INFECTIONS
70% LOWER COMPARED TO NAT’L BASELINE*
*Statistically significant.
When a tube is placed in a large vein and not put in correctly or kept clean, it can become a way for germs to enter the body and cause deadly infections in the blood.
Oregon hospitals reported no significant change in CLABSIs between 2012 and 2013.
4%Among the 23 hospitals in Oregon with enough data to calculate an SIR, 4% had an SIR significantly worse than the national SIR of 0.54.
CAUTIsCATHETER-ASSOCIATED URINARY TRACT INFECTIONS
16% HIGHER COMPARED TO NAT’L BASELINE*
When a urinary catheter is not put in correctly, not kept clean, or left in a patient for too long, germs can travel through the catheter and infect the bladder and kidneys.
Oregon hospitals reported a significant decrease in CAUTIs between 2012 and 2013.
14% Among the 28 hospitals in Oregon with enough data to calculate an SIR, 14% had an SIR significantly worse than the national SIR of 1.06.
MRSA BacteremiaLABORATORY IDENTIFIED HOSPITAL-ONSET BLOODSTREAM INFECTIONS
38% LOWER COMPARED TO NAT’L BASELINE*
Methicillin-resistant Staphylococcus aureus (MRSA) is bacteria usually spread by contaminated hands. In a healthcare setting, such as a hospital, MRSA can cause serious bloodstream infections.
0%Among the 19 hospitals in Oregon with enough data to calculate an SIR, 0% had an SIR significantly worse than the national SIR of 0.92.
SSIsSURGICAL SITE INFECTIONS
When germs get into an area where surgery is or was performed, patients can get a surgical site infection. Sometimes these infections involve only the skin. Other SSIs can involve tissues under the skin, organs, or implanted material.
SSI: Abdominal Hysterectomy 12% HIGHER COMPARED TO NAT’L BASELINE
Oregon hospitals reported a significant increase in SSIs related to abdominal hysterectomy surgery between 2012 and 2013.
Not enough data to report how many hospitals had an SIR significantly worse than the national SIR of 0.86.
SSI: Colon Surgery 25% LOWER COMPARED TO NAT’L BASELINE*
Oregon hospitals reported no significant change in SSIs related to colon surgery between 2012 and 2013.
Several changes to the NHSN 2013 SSI protocol likely contributed to an increase in the national and some state- specific colon surgery SIRs compared to 2012.
0%Among the 23 hospitals in Oregon with enough data to calculate an SIR, 0% had an SIR significantly worse than the national SIR of 0.92.
C. difficile InfectionsLABORATORY IDENTIFIED HOSPITAL-ONSET C. DIFFICILE INFECTIONS
24% LOWER COMPARED TO NAT’L BASELINE*
When a person takes antibiotics, good bacteria that protect against infection are destroyed for several months. During this time, patients can get sick from Clostridium difficile (C. difficile), bacteria that cause potentially deadly diarrhea, which can be spread in healthcare settings.
10%Among the 49 hospitals in Oregon with enough data to calculate an SIR, 10% had an SIR significantly worse than the national SIR of 0.90.
THIS REPORT IS BASED ON 2013 DATA, PUBLISHED JANUARY 2015

O R E G O NHEALTHCARE-ASSOCIATED INFECTION (HAI) DATA give healthcare facilities and public health agencies knowledge to design, implement, and evaluate HAI prevention efforts.
LEGEND
2013 state SIR is significantly lower (better) than comparison group
in column header
or
Change in 2013 state SIR compared to group in column header is not statistically significant
2013 state SIR is significantly higher (worse) than comparison group in
column header
2013 state SIR cannot be calculated
HAI TYPE# OF OREGON
HOSPITALS THAT REPORTED DATA TO CDC’S NHSN, 2013
Total Hospitals in State: 64+
2013 STATE SIR vs.
2012 State SIR‡
2013 STATE SIR vs.
2013 Nat’l SIR
2013 STATE SIR vs.
Nat’l Baseline
2013 STATE SIR
2013 NAT’L SIR
CLABSI Nat’l Baseline: 2008
49 23% 44% 70% 0.30 0.54
CAUTI Nat’l Baseline: 2009
50 18% 9% 16% 1.16 1.06
SSI, Abdominal Hysterectomy Nat’l Baseline: 2008
46 164% 30% 12% 1.12 0.86
SSI, Colon Surgery Nat’l Baseline: 2008
50 5% 18% 25% 0.75 0.92
MRSA Bacteremia Nat’l Baseline: 2011
49 2012 SIR not available
33% 38% 0.62 0.92
C. difficile Infections Nat’l Baseline: 2011
59 2012 SIR not available
16% 24% 0.76 0.90
+Not all hospitals are required to report these infections; for example, some hospitals do not use central lines or urinary catheters, or do not perform colon or abdominal hysterectomy surgeries. ‡The state’s 2012 SIR can be found in the data tables of this report. Nat’l baseline time period varies by infection type. See first column of this table for specifics.
WHAT IS THE STANDARDIZED INFECTION RATIO?
The standardized infection ratio (SIR) is a summary statistic that can be used to track HAI prevention progress over time; lower SIRs are better. The SIR for a facility or state is adjusted to account for factors that might cause infection rates to be higher or lower, such as hospital size, teaching status, the type of patients a hospital serves, and surgery and patient characteristics.
WHAT IS OREGON DOING TO PREVENT HEALTHCARE-ASSOCIATED INFECTIONS?
Oregon has a state mandate to publicly report at least one HAI to NHSN. Oregon is one of 10 state health departments participating in CDC’s Emerging Infections Program, which allows for extra surveillance and research of HAIs.
Prevention efforts to reduce specific HAIs:
■ Central line-associated bloodstream infections ■ Catheter-associated urinary tract infections
■ Surgical site infections ■ Multidrug-resistant infections (MRSA, C. difficile,
CRE, and others) ■ Long-term care facilities ■ Hand hygiene ■ Antibiotic stewardship
Learn how your hospital is performing: www.medicare.gov/hospitalcompare For additional information:
■ 2013 HAI Progress Report: www.cdc.gov/hai/progress-report/ ■ NHSN: www.cdc.gov/nhsn ■ HAIs and prevention activities in Oregon: public.health.oregon.gov/DiseasesConditions/CommunicableDisease/
HAI/Pages/index.aspx ■ Oregon validation efforts: www.cdc.gov/hai/pdfs/state-progress-landscape.pdf
THIS REPORT IS BASED ON 2013 DATA, PUBLISHED JANUARY 2015

P E N N S Y LV A N I AHealthcare-associated infections (HAIs) are infections patients can get while receiving medical treatment in a healthcare facility. Working toward the elimination of HAIs is a CDC priority. The standardized infection ratio (SIR) is a summary statistic that can be used to track HAI prevention progress over time; lower SIRs are better. The infection data are collected through CDC’s National Healthcare Safety Network (NHSN). HAI data for nearly all U.S. hospitals are published on the Hospital Compare website.
CLABSIsCENTRAL LINE-ASSOCIATED BLOODSTREAM INFECTIONS
51% LOWER COMPARED TO NAT’L BASELINE*
*Statistically significant.
When a tube is placed in a large vein and not put in correctly or kept clean, it can become a way for germs to enter the body and cause deadly infections in the blood.
Pennsylvania hospitals reported no significant change in CLABSIs between 2012 and 2013.
6%Among the 127 hospitals in Pennsylvania with enough data to calculate an SIR, 6% had an SIR significantly worse than the national SIR of 0.54.
CAUTIsCATHETER-ASSOCIATED URINARY TRACT INFECTIONS
2% HIGHER COMPARED TO NAT’L BASELINE
When a urinary catheter is not put in correctly, not kept clean, or left in a patient for too long, germs can travel through the catheter and infect the bladder and kidneys.
Pennsylvania hospitals reported a significant increase in CAUTIs between 2012 and 2013.
9% Among the 153 hospitals in Pennsylvania with enough data to calculate an SIR, 9% had an SIR significantly worse than the national SIR of 1.06.
MRSA BacteremiaLABORATORY IDENTIFIED HOSPITAL-ONSET BLOODSTREAM INFECTIONS
8% HIGHER COMPARED TO NAT’L BASELINE
Methicillin-resistant Staphylococcus aureus (MRSA) is bacteria usually spread by contaminated hands. In a healthcare setting, such as a hospital, MRSA can cause serious bloodstream infections.
12%Among the 105 hospitals in Pennsylvania with enough data to calculate an SIR, 12% had an SIR significantly worse than the national SIR of 0.92.
SSIsSURGICAL SITE INFECTIONS
When germs get into an area where surgery is or was performed, patients can get a surgical site infection. Sometimes these infections involve only the skin. Other SSIs can involve tissues under the skin, organs, or implanted material.
SSI: Abdominal Hysterectomy 7% LOWER COMPARED TO NAT’L BASELINE
Pennsylvania hospitals reported no significant change in SSIs related to abdominal hysterectomy surgery between 2012 and 2013.
6%Among the 35 hospitals in Pennsylvania with enough data to calculate an SIR, 6% had an SIR significantly worse than the national SIR of 0.86.
SSI: Colon Surgery 11% LOWER COMPARED TO NAT’L BASELINE*
Pennsylvania hospitals reported no significant change in SSIs related to colon surgery between 2012 and 2013.
Several changes to the NHSN 2013 SSI protocol likely contributed to an increase in the national and some state- specific colon surgery SIRs compared to 2012.
5%Among the 111 hospitals in Pennsylvania with enough data to calculate an SIR, 5% had an SIR significantly worse than the national SIR of 0.92.
C. difficile InfectionsLABORATORY IDENTIFIED HOSPITAL-ONSET C. DIFFICILE INFECTIONS
5% LOWER COMPARED TO NAT’L BASELINE*
When a person takes antibiotics, good bacteria that protect against infection are destroyed for several months. During this time, patients can get sick from Clostridium difficile (C. difficile), bacteria that cause potentially deadly diarrhea, which can be spread in healthcare settings.
15%Among the 158 hospitals in Pennsylvania with enough data to calculate an SIR, 15% had an SIR significantly worse than the national SIR of 0.90.
THIS REPORT IS BASED ON 2013 DATA, PUBLISHED JANUARY 2015

P E N N S Y LV A N I AHEALTHCARE-ASSOCIATED INFECTION (HAI) DATA give healthcare facilities and public health agencies knowledge to design, implement, and evaluate HAI prevention efforts.
LEGEND
2013 state SIR is significantly lower (better) than comparison group
in column header
or
Change in 2013 state SIR compared to group in column header is not statistically significant
2013 state SIR is significantly higher (worse) than comparison group in
column header
2013 state SIR cannot be calculated
HAI TYPE# OF PENNSYLVANIA
HOSPITALS THAT REPORTED DATA TO CDC’S NHSN, 2013
Total Hospitals in State: 221+
2013 STATE SIR vs.
2012 State SIR‡
2013 STATE SIR vs.
2013 Nat’l SIR
2013 STATE SIR vs.
Nat’l Baseline
2013 STATE SIR
2013 NAT’L SIR
CLABSI Nat’l Baseline: 2008
172 1% 9% 51% 0.49 0.54
CAUTI Nat’l Baseline: 2009
184 13% 4% 2% 1.02 1.06
SSI, Abdominal Hysterectomy Nat’l Baseline: 2008
146 4% 8% 7% 0.93 0.86
SSI, Colon Surgery Nat’l Baseline: 2008
160 13% 3% 11% 0.89 0.92
MRSA Bacteremia Nat’l Baseline: 2011
168 2012 SIR not available
18% 8% 1.08 0.92
C. difficile Infections Nat’l Baseline: 2011
167 2012 SIR not available
5% 5% 0.95 0.90
+Not all hospitals are required to report these infections; for example, some hospitals do not use central lines or urinary catheters, or do not perform colon or abdominal hysterectomy surgeries. ‡The state’s 2012 SIR can be found in the data tables of this report. Nat’l baseline time period varies by infection type. See first column of this table for specifics.
WHAT IS THE STANDARDIZED INFECTION RATIO?
The standardized infection ratio (SIR) is a summary statistic that can be used to track HAI prevention progress over time; lower SIRs are better. The SIR for a facility or state is adjusted to account for factors that might cause infection rates to be higher or lower, such as hospital size, teaching status, the type of patients a hospital serves, and surgery and patient characteristics.
WHAT IS PENNSYLVANIA DOING TO PREVENT HEALTHCARE-ASSOCIATED INFECTIONS?
Pennsylvania has a state mandate to publicly report at least one HAI to NHSN.
Prevention efforts to reduce specific HAIs:
■ Central line-associated bloodstream infections ■ Catheter-associated urinary tract infections ■ Surgical site infections
Learn how your hospital is performing: www.medicare.gov/hospitalcompare For additional information:
■ 2013 HAI Progress Report: www.cdc.gov/hai/progress-report/ ■ NHSN: www.cdc.gov/nhsn ■ HAIs and prevention activities in Pennsylvania: www.portal.state.pa.us/portal/server.pt/community/
healthcare_associated_infections/14234 ■ Pennsylvania validation efforts: www.cdc.gov/hai/pdfs/state-progress-landscape.pdf
THIS REPORT IS BASED ON 2013 DATA, PUBLISHED JANUARY 2015

P U E R T O R I C OHealthcare-associated infections (HAIs) are infections patients can get while receiving medical treatment in a healthcare facility. Working toward the elimination of HAIs is a CDC priority. The standardized infection ratio (SIR) is a summary statistic that can be used to track HAI prevention progress over time; lower SIRs are better. The infection data are collected through CDC’s National Healthcare Safety Network (NHSN). HAI data for nearly all U.S. hospitals are published on the Hospital Compare website.
CLABSIsCENTRAL LINE-ASSOCIATED BLOODSTREAM INFECTIONS
22% LOWER COMPARED TO NAT’L BASELINE*
*Statistically significant.
When a tube is placed in a large vein and not put in correctly or kept clean, it can become a way for germs to enter the body and cause deadly infections in the blood.
Puerto Rico hospitals reported a significant decrease in CLABSIs between 2012 and 2013.
8%Among the 12 hospitals in Puerto Rico with enough data to calculate an SIR, 8% had an SIR significantly worse than the national SIR of 0.54.
CAUTIsCATHETER-ASSOCIATED URINARY TRACT INFECTIONS
21% LOWER COMPARED TO NAT’L BASELINE*
When a urinary catheter is not put in correctly, not kept clean, or left in a patient for too long, germs can travel through the catheter and infect the bladder and kidneys.
Puerto Rico hospitals reported a significant decrease in CAUTIs between 2012 and 2013.
6% Among the 17 hospitals in Puerto Rico with enough data to calculate an SIR, 6% had an SIR significantly worse than the national SIR of 1.06.
MRSA BacteremiaLABORATORY IDENTIFIED HOSPITAL-ONSET BLOODSTREAM INFECTIONS
Methicillin-resistant Staphylococcus aureus (MRSA) is bacteria usually spread by contaminated hands. In a healthcare setting, such as a hospital, MRSA can cause serious bloodstream infections.
Not enough data to report how many hospitals had an SIR significantly worse than the national SIR of 0.92.
SSIsSURGICAL SITE INFECTIONS
When germs get into an area where surgery is or was performed, patients can get a surgical site infection. Sometimes these infections involve only the skin. Other SSIs can involve tissues under the skin, organs, or implanted material.
SSI: Abdominal Hysterectomy
Puerto Rico hospitals did not report 2013 abdominal hysterectomy data to NHSN.
SSI: Colon Surgery
Puerto Rico hospitals did not report 2013 colon surgery data to NHSN.
Several changes to the NHSN 2013 SSI protocol likely contributed to an increase in the national and some state- specific colon surgery SIRs compared to 2012.
C. difficile InfectionsLABORATORY IDENTIFIED HOSPITAL-ONSET C. DIFFICILE INFECTIONS
When a person takes antibiotics, good bacteria that protect against infection are destroyed for several months. During this time, patients can get sick from Clostridium difficile (C. difficile), bacteria that cause potentially deadly diarrhea, which can be spread in healthcare settings.
Not enough data to report how many hospitals had an SIR significantly worse than the national SIR of 0.90.
THIS REPORT IS BASED ON 2013 DATA, PUBLISHED JANUARY 2015

P U E R T O R I C OHEALTHCARE-ASSOCIATED INFECTION (HAI) DATA give healthcare facilities and public health agencies knowledge to design, implement, and evaluate HAI prevention efforts.
LEGEND
2013 state SIR is significantly lower (better) than comparison group
in column header
or
Change in 2013 state SIR compared to group in column header is not statistically significant
2013 state SIR is significantly higher (worse) than comparison group in
column header
2013 state SIR cannot be calculated
HAI TYPE# OF PUERTO RICO
HOSPITALS THAT REPORTED DATA TO CDC’S NHSN, 2013
Total Hospitals in State: 59+
2013 STATE SIR vs.
2012 State SIR‡
2013 STATE SIR vs.
2013 Nat’l SIR
2013 STATE SIR vs.
Nat’l Baseline
2013 STATE SIR
2013 NAT’L SIR
CLABSI Nat’l Baseline: 2008
18 24% 45% 22% 0.78 0.54
CAUTI Nat’l Baseline: 2009
18 20% 25% 21% 0.79 1.06
SSI, Abdominal Hysterectomy Nat’l Baseline: 2008
0 N/A N/A N/A N/A 0.86
SSI, Colon Surgery Nat’l Baseline: 2008
0 N/A N/A N/A N/A 0.92
MRSA Bacteremia Nat’l Baseline: 2011
3 2012 SIR not available
N/A N/A N/A 0.92
C. difficile Infections Nat’l Baseline: 2011
4 2012 SIR not available
N/A N/A N/A 0.90
+Not all hospitals are required to report these infections; for example, some hospitals do not use central lines or urinary catheters, or do not perform colon or abdominal hysterectomy surgeries. ‡The state’s 2012 SIR can be found in the data tables of this report. Nat’l baseline time period varies by infection type. See first column of this table for specifics.
WHAT IS THE STANDARDIZED INFECTION RATIO?
The standardized infection ratio (SIR) is a summary statistic that can be used to track HAI prevention progress over time; lower SIRs are better. The SIR for a facility or state is adjusted to account for factors that might cause infection rates to be higher or lower, such as hospital size, teaching status, the type of patients a hospital serves, and surgery and patient characteristics.
WHAT IS PUERTO RICO DOING TO PREVENT HEALTHCARE-ASSOCIATED INFECTIONS?
Prevention efforts to reduce specific HAIs:
■ Central line-associated bloodstream infections ■ Catheter-associated urinary tract infections ■ Surgical site infections ■ Multidrug-resistant infections (MRSA, C. difficile, CRE, and others) ■ Antibiotic stewardship
Learn how your hospital is performing: www.medicare.gov/hospitalcompare For additional information:
■ 2013 HAI Progress Report: www.cdc.gov/hai/progress-report/ ■ NHSN: www.cdc.gov/nhsn ■ HAIs and prevention activities in Puerto Rico: www.salud.gov.pr/Pages/default.aspx ■ Puerto Rico validation efforts: www.cdc.gov/hai/pdfs/state-progress-landscape.pdf
THIS REPORT IS BASED ON 2013 DATA, PUBLISHED JANUARY 2015

R H O D E I S L A N DHealthcare-associated infections (HAIs) are infections patients can get while receiving medical treatment in a healthcare facility. Working toward the elimination of HAIs is a CDC priority. The standardized infection ratio (SIR) is a summary statistic that can be used to track HAI prevention progress over time; lower SIRs are better. The infection data are collected through CDC’s National Healthcare Safety Network (NHSN). HAI data for nearly all U.S. hospitals are published on the Hospital Compare website.
CLABSIsCENTRAL LINE-ASSOCIATED BLOODSTREAM INFECTIONS
33% LOWER COMPARED TO NAT’L BASELINE*
*Statistically significant.
When a tube is placed in a large vein and not put in correctly or kept clean, it can become a way for germs to enter the body and cause deadly infections in the blood.
Rhode Island hospitals reported no significant change in CLABSIs between 2012 and 2013.
Not enough data to report how many hospitals had an SIR significantly worse than the national SIR of 0.54.
CAUTIsCATHETER-ASSOCIATED URINARY TRACT INFECTIONS
27% HIGHER COMPARED TO NAT’L BASELINE*
When a urinary catheter is not put in correctly, not kept clean, or left in a patient for too long, germs can travel through the catheter and infect the bladder and kidneys.
Rhode Island hospitals reported no significant change in CAUTIs between 2012 and 2013.
10% Among the 10 hospitals in Rhode Island with enough data to calculate an SIR, 10% had an SIR significantly worse than the national SIR of 1.06.
MRSA BacteremiaLABORATORY IDENTIFIED HOSPITAL-ONSET BLOODSTREAM INFECTIONS
10% LOWER COMPARED TO NAT’L BASELINE
Methicillin-resistant Staphylococcus aureus (MRSA) is bacteria usually spread by contaminated hands. In a healthcare setting, such as a hospital, MRSA can cause serious bloodstream infections.
Not enough data to report how many hospitals had an SIR significantly worse than the national SIR of 0.92.
SSIsSURGICAL SITE INFECTIONS
When germs get into an area where surgery is or was performed, patients can get a surgical site infection. Sometimes these infections involve only the skin. Other SSIs can involve tissues under the skin, organs, or implanted material.
SSI: Abdominal Hysterectomy 32% LOWER COMPARED TO NAT’L BASELINE
Rhode Island hospitals reported a significant decrease in SSIs related to abdominal hysterectomy surgery between 2012 and 2013.
Not enough data to report how many hospitals had an SIR significantly worse than the national SIR of 0.86.
SSI: Colon Surgery 32% HIGHER COMPARED TO NAT’L BASELINE
Rhode Island hospitals reported no significant change in SSIs related to colon surgery between 2012 and 2013.
Several changes to the NHSN 2013 SSI protocol likely contributed to an increase in the national and some state- specific colon surgery SIRs compared to 2012.
Not enough data to report how many hospitals had an SIR significantly worse than the national SIR of 0.92.
C. difficile InfectionsLABORATORY IDENTIFIED HOSPITAL-ONSET C. DIFFICILE INFECTIONS
18% HIGHER COMPARED TO NAT’L BASELINE*
When a person takes antibiotics, good bacteria that protect against infection are destroyed for several months. During this time, patients can get sick from Clostridium difficile (C. difficile), bacteria that cause potentially deadly diarrhea, which can be spread in healthcare settings.
45%Among the 11 hospitals in Rhode Island with enough data to calculate an SIR, 45% had an SIR significantly worse than the national SIR of 0.90.
THIS REPORT IS BASED ON 2013 DATA, PUBLISHED JANUARY 2015
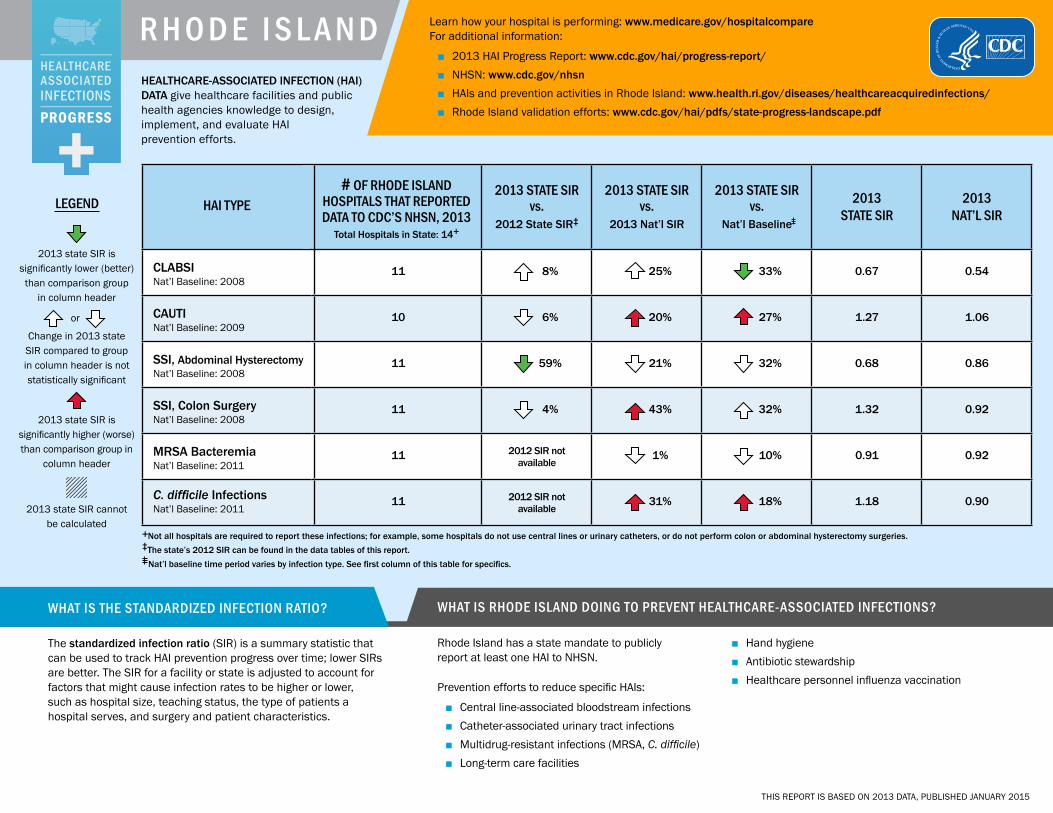
R H O D E I S L A N DHEALTHCARE-ASSOCIATED INFECTION (HAI) DATA give healthcare facilities and public health agencies knowledge to design, implement, and evaluate HAI prevention efforts.
LEGEND
2013 state SIR is significantly lower (better) than comparison group
in column header
or
Change in 2013 state SIR compared to group in column header is not statistically significant
2013 state SIR is significantly higher (worse) than comparison group in
column header
2013 state SIR cannot be calculated
HAI TYPE# OF RHODE ISLAND
HOSPITALS THAT REPORTED DATA TO CDC’S NHSN, 2013
Total Hospitals in State: 14+
2013 STATE SIR vs.
2012 State SIR‡
2013 STATE SIR vs.
2013 Nat’l SIR
2013 STATE SIR vs.
Nat’l Baseline
2013 STATE SIR
2013 NAT’L SIR
CLABSI Nat’l Baseline: 2008
11 8% 25% 33% 0.67 0.54
CAUTI Nat’l Baseline: 2009
10 6% 20% 27% 1.27 1.06
SSI, Abdominal Hysterectomy Nat’l Baseline: 2008
11 59% 21% 32% 0.68 0.86
SSI, Colon Surgery Nat’l Baseline: 2008
11 4% 43% 32% 1.32 0.92
MRSA Bacteremia Nat’l Baseline: 2011
11 2012 SIR not available
1% 10% 0.91 0.92
C. difficile Infections Nat’l Baseline: 2011
11 2012 SIR not available
31% 18% 1.18 0.90
+Not all hospitals are required to report these infections; for example, some hospitals do not use central lines or urinary catheters, or do not perform colon or abdominal hysterectomy surgeries. ‡The state’s 2012 SIR can be found in the data tables of this report. Nat’l baseline time period varies by infection type. See first column of this table for specifics.
WHAT IS THE STANDARDIZED INFECTION RATIO?
The standardized infection ratio (SIR) is a summary statistic that can be used to track HAI prevention progress over time; lower SIRs are better. The SIR for a facility or state is adjusted to account for factors that might cause infection rates to be higher or lower, such as hospital size, teaching status, the type of patients a hospital serves, and surgery and patient characteristics.
WHAT IS RHODE ISLAND DOING TO PREVENT HEALTHCARE-ASSOCIATED INFECTIONS?
Rhode Island has a state mandate to publicly report at least one HAI to NHSN.
Prevention efforts to reduce specific HAIs:
■ Central line-associated bloodstream infections ■ Catheter-associated urinary tract infections ■ Multidrug-resistant infections (MRSA, C. difficile) ■ Long-term care facilities
■ Hand hygiene ■ Antibiotic stewardship ■ Healthcare personnel influenza vaccination
Learn how your hospital is performing: www.medicare.gov/hospitalcompare For additional information:
■ 2013 HAI Progress Report: www.cdc.gov/hai/progress-report/ ■ NHSN: www.cdc.gov/nhsn ■ HAIs and prevention activities in Rhode Island: www.health.ri.gov/diseases/healthcareacquiredinfections/ ■ Rhode Island validation efforts: www.cdc.gov/hai/pdfs/state-progress-landscape.pdf
THIS REPORT IS BASED ON 2013 DATA, PUBLISHED JANUARY 2015

S O U T H C A R O L I N AHealthcare-associated infections (HAIs) are infections patients can get while receiving medical treatment in a healthcare facility. Working toward the elimination of HAIs is a CDC priority. The standardized infection ratio (SIR) is a summary statistic that can be used to track HAI prevention progress over time; lower SIRs are better. The infection data are collected through CDC’s National Healthcare Safety Network (NHSN). HAI data for nearly all U.S. hospitals are published on the Hospital Compare website.
CLABSIsCENTRAL LINE-ASSOCIATED BLOODSTREAM INFECTIONS
43% LOWER COMPARED TO NAT’L BASELINE*
*Statistically significant.
When a tube is placed in a large vein and not put in correctly or kept clean, it can become a way for germs to enter the body and cause deadly infections in the blood.
South Carolina hospitals reported no significant change in CLABSIs between 2012 and 2013.
12%Among the 41 hospitals in South Carolina with enough data to calculate an SIR, 12% had an SIR significantly worse than the national SIR of 0.54.
CAUTIsCATHETER-ASSOCIATED URINARY TRACT INFECTIONS
28% HIGHER COMPARED TO NAT’L BASELINE*
When a urinary catheter is not put in correctly, not kept clean, or left in a patient for too long, germs can travel through the catheter and infect the bladder and kidneys.
South Carolina hospitals reported a significant decrease in CAUTIs between 2012 and 2013.
16% Among the 51 hospitals in South Carolina with enough data to calculate an SIR, 16% had an SIR significantly worse than the national SIR of 1.06.
MRSA BacteremiaLABORATORY IDENTIFIED HOSPITAL-ONSET BLOODSTREAM INFECTIONS
7% LOWER COMPARED TO NAT’L BASELINE
Methicillin-resistant Staphylococcus aureus (MRSA) is bacteria usually spread by contaminated hands. In a healthcare setting, such as a hospital, MRSA can cause serious bloodstream infections.
9%Among the 32 hospitals in South Carolina with enough data to calculate an SIR, 9% had an SIR significantly worse than the national SIR of 0.92.
SSIsSURGICAL SITE INFECTIONS
When germs get into an area where surgery is or was performed, patients can get a surgical site infection. Sometimes these infections involve only the skin. Other SSIs can involve tissues under the skin, organs, or implanted material.
SSI: Abdominal Hysterectomy 19% LOWER COMPARED TO NAT’L BASELINE
South Carolina hospitals reported no significant change in SSIs related to abdominal hysterectomy surgery between 2012 and 2013.
0%Among the 15 hospitals in South Carolina with enough data to calculate an SIR, 0% had an SIR significantly worse than the national SIR of 0.86.
SSI: Colon Surgery 4% LOWER COMPARED TO NAT’L BASELINE
South Carolina hospitals reported no significant change in SSIs related to colon surgery between 2012 and 2013.
Several changes to the NHSN 2013 SSI protocol likely contributed to an increase in the national and some state- specific colon surgery SIRs compared to 2012.
7%Among the 28 hospitals in South Carolina with enough data to calculate an SIR, 7% had an SIR significantly worse than the national SIR of 0.92.
C. difficile InfectionsLABORATORY IDENTIFIED HOSPITAL-ONSET C. DIFFICILE INFECTIONS
26% LOWER COMPARED TO NAT’L BASELINE*
When a person takes antibiotics, good bacteria that protect against infection are destroyed for several months. During this time, patients can get sick from Clostridium difficile (C. difficile), bacteria that cause potentially deadly diarrhea, which can be spread in healthcare settings.
5%Among the 63 hospitals in South Carolina with enough data to calculate an SIR, 5% had an SIR significantly worse than the national SIR of 0.90.
THIS REPORT IS BASED ON 2013 DATA, PUBLISHED JANUARY 2015

S O U T H C A R O L I N AHEALTHCARE-ASSOCIATED INFECTION (HAI) DATA give healthcare facilities and public health agencies knowledge to design, implement, and evaluate HAI prevention efforts.
LEGEND
2013 state SIR is significantly lower (better) than comparison group
in column header
or
Change in 2013 state SIR compared to group in column header is not statistically significant
2013 state SIR is significantly higher (worse) than comparison group in
column header
2013 state SIR cannot be calculated
HAI TYPE# OF SOUTH CAROLINA
HOSPITALS THAT REPORTED DATA TO CDC’S NHSN, 2013
Total Hospitals in State: 81+
2013 STATE SIR vs.
2012 State SIR‡
2013 STATE SIR vs.
2013 Nat’l SIR
2013 STATE SIR vs.
Nat’l Baseline
2013 STATE SIR
2013 NAT’L SIR
CLABSI Nat’l Baseline: 2008
65 7% 7% 43% 0.58 0.54
CAUTI Nat’l Baseline: 2009
64 12% 21% 28% 1.28 1.06
SSI, Abdominal Hysterectomy Nat’l Baseline: 2008
51 28% 6% 19% 0.82 0.86
SSI, Colon Surgery Nat’l Baseline: 2008
57 10% 4% 4% 0.96 0.92
MRSA Bacteremia Nat’l Baseline: 2011
66 2012 SIR not available
2% 7% 0.93 0.92
C. difficile Infections Nat’l Baseline: 2011
64 2012 SIR not available
19% 26% 0.74 0.90
+Not all hospitals are required to report these infections; for example, some hospitals do not use central lines or urinary catheters, or do not perform colon or abdominal hysterectomy surgeries. ‡The state’s 2012 SIR can be found in the data tables of this report. Nat’l baseline time period varies by infection type. See first column of this table for specifics.
WHAT IS THE STANDARDIZED INFECTION RATIO?
The standardized infection ratio (SIR) is a summary statistic that can be used to track HAI prevention progress over time; lower SIRs are better. The SIR for a facility or state is adjusted to account for factors that might cause infection rates to be higher or lower, such as hospital size, teaching status, the type of patients a hospital serves, and surgery and patient characteristics.
WHAT IS SOUTH CAROLINA DOING TO PREVENT HEALTHCARE-ASSOCIATED INFECTIONS?
South Carolina has a state mandate to publicly report at least one HAI to NHSN.
Prevention efforts to reduce specific HAIs:
■ Central line-associated bloodstream infections ■ Catheter-associated urinary tract infections ■ Multidrug-resistant infections (C. difficile)
Learn how your hospital is performing: www.medicare.gov/hospitalcompare For additional information:
■ 2013 HAI Progress Report: www.cdc.gov/hai/progress-report/ ■ NHSN: www.cdc.gov/nhsn ■ HAIs and prevention activities in South Carolina: www.scdhec.gov/hai/ ■ South Carolina validation efforts: www.cdc.gov/hai/pdfs/state-progress-landscape.pdf
THIS REPORT IS BASED ON 2013 DATA, PUBLISHED JANUARY 2015

S O U T H D A K O TAHealthcare-associated infections (HAIs) are infections patients can get while receiving medical treatment in a healthcare facility. Working toward the elimination of HAIs is a CDC priority. The standardized infection ratio (SIR) is a summary statistic that can be used to track HAI prevention progress over time; lower SIRs are better. The infection data are collected through CDC’s National Healthcare Safety Network (NHSN). HAI data for nearly all U.S. hospitals are published on the Hospital Compare website.
CLABSIsCENTRAL LINE-ASSOCIATED BLOODSTREAM INFECTIONS
81% LOWER COMPARED TO NAT’L BASELINE*
*Statistically significant.
When a tube is placed in a large vein and not put in correctly or kept clean, it can become a way for germs to enter the body and cause deadly infections in the blood.
South Dakota hospitals reported no significant change in CLABSIs between 2012 and 2013.
Not enough data to report how many hospitals had an SIR significantly worse than the national SIR of 0.54.
CAUTIsCATHETER-ASSOCIATED URINARY TRACT INFECTIONS
26% LOWER COMPARED TO NAT’L BASELINE*
When a urinary catheter is not put in correctly, not kept clean, or left in a patient for too long, germs can travel through the catheter and infect the bladder and kidneys.
South Dakota hospitals reported no significant change in CAUTIs between 2012 and 2013.
0% Among the 11 hospitals in South Dakota with enough data to calculate an SIR, 0% had an SIR significantly worse than the national SIR of 1.06.
MRSA BacteremiaLABORATORY IDENTIFIED HOSPITAL-ONSET BLOODSTREAM INFECTIONS
20% LOWER COMPARED TO NAT’L BASELINE
Methicillin-resistant Staphylococcus aureus (MRSA) is bacteria usually spread by contaminated hands. In a healthcare setting, such as a hospital, MRSA can cause serious bloodstream infections.
Not enough data to report how many hospitals had an SIR significantly worse than the national SIR of 0.92.
SSIsSURGICAL SITE INFECTIONS
When germs get into an area where surgery is or was performed, patients can get a surgical site infection. Sometimes these infections involve only the skin. Other SSIs can involve tissues under the skin, organs, or implanted material.
SSI: Abdominal Hysterectomy 60% HIGHER COMPARED TO NAT’L BASELINE
South Dakota hospitals reported no significant change in SSIs related to abdominal hysterectomy surgery between 2012 and 2013.
Not enough data to report how many hospitals had an SIR significantly worse than the national SIR of 0.86.
SSI: Colon Surgery 2% LOWER COMPARED TO NAT’L BASELINE
South Dakota hospitals reported no significant change in SSIs related to colon surgery between 2012 and 2013.
Several changes to the NHSN 2013 SSI protocol likely contributed to an increase in the national and some state- specific colon surgery SIRs compared to 2012.
Not enough data to report how many hospitals had an SIR significantly worse than the national SIR of 0.92.
C. difficile InfectionsLABORATORY IDENTIFIED HOSPITAL-ONSET C. DIFFICILE INFECTIONS
28% LOWER COMPARED TO NAT’L BASELINE*
When a person takes antibiotics, good bacteria that protect against infection are destroyed for several months. During this time, patients can get sick from Clostridium difficile (C. difficile), bacteria that cause potentially deadly diarrhea, which can be spread in healthcare settings.
6%Among the 16 hospitals in South Dakota with enough data to calculate an SIR, 6% had an SIR significantly worse than the national SIR of 0.90.
THIS REPORT IS BASED ON 2013 DATA, PUBLISHED JANUARY 2015
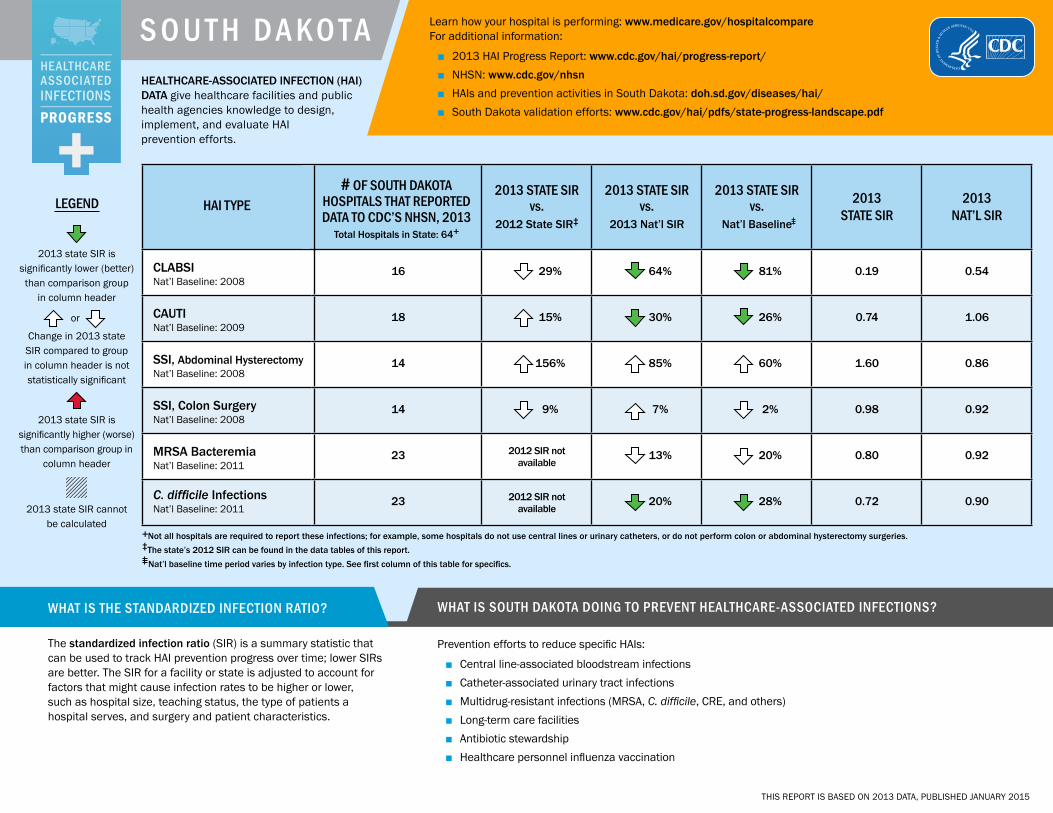
S O U T H D A K O TAHEALTHCARE-ASSOCIATED INFECTION (HAI) DATA give healthcare facilities and public health agencies knowledge to design, implement, and evaluate HAI prevention efforts.
LEGEND
2013 state SIR is significantly lower (better) than comparison group
in column header
or
Change in 2013 state SIR compared to group in column header is not statistically significant
2013 state SIR is significantly higher (worse) than comparison group in
column header
2013 state SIR cannot be calculated
HAI TYPE# OF SOUTH DAKOTA
HOSPITALS THAT REPORTED DATA TO CDC’S NHSN, 2013
Total Hospitals in State: 64+
2013 STATE SIR vs.
2012 State SIR‡
2013 STATE SIR vs.
2013 Nat’l SIR
2013 STATE SIR vs.
Nat’l Baseline
2013 STATE SIR
2013 NAT’L SIR
CLABSI Nat’l Baseline: 2008
16 29% 64% 81% 0.19 0.54
CAUTI Nat’l Baseline: 2009
18 15% 30% 26% 0.74 1.06
SSI, Abdominal Hysterectomy Nat’l Baseline: 2008
14 156% 85% 60% 1.60 0.86
SSI, Colon Surgery Nat’l Baseline: 2008
14 9% 7% 2% 0.98 0.92
MRSA Bacteremia Nat’l Baseline: 2011
23 2012 SIR not available
13% 20% 0.80 0.92
C. difficile Infections Nat’l Baseline: 2011
23 2012 SIR not available
20% 28% 0.72 0.90
+Not all hospitals are required to report these infections; for example, some hospitals do not use central lines or urinary catheters, or do not perform colon or abdominal hysterectomy surgeries. ‡The state’s 2012 SIR can be found in the data tables of this report. Nat’l baseline time period varies by infection type. See first column of this table for specifics.
WHAT IS THE STANDARDIZED INFECTION RATIO?
The standardized infection ratio (SIR) is a summary statistic that can be used to track HAI prevention progress over time; lower SIRs are better. The SIR for a facility or state is adjusted to account for factors that might cause infection rates to be higher or lower, such as hospital size, teaching status, the type of patients a hospital serves, and surgery and patient characteristics.
WHAT IS SOUTH DAKOTA DOING TO PREVENT HEALTHCARE-ASSOCIATED INFECTIONS?
Prevention efforts to reduce specific HAIs:
■ Central line-associated bloodstream infections ■ Catheter-associated urinary tract infections ■ Multidrug-resistant infections (MRSA, C. difficile, CRE, and others) ■ Long-term care facilities ■ Antibiotic stewardship ■ Healthcare personnel influenza vaccination
Learn how your hospital is performing: www.medicare.gov/hospitalcompare For additional information:
■ 2013 HAI Progress Report: www.cdc.gov/hai/progress-report/ ■ NHSN: www.cdc.gov/nhsn ■ HAIs and prevention activities in South Dakota: doh.sd.gov/diseases/hai/ ■ South Dakota validation efforts: www.cdc.gov/hai/pdfs/state-progress-landscape.pdf
THIS REPORT IS BASED ON 2013 DATA, PUBLISHED JANUARY 2015

T E N N E S S E EHealthcare-associated infections (HAIs) are infections patients can get while receiving medical treatment in a healthcare facility. Working toward the elimination of HAIs is a CDC priority. The standardized infection ratio (SIR) is a summary statistic that can be used to track HAI prevention progress over time; lower SIRs are better. The infection data are collected through CDC’s National Healthcare Safety Network (NHSN). HAI data for nearly all U.S. hospitals are published on the Hospital Compare website.
CLABSIsCENTRAL LINE-ASSOCIATED BLOODSTREAM INFECTIONS
52% LOWER COMPARED TO NAT’L BASELINE*
*Statistically significant.
When a tube is placed in a large vein and not put in correctly or kept clean, it can become a way for germs to enter the body and cause deadly infections in the blood.
Tennessee hospitals reported a significant decrease in CLABSIs between 2012 and 2013.
5%Among the 56 hospitals in Tennessee with enough data to calculate an SIR, 5% had an SIR significantly worse than the national SIR of 0.54.
CAUTIsCATHETER-ASSOCIATED URINARY TRACT INFECTIONS
24% HIGHER COMPARED TO NAT’L BASELINE*
When a urinary catheter is not put in correctly, not kept clean, or left in a patient for too long, germs can travel through the catheter and infect the bladder and kidneys.
Tennessee hospitals reported a significant decrease in CAUTIs between 2012 and 2013.
19% Among the 69 hospitals in Tennessee with enough data to calculate an SIR, 19% had an SIR significantly worse than the national SIR of 1.06.
MRSA BacteremiaLABORATORY IDENTIFIED HOSPITAL-ONSET BLOODSTREAM INFECTIONS
13% HIGHER COMPARED TO NAT’L BASELINE*
Methicillin-resistant Staphylococcus aureus (MRSA) is bacteria usually spread by contaminated hands. In a healthcare setting, such as a hospital, MRSA can cause serious bloodstream infections.
12%Among the 50 hospitals in Tennessee with enough data to calculate an SIR, 12% had an SIR significantly worse than the national SIR of 0.92.
SSIsSURGICAL SITE INFECTIONS
When germs get into an area where surgery is or was performed, patients can get a surgical site infection. Sometimes these infections involve only the skin. Other SSIs can involve tissues under the skin, organs, or implanted material.
SSI: Abdominal Hysterectomy 11% LOWER COMPARED TO NAT’L BASELINE
Tennessee hospitals reported no significant change in SSIs related to abdominal hysterectomy surgery between 2012 and 2013.
5%Among the 20 hospitals in Tennessee with enough data to calculate an SIR, 5% had an SIR significantly worse than the national SIR of 0.86.
SSI: Colon Surgery 9% LOWER COMPARED TO NAT’L BASELINE
Tennessee hospitals reported no significant change in SSIs related to colon surgery between 2012 and 2013.
Several changes to the NHSN 2013 SSI protocol likely contributed to an increase in the national and some state- specific colon surgery SIRs compared to 2012.
10%Among the 50 hospitals in Tennessee with enough data to calculate an SIR, 10% had an SIR significantly worse than the national SIR of 0.92.
C. difficile InfectionsLABORATORY IDENTIFIED HOSPITAL-ONSET C. DIFFICILE INFECTIONS
23% LOWER COMPARED TO NAT’L BASELINE*
When a person takes antibiotics, good bacteria that protect against infection are destroyed for several months. During this time, patients can get sick from Clostridium difficile (C. difficile), bacteria that cause potentially deadly diarrhea, which can be spread in healthcare settings.
9%Among the 106 hospitals in Tennessee with enough data to calculate an SIR, 9% had an SIR significantly worse than the national SIR of 0.90.
THIS REPORT IS BASED ON 2013 DATA, PUBLISHED JANUARY 2015

T E N N E S S E EHEALTHCARE-ASSOCIATED INFECTION (HAI) DATA give healthcare facilities and public health agencies knowledge to design, implement, and evaluate HAI prevention efforts.
LEGEND
2013 state SIR is significantly lower (better) than comparison group
in column header
or
Change in 2013 state SIR compared to group in column header is not statistically significant
2013 state SIR is significantly higher (worse) than comparison group in
column header
2013 state SIR cannot be calculated
HAI TYPE# OF TENNESSEE
HOSPITALS THAT REPORTED DATA TO CDC’S NHSN, 2013
Total Hospitals in State: 154+
2013 STATE SIR vs.
2012 State SIR‡
2013 STATE SIR vs.
2013 Nat’l SIR
2013 STATE SIR vs.
Nat’l Baseline
2013 STATE SIR
2013 NAT’L SIR
CLABSI Nat’l Baseline: 2008
95 14% 10% 52% 0.49 0.54
CAUTI Nat’l Baseline: 2009
94 10% 17% 24% 1.24 1.06
SSI, Abdominal Hysterectomy Nat’l Baseline: 2008
87 2% 3% 11% 0.89 0.86
SSI, Colon Surgery Nat’l Baseline: 2008
95 2% 1% 9% 0.91 0.92
MRSA Bacteremia Nat’l Baseline: 2011
115 2012 SIR not available
24% 13% 1.13 0.92
C. difficile Infections Nat’l Baseline: 2011
115 2012 SIR not available
16% 23% 0.77 0.90
+Not all hospitals are required to report these infections; for example, some hospitals do not use central lines or urinary catheters, or do not perform colon or abdominal hysterectomy surgeries. ‡The state’s 2012 SIR can be found in the data tables of this report. Nat’l baseline time period varies by infection type. See first column of this table for specifics.
WHAT IS THE STANDARDIZED INFECTION RATIO?
The standardized infection ratio (SIR) is a summary statistic that can be used to track HAI prevention progress over time; lower SIRs are better. The SIR for a facility or state is adjusted to account for factors that might cause infection rates to be higher or lower, such as hospital size, teaching status, the type of patients a hospital serves, and surgery and patient characteristics.
WHAT IS TENNESSEE DOING TO PREVENT HEALTHCARE-ASSOCIATED INFECTIONS?
Tennessee has a state mandate to publicly report at least one HAI to NHSN. Tennessee is one of 10 state health departments participating in CDC’s Emerging Infections Program, which allows for extra surveillance and research of HAIs.
Prevention efforts to reduce specific HAIs:
■ Central line-associated bloodstream infections ■ Catheter-associated urinary tract infections
■ Surgical site infections ■ Multidrug-resistant infections (MRSA, C. difficile, CRE) ■ Long-term care facilities ■ Antibiotic stewardship
Learn how your hospital is performing: www.medicare.gov/hospitalcompare For additional information:
■ 2013 HAI Progress Report: www.cdc.gov/hai/progress-report/ ■ NHSN: www.cdc.gov/nhsn ■ HAIs and prevention activities in Tennessee: health.state.tn.us/ceds/hai/index.htm ■ Tennessee validation efforts: www.cdc.gov/hai/pdfs/state-progress-landscape.pdf
THIS REPORT IS BASED ON 2013 DATA, PUBLISHED JANUARY 2015
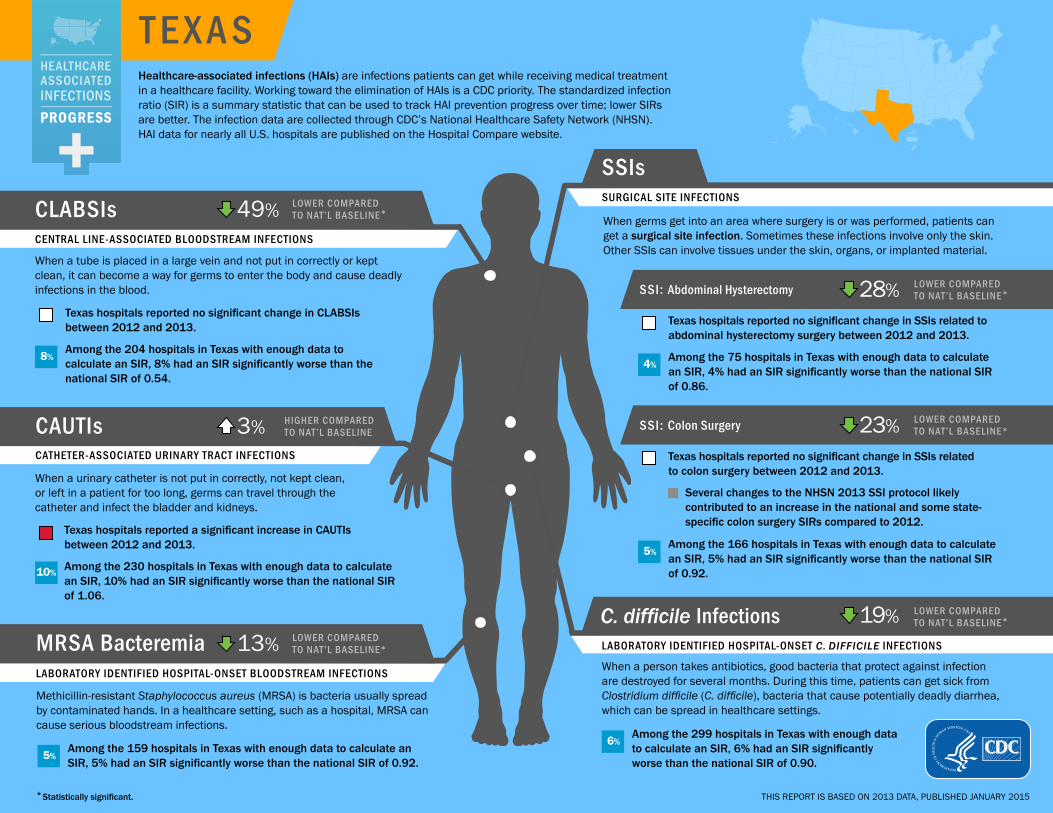
T E X A SHealthcare-associated infections (HAIs) are infections patients can get while receiving medical treatment in a healthcare facility. Working toward the elimination of HAIs is a CDC priority. The standardized infection ratio (SIR) is a summary statistic that can be used to track HAI prevention progress over time; lower SIRs are better. The infection data are collected through CDC’s National Healthcare Safety Network (NHSN). HAI data for nearly all U.S. hospitals are published on the Hospital Compare website.
CLABSIsCENTRAL LINE-ASSOCIATED BLOODSTREAM INFECTIONS
49% LOWER COMPARED TO NAT’L BASELINE*
*Statistically significant.
When a tube is placed in a large vein and not put in correctly or kept clean, it can become a way for germs to enter the body and cause deadly infections in the blood.
Texas hospitals reported no significant change in CLABSIs between 2012 and 2013.
8%Among the 204 hospitals in Texas with enough data to calculate an SIR, 8% had an SIR significantly worse than the national SIR of 0.54.
CAUTIsCATHETER-ASSOCIATED URINARY TRACT INFECTIONS
3% HIGHER COMPARED TO NAT’L BASELINE
When a urinary catheter is not put in correctly, not kept clean, or left in a patient for too long, germs can travel through the catheter and infect the bladder and kidneys.
Texas hospitals reported a significant increase in CAUTIs between 2012 and 2013.
10% Among the 230 hospitals in Texas with enough data to calculate an SIR, 10% had an SIR significantly worse than the national SIR of 1.06.
MRSA BacteremiaLABORATORY IDENTIFIED HOSPITAL-ONSET BLOODSTREAM INFECTIONS
13% LOWER COMPARED TO NAT’L BASELINE*
Methicillin-resistant Staphylococcus aureus (MRSA) is bacteria usually spread by contaminated hands. In a healthcare setting, such as a hospital, MRSA can cause serious bloodstream infections.
5%Among the 159 hospitals in Texas with enough data to calculate an SIR, 5% had an SIR significantly worse than the national SIR of 0.92.
SSIsSURGICAL SITE INFECTIONS
When germs get into an area where surgery is or was performed, patients can get a surgical site infection. Sometimes these infections involve only the skin. Other SSIs can involve tissues under the skin, organs, or implanted material.
SSI: Abdominal Hysterectomy 28% LOWER COMPARED TO NAT’L BASELINE*
Texas hospitals reported no significant change in SSIs related to abdominal hysterectomy surgery between 2012 and 2013.
4%Among the 75 hospitals in Texas with enough data to calculate an SIR, 4% had an SIR significantly worse than the national SIR of 0.86.
SSI: Colon Surgery 23% LOWER COMPARED TO NAT’L BASELINE*
Texas hospitals reported no significant change in SSIs related to colon surgery between 2012 and 2013.
Several changes to the NHSN 2013 SSI protocol likely contributed to an increase in the national and some state- specific colon surgery SIRs compared to 2012.
5%Among the 166 hospitals in Texas with enough data to calculate an SIR, 5% had an SIR significantly worse than the national SIR of 0.92.
C. difficile InfectionsLABORATORY IDENTIFIED HOSPITAL-ONSET C. DIFFICILE INFECTIONS
19% LOWER COMPARED TO NAT’L BASELINE*
When a person takes antibiotics, good bacteria that protect against infection are destroyed for several months. During this time, patients can get sick from Clostridium difficile (C. difficile), bacteria that cause potentially deadly diarrhea, which can be spread in healthcare settings.
6%Among the 299 hospitals in Texas with enough data to calculate an SIR, 6% had an SIR significantly worse than the national SIR of 0.90.
THIS REPORT IS BASED ON 2013 DATA, PUBLISHED JANUARY 2015

T E X A SHEALTHCARE-ASSOCIATED INFECTION (HAI) DATA give healthcare facilities and public health agencies knowledge to design, implement, and evaluate HAI prevention efforts.
LEGEND
2013 state SIR is significantly lower (better) than comparison group
in column header
or
Change in 2013 state SIR compared to group in column header is not statistically significant
2013 state SIR is significantly higher (worse) than comparison group in
column header
2013 state SIR cannot be calculated
HAI TYPE# OF TEXAS
HOSPITALS THAT REPORTED DATA TO CDC’S NHSN, 2013
Total Hospitals in State: 506+
2013 STATE SIR vs.
2012 State SIR‡
2013 STATE SIR vs.
2013 Nat’l SIR
2013 STATE SIR vs.
Nat’l Baseline
2013 STATE SIR
2013 NAT’L SIR
CLABSI Nat’l Baseline: 2008
281 7% 5% 49% 0.51 0.54
CAUTI Nat’l Baseline: 2009
289 9% 3% 3% 1.03 1.06
SSI, Abdominal Hysterectomy Nat’l Baseline: 2008
290 3% 18% 28% 0.73 0.86
SSI, Colon Surgery Nat’l Baseline: 2008
285 3% 17% 23% 0.78 0.92
MRSA Bacteremia Nat’l Baseline: 2011
359 2012 SIR not available
5% 13% 0.87 0.92
C. difficile Infections Nat’l Baseline: 2011
359 2012 SIR not available
11% 19% 0.81 0.90
+Not all hospitals are required to report these infections; for example, some hospitals do not use central lines or urinary catheters, or do not perform colon or abdominal hysterectomy surgeries. ‡The state’s 2012 SIR can be found in the data tables of this report. Nat’l baseline time period varies by infection type. See first column of this table for specifics.
WHAT IS THE STANDARDIZED INFECTION RATIO?
The standardized infection ratio (SIR) is a summary statistic that can be used to track HAI prevention progress over time; lower SIRs are better. The SIR for a facility or state is adjusted to account for factors that might cause infection rates to be higher or lower, such as hospital size, teaching status, the type of patients a hospital serves, and surgery and patient characteristics.
WHAT IS TEXAS DOING TO PREVENT HEALTHCARE-ASSOCIATED INFECTIONS?
Texas has a state mandate to publicly report at least one HAI to NHSN.
Prevention efforts to reduce specific HAIs:
■ Central line-associated bloodstream infections ■ Catheter-associated urinary tract infections ■ Surgical site infections ■ Multidrug-resistant infections (C. difficile)
Learn how your hospital is performing: www.medicare.gov/hospitalcompare For additional information:
■ 2013 HAI Progress Report: www.cdc.gov/hai/progress-report/ ■ NHSN: www.cdc.gov/nhsn ■ HAIs and prevention activities in Texas: www.texashai.org ■ Texas validation efforts: www.cdc.gov/hai/pdfs/state-progress-landscape.pdf
THIS REPORT IS BASED ON 2013 DATA, PUBLISHED JANUARY 2015

U TA HHealthcare-associated infections (HAIs) are infections patients can get while receiving medical treatment in a healthcare facility. Working toward the elimination of HAIs is a CDC priority. The standardized infection ratio (SIR) is a summary statistic that can be used to track HAI prevention progress over time; lower SIRs are better. The infection data are collected through CDC’s National Healthcare Safety Network (NHSN). HAI data for nearly all U.S. hospitals are published on the Hospital Compare website.
CLABSIsCENTRAL LINE-ASSOCIATED BLOODSTREAM INFECTIONS
34% LOWER COMPARED TO NAT’L BASELINE*
*Statistically significant.
When a tube is placed in a large vein and not put in correctly or kept clean, it can become a way for germs to enter the body and cause deadly infections in the blood.
Utah hospitals reported no significant change in CLABSIs between 2012 and 2013.
7%Among the 14 hospitals in Utah with enough data to calculate an SIR, 7% had an SIR significantly worse than the national SIR of 0.54.
CAUTIsCATHETER-ASSOCIATED URINARY TRACT INFECTIONS
64% HIGHER COMPARED TO NAT’L BASELINE*
When a urinary catheter is not put in correctly, not kept clean, or left in a patient for too long, germs can travel through the catheter and infect the bladder and kidneys.
Utah hospitals reported no significant change in CAUTIs between 2012 and 2013.
25% Among the 16 hospitals in Utah with enough data to calculate an SIR, 25% had an SIR significantly worse than the national SIR of 1.06.
MRSA BacteremiaLABORATORY IDENTIFIED HOSPITAL-ONSET BLOODSTREAM INFECTIONS
40% LOWER COMPARED TO NAT’L BASELINE*
Methicillin-resistant Staphylococcus aureus (MRSA) is bacteria usually spread by contaminated hands. In a healthcare setting, such as a hospital, MRSA can cause serious bloodstream infections.
0%Among the 10 hospitals in Utah with enough data to calculate an SIR, 0% had an SIR significantly worse than the national SIR of 0.92.
SSIsSURGICAL SITE INFECTIONS
When germs get into an area where surgery is or was performed, patients can get a surgical site infection. Sometimes these infections involve only the skin. Other SSIs can involve tissues under the skin, organs, or implanted material.
SSI: Abdominal Hysterectomy 8% HIGHER COMPARED TO NAT’L BASELINE
Utah hospitals reported no significant change in SSIs related to abdominal hysterectomy surgery between 2012 and 2013.
Not enough data to report how many hospitals had an SIR significantly worse than the national SIR of 0.86.
SSI: Colon Surgery 16% HIGHER COMPARED TO NAT’L BASELINE
Utah hospitals reported no significant change in SSIs related to colon surgery between 2012 and 2013.
Several changes to the NHSN 2013 SSI protocol likely contributed to an increase in the national and some state- specific colon surgery SIRs compared to 2012.
13%Among the 15 hospitals in Utah with enough data to calculate an SIR, 13% had an SIR significantly worse than the national SIR of 0.92.
C. difficile InfectionsLABORATORY IDENTIFIED HOSPITAL-ONSET C. DIFFICILE INFECTIONS
16% LOWER COMPARED TO NAT’L BASELINE*
When a person takes antibiotics, good bacteria that protect against infection are destroyed for several months. During this time, patients can get sick from Clostridium difficile (C. difficile), bacteria that cause potentially deadly diarrhea, which can be spread in healthcare settings.
0%Among the 29 hospitals in Utah with enough data to calculate an SIR, 0% had an SIR significantly worse than the national SIR of 0.90.
THIS REPORT IS BASED ON 2013 DATA, PUBLISHED JANUARY 2015

U TA HHEALTHCARE-ASSOCIATED INFECTION (HAI) DATA give healthcare facilities and public health agencies knowledge to design, implement, and evaluate HAI prevention efforts.
LEGEND
2013 state SIR is significantly lower (better) than comparison group
in column header
or
Change in 2013 state SIR compared to group in column header is not statistically significant
2013 state SIR is significantly higher (worse) than comparison group in
column header
2013 state SIR cannot be calculated
HAI TYPE# OF UTAH
HOSPITALS THAT REPORTED DATA TO CDC’S NHSN, 2013
Total Hospitals in State: 53+
2013 STATE SIR vs.
2012 State SIR‡
2013 STATE SIR vs.
2013 Nat’l SIR
2013 STATE SIR vs.
Nat’l Baseline
2013 STATE SIR
2013 NAT’L SIR
CLABSI Nat’l Baseline: 2008
26 2% 23% 34% 0.66 0.54
CAUTI Nat’l Baseline: 2009
26 11% 56% 64% 1.64 1.06
SSI, Abdominal Hysterectomy Nat’l Baseline: 2008
29 17% 26% 8% 1.08 0.86
SSI, Colon Surgery Nat’l Baseline: 2008
30 23% 26% 16% 1.16 0.92
MRSA Bacteremia Nat’l Baseline: 2011
37 2012 SIR not available
35% 40% 0.60 0.92
C. difficile Infections Nat’l Baseline: 2011
35 2012 SIR not available
7% 16% 0.84 0.90
+Not all hospitals are required to report these infections; for example, some hospitals do not use central lines or urinary catheters, or do not perform colon or abdominal hysterectomy surgeries. ‡The state’s 2012 SIR can be found in the data tables of this report. Nat’l baseline time period varies by infection type. See first column of this table for specifics.
WHAT IS THE STANDARDIZED INFECTION RATIO?
The standardized infection ratio (SIR) is a summary statistic that can be used to track HAI prevention progress over time; lower SIRs are better. The SIR for a facility or state is adjusted to account for factors that might cause infection rates to be higher or lower, such as hospital size, teaching status, the type of patients a hospital serves, and surgery and patient characteristics.
WHAT IS UTAH DOING TO PREVENT HEALTHCARE-ASSOCIATED INFECTIONS?
Utah has a state mandate to publicly report at least one HAI to NHSN.
Prevention efforts to reduce specific HAIs:
■ Central line-associated bloodstream infections ■ Catheter-associated urinary tract infections ■ Surgical site infections
■ Multidrug-resistant infections (MRSA, C. difficile, CRE, and others)
■ Long-term care facilities ■ Hand hygiene ■ Antibiotic stewardship ■ Healthcare personnel influenza vaccination
Learn how your hospital is performing: www.medicare.gov/hospitalcompare For additional information:
■ 2013 HAI Progress Report: www.cdc.gov/hai/progress-report/ ■ NHSN: www.cdc.gov/nhsn ■ HAIs and prevention activities in Utah: health.utah.gov/epi/diseases/HAI/ ■ Utah validation efforts: www.cdc.gov/hai/pdfs/state-progress-landscape.pdf
THIS REPORT IS BASED ON 2013 DATA, PUBLISHED JANUARY 2015

V E R M O N THealthcare-associated infections (HAIs) are infections patients can get while receiving medical treatment in a healthcare facility. Working toward the elimination of HAIs is a CDC priority. The standardized infection ratio (SIR) is a summary statistic that can be used to track HAI prevention progress over time; lower SIRs are better. The infection data are collected through CDC’s National Healthcare Safety Network (NHSN). HAI data for nearly all U.S. hospitals are published on the Hospital Compare website.
CLABSIsCENTRAL LINE-ASSOCIATED BLOODSTREAM INFECTIONS
75% LOWER COMPARED TO NAT’L BASELINE*
*Statistically significant.
When a tube is placed in a large vein and not put in correctly or kept clean, it can become a way for germs to enter the body and cause deadly infections in the blood.
Vermont hospitals reported no significant change in CLABSIs between 2012 and 2013.
Not enough data to report how many hospitals had an SIR significantly worse than the national SIR of 0.54.
CAUTIsCATHETER-ASSOCIATED URINARY TRACT INFECTIONS
14% LOWER COMPARED TO NAT’L BASELINE
When a urinary catheter is not put in correctly, not kept clean, or left in a patient for too long, germs can travel through the catheter and infect the bladder and kidneys.
Vermont hospitals reported no significant change in CAUTIs between 2012 and 2013.
Not enough data to report how many hospitals had an SIR significantly worse than the national SIR of 1.06.
MRSA BacteremiaLABORATORY IDENTIFIED HOSPITAL-ONSET BLOODSTREAM INFECTIONS
73% LOWER COMPARED TO NAT’L BASELINE*
Methicillin-resistant Staphylococcus aureus (MRSA) is bacteria usually spread by contaminated hands. In a healthcare setting, such as a hospital, MRSA can cause serious bloodstream infections.
Not enough data to report how many hospitals had an SIR significantly worse than the national SIR of 0.92.
SSIsSURGICAL SITE INFECTIONS
When germs get into an area where surgery is or was performed, patients can get a surgical site infection. Sometimes these infections involve only the skin. Other SSIs can involve tissues under the skin, organs, or implanted material.
SSI: Abdominal Hysterectomy 36% LOWER COMPARED TO NAT’L BASELINE
Vermont hospitals reported no significant change in SSIs related to abdominal hysterectomy surgery between 2012 and 2013.
Not enough data to report how many hospitals had an SIR significantly worse than the national SIR of 0.86.
SSI: Colon Surgery 121% HIGHER COMPARED TO NAT’L BASELINE*
Vermont hospitals reported no significant change in SSIs related to colon surgery between 2012 and 2013.
Several changes to the NHSN 2013 SSI protocol likely contributed to an increase in the national and some state- specific colon surgery SIRs compared to 2012.
Not enough data to report how many hospitals had an SIR significantly worse than the national SIR of 0.92.
C. difficile InfectionsLABORATORY IDENTIFIED HOSPITAL-ONSET C. DIFFICILE INFECTIONS
42% LOWER COMPARED TO NAT’L BASELINE*
When a person takes antibiotics, good bacteria that protect against infection are destroyed for several months. During this time, patients can get sick from Clostridium difficile (C. difficile), bacteria that cause potentially deadly diarrhea, which can be spread in healthcare settings.
0%Among the 11 hospitals in Vermont with enough data to calculate an SIR, 0% had an SIR significantly worse than the national SIR of 0.90.
THIS REPORT IS BASED ON 2013 DATA, PUBLISHED JANUARY 2015

V E R M O N THEALTHCARE-ASSOCIATED INFECTION (HAI) DATA give healthcare facilities and public health agencies knowledge to design, implement, and evaluate HAI prevention efforts.
LEGEND
2013 state SIR is significantly lower (better) than comparison group
in column header
or
Change in 2013 state SIR compared to group in column header is not statistically significant
2013 state SIR is significantly higher (worse) than comparison group in
column header
2013 state SIR cannot be calculated
HAI TYPE# OF VERMONT
HOSPITALS THAT REPORTED DATA TO CDC’S NHSN, 2013
Total Hospitals in State: 16+
2013 STATE SIR vs.
2012 State SIR‡
2013 STATE SIR vs.
2013 Nat’l SIR
2013 STATE SIR vs.
Nat’l Baseline
2013 STATE SIR
2013 NAT’L SIR
CLABSI Nat’l Baseline: 2008
7 1% 53% 75% 0.25 0.54
CAUTI Nat’l Baseline: 2009
5 29% 18% 14% 0.87 1.06
SSI, Abdominal Hysterectomy Nat’l Baseline: 2008
12 33% 24% 36% 0.65 0.86
SSI, Colon Surgery Nat’l Baseline: 2008
6 17% 140% 121% 2.21 0.92
MRSA Bacteremia Nat’l Baseline: 2011
13 2012 SIR not available
71% 73% 0.27 0.92
C. difficile Infections Nat’l Baseline: 2011
13 2012 SIR not available
36% 42% 0.58 0.90
+Not all hospitals are required to report these infections; for example, some hospitals do not use central lines or urinary catheters, or do not perform colon or abdominal hysterectomy surgeries. ‡The state’s 2012 SIR can be found in the data tables of this report. Nat’l baseline time period varies by infection type. See first column of this table for specifics.
WHAT IS THE STANDARDIZED INFECTION RATIO?
The standardized infection ratio (SIR) is a summary statistic that can be used to track HAI prevention progress over time; lower SIRs are better. The SIR for a facility or state is adjusted to account for factors that might cause infection rates to be higher or lower, such as hospital size, teaching status, the type of patients a hospital serves, and surgery and patient characteristics.
WHAT IS VERMONT DOING TO PREVENT HEALTHCARE-ASSOCIATED INFECTIONS?
Vermont has a state mandate to publicly report at least one HAI to NHSN.
Prevention efforts to reduce specific HAIs:
■ Multidrug-resistant infections (MRSA, C. difficile, CRE, and others) ■ Long-term care facilities ■ Antibiotic stewardship
Learn how your hospital is performing: www.medicare.gov/hospitalcompare For additional information:
■ 2013 HAI Progress Report: www.cdc.gov/hai/progress-report/ ■ NHSN: www.cdc.gov/nhsn ■ HAIs and prevention activities in Vermont: healthvermont.gov/hc/hospitalreportcard/index.aspx ■ Vermont validation efforts: www.cdc.gov/hai/pdfs/state-progress-landscape.pdf
THIS REPORT IS BASED ON 2013 DATA, PUBLISHED JANUARY 2015

V I R G I N I AHealthcare-associated infections (HAIs) are infections patients can get while receiving medical treatment in a healthcare facility. Working toward the elimination of HAIs is a CDC priority. The standardized infection ratio (SIR) is a summary statistic that can be used to track HAI prevention progress over time; lower SIRs are better. The infection data are collected through CDC’s National Healthcare Safety Network (NHSN). HAI data for nearly all U.S. hospitals are published on the Hospital Compare website.
CLABSIsCENTRAL LINE-ASSOCIATED BLOODSTREAM INFECTIONS
50% LOWER COMPARED TO NAT’L BASELINE*
*Statistically significant.
When a tube is placed in a large vein and not put in correctly or kept clean, it can become a way for germs to enter the body and cause deadly infections in the blood.
Virginia hospitals reported no significant change in CLABSIs between 2012 and 2013.
4%Among the 50 hospitals in Virginia with enough data to calculate an SIR, 4% had an SIR significantly worse than the national SIR of 0.54.
CAUTIsCATHETER-ASSOCIATED URINARY TRACT INFECTIONS
5% HIGHER COMPARED TO NAT’L BASELINE
When a urinary catheter is not put in correctly, not kept clean, or left in a patient for too long, germs can travel through the catheter and infect the bladder and kidneys.
Virginia hospitals reported a significant increase in CAUTIs between 2012 and 2013.
8% Among the 62 hospitals in Virginia with enough data to calculate an SIR, 8% had an SIR significantly worse than the national SIR of 1.06.
MRSA BacteremiaLABORATORY IDENTIFIED HOSPITAL-ONSET BLOODSTREAM INFECTIONS
9% LOWER COMPARED TO NAT’L BASELINE
Methicillin-resistant Staphylococcus aureus (MRSA) is bacteria usually spread by contaminated hands. In a healthcare setting, such as a hospital, MRSA can cause serious bloodstream infections.
9%Among the 47 hospitals in Virginia with enough data to calculate an SIR, 9% had an SIR significantly worse than the national SIR of 0.92.
SSIsSURGICAL SITE INFECTIONS
When germs get into an area where surgery is or was performed, patients can get a surgical site infection. Sometimes these infections involve only the skin. Other SSIs can involve tissues under the skin, organs, or implanted material.
SSI: Abdominal Hysterectomy 20% LOWER COMPARED TO NAT’L BASELINE
Virginia hospitals reported no significant change in SSIs related to abdominal hysterectomy surgery between 2012 and 2013.
0%Among the 19 hospitals in Virginia with enough data to calculate an SIR, 0% had an SIR significantly worse than the national SIR of 0.86.
SSI: Colon Surgery 10% LOWER COMPARED TO NAT’L BASELINE
Virginia hospitals reported no significant change in SSIs related to colon surgery between 2012 and 2013.
Several changes to the NHSN 2013 SSI protocol likely contributed to an increase in the national and some state- specific colon surgery SIRs compared to 2012.
7%Among the 43 hospitals in Virginia with enough data to calculate an SIR, 7% had an SIR significantly worse than the national SIR of 0.92.
C. difficile InfectionsLABORATORY IDENTIFIED HOSPITAL-ONSET C. DIFFICILE INFECTIONS
2% LOWER COMPARED TO NAT’L BASELINE
When a person takes antibiotics, good bacteria that protect against infection are destroyed for several months. During this time, patients can get sick from Clostridium difficile (C. difficile), bacteria that cause potentially deadly diarrhea, which can be spread in healthcare settings.
16%Among the 79 hospitals in Virginia with enough data to calculate an SIR, 16% had an SIR significantly worse than the national SIR of 0.90.
THIS REPORT IS BASED ON 2013 DATA, PUBLISHED JANUARY 2015

V I R G I N I AHEALTHCARE-ASSOCIATED INFECTION (HAI) DATA give healthcare facilities and public health agencies knowledge to design, implement, and evaluate HAI prevention efforts.
LEGEND
2013 state SIR is significantly lower (better) than comparison group
in column header
or
Change in 2013 state SIR compared to group in column header is not statistically significant
2013 state SIR is significantly higher (worse) than comparison group in
column header
2013 state SIR cannot be calculated
HAI TYPE# OF VIRGINIA
HOSPITALS THAT REPORTED DATA TO CDC’S NHSN, 2013
Total Hospitals in State: 109+
2013 STATE SIR vs.
2012 State SIR‡
2013 STATE SIR vs.
2013 Nat’l SIR
2013 STATE SIR vs.
Nat’l Baseline
2013 STATE SIR
2013 NAT’L SIR
CLABSI Nat’l Baseline: 2008
81 13% 7% 50% 0.50 0.54
CAUTI Nat’l Baseline: 2009
81 17% 1% 5% 1.05 1.06
SSI, Abdominal Hysterectomy Nat’l Baseline: 2008
66 7% 7% 20% 0.80 0.86
SSI, Colon Surgery Nat’l Baseline: 2008
75 17% 2% 10% 0.90 0.92
MRSA Bacteremia Nat’l Baseline: 2011
84 2012 SIR not available
1% 9% 0.91 0.92
C. difficile Infections Nat’l Baseline: 2011
84 2012 SIR not available
8% 2% 0.98 0.90
+Not all hospitals are required to report these infections; for example, some hospitals do not use central lines or urinary catheters, or do not perform colon or abdominal hysterectomy surgeries. ‡The state’s 2012 SIR can be found in the data tables of this report. Nat’l baseline time period varies by infection type. See first column of this table for specifics.
WHAT IS THE STANDARDIZED INFECTION RATIO?
The standardized infection ratio (SIR) is a summary statistic that can be used to track HAI prevention progress over time; lower SIRs are better. The SIR for a facility or state is adjusted to account for factors that might cause infection rates to be higher or lower, such as hospital size, teaching status, the type of patients a hospital serves, and surgery and patient characteristics.
WHAT IS VIRGINIA DOING TO PREVENT HEALTHCARE-ASSOCIATED INFECTIONS?
Virginia has a state mandate to publicly report at least one HAI to NHSN.
Prevention efforts to reduce specific HAIs:
■ Central line-associated bloodstream infections ■ Catheter-associated urinary tract infections ■ Surgical site infections
■ Multidrug-resistant infections (C. difficile, CRE) ■ Long-term care facilities ■ Antibiotic stewardship
Learn how your hospital is performing: www.medicare.gov/hospitalcompare For additional information:
■ 2013 HAI Progress Report: www.cdc.gov/hai/progress-report/ ■ NHSN: www.cdc.gov/nhsn ■ HAIs and prevention activities in Virginia: www.vdh.virginia.gov/Epidemiology/Surveillance/HAI/ ■ Virginia validation efforts: www.cdc.gov/hai/pdfs/state-progress-landscape.pdf
THIS REPORT IS BASED ON 2013 DATA, PUBLISHED JANUARY 2015
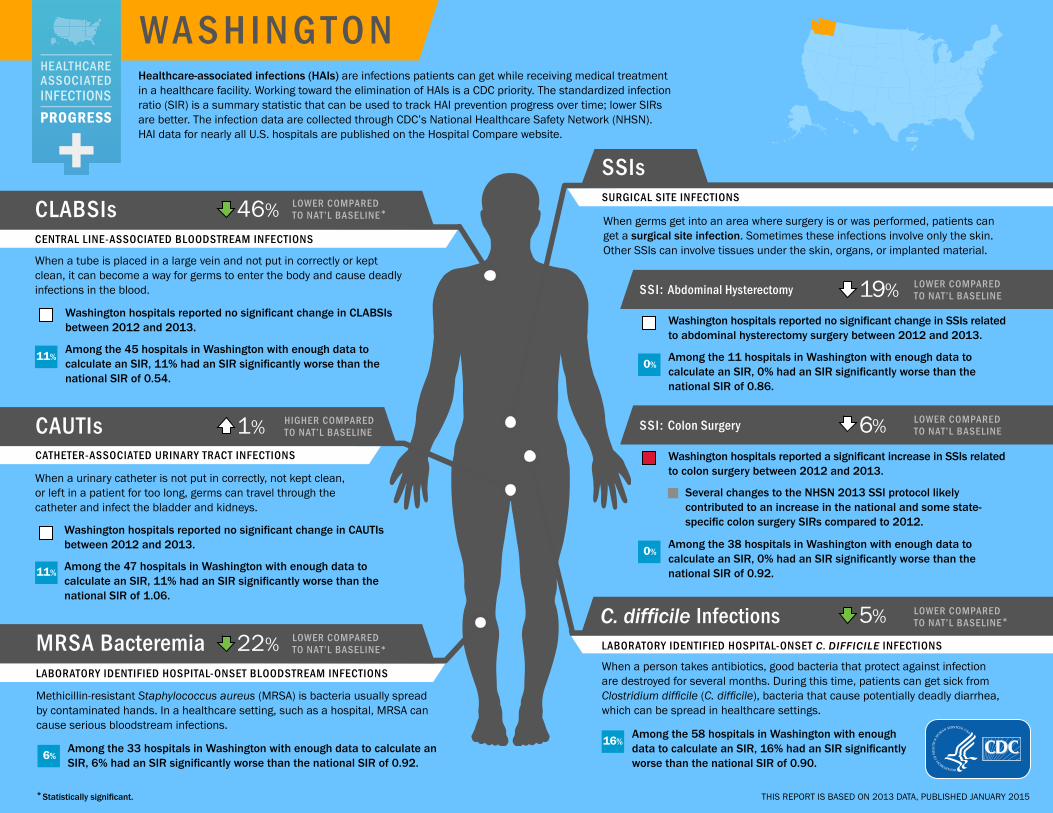
W A S H I N G T O NHealthcare-associated infections (HAIs) are infections patients can get while receiving medical treatment in a healthcare facility. Working toward the elimination of HAIs is a CDC priority. The standardized infection ratio (SIR) is a summary statistic that can be used to track HAI prevention progress over time; lower SIRs are better. The infection data are collected through CDC’s National Healthcare Safety Network (NHSN). HAI data for nearly all U.S. hospitals are published on the Hospital Compare website.
CLABSIsCENTRAL LINE-ASSOCIATED BLOODSTREAM INFECTIONS
46% LOWER COMPARED TO NAT’L BASELINE*
*Statistically significant.
When a tube is placed in a large vein and not put in correctly or kept clean, it can become a way for germs to enter the body and cause deadly infections in the blood.
Washington hospitals reported no significant change in CLABSIs between 2012 and 2013.
11%Among the 45 hospitals in Washington with enough data to calculate an SIR, 11% had an SIR significantly worse than the national SIR of 0.54.
CAUTIsCATHETER-ASSOCIATED URINARY TRACT INFECTIONS
1% HIGHER COMPARED TO NAT’L BASELINE
When a urinary catheter is not put in correctly, not kept clean, or left in a patient for too long, germs can travel through the catheter and infect the bladder and kidneys.
Washington hospitals reported no significant change in CAUTIs between 2012 and 2013.
11% Among the 47 hospitals in Washington with enough data to calculate an SIR, 11% had an SIR significantly worse than the national SIR of 1.06.
MRSA BacteremiaLABORATORY IDENTIFIED HOSPITAL-ONSET BLOODSTREAM INFECTIONS
22% LOWER COMPARED TO NAT’L BASELINE*
Methicillin-resistant Staphylococcus aureus (MRSA) is bacteria usually spread by contaminated hands. In a healthcare setting, such as a hospital, MRSA can cause serious bloodstream infections.
6%Among the 33 hospitals in Washington with enough data to calculate an SIR, 6% had an SIR significantly worse than the national SIR of 0.92.
SSIsSURGICAL SITE INFECTIONS
When germs get into an area where surgery is or was performed, patients can get a surgical site infection. Sometimes these infections involve only the skin. Other SSIs can involve tissues under the skin, organs, or implanted material.
SSI: Abdominal Hysterectomy 19% LOWER COMPARED TO NAT’L BASELINE
Washington hospitals reported no significant change in SSIs related to abdominal hysterectomy surgery between 2012 and 2013.
0%Among the 11 hospitals in Washington with enough data to calculate an SIR, 0% had an SIR significantly worse than the national SIR of 0.86.
SSI: Colon Surgery 6% LOWER COMPARED TO NAT’L BASELINE
Washington hospitals reported a significant increase in SSIs related to colon surgery between 2012 and 2013.
Several changes to the NHSN 2013 SSI protocol likely contributed to an increase in the national and some state- specific colon surgery SIRs compared to 2012.
0%Among the 38 hospitals in Washington with enough data to calculate an SIR, 0% had an SIR significantly worse than the national SIR of 0.92.
C. difficile InfectionsLABORATORY IDENTIFIED HOSPITAL-ONSET C. DIFFICILE INFECTIONS
5% LOWER COMPARED TO NAT’L BASELINE*
When a person takes antibiotics, good bacteria that protect against infection are destroyed for several months. During this time, patients can get sick from Clostridium difficile (C. difficile), bacteria that cause potentially deadly diarrhea, which can be spread in healthcare settings.
16%Among the 58 hospitals in Washington with enough data to calculate an SIR, 16% had an SIR significantly worse than the national SIR of 0.90.
THIS REPORT IS BASED ON 2013 DATA, PUBLISHED JANUARY 2015

W A S H I N G T O NHEALTHCARE-ASSOCIATED INFECTION (HAI) DATA give healthcare facilities and public health agencies knowledge to design, implement, and evaluate HAI prevention efforts.
LEGEND
2013 state SIR is significantly lower (better) than comparison group
in column header
or
Change in 2013 state SIR compared to group in column header is not statistically significant
2013 state SIR is significantly higher (worse) than comparison group in
column header
2013 state SIR cannot be calculated
HAI TYPE# OF WASHINGTON
HOSPITALS THAT REPORTED DATA TO CDC’S NHSN, 2013
Total Hospitals in State: 103+
2013 STATE SIR vs.
2012 State SIR‡
2013 STATE SIR vs.
2013 Nat’l SIR
2013 STATE SIR vs.
Nat’l Baseline
2013 STATE SIR
2013 NAT’L SIR
CLABSI Nat’l Baseline: 2008
83 5% < 1% 46% 0.54 0.54
CAUTI Nat’l Baseline: 2009
69 6% 4% 1% 1.01 1.06
SSI, Abdominal Hysterectomy Nat’l Baseline: 2008
64 32% 6% 19% 0.81 0.86
SSI, Colon Surgery Nat’l Baseline: 2008
70 39% 3% 6% 0.95 0.92
MRSA Bacteremia Nat’l Baseline: 2011
59 2012 SIR not available
15% 22% 0.78 0.92
C. difficile Infections Nat’l Baseline: 2011
61 2012 SIR not available
5% 5% 0.95 0.90
+Not all hospitals are required to report these infections; for example, some hospitals do not use central lines or urinary catheters, or do not perform colon or abdominal hysterectomy surgeries. ‡The state’s 2012 SIR can be found in the data tables of this report. Nat’l baseline time period varies by infection type. See first column of this table for specifics.
WHAT IS THE STANDARDIZED INFECTION RATIO?
The standardized infection ratio (SIR) is a summary statistic that can be used to track HAI prevention progress over time; lower SIRs are better. The SIR for a facility or state is adjusted to account for factors that might cause infection rates to be higher or lower, such as hospital size, teaching status, the type of patients a hospital serves, and surgery and patient characteristics.
WHAT IS WASHINGTON DOING TO PREVENT HEALTHCARE-ASSOCIATED INFECTIONS?
Washington has a state mandate to publicly report at least one HAI to NHSN.
Prevention efforts to reduce specific HAIs:
■ Central line-associated bloodstream infections ■ Catheter-associated urinary tract infections ■ Surgical site infections
■ Multidrug-resistant infections (MRSA, C. difficile, CRE, and others)
■ Long-term care facilities ■ Hand hygiene ■ Antibiotic stewardship ■ Healthcare personnel influenza vaccination
Learn how your hospital is performing: www.medicare.gov/hospitalcompare For additional information:
■ 2013 HAI Progress Report: www.cdc.gov/hai/progress-report/ ■ NHSN: www.cdc.gov/nhsn ■ HAIs and prevention activities in Washington: www.doh.wa.gov/YouandYourFamily/IllnessandDisease/
HealthcareAssociatedInfections ■ Washington validation efforts: www.cdc.gov/hai/pdfs/state-progress-landscape.pdf
THIS REPORT IS BASED ON 2013 DATA, PUBLISHED JANUARY 2015

W E S T V I R G I N I AHealthcare-associated infections (HAIs) are infections patients can get while receiving medical treatment in a healthcare facility. Working toward the elimination of HAIs is a CDC priority. The standardized infection ratio (SIR) is a summary statistic that can be used to track HAI prevention progress over time; lower SIRs are better. The infection data are collected through CDC’s National Healthcare Safety Network (NHSN). HAI data for nearly all U.S. hospitals are published on the Hospital Compare website.
CLABSIsCENTRAL LINE-ASSOCIATED BLOODSTREAM INFECTIONS
65% LOWER COMPARED TO NAT’L BASELINE*
*Statistically significant.
When a tube is placed in a large vein and not put in correctly or kept clean, it can become a way for germs to enter the body and cause deadly infections in the blood.
West Virginia hospitals reported no significant change in CLABSIs between 2012 and 2013.
0%Among the 24 hospitals in West Virginia with enough data to calculate an SIR, 0% had an SIR significantly worse than the national SIR of 0.54.
CAUTIsCATHETER-ASSOCIATED URINARY TRACT INFECTIONS
41% LOWER COMPARED TO NAT’L BASELINE*
When a urinary catheter is not put in correctly, not kept clean, or left in a patient for too long, germs can travel through the catheter and infect the bladder and kidneys.
West Virginia hospitals reported no significant change in CAUTIs between 2012 and 2013.
0% Among the 27 hospitals in West Virginia with enough data to calculate an SIR, 0% had an SIR significantly worse than the national SIR of 1.06.
MRSA BacteremiaLABORATORY IDENTIFIED HOSPITAL-ONSET BLOODSTREAM INFECTIONS
7% LOWER COMPARED TO NAT’L BASELINE
Methicillin-resistant Staphylococcus aureus (MRSA) is bacteria usually spread by contaminated hands. In a healthcare setting, such as a hospital, MRSA can cause serious bloodstream infections.
6%Among the 18 hospitals in West Virginia with enough data to calculate an SIR, 6% had an SIR significantly worse than the national SIR of 0.92.
SSIsSURGICAL SITE INFECTIONS
When germs get into an area where surgery is or was performed, patients can get a surgical site infection. Sometimes these infections involve only the skin. Other SSIs can involve tissues under the skin, organs, or implanted material.
SSI: Abdominal Hysterectomy 21% LOWER COMPARED TO NAT’L BASELINE
West Virginia hospitals reported no significant change in SSIs related to abdominal hysterectomy surgery between 2012 and 2013.
Not enough data to report how many hospitals had an SIR significantly worse than the national SIR of 0.86.
SSI: Colon Surgery 3% LOWER COMPARED TO NAT’L BASELINE
West Virginia hospitals reported no significant change in SSIs related to colon surgery between 2012 and 2013.
Several changes to the NHSN 2013 SSI protocol likely contributed to an increase in the national and some state- specific colon surgery SIRs compared to 2012.
12%Among the 17 hospitals in West Virginia with enough data to calculate an SIR, 12% had an SIR significantly worse than the national SIR of 0.92.
C. difficile InfectionsLABORATORY IDENTIFIED HOSPITAL-ONSET C. DIFFICILE INFECTIONS
2% HIGHER COMPARED TO NAT’L BASELINE
When a person takes antibiotics, good bacteria that protect against infection are destroyed for several months. During this time, patients can get sick from Clostridium difficile (C. difficile), bacteria that cause potentially deadly diarrhea, which can be spread in healthcare settings.
14%Among the 36 hospitals in West Virginia with enough data to calculate an SIR, 14% had an SIR significantly worse than the national SIR of 0.90.
THIS REPORT IS BASED ON 2013 DATA, PUBLISHED JANUARY 2015

W E S T V I R G I N I AHEALTHCARE-ASSOCIATED INFECTION (HAI) DATA give healthcare facilities and public health agencies knowledge to design, implement, and evaluate HAI prevention efforts.
LEGEND
2013 state SIR is significantly lower (better) than comparison group
in column header
or
Change in 2013 state SIR compared to group in column header is not statistically significant
2013 state SIR is significantly higher (worse) than comparison group in
column header
2013 state SIR cannot be calculated
HAI TYPE# OF WEST VIRGINIA
HOSPITALS THAT REPORTED DATA TO CDC’S NHSN, 2013
Total Hospitals in State: 58+
2013 STATE SIR vs.
2012 State SIR‡
2013 STATE SIR vs.
2013 Nat’l SIR
2013 STATE SIR vs.
Nat’l Baseline
2013 STATE SIR
2013 NAT’L SIR
CLABSI Nat’l Baseline: 2008
43 8% 35% 65% 0.35 0.54
CAUTI Nat’l Baseline: 2009
47 15% 44% 41% 0.59 1.06
SSI, Abdominal Hysterectomy Nat’l Baseline: 2008
34 63% 8% 21% 0.79 0.86
SSI, Colon Surgery Nat’l Baseline: 2008
36 1% 5% 3% 0.97 0.92
MRSA Bacteremia Nat’l Baseline: 2011
39 2012 SIR not available
1% 7% 0.93 0.92
C. difficile Infections Nat’l Baseline: 2011
41 2012 SIR not available
13% 2% 1.02 0.90
+Not all hospitals are required to report these infections; for example, some hospitals do not use central lines or urinary catheters, or do not perform colon or abdominal hysterectomy surgeries. ‡The state’s 2012 SIR can be found in the data tables of this report. Nat’l baseline time period varies by infection type. See first column of this table for specifics.
WHAT IS THE STANDARDIZED INFECTION RATIO?
The standardized infection ratio (SIR) is a summary statistic that can be used to track HAI prevention progress over time; lower SIRs are better. The SIR for a facility or state is adjusted to account for factors that might cause infection rates to be higher or lower, such as hospital size, teaching status, the type of patients a hospital serves, and surgery and patient characteristics.
WHAT IS WEST VIRGINIA DOING TO PREVENT HEALTHCARE-ASSOCIATED INFECTIONS?
West Virginia has a state mandate to publicly report at least one HAI to NHSN.
Prevention efforts to reduce specific HAIs:
■ Central line-associated bloodstream infections ■ Catheter-associated urinary tract infections ■ Surgical site infections
■ Multidrug-resistant infections (C. difficile) ■ Long-term care facilities ■ Antibiotic stewardship
Learn how your hospital is performing: www.medicare.gov/hospitalcompare For additional information:
■ 2013 HAI Progress Report: www.cdc.gov/hai/progress-report/ ■ NHSN: www.cdc.gov/nhsn ■ HAIs and prevention activities in West Virginia: www.dhhr.wv.gov/oeps/disease/HAI/Pages/default.aspx ■ West Virginia validation efforts: www.cdc.gov/hai/pdfs/state-progress-landscape.pdf
THIS REPORT IS BASED ON 2013 DATA, PUBLISHED JANUARY 2015
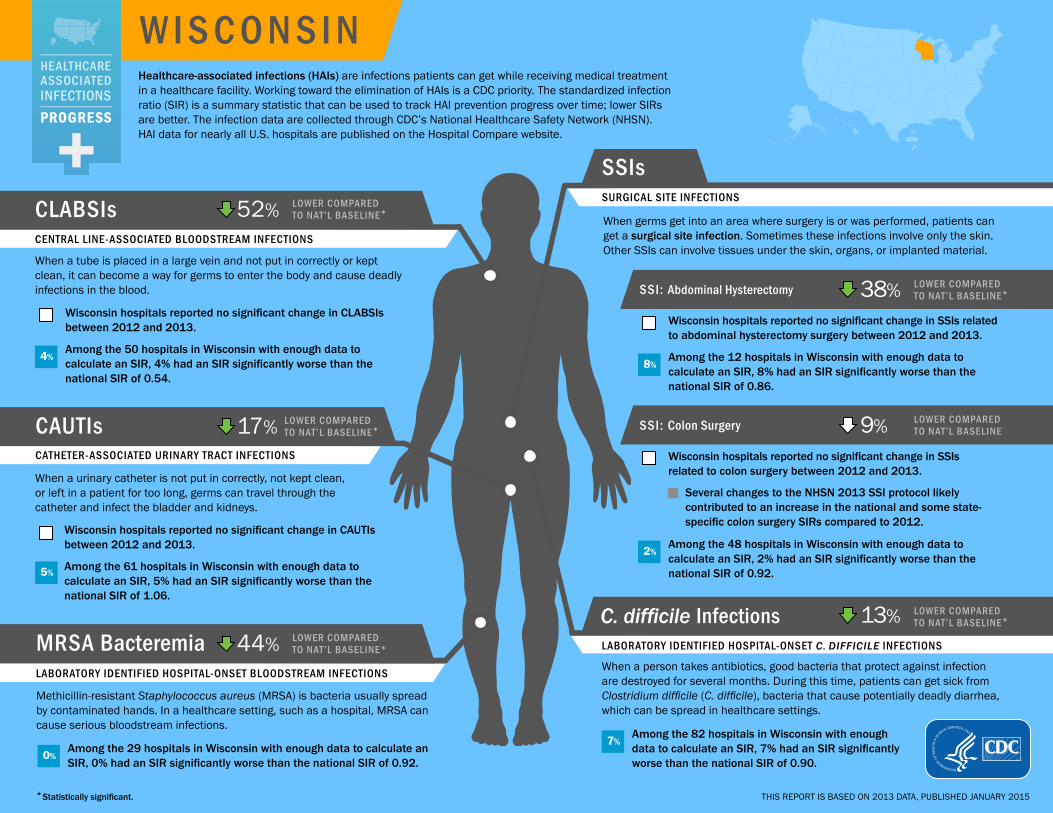
W I S C O N S I NHealthcare-associated infections (HAIs) are infections patients can get while receiving medical treatment in a healthcare facility. Working toward the elimination of HAIs is a CDC priority. The standardized infection ratio (SIR) is a summary statistic that can be used to track HAI prevention progress over time; lower SIRs are better. The infection data are collected through CDC’s National Healthcare Safety Network (NHSN). HAI data for nearly all U.S. hospitals are published on the Hospital Compare website.
CLABSIsCENTRAL LINE-ASSOCIATED BLOODSTREAM INFECTIONS
52% LOWER COMPARED TO NAT’L BASELINE*
*Statistically significant.
When a tube is placed in a large vein and not put in correctly or kept clean, it can become a way for germs to enter the body and cause deadly infections in the blood.
Wisconsin hospitals reported no significant change in CLABSIs between 2012 and 2013.
4%Among the 50 hospitals in Wisconsin with enough data to calculate an SIR, 4% had an SIR significantly worse than the national SIR of 0.54.
CAUTIsCATHETER-ASSOCIATED URINARY TRACT INFECTIONS
17% LOWER COMPARED TO NAT’L BASELINE*
When a urinary catheter is not put in correctly, not kept clean, or left in a patient for too long, germs can travel through the catheter and infect the bladder and kidneys.
Wisconsin hospitals reported no significant change in CAUTIs between 2012 and 2013.
5% Among the 61 hospitals in Wisconsin with enough data to calculate an SIR, 5% had an SIR significantly worse than the national SIR of 1.06.
MRSA BacteremiaLABORATORY IDENTIFIED HOSPITAL-ONSET BLOODSTREAM INFECTIONS
44% LOWER COMPARED TO NAT’L BASELINE*
Methicillin-resistant Staphylococcus aureus (MRSA) is bacteria usually spread by contaminated hands. In a healthcare setting, such as a hospital, MRSA can cause serious bloodstream infections.
0%Among the 29 hospitals in Wisconsin with enough data to calculate an SIR, 0% had an SIR significantly worse than the national SIR of 0.92.
SSIsSURGICAL SITE INFECTIONS
When germs get into an area where surgery is or was performed, patients can get a surgical site infection. Sometimes these infections involve only the skin. Other SSIs can involve tissues under the skin, organs, or implanted material.
SSI: Abdominal Hysterectomy 38% LOWER COMPARED TO NAT’L BASELINE*
Wisconsin hospitals reported no significant change in SSIs related to abdominal hysterectomy surgery between 2012 and 2013.
8%Among the 12 hospitals in Wisconsin with enough data to calculate an SIR, 8% had an SIR significantly worse than the national SIR of 0.86.
SSI: Colon Surgery 9% LOWER COMPARED TO NAT’L BASELINE
Wisconsin hospitals reported no significant change in SSIs related to colon surgery between 2012 and 2013.
Several changes to the NHSN 2013 SSI protocol likely contributed to an increase in the national and some state- specific colon surgery SIRs compared to 2012.
2%Among the 48 hospitals in Wisconsin with enough data to calculate an SIR, 2% had an SIR significantly worse than the national SIR of 0.92.
C. difficile InfectionsLABORATORY IDENTIFIED HOSPITAL-ONSET C. DIFFICILE INFECTIONS
13% LOWER COMPARED TO NAT’L BASELINE*
When a person takes antibiotics, good bacteria that protect against infection are destroyed for several months. During this time, patients can get sick from Clostridium difficile (C. difficile), bacteria that cause potentially deadly diarrhea, which can be spread in healthcare settings.
7%Among the 82 hospitals in Wisconsin with enough data to calculate an SIR, 7% had an SIR significantly worse than the national SIR of 0.90.
THIS REPORT IS BASED ON 2013 DATA, PUBLISHED JANUARY 2015

W I S C O N S I NHEALTHCARE-ASSOCIATED INFECTION (HAI) DATA give healthcare facilities and public health agencies knowledge to design, implement, and evaluate HAI prevention efforts.
LEGEND
2013 state SIR is significantly lower (better) than comparison group
in column header
or
Change in 2013 state SIR compared to group in column header is not statistically significant
2013 state SIR is significantly higher (worse) than comparison group in
column header
2013 state SIR cannot be calculated
HAI TYPE# OF WISCONSIN
HOSPITALS THAT REPORTED DATA TO CDC’S NHSN, 2013
Total Hospitals in State: 144+
2013 STATE SIR vs.
2012 State SIR‡
2013 STATE SIR vs.
2013 Nat’l SIR
2013 STATE SIR vs.
Nat’l Baseline
2013 STATE SIR
2013 NAT’L SIR
CLABSI Nat’l Baseline: 2008
90 10% 11% 52% 0.48 0.54
CAUTI Nat’l Baseline: 2009
102 5% 22% 17% 0.83 1.06
SSI, Abdominal Hysterectomy Nat’l Baseline: 2008
75 33% 29% 38% 0.62 0.86
SSI, Colon Surgery Nat’l Baseline: 2008
84 12% 1% 9% 0.91 0.92
MRSA Bacteremia Nat’l Baseline: 2011
88 2012 SIR not available
39% 44% 0.56 0.92
C. difficile Infections Nat’l Baseline: 2011
95 2012 SIR not available
4% 13% 0.87 0.90
+Not all hospitals are required to report these infections; for example, some hospitals do not use central lines or urinary catheters, or do not perform colon or abdominal hysterectomy surgeries. ‡The state’s 2012 SIR can be found in the data tables of this report. Nat’l baseline time period varies by infection type. See first column of this table for specifics.
WHAT IS THE STANDARDIZED INFECTION RATIO?
The standardized infection ratio (SIR) is a summary statistic that can be used to track HAI prevention progress over time; lower SIRs are better. The SIR for a facility or state is adjusted to account for factors that might cause infection rates to be higher or lower, such as hospital size, teaching status, the type of patients a hospital serves, and surgery and patient characteristics.
WHAT IS WISCONSIN DOING TO PREVENT HEALTHCARE-ASSOCIATED INFECTIONS?
Prevention efforts to reduce specific HAIs:
■ Central line-associated bloodstream infections ■ Catheter-associated urinary tract infections ■ Surgical site infections ■ Multidrug-resistant infections (C. difficile, CRE) ■ Long-term care facilities
Learn how your hospital is performing: www.medicare.gov/hospitalcompare For additional information:
■ 2013 HAI Progress Report: www.cdc.gov/hai/progress-report/ ■ NHSN: www.cdc.gov/nhsn ■ HAIs and prevention activities in Wisconsin: www.dhs.wisconsin.gov/communicable/HAI/index.htm ■ Wisconsin validation efforts: www.cdc.gov/hai/pdfs/state-progress-landscape.pdf
THIS REPORT IS BASED ON 2013 DATA, PUBLISHED JANUARY 2015

W Y O M I N GHealthcare-associated infections (HAIs) are infections patients can get while receiving medical treatment in a healthcare facility. Working toward the elimination of HAIs is a CDC priority. The standardized infection ratio (SIR) is a summary statistic that can be used to track HAI prevention progress over time; lower SIRs are better. The infection data are collected through CDC’s National Healthcare Safety Network (NHSN). HAI data for nearly all U.S. hospitals are published on the Hospital Compare website.
CLABSIsCENTRAL LINE-ASSOCIATED BLOODSTREAM INFECTIONS
47% LOWER COMPARED TO NAT’L BASELINE
*Statistically significant.
When a tube is placed in a large vein and not put in correctly or kept clean, it can become a way for germs to enter the body and cause deadly infections in the blood.
Wyoming hospitals reported no significant change in CLABSIs between 2012 and 2013.
Not enough data to report how many hospitals had an SIR significantly worse than the national SIR of 0.54.
CAUTIsCATHETER-ASSOCIATED URINARY TRACT INFECTIONS
47% LOWER COMPARED TO NAT’L BASELINE*
When a urinary catheter is not put in correctly, not kept clean, or left in a patient for too long, germs can travel through the catheter and infect the bladder and kidneys.
Wyoming hospitals reported no significant change in CAUTIs between 2012 and 2013.
Not enough data to report how many hospitals had an SIR significantly worse than the national SIR of 1.06.
MRSA BacteremiaLABORATORY IDENTIFIED HOSPITAL-ONSET BLOODSTREAM INFECTIONS
30% LOWER COMPARED TO NAT’L BASELINE
Methicillin-resistant Staphylococcus aureus (MRSA) is bacteria usually spread by contaminated hands. In a healthcare setting, such as a hospital, MRSA can cause serious bloodstream infections.
Not enough data to report how many hospitals had an SIR significantly worse than the national SIR of 0.92.
SSIsSURGICAL SITE INFECTIONS
When germs get into an area where surgery is or was performed, patients can get a surgical site infection. Sometimes these infections involve only the skin. Other SSIs can involve tissues under the skin, organs, or implanted material.
SSI: Abdominal Hysterectomy 28% HIGHER COMPARED TO NAT’L BASELINE
Wyoming hospitals reported no significant change in SSIs related to abdominal hysterectomy surgery between 2012 and 2013.
Not enough data to report how many hospitals had an SIR significantly worse than the national SIR of 0.86.
SSI: Colon Surgery 57% LOWER COMPARED TO NAT’L BASELINE
Wyoming hospitals reported no significant change in SSIs related to colon surgery between 2012 and 2013.
Several changes to the NHSN 2013 SSI protocol likely contributed to an increase in the national and some state- specific colon surgery SIRs compared to 2012.
Not enough data to report how many hospitals had an SIR significantly worse than the national SIR of 0.92.
C. difficile InfectionsLABORATORY IDENTIFIED HOSPITAL-ONSET C. DIFFICILE INFECTIONS
19% LOWER COMPARED TO NAT’L BASELINE
When a person takes antibiotics, good bacteria that protect against infection are destroyed for several months. During this time, patients can get sick from Clostridium difficile (C. difficile), bacteria that cause potentially deadly diarrhea, which can be spread in healthcare settings.
0%Among the 19 hospitals in Wyoming with enough data to calculate an SIR, 0% had an SIR significantly worse than the national SIR of 0.90.
THIS REPORT IS BASED ON 2013 DATA, PUBLISHED JANUARY 2015

W Y O M I N GHEALTHCARE-ASSOCIATED INFECTION (HAI) DATA give healthcare facilities and public health agencies knowledge to design, implement, and evaluate HAI prevention efforts.
LEGEND
2013 state SIR is significantly lower (better) than comparison group
in column header
or
Change in 2013 state SIR compared to group in column header is not statistically significant
2013 state SIR is significantly higher (worse) than comparison group in
column header
2013 state SIR cannot be calculated
HAI TYPE# OF WYOMING
HOSPITALS THAT REPORTED DATA TO CDC’S NHSN, 2013
Total Hospitals in State: 31+
2013 STATE SIR vs.
2012 State SIR‡
2013 STATE SIR vs.
2013 Nat’l SIR
2013 STATE SIR vs.
Nat’l Baseline
2013 STATE SIR
2013 NAT’L SIR
CLABSI Nat’l Baseline: 2008
21 225% 2% 47% 0.53 0.54
CAUTI Nat’l Baseline: 2009
24 41% 50% 47% 0.53 1.06
SSI, Abdominal Hysterectomy Nat’l Baseline: 2008
13 85% 49% 28% 1.28 0.86
SSI, Colon Surgery Nat’l Baseline: 2008
12 66% 53% 57% 0.43 0.92
MRSA Bacteremia Nat’l Baseline: 2011
14 2012 SIR not available
23% 30% 0.70 0.92
C. difficile Infections Nat’l Baseline: 2011
27 2012 SIR not available
10% 19% 0.81 0.90
+Not all hospitals are required to report these infections; for example, some hospitals do not use central lines or urinary catheters, or do not perform colon or abdominal hysterectomy surgeries. ‡The state’s 2012 SIR can be found in the data tables of this report. Nat’l baseline time period varies by infection type. See first column of this table for specifics.
WHAT IS THE STANDARDIZED INFECTION RATIO?
The standardized infection ratio (SIR) is a summary statistic that can be used to track HAI prevention progress over time; lower SIRs are better. The SIR for a facility or state is adjusted to account for factors that might cause infection rates to be higher or lower, such as hospital size, teaching status, the type of patients a hospital serves, and surgery and patient characteristics.
WHAT IS WYOMING DOING TO PREVENT HEALTHCARE-ASSOCIATED INFECTIONS?
Prevention efforts to reduce specific HAIs:
■ Central line-associated bloodstream infections ■ Catheter-associated urinary tract infections ■ Surgical site infections ■ Multidrug-resistant infections (MRSA, C. difficile) ■ Long-term care facilities
Learn how your hospital is performing: www.medicare.gov/hospitalcompare For additional information:
■ 2013 HAI Progress Report: www.cdc.gov/hai/progress-report/ ■ NHSN: www.cdc.gov/nhsn ■ HAIs and prevention activities in Wyoming: www.health.wyo.gov/phsd/epiid/HAIgeneral.html ■ Wyoming validation efforts: www.cdc.gov/hai/pdfs/state-progress-landscape.pdf
THIS REPORT IS BASED ON 2013 DATA, PUBLISHED JANUARY 2015

128NATIONAL AND STATE HEALTHCARE-ASSOCIATED INFECTIONS PROGRESS REPORT
CALL TO ACTION
T he National and State Healthcare-Associated Infection
Progress Report should be used by health departments,
hospital associations, professional societies, healthcare
systems and facilities, and quality improvement groups to identify
infections that need additional prevention efforts . As identified in
this report, most infections are decreasing . Despite this progress,
the nation did not reach the 2013 goals established by the
HAI Action Plan in 2009, and catheter-associated urinary tract
infections (CAUTI) have increased since 2009 .
Together with health care and public health partners, CDC is
working to bring increased attention to HAI prevention and
reverse the CAUTI trend . Early data from 2014 shows that these
infections have started to decrease . CDC-recommended infection
prevention strategies for several infection types, including CAUTI,
have proven effective in a variety of patient care locations . CDC
continues to assist public health and clinical partners with
implementation of those recommendations . In addition, CDC is
working with health departments and quality improvement groups
to specifically identify and assist hospitals in need of infection
prevention assistance .
State health department efforts to assess the quality and
completeness of data reported to NHSN are critical to improving
confidence data validity . Ongoing interactions between state and
federal public health agencies and their partners in the healthcare
sector will be vital to sustaining and extending HAI tracking
and prevention .
CDC will continue to measure progress at the state and national
levels . Prevention goals are most likely to be met with targeted
efforts to cut infection types shown to be lagging behind and to
make further progress on the infection types headed in the right
direction . Preventing HAIs is possible, but it will take a conscious
effort by clinicians, healthcare facilities and systems, public
health, quality improvement groups, and the federal government to
work together toward protecting patients and saving lives .

129NATIONAL AND STATE HEALTHCARE-ASSOCIATED INFECTIONS PROGRESS REPORT
TECHNICAL APPENDIX
METHODSThe current National and State Healthcare-Associated Infections
Progress Report presents data reported to the National
Healthcare Safety Network (NHSN) for the calendar year 2013 .
The healthcare-associated infection (HAI) data were reported
either by mandate or voluntarily from hospitals in all 50 states,
Washington, D .C ., and Puerto Rico . Data included in the annual
report use standardized NHSN definitions for central line-
associated bloodstream infections (CLABSI), catheter-associated
urinary tract infections (CAUTI), surgical site infections (SSI), and
laboratory identified methicillin-resistant Staphylococcus aureus
(MRSA) bacteremia (bloodstream infections) and Clostridium
difficile (C . difficile) events . To account for delayed reporting,
data reported through July 1, 2014, were included .
Data in this report are from acute care and critical access
hospitals only . To focus on HAIs among acute care hospital
patients, data from long-term acute care facilities and
rehabilitation hospitals were excluded (HAI rates for these settings
are available on CDC’s NHSN website) . The CLABSI and CAUTI data
are inclusive of data reported from all applicable locations within
hospitals . CLABSI and CAUTI data stratified by location type (e .g .
critical care units and wards) are available on CDC’s HAI Progress
Report website (see Data Tables) . For this report, wards include
step-down units and specialty care areas including hematology/
oncology and bone marrow transplant units . CLABSI data are also
reported from neonatal intensive care units (NICUs) . The national
SSI data included in this report include 10 select procedures that
approximate the procedures included in the Centers for Medicare
& Medicaid Services (CMS) Surgical Care Improvement Project
(SCIP) . Only deep incisional and organ/space infections detected
during the same admission as the surgical procedure or upon
readmission to the same hospital that performed the surgical
procedure are included in the reported SIRs; superficial incisional
SSIs and those identified on post-discharge surveillance are
excluded . The state-specific SSI data included in this report only
include data from the two surgical procedures reported to the
CMS Hospital Inpatient Quality Reporting (IQR) program – colon
surgery and abdominal hysterectomy surgery . Data reported
for MRSA bacteremia and C . difficile infections are only cases
classified as hospital-onset, but community-acquired cases are
reported to NHSN and are included in the risk adjustment to
produce the SIR .
In addition to the NHSN data used to produce the SIRs in this
report, several external data sources were used to provide
additional metrics . State health department HAI programs were
contacted to assess status and specific requirements of state HAI
reporting mandates to NHSN, as well as efforts to validate 2013
HAI data and prevention collaboratives that occurred from January
130NATIONAL AND STATE HEALTHCARE-ASSOCIATED INFECTIONS PROGRESS REPORT
2013 to December 2014 . This report indicates the presence of
a state reporting mandate by either the state health department
or the hospital association . Validation efforts were classified into
two categories for each HAI type: data checked for quality and
additional in-depth data review . The following criteria were used to
assign credit to states that performed data quality checks: state
health department had access to 2013 NHSN data, performed
regular data cleaning/quality checks on at least 6 months of
2013 data prior to July 1, 2014, and indicated that hospitals
would be contacted if data errors, outliers, or missing information
were found . A state received credit for additional in-depth data
review if the state performed any type of audit of their hospitals’
data prior to July 1, 2014, meaning the state health department
reviewed hospital medical records and/or laboratory records to
confirm proper case ascertainment and data entry into NHSN .
Validation efforts should be taken into account when evaluating an
individual state’s performance . States that perform more vigorous
data validation activities are more likely to find hospital records
of infections, and therefore these states may have higher SIRs
compared to states that do not perform validation . Not all state
health departments have access to NHSN data or have access to
NHSN data from every hospital included in this report .
This report followed the same methodology as last year’s report
to estimate the number of hospitals in each state . The CLABSI
and SSI SIRs continue to use a referent period of January 2006
to December 2008 . The CAUTI SIRs use a referent period of
calendar year 2009, and the MRSA bacteremia and C . difficile
infection SIRs use a referent period of January 2010 to December
2011 . The risk adjustment methodology used to produce the
CLABSI, CAUTI, and SSI SIRs are summarized in previous reports
and have not changed . State-specific SIRs for hospital-onset
MRSA bacteremia and C . difficile infections are included for the
first time in this report and are risk adjusted for facility bed size,
affiliation with a medical school, admission prevalence rate, and
laboratory identification method for C . difficile infections .
The SIRs published in this report compare the observed number
of infections reported to NHSN during 2013 to the predicted
number of infections based on infection rates during the referent
period, adjusting for key risk factors . Annual progress in preventing
CLABSIs, CAUTIs, SSIs, MRSA bacteremia, and C . difficile
infections was evaluated by comparing 2012 and 2013 SIRs by
infection type and location or surgical procedure category . SIRs
between the two reporting years were compared for all reporting
facilities in each state, and the change in SIRs was assessed for
statistical significance using a mid-p exact test . For any state with
a referent SIR of 0, the percent change was reflected as greater
than 100 percent . A state SIR was only calculated if at least five
hospitals in the state reported data for a given location category

131NATIONAL AND STATE HEALTHCARE-ASSOCIATED INFECTIONS PROGRESS REPORT
or surgical procedure in 2013 . State SIRs were compared to
the national SIR with the state’s data removed; significance was
assessed using a mid-p exact test . Facility-specific SIRs were
calculated if the facility had at least one predicted HAI for a given
location category or surgical procedure . These facility-specific
SIRs were used to create a distribution if at least 20 facilities
had sufficient data to calculate an SIR . Additionally, the facility-
specific SIRs were compared to the national SIR for each location
or procedure category; if at least 10 facilities in each category
had sufficient data to calculate an SIR, the percent of facilities
significantly higher or lower than the national SIR was calculated
both nationally and by state .
For complete data tables and a glossary of terms, please visit
CDC’s HAI Progress Report website at www.cdc.gov/hai/progress-
report .

132NATIONAL AND STATE HEALTHCARE-ASSOCIATED INFECTIONS PROGRESS REPORT
REFERENCESCenters for Medicare and Medicaid Services . Inpatient Quality
Reporting Program – Healthcare-associated infections . Available
at https://www.qualitynet.org/dcs/ContentServer?c=Page&page
name=QnetPublic%2FPage%2FQnetTier2&cid=1228760487021 .
Accessed December 23, 2014 .
Dudeck MA, Weiner LM, Allen-Bridson K, et al . National Healthcare
Safety Network (NHSN) report, data summary for 2012, Device-
associated Module . Am J Infect Control 2013; 41(12):1148-66 .
Mu Y, Edwards JR, Horan TC, et al . Improving risk-adjusted
measures of surgical site infection for the National Healthcare
Safety Network . Infect Control Hosp Epidemiol 2011; 32(10):
970-986 .
Dudeck MA, Weiner LM, Malpiedi PJ, et al . Risk adjustment
for healthcare-facility onset C . difficile and MRSA bacteremia
Laboratory-Identified Event reporting in NHSN . Available at http://
www.cdc.gov/nhsn/PDFs/mrsa-cdi/RiskAdjustment-MRSA-CDI.pdf .
Accessed December 23, 2014 .
Sievert DM, Ricks P, Edwards JR, et al . Antimicrobial-resistant
pathogens associated with healthcare-associated infections:
summary of data reported to the National Healthcare Safety
Network at the Centers for Disease Control and Prevention,
2009-10 . Infection Control Hosp Epidemiol 2013; 34(1):1-14 .
Centers for Disease Control and Prevention . 2012 National and
State Healthcare-Associated Infections Progress Report . Published
March 26, 2014 . Available at http://www.cdc.gov/nhsn/dataStat.
html#nr . Accessed December 23, 2014 .
Centers for Disease Control and Prevention . Acute care hospital
surveillance for central line-associated bloodstream infections .
http://www.cdc.gov/nhsn/acute-care-hospital/clabsi/index.html .
Accessed December 23, 2014 .
Centers for Disease Control and Prevention . Acute care hospital
surveillance for catheter-associated urinary tract infections .
http://www.cdc.gov/nhsn/acute-care-hospital/CAUTI/index.html .
Accessed December 23, 2014 .
Centers for Disease Control and Prevention . Acute care hospital
surveillance for surgical site infections . http://www.cdc.gov/nhsn/
acute-care-hospital/ssi/index.html . Accessed December 23, 2014 .
Centers for Disease Control and Prevention . Acute care hospital
surveillance for C . difficile, MRSA, and other drug-resistant
infections . Available at http://www.cdc.gov/nhsn/acute-care-
hospital/cdiff-mrsa/index.html . Accessed December 23, 2014 .

133NATIONAL AND STATE HEALTHCARE-ASSOCIATED INFECTIONS PROGRESS REPORT
US Department of Health and Human Services . National Action
Plan to Prevent Healthcare-associated Infections . Available at
http://www.health.gov/hai/prevent_hai.asp#hai_measures .
Accessed December 23, 2014 .
Centers for Disease Control and Prevention . NHSN validation
guidance and toolkit; validation for 2013 central line-associated
bloodstream infections in ICUs . Available at http://www.cdc.gov/
nhsn/validation/index.html . Accessed December 23, 2014 .
ACKNOWLEDGEMENTSWe thank the infection preventionists, hospital epidemiologists,
and other dedicated hospital staff who report surveillance data to
NHSN . We also thank our colleagues in HAI programs in state and
local health departments .
This report was prepared by the following CDC staff: Lacey Avery,
Ramona Bennett, Kristen Brinsley-Rainisch, Meredith Boyter,
Nicole Coffin, Swapna Deshpande, Margaret Dudeck, Jonathan
Edwards, Susan Fuller, Renee Maciejewski, Paul Malpiedi, Fred
Maxineau, L . Clifford McDonald, Rose Pecoraro, Kelly Peterson,
Minn Soe, Jason Snow, Abbigail Tumpey, Lindsey Weiner, Joni
Young, and Kim Zimmerman, Division of Healthcare Quality
Promotion, National Center for Emerging and Zoonotic Diseases .

134NATIONAL AND STATE HEALTHCARE-ASSOCIATED INFECTIONS PROGRESS REPORT
GLOSSARY
Terms and topics from CDC’s National and State Healthcare-
Associated Infections Progress Report .
Click on the category to locate specific terms:
Organizational Structure • Infections Reported
Prevention Collaboratives • Calculations
ORGANIZATIONAL STRUCTURECenters for Disease Control and Prevention (CDC): Housed within
U.S. Department of Health and Human Services, CDC is charged
with protecting the public health of the Nation by providing
leadership and direction in the prevention of and control of
diseases and other preventable conditions, and responding to
public health emergencies . CDC works 24/7 to protect America
from health, safety and security threats, both foreign and in
the U .S .
Emerging Infections Program (EIP): A national resource utilized
for surveillance, prevention, and control of emerging infectious
diseases . EIP is a network of 10 state health departments (CA,
CO, CT, GA, MD, MN, NM, NY, OR, TN) and their collaborators in
local health departments, academic institutions, other federal
agencies, and public health and clinical laboratories; infection
preventionists; and healthcare providers . The EIP population is
roughly representative of the U .S . population on the basis of
demographic characteristics, such as age, gender, race, and more .
Hospital Compare: A consumer-oriented website that provides
information on how well hospitals provide recommended care
to their patients . Hospital Compare was created through the
efforts of the Centers for Medicare & Medicaid Services (CMS),
in collaboration with organizations representing consumers,
hospitals, doctors, employers, accrediting organizations, and
other Federal agencies . Hospitals participating in the CMS quality
reporting program submit healthcare-associated infection data to
CDC’s National Healthcare Safety Network (NHSN) . NHSN shares
these data with CMS for public posting on Hospital Compare,
which helps consumers make informed decisions about their
health care .
National Healthcare Safety Network (NHSN): CDC’s NHSN is the
nation’s most widely used healthcare-associated (HAI) infection
tracking system . NHSN provides facilities, states, regions, and
the nation with data needed to identify problem areas, measure
progress of prevention efforts, and ultimately eliminate HAIs .
In addition, NHSN allows healthcare facilities to track blood
safety errors and important healthcare process measures such
as healthcare personnel influenza vaccine status and infection
control adherence rates .

135NATIONAL AND STATE HEALTHCARE-ASSOCIATED INFECTIONS PROGRESS REPORT
INFECTIONS REPORTEDCatheter-associated urinary tract infection (CAUTI): A urinary tract
infection (UTI) is an infection involving any part of the urinary
system, including urethra, bladder, ureters, and kidney . When a
urinary catheter is not put in correctly, not kept clean, or left in a
patient for too long, germs can travel through the catheter and
infect the bladder and kidneys . In this report, the CAUTI data
include all infections reported to National Healthcare Safety
Network from all applicable locations, including intensive care
units and wards .
Central line-associated bloodstream infection (CLABSI): When
a tube is placed in a large vein and not put in correctly or kept
clean, it can become a way for germs to enter the body and
cause deadly infections in the blood . In this report, the CLABSI
data include all infections reported to National Healthcare Safety
Network from all applicable locations, including intensive care
units, neonatal intensive care unit, and wards .
Clostridium difficile (C. difficile, C. diff): When a person takes
antibiotics, good bacteria that protect against infection are
destroyed for several months . During this time, patients can get
sick from C . difficile, bacteria that cause life-threatening diarrhea .
Often, C . difficile infections occur in hospitalized or recently
hospitalized patients . In this report, the C . difficile data include all
laboratory identified hospital-onset infections reported to National
Healthcare Safety Network from all inpatient locations in the
facility, with the exception of the neonatal intensive care units and
well-baby locations .
Healthcare-associated infection (HAI): Infection patients can get
while receiving medical treatment in hospitals, outpatient clinics,
nursing homes, and other facilities where people receive care .
Hospital-onset HAI: For reporting to National Healthcare
Safety Network, an infection is considered hospital-onset if
the patient begins to show infection symptoms on or after the
fourth day of admission .
Laboratory identified (LabID) Event: For reporting to National
Healthcare Safety Network, an infection is considered
laboratory identified when a patient sample is tested and
confirmed by laboratory test only (i .e ., clinical evaluation of the
patient is not required) .
Methicillin-resistant Staphylococcus aureus (MRSA): A type
of staph bacteria that is resistant to many antibiotics . In this
report, the MRSA data include all laboratory identified hospital-
onset MRSA bacteremia (bloodstream infections) reported to
National Healthcare Safety Network from all inpatient locations in
the facility .

136NATIONAL AND STATE HEALTHCARE-ASSOCIATED INFECTIONS PROGRESS REPORT
Surgical site infection (SSI): When germs get into an area where
surgery is or was performed, patients can get a surgical site
infection . Sometimes these infections involve only the skin .
Other SSIs can involve tissues under the skin, organs, or
implanted material .
Implanted material: An object or material inserted or grafted
into the body, such as prosthetic joints .
PREVENTION COLLABORATIVESAntibiotic resistance (antimicrobial resistance): Antibiotic
resistance is the result of bacteria changing in ways that reduce or
eliminate the effectiveness of antibiotics . Antimicrobial resistance
is result of microorganisms changing in ways that reduce or
eliminate the effectiveness of drugs, chemicals, or other agents
used to cure or prevent infections . Antibiotic resistance is one
type of antimicrobial resistance .
Antibiotic stewardship: Coordinated efforts and programs to
improve the use of antimicrobials . For example, facilities with
antibiotic stewardship programs have made a commitment to
always use antibiotics appropriately and safely – only when they
are needed to prevent or treat disease, and to choose the right
antibiotics and to administer them in the right way in every case .
Carbapenem-resistant Enterobacteriaceae (CRE) infections:
A family of germs that is difficult to treat because they have
high levels of resistance to antibiotics . CRE infections are most
commonly seen in people with exposure to healthcare settings,
like hospitals and long-term care facilities .
Hand hygiene: The practice of cleaning hands to prevent the
spread of disease-causing germs .
Healthcare personnel influenza vaccination: Influenza, or the flu,
is a mild to severe respiratory illness caused by a virus . The
contagious illness can easily spread from person to person,
including from healthcare workers to patients . Vaccination is the
best way to prevent getting and spreading the flu .
Long-term care facilities (LTCF): Nursing homes, skilled nursing
facilities, and assisted living facilities (collectively known as long-
term care facilities) provide a variety of services, both medical and
personal care, to people who are unable to manage independently
in the community .
Multi-drug resistant organism (MDRO) infections: An infection
caused by a germ that are resistant to multiple classes of
antimicrobials . In some cases, the germs have become so
resistant that no available antibiotics are effective against them .

137NATIONAL AND STATE HEALTHCARE-ASSOCIATED INFECTIONS PROGRESS REPORT
Prevention collaboratives: Prevention projects that consist of
multiple hospitals within a state to target an infection as a team,
implement prevention strategies, share experiences between
facilities, measure progress as a group, and provide feedback to
clinicians and staff .
Ventilator-associated events (VAE): A ventilator is a machine used
to help a patient breathe by giving oxygen through a tube placed
in a patient’s mouth or nose, or through a hole in the front of the
neck . An infection may occur if germs enter a patient through the
tube, such as pneumonia or bacterial infections in the blood .
CALCULATIONSNational baseline: Aggregated data reported to the National
Healthcare Safety Network (NHSN) by all facilities during a
baseline period that is used to “predict” the number of infections
expected to occur in a hospital, state, or in the country . Many
federal and state mandates were not enacted during the baseline
time periods, and therefore not all states or facilities may have
contributed to the baseline (see State mandate) .
In this report, the number of predicted infections is an estimate
based on infections reported to NHSN during the following
time periods:
■ 2006 to 2008: CLABSI and SSI
■ 2009: CAUTI
■ 2010 to 2011: MRSA bacteremia and C . difficile infections
Infection types presented have different baseline years for
comparison . All healthcare-associated infections will undergo re-
baseline against 2015 data for successive years .
Statistical significance: Term used in the context of a
statistical hypothesis test to determine if a finding is unlikely
to have occurred by chance alone . A statistically significant
test result means it is unlikely that the two groups sampled
are different simply by chance alone (suggesting that the two
populations sampled are, in fact, different) . In this report,
statistical hypothesis testing is used to compare a calculated
Standardized Infection Ratio value (see SIR) to the value of
1 .0 . A statistical significant result from this test means there
is statistical evidence that the calculated SIR is different than
what would be predicted from the national data . In this report,
statistical hypothesis testing is also used to compare two SIRs
to each other .
Standardized Infection Ratio (SIR): A summary statistic that can
be used to track healthcare-associated infection (HAI) prevention
progress over time; lower SIRs are better . The SIR compares

138NATIONAL AND STATE HEALTHCARE-ASSOCIATED INFECTIONS PROGRESS REPORT
the number of infections in a facility or state to the number of
infections that were “predicted” to have occurred, based on
previous years of reported data (see National baseline) . The SIR
is not calculated when the number of predicted infections is less
than 1 . In this report, the SIRs compare the observed number of
infections reported to National Healthcare Safety Network (NHSN)
during 2013 to the predicted number of infections based on the
referent period, adjusting for key risk factors .
Risk adjustment: A process used to level the playing field
by adjusting for the differences in risk . When the data are
risk-adjusted, it makes it possible to fairly compare hospital
performance . In this report, the SIRs are adjusted for risk
factors that may impact the number of infections reported by a
hospital, such as type of patient care location, bed size of the
hospital, patient age, and other factors .
National 2013 SIR: A summary statistic calculated from all
reported HAIs that occurred in the country in 2013 . It was
calculated as the total number of observed infections in the
country, divided by the total number of predicted infections in
the country in 2013 .
State 2013 SIR: A summary statistic calculated from all
reported HAIs that occurred in an individual state in 2013 .
It was calculated as the total number of observed infections
from all hospitals in the state, divided by the total number of
predicted infections in the state in 2013 .
State mandate (for data reporting): A state legislative or regulatory
requirement (enacted by the state’s government) requiring
hospitals in the state to report healthcare-associated infections to
the National Healthcare Safety Network .
Validation: Double-checking, or confirming, healthcare-associated
infection (HAI) data reported to the National Healthcare Safety
Network (NHSN) . This generally involves an assessment to ensure
all relevant infections were captured in the system . It may also
involve checking the accuracy, or quality, of the submitted data .
Currently, state health departments may use different methods to
validate the HAI data that hospitals submit to NHSN . For example,
some states only validate data from one facility while other states
validate more widely . Validation efforts should be taken into
account when evaluating an individual state’s performance . States
that validate data or use advanced tools to detect HAIs may find
and report more infections than states that do not validate .
In this report, state validation efforts are specified and classified
into two categories for each HAI type – data checked for quality
and additional in-depth data review .

139NATIONAL AND STATE HEALTHCARE-ASSOCIATED INFECTIONS PROGRESS REPORT
Data Quality: State health departments may assess a
hospital’s overall reported HAI data for data entry errors,
outliers, or missing information . This does not involve
reviewing medical records .
In this report, the following criteria were used to assign credit
to states that performed data quality checks:
■ State health department had access to 2013 data from NHSN .
■ State health department performed quality checks on at least 6 months of 2013 NHSN data prior to July 1, 2014 .
■ State health department contacted hospitals when data errors, outliers, or missing information were found .
“Additional In-depth Data Review”: State health departments
may perform a review, or “audit”, of a hospital’s medical
records to ensure the hospital reported all HAIs to NHSN . The
auditing process may identify more HAIs in a hospital than
originally reported . As such, states that perform data audits
may have a higher SIR when compared to states that do not
perform data audits . In this report, credit is given to states
that performed any type of audit of their hospitals’ data prior
to July 1, 2014 .

NATIONAL AND STATE HEALTHCARE-ASSOCIATED INFECTIONS PROGRESS REPORT
Suggested citation: Centers for Disease Control and Prevention . 2013 National and State Healthcare-Associated Infections Progress
Report . Published January 14, 2015 . Available at www .cdc .gov/hai/progress-report/index .html .
CS250252-B