haksun li [email protected]
TRANSCRIPT

SPEAKER PROFILE
Haksun Li, Numerical Method Inc. Quantitative Trader Quantitative Analyst PhD, Computer Science, University of
Michigan Ann Arbor M.S., Financial Mathematics, University
of Chicago B.S., Mathematics, University of
Chicago
OVERVIEW
Algo trading is the automated execution of trading orders decided by quantitative market models.
It is an arms race to build more reliable and faster execution
platforms (computer sciences) more comprehensive and accurate
prediction models (mathematics)
MARKET MAKING
Quote to the market. Ensure that the portfolios respect certain
risk limits, e.g., delta. Money comes mainly from client flow, e.g.,
bid-ask spread.
STATISTICAL ARBITRAGE
Bet on the market direction, e.g., whether the price will go up or down.
Look for repeatable patterns. Money comes from winning trades.

PREREQUISITE
Build or buy a trading infrastructure. many vendors for Gateways, APIs Reuters Tibco
Collect data, e.g., timestamps, order book history, numbers, events. Reuters, EBS
Clean and store the data. flat file, HDF5, Vhayu, KDB, One Tick
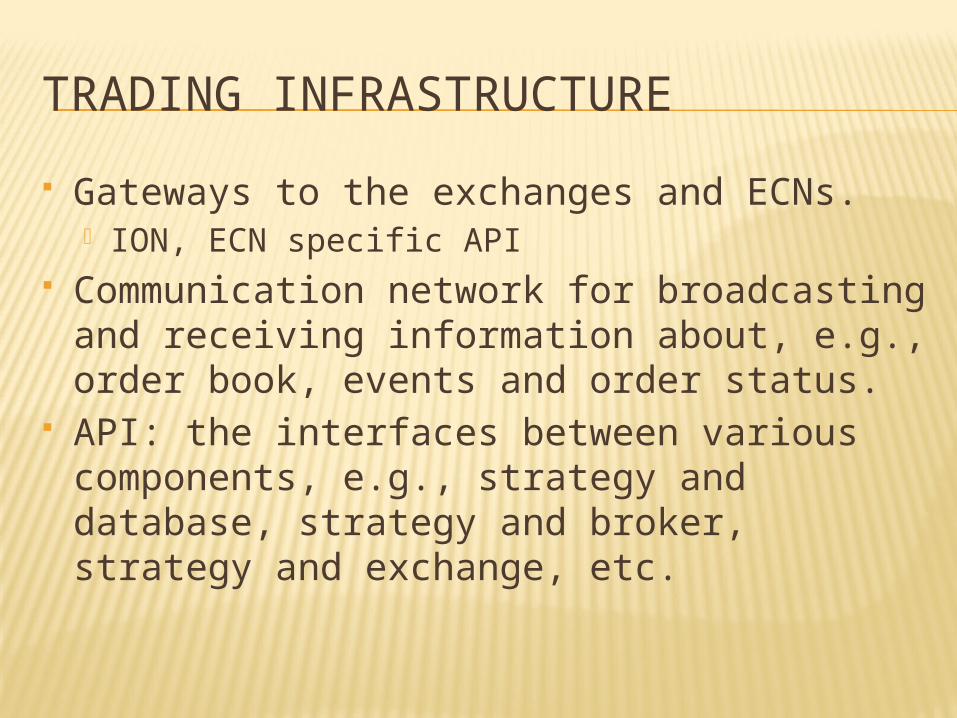
TRADING INFRASTRUCTURE
Gateways to the exchanges and ECNs. ION, ECN specific API
Communication network for broadcasting and receiving information about, e.g., order book, events and order status.
API: the interfaces between various components, e.g., strategy and database, strategy and broker, strategy and exchange, etc.

PROCESS
1. Generate or improve a trading idea.2. Quantify the idea and build a model for it.3. Back test the strategy.4. Collect the performance statistics.5. If the statistics are not good enough, go back to
#1.6. If the strategy does not add significant value to
the existing portfolio, go back to #1.7. Implement the strategy on the execution platform.8. Trade.
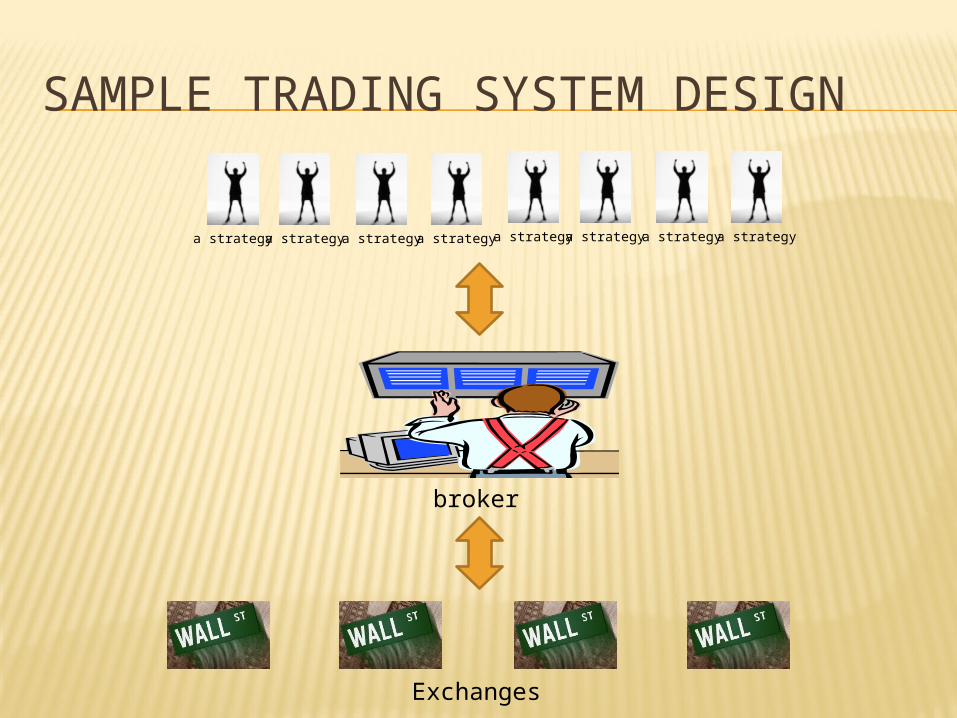
SAMPLE TRADING SYSTEM DESIGN
a strategy a strategy a strategy a strategy
broker
a strategy a strategy a strategy a strategy
Exchanges

BROKER JUSTIFICATIONS
Mimic how a human trader and broker work.
Separation of responsibilities.
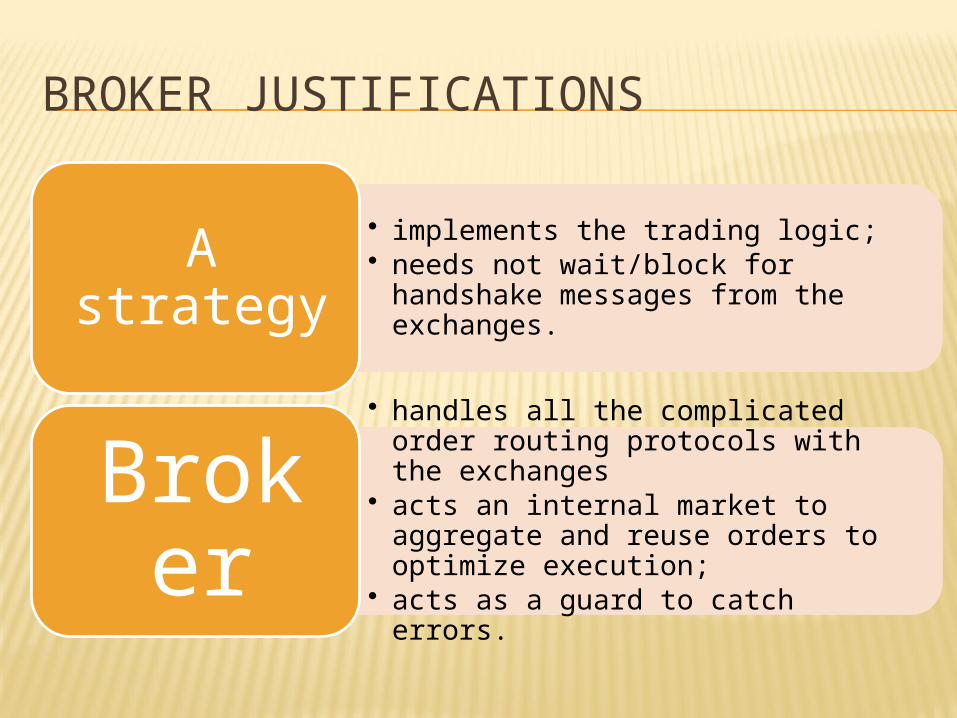
BROKER JUSTIFICATIONS
• implements the trading logic;• needs not wait/block for handshake
messages from the exchanges.
A strategy
• handles all the complicated order routing protocols with the exchanges
• acts an internal market to aggregate and reuse orders to optimize execution;
• acts as a guard to catch errors.
Broker
PRACTICAL ISSUES
Filtration Consistency Internal Order Matching Rapid Strategy Implementation Safety
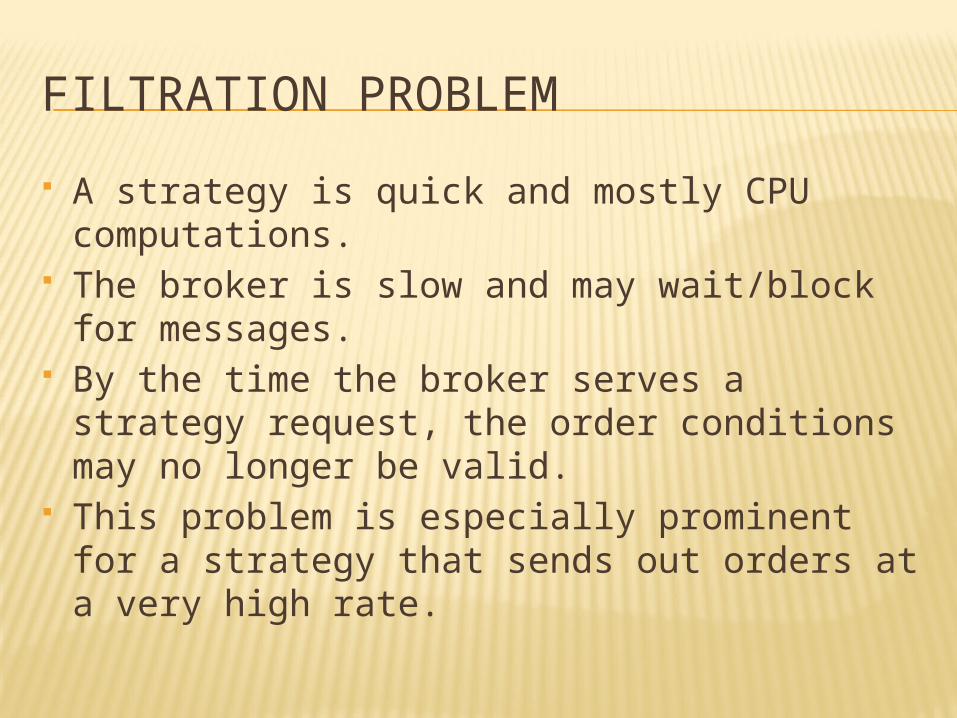
FILTRATION PROBLEM
A strategy is quick and mostly CPU computations.
The broker is slow and may wait/block for messages.
By the time the broker serves a strategy request, the order conditions may no longer be valid.
This problem is especially prominent for a strategy that sends out orders at a very high rate.
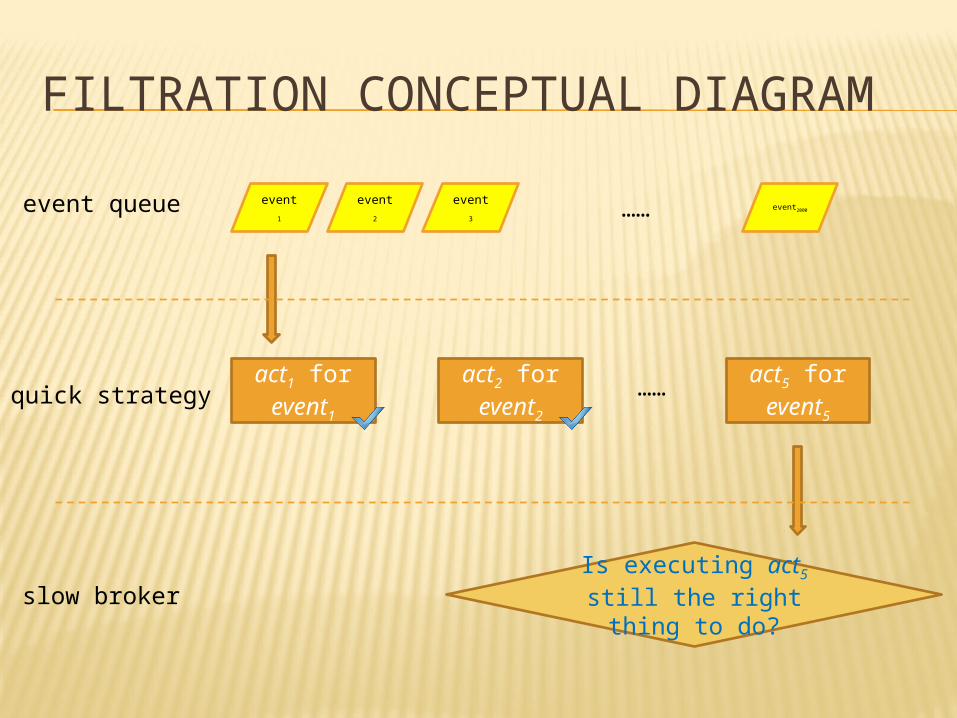
FILTRATION CONCEPTUAL DIAGRAM
event1 event2 event3event2000……
act1 for event1
Is executing act5 still the right thing
to do?
event queue
quick strategy
slow broker
act2 for event2
act5 for event5
……

FILTRATION SOLUTIONS
Manage only one order at a time; always wait for confirmation. This is only appropriate for low frequency
strategies that do not anticipate orders to optimize execution.
Allow error margins for, e.g., overfilling. Catch and correct the cumulated errors afterward.
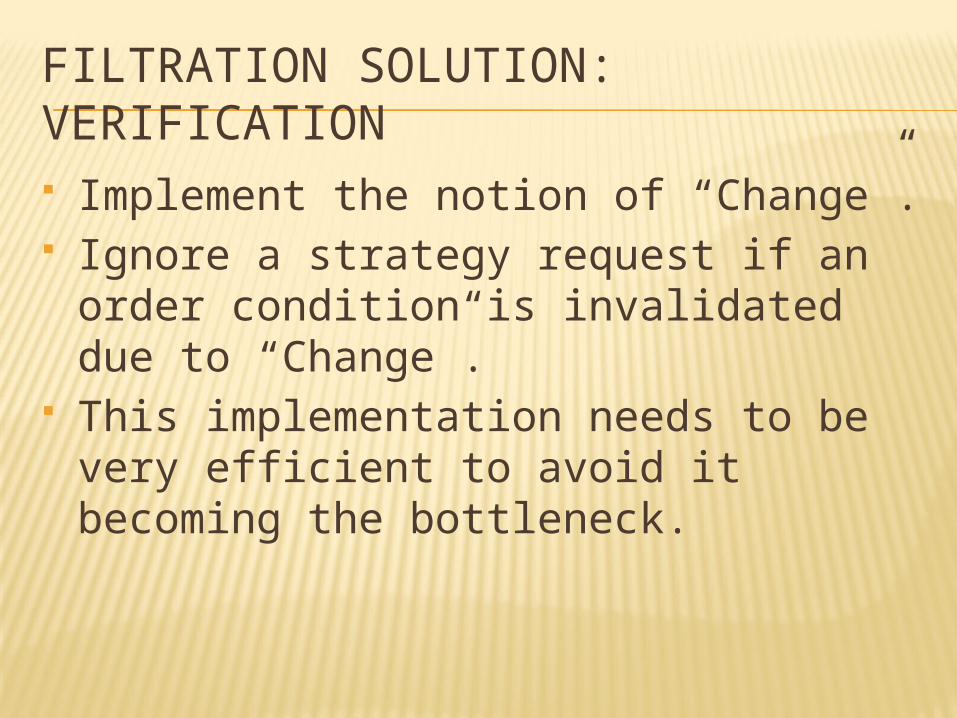
FILTRATION SOLUTION: VERIFICATION
Implement the notion of “Change”. Ignore a strategy request if an order
condition is invalidated due to “Change”.
This implementation needs to be very efficient to avoid it becoming the bottleneck.

The market states may change during strategy computation.
For example, an order-fill message may arrive to update the position information.
CONSISTENCY
pos = 2
pos = 3
inconsistency logic
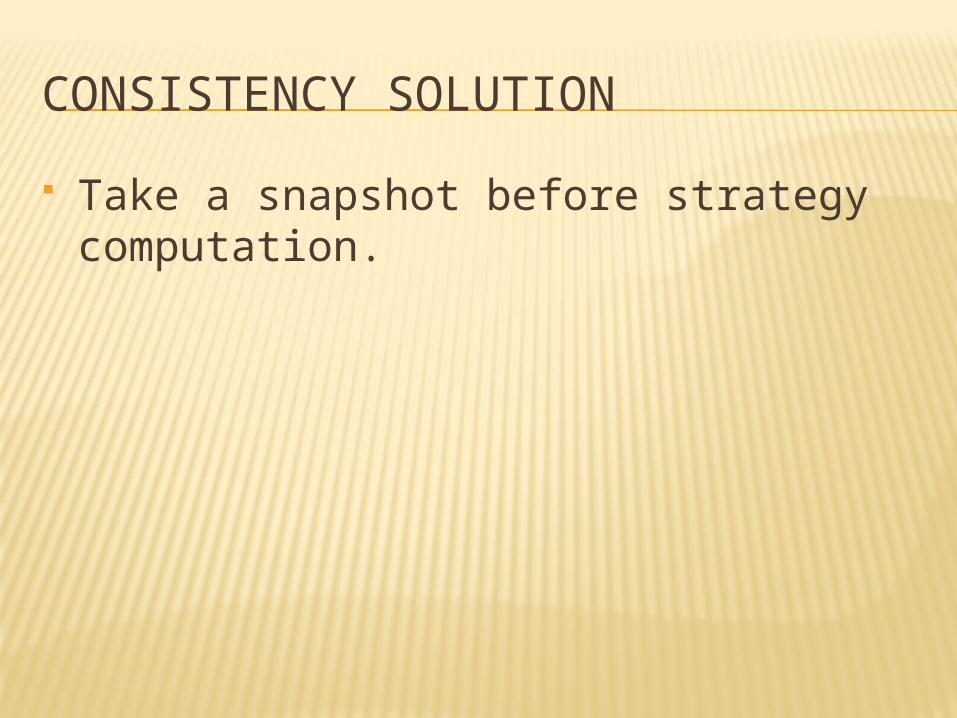
CONSISTENCY SOLUTION
Take a snapshot before strategy computation.
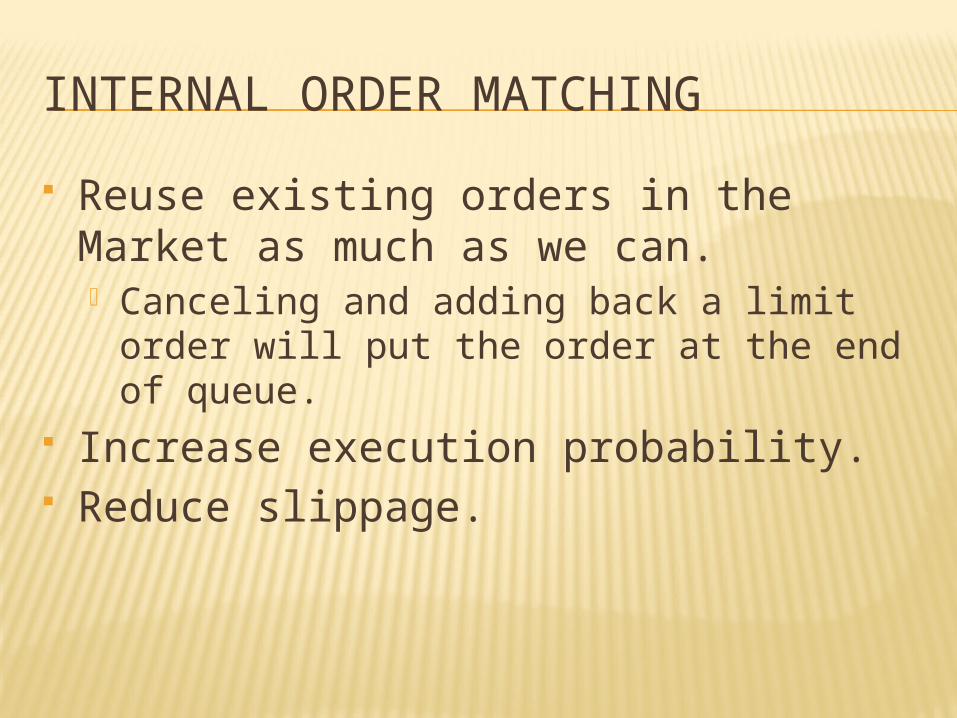
INTERNAL ORDER MATCHING
Reuse existing orders in the Market as much as we can. Canceling and adding back a limit order
will put the order at the end of queue. Increase execution probability. Reduce slippage.
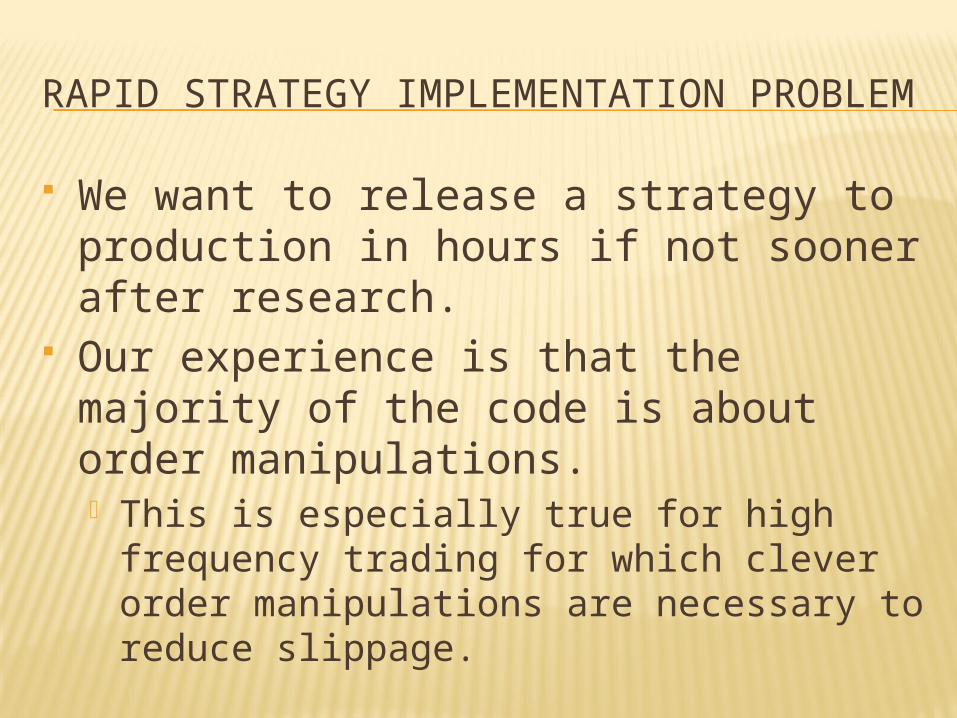
RAPID STRATEGY IMPLEMENTATION PROBLEM
We want to release a strategy to production in hours if not sooner after research.
Our experience is that the majority of the code is about order manipulations. This is especially true for high frequency
trading for which clever order manipulations are necessary to reduce slippage.

ORDER ANTICIPATION EXAMPLE
Suppose the current price is 100. We place a limit order to buy at 90.
The price moves up to 110, leaving the order unfilled.
We cancel the order at 90, place a new limit order at 100, chasing the market.
Code: delete an old order, wait for confirmation, add a new order, etc.
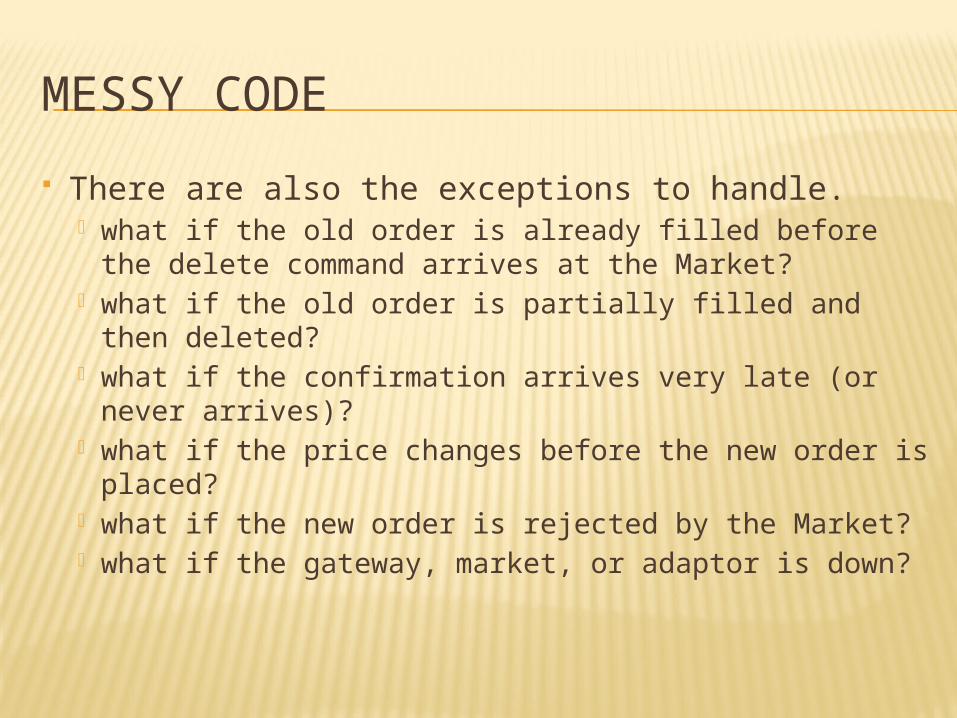
MESSY CODE
There are also the exceptions to handle. what if the old order is already filled before the
delete command arrives at the Market? what if the old order is partially filled and then
deleted? what if the confirmation arrives very late (or never
arrives)? what if the price changes before the new order is
placed? what if the new order is rejected by the Market? what if the gateway, market, or adaptor is down?
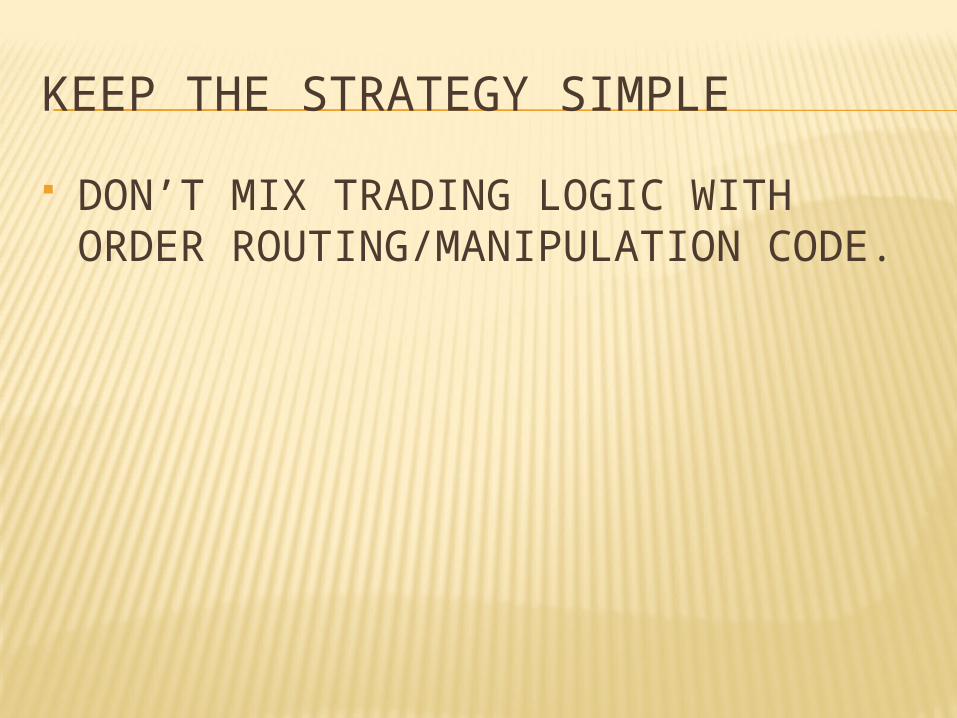
KEEP THE STRATEGY SIMPLE
DON’T MIX TRADING LOGIC WITH ORDER ROUTING/MANIPULATION CODE.
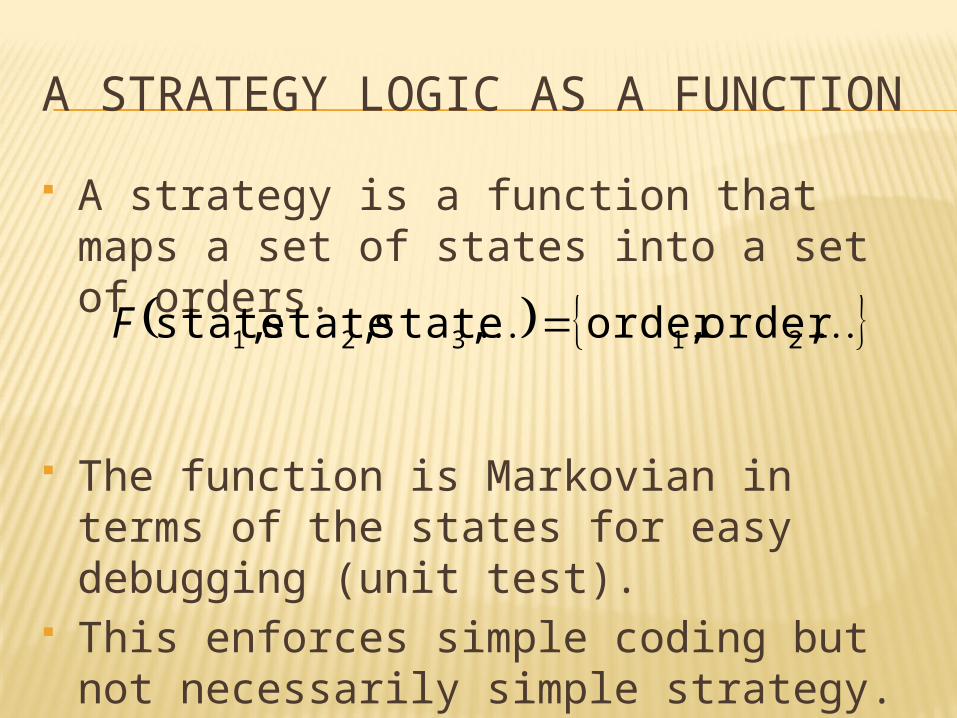
A STRATEGY LOGIC AS A FUNCTION
A strategy is a function that maps a set of states into a set of orders.
The function is Markovian in terms of the states for easy debugging (unit test).
This enforces simple coding but not necessarily simple strategy.
,order,order,state,state,state 21321 F
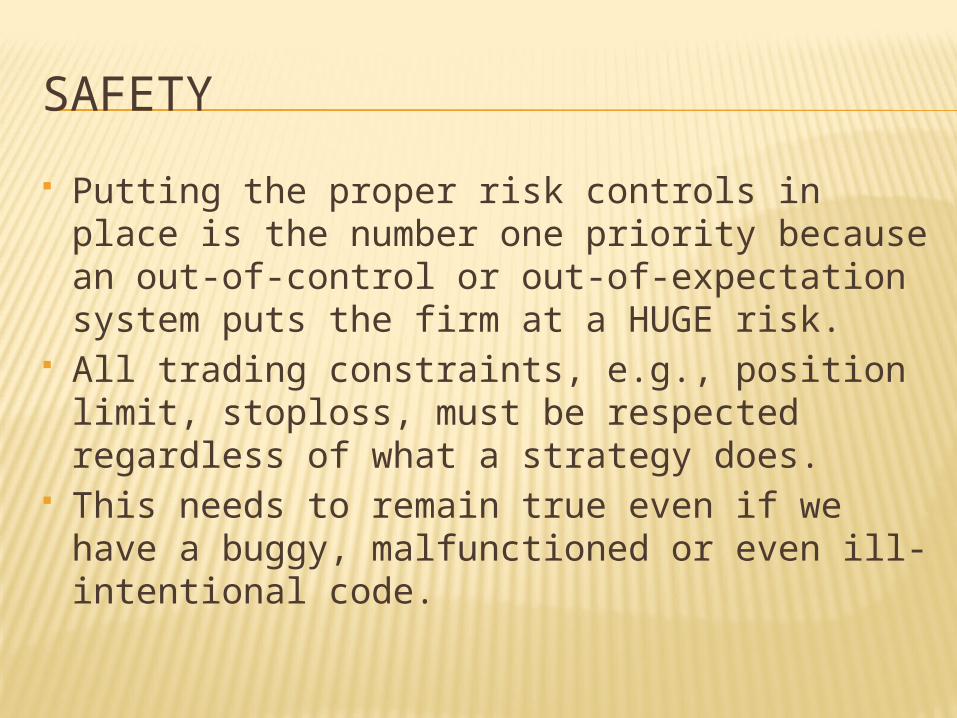
SAFETY
Putting the proper risk controls in place is the number one priority because an out-of-control or out-of-expectation system puts the firm at a HUGE risk.
All trading constraints, e.g., position limit, stoploss, must be respected regardless of what a strategy does.
This needs to remain true even if we have a buggy, malfunctioned or even ill-intentional code.
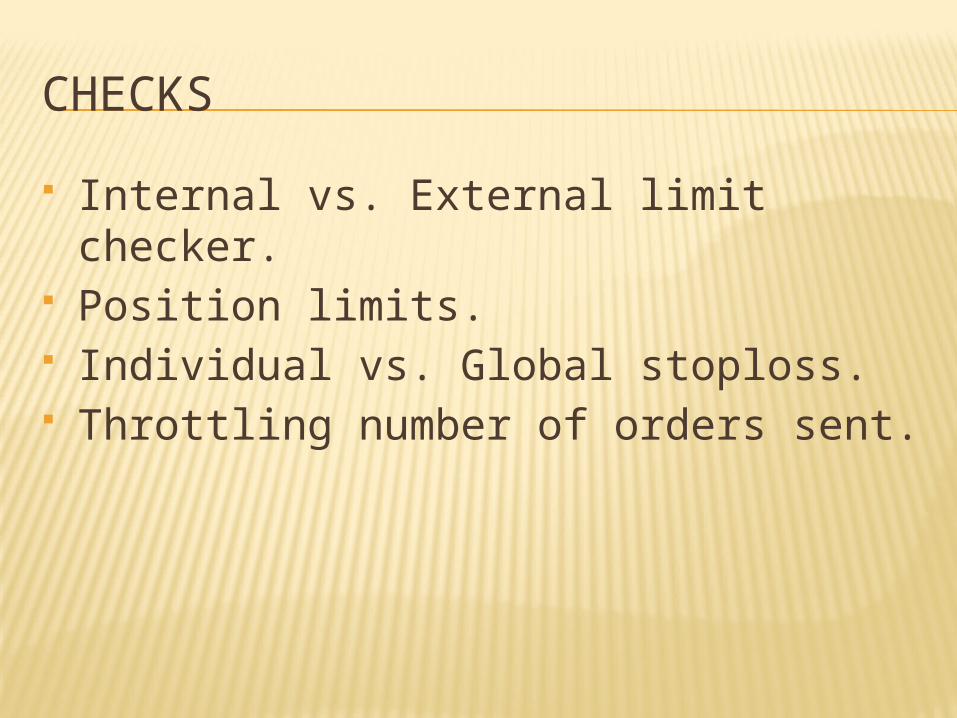
CHECKS
Internal vs. External limit checker. Position limits. Individual vs. Global stoploss. Throttling number of orders sent.

A SAMPLE TRADING IDEA
Two simple strategies mean reversion: buy when price goes
down; sell otherwise trend following: buy when price goes up;
sell otherwise When to use #1 and when to use #2?
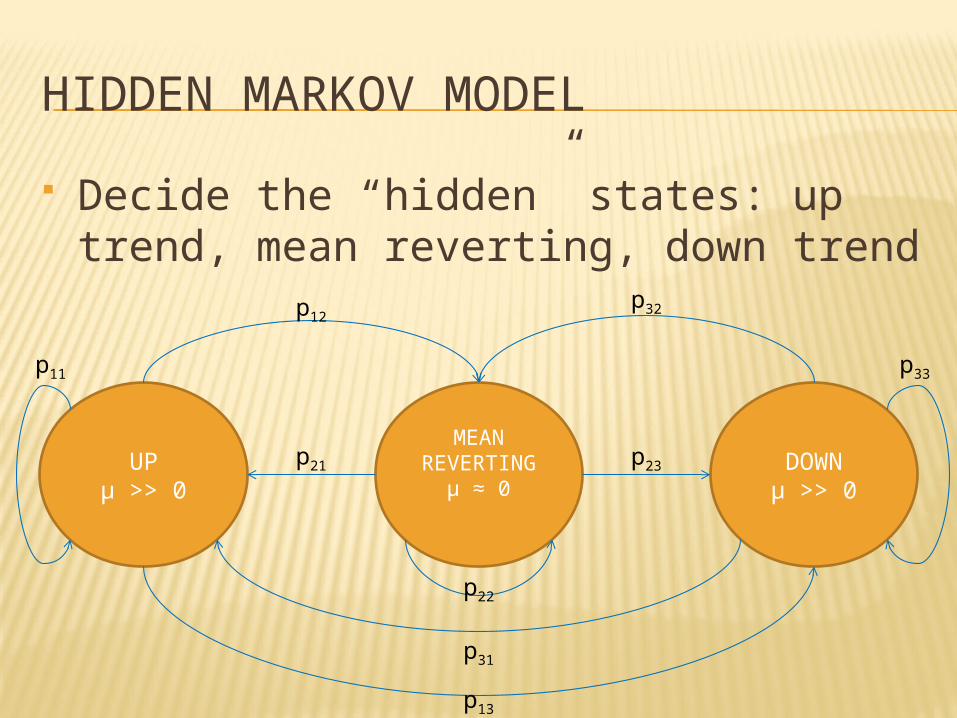
HIDDEN MARKOV MODEL
Decide the “hidden” states: up trend, mean reverting, down trend
MEAN REVERTING
μ ≈ 0DOWNμ >> 0
UPμ >> 0
p11
p12
p13
p22
p21 p23
p33
p32
p31

THE MATH MODEL
St: the states, time dependent Xt: the time series of interests, time
dependent, e.g., the log returns Zt: the matrix of factors, time dependent β, σ: the linear regression results; state (hence time)
dependent ε: white noise
tSStt ttZX
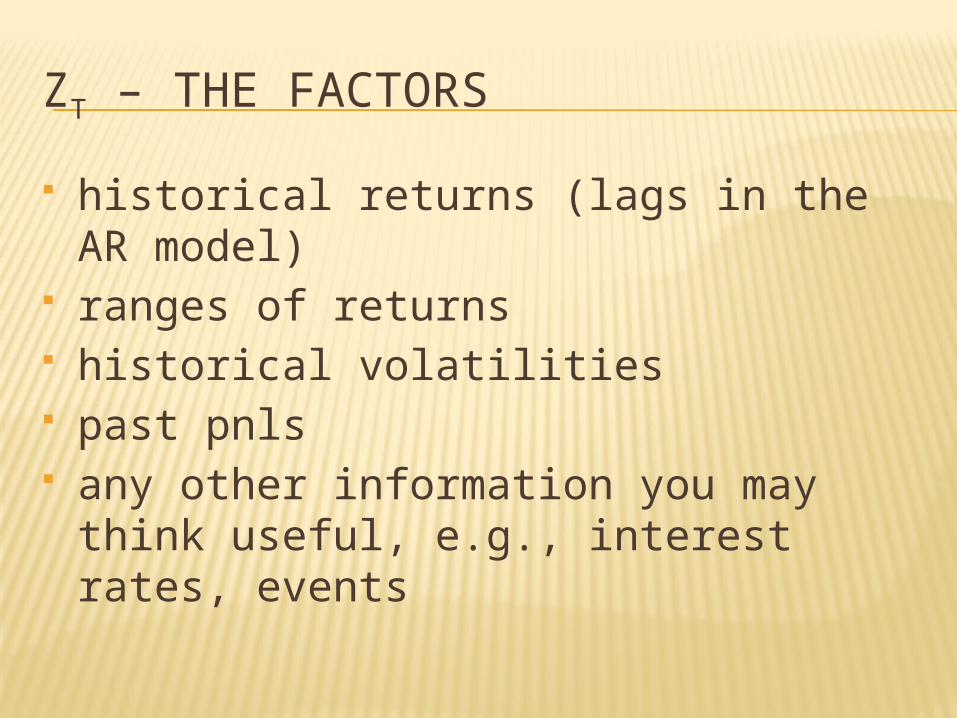
ZT – THE FACTORS
historical returns (lags in the AR model) ranges of returns historical volatilities past pnls any other information you may think
useful, e.g., interest rates, events

THE MATH PROBLEM
We need to estimate β and σ for each state.
We need to estimate the transition matrix {pij}.
THE MATH SOLUTION
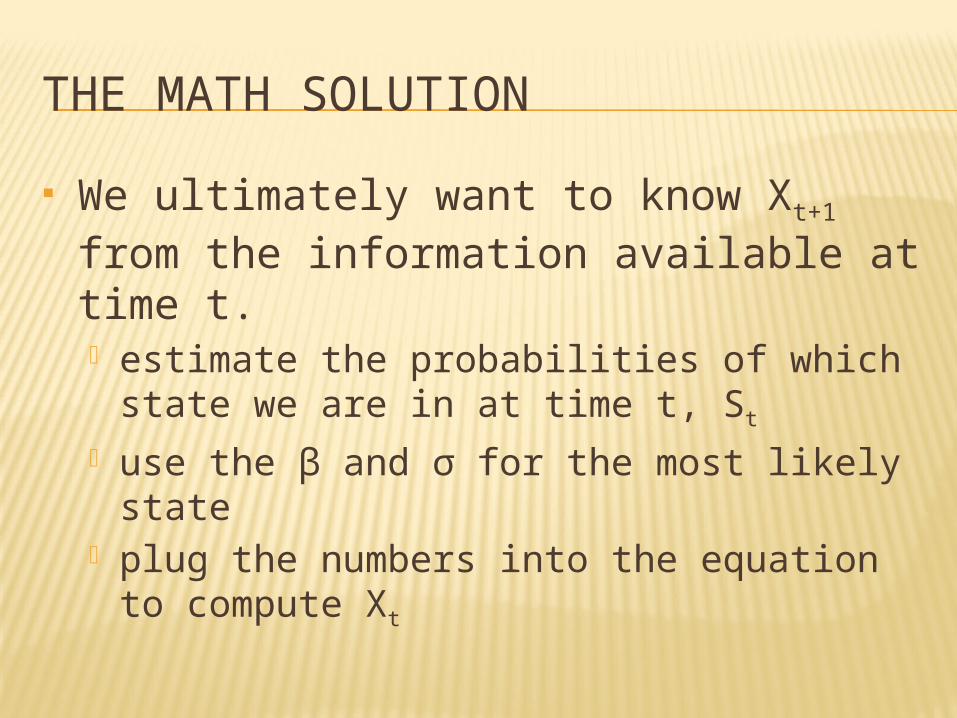
We ultimately want to know Xt+1 from the information available at time t. estimate the probabilities of which state
we are in at time t, St
use the β and σ for the most likely state plug the numbers into the equation to
compute Xt
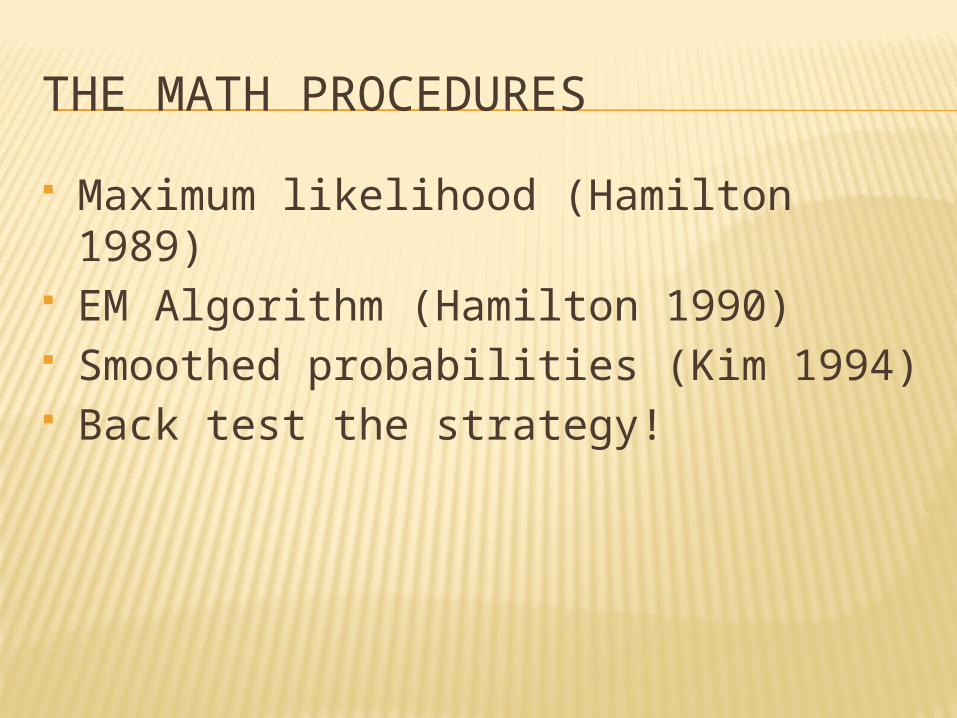
THE MATH PROCEDURES
Maximum likelihood (Hamilton 1989) EM Algorithm (Hamilton 1990) Smoothed probabilities (Kim 1994) Back test the strategy!
SUANSHU INITIATIVES
The majority of traders do not have the math training to understand the mathematics details.
For a capable quant, it may take 1 to 2 months to code a robust estimation procedure with elegant code, extensive test cases and professional documentations.
Too expensive and time-consuming for a small hedge fund or prop. team in a bank.

SUANSHU OBJECTIVES
SuanShu is a java numerical library of numerical methods and for numerical analysis.
It has a collection of mathematics concepts and algorithms.
It alleviates the users from writing infrastructural math code so they can focus on their applications.
SuanShu has thousands of test cases and is professionally documented.

BACKTESTING
Backtesting tells you whether a strategy worked in the past and not whether it will work in the future.
It gives an objective way to measure performance, and hence confidence to the strategy.
It allows systematic analysis of winning and losing trades, which in turn can be used to refine the strategy.
It helps decide stoploss and take-profit.
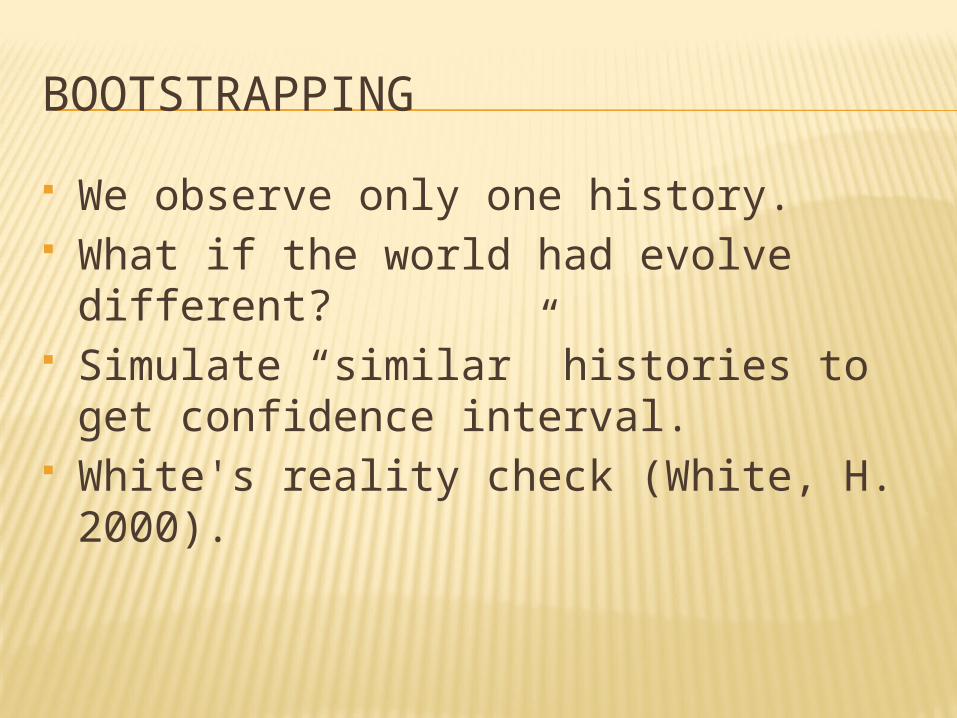
BOOTSTRAPPING
We observe only one history. What if the world had evolve different? Simulate “similar” histories to get
confidence interval. White's reality check (White, H. 2000).
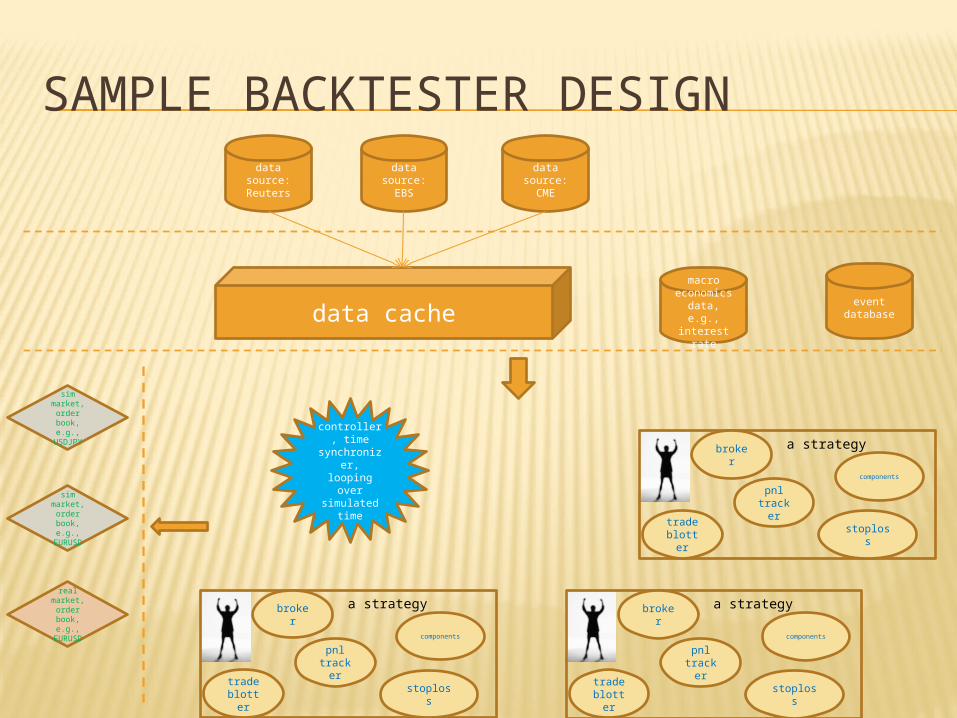
SAMPLE BACKTESTER DESIGNdata source:
Reutersdata source:
EBS
macro economics data, e.g.,
interest ratedata cache
data source:CME
controller, time
synchronizer, looping
over simulated
time
event database
a strategybroker
trade blotter
pnl tracke
r
stoploss
components
a strategybroker
trade blotter
pnl tracke
r
stoploss
components
a strategybroker
trade blotter
pnl tracke
r
stoploss
components
sim market, order book, e.g.,
EURUSD
sim market, order book, e.g.,
USDJPY
real market, order book, e.g.,
EURUSD
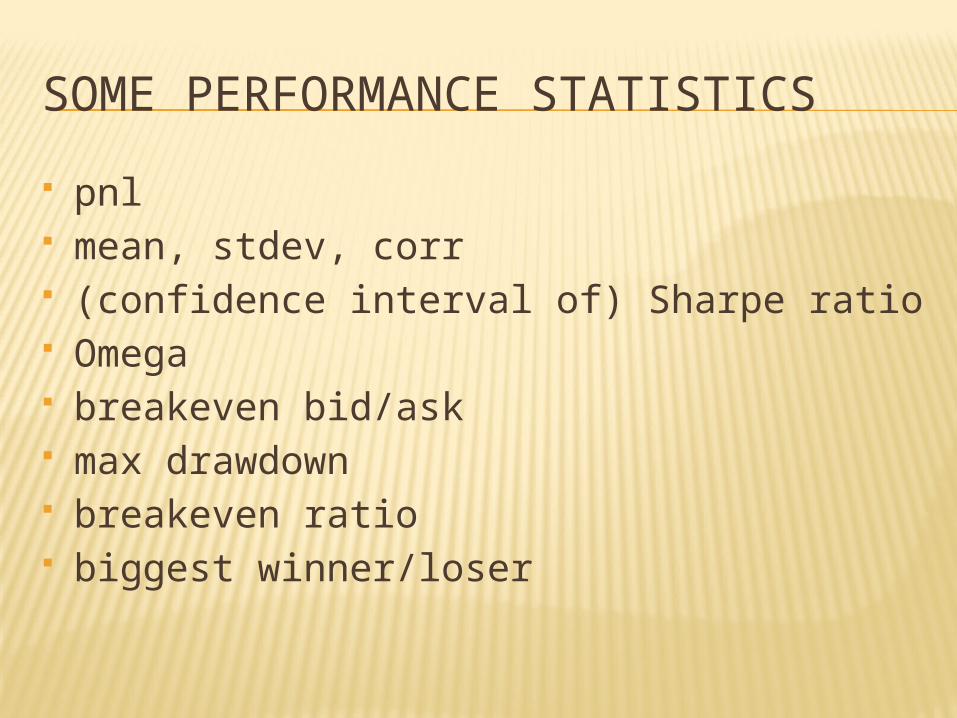
SOME PERFORMANCE STATISTICS
pnl mean, stdev, corr (confidence interval of) Sharpe ratio Omega breakeven bid/ask max drawdown breakeven ratio biggest winner/loser
OPTIMIZER
Most strategies require calibration to update parameters for the current trading regime.
Occam’s razor: the fewer parameters the better.
For strategies that take parameters from the Real line: Nelder-Mead, BFGS
For strategies that take integers: Mixed-integer non-linear programming (branch-and-bound, outer-approximation)
SENSITIVITY
How much does the performance change for a small change in parameters?
Avoid the optimized parameters merely being statistical artifacts.
A plot of measure vs. d(parameter) is a good visual aid to determine robustness.
We look for plateaus.
SUMMARY
Algo trading is a rare field in quantitative finance where computer sciences is at least as important as mathematics, if not more.
Algo trading is a very competitive field in which technology is a decisive factor.