half image placement holder (horizontal) resize image …
TRANSCRIPT

HALF IMAGE PLACEMENT HOLDER (HORIZONTAL)Resize image to cover grey box
PROFESSIONAL CLIENTS ONLY | NOT FOR RETAIL USE OR DISTRIBUTION
Tapping into Asia’s transformation
J.P. Morgan Asset Management Emerging Markets and Asia Pacific Equities team
4th March 2020

1 | PROFESSIONAL CLIENTS ONLY | NOT FOR RETAIL USE OR DISTRIBUTION
Why Asia?
Image source: Shutterstock

2 | PROFESSIONAL CLIENTS ONLY | NOT FOR RETAIL USE OR DISTRIBUTION
GTM – Europe | Page 44
Source: (Left) World Bank, J.P. Morgan Asset Management. Urbanisation rate refers to the proportion of the total population living within an urban area defined by national statistical offices. Countries are labelled using three-letter International Organisation of Standardisation country codes. (Right) Refinitiv Datastream, World Bank, J.P. Morgan Asset Management. Past performance is not a reliable indicator of current and future results. Guide to the Markets - Europe. Data as of 31st December 2020.
This is a multi-decade opportunityUrbanisation, real GDP per capita and population sizeUrbanisation rates, %, and GDP per capita, USD, bubble size is population
GD
P pe
r cap
ita
Urbanisation rate (%)
USA
JPNDEU
GBRFRA
CAN
ITAESP
AUSNLD
CHN
IND
BRAMEX
TUR
KOR
RUS
IDN
ARG
SAU
THA
HKG
ZAF
-10,000
0
10,000
20,000
30,000
40,000
50,000
60,000
0 10 20 30 40 50 60 70 80 90 100
Emerging marketsDeveloped markets

3 | PROFESSIONAL CLIENTS ONLY | NOT FOR RETAIL USE OR DISTRIBUTION
The middle class is key
Growth of the middle class
1% 4%0%
30%
40%
14%
27%34%
53%
71%79%
41%
72%
61%
79%
0%
20%
40%
60%
80%
100%
India Indonesia China Brazil Mexico
1995 2018F 2030F
Source: J.P. Morgan Asset Management; Brookings Institute. Middle class is defined as $3,600-$36,000 annual per capita income in purchasing power parity terms. Historical and forecast figures come from the Brookings Development, Aid and Governance Indicators. Guide to the Markets – U.S. Data are as of 31st December 2019. MSCI ACWI weights as at end August 2019.
60%
4.5 billion
9%
Percent of total population

4 | PROFESSIONAL CLIENTS ONLY | NOT FOR RETAIL USE OR DISTRIBUTION
JPM Asia Growth Fund
Image source: Shutterstock

5 | PROFESSIONAL CLIENTS ONLY | NOT FOR RETAIL USE OR DISTRIBUTION
What is JPM Asia Growth?

6 | PROFESSIONAL CLIENTS ONLY | NOT FOR RETAIL USE OR DISTRIBUTION
Easily misunderstood
Image source: J.P. Morgan Asset Management

7 | PROFESSIONAL CLIENTS ONLY | NOT FOR RETAIL USE OR DISTRIBUTION
Looking towards the best long-term structural growth stories
LIFESTYLE UPGRADES
DEMOGRAPHICCHANGES
FINANCIALDEEPENING

8 | PROFESSIONAL CLIENTS ONLY | NOT FOR RETAIL USE OR DISTRIBUTION
Premiumisation
Manufacturingleaders
Technology
Image source: Shutterstock

9 | PROFESSIONAL CLIENTS ONLY | NOT FOR RETAIL USE OR DISTRIBUTION
The Indian consumer is moving upHindustan Unilever’s product portfolio straddles the pyramid
The companies above are shown for illustrative purposes only. Their inclusion should not be interpreted as a recommendation to buy or sell. The use of their logos is in no way an endorsement of those companies by J.P. Morgan Asset Management nor is it intended to indicate an endorsement of J.P. Morgan Asset Management by those companies.
Premium
Popular
Mass
Premiumisation
10 | PROFESSIONAL CLIENTS ONLY | NOT FOR RETAIL USE OR DISTRIBUTION
Audience poll
Image source: Shutterstock
What do you think Jonjee Hi-Tech Industrial and Commercial Holding Company does?
1. Manufactures components
2. Manufactures condiments
3. Advertising billboards

11 | PROFESSIONAL CLIENTS ONLY | NOT FOR RETAIL USE OR DISTRIBUTION
The condiment industry looks appetising
Image source: Shutterstock
100%
Premiumisation

12 | PROFESSIONAL CLIENTS ONLY | NOT FOR RETAIL USE OR DISTRIBUTION
Manufacturing leaders on a global stageManufacturing leaders
TSMC is about to become the world’s most advanced chipmaker
Image source: Shutterstock
13 | PROFESSIONAL CLIENTS ONLY | NOT FOR RETAIL USE OR DISTRIBUTION
Audience poll
Image source: Shutterstock
What is the size of TSMC’s most recent process node?
1. 7 nanometers
2. 9 micrometers
3. 0.01 millimeters

14 | PROFESSIONAL CLIENTS ONLY | NOT FOR RETAIL USE OR DISTRIBUTION
TSMC is in your life already
Image source: Shutterstock
Manufacturing leaders

15 | PROFESSIONAL CLIENTS ONLY | NOT FOR RETAIL USE OR DISTRIBUTION
Technology Alphabet
Banks are now moving from the ABCD of Tech to the EFG of Tech, i.e. moving from AI, Blockchain, Cloud and big Data to Experience, Facial and 5G!”
– Bank of China“Image source: Shutterstock
16 | PROFESSIONAL CLIENTS ONLY | NOT FOR RETAIL USE OR DISTRIBUTION
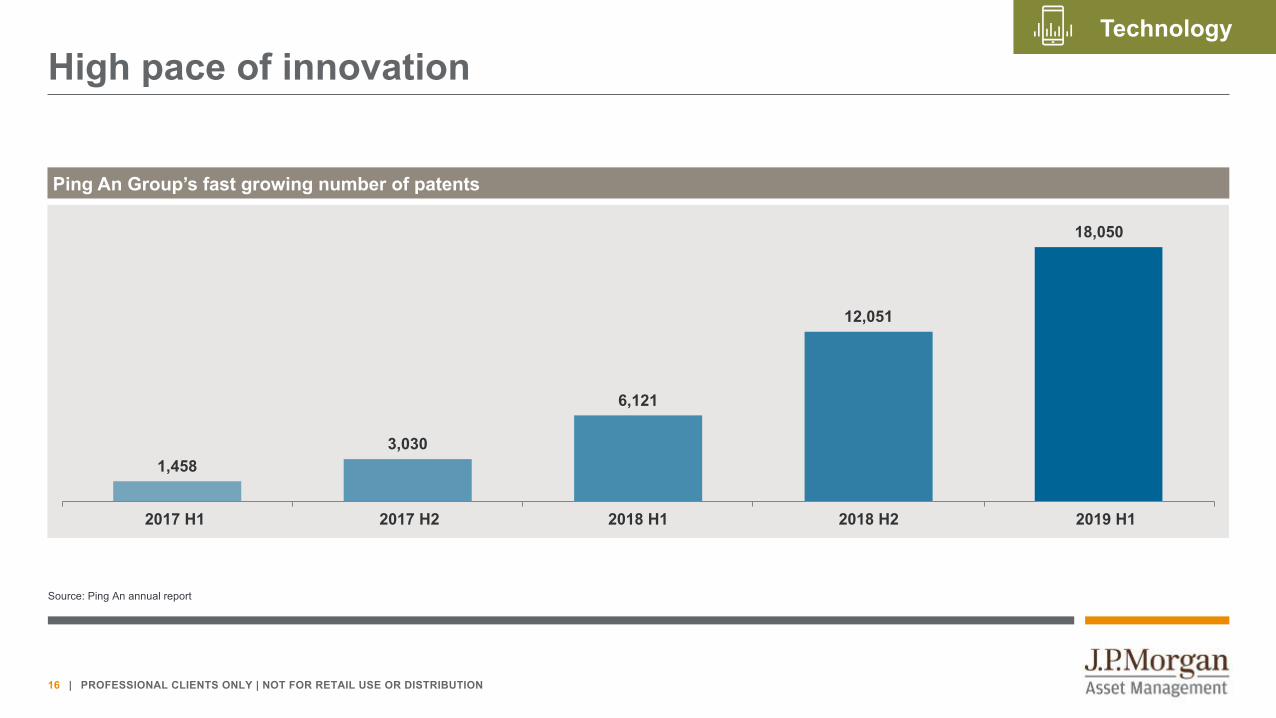
High pace of innovation
Source: Ping An annual report
Technology
1,4583,030
6,121
12,051
18,050
17H 17A 18H 18A 19H2017 H1 2017 H2 2018 H1 2018 H2 2019 H1
Ping An Group’s fast growing number of patents

17 | PROFESSIONAL CLIENTS ONLY | NOT FOR RETAIL USE OR DISTRIBUTION
…across Asia
The companies above are shown for illustrative purposes only. Their inclusion should not be interpreted as a recommendation to buy or sell. The use of their logos is in no way an endorsement of those companies by J.P. Morgan Asset Management nor is it intended to indicate an endorsement of J.P. Morgan Asset Management by those companies.
Technology
18 | PROFESSIONAL CLIENTS ONLY | NOT FOR RETAIL USE OR DISTRIBUTION
Source: J.P. Morgan Asset Management. The fund is actively managed. Holdings, sector weights, allocations and leverage, as applicable, are subject to change at the discretion of the Investment Manager without notice.
JPM Asia Growth Fund as of 31 January 2020
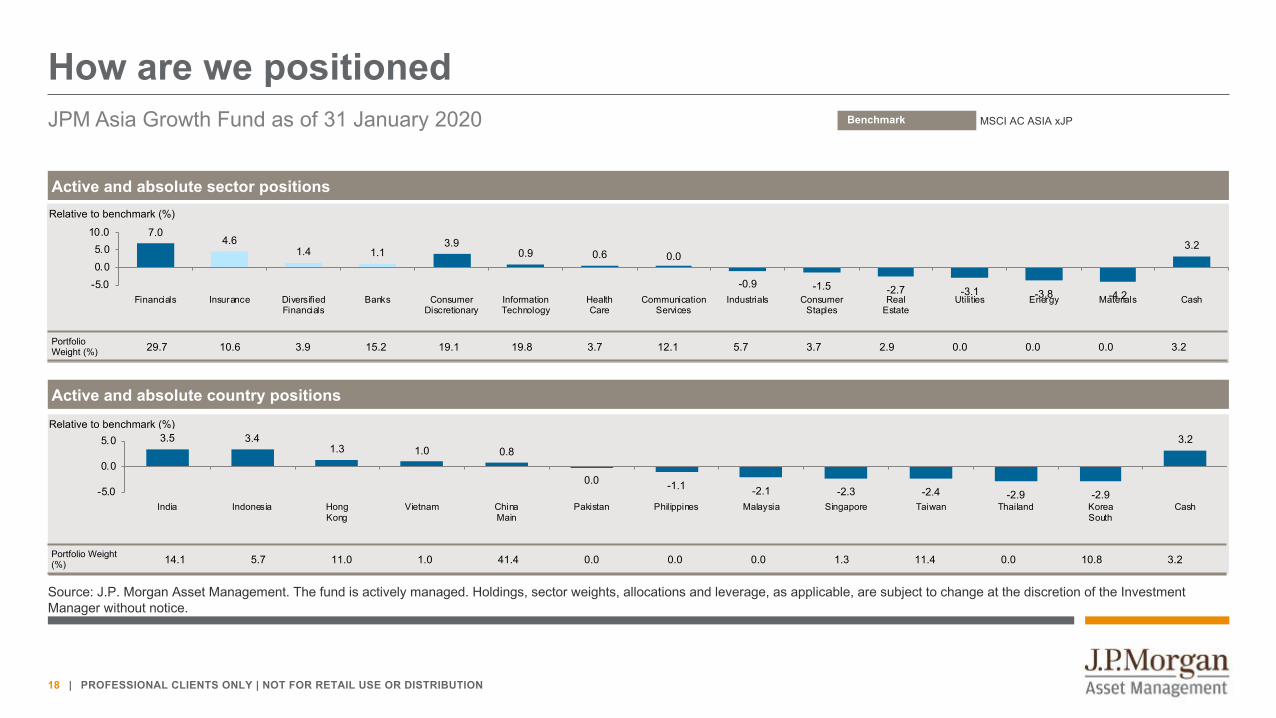
Relative to benchmark (%)
Relative to benchmark (%)
7.04.6
1.4 1.13.9
0.9 0.6 0.0
-0.9 -1.5 -2.7 -3.1 -3.8 -4.2
3.2
-5.00.05.0
10.0
Financials Insurance DiversifiedFinancials
Banks ConsumerDiscretionary
InformationTechnology
HealthCare
CommunicationServices
Industrials ConsumerStaples
RealEstate
Utilities Energy Materials Cash
Portfolio Weight (%) 29.7 10.6 3.9 15.2 19.1 19.8 3.7 12.1 5.7 3.7 2.9 0.0 0.0 0.0 3.2
Active and absolute sector positions
Portfolio Weight(%) 14.1 5.7 11.0 1.0 41.4 0.0 0.0 0.0 1.3 11.4 0.0 10.8 3.2
3.5 3.41.3 1.0 0.8
0.0 -1.1 -2.1 -2.3 -2.4 -2.9 -2.9
3.2
-5.0
0.0
5.0
India Indonesia HongKong
Vietnam ChinaMain
Pakistan Philippines Malaysia Singapore Taiwan Thailand KoreaSouth
Cash
Active and absolute country positions
Benchmark MSCI AC ASIA xJP
How are we positioned

19 | PROFESSIONAL CLIENTS ONLY | NOT FOR RETAIL USE OR DISTRIBUTION
JPM Asia Growth Fund as of 31 January 2020 Benchmark MSCI AC ASIA xJP
Source: J.P. Morgan Asset Management. The fund is actively managed. Holdings, sector weights, allocations and leverage, as applicable, are subject to change at the discretion of the Investment Manager without notice.
Key portfolio positions
Top 10 holdings Portfolio weight (%)
Alibaba Group Holding Ltd 9.4
Samsung Electronics 8.6
TSMC 7.8
Tencent 7.7
AIA 5.4
Bank Central Asia 3.8
Ping An Insurance 3.7
HDFC Bank 3.3
HDFC 2.3
China Overseas Land 2.3
Top 5 overweights Fundweight (%)
Relative position (%)
Samsung Electronics 8.6 3.5
Bank Central Asia 3.8 3.3
HDFC Bank 3.3 3.3
AIA 5.4 3.0
TSMC 7.8 2.6
Top 5 underweights Fundweight (%)
Relative position (%)
China Construction Bank 0.0 -1.5
Reliance Industries 0.0 -1.1
China Mobile 0.0 -1.0
ICBC 0.0 -0.9
SK Hynix 0.0 -0.9
20 | PROFESSIONAL CLIENTS ONLY | NOT FOR RETAIL USE OR DISTRIBUTION
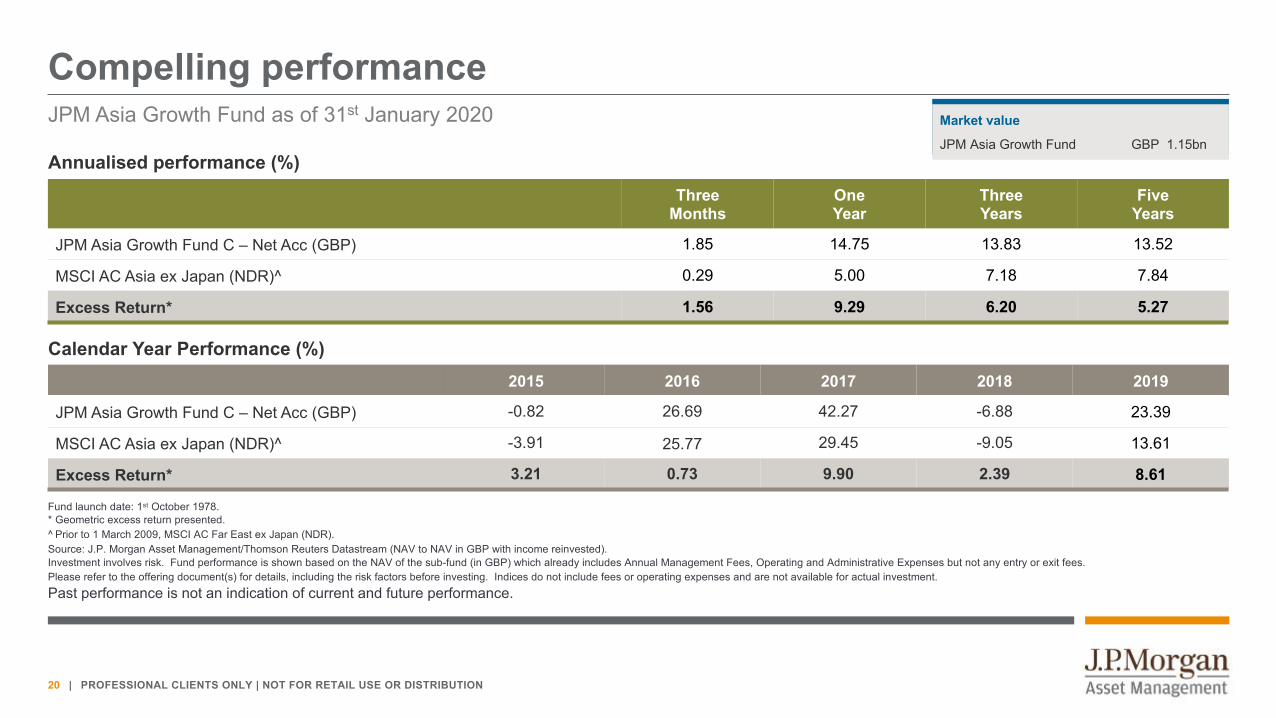
Compelling performanceJPM Asia Growth Fund as of 31st January 2020
Fund launch date: 1st October 1978.* Geometric excess return presented. ^ Prior to 1 March 2009, MSCI AC Far East ex Japan (NDR).Source: J.P. Morgan Asset Management/Thomson Reuters Datastream (NAV to NAV in GBP with income reinvested).Investment involves risk. Fund performance is shown based on the NAV of the sub-fund (in GBP) which already includes Annual Management Fees, Operating and Administrative Expenses but not any entry or exit fees. Please refer to the offering document(s) for details, including the risk factors before investing. Indices do not include fees or operating expenses and are not available for actual investment. Past performance is not an indication of current and future performance.
Annualised performance (%)
Calendar Year Performance (%)
Market value
JPM Asia Growth Fund GBP 1.15bn
2015 2016 2017 2018 2019
JPM Asia Growth Fund C – Net Acc (GBP) -0.82 26.69 42.27 -6.88 23.39
MSCI AC Asia ex Japan (NDR)^ -3.91 25.77 29.45 -9.05 13.61
Excess Return* 3.21 0.73 9.90 2.39 8.61
ThreeMonths
One Year
Three Years
FiveYears
JPM Asia Growth Fund C – Net Acc (GBP) 1.85 14.75 13.83 13.52
MSCI AC Asia ex Japan (NDR)^ 0.29 5.00 7.18 7.84
Excess Return* 1.56 9.29 6.20 5.27

PROFESSIONAL CLIENTS ONLY | NOT FOR RETAIL USE OR DISTRIBUTION
Image source: Shutterstock

22 | PROFESSIONAL CLIENTS ONLY | NOT FOR RETAIL USE OR DISTRIBUTION
Investment objective and risk profile JPMorgan Funds – Asia Growth Fund
Please refer to the Fund's prospectus or Key Investor Information Document (KIID) for more information relating to the Fund.
Risk profilen The value of your investment may fall as well as rise and you may get back less than you originally invested.
n The value of equity and equity-linked securities may fluctuate in response to the performance of individual companies and general market conditions. Furthermore, participation notes run the risk of counterparty default which may result in the loss of the full market value of the note.
n Emerging markets may be subject to increased political, regulatory and economic instability, less developed custody and settlement practices, poor transparency and greater financial risks. Emerging market currencies may be subject to volatile price movements. Emerging market securities may also be subject to higher volatility and be more difficult to sell than non-emerging market securities.
n The Fund may be concentrated in a limited number of securities, industry sectors or countries and as a result, may be more volatile than more broadly diversified funds.
n The Fund may invest in China A-Shares through the China Hong Kong Stock Connect Programmes which are subject to regulatory change, quota limitations and also operational constraints which may result in increased counterparty risk.
n Movements in currency exchange rates can adversely affect the return of your investment.
Investment objectiveTo provide long-term capital growth from investment primarily in a growth biased portfolio of companies in Asia (excluding Japan).
Extract from the Investment Policy: The Fund will invest in companies that are incorporated under the laws of, and have their registered office in an Asian (excluding Japan) country, or that derive the predominant part of their economic activity from Asian (excluding Japan) countries, even if listed elsewhere.

23 | PROFESSIONAL CLIENTS ONLY | NOT FOR RETAIL USE OR DISTRIBUTION
FOR PROFESSIONAL CLIENTS ONLY – NOT FOR RETAIL USE OR DISTRIBUTION.
This is a marketing communication and as such the views contained herein do not form part of an offer, nor are they to be taken as advice or a recommendation, to buy or sell any investment or interest thereto. Reliance upon information in this material is at the sole discretion of the reader. Any research in this document has been obtained and may have been acted upon by J.P. Morgan Asset Management for its own purpose. The results of such research are being made available as additional information and do not necessarily reflect the views of J.P. Morgan Asset Management. Any forecasts, figures, opinions, statements of financial market trends or investment techniques and strategies expressed are, unless otherwise stated, J.P. Morgan Asset Management’s own at the date of this document. They are considered to be reliable at the time of writing, may not necessarily be all inclusive and are not guaranteed as to accuracy. They may be subject to change without reference or notification to you. It should be noted that the value of investments and the income from them may fluctuate in accordance with market conditions and taxation agreements and investors may not get back the full amount invested. Changes in exchange rates may have an adverse effect on the value, price or income of the products or underlying overseas investments. Past performance and yield are not a reliable indicator of current and future results. There is no guarantee that any forecast made will come to pass. Furthermore, whilst it is the intention to achieve the investment objective of the investment products, there can be no assurance that those objectives will be met. J.P. Morgan Asset Management is the brand name for the asset management business of JPMorgan Chase & Co. and its affiliates worldwide. To the extent permitted by applicable law, we may record telephone calls and monitor electronic communications to comply with our legal and regulatory obligations and internal policies. Personal data will be collected, stored and processed by J.P. Morgan Asset Management in accordance with our EMEA Privacy Policy www.jpmorgan.com/emea-privacy-policy. Prior to any application investors are advised to take all necessary legal, regulatory and tax advice on the consequences of an investment in the products. Investment is subject to documentation, which is comprised of the Prospectus, Key Investor Information Document (KIID) and either the Supplementary Information Document (SID) or Key Features/Terms and Conditions. These documents, together with the annual report, semi-annual report and instrument of incorporation are available free of charge from JPMorgan Asset Management (UK) Limited. This communication is issued by JPMorgan Asset Management (UK) Limited, which is authorised and regulated in the UK by the Financial Conduct Authority. Registered in England No: 01161446. Registered address: 25 Bank Street, Canary Wharf, London E14 5JP.
0903c02a8281c8db