half year 2017 earnings presentation - axa axa... · * contribution to ambition 2020 ueps cagr...
TRANSCRIPT

August 3, 2017
Half Year 2017Earnings presentation

IMPORTANT LEGAL INFORMATION AND CAUTIONARY STATEMENTS CONCERNING FORWARD-LOOKING STATEMENTSCertain statements contained herein may be forward-looking statements including, but not limited to, statements that are predictions of orindicate future events, trends, plans, expectations or objectives. Undue reliance should not be placed on such statements because, by theirnature, they are subject to known and unknown risks and uncertainties and can be affected by other factors that could cause AXA’s actualresults to differ materially from those expressed or implied in the forward looking statements. Please refer to Part 4 - “Risk factors and riskmanagement” of AXA’s Registration Document for the year ended December 31, 2016, for a description of certain important factors, risks anduncertainties that may affect AXA’s business and/or results of operations. AXA undertakes no obligation to publicly update or revise any ofthese forward-looking statements, whether to reflect new information, future events or circumstances or otherwise, except as part ofapplicable regulatory or legal obligations.
In addition, this report refers to certain non-GAAP financial measures, or alternative performance measures, used by management inanalyzing AXA’s operating trends, financial performance and financial position and providing investors with additional information thatmanagement believes is useful and relevant regarding AXA’s results. These alternative performance measures generally have nostandardized meaning and therefore may not be comparable to similarly labelled measures used by other companies. As a result, none ofthese non-GAAP financial measures should be considered in isolation from, or as a substitute for, the Group’s consolidated financialstatements and related notes prepared in accordance with IFRS. The Non-GAAP measures underlying earnings and adjusted earnings arereconciled to net income on pages A16 and A17 of this release. Other non-GAAP financial measures used in this presentation are defined inthe Glossary set forth in AXA’s 1H17 Activity Report (pp. 83-88).

Table of contents
A 3 Half Year 2017 Earnings l August 3, 2017
1. Introduction & highlights A.04Thomas Buberl, Group CEO
2. 1H17 financial performance A.13
Gérald Harlin, Group CFO
3. Concluding remarks A.35
Thomas Buberl, Group CEO

1Introduction & highlights
Thomas Buberl, Group CEO

Strong earnings growth
A 5 Half Year 2017 Earnings l August 3, 2017
Adjusted earnings per shareUnderlying earnings per share
1.26
+5%
1H171H16
1.21
3% - 7% UEPS CAGR
target(2015-2020E)
1.33 1.39
+4%
1H171H16
In Euro
Ambition 2020
Changes are on a reported basis

Growth in underlying earnings across all businesses
A 6 Half Year 2017 Earnings l August 3, 2017
Property & CasualtyLife & Savings
1H17
1,347
+6%
1H16 restated
1,274
1H17
1,984
+3%
1H16 restated
1,903
Asset management
213236
1H17
+10%
1H16
In Euro million
Changes are in constant Forex

Growth in preferred segments
A 7 Half Year 2017 Earnings l August 3, 2017
Commercial lines
+9%
80% non-motor(+3% vs. 1H16)
20% motor(+1% vs. 1H16)
+2%
NBV in Asia
+11%Unit-LinkedAPE
P&C revenues
+6%
1H171H16
+4%
FY16FY15 revenuesHealth
L&S NBV margin
40%
M&AEfficiencyTechnical margin
Growth
Changes are on comparable basis
25%vs. 10% in 1H16
China NBV margin
excl. Japan

Technical margin – Property & Casualty
A 8 Half Year 2017 Earnings l August 3, 2017
1H17 all year combined ratio
1H17
96.9%
1H16 restated
98.4%
-1.5 pts
96.1%
95% - 94% All year combined ratio
Ambition 2020
M&AEfficiencyTechnical margin
Growth
Current year combined ratio
Changes are in constant Forex

Efficiency – on track to achieve Ambition 2020
A 9 Half Year 2017 Earnings l August 3, 2017
0.3
2.1
0.2
FY16
1H17
Ambition 2020target
FY16-1H17 achievement
Administrative expenses
Claims handling costs
Acquisition expenses
M&AEfficiencyTechnical margin
GrowthIn Euro billion
+3% UEPS CAGR*2015 – 2020E
* Contribution to Ambition 2020 UEPS CAGR target from cost savings as per 2016 Investor Day
Ambition 2020
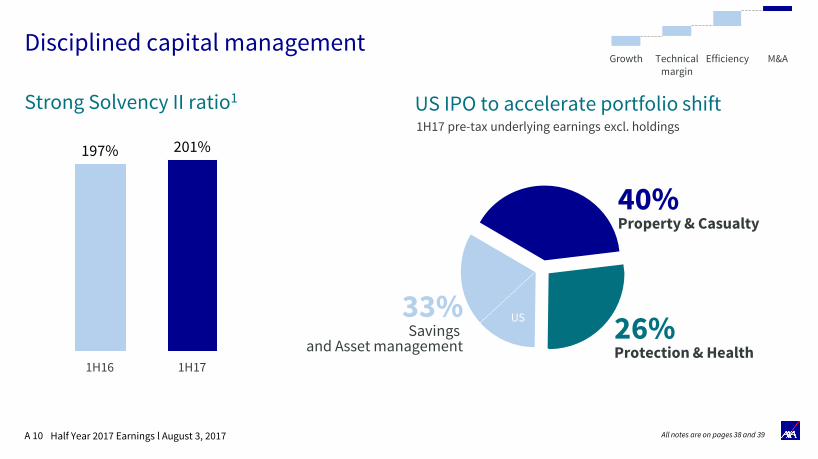
Disciplined capital management
A 10 Half Year 2017 Earnings l August 3, 2017
Strong Solvency II ratio1
201%
1H16
197%
1H17
M&AEfficiencyTechnical margin
Growth
US IPO to accelerate portfolio shift1H17 pre-tax underlying earnings excl. holdings
40%Property & Casualty
26%Protection & Health
33%Savings
and Asset management
US
All notes are on pages 38 and 39

A 11 Half Year 2017 Earnings l August 3, 2017
1H17 initiatives to help people living a better life
Sponsor of the world’s first Global Investor statement against
tobaccoRE 100
100% sustainable electricity by
2025
Pioneer in extending coal exclusion policy to
insurance business
75+ companies banned
Climate change
EU High-Level Expert Group on Sustainable Finance: regulatory
recommendations to foster sustainable growth and inclusive
resource-efficient economy
Sustainable finance Health

Ambition 2020 – On track on key objectives
A 12 Half Year 2017 Earnings l August 3, 2017
Underlying earnings per share
Adjusted return on equity2 Solvency II ratio
14.6%13.5%14.1% 14.7%
1H171H16FY16FY15
197%197%205% 201%
1H17FY161H16FY15
170%-
230%Target range
Ambition 2020
Ambition 2020
3%-
7% UEPS CAGR1
Ambition 2020
Free cash flows
Ambition 2020
28 - 32Euro billion
cumulative FCF
6.2
FY16
6.2
FY15
+5%
1H17
1.26
1H16
1.21
FY16
2.24
FY15
2.16
+4%
12%-
14%
All figures are as published
In Euro In Euro billion
All notes are on pages 38 and 39

21H17 financial performance
Gérald Harlin, Group CFO

A 14
Group earnings
Life & Savings
Property & Casualty
Asset management
Balance sheet
Half Year 2017 Earnings l August 3, 2017

Underlying earnings
A 15
Underlying earnings by segment
1H17
3,171
1H16
3,063
+3%
Underlying earnings
Half Year 2017 Earnings l August 3, 2017
In Euro million
Changes are in constant Forex
1H16
restated1H17
Constant
Forex
Life & Savings 1,903 1,984 +3%
Property & Casualty 1,274 1,347 +6%
Asset Management 213 236 +10%
Banking 60 52 -13%
Holdings -387 -448 -15%
Underlying earnings 3,063 3,171 +3%

Adjusted earnings
Adjusted earnings
A 16
Details of Adjusted earnings
+3%
1H17
3,478
1H16
3,364
Half Year 2017 Earnings l August 3, 2017
In Euro million
Changes are in constant Forex
1H16 1H17
Underlying earnings 3,063 3,171
Net realized capital gains/losses 301 307
o/w realized capital gains 479 415
o/w net impairments -194 -66
o/w hedging of equity portfolio 16 -42
Adjusted earnings 3,364 3,478

1H16 1H17
Adjusted earnings 3,364 3,478
Change in fair value & Forex -647 -154
o/w gains (losses) on economic hedges -517 -281
o/w change in fair value of assets accounted
for as fair value option-130 127
Exceptional and discontinued operations 626 39
Integration & Restructuring costs -91 -51
Intangibles amortization and other -45 -44
Net income 3,207 3,268
Net income
Net income
A 17
Details of Net income
1H16
3,207
1H17
+1%
3,268
Half Year 2017 Earnings l August 3, 2017
In Euro million
Changes are in constant Forex
1
All notes are on pages 38 and 39
A 18
Group earnings
Life & Savings
Property & Casualty
Asset management
Balance sheet
Half Year 2017 Earnings l August 3, 2017

L&S – New business sales and margins by market
A 19
In Euro million
Life & Savings NBV
+2%
1,296
1H171H16restated
1,335
APE, NBV and NBV margin by market
Half Year 2017 Earnings l August 3, 2017
Type of market
1H17 change 1H17 change 1H17 change
Mature markets 2,638 +2% 1,033 0% 39% -0.9 pt
Emerging markets 692 -2% 302 +9% 44% +4.5 pts
TOTAL 3,330 +1% 1,335 +2% 40% +0.2 pt
APE NBV NBV margin (%)
Changes are on a comparable basis

L&S – New business sales and margins by business
A 20
+1.0
+0.7
-2.9
+4.3
G/ATraditional1
Protection& Health
In Euro billion
Unit-Linked
G/A CapitalLight2
Net flows
Half Year 2017 Earnings l August 3, 2017
Includes +1.6 SCS3
and -1.3 VA GMxB in the US
Changes are on a comparable basis
Business LinesNBV
margin
1H17 change 1H171H16
restated1H17
Protection & Health 1,539 +1% 60% +3.9 +4.3
G/A Savings 614 -16% 18% -0.4 -2.2
of which G/A capital light 356 -13% 24% +2.3 +0.7
Unit-Linked 845 +11% 32% +0.6 +1.0
Mutual Funds & Other 332 +22% 8% +0.1 -0.1
TOTAL 3,330 +1% 40% +4.2 +3.0
APE
(Euro million)
Net Flows
(Euro billion)
40%
60%
18%
24%
32%
8%
All notes are on pages 38 and 39

L&S – Underlying earnings by businessIn Euro million
+3%
1H17
1,984
1H16restated
1,903
A 21
Total Life & Savings (post-tax)
Underlying earnings by business(pre-tax)
Half Year 2017 Earnings l August 3, 2017
- +-
Protection & Health G/A Savings Unit-Linked
-10%
1H17
1,233
1H16restated
1,355-4%
1H17
428
1H16restated
415
+35%
1H17
617
1H16restated
449
Mortality model changes in the US (-0.1 billion)
Lower investment margin Higher management fees mainly in France and the US
Higher GMxB margin
Changes are on a comparable basis for pre-tax earnings and in constant Forex for post-tax earnings Full detail in appendix on pages B19 to B30
+

A 22
Group earnings
Life & Savings
Property & Casualty
Asset management
Balance sheet
Half Year 2017 Earnings l August 3, 2017

P&C – Revenues by business
A 23
In Euro million
1H17
20,983
+1.4%
1H16restated
20,876
Total revenues
Half Year 2017 Earnings l August 3, 2017
Or +2.3% excl. Turkey
Changes are on a comparable basis
1
Price
effect
1H17 change 1H17
Personal lines 10,363 +1% +2.7%
of which non-motor +3%
Commercial lines 10,577 +2% +1.7%
of which non-motor +3%
TOTAL 20,983 +1% +2.2%
Revenues
All notes are on pages 38 and 39

0.1%
P&C – Underlying earnings
A 24
In Euro million
1H16restated
1,274
+6%
1H17
1,347
Total underlying earnings Combined ratio
Investment income
+2%
1H17
1,127
1H16restated
1,129 • Investment yield of 3.4% vs. 3.5% in 1H16
• Higher average invested assets in 1H17
Current year combined ratio Prior year reserve developments All year combined ratio+
Lower nat cat
Higher natural events
Lower attritional losses+
In Euro million
Half Year 2017 Earnings l August 3, 2017
+1H17
96.9%
1H16 restated
98.4%
0.7%
-1.9% -0.7%
1H17
96.1%
1H16 restated
96.4%
Natural catastrophes
Changes are in constant Forex
Full detail in appendix on pages B35 to B38
-

A 25
Group earnings
Life & Savings
Property & Casualty
Asset management
Balance sheet
Half Year 2017 Earnings l August 3, 2017

Asset management
A 26
In Euro million
213236
1H17
+10%
1H16
Total underlying earnings Details of asset management
Half Year 2017 Earnings l August 3, 2017
Net flows and average AUM in Euro billion, revenues and underlying earnings in Euro million
*or Euro +5 billion excl. Asian Joint Ventures
*
Net flows
1H17 1H17 change 1H17 change 1H17 change
AXA IM -4 627 +7% 607 +6% 129 +13%
AB +4 475 +2% 1,333 +6% 107 +7%
TOTAL 0 1,102 +5% 1,941 +6% 236 +10%
Average AUM Revenues Underlying earnings
Changes are in constant Forex for earnings and on a comparable basis for revenues and average AUM
1
All notes are on pages 38 and 39
A 27
Group earnings
Life & Savings
Property & Casualty
Asset management
Balance sheet
Half Year 2017 Earnings l August 3, 2017

Asset & Liability Management (1/4)
Euro 575billion3
Other fixed income2 (8%)
Cash (4%)
Real estate (5%)
Listed equities (4%)
Policy loans (1%)
Alternative investments1 (3%)
Total General Account Invested Assets
A 28
82% of assetsinvested in Fixed income
39%Govies & related
35% Corporate bonds
Half Year 2017 Earnings l August 3, 2017
Long asset duration
8.2
5.5
years
years
Life & Savings
Property & Casualty
Leading to a slow yield dilution
3.3%3.6%3.7%3.7%3.8%3.9%4.0% 3.1%
FY15FY14FY13FY12 1H175FY164FY11FY10
3.4%3.6%3.9%3.9%3.9%4.0%4.0% 3.4%
FY13FY12 FY15FY14 1H175FY164FY11FY10
Life & Savings
Property& Casualty
Fixed income assets duration as of June 30,2017
All notes are on pages 38 and 39Full detail in appendix on pages B46 to B63

Asset & Liability Management (2/4) – Ratings
A 29
Average rating maintained in the AA range
Non rated (2%)
Below investment grade (1%)
Euro 227billion
39% AA
15% A
18% BBB
26%AAA
Below investment grade (7%)
34% A
11%
AA
36% BBB
12%AAA
Average rating maintained in the A range
Half Year 2017 Earnings l August 3, 2017
Euro 200billion
All notes are on pages 38 and 39
Government and related bonds Corporate bonds1

Asset & Liability Management (3/4) – New investments
A 30
1H17 new investments
ABS (~10%)
Below Investment Grade credit1 (6%)
~58% Investment grade credit (average rating A)
~26% Government
bonds & related (average rating AA)
Euro 31 billion invested in fixed income in 1H17
Of which • ca. 83% corporate bonds • ca. 8% Commercial Real Estate loans• ca. 8% other loans
Half Year 2017 Earnings l August 3, 2017 All notes are on pages 38 and 39
1H172
Eurozone 1.9%
US 2.6%
Japan 0.8%
Switzerland 0.8%
TOTAL 2.0%
Yield on new investments in fixed income assets
for Life & Savings and Property & Casulaty entities
New fixed income investments Resilient new investment yield
Guidance65-75 bps
75 bps71 bps
1H171H16
restated
Asset & Liability Management (4/4) - Life & Savings General Account
A 31
Details of spread above guaranteed rates
• Significant buffer to cover guarantees and to manage crediting rates to preserve investment margin
• Average inforce reserves of Euro 373 billion
• New business sold in combination with higher margin Unit-Linked business (hybrid2 sales)
Half Year 2017 Earnings l August 3, 2017 All notes are on pages 38 and 39
1H17 Yield on assetsAverage
guaranteed rates
Spread above
guarantee
Inforce 3.1% 1.9% +120bps
New business 2.0% 0.3% +170bps
Investment margin1

Shareholders’ equity
A 32
68.070.6
FY16 1H17
Adjusted ROE
13.5% 14.7%
1H17 vs. FY16
Dividends -2.8
Share buyback -0.9
Change in net unrealized capital gains -0.2
Subordinated debt (incl. interest charges) -0.1
Net income for the period +3.3
Change in pension benefits +0.4
Forex and other -2.3
-
+
+
-
-
-
Half Year 2017 Earnings l August 3, 2017 All notes are on pages 38 and 39
In Euro billion
-

Debt & Ratings
9.18.0
8.17.8
18.3
1.1
1H17
1.1
16.9
FY16
AA-stable
as of 10/05/2017
Aa3stable
as of 09/09/2016
AA-stable
as of 31/05/2017 Subordinated debt1
Undated subordinated debt
Senior debt
A 33
Financial debtIn Euro billion
Debt ratios
Ratings
Half Year 2017 Earnings l August 3, 2017 All notes are on pages 38 and 39
2
FY16 1H17
Debt gearing 26% 26%
Interest cover 15.7x 15.6x

Solvency II ratio
A 34 Half Year 2017 Earnings l August 3, 2017
Solvency II ratio1
In Euro billion
Key sensitivities
Solvency II ratio roll-forward
1H17
201%
Subordinated debt, forex & other
-2 pts
Market impact excl. forex
+1 pt
Dividend
-5 pts
Operatingreturn
+9 pts
FY16
197%
Equity markets -25%
Equity markets +25%
Corporate spreads +75bps
Interest rate -50bps
Interest rate +50bps
Ratio as of June 30, 2017
+5 pts
-9 pts
-1 pt
+5 pts
-6 pts
201%
206%
192%
200%
206%
195%
Required capital
Available capital
58.757.9
29.329.4
1H17FY16
Solvency II ratio 197% 201%
All notes are on pages 38 and 39
3Concluding remarks
Thomas Buberl, Group CEO

Key takeaways
A 36 Half Year 2017 Earnings l August 3, 2017
Strong earnings per share growth supported by growth in all business lines
Focused topline growth
Strong technical improvement

Q&A

Notes (1/2)
A 38 Half Year 2017 Earnings l August 3, 2017
Page A10:1. The Solvency II ratio is estimated based on AXA’s internal model calibrated based on adverse 1/200 year shock and assuming US equivalence. AXA’s internal model was approved by ACPR on
November 18, 2015. Solvency II took effect January 1, 2016
Page A12:1. Compound annual growth rate2. Adjusted ROE: Return corresponds to adjusted earnings net of interest charges on undated debt. Equity corresponds to average shareholders’ equity excluding undated debt and reserves related
to change in fair value
Page A17:1. Interest rate and foreign exchange economic hedges not eligible for hedge accounting under IAS 39
Page A20:1. G/A Savings products, which, at inception, create less AFR than the economic capital they consume2. G/A Savings products, which, at inception, create more AFR than the economic capital they consume3. SCS is a non-GMxB Variable Annuity product in the US
Page A23:1. Of which other P&C revenues at Euro 43 million in 1H17
Page A26:1. AXA IM’s joint ventures in Asia (China, South Korea and India) are included at 100% in net flows, opening and closing assets under management but are excluded from revenues and average
assets under management as they are not fully consolidated

Notes (2/2)
A 39 Half Year 2017 Earnings l August 3, 2017
Page A28:1. Mainly Private Equity and Hedge Funds2. Other fixed income include Asset backed securities (Euro 13 billion), residential loans (Euro 12 billion), commercial & agricultural loans (Euro 21 billion) and Agency Pools (Euro 1 billion)3. 1H17 invested assets referenced in page 51 of the financial supplement are Euro 778 billion, which include notably Euro 175 billion of Unit-linked assets and Euro 35 billion related to the banking
segment4. Published5. Annualized
Page A29:1. Corporate bonds not rated by external rating agencies are reallocated under AXA’s internal ratings: AAA: Euro 0.3 billion / AA: Euro 0.9 billion / A: Euro 3.5 billion / BBB: Euro 3.9 billion / Below
investment grade: Euro 3.1 billion
Page A30:1. Mainly short duration high yield2. Annualized
Page A31:1. Annualized Group investment margin on total Life & Savings General Account business2. Hybrid products are savings products allowing clients to invest in both Unit-Linked and General Account assets
Page A33:1. Including Euro 0.9 billion of reversal of market-to-market on interest rates derivatives in 1H17 versus Euro 1.3 billion in FY162. Including undated debt interest charges
Page A34:1. Solvency II ratio is estimated including a theoretical amount for dividends accrued for the first half of 2017, based on half of the full year dividend paid in 2017 for FY 2016. Dividends are proposed
by the Board at its discretion based on a variety of factors described in AXA’s 2016 Annual Report and then submitted to AXA’s shareholders for approval. This estimate should not be considered in any way to be an indication of the actual dividend amount, if any, for the 2017 financial year
Definitions (1/2)
A 40 Half Year 2017 Earnings l August 3, 2017
AXA’s 1H17 financial statements are subject to a completion of limited review by AXA’s independent auditors
AXA's 1H17 results have been prepared in accordance with IFRS and interpretations applicable and endorsed by the European Commission as of June 30, 2017
Underlying earnings, Adjusted earnings, APE, NBV and Group Operating Free Cash Flows are non-GAAP measures and as such are not audited, may not be comparable to similarly titled measures reported by other companies and should be read together with our GAAP measures. Management uses these non-GAAP measures as key indicators of performance in assessing AXA’s various businesses and believes that the presentation of these measures provides useful and important information to shareholders and investors as measures of AXA’s financial performance. For a reconciliation of underlying and adjusted earnings to net income see pages A16 and A17 of this presentation
Life & Savings emerging markets: APE and NBV: China, Czech Republic, Hong Kong, India, Indonesia, Mexico, Morocco, the Philippines, Poland, Singapore, Thailand and Turkey; Revenues: Colombia, Czech Republic, Hong Kong, Indonesia (excl. bancassurance entity), Mexico, Morocco, Poland, Singapore, Slovakia and Turkey
Property & Casualty emerging markets: Revenues: Brazil, Colombia, the Gulf region, Hong Kong, Malaysia, Mexico, Morocco, Poland, Singapore, Thailand and Turkey
South-East Asia, India and China (L&S): APE and NBV: China, India, Indonesia, the Philippines, Singapore and Thailand; Revenues: Singapore and non-bancassurancesubsidiaries in Indonesia; China, India, the Philippines, and bancassurance business in Indonesia and Thailand are not included in revenues due to consolidation under equity method; Malaysian operations are not consolidated
Asia (P&C): Hong Kong, Malaysia, Singapore and Thailand. China and India are not included in revenues due to consolidation under equity method. Indonesian operations are not consolidated
EMEA-LATAM region: Europe, Middle East, Africa & Latin America. For Life & Savings: Colombia, Czech Republic, Greece, Luxembourg, Mexico, Morocco, Poland, Slovakia, and Turkey are fully consolidated; Nigeria is consolidated under the equity method and contributes only to the underlying earnings, adjusted earnings and net income. For Property & Casualty: Brazil, Colombia, Greece, the Gulf region, Luxembourg, Mexico, Morocco and Turkey are fully consolidated; Russia, Nigeria and Lebanon are consolidated under the equity method and contribute only to the underlying earnings, adjusted earnings and net income; Poland is fully consolidated since January 1,2017

Definitions (2/2)
A 41 Half Year 2017 Earnings l August 3, 2017
Direct (P&C): AXA Global Direct (Belgium, France, Italy, Japan, Poland, South Korea and Spain), UK Direct operations. In France, Natio is not included in revenues due to consolidation under equity method.
Emerging markets include the following entities: EMEA-LATAM Region (Brazil, Colombia, Czech Republic, the Gulf region, Lebanon, Mexico, Morocco, Nigeria, Poland, Slovakia, Turkey and Russia), Hong Kong, South-East Asia (Indonesia, Malaysia, the Philippines, Singapore and Thailand), India and China, excluding Direct operations.
Mature markets include the following entities: AXA Assistance, AXA Corporate Solutions Assurance, Belgium, France, Germany, Greece, Italy, Ireland, Japan, Luxembourg, Switzerland, Spain, the United Kingdom and the United States.

August 3, 2017
Half Year 2017Appendices

IMPORTANT LEGAL INFORMATION AND CAUTIONARY STATEMENTS CONCERNING FORWARD-LOOKING STATEMENTSCertain statements contained herein may be forward-looking statements including, but not limited to, statements that are predictions of orindicate future events, trends, plans, expectations or objectives. Undue reliance should not be placed on such statements because, by theirnature, they are subject to known and unknown risks and uncertainties and can be affected by other factors that could cause AXA’s actualresults to differ materially from those expressed or implied in the forward looking statements. Please refer to Part 4 - “Risk factors and riskmanagement” of AXA’s Registration Document for the year ended December 31, 2016, for a description of certain important factors, risks anduncertainties that may affect AXA’s business and/or results of operations. AXA undertakes no obligation to publicly update or revise any of theseforward-looking statements, whether to reflect new information, future events or circumstances or otherwise, except as part of applicableregulatory or legal obligations.
In addition, this report refers to certain non-GAAP financial measures, or alternative performance measures, used by management in analyzingAXA’s operating trends, financial performance and financial position and providing investors with additional information that managementbelieves is useful and relevant regarding AXA’s results. These alternative performance measures generally have no standardized meaning andtherefore may not be comparable to similarly labelled measures used by other companies. As a result, none of these non-GAAP financialmeasures should be considered in isolation from, or as a substitute for, the Group’s consolidated financial statements and related notesprepared in accordance with IFRS. The Non-GAAP measures underlying earnings and adjusted earnings are reconciled to net income on pagesA16 and A17 of the main presentation of this release. Other non-GAAP financial measures used in this document are defined in the Glossary setforth in AXA’s 1H17 Activity Report (pp. 83-88).

Table of contents
B3 Half Year 2017 Earnings l Appendices l August 3, 2017
1. BUSINESS OVERVIEW B.04
2. GROUP B.12
3. LIFE & SAVINGS B.16
4. PROPERTY & CASUALTY B.32
5. HEALTH B.39
6. ASSET MANAGEMENT B.41
7. BALANCE SHEET B.44
8. CORPORATE RESPOSIBILITY B.67

B1Business Overview

Group revenues and underlying earnings
B5 Half Year 2017 Earnings l Appendices l August 3, 2017
1H17 Revenues by geography 1H17 Underlying earnings by geography
Euro 54 billion
Asia (incl. Japan) 9%
Other1 12%
Europe (excl. France) 40%
United States 17%
France2 23%
Euro 3.2 billion3
Asia (incl. Japan) 16%
Other1 10%
Europe (excl. France) 33%
United States 16%
France2 24%
1. Other include Direct, EMEA-LATAM region, AXA Corporate Solutions, AXA Assistance, AXA Life Invest (excl. Germany and Japan), AXA Corporate Solutions Life Reinsurance Company, AXAGlobal Life, Architas, AXA Global P&C, AXA Liabilities Managers
2. France includes AXA IM, US includes AB, Europe (excl. France) includes Banking,3. Underlying earnings split excluding holdings. Total underlying earnings including holdings.

Life & Savings | Scope Overview
B6 Half Year 2017 Earnings l Appendices l August 3, 2017
Global footprint1H17 APE by geography
Well balanced business mix1H17 APE by business
Strong proprietary networks1H17 APE by channelUS 29%
Asia (incl. Japan) 26%
Other Europe2 17%
France 27%
Other1 2%
1. Other: EMEA-LATAM, Architas, AXA Life Invest (excluding Germany & Japan), AXA Global Life andAXA Corporate Life Reinsurance Company
2. Other Europe (excl. France): Germany, Switzerland, Belgium, Italy and Spain
G/A Savings 18%
Unit-Linked 25%Protection & Health 46%
Mutual Funds & other 10%
Euro 3,330million
Euro 3,330million
Euro 3,330million
Brokers – IFAs& others 26%
Partnerships 22%
Agents & salariedsales force 52%
B7 Half Year 2017 Earnings l Appendices l August 3, 2017
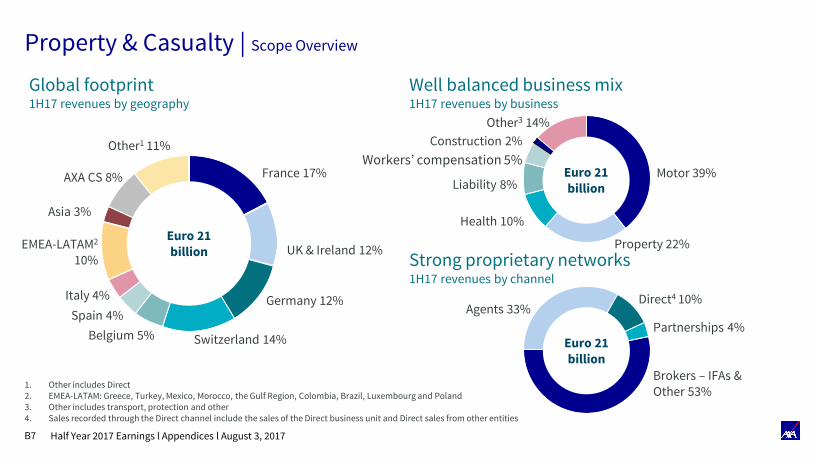
Property & Casualty | Scope Overview
Global footprint1H17 revenues by geography
Well balanced business mix1H17 revenues by business
Strong proprietary networks1H17 revenues by channel
Euro 21billion
Germany 12%Spain 4%
France 17%
UK & Ireland 12%
Belgium 5%
Italy 4%
Other1 11%
AXA CS 8%
Switzerland 14%
EMEA-LATAM2
10%
Asia 3%
1. Other includes Direct2. EMEA-LATAM: Greece, Turkey, Mexico, Morocco, the Gulf Region, Colombia, Brazil, Luxembourg and Poland3. Other includes transport, protection and other4. Sales recorded through the Direct channel include the sales of the Direct business unit and Direct sales from other entities
Euro 21billion
Euro 21billion
Agents 33%
Partnerships 4%
Direct4 10%
Brokers – IFAs &Other 53%
Other3 14%
Workers’ compensation 5%
Property 22%
Construction 2%
Motor 39%Liability 8%
Health 10%
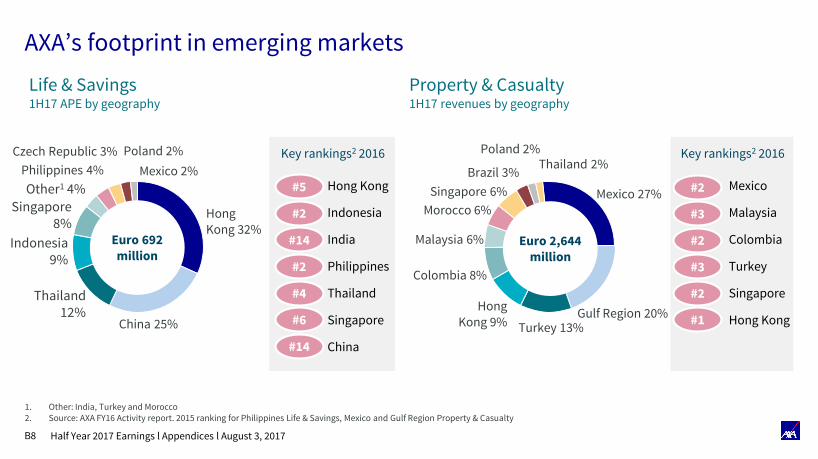
AXA’s footprint in emerging markets
B8 Half Year 2017 Earnings l Appendices l August 3, 2017
Life & Savings1H17 APE by geography
Property & Casualty1H17 revenues by geography
1. Other: India, Turkey and Morocco2. Source: AXA FY16 Activity report. 2015 ranking for Philippines Life & Savings, Mexico and Gulf Region Property & Casualty
#2
#14 India
#14 China
#2 Indonesia
Thailand
#6 Singapore
Hong Kong
#4
#5
Philippines
Key rankings2 2016 Key rankings2 2016
#3 Malaysia
#1 Hong Kong
#2 Singapore
Mexico
#3
#2
Turkey
#2 ColombiaEuro 692million
Euro 2,644million
Turkey 13%
Malaysia 6%
Mexico 27%Singapore 6%
Colombia 8%
Morocco 6%
Gulf Region 20%Hong
Kong 9%
Poland 2%
Brazil 3%
Thailand12%
China 25%
Other1 4%
HongKong 32%
Mexico 2%
Indonesia9%
Singapore8%
Philippines 4%
Czech Republic 3% Poland 2%Thailand 2%

L&S Economic Gross Revenues
B9 Half Year 2017 Earnings l Appendices l August 3, 2017
1. Economic gross revenues definition: all entities are shown at ownership rate.2. IFRS: IFRS scope of consolidation (fully consolidated entities at 100% and equity-method entities at 0%).3. EMEA-LATAM: Colombia, Czech Republic, Greece, Luxembourg, Mexico, Morocco, Nigeria, Poland, Slovakia and Turkey4. Other: AXA Life Invest (excl. Germany & Japan), AXA Corporate Solutions Life Reinsurance Company, AXA Global Life, Architas
Economic Gross Revenues1
In Euro million
United States 6,925 7,727 +8% +8%
France 7,916 8,115 +2% +3%
Germany 3,325 3,377 +2% +2%
Switzerland 5,119 4,945 -5% -5%
Belgium 614 561 -9% -9%
Italy 1,143 831 -27% -28%
Spain 496 306 -38% -38%
EMEA-LATAM3 488 539 +10% +10%
Japan 2,563 2,401 -8% -8%
South-East Asia, India & China 1,912 2,224 +16% +18%
Hong Kong 1,245 1,303 +2% +2%
Other4 146 56 -60% -59%
Total 31,893 32,385 0% -1%
1H16
restated1H17
Change on
comparable basisIFRS
2 change on
comparable basis

P&C Economic Gross Revenues
B10 Half Year 2017 Earnings l Appendices l August 3, 2017
1. Economic gross revenues definition: all entities are shown at ownership rate.2. IFRS: IFRS scope of consolidation (fully consolidated entities at 100% and equity-method entities at 0%).3. EMEA-LATAM: Brazil, Colombia, Greece, the Gulf Region, Lebanon, Luxembourg, Mexico, Morocco, Nigeria, Poland, Russia and Turkey4. Other: AXA Global P&C and AXA Liabilities Managers
Economic Gross Revenues1
In Euro million
France 3,703 3,641 0% 0%
United Kingdom & Ireland 2,565 2,462 +5% +5%
Germany 2,517 2,576 +2% +2%
Switzerland 2,771 2,856 +1% +1%
Belgium 1,102 1,116 +1% +1%
Italy 725 766 +6% +5%
Spain 839 862 +3% +3%
EMEA-LATAM3 2,139 2,093 -2% -4%
Direct 1,490 1,535 +1% +1%
Asia 802 820 +2% -2%
AXA Corporate Solutions 1,527 1,614 +6% +6%
AXA Assistance 646 653 0% 0%
Other4 81 87 +17% +17%
Total 20,906 21,081 +2% +1%
1H16
restated1H17
Change on
comparable basisIFRS
2 change on
comparable basis

Asset management | Scope overview
B11 Half Year 2017 Earnings l Appendices l August 3, 2017
• Multi-expert model: structured by “Expertise”
• Expertise in fixed income, equities, quantitative equities
• Focus on alternative investments (structured finance, real estate, funds of hedge funds)
• Client centric business model across the full value chain
• Risk-reducing, return-seeking, diversifying strategies and customized solutions
• Expertise in actively managed equity and fixed income strategies, as well as index strategies
• Growing platform of alternative and multi-asset services and solutions
• Institutional research and trading
PRODUCT OFFER
• Separate distribution platforms for third parties & AXA insurance companies
• Global and integrated distribution platforms through Institutions, Retail and Private Client channels
DISTRIBUTION
• Mainly Europe • US, Europe and AsiaFOOTPRINT
• Euro 460 billion as at 30/06/2017 • Euro 735 billion as at 30/06/2017 AuM
Complementary business models

B2Group

RevenuesRevenues by segment
B13 Half Year 2017 Earnings l Appendices l August 3, 2017
Life & Savings 31,063 31,118 0% -1%
Property & Casualty 20,876 20,983 +1% +1%
Asset Management 1,799 1,941 +8% +6%
Banking 297 240 -19% -16%
Revenues 54,035 54,283 0% 0%
In Euro million1H16
restated1H17
Reported
change
Comparable
change

Underlying earnings by geography
B14 Half Year 2017 Earnings l Appendices l August 3, 2017
1. EMEA-LATAM: Luxembourg, Russia (P&C only), Poland, Czech Republic and Slovakia (L&S only), Greece, Turkey, Mexico, Morocco, Nigeria, Colombia, Gulf Region (P&C only), Lebanon(P&C only), and Brazil (P&C only)
2. Other countries: AXA Life Invest (excl. Germany & Japan), AXA Corporate Solutions Life Reinsurance, AXA Global Life, Architas, AXA Global P&C and AXA Liabilities Managers
Property & Casualty 1 274 1 347 +6% +6%
France 291 310 +7% +7%
United Kingdom & Ireland 106 102 -3% +4%
Germany 147 174 +18% +18%
Switzerland 247 245 -1% -2%
Belgium 61 90 +47% +47%
Italy 66 56 -15% -15%
Spain 55 49 -11% -11%
EMEA-LATAM1 71 116 +63% +65%
Direct 103 71 -31% -29%
Asia 30 22 -25% -24%
AXA Corporate Solutions 48 73 +54% +53%
AXA Assistance 7 13 +98% +98%
Other countries2 45 26 -42% -41%
In Euro million
Underlying earnings
1H16
restated1H17
Reported
change
Change at
constant Forex
Life & Savings 1 903 1 984 +4% +3%
France 419 432 +3% +3%
United States 462 484 +5% +2%
Japan 273 256 -6% -8%
Germany 126 100 -21% -21%
Switzerland 159 169 +6% +4%
Belgium 114 111 -2% -2%
Italy 40 38 -5% -5%
Spain 19 24 +27% +27%
EMEA-LATAM1 29 28 -4% -3%
Hong Kong 198 204 +3% 0%
South-East Asia & China 83 106 +28% +24%
Other countries2 -20 33 -266% -264%
In Euro million
Underlying earnings
1H16
restated1H17
Reported
change
Change at
constant Forex

1H17 Key sensitivities
B15 Half Year 2017 Earnings l Appendices l August 3, 2017
1. Consists of gains/losses on derivatives and forex economic hedges not eligible for hedge accounting under IAS 39, as well as the change in fair value of assetsaccounted for as fair value option
Balance Sheet
+75 bps -0.4 -2.2
+100 bps 0.0 -10.2
-75 bps +0.4 +2.2
0.0
+0.4
-0.4
+25% 0.0 +0.3 +1.7
-100 bps 0.0 +9.0
+0.3
0.0
-25% -0.4 -1.0 -1.2
In Euro billion
P&L
Impairments net of
hedges through
Adjusted Earnings
Total impact Net income
(incl. impact through
Adjusted earnings)
Net unrealized capital
gains through
Shareholders' Equity
Change 1 in fair value
and Forex through
Net Income
-0.6
Equities
Interest rates
Corporatespreads

B3Life & Savings

Life & Savings
B17 Half Year 2017 Earnings l Appendices l August 3, 2017
1. Revenues, new business volumes and profitability B.18
2. Underlying earnings margin analysis B.19
3. Underlying earnings margin analysis by business B.25
4. Focus on the US B.31

L&S | Revenues and net flows
B18 Half Year 2017 Earnings l Appendices l August 3, 2017
1H17 L&S revenues by regionIn Euro billion
1H17 L&S net flowsIn Euro billion
Changes are on a comparable basis
1. EMEA-LATAM: Czech Republic, Colombia, Greece, Luxembourg, Morocco, Mexico, Poland, Slovakia, Turkey, AXA Life Invest (excl. Germany & Japan), AXA Corporate Solutions Life ReinsuranceCompany, AXA Global Life and Architas
2. Europe (excl. France): Germany, Switzerland, Belgium, Italy and Spain3. G/A Savings products which, at inception, create more AFR than the economic capital they consume.
7.7
8.0
10.6
0.74.1
EMEA-LATAM and other1
-4%Asia (incl. Japan)-4%
Europe (excl. France)2
-9%
France+3%
US+8%
In Euro billion1H16
restated1H17
France +1.2 +1.0
Europe (excl. France) +1.3 +0.8
United States -0.2 -0.3
Asia (incl. Japan) +1.7 +1.5
EMEA-LATAM +0.2 +0.2
Other 0.0 -0.1
Total +4.2 +3.0
of which mature markets +3.1 +2.0
of which emerging markets +1.1 +1.0
Net flows by country/region
In Euro billion1H16
restated1H17
Protection & Health +3.9 +4.3
G/A Savings -0.4 -2.2
o/w capital light 3 +2.3 +0.7
o/w traditional G/A -2.6 -2.9
Unit-Linked +0.6 +1.0
Mutual funds & other +0.1 -0.1
Total +4.2 +3.0
Net flows by business

L&S | Underlying earnings margin analysis
B19 Half Year 2017 Earnings l Appendices l August 3, 2017
1. Changes are at constant forex2. Life & Savings gross written premiums and mutual fund sales3. Lower taxes driven by a lower effective tax rate notably in France and the US. Tax one-offs remained stable.
1H17 Change1 1H17 Change
1
-5%Margin on revenues2 2,401 -4% Acquisition expenses 2,049
27 -68%
Margin on assets 2,911 +3% Admin. Expenses 1,515 +5%
Pre-tax underlying earnings0%
Euro 2,329 million
Technical margin 520 -14% VBI amortization
-12%
Minority interest 36 -9%
UE from associates 88 +10%
Underlying earnings+3%
Euro 1,984 million
Tax3 309
+ +
-
-
Gross marginIn Euro million
ExpensesIn Euro million

L&S | Margin analysis
Details of margin on revenues
B20 Half Year 2017 Earnings l Appendices l August 3, 2017
Margin on revenues
1. Life & Savings gross written premiums and mutual fund fees
-0.2 pt
-0.1 pt business mix
Detail by product -0.1 pt country mix
Protection & Health: 12.5%
G/A Savings: 2.3%
Unit-Linked: 1.8%
Mutual funds & other: 5.4%
Euro 2,401 million -4%
-1%Euro 31,175 million
Average margin on L&S revenues1
7.7%
Margin on revenues1
Life & Savings revenues1
x

L&S | Margin analysis
Details of margin on Unit-Linked assets
B21 Half Year 2017 Earnings l Appendices l August 3, 2017
Investment margin
79 bps
158 bps annualized
Euro 1,371 million +7%
Euro 2,911 million +3% +7%
Euro 1,317 million -3%
Average management fees
on Unit-Linked reserves
0 bp
Unit-Linked management fees-0.5 bp business mix
+0.4 bp country mix
Margin on assets1 Unit-Linked average reserves
Euro 173 billion
General account investment marginIn Euro billion
Reserves as of Jan. 1, 2017
Scope
Opening reserves restated
Net flows
Market
Forex
Reserves as of June 30, 2017
176
-
176
0
9
-9
175
+
x
1. Including other fees (mainly mutual and broker fees) of Euro 224 million (+19% vs. 1H16)2. Excludes net flows from SCS products in the US
2

L&S | Margin analysis
Details of margin on General Account assets Investment margin
B22 Half Year 2017 Earnings l Appendices l August 3, 2017
Euro 1,371 million +7%
Euro 2,911 million +3% 35 bps
71 bps annualized
+2%
393
+3
+1
-9
0
389
Reserves as of Jan. 1, 2017
Net flows
Market
Forex
Scope
Reserves as of June 30, 2017
Unit-Linked management fees
Margin on assets1 Average management fees on general
account reserves
-2 bps
General account investment
margin
-2 bps business mix
0 bp country mix
Euro 1,317 million -3% General account average reserves
Euro 373 billion
In Euro billion
+
x
1. Including other fees (mainly mutual and broker fees) of Euro 224 million (+19% vs. 1H16)2. Includes net flows from SCS products in the US
2

L&S | Margin analysis
Details of technical margin
B23 Half Year 2017 Earnings l Appendices l August 3, 2017
Technical margin
1. Claims paid, maturities and surrenders
Euro 744 million -16%
Euro 520 million -14%
Euro -225 million +20%
In Euro billion
o/w basis 16
o/w volatility (equity and interest rates) 32
o/w interest rates, credit spreads and other -88
o/w model and assumption changes -185
Mortality & morbidity margin and other1
Technical margin
GMxB Variable Annuity margin
+

L&S | Margin analysis
Focus on gross technical margin
B24 Half Year 2017 Earnings l Appendices l August 3, 2017
Gross mortality, morbidity & surrender margin (pre-tax)In Euro million
Gross GMxB Variable Annuity technical margin (pre-tax, pre-DAC)In Euro million
1H17 evolution mainly explained by:
• Higher GMxB hedge margin driven by favorable volatility and basis, more than offsetting unfavorable impacts from assumption and model updates
1H17 evolution mainly explained by:
• Mortality model changes in the US (Euro -0.1 billion)
744883
-16%
1H171H16restated
-225-271
1H171H16restated
+20%
Euro -28 million net Underlying
Earnings impact
L&S | Underlying earnings by business
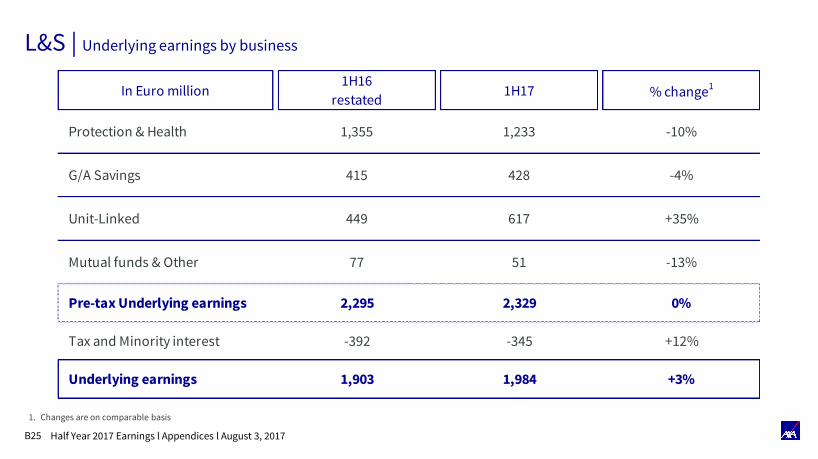
B25 Half Year 2017 Earnings l Appendices l August 3, 2017
1. Changes are on comparable basis
In Euro million1H16
restated1H17 % change1
Protection & Health 1,355 1,233 -10%
G/A Savings 415 428 -4%
Unit-Linked 449 617 +35%
Mutual funds & Other 77 51 -13%
Pre-tax Underlying earnings 2,295 2,329 0%
Tax and Minority interest -392 -345 +12%
Underlying earnings 1,903 1,984 +3%

L&S | Margin analysis by business
B26 Half Year 2017 Earnings l Appendices l August 3, 2017
1. Mainly other fees (mainly mutual fund and brokers fees)2. Annualized
In Euro millionProtection &
HealthG/A Savings Unit-Linked
Mutual Funds &
Other
8%
of GWP
71 bps
of avg. G/A reserves2
158 bps
of avg. UL reserves2
Technical Margin
& Other742 20 -196 176
Gross margin 3,328 919 1,324 259 5,832
Admin. Exp. &
Other-656 -295 -451 -51 -1,454
Acquistion
expenses-1,440 -197 -255 -157 -2,049
Pre-tax UE 1,233 428 617 51 2,329
Management fees 110 1,261
Margin on
revenues2,081 126 146 48
Investment
margin395 772 113 35
1
Main profit drivers

L&S | Margin analysis by business
Protection & Health
B27 Half Year 2017 Earnings l Appendices l August 3, 2017
Technical resultsIn Euro million
Unit-Linked management feesIn Euro million
Net investment marginIn Euro million
Note: From FY16, Unit-Linked Protection with Savings products have been reclassified in Protection & Health
1H17Comp.
Change1H17
Comp.
Change1H17
Comp.
Change
133 bps annualized
UE from associates 85 +14%
Pre-tax underlying earnings-10%
Euro 1,233 million
22 bps -3 bps
Net technical result 644 -16%Unit-Linked
Management fees110 +22% Investment margin 395 -9%
Protection & Health
average G/A reserves180,299 +2%
Protection & Health
Combined ratio (in %)96.1% +0.8 pt
UL average management
fees66 bps +7 bps
Protection & Health
investment spread
Protection & Health
Gross revenues16,680 0%
Protection & Health
average UL reserves16,552 +9%
x x
+
+
x

L&S | Margin analysis by business
Protection & Health – Details on Combined Ratio
B28 Half Year 2017 Earnings l Appendices l August 3, 2017
Combined ratio
Loss ratio
Expense ratio
Loss ratio deteriorated by 1.0 point:
Mortality model changes in the US (Euro -0.1 billion)-
Expense ratio improved by 0.2 point:
Lower VBI amortization mainly following the non-repeat of 2016 assumption updates
1. Expense ratio includes VBI amortization
Changes are on a comparable basis
82.1% 83.1%
13.3% 13.1%
+ 0.8 pt
95.4%
1H16 restated
Expense Ratio1
Loss Ratio
96.1%
1H17
+
L&S | Margin analysis by business
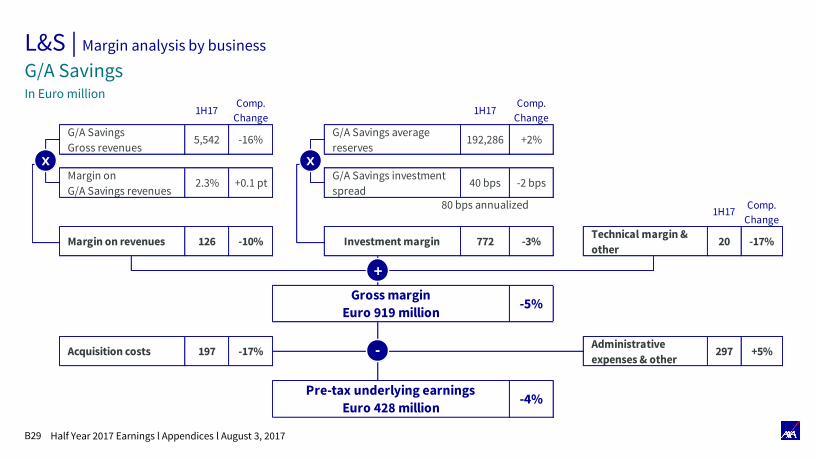
B29 Half Year 2017 Earnings l Appendices l August 3, 2017
G/A SavingsIn Euro million
1H17Comp.
Change1H17
Comp.
Change
80 bps annualized Comp.
Change
Administrative
expenses & other297 +5%
Pre-tax underlying earnings-4%
Euro 428 million
Gross margin-5%
Euro 919 million
20 -17%
1H17
Acquisition costs 197 -17%
-3%Technical margin &
other
-2 bps
Margin on revenues 126 -10% Investment margin 772
Margin on
G/A Savings revenues2.3% +0.1 pt
G/A Savings investment
spread40 bps
+2%G/A Savings
Gross revenues5,542 -16%
G/A Savings average
reserves192,286
x x
+
-

L&S | Margin analysis by business
Unit-LinkedIn Euro million
B30 Half Year 2017 Earnings l Appendices l August 3, 2017
1H17Comp.
change1H17
Comp.
change
161 bps annualized
-225 +20%
+7%Unit-Linked Gross
revenues8,070 +9%
Unit-Linked
average reserves156,632
1H17Comp.
change
Margin on revenues 146 -24%Unit-Linked
management fees1,261 +6%
Technical margin &
other-196
Average margin on Unit-
Linked revenues1.8% -0.8 pt
UL average
management fees-1 bp
Administrative
expenses & other451 +4%
+27%
o/w GMxB VA margin
Investment margin 113 +25%
Pre-tax underlying earnings+35%
Euro 617 million
81 bps
Acquisition costs 255 -18%
Gross margin+10%
Euro 1,324 million
x x
+
-

L&S | Focus on the US
B31 Half Year 2017 Earnings l Appendices l August 3, 2017
Net of DAC and tax1 FY15 FY16 1H16 1H17
Variable Annuity base fees & other, less expenses2 349 331 169 164
GMxB hedge margin -13 23 -21 13
Reserve strengthening (including assumption and model changes)2 -62 -6 -7 -10
Variable Annuity GMxB
Underlying earnings275 349 141 167
US L&S APE
484462513
431
1H151H14 1H171H16restated3
1H17 32% 10% 21% 24% 12% 1%
1H16 29% 10% 22% 19% 18% 2%
FY08 22% 15% 15% 48%
Fixed rate GMxB VA
Floating rate GMxB VA
New Non-GMxB VA4
Employee Sponsored Non-GMxB VA
Life
Mutual Funds & Other
US Variable Annuity GMxB Underlying earningsIn Euro million
US L&S Underlying earningsIn Euro million
1. Notional tax rate of 35%.2. The reserve strengthening figures include the effect on DAC of base fees related to assumption and model changes3. 1H16 restated: reclassification of AXA Liabilities Managers Accident & Health from the International Insurance segment into the United States Life & Savings operations.4. New Non GMxB Variable Annuity includes Investment Edge, Structured Capital Strategies and Others.

B4Property & Casualty

P&C | Revenues and net new contracts
B33 Half Year 2017 Earnings l Appendices l August 3, 2017
1H17 Revenues by markets 1H17 P&C personal net new contractsIn thousands
Mature markets 80%
Emerging markets13%
Direct 7%
Euro 21 billion
-469
+94
1H171H16
Total
Changing market conditions in Turkey and in France partially due to the Hamon law, partly offset by positive
developments in Italy
Of which:+26 in Direct-78 in Mature+146 in Emerging
Of which:-91 in Direct+3 in Mature-381 in Emerging

P&C | Pricing effect by geography
B34 Half Year 2017 Earnings l Appendices l August 3, 2017
Price
effect
Revenues
growth
Price
effect
Revenues
growth FY17 Market pricing trends
France +1.4% -0.5% +2.2% -0.4%Slight increase in prices expected in Personal lines.
Market continues to be competitive in Commercial lines
Germany +2.5% +1.4% +0.7% +2.6%Prices expected to be stable in both Personal and
Commercial lines
UK & Ireland +6.3% +2.5% +3.9% +6.8%Increase in prices in highly competitive market, notably
driven by Ogden
Switzerland -0.5% +0.5% +1.4% +2.2%Slight price softening in Personal lines and stable pricing
in Commercial lines
Belgium +1.9% +2.1% +1.5% +3.1%Stabilization of prices in both Personal lines and
Commercial lines
Italy -2.3% +4.2% 0.0% +8.0%Price decrease both in Personal and Commercial lines
due to increased competition
Spain +2.8% +2.8% +3.1% +2.4% Continued price recovery in the market
EMEA-LATAM +2.1% -5.3% +2.6% -1.6%
Asia +0.2% +1.3% +0.2% -4.5%
Direct +8.0% +0.8% - -
Total +2.7% +0.7% +1.7% +2.3%
Commercial Lines1H17
Personal Lines
Prices expected to be stable
Prices expected to decrease
Prices expected to increase

P&C | Underlying earnings analysis
B35 Half Year 2017 Earnings l Appendices l August 3, 2017
Net technical resultIn Euro million
Net investment resultIn Euro million
1. Combined ratio calculated based on gross earned premiums2. Technical result net of expenses3. Annualized. Net of interests credited to P&C reserves relating to annuities. Gross asset yield was 3.4%4. Tax rate: 26% in 1H17 vs. 27% in 1H16 (includes a reduction in tax rate in France from 38% to 34.43%)
Changes are on a comparable basis for activity indicators (constant Forex, scope and methodology) Changes are on a constant exchange rate basis for earnings
1H17Comp.
Change1H17
Comp.
Change
Minority interest 31 +4%
+0.0pt
20,983 +1.4% Average P&C assets 72,919 +1.5%
3.1%
Underlying earnings
Euro 1,347 million+6%
+2%
Pre-tax underlying earnings
Euro 1,868 million+5%
Tax4 491 +3%
Net technical result2 699 +9% Net investment income 1,127
UE from associates 42 +102%
Revenues
Combined ratio1 (in %) 96.1% -0.2pt Average Asset Yield
3
x x
+
+
-

P&C | Details on Combined Ratio
B36 Half Year 2017 Earnings l Appendices l August 3, 2017
Combined ratio Expense ratio
Loss ratio
Change a constant exchange rate basis for earnings
96.1%
69.4%
26.7%
1H16 restated
-0.2 pt
Loss ratio
Expense ratio
1H17
96.4%
69.7%
26.7%
Current accident
year
-0.9 pt
1H16 restated
69.7%
-0.3 pt
1H17
69.4%
Prior year reserve dev.
+1.2 pts
Nat Cat
-0.6 pt
0.0 pt
-0.3 pt
1H16 restated
26.7%
1H17
26.7%
Administrative Expenses
+0.4 pt
Acquisition Expenses

P&C | Details on current year loss ratio
B37 Half Year 2017 Earnings l Appendices l August 3, 2017
Personal motor Personal non Motor
Total Commercial linesIncl. Construction & Work. Comp.
Total P&C
63.1%
1H17
62.9%
Other1
+0.8pt
Freq & Sev
+1.9pts
Price effect
-1.4pts
Nat Cat
-1.5pts
1H16 restated
Price effect
-1.4pts
Nat Cat
-0.6pt
1H16 restated
71.6%
1H17
70.1%
Other1
-0.3pt
Freq & Sev
+0.8pt
Nat Cat
-0.3pt
1H16 restated
73.9%
1H17
71.5%
Other1
-0.6pt
Freq & Sev
-0.4pt
Price effect
-1.2pts
Other1 1H17
74.3%
-0.8pt
Freq & Sev
+1.9pts
Price effect
-1.6pts
Nat Cat
-0.5pt
1H16 restated
75.3%
1. Other includes opening adjustments, changes in mix, claims handling costs, reinsurance impact excl. Nat Cat, other changes in reserves, Forex and scope
o/w Severity +1.4 ptso/w Frequency -0.6 pt

P&C | Focus on reserve development
B38 Half Year 2017 Earnings l Appendices l August 3, 2017
Prior year reserve development level(in % of gross earned premiums)
Reserving ratio(Net technical reserves/Net earned premiums)
1H17FY16
5.4%
FY07
2.7%
FY06
1.4%
FY05
0.9% 1.2%
1H12
2.1%
FY11
1.2%
1H13
1.8%
FY12
3.1%
1H10
4.5%
FY09
5.4%
1H09
6.0%
FY08
1.7%
1H11
2.0%
FY10
1.4%
1H15
1.8%
FY14
1.9%1.2%
1H16*FY15*
0.7%0.6%
1H14
1.3%
FY13
FY07
194%
FY06
186%
FY05
193% 185%
1H13 FY16
199%
FY12
194%195%
FY10
196%
FY14 1H16*
199%187%
1H11 FY13 1H14
202%188%
FY15*
192%
FY11
195% 186%
1H12 1H15
187%
1H09
198%
FY08
203%187%
1H17
186%
1H10
199%
FY09
Information related to FY13 was restated for the retrospective application of the new IFRS standards on consolidationFY04 to FY12 figures were not adjusted for this change. Note: FY04 to FY09 figures do not exclude Canadian operations
*FY15, 1H16 figures have been restated to include the reclassification of International Insurance activity in the Property & Casualty segment

B5Health

Health | Revenues and profitability
B40 Half Year 2017 Earnings l Appendices l August 3, 2017
1H17 Health revenuesIn Euro million
1H17 Health revenues by countryIn Euro billion
Combined ratio
6,5236,240
+6%
1H171H16
95.1%95.5%
-0.4pt
1H171H16
France (29%)
UK (16%)
Japan (11%)
EMEA-LATAM (9%)
Germany (24%)
Asia (6%)Other1 (5%)
Euro 6.5 billion
1. Other includes Belgium, Italy, Spain, the US, Direct and AXA AssistanceChanges are on a comparable basis for activity indicators (constant Forex, scope and methodology) Changes are on a constant exchange rate basis for earnings

B6Asset Management

Asset Management | Underlying earnings
B42 Half Year 2017 Earnings l Appendices l August 3, 2017
Margin1 Expenses1
Details of Asset Management margin analysis
1. Margin and expenses are calculated gross of intercompany eliminations to help reconcile with disclosure on page 19 of 1H17 Financial Supplement 2. Changes are on a comparable basis for activity indicators (constant Forex, scope and methodology), and at constant Forex for earnings3. Or Euro 1,714 million net of intercompany eliminations4. Tax rate increased to 28% in 1H17 vs. 27% at 1H16
In Euro million 1H17 Change2 1H17 Change2
Asset management fees 1,831 +6% Asset management expenses 1,349 +6%
Distribution revenues 336 -2%
Investment result 6
132
Pre-tax underlying earnings
Euro 471 million+10%
Minority int. & other 102 +3%
+16%Tax4
Underlying earnings
Euro 236 million+10%
Distribution expenses 354 0%n.a
Expenses
3
-
-

Asset Management | Revenues
B43 Half Year 2017 Earnings l Appendices l August 3, 2017
Details of Asset Management revenues
Changes are on a comparable basis1. Average AUM for AXA IM is calculated excluding the contribution from joint ventures
31 bps +1 bp
Euro 1,714 million +7%
o/w performance fees Euro 30 million (-5%)
o/w research fees Euro 205 million (-8%)
Euro 1,102 billion +5%
In Euro billion
AUM at FY16 1,203
Net inflows +0
o/w AB +4
o/w AXA IM -4
Market +41
Forex -48
Scope & other -1
AUM at 1H17 1,195
Asset management fees
Average assets under
management1
Average management fees on
average assets under management
x
B7Balance Sheet

Balance sheet
B45 Half Year 2017 Earnings l Appendices l August 3, 2017
1. General Account invested assets B.46
I. Government Bonds and related B.47II. Corporate Bonds B.49III. Asset Backed Securities B.53IV. Equity B.54V. Real Estate B.56VI. Hedge Funds B.57VII. Private Equity B.58VIII. Mortgage Loans B.59
2. Focus on net unrealised capital gains B.60
3. Asset Liability management B.61
4. Net financial debt and adjusted ROE B.63
5. Solvency II B.65

General Account Invested Assets
B46 Half Year 2017 Earnings l Appendices l August 3, 2017
Changes in asset mix
Forex: negative impact from the appreciation of Euro against major currencies
Yields: negative impact linked to the increase in interest rates on fixed income assets
Invested assets (100%) FY16
In Euro billion Published
Fixed income 485 83% 474 82%
o/w Govies and related 236 40% 227 39%
o/w Corporate bonds 202 35% 200 35%
o/w Asset backed securities 13 2% 13 2%
o/w Mortgage loans & other 1 34 6% 34 6%
Cash 23 4% 25 4%
Listed equities 19 3% 21 4%
Real Estate 30 5% 31 5%
Alternative investments2 20 3% 20 3%
Policy loans 6 1% 5 1%
Total Insurance Invested Assets3 583 100% 575 100%
% 1H17 %
1. Mortgage loans & other include residential loans (Euro 12 billion), commercial & agricultural loans (Euro 21billion) and Agency Pools (Euro 1 billion)
2. Mainly Private Equity and Hedge Funds3. 1H17 invested assets referenced in page 51 of the financial supplement are Euro 778 billion, which include notably Euro 175 billion of Unit-linked assets and
Euro 35 billion related to the Banking segment.

Government bonds and related
B47 Half Year 2017 Earnings l Appendices l August 3, 2017
Breakdown by geography Breakdown by segment
Gross1 unrealised capital gains and lossesIn Euro billion
P&C10%
L&S90%
Euro 227 billion
SupranationalInstitutions 5%
Spain 6%
Switzerland 6%
Other 7%
Belgium 9%
Austria 3%
Italy 10%
Japan 13%
France 20%
Germany 10%
US 9%
Ireland 2%Netherlands 2%
As of June 30, 2017 1. Gross of tax and policyholders’ participation
40.936.2
1H17FY16

Government bonds and relatedFocus on exposure to Eurozone peripheral countries
B48 Half Year 2017 Earnings l Appendices l August 3, 2017
Gross book value Gross market value Gross book value Gross market value
December 31, 2016 December 31, 2016 June 30, 2017 June 30, 2017
Italy 20.6 23.0 19.3 21.7
Spain 11.9 15.0 11.6 14.2
Ireland 2.7 3.3 3.2 3.9
Portugal 0.4 0.4 0.3 0.4
Greece 0.0 0.0 0.0 0.0
TOTAL 35.6 41.7 34.4 40.2
In Euro billion
Exposure by issuer

Corporate bonds
B49 Half Year 2017 Earnings l Appendices l August 3, 2017
P&C17%
L&S83%
Euro 200 billion
Energy 6%
Financials 5%
Utilities 8%
Basic materials 4%
Industrials8%
ConsumerCyclical 6%
Banks 37%
Consumernon-cyclical 14%
Other 5%
Communications8%
Breakdown by industry Breakdown by segment
8.0 7.5
1H17FY16
As of June 30, 2017 1. Gross of tax and policyholders’ participation
Gross1 unrealised capital gains and lossesIn Euro billion

Corporate bondsBreakdown by entity and rating (including CDS)
B50 Half Year 2017 Earnings l Appendices l August 3, 2017
P = Participating NP = Non-participating
1. Including Asia (excl. Japan), Direct P&C excluding Direct Japan, EMEA-LATAM, Italy, Spain and UK2. Not rated by external rating agencies. Under AXA’s internal ratings: AAA: Euro 0.3 billion / AA: Euro 0.9 billion / A: Euro 3.5 billion / BBB: Euro 3.9 billion / Below investment grade: Euro 3.1 billion
In Euro billion
As of June 30, 2017 P NP P NP P NP P NP P NP P NP P NP P NP
AAA 2.3 0.9 0.1 0.4 0.0 0.1 9.2 1.1 7.2 1.1 - 1.0 0.2 0.4 19.1 4.9
AA 3.9 2.0 0.4 3.2 0.5 0.5 3.1 0.4 1.7 0.3 - 2.2 1.7 1.4 11.3 10.1
A 10.7 5.2 1.8 11.9 1.6 1.3 5.8 1.9 6.7 0.9 - 6.4 6.0 4.0 32.6 31.7
BBB 12.3 6.5 1.0 12.0 1.5 2.3 6.5 2.2 8.3 1.3 - 3.5 5.5 4.7 35.1 32.4
Below Investment Grade 2.1 1.6 0.1 1.0 0.0 0.7 1.4 0.5 1.3 0.3 - 0.4 0.5 0.9 5.4 5.4
Non rated2 1.3 0.7 0.0 0.3 0.2 0.8 1.1 0.2 1.6 0.1 - 0.9 1.9 2.4 6.1 5.4
Total 32.6 17.0 3.5 28.8 3.9 5.7 27.1 6.2 26.9 4.0 - 14.4 15.7 13.9 109.7 89.9
TotalOther1France US Belgium Germany Switzerland Japan
As of June 30, 2017

Focus on banking corporate bonds
B51 Half Year 2017 Earnings l Appendices l August 3, 2017
1. Banking Corporate bonds not rated by external rating agencies have been reallocated under AXA’s internal rating: AAA: Euro 0.1 billion / AA: Euro 0.5 billion / A: Euro 1.4 billion / BBB: Euro 1.4 billion / BIG: Euro 0.7 billion
2. More than 30 countries
Gross market value
in Euro billion Secured Non secured Lower Tier 2 Upper Tier 2 Tier 1 Preferred
By rating1:
AAA 22.3 0.8 0.0 0.0 0.0 0.0 23.1
AA 4.1 7.0 0.2 0.0 0.0 0.0 11.2
A 3.6 21.0 2.0 0.0 0.0 0.0 26.6
BBB 0.5 6.7 3.9 0.2 0.0 0.0 11.3
BIG 0.4 0.5 0.4 0.1 0.1 0.0 1.4
Total 30.7 36.0 6.5 0.4 0.1 0.0 73.7
By Country:
Germany 7.1 1.1 0.7 0.3 0.0 0.0 9.2
France 4.0 3.3 2.5 0.0 0.0 0.0 9.9
United States 0.3 12.0 0.4 0.0 0.0 0.0 12.7
Netherlands 1.1 2.2 0.4 0.0 0.0 0.0 3.8
UK 1.3 3.0 0.7 0.0 0.0 0.0 5.1
Spain 2.2 1.1 0.8 0.0 0.1 0.0 4.1
Australia 1.7 2.3 0.4 0.0 0.0 0.0 4.4
Italy 0.9 1.4 0.1 0.0 0.0 0.0 2.4
Switzerland 8.2 2.3 0.0 0.0 0.0 0.0 10.5
Sweden 0.3 1.7 0.3 0.0 0.0 0.0 2.3
Austria 0.4 0.0 0.0 0.0 0.0 0.0 0.4
Norway 0.5 0.3 0.0 0.0 0.0 0.0 0.8
Other2 2.8 5.2 0.2 0.0 0.0 0.0 8.2
Total 30.7 36.0 6.5 0.4 0.1 0.0 73.7
Senior Debt Subordinated Debt Total
As of June 30, 2017
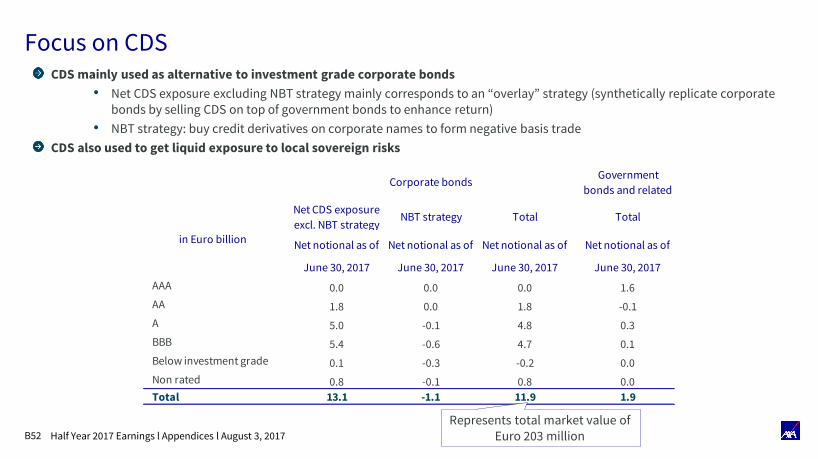
Focus on CDS
B52 Half Year 2017 Earnings l Appendices l August 3, 2017
CDS mainly used as alternative to investment grade corporate bonds
• Net CDS exposure excluding NBT strategy mainly corresponds to an “overlay” strategy (synthetically replicate corporate bonds by selling CDS on top of government bonds to enhance return)
• NBT strategy: buy credit derivatives on corporate names to form negative basis trade
CDS also used to get liquid exposure to local sovereign risks
Government
bonds and related
Net CDS exposure
excl. NBT strategyNBT strategy Total Total
Net notional as of Net notional as of Net notional as of Net notional as of
June 30, 2017 June 30, 2017 June 30, 2017 June 30, 2017
AAA 0.0 0.0 0.0 1.6
AA 1.8 0.0 1.8 -0.1
A 5.0 -0.1 4.8 0.3
BBB 5.4 -0.6 4.7 0.1
Below investment grade 0.1 -0.3 -0.2 0.0
Non rated 0.8 -0.1 0.8 0.0
Total 13.1 -1.1 11.9 1.9
Corporate bonds
in Euro billion
Represents total market value of Euro 203 million

Asset backed securities
B53 Half Year 2017 Earnings l Appendices l August 3, 2017
Breakdown by asset type1 Breakdown by rating
Other asset-backed Mortgage-backed
Euro 13 billionPrime Residential 3%
Commercial MBS 3%
CDO 2%
Consumer ABS2 1%
CLO 88%
US Subprime,Alt-A & NC RMBS 4%
As of June 30, 2017
1. Including debt and equity tranches of ABS2. Mainly consumer loan ABS (plus some leases and operating ABS assets)
Euro 13 billion
Below investment grade 4%
BBB 2%
A 12%
AAA 57%
AA 22%
Non rated/Equity 2%

Listed equity portfolio overview
B54 Half Year 2017 Earnings l Appendices l August 3, 2017
P&C22%
L&S77%
Holding 1%
Euro 21 billion
France 24%Other
EurozoneCountries 10%
Switzerland5%
UK 4%
Rest of theWorld 14%
Belgium 6%
Japan 7%
US 22%
Germany 8%
Breakdown by geography Breakdown by segment
3.54.1
FY16 1H17
As of June 30, 2017 1. Gross of tax and policyholders’ participation
Gross1 unrealised capital gains and lossesIn Euro billion

Shareholders’ exposure to listed equity
B55 Half Year 2017 Earnings l Appendices l August 3, 2017
Estimated shareholders’ exposure to listed equityIn Euro billion
FY16 1H17
8
21
Gross nominal 100%
Group share net of hedge, tax & PB
7
19
Gross nominal 100%
Group share net of hedge, tax & PB

Real estate investments
B56 Half Year 2017 Earnings l Appendices l August 3, 2017
Breakdown by geography Breakdown by segment
Breakdown by type and geography
P&C19%
L&S81%
As of June 30, 2017
1. Representing Euro 3.7 billion of unrealized gains off balance sheet, net of tax and PB. The assets in scope exclude those held directly by the French Mutual funds and the non-Main Fund unit linked holdings, as well as CRE loans.
Portfolio Yield from Rental Income ~ 3.8%
Japan 1%UK 5%
Germany 10%
Other Eurozone countries 8%
Belgium 10%
France 28%
Switzerland37%
US 2%
Defensive portfolio with good performance over the long term
Market value1
Euro 31 billion
Switzerland France Belgium Germany Other Total
Office 16% 10% 7% 4% 9% 46%
Residential 18% 3% 0% 0% 1% 22%
Retail 0% 10% 2% 2% 3% 17%
Others 3% 5% 1% 3% 3% 15%
Total 37% 28% 10% 10% 16% 100%
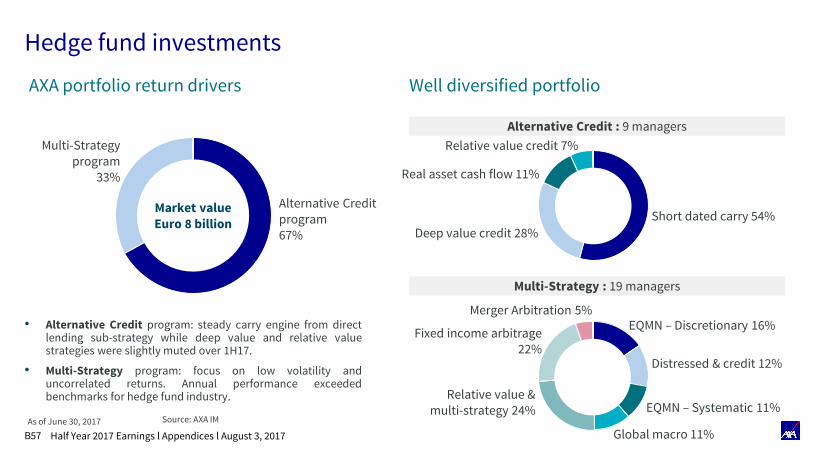
Hedge fund investments
B57 Half Year 2017 Earnings l Appendices l August 3, 2017
• Alternative Credit program: steady carry engine from directlending sub-strategy while deep value and relative valuestrategies were slightly muted over 1H17.
• Multi-Strategy program: focus on low volatility anduncorrelated returns. Annual performance exceededbenchmarks for hedge fund industry.
Source: AXA IM
Alternative Credit : 9 managers
Multi-Strategy : 19 managers
Market valueEuro 8 billion
Alternative Credit program67%
Multi-Strategy program
33%
Short dated carry 54%
Deep value credit 28%
Real asset cash flow 11%
Relative value credit 7%
EQMN – Discretionary 16%
EQMN – Systematic 11%
Distressed & credit 12%
Relative value &multi-strategy 24%
Merger Arbitration 5%
Global macro 11%
Fixed income arbitrage 22%
AXA portfolio return drivers Well diversified portfolio
As of June 30, 2017

Private equity investmentsDiversified portfolio built over the long run
B58 Half Year 2017 Earnings l Appendices l August 3, 2017
Breakdown by expertise
Diversified portfolio
Infrastructure 14%
Private debt 11%
Venture 4%
Buy-out 71%
Funds of funds 56%
Direct 44%
Market valueEuro 8 billion
Europe 60%
US 31%
Other 7%Japan 2%
As of June 30, 2017
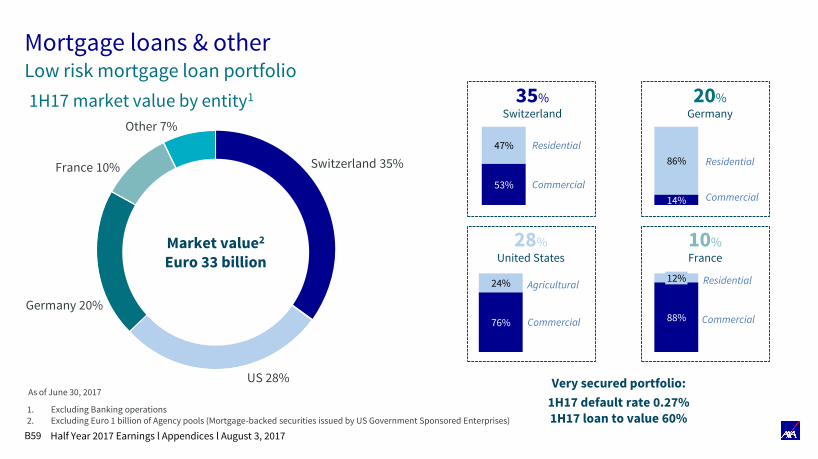
Mortgage loans & otherLow risk mortgage loan portfolio
B59 Half Year 2017 Earnings l Appendices l August 3, 2017
1H17 market value by entity1
Market value2
Euro 33 billion
1. Excluding Banking operations2. Excluding Euro 1 billion of Agency pools (Mortgage-backed securities issued by US Government Sponsored Enterprises)
Switzerland 35%
Germany 20%
France 10%
Other 7%
US 28%
20%Germany
28%United States
14%
86% Residential
Commercial
76%
24%
88%
12%
53%
47%
Commercial
Agricultural
Very secured portfolio:
1H17 default rate 0.27%1H17 loan to value 60%
10%France
Residential
Commercial
35%Switzerland
Residential
Commercial
As of June 30, 2017

Focus on net unrealised capital gains
B60 Half Year 2017 Earnings l Appendices l August 3, 2017
Balance sheet net unrealised capital gainsIn Euro billion
Off balance sheet net unrealised capital gainsIn Euro billion
1.7
FY16
14.7
11.2
2.01.6
1H17
14.2
10.4
2.1
Government bondsand related
Corporate bonds
Equities & other1
1H17
4.3
FY16
4.2
Net unrealisedcapital gains on
Government bonds and related by issuer
2.82.4
Switzerland
0.8
Belgium
2.2
GermanyFrance
0.7
Eurozone peripherals
0.7
Japan
0.8
Other
1. Including ABS, alternative investments, other assets, minorities and equity methods

Asset & Liability management (1/2)Life & Savings General Account investment spreads and margin
B61 Half Year 2017 Earnings l Appendices l August 3, 2017
Guidance65-75 bps
1H16restated
1H17
71 bps75 bps
Details of spread above guaranteed rates
• Significant buffer to cover guarantees and to manage crediting rates to preserve investment margin
• Average inforce reserves of Euro 373 billion
• New business sold in combination with higher margin Unit-Linked business (hybrid2 sales)
1H17 Yield on assetsAverage
guaranteed rates
Spread above
guarantee
Inforce 3.1% 1.9% +120bps
New business 2.0% 0.3% +170bps
Investment margin1
1. Group investment margin on total Life & Savings General Account business. Annualized2. Hybrid products are savings products allowing clients to invest in both Unit-Linked and General Account assets

Asset & Liability Management (2/2)Life & Savings General Account investment spreads above guarantees for main entities
B62 Half Year 2017 Earnings l Appendices l August 3, 2017
• Average G/A reserves: Euro 23 billion
• Strategic decision to exit the Individual Savings business
• Average G/A reserves: Euro 12 billion
• Emphasizing hybrid products and Protection businesses
• Average Life reserves: Euro 36 billion
• Asset portfolio with long investment horizon and with limited reinvestments in Bunds
• Average G/A reserves: Euro 107 billion
• G/A Savings new business sales with long term guarantees stopped in 1998
• Average G/A reserves: Euro 59 billion
• Protection components making products very profitable
Ne
wb
usi
ne
ssIn
forc
e
Belgium AXA MPSGermany France Switzerland
2.7%3.9%
110 bps0 bps
3.4%3.4%2.7%
1.2%
150 bps
1.9%
70 bps
1.2%
310 bps
0.7%
3.8%
130 bps
0.8%2.1%
90 bps
0.9%1.8%
70 bps
0.7%1.4%0.9%
70 bps
0.2%0.0%
190 bps
1.9%
1H17 L&S average guaranteed rate1H17 Reinvestment yield on L&S fixed income assets1H17 Yield on total L&S asset base

Net financial debt – Long-term maturities
B63 Half Year 2017 Earnings l Appendices l August 3, 2017
Net financial debtIn Euro billion
Contractual maturity breakdownIn Euro billion
Economic maturity breakdownIn Euro billion
Debtgearing
26% 26%
5.1
3.0
3.4
3.3
0.8
0.3
20182017
1.8
Undated2026-20402021-20252020
0.4
2019
4.4
0.92.01.00.30.70.31.80.21.0
1.71.81.0
0.8
0.3
2020201920182017 2021-2025 Undated2026-2040
TSS = undated deeply subordinated notes
TSDI = undated subordinated notes
Subordinated debt
Senior debt
1. Including Euro 0.9 billion of reversal of market-to-market on interest rates derivatives in 1H17 versus Euro 1.3 billion in FY16
9.1 8.0
8.17.8
1H17
16.9
1.1
FY16
18.3
1.1
Senior debt
Subordinated debt1
Undated subordinated debt

Adjusted ROE
B64 Half Year 2017 Earnings l Appendices l August 3, 2017
In Euro million1H16
published1H17
Adjusted earnings 3,364 3,478
Interest charges on undated debt -140 -117
Average adjusted shareholders’ equity 44,225 45,782
Adjusted ROE 14.6% 14.7%

Solvency II
B65 Half Year 2017 Earnings l Appendices l August 3, 2017
Solvency II ratioIn Euro billion
Key sensitivities
Solvency II ratio roll-forward
1H17
201%
Subordinated debt, forex & other
-2 pts
Market impact excl. forex
+1 pt
Dividend
-5 pts
Operatingreturn
+9 pts
FY16
197%
Equity markets -25%
Equity markets +25%
Corporate spreads +75bps
Interest rate -50bps
Interest rate +50bps
Ratio as of June 30, 2017
+5 pts
-9 pts
-1 pt
+5 pts
-6 pts
201%
206%
192%
200%
206%
195%
Required capital
Available capital
58.757.9
29.329.4
1H17FY16
Solvency II ratio 197% 201%

Solvency II required capitalSplit by Risk, Geography & Business
B66 Half Year 2017 Earnings l Appendices l August 3, 2017
Required capital by risk1H17
Required capital by businessFY16
Required capital by geographyFY16
Counterparty5%
P&C
Operational
7%
45% Market20%
Life
23%
26%
Life & Savings
54%
Asset Management & Banking
4%Holdings & Other
16%
Property &Casualty
3%
Asset Management& Banking
8%
UK
4%Belgium
Italy, Spain,EMEA
6%
Germany
8%
US9%
Switzerland
10%
Asia (incl. Japan)
13%
France17%
Holdings &Other20%

B8Corporate Responsibility

Main SRI rating
B68 Half Year 2017 Earnings l Appendices l August 3, 2017
12th overall/worldwide and 1st insurer by number of SRI funds in its capital (Ipreo, Q2 2016)
N°2 out of 150 insurance companies
Score: 87/100
Ranked “A+” in the 2016 “Assessment Report” (Responsible
Investment strategy)
Included in the FTSE4GOOD index since 2008
Score of AAA
2016 Sector leader, Included in
Vigeo Euronext indices
Score: 85/100Percentile ranking: 95/100
Now accounts for 10% of AXA employee’s performance shares
attribution

B69 Half Year 2017 Earnings l Appendices l August 3, 2017
ESG integration into investmentsAXA’s “ESG + Carbon” RI Strategy
“ESG + CARBON” INTEGRATION
Long-term ESG integration process: gradual and systematic integration of tangible ESG factors in AXA’s investment mandates
X3 Green investments to reach Euro 3 billion by 2020
Coal divestment: Euro 500 million, coal mining and coal-based power generation.
“Article 173” : #1 award in the “Best Investor Climate-Related Disclosures” contest
FSB TCFD Vice-Chair
Chairmanship of the EU Commission’s High Level Expert Group on Sustainable Finance
SECTOR GUIDELINES & EXCLUSIONS
ESG Footprint Committee: ad-hoc exclusions and/or engagement for worst ESG performers
Current sector exclusions:
Controversial weapons
Coal-based energy production & coal extraction
Palm oil production
Food commodity derivatives
Tobacco: 1st global insurer to divest from Tobacco industry (€1,8Bn, bonds + equity) and ending insurance covers for tobacco manufacturers.
Exclusions are applied to both investmentand insurance business
IMPACT INVESTING
Two “impact investment” funds
Impact Fund 1: inclusion, health, education
Impact Fund 2: environmental & social resilience
€200M each
Creating both financial returns and positive social or environmental impacts that are actively measured
Impact KPIs examples (Fund 1): 79 million underserved customers reached; 15,8 million micro-insurance policies distributed; 1,39 million tones of CO2 emissions saved
€155M renewable energy fund managed by Ardian Investments