half year report 2019
TRANSCRIPT

Half Year Report 2019


FLOW TR ADERS | HALF YEAR REPORT 2019 > Table of conTenTs 1
Table of contents
2 flow Traders at a Glance
4 our business
6 our Risk Management
13 condensed consolidated Interim
financial statements 30 June 2019
FLOW TR ADERS | HALF YEAR REPORT 2019 > flow TRadeRs aT a Gl ance2
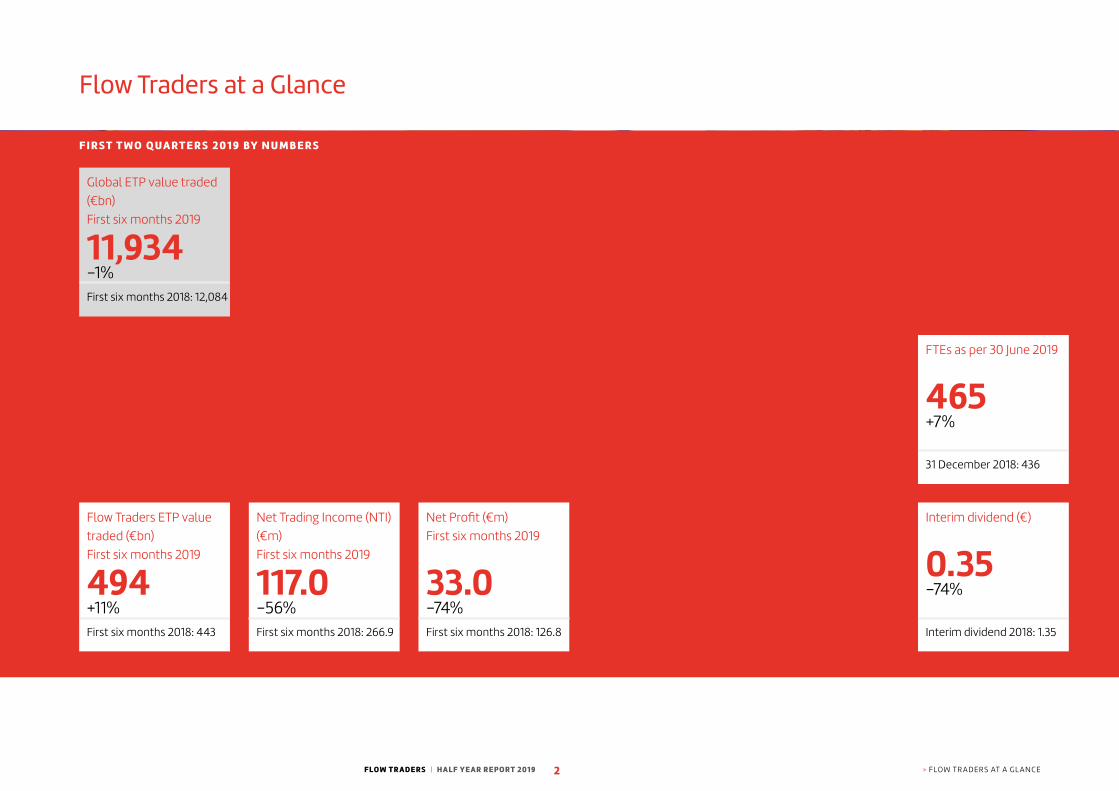
Flow Traders at a Glance
Global eTP value traded (€bn) first six months 2019
11,934–1%first six months 2018: 12,084
fTes as per 30 June 2019
465+7%
31 december 2018: 436
flow Traders eTP value traded (€bn) first six months 2019
494+11%first six months 2018: 443
net Trading Income (nTI) (€m) first six months 2019
117.0–56%first six months 2018: 266.9
net Profit (€m) first six months 2019
33.0–74%first six months 2018: 126.8
Interim dividend (€)
0.35–74%
Interim dividend 2018: 1.35
F I R S T T W O Q UA RT E R S 2 0 1 9 BY N U M B E R S
FLOW TR ADERS | HALF YEAR REPORT 2019 > flow TRadeRs aT a Gl ance3
N E W YO R K
A M S T E R DA M
LO N D O N C LU J
S I N G A P O R E
H O N G KO N G
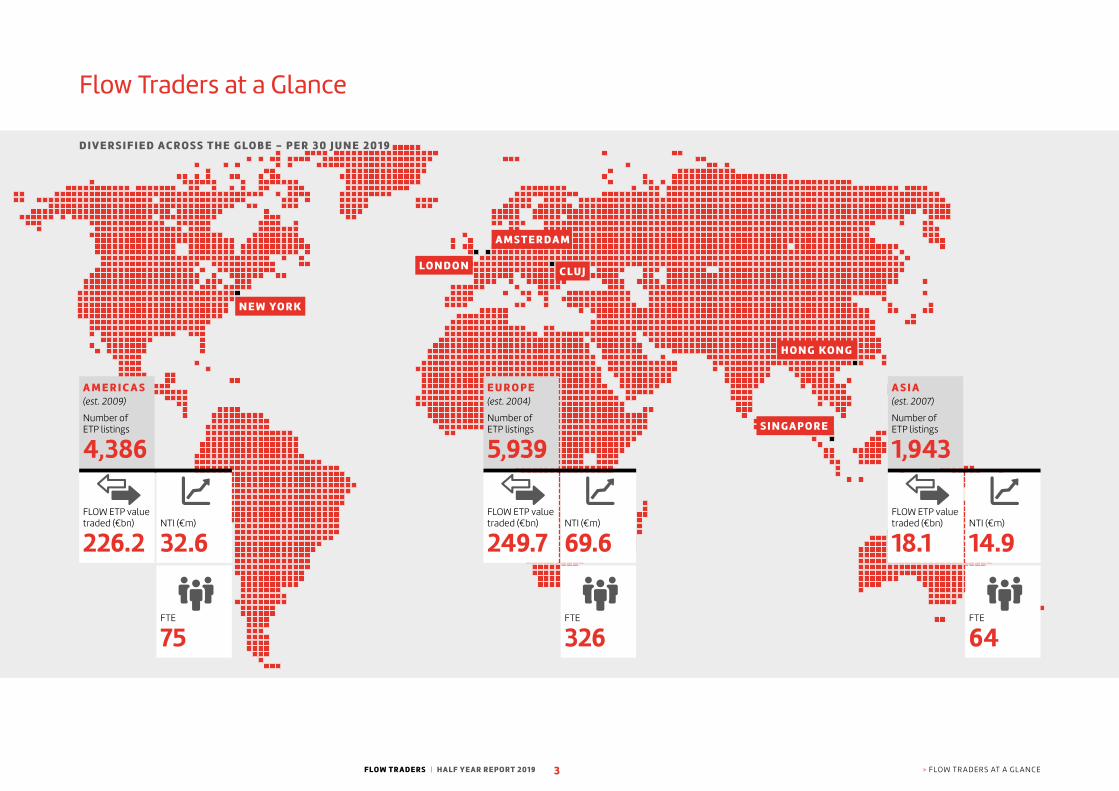
Flow Traders at a Glance
D I V E R S I F I E D AC RO S S T H E G LO B E - P E R 3 0 J U N E 2 0 1 9
A M E R I C A S(est. 2009)
number of eTP listings
4,386
flow eTP value traded (€bn)
226.2nTI (€m)
32.6
fTe
75
E U R O P E(est. 2004)
number of eTP listings
5,939
flow eTP value traded (€bn)
249.7nTI (€m)
69.6
fTe
326
A S I A(est. 2007)
number of eTP listings
1,943
flow eTP value traded (€bn)
18.1nTI (€m)
14.9
fTe
64
FLOW TR ADERS | HALF YEAR REPORT 2019 > ouR busIness4
Our Business
We provide liquidity in financial products, historically with a focus on exchange-traded products (ETPs). ETPs are baskets of securities made up of shares, bonds, commodities or alternative products. ETPs often track indices and, unlike most mutual funds, can be traded throughout the day on trading venues. We do this globally, enabling investors to buy and sell ETPs efficiently by quoting bid and ask prices under virtually all market circumstances. In 2019 we continued our work to further diversify our market making activities into other asset classes, like Foreign Exchange (FX). The modularity of our Trading infrastructure allows for efficient leverage on our trading capabilities in all financial products and not only ETPs.
Markets & Trends
Our business
In 2019 we traded in well over 10,000 financial instruments,
and have access to more than 182 trading venues in over
40 countries around the world. we provide liquidity in over
7,000 eTP listings on- and off-exchange, which is well over
50 percent of all eTPs globally.
off-exchange, we provide liquidity in eTPs on a request-
for-quote basis to over 1,200 institutional counterparties
across the globe, including banks, asset managers, pension
funds, insurance companies, family offices, hedge funds,
and others and this number is increasing on an almost daily
basis.
In addition to eTPs we provide liquidity in similar instruments
whose value is correspondingly affected by a change in the
value of underlying or related assets, such as futures or
bonds.
In 2018, we began providing liquidity as a market maker in
fX. we are continuously providing liquidity in an increasing
number of currencies on-screen and over the counter (oTc)
to a growing number of counterparties.
Irrespective of what we trade, as a liquidity provider we
generally do not have a directional opinion on the market.
In other words, our results do not depend on the direction of
market prices. our net Trading Income (nTI) is realized
through the small price differences that are realized
between buying and selling related or correlating assets.
whether that is between the eTPs we buy or sell, and the
prices we pay or receive for the underlying or related
financial instruments to mitigate our risk, or trading fX pairs.
The ETP market
The popularity of eTPs has continued to grow in recent
years. according to asset manager blackRock advisors,
global eTP assets under Management (auM) grew from
€4,192 billion in 2018 to €4,731 billion by the end of 1Q 2019.
This growth is expected to continue, with sources such as
blackRock, Pwc, boston consulting Group and eY predicting
that the market will grow further to over $ 7.6 trillion by the
end of 2020, as investors continue to invest in low-cost,
transparent and easy-to-trade passive investment
strategies. This contributes to the long-term value creation
of flow Traders’ strategy.
we believe there are a number of reasons for this trend to
continue, including beyond 2020: one is that investors are
attracted to the transparent nature of eTPs, which enables
them to follow clearly how the underlying securities are
performing. another reason is that eTPs are liquid and
available at low-cost and can be bought and sold easily
during market hours. a third reason is that eTPs can be
composed of financial instruments from almost any asset
class, sector or location, giving investors access to markets
that would normally be difficult to reach.
FLOW TR ADERS | HALF YEAR REPORT 2019 > ouR busIness5
Review of 2019
Global eTP markets grew measured in auM driven by
political developments across the globe and market
conditions. (source blackRock Global eTP landscape May
2019). overall trading activity in 2019 was comparable to the
first 6 months of 2018 in terms of Value Traded.
The emphasis on growing our presence in the americas and
aPac are starting to show in our values traded in 2019 so far.
with the growth initiatives underway and the optimization of
flow Traders’ trading infrastructure in aPac, flow Traders
expects to extend it’s presence further in its regions.
In eMea, the total market eTP value traded of €710 billion in
the first six months of 2019. our total eTP value traded from
our europe offices was €250 billion, which was in line with
market developments. flow Traders remained the number
one liquidity provider in eTPs in eMea. our non-eTP Value
Traded in eMea grew further as well, supporting our overall
position in the region.
In aPac, volumes traded in the eTP market remain
dominated by the top-10 most traded eTP products,
as those 10 determine roughly 55-60 percent of the total
market volumes. The market total eTP value traded
(on-exchange and off-exchange) was €941 billion in the first
six months of 2019, including china, while the total eTP value
traded at our Hong Kong and singapore offices was €18
billion. our non-eTP Value Traded grew to € 226 billion.
Global coverage
flow Traders has a global presence operating trading
activities from five offices, in amsterdam, Hong Kong,
london, new York and singapore. our value traded, both in
eTPs and other financial products, grew substantially, while
the eTP market value traded was practically flat. This is the
result of our ongoing focus on growth and diversification in
trading. The largest eTP market is still in the united states,
where total eTP value traded (on-exchange and
off-exchange) was €10.3 trillion in the first six months of
2019. our new York office’s total eTP value traded was €226
billion in the first six months of 2019, an improvement versus
2018. as institutional trading gained further momentum in
2019, flow Traders us continued to grow its overall
presence.
FLOW TR ADERS | HALF YEAR REPORT 2019 > ouR RIsK ManaGeMenT6
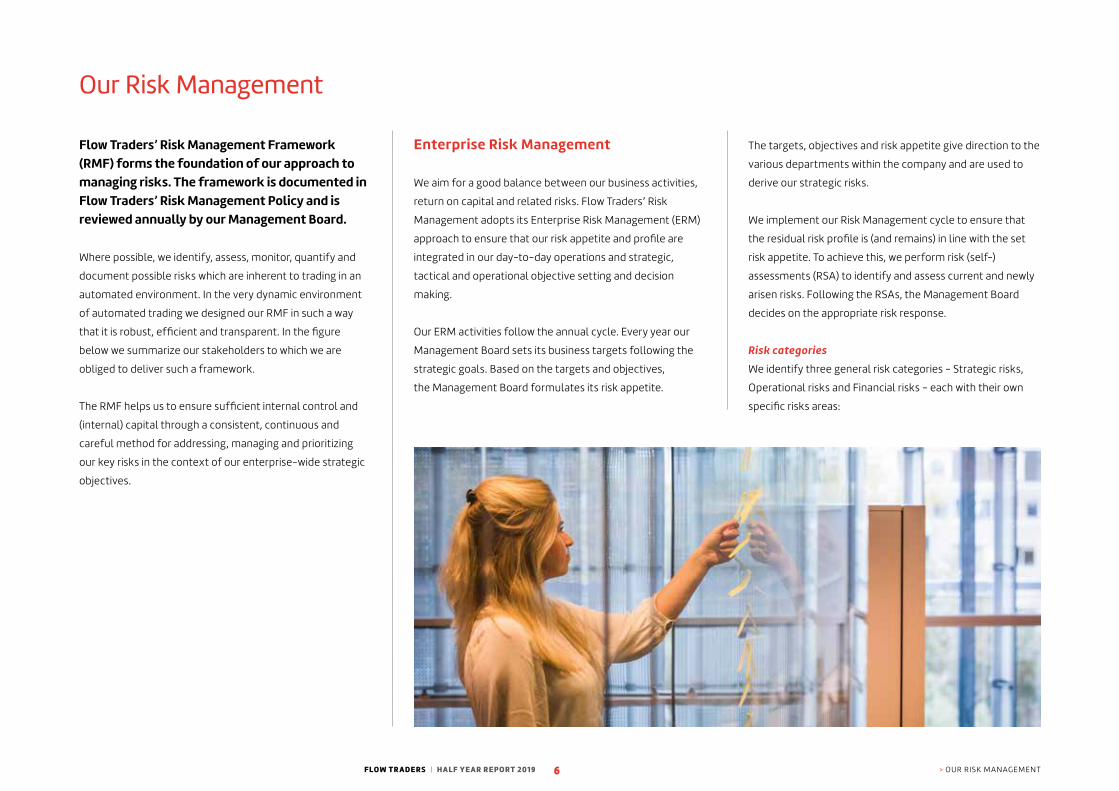
Flow Traders’ Risk Management Framework (RMF) forms the foundation of our approach to managing risks. The framework is documented in Flow Traders’ Risk Management Policy and is reviewed annually by our Management Board.
where possible, we identify, assess, monitor, quantify and
document possible risks which are inherent to trading in an
automated environment. In the very dynamic environment
of automated trading we designed our RMf in such a way
that it is robust, efficient and transparent. In the figure
below we summarize our stakeholders to which we are
obliged to deliver such a framework.
The RMf helps us to ensure sufficient internal control and
(internal) capital through a consistent, continuous and
careful method for addressing, managing and prioritizing
our key risks in the context of our enterprise-wide strategic
objectives.
Enterprise Risk Management
we aim for a good balance between our business activities,
return on capital and related risks. flow Traders’ Risk
Management adopts its enterprise Risk Management (eRM)
approach to ensure that our risk appetite and profile are
integrated in our day-to-day operations and strategic,
tactical and operational objective setting and decision
making.
our eRM activities follow the annual cycle. every year our
Management board sets its business targets following the
strategic goals. based on the targets and objectives,
the Management board formulates its risk appetite.
The targets, objectives and risk appetite give direction to the
various departments within the company and are used to
derive our strategic risks.
we implement our Risk Management cycle to ensure that
the residual risk profile is (and remains) in line with the set
risk appetite. To achieve this, we perform risk (self-)
assessments (Rsa) to identify and assess current and newly
arisen risks. following the Rsas, the Management board
decides on the appropriate risk response.
Risk categories
we identify three general risk categories - strategic risks,
operational risks and financial risks - each with their own
specific risks areas:
Our Risk Management

FLOW TR ADERS | HALF YEAR REPORT 2019 > ouR RIsK ManaGeMenT7
Risk category ContextSTRATEGIC RISKS
Business and Strategic risk
This concerns risk related to our strategy, business model and market conditions. Market activity risk is
part of this risk as our nTI and profitability are primarily a function of the level of trading activity, or
trading volumes, in the financial instruments in which we trade.
Compliance and regulatory risk
compliance risk is the threat posed to a company’s earnings or capital as a result of violation or
non-conformance with laws, regulations, or prescribed practices. It also concerns the risk of changing
laws and regulations (regulatory risk).
In addition, it includes the risk that the integrity of the organization or its operations is jeopardized as a
result of unethical behavior of the organization, its staff members or management.
Concentration risk Probability of loss arising from heavily lopsided exposure to a particular group of counterparties or
products. concentration risk also includes supplier dependency risks.
Legal risk The legal risk is the risk of loss resulting from a claim, failure to adhere to legally binding agreements
and requirements, or failure to adequately legally protect assets of the firm.
Reputation risk The reputation risk is the risk of loss resulting from negative exposure to stakeholders.
IT risk The IT risk concerns the risk of loss resulting from inadequate information technology and processing in
terms of availability, manageability, integrity, controllability and continuity, insufficient protection, or
inadequate IT strategy and policy or inadequate use.
IT security risk This concerns risks relating to access management, cybersecurity and data integrity risks.
Operational risk The operational risk is the risk of loss resulting from inadequate or failed internal processes and people
or from external events. The main driver of operational risk is human error.
FINANCIAL RISKS
Liquidity risk liquidity risk is the risk that there is not sufficient trading capital or regulatory capital available.
Market risk Market risk is the risk to an institution resulting from movements in market prices; in particular, changes
in interest rates, foreign exchange rates, and equity and commodity prices.
Credit risk credit risk is the risk of a counterparty and/or issuing institution involved in trading in or issuing a financial
instrument defaulting on an obligation.
Risk Management Governance
The effectiveness of risk management is unavoidably linked
to commitment and integrity. It is therefore crucial that the
Management board, global and local department heads,
and all flow Traders employees are aware of the company’s
risk exposure and their own responsibilities, as well as the
responsibilities of flow Traders as a whole.
our risk management is embedded in the organization in line
with the three lines of defense model.
The first line of defense is formed by Trading and
Technology. These two departments are crucial for the core
processes within flow Traders and are responsible for
incorporating preventive and detective controls in the
day-to-day trading and IT processes and for the continuous
monitoring of our systems and trading controls.
The second line of defense is responsible for oversight and
monitoring regarding risks, rules and requirements. Risk
Management, Mid-office and Trading compliance monitor
and manage most of the preventive controls, Regulatory
compliance and finance monitor and manage primarily
detective controls. Together, they are responsible for the
continuous risk management of flow Traders.
The third line of defense is formed by our Internal audit
department. In addition, we have an external auditor and we
are audited by regulators.
FLOW TR ADERS | HALF YEAR REPORT 2019 > ouR RIsK ManaGeMenT8
Enterprise Risk Management roles and responsibilities
The role of the Risk committee of the supervisory board
is to:
◾ supervise the Management board with respect to:
◾ Identifying and analysing the risks associated with the
strategy and activities of the company and its
affiliated enterprise;
◾ establishing the risk appetite, and putting in place the
measures in order to counter the risks being taken;
◾ designing, implementing and maintaining adequate
internal risk management and control systems;
◾ Monitoring the operation of the internal risk
management and control systems and carrying out a
systematic assessment of their design and
effectiveness at least once a year. where necessary,
improvements should be made to internal risk
management and control systems;
◾ accounting for the effectiveness of the design and
the operation of the internal risk management and
control systems referred to in best practice
provisions 1.2.1 to 1.2.3 of the dutch corporate
Governance code together with the audit
committee.
◾ advise, and where applicable supervise, the
Management board with respect to:
◾ the company’s overall risk appetite, tolerance and
strategy;
◾ the current risk exposures and future risk strategy;
◾ the intended appointment and/or removal of the
Global Head of Risk and Mid-office.
◾ Review, in relation to the company’s internal risk
management and control systems:
◾ the company’s overall risk assessment processes that
inform the Management board’s decision making,
ensuring both qualitative and quantitative metrics
are used;
◾ on an annual basis, the parameters used for these
processes and the methodology adopted;
◾ the accurate and timely monitoring of certain risk
types of high importance;
◾ the company’s capability to identify and manage new
risk types;
◾ reports on any material breaches of risk limits and
the adequacy of proposed action.
◾ Monitor the manner in which the company’s risk
management function is provided with adequate
resources and appropriate access to information to
enable it to perform its function effectively and in
accordance with the relevant professional standards.
The Risk committee shall also keep under review that
the function has the adequate independence and is free
from management and other restrictions;
◾ Prepare reports, recommendations and deliberations
on its findings regarding the company’s internal risk
management for purposes of the meetings of the
supervisory board or the audit committee;
◾ Review, and where applicable monitor, the
Management board s responsiveness to the reports,
findings and recommendations of the Global Head of
Risk and Mid-office.
The Management board is responsible for:
◾ setting companywide objectives;
◾ setting boundaries for risk taking by communicating
our risk appetite;
◾ successfully promoting, sponsoring and coordinating
the development of a risk management culture
throughout the company;
◾ Guiding the inclusion of risk management practices in
all strategic and operational decision making;
◾ Maintaining and monitoring the effectiveness of the
framework to manage, monitor and report risk;
◾ Identifying and evaluating the significant risks related
to flow Traders’ strategy;
◾ discussing current risk developments with the standing
risk committee of the Management board.
The Management board invites stakeholders within the
firm to report on new and existing risk exposures;
◾ Reporting on the outcomes of the risk management
activities to the Risk committee of the supervisory
board.
flow Traders Managing directors are responsible for:
◾ setting local department targets and objectives in line
with companywide objectives together with the Global
Heads;
◾ supporting the company in the identification, handling,
monitoring of risks related to its objectives;
◾ Identifying and evaluating the significant risks related
to our objectives and operations;
◾ Managing the risk self-assessment cycle (non-trading
Managing directors);
◾ Monitoring of risks related to our objectives;
◾ Providing advice and follow-up on risk mitigating
measures;
◾ Reporting on risks and risk management towards the
Management board.
FLOW TR ADERS | HALF YEAR REPORT 2019 > ouR RIsK ManaGeMenT9
The targets, objectives and risk appetite give direction to the
various departments within flow Traders and are used to
derive the company’s strategic risks.
flow Traders’ Risk Management cycle is implemented to
ensure that the net risk profile is and stays in line with the
set risk appetite. To do so, we perform Rsas to identify and
assess current and newly arisen risks and compliance with
applicable requirements. following the Rsas, department
heads in cooperation with the Management board will
decide on the appropriate risk response. The effects of the
chosen risk responses will be monitored and every year the
actual net risk profile will be mapped versus the appetite.
every year the Management board sets its business targets
following the strategic goals. The strategic goals are
generally formulated in november/december.
The supervisory board, together with the Management
board, approves the strategic goals and business targets.
additionally, the supervisory board is part of the strategy
setting exercise. based on these long-term goals,
short-term targets are determined. These targets are then
translated into annual companywide, departmental and
individual goals and discussed in an annual meeting with the
Management board and all Managing directors.
based on the targets and objectives, the Management board
formulates the risk appetite of the company.
flow Traders Global/local Heads are responsible for:
◾ setting global/local department targets and objectives
in line with companywide objectives;
◾ Performing annual risk self-assessments to identify
assess and document existing and new risks and their
impact on proposed plans;
◾ The adoption of risk management practices;
◾ awareness and training on risk management.
◾ The results of risk management activities, relevant to
their area of responsibility;
◾ Reporting on risks and risk management towards the
Risk and Mid-office department, the local Managing
directors and/or (Global) Head.
flow Traders Risk and Mid-office department is responsible
for:
◾ Monitoring, improving and controlling the eRM;
◾ Triggering risk self-assessments for all departments;
◾ Gathering the necessary information and creating risk
reports for internal stakeholders and the Management
board.
flow Traders employees are responsible for:
◾ Giving input to annual risk self-assessments to identify,
asses and document existing and new risks and their
impact on proposed plans;
◾ Identifying areas where risk management practices
should be adopted and are to advise their supervisors
accordingly.
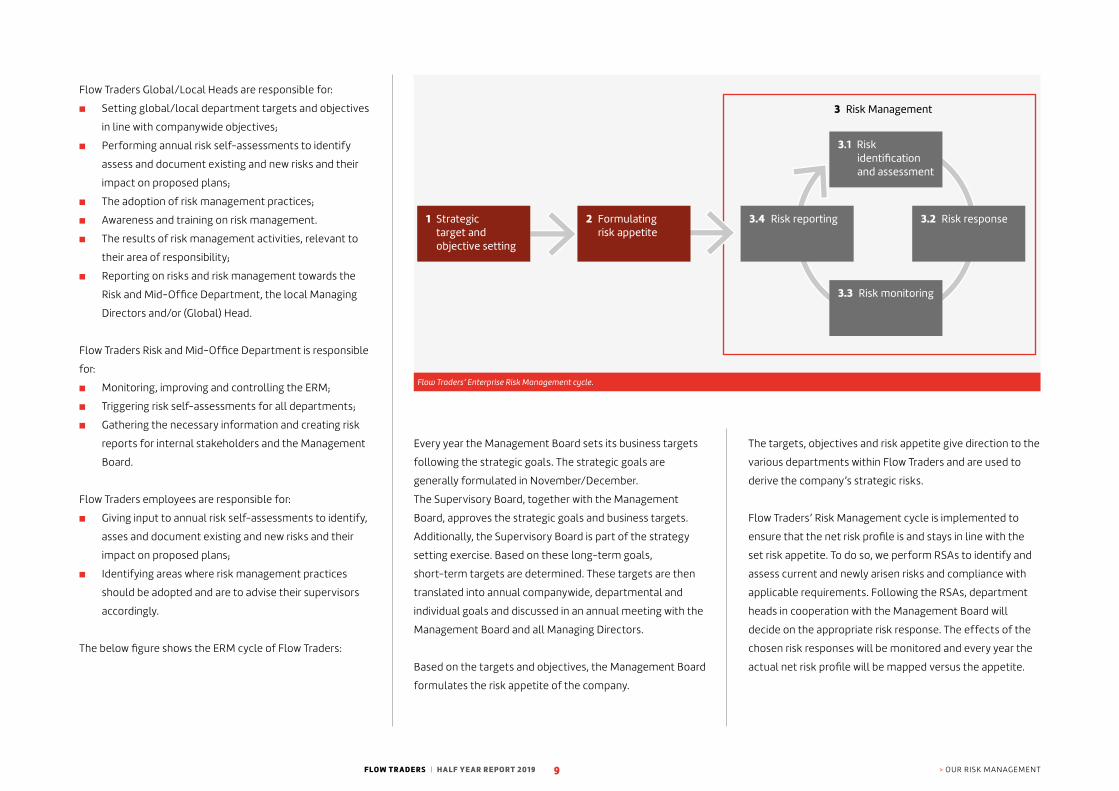
The below figure shows the eRM cycle of flow Traders:
1 Strategic target and objective setting
2 Formulating risk appetite
3.1 Risk identification
and assessment
3.3 Risk monitoring
3.4 Risk reporting 3.2 Risk response
3 Risk Management
Flow Traders’ Enterprise Risk Management cycle.

FLOW TR ADERS | HALF YEAR REPORT 2019 > ouR RIsK ManaGeMenT10
conditions, broad trends in business and finance, regulatory
requirements, actions by central banks, and changes in the
markets in which such transactions occur.
To cope with periods of little market activity, we diversify in
products and markets traded. This is to safeguard that we
are not too dependent on the levels of market activity in
one asset class or product category.
Operational risk
operational risk is defined as the risk of loss arising from
inadequate or failed internal processes, people, systems or
external events. operational risk management is an integral
part of flow Traders’ management information and control
systems. as our operational risks are concentrated in
technology events at exchanges and clearing members,
our investment in technology is important to mitigate those
associated risks.
we operate an integrated, in-house developed,
high-performance and customized technology platform
with frequent and controlled deployments of new hardware
and software. our infrastructure has a modular design which
allows us to rapidly test and implement improvements in
both hardware and software on an ongoing basis. controlled
releases of hardware and software enhancements provide
for minimal disruption to our business.
The environment in which our trading software (or updates
of our trading software) is being developed is strictly
separated from the environment in which such trading
software operates in production. access to the source code
is strictly controlled and limited. Prior to releasing our
trading software, or an update into the production
environment, any element of our trading software is
following a review of the company’s risk assessment
processes, the monitoring of the company’s internal risk
management and control systems has been identified as
a priority and as a joint responsibility of the supervisory
board and its committees. all risks relevant to each of the
committees of the supervisory board are monitored in the
Risk committee of the supervisory board. This means that
the relevant items set out in best practice provision 1.4.1 of
the corporate Governance code have been discussed by the
supervisory board, as all members of the supervisory board
are members of the Risk committee.
Key risks
Market risk
Market risk is the risk of loss resulting from unfavorable
market movements, such as prices, when positions in
financial instruments are held. The value of a financial
instrument may fluctuate because of changes in factors
such as equity prices, currency rates, future dividend
expectations, interest rates and volatilities. our hedging
strategies, in combination with the use of straightforward
products and continuous monitoring, aim to minimize this
risk. our trading philosophy is that we hedge our positions as
perfectly as possible and therefore we minimalize exposures
towards market.
Market activity risk (business risk)
our nTI and profitability are primarily a function of the level
of trading activity, or trading volumes, in the financial
instruments in which we trade, and the bid-ask spreads
(which largely determine the profit on the trade, or margins,
we capture). Trading volumes in securities, derivatives and
other financial instruments on exchanges and in other
trading venues worldwide are directly affected by factors
beyond our control, including economic and political
Risk reporting
we have a standing risk committee that continuously
assesses the risks we face in our business, comprised of our
Global Head of Risk and Mid-office and the Management
board. aside from ongoing ad-hoc communication, there is
a recurring meeting set up in which they discuss all risk
assessments and risk proposals related to position limits,
strategies, procedures, capital requirements and other
requirements of prime brokers and market developments.
any major changes to our risk systems, strategies and limit
setting must subsequently be approved by the Management
board. There have not been any major failings in the internal
risk management and control systems observed in H1 2019.
additionally, improvements to the systems are discussed
with the Management board.
In addition to the standing risk committee, the company has
a Risk committee of the supervisory board. all members of
the supervisory board are members of this Risk committee.
The Management board informs the Risk committee of the
supervisory board about the effectiveness of the internal
risk management and control systems. This includes the
reasonable assurance that the aforementioned systems do
not contain any material inaccuracies. In addition, the tasks
of the Risk committee of the supervisory board includes
supervision and monitoring, as well as advising the
Management board on the operation of the company’s
internal risk management and control systems. The Risk
committee is also responsible for providing advice to the
Management board on the company’s development,
performance, and sustainability of its trading strategies,
as well as reviewing the risk of the company. It maintains
regular contact with the company’s Trading and Risk and
Mid-office departments.

FLOW TR ADERS | HALF YEAR REPORT 2019 > ouR RIsK ManaGeMenT11
systems and the data that is being exchanged is subject to
prior conformance testing and continuous monitoring.
unexpected deviations are flagged and investigated.
we also have a disaster recovery plan in place which,
for instance, provides that each office acts as a back-up site
for other offices.
we use risk-based onboarding procedures before we
commence trading on new platforms, including platforms
designated for trading digital assets. while many of such
platforms remain unregulated, many have strongly
improved their own onboarding procedures and cId
procedures. while we believe our own procedures are strong
and trading on such platforms is quite limited,
the unregulated status of such platforms and their location
in emerging economies makes them inherently less
institutionalized and supervised than regulated platforms in
developed economies.
Regulatory risk
while we do not have clients and do not provide investment
services or ancillary services to third parties, our markets
and nearly all aspects of our business are heavily regulated.
where applicable, entities forming part of our group have
obtained the regulatory licenses and approvals needed to
operate their regulated businesses.
flow Traders’ trading operations are established in four
international jurisdictions. as a group we currently trade on
more than 182 venues worldwide. In addition, we operate on
various venues through brokers. as we have to comply with
our home regulations, local regulations and trading rules of
all venues on which we trade, our regulatory landscape is
vast. legislators and regulators worldwide strengthen their
supervision within our environment, demanding
a professional and well-structured compliance organization.
our Regulatory compliance department assists
management and operations at group and local level by
identifying, advising on, reviewing and reporting on
regulations. It also seeks to maintain a compliant business
environment through training and monitoring in order to
ensure and enhance the group’s conformance with its
regulatory obligations.
The Trading compliance and Risk and Mid-office
departments have promulgated and implemented
pre-trade risk controls, internal rules and regulations that
were developed following regulatory requirements,
guidelines from market authorities, industry best practices
and our own best practices.
laws and regulations, including tax laws, are subject to
change or can be interpreted differently in practice over
time. currently, the european commission, european
subjected to a review of its code, testing in an environment
that is separate from our production environment, validation
in limited production (processing a strictly limited number of
trades) on one trading desk in respect of trading a single
financial instrument, followed by more extensive testing
across multiple desks and/or trading multiple financial
instruments. each step, and progressive steps,
is documented.
we have a monitoring system in place to control undisrupted
trading activities in real time. Multilayer monitoring is
employed to avoid errors, but when these occur the relevant
teams are notified via multiple notification channels. we rely
on multiple third party service providers for business and
market data.
our risk management system is fully integrated with our
trading platform, analyzing real-time pricing data, and is
designed to ensure that our order activity is conducted
within strict pre-determined trading and position limits.
for example, our pre-trade risk controls are designed to
prevent the trading engines from sending quotes which
deviate from our pre-defined risk parameters, such as price
and volume limits set by the Risk Management department,
which keeps our ordering, trading and positions well within
tolerance levels. our monitoring tools reconcile trades,
prices and positions against those of our exchanges and
prime brokers.
our IT systems are regularly subjected to penetration tests
by external experts. we have a comprehensive IT security
system that is designed to protect us from attacks both
from inside and outside the platform. where we have
a technical interface with institutions like our prime brokers
and exchanges, the integrity of the connection between the
‘ Our infrastructure has a modular design which allows us to rapidly test and implement improvements’

FLOW TR ADERS | HALF YEAR REPORT 2019 > ouR RIsK ManaGeMenT12
Statement by the Management Board
as required by section 5:25d of the dutch financial
supervision act (wet op het financieel toezicht) we state
that according to the best of our knowledge:
◾ the interim financial statements present a true and fair
view of the assets, the liabilities, the financial position
and profit or loss of flow Traders n.V. and the
companies included in the consolidation; and
◾ the interim financial statements provide a true and fair
view of the information required pursuant to article
5:25d paragraph 8 and 9 of the dutch financial
supervision act (wet op het financieel toezicht).
amsterdam, 23 July 2019
Management Board
dennis dijkstra, ceo
folkert Joling, cTro
Thomas wolff, cTo
we continuously invest in good professional relationships
with trading venues, regulators and other relevant parties.
flow Traders is a founding member of the fIa european
Principal Traders association (fIa ePTa), a member of the
fIa Principal Traders Group (fIa PTG) in the us and
a member of fIa asia. These are industry groups that consist
of leading principal trading firms. we are also a member of
the dutch association of Proprietary Traders (aPT),
operating as an industry body of netherlands-based
liquidity providers. as part of these important groups,
we continue to promote, foremost, the principle that all
markets and market participants should be adequately and
transparently regulated. within these groups we contribute
to discussions regarding current and new regulations,
including IfR/Ifd, cRd IV/cRR, MifId II, brexit, market
structure and market regulations. we will continue to
contribute to these discussions and will persist in maximizing
transparency in respect of our industry, its benefits for all
market participants and fair, orderly and transparent
financial markets.
Parliament and european member states are negotiating
new capital and remuneration requirements (IfR/Ifd) which
may affect our dutch trading entity and our Group.
we expect more certainty about the outcome in the next
few months. Meanwhile, the remuneration rules in the
netherlands are in the process of being reviewed. we cannot
predict the outcome of such regulatory developments and
are closely following relevant developments.
actual or alleged non-compliance with applicable laws or
regulatory requirements could adversely affect our
reputation, profitability and prospects. This may also be the
case for differences in interpretation or lack of timely or
complete implementation of regulatory requirements.
sanctions could include fines, penalties, disgorgements and
censures, suspension or expulsion from trading venues or
the revocation or limitation of licenses. we aim to minimize
such risks by focusing considerable management attention,
employing highly-qualified compliance and risk
professionals, deploying training, monitoring and reporting
systems, and continuously evaluating and implementing
current and upcoming regulation on our operations.
notwithstanding such efforts, given the highly regulated
nature of our business, we are regularly subject to routine
(and sometimes more targeted) inquiries and audits from
regulators and trading venues. It is difficult to predict or
manage the outcome of such inquiries, although we aim to
be as transparent and cooperative as possible given the
circumstances.

FLOW TR ADERS | HALF YEAR REPORT 2019 13
14 Condensed Consolidated Interim
Financial Statements
19 Notes to the Condensed
Consolidated Interim Financial
Statements
29 Review Report
Condensed Consolidated Interim Financial Statements 30 June 2019

FLOW TR ADERS | HALF YEAR REPORT 2019 14
CONDENSED CONSOLIDATED STATEMENT OF FINANCIAL POSITION In thousands of euro
Note At 30 June 2019 At 31 December 2018
AssetsCash and cash equivalents 10,369 10,054
Financial assets held for trading 5 3,500,806 3,676,807
Trading receivables 5 2,733,027 3,039,875
Other receivables 13,700 13,927
Investments fair value through OCI 5 1,557 1,267
Investments in associates 367 357
Property and equipment* 44,437 28,905
Intangible assets 1,358 1,281
Current tax assets 5,873 4,699
Deferred tax assets 1,096 3,001
Total assets 6,312,590 6,780,173
LiabilitiesFinancial liabilities held for trading 5 1,786,231 2,601,529
Trading payables 5 4,083,337 3,700,555
Lease liabilities* 3 18,504 -
Other liabilities 84,032 125,963
Current tax liabilities 11,611 9,857
Deferred tax liabilities 1,217 1,218
Total liabilities 5,984,932 6,439,122
Equity 10
Share capital 4,653 4,653
Share premium 154,540 154,509
Retained earnings 154,164 167,734
Currency translation reserve 14,958 14,663
Fair value reserve (657) (508)
Total equity 327,658 341,051
Total equity and liabilities 6,312,590 6,780,173
* Increase is driven by the implementation of IFRS 16. Please refer to note 3 on page 19 and 20.
The notes on pages 19 to 28 are an integral part of these consolidated financial statements.
FLOW TR ADERS | HALF YEAR REPORT 2019 15
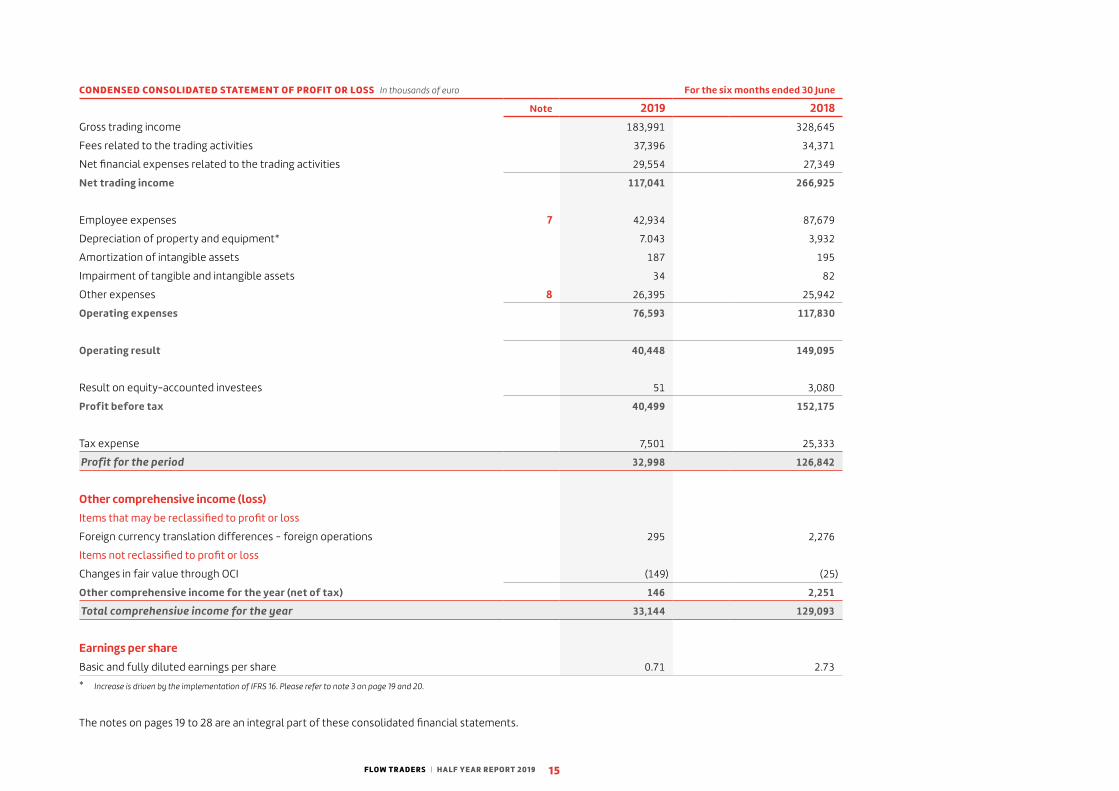
CONDENSED CONSOLIDATED STATEMENT OF PROFIT OR LOSS In thousands of euro For the six months ended 30 June
Note 2019 2018Gross trading income 183,991 328,645
Fees related to the trading activities 37,396 34,371
Net financial expenses related to the trading activities 29,554 27,349
Net trading income 117,041 266,925
Employee expenses 7 42,934 87,679
Depreciation of property and equipment* 7.043 3,932
Amortization of intangible assets 187 195
Impairment of tangible and intangible assets 34 82
Other expenses 8 26,395 25,942
Operating expenses 76,593 117,830
Operating result 40,448 149,095
Result on equity-accounted investees 51 3,080
Profit before tax 40,499 152,175
Tax expense 7,501 25,333
Profit for the period 32,998 126,842
Other comprehensive income (loss)Items that may be reclassified to profit or loss
Foreign currency translation differences - foreign operations 295 2,276
Items not reclassified to profit or loss
Changes in fair value through OCI (149) (25)
Other comprehensive income for the year (net of tax) 146 2,251
Total comprehensive income for the year 33,144 129,093
Earnings per shareBasic and fully diluted earnings per share 0.71 2.73
* Increase is driven by the implementation of IFRS 16. Please refer to note 3 on page 19 and 20.
The notes on pages 19 to 28 are an integral part of these consolidated financial statements.
FLOW TR ADERS | HALF YEAR REPORT 2019 16
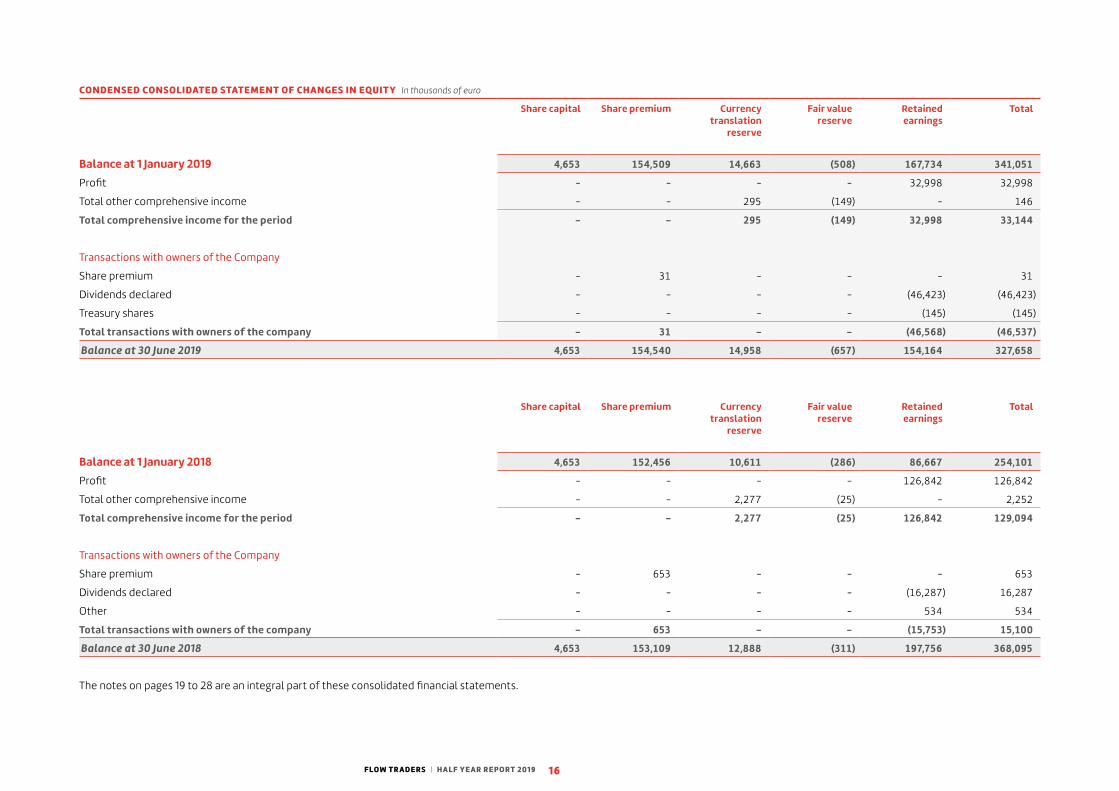
CONDENSED CONSOLIDATED STATEMENT OF CHANGES IN EQUITY In thousands of euro
Share capital Share premium Currency translation
reserve
Fair value reserve
Retained earnings
Total
Balance at 1 January 2019 4,653 154,509 14,663 (508) 167,734 341,051
Profit - - - - 32,998 32,998
Total other comprehensive income - - 295 (149) - 146
Total comprehensive income for the period - - 295 (149) 32,998 33,144
Transactions with owners of the Company
Share premium - 31 - - - 31
Dividends declared - - - - (46,423) (46,423)
Treasury shares - - - - (145) (145)
Total transactions with owners of the company - 31 - - (46,568) (46,537)
Balance at 30 June 2019 4,653 154,540 14,958 (657) 154,164 327,658
Share capital Share premium Currency translation
reserve
Fair value reserve
Retained earnings
Total
Balance at 1 January 2018 4,653 152,456 10,611 (286) 86,667 254,101
Profit - - - - 126,842 126,842
Total other comprehensive income - - 2,277 (25) - 2,252
Total comprehensive income for the period - - 2,277 (25) 126,842 129,094
Transactions with owners of the Company
Share premium - 653 - - - 653
Dividends declared - - - - (16,287) 16,287
Other - - - - 534 534
Total transactions with owners of the company - 653 - - (15,753) 15,100
Balance at 30 June 2018 4,653 153,109 12,888 (311) 197,756 368,095
The notes on pages 19 to 28 are an integral part of these consolidated financial statements.

FLOW TR ADERS | HALF YEAR REPORT 2019 17
CONDENSED CONSOLIDATED STATEMENT OF CASH FLOWS In thousands of euro For the six months ended 30 June
2019 2018Cash flows from operating activitiesProfit for the period 32,998 126,842
Adjusted for:
Depreciation of property and equipment 7,043 3,932
Amortization of intangible assets 187 195
Impairment of tangible and intangible assets 34 82
Result on equity-accounted investees (net of tax) (51) (73)
Tax expense 7,501 25,333
Changes in working capital
◾ Financial assets held for trading 176,001 (115,751)
◾ Trading receivables 306,848 (662,673)
◾ Other receivables 227 (2,431)
◾ Financial liabilities held for trading (815,298) 730,169
◾ Trading payables 382,782 (105,990)
◾ Other liabilities (36,352) 34,345
◾ Corporate income tax paid (5.017) (17,371)
◾ Other (20) 2,752
Cash flows from operating activities 56,883 19,361
FLOW TR ADERS | HALF YEAR REPORT 2019 18
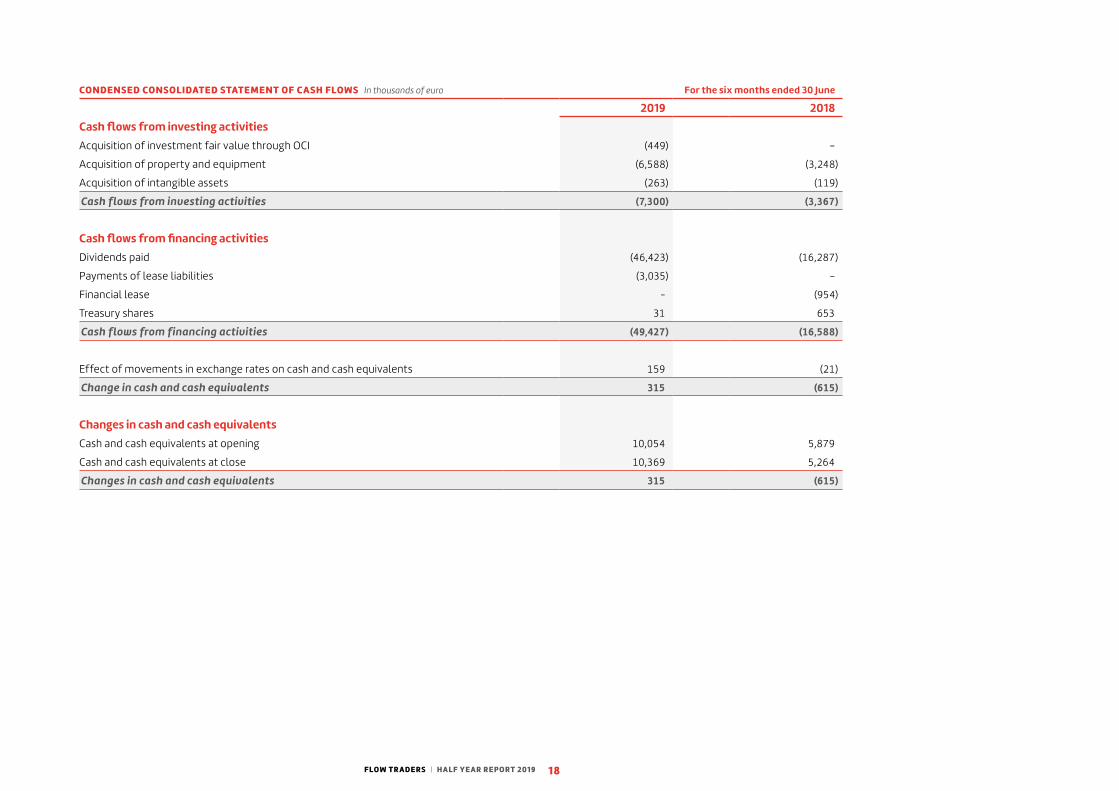
CONDENSED CONSOLIDATED STATEMENT OF CASH FLOWS In thousands of euro For the six months ended 30 June
2019 2018Cash flows from investing activitiesAcquisition of investment fair value through OCI (449) –
Acquisition of property and equipment (6,588) (3,248)
Acquisition of intangible assets (263) (119)
Cash flows from investing activities (7,300) (3,367)
Cash flows from financing activitiesDividends paid (46,423) (16,287)
Payments of lease liabilities (3,035) –
Financial lease - (954)
Treasury shares 31 653
Cash flows from financing activities (49,427) (16,588)
Effect of movements in exchange rates on cash and cash equivalents 159 (21)
Change in cash and cash equivalents 315 (615)
Changes in cash and cash equivalentsCash and cash equivalents at opening 10,054 5,879
Cash and cash equivalents at close 10,369 5,264
Changes in cash and cash equivalents 315 (615)

FLOW TR ADERS | HALF YEAR REPORT 2019 19
Notes to the condensed consolidated interim financial statementsAll amounts in thousands of euro, unless stated otherwise.
1. Reporting entity
Flow Traders N.V. (referred to as the ‘Company’) is a public limited liability company (naamloze
vennootschap) incorporated under the laws of the Netherlands, having its seat (statutaire
zetel) in Amsterdam, the Netherlands, having its registered office at Jacob Bontiusplaats 9,
1018 LL Amsterdam, the Netherlands and registered with the Trade Register of the Chamber of
Commerce (Kamer van Koophandel, afdeling Handelsregister) under number 34294936.
These condensed consolidated interim financial statements comprise the Company and its
subsidiaries (together referred to as the ‘Group’). The Group is a leading global technology-
enabled liquidity provider that specializes in exchange traded products (ETPs). The Group’s goal
is to be a one-stop shop for liquidity in the Global financial Market.
The condensed consolidated interim financial statements of the Group for the six months
period ended 30 June 2019 incorporate financial information of Flow Traders N.V., its controlled
entities and interests in associates. The condensed consolidated interim financial statements
were authorised for issue by the Company’s Management Board and the Supervisory Board on
23 July 2019.
2. Basis of preparation
These condensed consolidated interim financial statements have been prepared in accordance
with IAS 34 Interim Financial Reporting as adopted by the European Union. They do not include
all the information required for a complete set of IFRS financial statements. However, selected
explanatory notes are included to explain events and transactions that are significant to an
understanding of the changes in the Group’s financial position and performance since the last
annual consolidated financial statements as at and for the year ended 31 December 2018.
The board report as set out on page 4 to 12 is an integral part of these condensed consolidated
interim financial statements.
3. New standards, interpretations and amendments adopted by the group
In these condensed consolidated interim financial statements, IFRS 16 has been applied for the
first time. This new standard has limited impact on the financials and are disclosed in more
detail below. All other accounting policies are the same as those applied in the Group’s consol-
idated financial statements as at and for the year ended 31 December 2018.
Several other amendments and interpretations apply for the first time in 2019, but do not have
an impact on the interim condensed consolidated financial statements of the Group.
IFRS 16 Leases
IFRS 16 supersedes IAS 17 Leases, IFRIC 4 Determining whether an Arrangement contains
a Lease, SIC-15 Operating Leases-Incentives and SIC-27 Evaluating the Substance of
Transactions Involving the Legal Form of a Lease. The standard sets out the principles for the
recognition, measurement, presentation and disclosure of leases and requires lessees to
account for most leases under a single on-balance sheet model.
The Group adopted IFRS 16 using the modified retrospective method of adoption with the date
of initial application of 1 January 2019. Under this method, the standard is applied retrospec-
tively with the cumulative effect of initially applying the standard recognised at the date of
initial application.
Nature of the effect of adoption of IFRS 16
Leases previously classified as finance leases
The Group did not change the initial carrying amounts of recognised assets and liabilities at the
date of initial application for leases previously classified as finance leases (i.e., the right-of-use
assets and lease liabilities equal the lease assets and liabilities recognised under IAS 17).
The requirements of IFRS 16 were applied to these leases from 1 January 2019.
Leases previously accounted for as operating leases
The Group recognized right-of-use assets and lease liabilities for those leases previously
classified as operating leases, except for short-term leases. The right-of-use assets recognized
were equal to the lease liabilities, adjusted by the amount of any lease incentives relating such
leases recognized in the statement of financial position immediately before the date of initial
application. Lease liabilities were recognized based on the present value of the remaining lease
payments, discounted using the incremental borrowing rate at the date of initial application.
FLOW TR ADERS | HALF YEAR REPORT 2019 20
Lease liabilities
At the commencement date of the lease, the Group recognizes lease liabilities on the
statement of financial position measured at the present value of lease payments to be made
over the lease term. In calculating the present value of lease payments, the Group uses the
incremental borrowing rate at the lease commencement date. After the commencement date,
the amount of lease liabilities is increased to reflect the accretion of interest and reduced for
the lease payments made. In addition, the carrying amount of lease liabilities is remeasured if
there is a change in the lease term.
The Group applies the short-term lease recognition exemption to its short-term leases (i.e.,
those leases that have a lease term of 12 months or less from the commencement date and do
not contain a purchase option). Lease payments on short-term leases are recognised as
expense on a straight-line basis over the lease term.
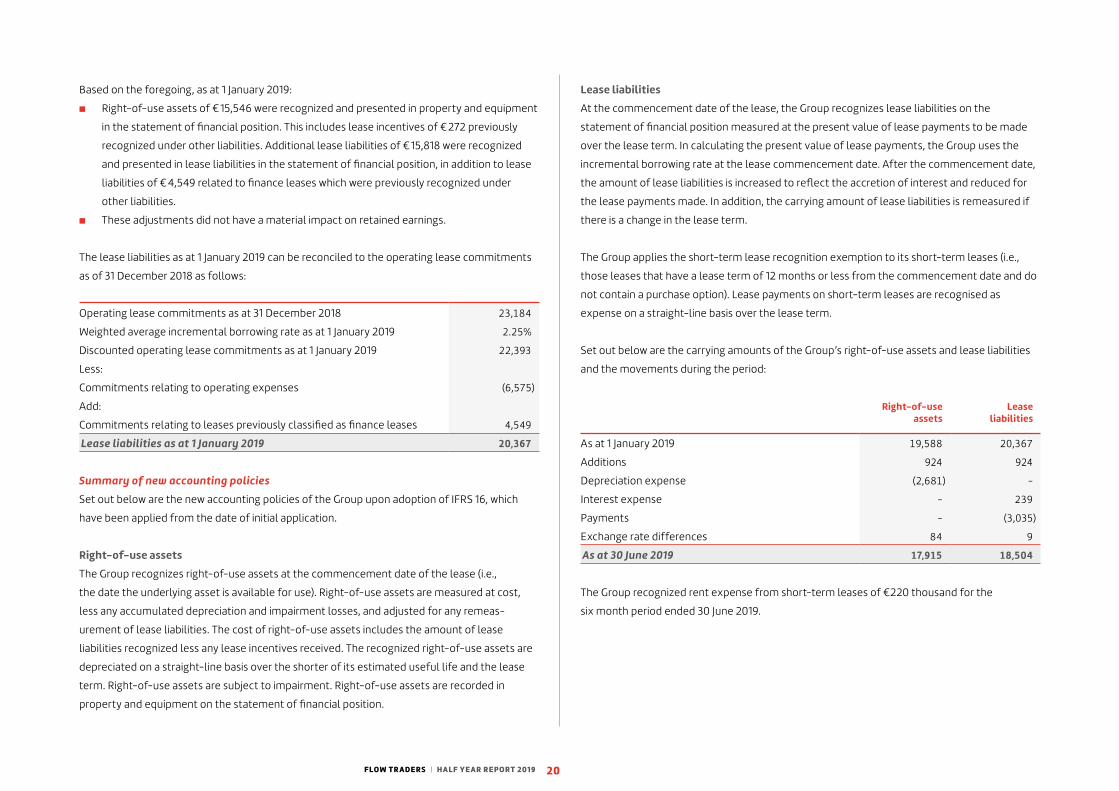
Set out below are the carrying amounts of the Group’s right-of-use assets and lease liabilities
and the movements during the period:
Right-of-use assets
Lease liabilities
As at 1 January 2019 19,588 20,367
Additions 924 924
Depreciation expense (2,681) -
Interest expense - 239
Payments - (3,035)
Exchange rate differences 84 9
As at 30 June 2019 17,915 18,504
The Group recognized rent expense from short-term leases of €220 thousand for the
six month period ended 30 June 2019.
Based on the foregoing, as at 1 January 2019:
◾ Right-of-use assets of € 15,546 were recognized and presented in property and equipment
in the statement of financial position. This includes lease incentives of € 272 previously
recognized under other liabilities. Additional lease liabilities of € 15,818 were recognized
and presented in lease liabilities in the statement of financial position, in addition to lease
liabilities of € 4,549 related to finance leases which were previously recognized under
other liabilities.
◾ These adjustments did not have a material impact on retained earnings.
The lease liabilities as at 1 January 2019 can be reconciled to the operating lease commitments
as of 31 December 2018 as follows:
Operating lease commitments as at 31 December 2018 23,184
Weighted average incremental borrowing rate as at 1 January 2019 2.25%
Discounted operating lease commitments as at 1 January 2019 22,393
Less:
Commitments relating to operating expenses (6,575)
Add:
Commitments relating to leases previously classified as finance leases 4,549
Lease liabilities as at 1 January 2019 20,367
Summary of new accounting policies
Set out below are the new accounting policies of the Group upon adoption of IFRS 16, which
have been applied from the date of initial application.
Right-of-use assets
The Group recognizes right-of-use assets at the commencement date of the lease (i.e.,
the date the underlying asset is available for use). Right-of-use assets are measured at cost,
less any accumulated depreciation and impairment losses, and adjusted for any remeas-
urement of lease liabilities. The cost of right-of-use assets includes the amount of lease
liabilities recognized less any lease incentives received. The recognized right-of-use assets are
depreciated on a straight-line basis over the shorter of its estimated useful life and the lease
term. Right-of-use assets are subject to impairment. Right-of-use assets are recorded in
property and equipment on the statement of financial position.
FLOW TR ADERS | HALF YEAR REPORT 2019 21
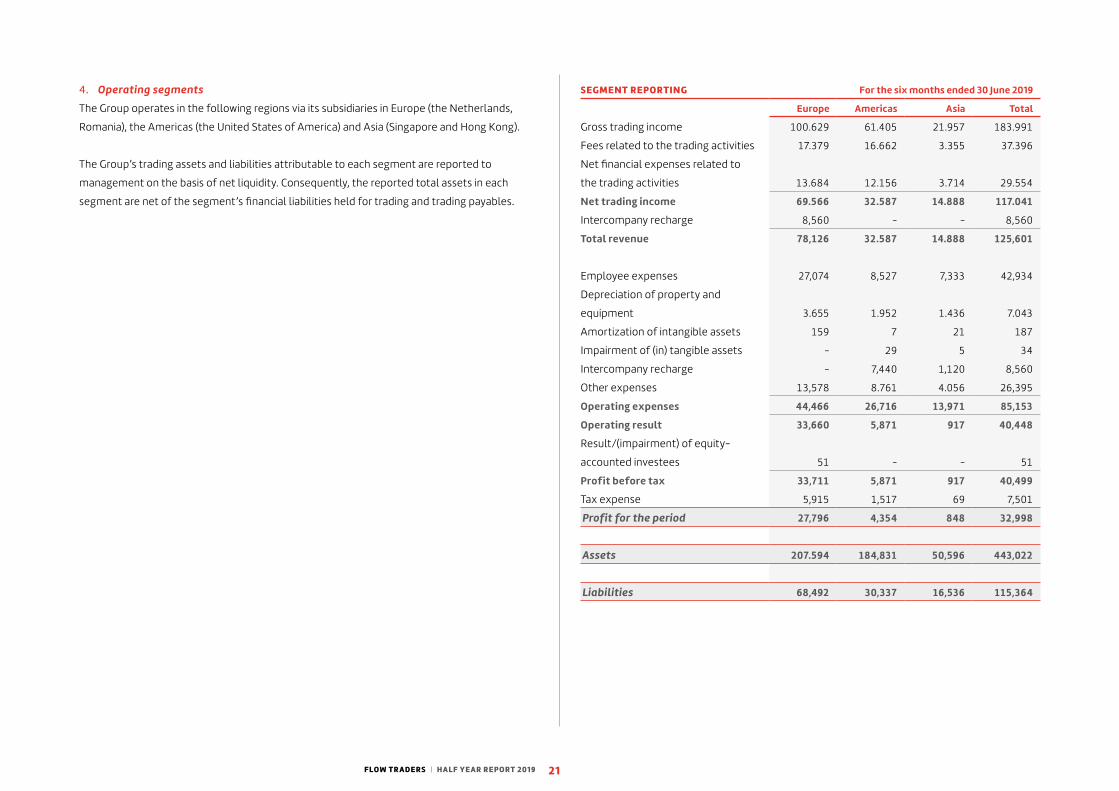
SEGMENT REPORTING For the six months ended 30 June 2019
Europe Americas Asia Total
Gross trading income 100.629 61.405 21.957 183.991
Fees related to the trading activities 17.379 16.662 3.355 37.396
Net financial expenses related to
the trading activities 13.684 12.156 3.714 29.554
Net trading income 69.566 32.587 14.888 117.041
Intercompany recharge 8,560 - - 8,560
Total revenue 78,126 32.587 14.888 125,601
Employee expenses 27,074 8,527 7,333 42,934
Depreciation of property and
equipment 3.655 1.952 1.436 7.043
Amortization of intangible assets 159 7 21 187
Impairment of (in) tangible assets - 29 5 34
Intercompany recharge - 7,440 1,120 8,560
Other expenses 13,578 8.761 4.056 26,395
Operating expenses 44,466 26,716 13,971 85,153
Operating result 33,660 5,871 917 40,448
Result/(impairment) of equity-
accounted investees 51 - - 51
Profit before tax 33,711 5,871 917 40,499
Tax expense 5,915 1,517 69 7,501
Profit for the period 27,796 4,354 848 32,998
Assets 207.594 184,831 50,596 443,022
Liabilities 68,492 30,337 16,536 115,364
4. Operating segments
The Group operates in the following regions via its subsidiaries in Europe (the Netherlands,
Romania), the Americas (the United States of America) and Asia (Singapore and Hong Kong).
The Group’s trading assets and liabilities attributable to each segment are reported to
management on the basis of net liquidity. Consequently, the reported total assets in each
segment are net of the segment’s financial liabilities held for trading and trading payables.
FLOW TR ADERS | HALF YEAR REPORT 2019 22
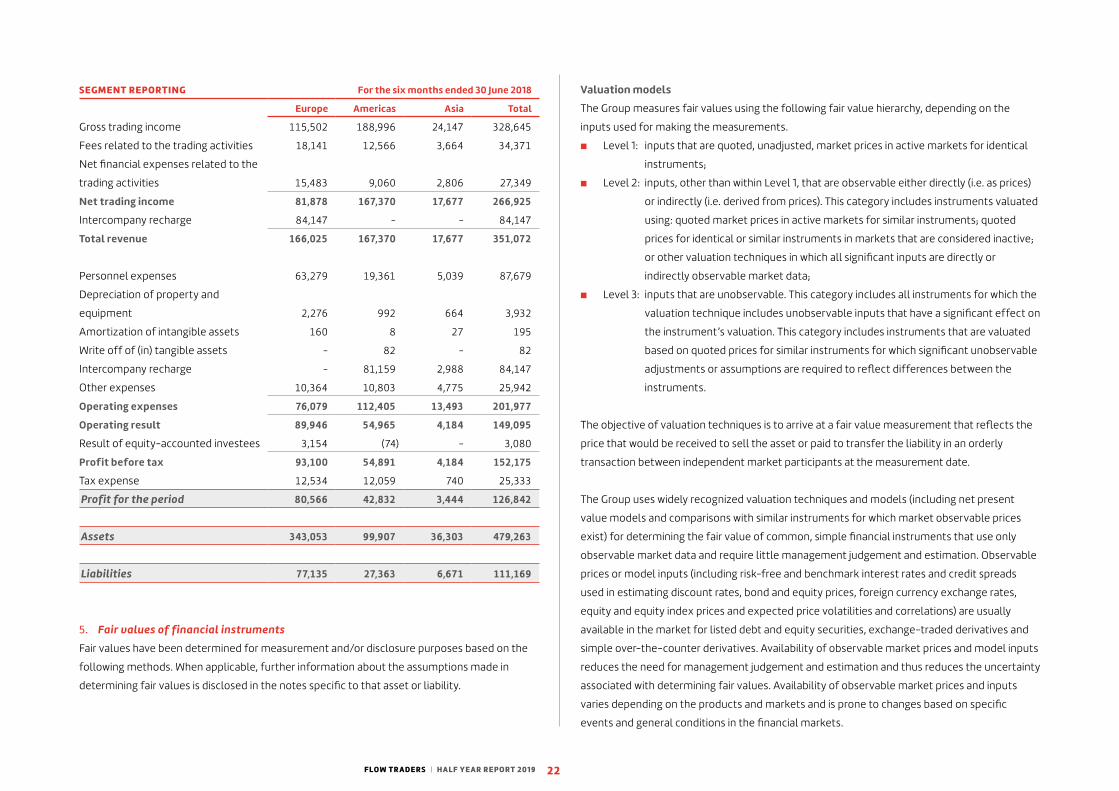
Valuation models
The Group measures fair values using the following fair value hierarchy, depending on the
inputs used for making the measurements.
◾ Level 1: inputs that are quoted, unadjusted, market prices in active markets for identical
instruments;
◾ Level 2: inputs, other than within Level 1, that are observable either directly (i.e. as prices)
or indirectly (i.e. derived from prices). This category includes instruments valuated
using: quoted market prices in active markets for similar instruments; quoted
prices for identical or similar instruments in markets that are considered inactive;
or other valuation techniques in which all significant inputs are directly or
indirectly observable market data;
◾ Level 3: inputs that are unobservable. This category includes all instruments for which the
valuation technique includes unobservable inputs that have a significant effect on
the instrument’s valuation. This category includes instruments that are valuated
based on quoted prices for similar instruments for which significant unobservable
adjustments or assumptions are required to reflect differences between the
instruments.
The objective of valuation techniques is to arrive at a fair value measurement that reflects the
price that would be received to sell the asset or paid to transfer the liability in an orderly
transaction between independent market participants at the measurement date.
The Group uses widely recognized valuation techniques and models (including net present
value models and comparisons with similar instruments for which market observable prices
exist) for determining the fair value of common, simple financial instruments that use only
observable market data and require little management judgement and estimation. Observable
prices or model inputs (including risk-free and benchmark interest rates and credit spreads
used in estimating discount rates, bond and equity prices, foreign currency exchange rates,
equity and equity index prices and expected price volatilities and correlations) are usually
available in the market for listed debt and equity securities, exchange-traded derivatives and
simple over-the-counter derivatives. Availability of observable market prices and model inputs
reduces the need for management judgement and estimation and thus reduces the uncertainty
associated with determining fair values. Availability of observable market prices and inputs
varies depending on the products and markets and is prone to changes based on specific
events and general conditions in the financial markets.
SEGMENT REPORTING For the six months ended 30 June 2018
Europe Americas Asia Total
Gross trading income 115,502 188,996 24,147 328,645
Fees related to the trading activities 18,141 12,566 3,664 34,371
Net financial expenses related to the
trading activities 15,483 9,060 2,806 27,349
Net trading income 81,878 167,370 17,677 266,925
Intercompany recharge 84,147 - - 84,147
Total revenue 166,025 167,370 17,677 351,072
Personnel expenses 63,279 19,361 5,039 87,679
Depreciation of property and
equipment 2,276 992 664 3,932
Amortization of intangible assets 160 8 27 195
Write off of (in) tangible assets - 82 - 82
Intercompany recharge - 81,159 2,988 84,147
Other expenses 10,364 10,803 4,775 25,942
Operating expenses 76,079 112,405 13,493 201,977
Operating result 89,946 54,965 4,184 149,095
Result of equity-accounted investees 3,154 (74) - 3,080
Profit before tax 93,100 54,891 4,184 152,175
Tax expense 12,534 12,059 740 25,333
Profit for the period 80,566 42,832 3,444 126,842
Assets 343,053 99,907 36,303 479,263
Liabilities 77,135 27,363 6,671 111,169
5. Fair values of financial instruments
Fair values have been determined for measurement and/or disclosure purposes based on the
following methods. When applicable, further information about the assumptions made in
determining fair values is disclosed in the notes specific to that asset or liability.

FLOW TR ADERS | HALF YEAR REPORT 2019 23
Results of these reconciliation processes are communicated and agreed with Heads of Trading,
the Risk and Mid-Office department and the Management Board on a daily basis.
a) Financial assets and liabilities held for trading
The Group mainly trades on regulated and active markets. The financial assets and liabilities
held for trading are carried at fair value, based whenever possible on quoted market prices,
as published by exchanges, market data vendors and prime brokers.
The valuation of trading positions, both the long and the short positions, is determined by
reference to last traded prices from similar instruments from the exchanges at the reporting
date. Such financial assets and liabilities are classified as Level 1.
A substantial part of the financial assets and liabilities held for trading which are carried at fair
value are based on theoretical prices which can differ from quoted market prices.
The theoretical prices reflect price adjustments primarily caused by the fact that the Group
continuously prices its financial assets and liabilities based on all available information.
This includes prices for identical and near-identical positions, as well as the prices for securities
underlying the Group’s positions, on other exchanges that are open after the exchange on
which the financial asset or liability is traded closes. The Group’s Risk and Mid-Office
department checks the theoretical price independently. As part of Its review, It monitors
whether all price adjustments can be substantiated with market inputs. Consequently,
such financial assets and liabilities are classified as Level 2.
For offsetting (delta neutral) positions, the Group uses mid-market prices to determine fair
value.
b) Investments fair value through OCI
The fair value of Investments fair value through OCI is determined by reference to their quoted
closing bid price at the reporting date, or if unquoted, determined using a valuation technique
and are classified as Level 2.
c) Other receivables
The carrying value of other receivables with a maturity of less than one year is assumed to
approximate their fair values.
When the Group measures portfolios of financial assets and financial liabilities on the basis of
net exposures to market risks, it applies judgement in determining appropriate portfolio-level
adjustments such as bid-ask spreads. Such adjustments are derived from observable bid-ask
spreads for similar instruments and adjusted for factors specific to the portfolio. Similarly,
when the Group measures portfolios of financial assets and financial liabilities on the basis of
net exposure to the credit risk of a particular counterparty, it takes into account any existing
arrangements that mitigate the credit risk exposure (e.g. master netting agreements with the
counterparty).
Valuation framework
The Group has a control framework with respect to the measurement of fair values.
This framework includes a Risk and Mid-Office department which is independent of the Trading
department and reports directly to the Management Board. The Risk and Mid-Office
department has overall responsibility for independently verifying the results of trading and all
significant fair value measurements. The daily reconciliation of the positions and prices
between the prime brokers and the Trading department is most important.
The prime brokers of the Group provide electronic position statements on a daily basis, which
are uploaded automatically into the Group’s databases. The Group and its prime brokers agreed
when files will be available and methods for transmission and communication. All data is
normalized by the Group so it can be used in multiple internal systems. The information is
mainly used for daily independent reconciliation of positions and prices, resulting in profit and
loss accounts.
The following reconciliations are executed on a daily basis:
◾ Reconciliation of the positions - The Risk and Mid-Office department reconciles the
positions of the Trading department with information provided by the prime brokers.
All differences are reconciled and agreed by the Trading department of the Group and the
prime brokers;
◾ Reconciliation of prices - The Risk and Mid-Office department reconciles prices as
provided by the Trading Department with those of the prime brokers and/or data from
external data vendors. All differences are reconciled and the Risk and Mid-Office
department makes sure that any required follow up action is taken, either by the prime
broker or the Trading department. Therefore, all prices are checked with independent
sources.

FLOW TR ADERS | HALF YEAR REPORT 2019 24
Fair value hierarchy
At 30 June 2019
Level 1 Level 2 Level 3 Total
Long positions in cash market
products 59,909 3,436,029 - 3,495,938
Mark to market derivatives assets - 4,868 - 4,868
Financial assets held for trading 59,909 3,440,897 - 3,500,806
Trading receivables 2,733,027 - - 2,733,027
Investments fair value through OCI - 1,557 - 1,557
Total long positions 2,792,936 3,442,454 - 6,235,390
Short positions in cash market
products 44,708 1,741,523 - 1,786,231
Mark to market derivatives liabilities - - - -
Financial liabilities held for trading 44,708 1,741,523 - 1,786,231
Trading payables 4,083,337 - - 4,083,337
Total short positions 4,128,045 1,741,523 - 5,869,568
At 30 June 2018
Level 1 Level 2 Level 3 Total
Long positions in cash market
products 172,501 3,668,072 - 3,840,573
Mark to market derivatives assets 6,806 7,021 - 13,827
Financial assets held for trading 179,307 3,675,093 - 3,854,400
Available for sale investments - 1,457 - 1,457
Total long positions 179,307 3,676,550 - 3,855,857
Short positions in cash market
products 20,753 1,670,596 - 1,691,349
Mark to market derivatives liabilities - - - -
Total short positions 20,753 1,670,596 - 1,691,349
Due to the short holding period between acquisition and sale, there are no transfers between
Level 1 and Level 2. There are no Level 3 positions.
Hedge of net investments in foreign operations
Included in financial liabilities held for trading at 30 June 2019 were borrowings of
USD 110,500,000 and USD 10,000,000, which has been designated as a hedge of the net
investments in the United States and Singapore subsidiaries, respectively, which have their
functional currencies in USD. This borrowing is being used to hedge the Group’s exposure to the
USD foreign exchange risk on these investments. Gains or losses on the retranslation of this
borrowing are transferred to OCI to offset any gains or losses on translation of the net
investments in the subsidiaries.
There is an economic relationship between the hedged item and the hedging instrument as the
net investment creates a translation risk that will match the foreign exchange risk on the USD
borrowing. The Group has established a hedge ratio of 1:1 as the underlying risk of the hedging
instrument is identical to the hedged risk component. The hedge ineffectiveness will arise when
the amount of the investment in the foreign subsidiary becomes lower than the amount of the
borrowing.
FLOW TR ADERS | HALF YEAR REPORT 2019 25
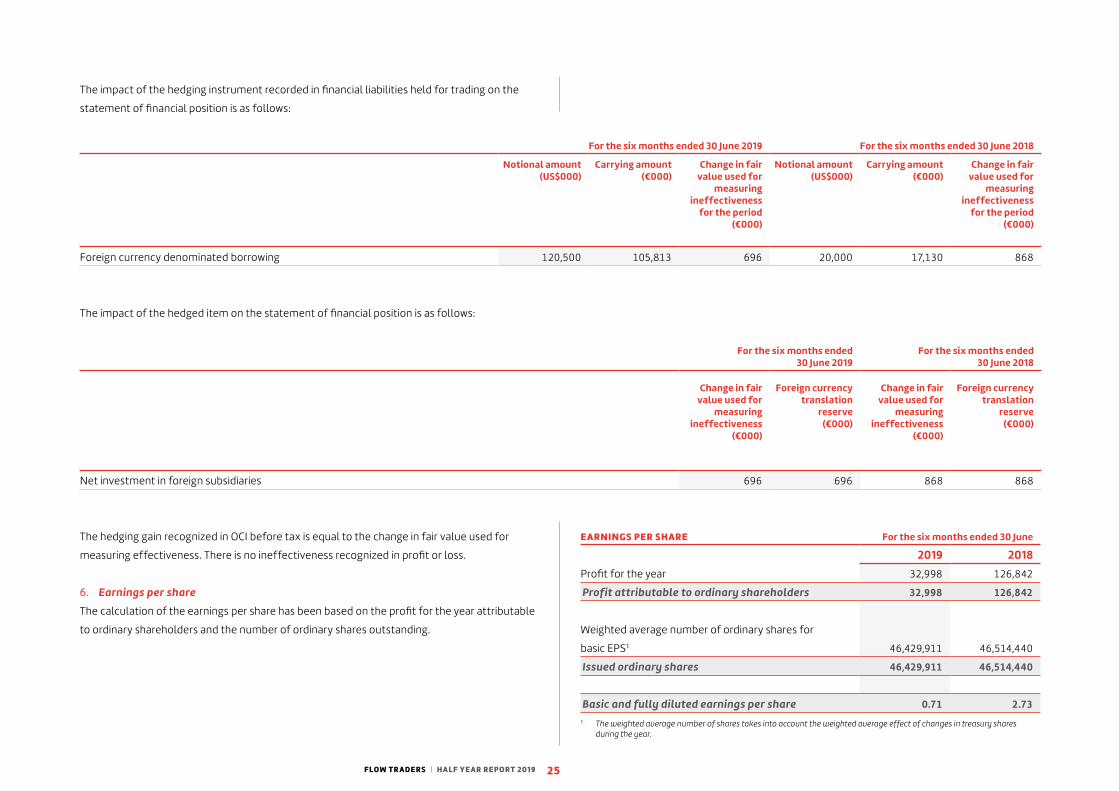
The impact of the hedging instrument recorded in financial liabilities held for trading on the
statement of financial position is as follows:
For the six months ended 30 June 2019 For the six months ended 30 June 2018
Notional amount (US$000)
Carrying amount (€000)
Change in fair value used for
measuring ineffectiveness
for the period (€000)
Notional amount (US$000)
Carrying amount (€000)
Change in fair value used for
measuring ineffectiveness
for the period (€000)
Foreign currency denominated borrowing 120,500 105,813 696 20,000 17,130 868
The impact of the hedged item on the statement of financial position is as follows:
For the six months ended 30 June 2019
For the six months ended 30 June 2018
Change in fair value used for
measuring ineffectiveness
(€000)
Foreign currency translation
reserve (€000)
Change in fair value used for
measuring ineffectiveness
(€000)
Foreign currency translation
reserve (€000)
Net investment in foreign subsidiaries 696 696 868 868
The hedging gain recognized in OCI before tax is equal to the change in fair value used for
measuring effectiveness. There is no ineffectiveness recognized in profit or loss.
6. Earnings per share
The calculation of the earnings per share has been based on the profit for the year attributable
to ordinary shareholders and the number of ordinary shares outstanding.
EARNINGS PER SHARE For the six months ended 30 June
2019 2018Profit for the year 32,998 126,842
Profit attributable to ordinary shareholders 32,998 126,842
Weighted average number of ordinary shares for
basic EPS1 46,429,911 46,514,440
Issued ordinary shares 46,429,911 46,514,440
Basic and fully diluted earnings per share 0.71 2.731 The weighted average number of shares takes into account the weighted average effect of changes in treasury shares
during the year.
FLOW TR ADERS | HALF YEAR REPORT 2019 26
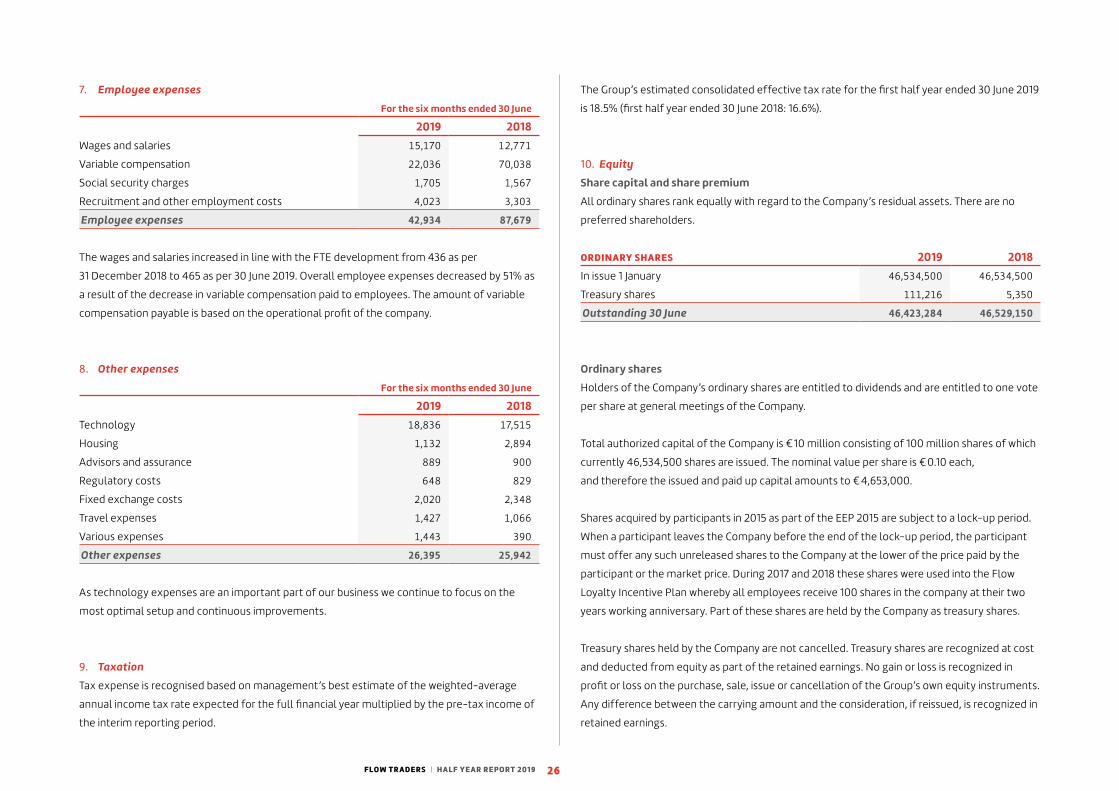
The Group’s estimated consolidated effective tax rate for the first half year ended 30 June 2019
is 18.5% (first half year ended 30 June 2018: 16.6%).
10. Equity
Share capital and share premium
All ordinary shares rank equally with regard to the Company’s residual assets. There are no
preferred shareholders.
ORDINARY SHARES 2019 2018In issue 1 January 46,534,500 46,534,500
Treasury shares 111,216 5,350
Outstanding 30 June 46,423,284 46,529,150
Ordinary shares
Holders of the Company’s ordinary shares are entitled to dividends and are entitled to one vote
per share at general meetings of the Company.
Total authorized capital of the Company is € 10 million consisting of 100 million shares of which
currently 46,534,500 shares are issued. The nominal value per share is € 0.10 each,
and therefore the issued and paid up capital amounts to € 4,653,000.
Shares acquired by participants in 2015 as part of the EEP 2015 are subject to a lock-up period.
When a participant leaves the Company before the end of the lock-up period, the participant
must offer any such unreleased shares to the Company at the lower of the price paid by the
participant or the market price. During 2017 and 2018 these shares were used into the Flow
Loyalty Incentive Plan whereby all employees receive 100 shares in the company at their two
years working anniversary. Part of these shares are held by the Company as treasury shares.
Treasury shares held by the Company are not cancelled. Treasury shares are recognized at cost
and deducted from equity as part of the retained earnings. No gain or loss is recognized in
profit or loss on the purchase, sale, issue or cancellation of the Group’s own equity instruments.
Any difference between the carrying amount and the consideration, if reissued, is recognized in
retained earnings.
7. Employee expenses
For the six months ended 30 June
2019 2018Wages and salaries 15,170 12,771
Variable compensation 22,036 70,038
Social security charges 1,705 1,567
Recruitment and other employment costs 4,023 3,303
Employee expenses 42,934 87,679
The wages and salaries increased in line with the FTE development from 436 as per
31 December 2018 to 465 as per 30 June 2019. Overall employee expenses decreased by 51% as
a result of the decrease in variable compensation paid to employees. The amount of variable
compensation payable is based on the operational profit of the company.
8. Other expenses
For the six months ended 30 June
2019 2018Technology 18,836 17,515
Housing 1,132 2,894
Advisors and assurance 889 900
Regulatory costs 648 829
Fixed exchange costs 2,020 2,348
Travel expenses 1,427 1,066
Various expenses 1,443 390
Other expenses 26,395 25,942
As technology expenses are an important part of our business we continue to focus on the
most optimal setup and continuous improvements.
9. Taxation
Tax expense is recognised based on management’s best estimate of the weighted-average
annual income tax rate expected for the full financial year multiplied by the pre-tax income of
the interim reporting period.

FLOW TR ADERS | HALF YEAR REPORT 2019 27
ON- AND OFF-BALANCE SHEET LIABILITY AMOUNTS
2020 2021 2022 2023 2024
Cash incentive plan 2017 561 561 561 561 –
Cash incentive plan 2018 1,683 1,683 1,683 1,683 –
Cash incentive plan 2019 421 421 421 421 421
12. Group companies
SUBSIDIARIES Country of incorporation
Ownership interest
2019 2018Flow Traders Holding B.V. Netherlands 100% 100%
Flow Traders B.V. Netherlands 100% 100%
Flow Traders Technologies B.V. Netherlands 100% 100%
INIT Capital B.V.* Netherlands 100% -
Flow Traders Asia Pte. Ltd. Singapore 100% 100%
Flow Traders Hong Kong Ltd Hong Kong 100% 100%
Flow Traders Hong Kong Services Ltd* Hong Kong 100% -
Flow Traders U.S. Holding LLC United States of
America
100% 100%
Flow Traders U.S. LLC United States of
America
100% 100%
Flow Traders U.S. Institutional Trading
LLC
United States of
America
100% 100%
Flow Traders Technologies SRL Romania 100% 100%
* The Company incorporated these wholly-owned subsidiaries in 2019.
Significant restrictions
The Group does not have significant restrictions on its ability to access or use its assets and
settle its liabilities other than those resulting from the supervisory frameworks within which its
subsidiaries operate.
Related party transactions
No material related party transactions have taken place in the first six months of the year.
Currency translation reserve
The translation reserve comprises all foreign currency differences arising from the translation
of the financial statements of foreign operations. This also includes the hedge results.
Revaluation reserve
The revaluation reserve comprises the fair value movements on all Investments fair value
through OCI of the Group.
Interim dividends
It is proposed that an interim cash dividend of € 0.35 per share will be paid out to shareholders
for the financial year 2019, subject to 15% dividend withholding tax.
11. Other contingent liabilities
Claims
The Group is not involved in any significant and material legal procedures and/or claims and
there are no other contingent liabilities.
Fiscal unity
The Group constitutes a fiscal unity with its fully owned Dutch subsidiaries for Dutch income
tax purposes. Moreover, Flow Traders B.V. forms part of a fiscal unity for VAT purposes,
covering part of the Dutch Group. All companies in the fiscal unity are jointly and severally
liable for the tax obligations of the fiscal unity.
Cash incentive provided to employees
As explained in our remuneration policy and the Management Board report of the Company’s
annual report of 2018, our employees have the possibility to participate in an employee equity
plan and are eligible to a cash incentive depending on their share position in the company.
One of the conditions for this cash incentive is that the employee needs to be employed at the
Company at the time of the payment of the cash incentive. Payments will be made in the first,
second, third, fourth and fifth year of the plan. Based on IAS 19, it is not possible to record any
costs in relation to the cash incentive as long as the employee did not provide the service.
Therefore these costs will be recognized in the coming years in profit and loss.

FLOW TR ADERS | HALF YEAR REPORT 2019 28
Subsequent events
No material subsequent events have occurred since 30 June 2019 that require recognition or
disclosure in this year’s financial statements.
FLOW TR ADERS | HALF YEAR REPORT 2019 29
Review report
To: the supervisory board, the management board and shareholders of Flow Traders N.V.
Introduction
We have reviewed the accompanying condensed consolidated interim financial statements of
Flow Traders N.V., Amsterdam, that comprise the condensed consolidated statement of
financial position as at 30 June 2019, the condensed consolidated statements of profit and loss
and other comprehensive income, changes in equity and cash flows for the six-month period
then ended, and the notes, comprising a summary of the significant accounting policies and
other explanatory information. Management is responsible for the preparation and presen-
tation of these condensed consolidated interim financial statements in accordance with IAS 34,
“Interim Financial Reporting”, as adopted by the European Union. Our responsibility is to
express a conclusion on these condensed consolidated interim financial statements based on
our review.
Scope
We conducted our review in accordance with Dutch law, including Standard 2410, “Review of
Interim Financial Information Performed by the Independent Auditor of the Entity”. A review of
interim financial information consists of making inquiries, primarily of persons responsible for
financial and accounting matters, and applying analytical and other review procedures. A review
is substantially less in scope than an audit conducted in accordance with Dutch auditing
standards and, consequently, does not enable us to obtain assurance that we would become
aware of all significant matters that might be identified in an audit. Accordingly, we do not
express an audit opinion.
Conclusion
Based on our review, nothing has come to our attention that causes us to believe that the
accompanying condensed consolidated interim financial statements as at and for the
six-month period ended 30 June 2019 are not prepared, in all material respects, in accordance
with IAS 34, “Interim Financial Reporting”, as adopted by the European Union.
The Hague, 23 July 2019
Ernst & Young Accountants LLP
signed by T. de Kuijper

The forward-looking statements contained in this document are based on assumptions, beliefs and expectations that we have made in light of our experience in the industry, as well as our perceptions of historical trends, current conditions, expected future developments and other factors we believe are appropriate under the circumstances. Although we believe that the expectations reflected in such forward-looking statements are reasonable at this time, we cannot assure you that such expectations will prove to be correct. Given the risks and uncertainties associated with forward-looking statements, you are cautioned not to place undue reliance on such forward-looking statements.
Such forward-looking statements speak only as of the date on which they are made. Accordingly, other than as required by applicable law or the rules of the stock exchange on which our securities are listed, we do not undertake any obligation to update or revise any of them, whether as a result of new information, future events or otherwise. Any forward-looking statements should not be regarded as a representation or warranty by us or any other person with respect to the achievement of the results set out in such statements or that the underlying assumptions used will in fact be the case. If any of these risks and uncertainties materialize, or if any of our underlying assumptions prove to be incorrect, our actual results of operations or financial condition could differ materially from that described herein as anticipated, believed, estimated or expected.
Statements regarding the market, industry and trends, including the FX market and development in ETP Assets under Management in certain markets, ETP value traded in certain markets and Flow Traders’ competitive position are based on outside data and sources.
This document contains “forward-looking statements” which relate to, without limitation, our plans, objectives, strategies, future operational performance, and anticipated developments in the industry in which we operate. These forward-looking statements are characterized by words such as “anticipate”, “estimate”, “believe”, “intend”, “plan”, “predict”, “may”, “will”, “would”, “should”, “continue”, “expect” and similar expressions, but these expressions are not the exclusive means of identifying such statements. Such forward-looking statements involve known and unknown risks, uncertainties and other important factors that could cause circumstances or our actual results, performance or achievements to be materially different from any future circumstances, results, performance or achievements expressed or implied by such statements. Such factors include, among other things, reduced levels of overall trading volume and lower margins; dependence upon prime brokers, ETP issuers, trading counterparties, CCPs and custodians; losing access to an important exchange or other trading venue; occurrence of a systemic market event; incurrence of trading losses; failures or disruption of our trading platform or our or third-party technical infrastructure; risks associated with operational elements of our business and trading generally; ineffective risk management systems, processes and strategies; intense competition in our business; dependence on continued access to sources of liquidity; capacity constraints of computer and communications systems; dependence on third-party software, infrastructure or availability of certain software systems; damage to our reputation and the reputation of our industry; loss of key staff or failure to attract and retain other highly skilled professionals; changes to applicable regulatory requirements; compliance with applicable laws and regulatory requirements, including those specific to our industry; enhanced media and regulatory attention and its impact upon public perception of us or of companies in our industry; and other risks.

Flow Traders N.V.
Jacob Bontiusplaats 9
1018 LL Amsterdam
The Netherlands
Tel: +31 20 799 6799
www.flowtraders.com