half year results for the period ended 30 june 2016* · announces its half year results for the...
TRANSCRIPT

FOR IMMEDIATE RELEASE 17 August 2016
The CORE Building, 9th Floor, Ébène CyberCity, Mauritius Tel: +230 464 3250 Fax: +230 464 3255 Website: www.capdrill.com
Capital Drilling Limited
(“Capital Drilling”, the “Group” or “the Company”)
Half-year Results For the period ended 30 June 2016 and Interim Dividend
Capital Drilling Limited (LSE: CAPD), the emerging and developing markets focused drilling company, today announces its half year results for the period ended 30 June 2016.
HALF YEAR RESULTS FOR THE PERIOD ENDED 30 JUNE 2016*
H1 2016 $m
H1 2015 $m
Average Fleet Size (No. of drill rigs) 94 97 Fleet Utilisation (%) 40 34 ARPOR ($) 175,000 189,000 Revenue 41.7 39.0 EBITDA 7.3 7.9 EBIT 0.2 0.6 Net (Loss) Profit After Tax (0.8) (3.2) Cash from operations 7.7 10.3 Earnings per share Basic (cents) (0.6) (2.4) Diluted (cents) (0.6) (2.4) Interim Dividend per share (cents) 1.5 1.1 Net Asset Value per share (cents) 54.5 63.2 Return On Capital Employed (%)** (6.4) 0.5 Return on Total Assets (%)** (5.1) 0.4 Net Cash 7.0 2.2 Net Cash to Equity (%) 9.5 2.5
* All amounts are in USD unless otherwise stated ** Twelve months rolling average
Financial Overview • First half revenue 5.0% higher at $41.7 million compared to H2 2015 of $39.7 million (H1 2015: $39.0 million) • Continued strength in net cash generated from operations of $7.7 million • Operating cash flow margin of 18.6% (H1 2015: 26.5%) • Cash reserves increased to $14.2 million at 30 June 2016 from $13.4 million at 31 December 2015 • Net cash of $7.0 million compared to $8.3 million at 31 December 2015 (H1 2015: $2.2 million) • Final dividend in relation to the 2015 financial year of $3.4 million paid during H1 2015 (H1 2014: $2.6 million) • Interim dividend up 36% to 1.5 cents per share to be paid on 7th October 2016 (2015: Interim dividend of 1.1 cents
per share paid on 9 October 2015)
Operational & Strategic Overview • New contracts awarded in H1 2016 include:
» Alexander Nubia, Egypt: 1 diamond rig, commenced March » Algold, Mauritania: 1 multi-purpose rig, commenced May » OreCorp Limited, Mauritania; 1 diamond rig, commenced March » Tanga Resources, Tanzania: 1 multi-purpose rig, commenced April
• H1 utilisation of 40%, up from 34% in H1 2015, on an average fleet size of 94 rigs • H1 Average Revenue per Operating Rig (ARPOR) fell to $175,000 (H1 2015: $189,000) due to the increase in RC
drilling

Page | 2
• Contracts awarded after period end: » RAKITA Exploration (part of the Freeport McMoran Company), Serbia: 4 deep hole exploration directional
drilling rigs, commenced early August » Ascom Mining, Ethiopia: 2 diamond rigs, commenced July » Resolute, Mali: 1 diamond rig, commenced July
• Purchase and delivery of two new deep hole exploration rigs to support the RAKITA contract
Outlook • Trading conditions continue to show positive signs of improvement, resulting in increased tendering • Strengthening gold price and increasing interest in the resources sector by global capital markets • Long-term core production and grade control contracts in Egypt and Tanzania continue to diversify and underpin
performance • Increasing exploration activity for new contracts and success with the Lean Operating Model generated additional
revenue in Q2 and improving exploration fleet utilisation
Health & Safety • Previously announced World Class Achievement for Tanzania (Geita Gold Mine) which achieved 9 Years LTI free in
April 2016, and other achievements of world class safety milestones, including: » Tanzania (Mwanza Support Facility) achieved 8 years LTI free in January 2016 » Mauritania (Tasiast Project) achieved 5 years LTI free in February 2016 » Botswana (Cupric Project) achieved 1 year LTI free in March 2016
Financials
Statement of Financial Position Data
H1 2016 $
FY 2015 $
Statement of Cash Flow Data H1 2016 $
H1 2015 $ $m $m $m $m
Non-Current Assets 46.6 49.7 Operating cash flows before working capital changes 8.1 8.1 Current Assets 46.3 45.7 Adjustments for working capital changes (0.3) 2.2 Total Assets 92.9 95.4 Cash from operations 7.8 10.3 Non-Current Liabilities 7.4 5.2 Finance charges (0.1) (0.5) Current Liabilities 12.1 13.5 Taxation (1.3) (0.2) Total Liabilities 19.5 18.7 Net cash generated from operating activities 6.4 9.6 Equity 73.4 76.7 Investing Activities Cash 14.2 13.4 Net cash used in investing activities (3.8) (4.3) Debt 7.2 5.1 Financing Activities Net Cash 7.0 8.3 Movement in long term liabilities 2.0 (2.0) Dividend paid (3.4) (2.6) Net cash used in financing activities (1.4) (4.6) Net increase (decrease) in cash 1.2 0.7 Opening cash balance 13.4 13.4 FX on cash (0.4) (0.4)
Closing cash balance 14.2 15.2
Commenting on the results, Mark Parsons, CEO of Capital Drilling, said: “The increasing interest from the mining industry, particularly over the last few months, to invest in assets combined with the firming of selected metal pricing, has injected some momentum in tendering for new contracts as well higher demand from existing clients for the Group’s drilling solution services. The combination of deploying our Lean Operating Model in a steadily improving market environment, particularly the gold industry, our largest market segment, has seen utilization of our exploration rigs improve in line with our growth strategy. Our focus on geographic expansion has also been successful with projects awarded and mobilized in Mali, West Africa, Serbia in Europe, and re-entry into Ethiopia.

Page | 3
For the balance of FY16 we will continue to focus on: further geographic and underground expansion in emerging markets; building on our operational capability to ensure we are appropriately resourced to manage increasing activity levels; diligently managing our costs and providing excellence across a full range of drilling services. We have a highly competitive operational model, diversified long-term contracts, a strong balance sheet, and a progressive dividend policy – Capital Drilling remains confident that it can continue to leverage its position in what appears to be a sustainable upswing in our core markets.” Capital Drilling will host a conference call on Wednesday 17 August at 9am (London, UK time) to update investors and analysts on its results. Participants may join the call by dialling one of the following numbers, approximately 10 minutes before the start of the call. A copy of the Company’s presentation will be available on www.capdrill.com. UK and International dial in: +44 (0)203 043 2014 ID Number: 832337 For further information, please visit Capital Drilling’s website www.capdrill.com or contact: Capital Drilling Limited +230 464 3250 Jamie Boyton, Chairman [email protected] Mark Parsons, Chief Executive Officer finnCap +44 (0)20 7220 0500 Christopher Raggett, Corporate Finance Joanna Scott/Tim Redfern, Corporate Broking Buchanan +44 (0)20 7466 5000 Bobby Morse [email protected] Gemma Mostyn-Owen About Capital Drilling Capital Drilling provides specialised drilling services to mineral exploration and mining companies in emerging and developing markets, for exploration, development and production stage projects. The Company currently owns and operates a fleet of 94 drilling rigs with established operations in Botswana, Chile, Egypt, Ethiopia, Mali, Mauritania, Serbia and Tanzania.

Page | 4
Chief Executive Officer Review
Market conditions over the first half of 2016 remain encouraging for Capital Drilling and suggest a sustained cyclical upswing. Improved conditions are generating additional exploration drilling project opportunities, which are expanding both in size and duration. Mining companies have also begun to allocate budget expenditure to new brownfield exploration programs. These developments can largely be attributed to the continued confidence in the sustainability of the recovery of the gold price, together with positive movements for copper, nickel and zinc. Capital Drilling also has begun to see the benefits of increased activity as new exploration contracts extend into longer term programs. Improvement in the sector has seen the Company experience half-yearly revenue growth since 2014. A marginal increase was reported in the second half of 2015 as the business stabilized from the historical lows of the industry downturn, with a further 3.4% increase in the first half of this financial year. Group revenue for 1H16 was $41.7 million, up from $39.7 million (2H15) and $39.0 million in 1H15 (up 7.0% on 1H15). Similarly, Capital Drilling has seen incremental increases in its average rig utilization. Utilization for this half was 40%, up from 34% in the first half of 2015 and 35% in the second half. Indeed, Q2 alone this year saw a sharp 22% increase in rig utilisation from Q1 as Capital Drilling delivered on contracts won late in that quarter. All production rigs are fully utilized and focus remains on improving utilization of the exploration fleet. Recently, the Company has been successful in a number of tenders for exploration and delineation projects. Average revenue per operating rig (ARPOR) was down on the previous half due to an increase in reverse circulation (RC) drilling. This type of exploration drilling traditionally yields intermittent revenues due to the stop/start nature through the month resulting in lower overall revenue than production or diamond drilling, in turn negatively impacting ARPOR. Despite this decrease, gross profit margins were successfully maintained due to the Lean Operating Model. As a result of the upswing of the market, the Group has been preparing its stacked exploration fleet to meet its stringent Drilling Equipment Standard (DES) and ensuring it is operationally ready. The DES provides minimum standards to consistently improve productivity and ensure safe operating conditions on site. Greater exploration activity has also increased expenditure on mobilization, customs and duties in the first half. Operational Delivery In the first quarter of 2015, the Group implemented its Lean Operating Model to combat the competitive exploration and delineation markets. This approach continues to deliver benefits, with the award of several new contracts in 1H16 increasing utilization of the exploration fleet. New contracts awarded over the period include: Contracts awarded in H1 2016:
» Alexander Nubia, Egypt: 1 diamond rig, commenced March » Algold, Mauritania: 1 multi-purpose rig, commenced May » OreCorp Limited, Mauritania; 1 diamond rig, commenced March » Tanga Resources, Tanzania: 1 multi-purpose rig, commenced April
Contracts awarded after period end: » RAKITA Exploration (part of the Freeport McMoran Company), Serbia: 4 deep hole exploration directional
drilling rigs, commenced early August » Ascom Mining, Ethiopia: 2 diamond rigs, mobilised on June, commenced in July » Resolute, Mali: 1 diamond rig, mobilised in June, commenced in July
Capital Drilling’s long-term core production contracts in Egypt (Centamin’s Sukari Gold Mine) and Tanzania (AngloGold Ashanti’s Geita Gold Mine) continue to underpin performance, providing a stable revenue base for the Group. Additionally, the new Blast Hole and Grade Control contract at Acacia’s North Mara Gold Mine is performing well and has diversified the long-term core production contract portfolio.

Page | 5
The Company is operating a fleet of 94 rigs, a significant investment that positions it well to capitalize on improving market conditions. All production rigs are fully utilized on long term contracts - focus for the remainder of 2016 will be on improving utilization of the exploration fleet using the Lean Operating Model. We are already seeing the rewards of this and a benefit from the upswing in the mining industry as a whole as the Company won four new exploration contracts in H1 and three more post-period end. Quality, Health and Safety Capital Drilling continues to focus on developing an overarching safety culture throughout the organization. Driven by the Executive Leadership Team (ELT), visible safety leadership across the company is considered of paramount importance. Capital Drilling is also pleased to report there were no lost time injuries (LTIs) or significant incidents during the start-up of its production contract in North Mara or its other lean operating projects in Mauritania, Egypt, Ethiopia and Mali. Other significant health and safety achievements for the half as previously announced include: Nine years LTI free at the Geita Gold Mine in Tanzania, April 2016; Eight years LTI free at the Mwanza Support Facility in Tanzania, January 2016; Five years LTI at the Tasiast Gold Mine in Mauritania, February 2016; and One year LTI at the new Khoemacau Copper Project in Botswana, March 2016. Capital Drilling is continually upgrading its fleet to ensure it meets the company’s DES to enable consistently high productivity and safe operating conditions and to mitigate potential risks to employees or other personnel on site. Dividends The Directors have declared an increased interim dividend of US1.5 cents per share for the first half of 2016 versus US1.1 cents per share in H1 2015, a rise of over 36%. This interim dividend will be paid on 7th October 2016 to shareholders on the Record Date of 9th September 2016. The Company’s shares will be ex-dividend on 8th September 2016. As announced to the market previously, the company paid a final dividend of US2.5 cents per share for the 2015 financial year on 6th May 2016. Outlook The increased gold price is expected to generate additional exploration opportunities and it is encouraging that these opportunities are traditionally larger in size and longer in duration. Capital Drilling’s exploration rig utilization is expected to continue its gradual upward trend of 1H16 as a result of anticipated growth in the exploration market. New contracts awarded in the first half and delivered in Q2 and Q3 are expected to have a positive impact on revenue in the current half of the year. Capital Drilling forecasts an incremental uplift in FY16 revenue to $88.0 - $90.0 million, together with a material increase in EBITA in the second half despite the increased capital expenditure anticipated during the period as we gear up for projects in 2017. For the balance of the 2016 financial year, Capital Drilling will continue to focus on growing its existing exploration projects throughout their lifecycles into prefeasibility, delineation and potential production. The Company also expects to grow its production contracts as expansion projects come on line and budgets are approved.

Page | 6
Maturing open pit mines continue to trend towards underground operations, therefore Capital Drilling’s strategy of expanding its underground capacity remains sounds. The Company’s agreement with Pybar, a leading underground service provider, to co-market their services for underground hard rock mining contracts in Africa aligns with this strategy. Geographically, the Company will continue to focus on expansion in West Africa and Serbia to position it for potential copper price increases. It will also remain focused on disciplined cost management across its operations, generating solid cash flows and maintaining a strong balance sheet. Capital Drilling’s strong balance sheet, diversified long-term contracts, highly competitive operating model and expanding capabilities place the Company in an excellent position to benefit from improving market conditions. The Company remains committed to rewarding shareholders through its dividend policy while maintaining a strong balance sheet. Mark Parsons Chief Executive Officer 17 August 2016
Cautionary note regarding forward looking statements
Certain information contained in this report, including any information on Capital Drilling’s plans or future financial or operating performance and other statements that express management’s expectations, or estimates of future performance, constitute forward-looking statements. Such statements are based on a number of estimates and assumptions that, while considered reasonable by management at the time, are subject to significant business, economic and competitive uncertainties, which remain unchanged from those disclosed in our Prospectus. Capital Drilling cautions that such statements involve known and unknown risks, uncertainties and other factors that may cause the actual financial results, performance or achievements of Capital Drilling to be materially different than the Company’s estimated future results, performance or achievements expressed or implied by those forward-looking statements. These factors include the inherent risks involved in exploration and development of mineral properties, changes in economic conditions, changes in the worldwide price of commodities and project execution delays, many of which are beyond the control of Capital Drilling. Nothing in the report should be construed as either an offer to sell or a solicitation to buy or sell Capital Drilling securities.

Page | 7
Independent review report on the condensed consolidated interim financial statements To the members of Capital Drilling Limited We have been engaged by the Capital Drilling Limited (“Company”) to review the condensed consolidated set of interim financial statements in the half-yearly financial report for the six months ended 30 June 2016 which comprises the condensed consolidated statement of financial position as of 30 June 2016 and the related condensed consolidated statements of comprehensive income, changes in equity and cash flows for the six month period then ended, and related notes 1 to 15. We have read the other information contained in the half-yearly financial report and considered whether it contains any apparent misstatements or material inconsistencies with the information in the condensed consolidated set of interim financial statements. This report is made solely to the Company in accordance with International Standard on Review Engagements 2410 “Review of Interim Financial Information Performed by the Independent Auditor of the Entity” issued by the International Auditing and Assurance Standards Board (“IAASB”). Our work has been undertaken so that we might state to the Company those matters we are required to state to it in an independent review report and for no other purpose. To the fullest extent permitted by law, we do not accept or assume responsibility to anyone other than the Company, for our review work, for this report, or for the conclusions we have formed.
Directors’ responsibilities The half-yearly financial report is the responsibility of, and has been approved by, the directors. The directors are responsible for preparing the half-yearly financial report in accordance with the Disclosure and Transparency Rules of the United Kingdom’s Financial Conduct Authority. As disclosed in note 1, the annual consolidated financial statements of the Company are prepared in accordance with International Financial Reporting Standards as issued by the International Accounting Standards Board (the “IASB”). The condensed consolidated interim financial statements included in this half-yearly financial report have been prepared in accordance with International Accounting Standard 34, “Interim Financial Reporting” issued by the IASB. Our responsibility Our responsibility is to express to the Company a conclusion on the condensed consolidated set of interim financial statements in the half-yearly financial report based on our review. Scope of Review We conducted our review in accordance with International Standard on Review Engagements 2410 “Review of Interim Financial Information Performed by Independent Auditor of the Entity” issued by the IAASB. A review of interim financial information consists of making inquiries, primarily of persons responsible for financial and accounting matters, and applying analytical and other review procedures. A review is substantially less in scope than an audit conducted in accordance with International Standards on Auditing and consequently does not enable us to obtain assurance that we would become aware of all significant matters that might be identified in an audit. Accordingly, we do not express an audit opinion.

Page | 8
Conclusion Based on our review, nothing has come to our attention that causes us to believe that the condensed consolidated set of interim financial statements in the half-yearly financial report for the six months ended 30 June 2016 is not prepared, in all material respects, in accordance with International Accounting Standard 34 as issued by the IASB and the Disclosure and Transparency Rules of the United Kingdom’s Financial Conduct Authority.
Deloitte & Touche Registered Auditors Per: H. Loonat Partner 17 August 2016 Deloitte & Touche Registered Auditors Audit – Gauteng www.deloitte.com
Buildings 1 and 2 Deloitte Place The Woodlands Woodlands Drive Woodmead Sandton Private Bag X6 Gallo Manor 2052 South Africa Docex 10 Johannesburg Tel: +27 (0)11 806 5000 Fax: +27 (0)11 806 5111
Riverwalk Office Park, Block B 41 Matroosberg Road Ashlea Gardens X6 Pretoria, 0081 PO Box 11007 Hatfield 0028 South Africa Docex 6 Pretoria Tel: +27 (0)12 482 0000 Fax: +27 (0)12 460 3633
National Executive: *LL Bam Chief Executive Officer *TMM Jordan Deputy Chief Executive Officer *MJ Jarvis Chief Operating Officer *GM Pinnock Audit *N Sing Risk Advisory *NB Kader Tax TP Pillay Consulting S Gwala BPaaS *K Black Clients & Industries *JK Mazzocco Talent & Transformation *MJ Comber Reputation & Risk *TJ Brown Chairman of the Board A full list of partners and directors is available on request *Partner and Registered Auditor B-BBEE rating: Level 2 contributor in terms of the Chartered Accountancy Profession Sector Code Associate of Deloitte Africa, a Member of Deloitte Touche Tohmatsu Limited

Page | 9
CAPITAL DRILLING LIMITED CONDENSED CONSOLIDATED STATEMENT OF COMPREHENSIVE INCOME For the six months ended 30 June 2016 Reviewed Reviewed Notes 30 June 2016 30 June 2015 $ $ Revenue 41,714,801 38,952,636 Cost of sales (28,982,615) (25,523,338) Gross profit 12,732,186 13,429,298 Administration costs (5,402,327) (5,550,683) Depreciation (7,089,799) (7,302,353) Profit from operations 240,060 576,262 Net gain on financial assets at fair value through profit or loss 745,426 - Interest income 6,763 51,140 Share of income (losses) from associate 9,587 (101,109) Finance charges (253,477) (491,025) Profit before taxation 748,359 35,268 Taxation 3 (1,588,416) (3,231,984) Loss for the period (840,057) (3,196,716) Other comprehensive (loss) income: Other comprehensive (loss) income to be reclassified to profit or loss in subsequent periods:
Exchange differences on translation of foreign operations (186) (138,749) Net fair value income (loss) on available-for-sale financial assets 780,605 (58,305) Total comprehensive loss for the period (59,638) (3,393,770) - Loss per share: Basic (cents per share) 4 (0.6) (2.4) Diluted (cents per share) 4 (0.6) (2.4)

Page | 10
CAPITAL DRILLING LIMITED CONDENSED CONSOLIDATED STATEMENT OF FINANCIAL POSITION 30 June 2016 Reviewed Audited Notes 30 June 2016 31 December 2015 $ $ ASSETS
Non-current assets Property, plant and equipment 6 45,478,056 49,114,031 Investment in associate 537,412 528,011 Deferred taxation 592,159 59,842 Total non-current assets 46,607,627 49,701,884 Current assets Inventory 17,258,880 17,576,970 Trade and other receivables 9,347,423 9,044,527 Prepaid expenses and other assets 3,079,797 4,686,905 Taxation 498,487 771,551 Investments 1,965,049 222,032 Cash and cash equivalents 14,174,625 13,369,091 Total current assets 46,324,261 45,671,076 Total assets 92,931,888 95,372,960 EQUITY AND LIABILITIES Equity Share capital 7 13,490 13,460 Share premium 7 21,697,470 21,566,856 Equity-settled employee benefits reserve 337,185 282,075 Foreign currency translation reserve (35,851) (35,665) Investments revaluation reserve 737,055 (43,550) Retained earnings 50,671,012 54,883,674 Total equity 73,420,361 76,666,850 Non-current liabilities Long-term liabilities 8 7,000,000 5,000,000 Deferred taxation 378,567 201,389 Total non-current liabilities 7,378,567 5,201,389 Current liabilities Trade and other payables 10,278,522 12,176,822 Taxation 1,652,233 1,231,898 Current portion of long-term liabilities 8 202,205 96,001 Total current liabilities 12,132,960 13,504,721 Total equity and liabilities 92,931,888 95,372,960

Page | 11
CAPITAL DRILLING LIMITED CONDENSED CONSOLIDATED STATEMENT OF CHANGES IN EQUITY 30 June 2016 Reserves
Share capital
Share premium
Retained earnings
Equity-settled
employee benefits reserve
Foreign currency
translation reserve
Investments revaluation
reserve
Total equity $ $ $ $ $ $ $
Balance at 31 December 2014 - Audited 13,459 21,561,190 69,089,299 205,146 138,749 - 91,007,843
Issue of shares 1 5,666 - (5,667) - - - Recognition of share-based payments - - - 36,255 - - 36,255 Total comprehensive loss for the period - - (3,196,716) - (138,749) (58,305) (3,393,770) Dividends paid (1.9 cents per share) - Note 5 - - (2,557,470) - - - (2,557,470) Balance at 30 June 2015 - Reviewed 13,460 21,566,856 63,335,113 235,734 - (58,305) 85,092,858 Balance at 31 December 2015 - Audited 13,460 21,566,856 54,883,674 282,075 (35,665) (43,550) 76,666,850 Issue of shares 30 130,614 - (130,644) - - - Recognition of share-based payments - - - 185,754 - - 185,754 Total comprehensive loss for the period - - (840,057) - (186) 780,605 (59,638) Dividends paid (2.5 cents per share) - Note 5 - - (3,372,605) - - - (3,372,605) Balance at 30 June 2016 - Reviewed 13,490 21,697,470 50,671,012 337,185 (35,851) 737,055 73,420,361

Page | 12
CAPITAL DRILLING LIMITED CONDENSED CONSOLIDATED STATEMENT OF CASH FLOWS For the six months ended 30 June 2016 Reviewed Reviewed Notes 30 June 2016 30 June 2015 $ $ Operating activities:
Cash from operations 9 7,743,863 10,333,878 Interest received 6,763 51,140 Finance charges paid (147,273) (518,136) Taxation paid (1,250,156) (242,624) Net cash generated from operating activities 6,353,197 9,624,258
Investing activities: Purchase of property, plant and equipment (4,099,402) (3,446,116) Proceeds from disposal of property, plant and equipment 541,238 30,468 Investments (216,986) (290,102) Investment in associate - (607,188) Net cash used in investing activities (3,775,150) (4,312,938)
Financing activities: Long-term liabilities raised 8 2,000,000 - Long-term liabilities repaid 8 - (2,000,000) Dividend paid 5 (3,372,605) (2,557,470) Net cash used in financing activities (1,372,605) (4,557,470)
Net increase in cash and cash equivalents 1,205,442 753,850 Cash and cash equivalents at the beginning of the period 13,369,091 14,743,976 Translation of foreign currency cash and cash equivalent adjustment
(399,908)
(248,565)
Cash and cash equivalents at the end of the period 14,174,625 15,249,261

Page | 13
CAPITAL DRILLING LIMITED NOTES TO THE CONDENSED CONSOLIDATED INTERIM FINANCIAL STATEMENTS For the six months ended 30 June 2016 1. Basis of presentation and accounting policies Preparation of the condensed consolidated interim financial statements The condensed consolidated interim financial statements of Capital Drilling Limited and Subsidiaries
(“Capital Drilling” or the “Group”) as at and for the six months ended 30 June 2016 (the “Interim Financial Statements”) have been prepared in accordance with International Accounting Standard (“IAS”) No. 34, “Interim Financial Reporting”. They should be read in conjunction with the annual consolidated financial statements and the notes thereto in the Group’s Annual Report for the year ended 31 December 2015 which have been prepared in accordance with International Financial Reporting Standards (“IFRS”) as issued by the International Accounting Standards Board (“IASB”). The Interim Financial Statements have been reviewed in terms of ISRE 2410.
Accounting policies The Interim Financial Statements have been prepared on a historical cost basis, except for certain
financial instruments which are measured at fair value. The Group has adopted a number of new standards and interpretations effective on or before 1 January 2016, which were described in note 2 of the consolidated financial statements for the year ended 31 December 2015. The adoption of these standards and interpretations did not have a material impact on the financial statements. The same accounting policies, presentation and methods of computation have been followed in these condensed consolidated interim financial statements as were applied in the preparation of the consolidated financial statements for the year ended 31 December 2015.
The preparation of financial statements in conformity with IFRS recognition and measurement principles
requires the use of estimates and assumptions that affect the reported amounts of assets, liabilities, revenues and expenses. Management reviews its estimates on an on-going basis using currently available information. Changes in facts and circumstances may result in revised estimates and actual results could differ from those estimates.
2. Operations in the interim period Capital Drilling Limited is incorporated in Bermuda. The Group provides drilling services including but
not limited to exploration, development, grade control and blast hole drilling services to mineral exploration and mining companies located in emerging and developing markets. The Group also provides some equipment rental and information technology services to mining and mining related companies.
During the six months ended 30 June 2016, the Group provided drilling services in Botswana, Chile,
Egypt, Mauritania and Tanzania. The seasonality of the Group's operations has no significant impact on the condensed consolidated
interim financial statements. 3. Taxation The tax expense for the period is based on an estimated annual effective tax rate, which requires
management to make its best estimate of annual pre-tax income for the year, in the various tax jurisdictions in which the Group operates. During the year, management regularly updates its estimates based on changes in various factors such as operating profits, plant operating performance and cost estimates, including labour, raw materials, energy and other variable costs.
Due to the tax charge calculations in certain countries in which the Group operates being based on
revenues instead of profits, the consolidated taxation expense for the period is not directly linked to profits and losses.

Page | 14
CAPITAL DRILLING LIMITED NOTES TO THE CONDENSED CONSOLIDATED INTERIM FINANCIAL STATEMENTS For the six months ended 30 June 2016 Reviewed Reviewed 30 June 2016 30 June 2015 $ $ 4. Loss per share Basic loss per share:
The loss and weighted average number of ordinary shares used in the calculation of basic loss per share are as follows:
Loss for the period used in the calculation of basic loss per share
(840,057)
(3,196,716)
Weighted average number of ordinary shares for the purposes of basic loss per share
134,753,539
134,602,839
Loss earnings per share (cents) (0.6)
(2.4)
Diluted loss per share:
The loss used in the calculation of all diluted loss per share
measures are the same as those used in the equivalent basic loss per share measures, as outlined above.
Weighted average number of ordinary shares used in the calculation of basic loss per share
134,753,539
134,602,839
Shares deemed to be issued for no consideration in respect of:
- Dilutive share options # 149,326
17,051 Weighted average number of ordinary shares used in the
calculation of diluted loss per share
134,902,865
134,619,890
Diluted loss per share (cents) (0.6)
(2.4)
# For the purposes of calculating loss per share, diluted weighted average shares outstanding excludes
5.34 million (2015: 5.34 million) potential ordinary shares from share options and share grants, because such potential ordinary shares are anti-dilutive.
5. Dividends During the six months ended 30 June 2016 a dividend of 2.5 cents per ordinary share, totaling $3,372,605
(six months ended 30 June 2015: 1.9 cents per ordinary share, totalling $2,557,470) was declared and paid.
6. Property, plant and equipment During the six months ended 30 June 2016, the Group acquired approximately $4.1 million (2015: $3.4
million) of drilling rigs and other assets to expand its operations and for the replacement of existing assets.

Page | 15
CAPITAL DRILLING LIMITED NOTES TO THE CONDENSED CONSOLIDATED INTERIM FINANCIAL STATEMENTS For the six months ended 30 June 2016 6. Property, plant and equipment (continued) The Group disposed of property, plant and equipment with a net carrying amount of $0.6 million (2015:
$0.1 million) during the period. A loss of $0.1 million (2015: $0.1 million) was incurred on the disposal of property, plant and equipment.
At the end of each reporting period, the Group reviews the carrying amounts of its tangible assets to
determine whether there is any indication that those assets may be impaired. Due to the poor performance of the Group’s share price in 2015 and 2016, the net asset value of the Group exceeded its market capitalisation as at 30 June 2016 and 31 December 2015. The Group identified this circumstance as an indicator of impairment for the current and prior period. As a result, property, plant and equipment was tested for impairment at the reporting date. As at 30 June 2016 and 31 December 2015 management concluded that the carrying amount of property, plant and equipment did not exceed the value in use and therefore, no impairment loss was recognised on that basis.
For purposes of determining the recoverable value of tangible assets, management estimates discount
rates using pre-tax rates that reflect current market rates for investments of similar risk. The rate was estimated from the weighted average cost of capital of companies, which operate a portfolio of assets similar to those of the Group’s assets.
In validating the value in use, key assumptions used in the discounted cash-flow model (such as allocating
all assets to a single cash generating unit discount rates, average revenue rates, drilling volumes and terminal growth rate) management performed a sensitivity analysis to test the resilience of the assumptions used in determining the value in use for the impairment test. Management believe that reasonable movements in key assumptions would not result in an impairment loss to be recognized.
Reviewed Reviewed 30 June 2016 30 June 2015 $ $ 7. Issued capital and share premium Authorised capital 2,000,000,000 (2015: 2,000,000,000) ordinary shares of 0.01
cents (2015: 0.01 cents) each
200,000
200,000 Issued and fully paid: 134,903,396 (30 June 2015: 134,603,681) ordinary shares of
0.01 cents (31 December 2015: 0.01 cents) each
13,490
13,460 Share premium: Balance at the beginning of the period 21,566,856 21,561,190 Share premium on issue of shares 130,614 5,666 Balance at the end of the period 21,697,470 21,566,856 On 1 April 2016, the Company issued 299,715 new common shares pursuant to the Company’s employee
incentive scheme. The shares rank pari passu with the existing common shares.

Page | 16
CAPITAL DRILLING LIMITED NOTES TO THE CONDENSED CONSOLIDATED INTERIM FINANCIAL STATEMENTS For the six months ended 30 June 2016 8. Long term liabilities Long term liabilities consist of an initial $25 million revolving credit facility (“RCF”) provided by Standard
Bank (Mauritius) Limited. The RCF has an annual interest rate of 5.25% above the prevailing three month US$ LIBOR (payable in arrears), and has an annual commitment fee of 1% of the undrawn balance and is available for utilisation up to 2 February 2018 less an annual amortisation of $5 million. In accordance with the terms of the facility, the available amount under the facility reduced by $5 million on 2 February 2016 to $20 million.
Security for the Standard Bank (Mauritius) Limited facilities comprise: • Upward corporate guarantees from Capital Drilling Egypt (Limited Liability Company), Capital Drilling
(T) Limited and Capital Drilling Zambia Limited. • A negative pledge over the assets of Capital Drilling Ltd and Capital Drilling Egypt (Limited Liability
Company). At 30 June 2016 $7 million was outstanding on the RCF, with a further $13 million available for utilisation.
During H1 2016 the Group drew down $2 million on the RCF to finance capital expenditure. As at the reporting date and during the six months under review, the Group has complied with all
covenants that attaches to the loan facility. Reviewed Reviewed 30 June 2016 30 June 2015 $ $ 9. Cash from operations
Profit before taxation 748,359
35,268
Adjusted for:
- Depreciation 7,089,799
7,302,353
- Loss on disposal of property, plant and equipment 104,340
111,441
- Share based payment expense 185,754
36,225
- Exchange differences on translating foreign operations -
(138,697)
- Net gain on financial assets at fair value through profit and loss
(745,426)
-
- Interest received (6,763)
(51,140)
- Finance charges 253,477
491,025
- Share of (gains) losses from associate (9,587)
101,109
- Unrealised foreign exchange loss (gain) on foreign exchange held
399,908
248,565
Operating profit before working capital changes 8,019,861
8,136,149
Adjustments for working capital changes:
- Decrease in inventory 318,090
881,712
- Decrease (increase) in trade and other receivables (302,896)
(270,442)
- Decrease in prepaid expenses and other assets 1,607,108
2,669,294
- Decrease in trade and other payables (1,898,300)
(1,082,835)
7,743,863
10,333,878

Page | 17
CAPITAL DRILLING LIMITED NOTES TO THE CONDENSED CONSOLIDATED INTERIM FINANCIAL STATEMENTS For the six months ended 30 June 2016 10. Segmental analysis
Operating segments are identified on the basis of internal management reports about components of the Group that are regularly reviewed by the chief executive officer, in order to allocate resources to the segments and to assess their performance. Information reported to the Group’s chief executive officer for the purposes of resource allocation and assessment of segment performance is focused on the region of operation. For the purposes of the segmental report, the information on the operating segments has been aggregated into the principal regions of operations of the Group. The Group’s reportable segments under IFRS 8 are therefore:
- Africa: Derives revenue from the provision of drilling services.
- Rest of world: Derives revenue from the provision of drilling services and related logistic, equipment rental and information technology support services.
Information regarding the Group’s operating segments is reported below. At 31 December 2015, management reviewed the composition of the Group's operating segments and the allocations of operations to the reportable segments.
Segment revenue and results:
The following is an analysis of the Group’s revenue and results by reportable segment:
For the six months ended 30 June 2016 Africa Rest of World Consolidated
$ $ $
External revenue 40,361,890 1,352,911 41,714,801
Segmental gross profit 14,128,643 (1,396,457) 12,732,186
Administration costs and depreciation, net of other income (10,557,569)
(1,208,812)
(11,766,381)
Segment profit (loss) 3,571,074
(2,605,269)
965,805
Central administration costs and depreciation, net of other income
-
(725,745)
Profit from operations 240,060
Net gain on financial assets at fair value through profit and loss
745,426
Interest income 6,763
Share of losses from associate 9,587
Finance charges (253,477)
Profit before tax 748,359
For the six months ended 30 June 2015 Africa Rest of World Consolidated
$ $ $
External revenue 38,226,314
726,322
38,952,636
Segmental gross profit 14,426,056
(996,758)
13,429,298
Administration costs and depreciation, net of other income
(10,754,617)
(1,701,883)
(12,456,500)
Segment profit (loss) 3,671,439
(2,698,641)
972,798
Central administration costs and depreciation, net of other income
(396,536)
Profit from operations
576,262
Interest income
51,140
Share of losses from associate
(101,109)
Finance charges
(491,025)
Profit before tax
35,268

Page | 18
CAPITAL DRILLING LIMITED NOTES TO THE CONDENSED CONSOLIDATED INTERIM FINANCIAL STATEMENTS For the six months ended 30 June 2016
Reviewed Reviewed 30 June 2016 30 June 2015 $ $ 10. Segmental analysis (continued) The accounting policies of the reportable segments are the same as the Group’s accounting policies
described in note 1. Segment profit represents the profit earned by each segment without the allocation of central administration costs, depreciation, other income, finance charges, and income tax. This is the measure reported to the Group’s chief executive officer for the purpose of resource allocation and assessment of segment performance.
Segment assets: Africa 121,774,887 147,658,012 Rest of world 14,801,971 78,276,508 Total segment assets 136,576,858 225,934,520 Head office companies 31,726,985 27,464,894 168,303,843 253,399,414 Eliminations * (75,371,955) (146,932,965) Total assets 92,931,888 106,466,449 Segment liabilities: Africa 24,714,022 52,519,206 Rest of world 10,505,807 36,556,661 Total segment liabilities 35,219,829 89,075,867 Head office companies 58,214,814 77,782,321 93,434,643 166,858,188 Eliminations * (73,923,116) (145,484,567) Total liabilities 19,511,527 21,373,621 For the purposes of monitoring segment performance and allocating resources between segments the
Group’s chief executive monitors the tangible, intangible and financial assets attributable to each segment. All assets are allocated to reportable segments with the exception of property, plant and equipment used by the head office companies, certain amounts included in other receivables, and cash and cash equivalents held by the head office companies.
* Eliminations include inter-group accounts receivable, inter-group accounts payable and inter-group
investments. Other segment information: Depreciation Africa 6,105,737 6,151,593 Rest of world 833,078 901,456 Total segment depreciation 6,938,815 7,053,049 Head office companies 150,984 249,304 7,089,799 7,302,353
Page | 19
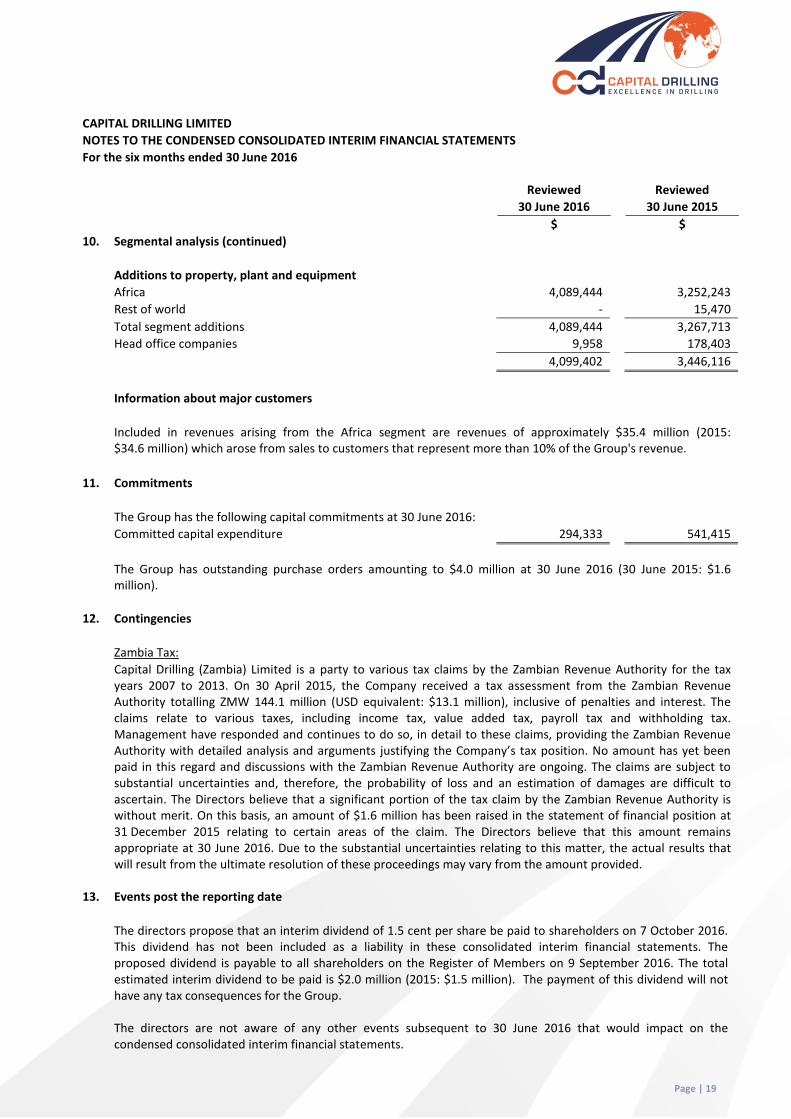
CAPITAL DRILLING LIMITED NOTES TO THE CONDENSED CONSOLIDATED INTERIM FINANCIAL STATEMENTS For the six months ended 30 June 2016 Reviewed Reviewed 30 June 2016 30 June 2015 $ $ 10. Segmental analysis (continued) Additions to property, plant and equipment Africa 4,089,444 3,252,243 Rest of world - 15,470 Total segment additions 4,089,444 3,267,713 Head office companies 9,958 178,403 4,099,402 3,446,116 Information about major customers Included in revenues arising from the Africa segment are revenues of approximately $35.4 million (2015:
$34.6 million) which arose from sales to customers that represent more than 10% of the Group's revenue. 11. Commitments The Group has the following capital commitments at 30 June 2016: Committed capital expenditure 294,333 541,415 The Group has outstanding purchase orders amounting to $4.0 million at 30 June 2016 (30 June 2015: $1.6
million). 12. Contingencies Zambia Tax: Capital Drilling (Zambia) Limited is a party to various tax claims by the Zambian Revenue Authority for the tax
years 2007 to 2013. On 30 April 2015, the Company received a tax assessment from the Zambian Revenue Authority totalling ZMW 144.1 million (USD equivalent: $13.1 million), inclusive of penalties and interest. The claims relate to various taxes, including income tax, value added tax, payroll tax and withholding tax. Management have responded and continues to do so, in detail to these claims, providing the Zambian Revenue Authority with detailed analysis and arguments justifying the Company’s tax position. No amount has yet been paid in this regard and discussions with the Zambian Revenue Authority are ongoing. The claims are subject to substantial uncertainties and, therefore, the probability of loss and an estimation of damages are difficult to ascertain. The Directors believe that a significant portion of the tax claim by the Zambian Revenue Authority is without merit. On this basis, an amount of $1.6 million has been raised in the statement of financial position at 31 December 2015 relating to certain areas of the claim. The Directors believe that this amount remains appropriate at 30 June 2016. Due to the substantial uncertainties relating to this matter, the actual results that will result from the ultimate resolution of these proceedings may vary from the amount provided.
13. Events post the reporting date The directors propose that an interim dividend of 1.5 cent per share be paid to shareholders on 7 October 2016.
This dividend has not been included as a liability in these consolidated interim financial statements. The proposed dividend is payable to all shareholders on the Register of Members on 9 September 2016. The total estimated interim dividend to be paid is $2.0 million (2015: $1.5 million). The payment of this dividend will not have any tax consequences for the Group. The directors are not aware of any other events subsequent to 30 June 2016 that would impact on the condensed consolidated interim financial statements.

Page | 20
CAPITAL DRILLING LIMITED NOTES TO THE CONDENSED CONSOLIDATED INTERIM FINANCIAL STATEMENTS For the six months ended 30 June 2016 14. Going concern The Group has set specific objectives and also has policies and processes in place to manage its capital and
its financial, credit risk and liquidity risks. The Group has borrowings and debt facilities which, together with its clients’ receipts, fund its day to day
working capital requirements. Volatile economic conditions may create uncertainty particularly over (a) the level of demand for the Group’s services; (b) exchange rate fluctuations against the US Dollar and thus the consequence for the cost of the Group’s direct costs; and (c) the availability of bank financing in the foreseeable future.
The Group’s forecasts and projections, taking into account potential changes in its performance, show that
the Group should be able to operate within the level of its capital structure. The Group continuously discusses its future borrowing and / or refinancing needs with its bankers and no matters have been drawn to its attention to suggest that these needs may not be met on acceptable terms.
The directors confirm that the Group has adequate resources to continue in operational existence for the
foreseeable future. The Group continues to adopt the going concern basis of accounting in preparing the interim financial statements.
15. Financial instruments Financial instruments that are measured in the condensed consolidated statement of financial position at
fair value require disclosure of fair value measurements by level based on the following fair value measurement hierarchy:
• Level 1: quoted prices (unadjusted) in active markets for identical assets or liabilities; • Level 2: inputs other than quoted prices included within level 1 that are observable for the asset or
liability, either directly (that is, as prices) or indirectly (that is, derived from prices); and • Level 3: inputs for the asset or liability that are not based on observable market data (that is,
unobservable inputs). The Group’s available-for-sale financial assets, with a fair value of $1.2 million (31 December 2015: $0.2
million) are listed equity securities in the mining industry that measured at fair value at the end of each reporting period. The available-for-sale investments are designated as level 1 in the fair value hierarchy. Their fair value is determined using quote bid prices in an active market. The Group's held-for-trading financial assets, with a fair value of $0.7 million (31 December 2015: $0) are options and warrants to acquire shares in listed equity securities that are not traded in an active market. The held-for-trading financial assets are designated as level 3 in the fair value hierarchy. Their fair value is determined using a binominal tree model valuation technique based on observable market data that includes the value of the underlying security, the exercise price, volatility and risk free rate of return.
The fair values of financial assets and liabilities, other than the available-for-sale and held-for-trading
financial assets carried at fair value, that are not traded in an active market are determined using standard valuation techniques. These valuation techniques maximise the use of observable market data where available and rely as little as possible on Group specific estimates. The directors consider that the carrying value amounts of financial assets and financial liabilities recorded at amortised cost in the consolidated financial statements are approximately equal to their fair values. The fair values disclosed for the financial assets and financial liabilities are classified in level 3 of the fair value hierarchy and have been assessed to approximate their carrying amounts based on a discounted cash flow assessment.

Page | 21
CAPITAL DRILLING LIMITED STATEMENT OF DIRECTORS’ RESPONSIBILITY For the six months ended 30 June 2016
The directors are responsible for the maintenance of adequate accounting records and the preparation and integrity of the condensed consolidated interim financial statements and related information. The auditors are responsible for expressing a review conclusion on the condensed consolidated interim financial information based on their review. The directors are also responsible for the Group’s systems of internal financial control. These are designed to provide reasonable, but not absolute, assurance as to the reliability of the financial statements, and to adequately safeguard, verify and maintain accountability for the Group’s assets, and to prevent and detect misstatement and loss. Nothing has come to the attention of the directors to indicate that any material breakdown in the functioning of these controls, procedures and systems has occurred during the six months under review. We confirm that to the best of our knowledge: a) the condensed set of consolidated interim financial statements, which has been prepared in accordance
with International Accounting Standard 34, Interim Financial Reporting, as issued by the International Accounting Standards Boards gives a true and fair view of the assets, liabilities, financial position and profit or loss of the Group as required by DTR4.2.4R;
b) the interim management report includes a fair review of the information required by DTR 4.2.7R and DTR4.2.8; and
c) there has been no significant individual related party transactions during the first six months of the financial year and nor have there been any significant changes in the Group's related party relationships from those reported in the Group's annual financial statement for the year ended 31 December 2015.
The condensed consolidated interim financial statements have been prepared on the going concern basis since the directors believe that the Group has adequate resources in place to continue in operation for the foreseeable future. The condensed consolidated interim financial statements were approved by the board of directors on 17 August 2016. ON BEHALF OF THE DIRECTORS Jamie Boyton Chairman Mark Parsons Chief Executive Officer

Page | 22
CAPITAL DRILLING LIMITED Principal Risks and uncertainties The Group operates in environments that pose various risks and uncertainties. Aside from the generic risks that face all businesses, the Group’s business, financial condition or results of operations could be materially and adversely affected by any of the risks described below. These risks should not be regarded as a complete and comprehensive statement of all potential risks and uncertainties nor are they listed in order of magnitude or probability. Additional risks and uncertainties that are not presently known to the Directors, or which they currently deem immaterial, may also have an adverse effect on the Group’s operating results, financial condition and prospects. The principal risks associated with the business are: Area Description Mitigation Fluctuation in levels of mining activity
The Group is highly dependent on the levels of mineral exploration, development and production activity within the markets in which it operates. A reduction in exploration, development and production activities, or in the budgeted expenditure of mining and mineral exploration companies, will cause a decline in the demand for drilling rigs and drilling services, as was evident in the 2014 and 2015 financial years.
The Group is seeking to balance these risks by building a portfolio of long term drilling contracts, expanding into new geographic areas and implementing of our Lean Operating Model.
Reliance on key customers
The Group’s revenue is reliant on a small number of key customers. A loss of a key customer, or a significant reduction in the demand for drilling provided to a key customer will have a significant adverse effect on the Group’s revenues.
The Group has entered into long term contracts with its key customers for periods between 2 to 5 years. Contract renewal negotiations are initiated well in advance of expiry of contracts to ensure contract renewals are concluded without interruption to drilling services. The Group has and continues to monitor projects closely and invest a significant amount of time into client relationship and service level monitoring at all levels of the business. A key part of this process is the quarterly project steering committee meetings with key client stakeholders that provide a forum for monitoring and reporting on project performance and key performance indicators (“KPI’s”), contractual issues, pricing and renewal.

Page | 23
Area Description Mitigation Key personnel and staff retention
The Group’s ability to implement a strategy of pursuing expansion opportunities is dependent on the efforts and abilities of its executive directors and senior managers. In addition, the Group’s operations depend, in part, upon the continued services of certain key employees. If the Group loses the services of any of its existing key personnel without timely and suitable replacements, or is unable to attract and retain new personnel with suitable experience as it grows, the Group’s business, financial condition, results of operations and prospects may be materially and adversely affected. In addition, business may be lost to competitors which members of senior management may join after leaving their positions with the Group.
The Group has expanded capabilities in the areas of business development, supply chain, finance, training and health and safety during 2015 and continues to do so through the recruiting of senior managers in the various fields, implementing comprehensive training programmes and providing employees with international exposure in their fields. The Group has implemented remuneration policies that seeks to recruit suitable talent and to remunerate talent at levels commensurate with market levels.
Currency fluctuations The Group receives the majority of its revenues in US dollars. However, some of the Group’s costs are in other currencies in the jurisdictions in which it operates. Foreign currency fluctuations and exchange rate risks between the value of the US dollar and the value of other currencies may increase the cost of the Group’s operations and could adversely affect the financial results. As a result, the Group is exposed to currency fluctuations and exchange rate risks.
To minimise the Group’s risk, the Group tries to match the currency of operating costs with the currency of revenue. Funds are pooled centrally in the head office bank accounts to the maximum extent possible. The group have implemented procedures to allow for the repatriation of funds to the Group’s Head Office bank accounts from jurisdictions where exchange control regulations are in effect.
Operating risks Operations are subject to various risks associated with drilling including, in the case of employees, personal injury, malaria and loss of life and, in the Group’s case, damage and destruction to property and equipment, release of hazardous substances in to the environment and interruption or suspension of drill site operations due to unsafe drill operations. The occurrence of any of these events could adversely impact the Group’s business, financial condition, results of operations and prospects, lead to legal proceedings and damage the Group’s reputation. In particular, clients are placing an increasing focus on occupational health and safety, and deterioration in the Group’s safety record may result in the loss of key clients.
The Chief Executive Officer, Executive Leadership Team and managers provide leadership to projects on the management of these risks and actively engage with all levels of employees. The Group have implemented and continue to monitor and update a range of health and safety policies and procedures. including equipment standards and standard work procedures. Employees are provided with training regarding risks associated with their employment, policies and standard work procedures. Health and Safety statistics and incident reports are monitored throughout our projects and the various management structures of the Group, including the HSSE committee. Where necessary policies and procedures are update to reflect developments and improvement needs. The Group maintains adequate insurance policies to provide insurance cover against operating risks.

Page | 24
Area Description Mitigation Political, economic and legislative risk
The Group operates in a number of jurisdictions where the political, economic and legal systems are less predictable than in countries with more developed industrial structures. Significant changes in the political, economic or legal landscape in such countries may have a material effect on the Group’s operations in those countries. Potential impacts include restrictions on the export of currency, expropriation of assets, imposition of royalties or other taxes targeted at mining companies, and requirements for local ownership. Political instability can also result in civil unrest, industrial action and nullification of existing agreements, mining permits or leases. Any of these may adversely affect the Group’s operations or results of those operations. The Group has invested in a number of countries thereby diversifying exposure to any single jurisdiction.
The Group monitors political and regulatory developments in the jurisdictions it operates in through a number of service providers and advisors. Senior management regularly reports to the Board on any political or regulatory changes in the jurisdictions we operate in. Where significant events occur, we work closely with our clients, advisors and other stakeholders to address these events.

Page | 25
CAPITAL DRILLING LIMITED
APPENDIX: GLOSSARY AND ALTERNATIVE PERFORMANCE MEASURES
The following terms and alternative performance measures are used in the half year results release for the six months ended 30 June 2016.
ARPOR Average revenue per operation rig EBITDA Earnings before interest, taxes, depreciation and amortisation EBIT Earnings before interest and taxes (Equal to profit from operations per
the financial statements) PBT Profit (loss) before tax per the financial statements NPAT Net profit (loss) after tax per the financial statements NET CASH (DEBT) Cash and cash equivalents less short term and long term debt RETURN ON CAPITAL EMPLOYED (%) Long Term EBIT / (Average total assets – Average current liabilities) RETURN ON TOTAL ASSETS (%) Long Term EBIT / Average total assets AIFR All incident frequency rate DES Drilling equipment standards HSSE Health, Safety, Social and Environment KPI Key Performance Indicator LTI Lost Time Injury Reconciliation of alternative performance measures to the financial statements:
30 June 2016
30 June 2015 ARPOR can be reconciled from the financial statements as per the below:
Revenue per financial statements ($) 41,714,801 38,952,636 Non-drilling revenue ($) (2,123,175) (1,538,484) Revenue used in the calculation of ARPOR ($) 39,591,626 37,414,152 Monthly Average operating Rigs 37.7 33.0 ARPOR (rounded to nearest $'000) 175,000 189,000 EBITDA can be reconciled from the financial statements as per the below: Gross profit per financial statements 12,732,186 13,429,298 Administration costs (5,402,327) (5,550,683) EBITDA 7,329,859 7,878,615