half yearly financial report 30 june 2008 - astaldi · significant events at 30 june 2008 14...
TRANSCRIPT

Half‐Yearly Financial Report 30 June 2008

2
Astaldi Società per Azioni Registered Office and Head Office: Rome (Italy), Via Giulio Vincenzo Bona no. 65 Entered in the Rome Company Register TIN 00398970582 R.E.A. no. 152353 VAT no. 0080281001 Share capital: EUR 196.849.800,00 fully-paid up
3
CONTENTS
CORPORATE BODIES
SIGNIFICANT EVENTS AT 30 JUNE 2008
INTERIM HALF‐YEARLY MANAGEMENT REPORT
Summary of main balance sheet and assets data
The context
Reclassified account schedules
Comment on the balance sheet, asset and financial results of the Group
Orders backlog
Events subsequent to the closing of the period
Main risks and contingencies regarding the second half
Information on operations with related parties
Performance forecast
Alternative performance indicators: non‐Gaap measures
SUMMARIZED HALF‐YEARLY CONSOLIDATED FINANCIAL STATEMENTS
MANAGEMENT'S CERTIFICATION
ANNEXES TO SUMMARIZED HALF‐YEARLY CONSOLIDATED FINANCIAL STATEMENTS

4
CORPORATE BODIES (Situation at 30 June 2008)
Board of Directors 1
Honorary Chairman Monti Ernesto
Chairman Di Paola Vittorio
Deputy Chairman Astaldi Paolo
Chief Executive Officer Cafiero Giuseppe
Chief Executive Officer Cerri Stefano
Directors Astaldi Caterina
Astaldi Pietro
Cavalchini Garofoli Luigi Guidobono
Grassini Franco Alfredo
Lupo Mario
Oliva Nicola
Poloni Maurizio
Tosato Gian Luigi
Internal Audit Committee
Chairman Lupo Mario
Members Cavalchini Garofoli Luigi Guidobono
Grassini Franco Alfredo
1 Appointed by the Shareholders’ Meeting with the resolution of 2 May 2007 for the 3-year period 2007-2009, the Board of Directors will remain in office until the approval of the financial statements for the year 2009.

5
Remuneration Committee
Chairman Monti Ernesto
Members Grassini Franco Alfredo
Poloni Maurizio
Board of Auditors
Chairman Spanò Pierumberto
Statutory Auditors Singer Pierpaolo
Sisca Antonio
Substitute Auditors Lauri Maurizio
Pizzini Flavio
Tabellini Massimo
Independent Auditors
Independent Auditors Reconta Ernst & Young S.p.A.
General Managers
General Manager - International Cafiero Giuseppe
General Manager - Domestic Oliva Nicola
General Manager - Administration and Finance Citterio Paolo1
Deputy General Manager - International Nenna Rocco
Deputy General Manager - International Cesare Bernardini
Deputy General Manager – Domestic Giannotti Gianfranco 1 Paolo Citterio, General Manager - Administration and Finance, was appointed as manager in charge of drafting the corporate accounting documents by the Board of Directors of 31 July 2007, pursuant to Art. 154-bis, Italian Legislative Decree no. 58/1998.
SIGNIFICANT EVENTS AT 30 JUNE 2008
14 January. In Romania, Astaldi was awarded the third phase of the project for the development and modernization of the “Henri Coanda” International Airport in Bucharest, a contract with a value of EUR 76 million, concluding what the Group has already undertaken in this area in the airport sector.
17 January. Astaldi acquired the general contracting for the construction of the new Istanbul Underground Network, in Turkey. As leader of an international joint venture, Astaldi gained first place in an international public tender. The contract has an overall value of EUR 751 million (with Astaldi’s share 42%).
11 February. Astaldi announced the signature of a contract with a value of US$ 93 million, for the design and construction of civil engineering works related to an aluminum production plant in the Mesaieed industrial district, in Qatar, confirming the expertise acquired by the Group in the plant engineering in the petrochemical sector.
5 March. The Astaldi Group took part in Expocomer 2008, Panama, an event promoted to create business opportunities for the area, thus confirming the interest and open commercial policies of the Group with regard to this new market.
6 March. The project finance initiative for the construction and management of Line 5 of the Milan Underground gained the international “Deal of the Year 2007” award in the category “Europe Transport Light Rail”. The “Euromoney Project Finance” Award Ceremony is one of the most prestigious international events of its kind in the sector. Astaldi is the leader of the joint venture undertaking the works.
7 March. Astaldi announced the signature of the contract for the construction of the new Istanbul Underground on a general contracting basis. The signature followed the provisional assignment of the project in January; the Astaldi share of the contracts totals EUR 315 million.
27 March. The Astaldi Board of Directors approved the consolidated financial statements for 2007 financial year, and in the light of the results achieved, decided to submit a proposal to the General Meeting for the payment of an increased dividend of 0.1 euro per share.
1 April. The City of Milan was assigned to be the venue for Expo 2015, a full recognition of Italian excellence. The New Expo Fair Centre in Milan, built by Astaldi in 2005 in just 24 months, will be one of the protagonists of the event.
9 April. An EU Delegation visited the construction site of the new PlovdivSvilengrad railway line in Bulgaria. This institutional visit highlighted the great interest shown by the European Union for initiatives that can favor cohesion between the old EU and the new Member States.
9 April. In Mestre, work started for the transfer of all the equipment and archives from the old Umberto I Hospital to the New Hospital in Mestre, built by Astaldi and inaugurated in September 2007.
15 April. The Astaldi Board of Directors approved the Business Plan for 20082012: according to forecasts, in 2012 revenues will double to over EUR 2.6 billion, with a net profit of EUR 100 million.

7
21 April. Astaldi made available the 2007 Annual Report on corporate governance.
22 April. Astaldi participated in the “PPP in CEE and SEE Summit” in Vienna, an international event for promoting private-public partnership on the European level. Astaldi’s participation in this event confirms the expertise achieved by the Group in this sector, and the company’s willingness to develop further new business opportunities, exporting abroad a know-how long consolidated on the domestic level, especially in the field of transport infrastructures, healthcare construction, parking facilities and water management.
23 April. Astaldi recorded the first major success in the sector of concession management of motorways, with the appointment as promoter for the project finance initiative for the construction and management of the link between the Port of Ancona with nearby major roads. The value of the initiative is EUR 580 million; it will be undertaken by a joint venture in which Astaldi has a share of 24%.
29 April. Astaldi acquired on a provisional basis the general contracting for the construction of an initial section of the Pedemontana Lombarda motorway. The value of the initiative is EUR 630 million; it will be undertaken by a joint venture in which Astaldi has a share of 24%.
14 May. The Astaldi Board of Directors approved the results of the first quarter 2008, recording a growing net profit of +16.7% and an orders backlog of over EUR 8.5 billion.
21 May. Astaldi participated in the 8th Intertunnel 2008 exhibition in Turin, the international event for the companies operating in the tunnel sector, an area in which Astaldi boasts extensive expertise and is a major player in Italy and abroad.
23 May. The first two TBMs (Tunnel Boring Machines) started operation for the construction of the new Line C of the Rome Underground.
4 June. The first surgical operation was performed in the New Hospital in Mestre, this confirming the full operation of the new hospital, in full compliance with the timing agreed with the administration.
5 June. Astaldi took part in the ANCE mission to Poland, an institutional visit showing how the Group has opened to a new market with significant growth potential.
18 June. The Councilor for Traffic, Transport and the Environment of the City of Milan visited the construction site of the new Line 5 of the Milan Underground, acknowledging the significant advancement of works with respect to contract schedules.
30 June. Confirmation of a loan by an international pool of banks totaling EUR 776 million for the Municipality of Istanbul, for the construction of the new underground line, to be undertaken by Astaldi as leading company of a joint venture.

8
INTERIM HALFYEARLY MANAGEMENT REPORT
Summary of main balance sheet and assets data
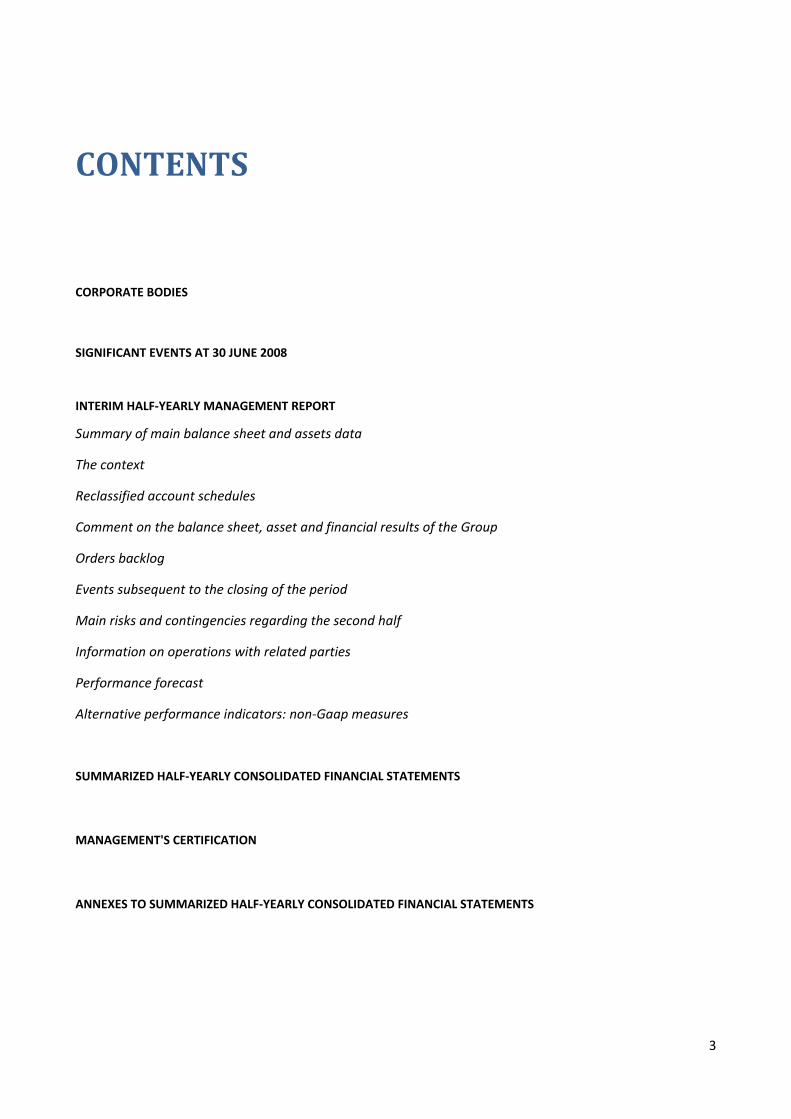
□ Total revenues EUR 704.7 million (+18.4%).
□ EBIT EUR 60.5 million (+20.4%).
□ Net profit EUR 21.1 million (+9.4%).
□ Net financial position EUR (496.5) million, net of treasury shares.
+20.4%
+9.4%
+18.4%
Total revenues EBIT Net income
June 30, 2007
June 30, 2008
9
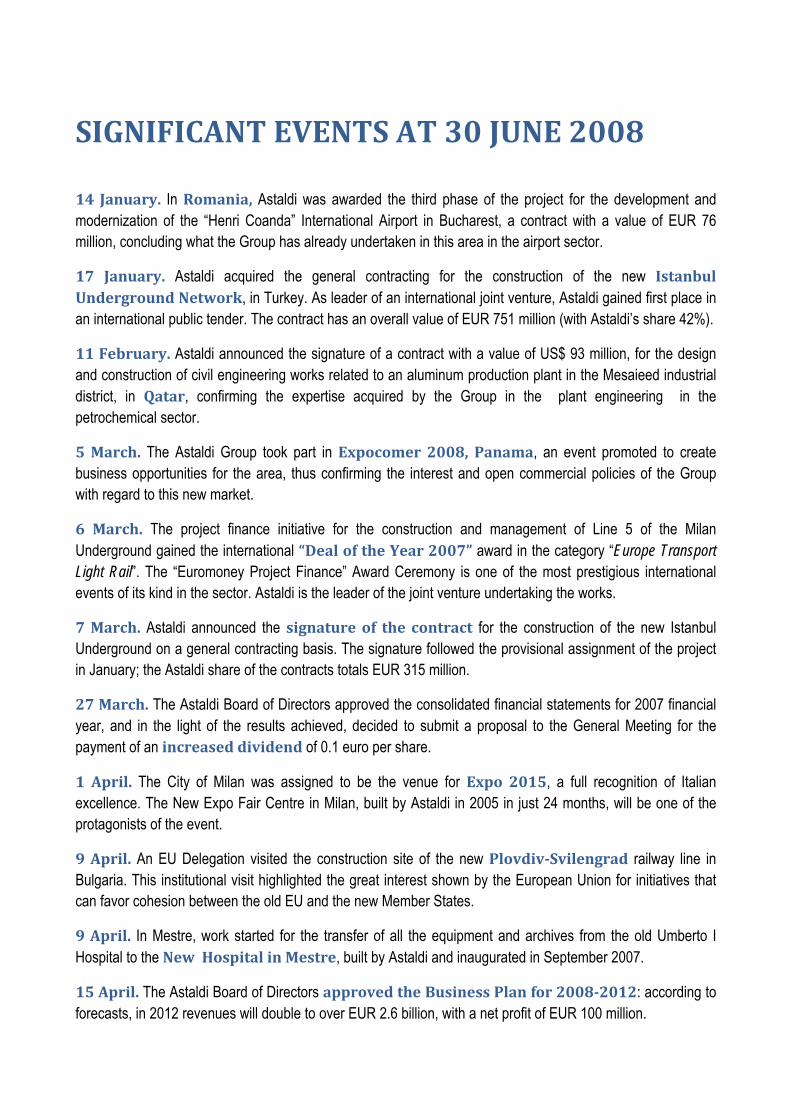
1.26 1.31.5 1.4
Debt/Equity ratio Current ratio
31‐dic‐07 30‐giu‐08
□ Revenues EUR 672.8 million (+18.9%)
□ Orders backlog EUR 8.4 billion.
June 30, 2007
June 30, 2008
December 31, 2007
June 30, 2008
Revenues by line of business Revenues by geographical areas
Orders backlogby line of business Orders backlog by geographical areas
10
The context
During the first half of 2008, the Astaldi Group has continued to strengthen its position in specific areas of the world it has traditionally occupied (Italy, Eastern Europe, North Africa, Middle East), which provide interesting development opportunities and long-term infrastructure investments. At the same time, commercial penetration in neighboring markets with the best expansion proposals has been promoted. All this, with investments mainly made by the Group, guarantees further capacity for business growth. The major sectors continue to be the ones in which the Group is traditionally active, and where it has long had a consolidated competitive position: first of all, the sector of transport infrastructures, especially railways and underground lines, the waterworks sector and energy in general, and civil and industrial construction. The interest for the sector of concessions is also significant, with the know-how acquired on the domestic level enabling the identification of interesting growth opportunities also abroad. There follows a brief summary of the context in which the Group operates. Italy. Although Italy is experiencing a situation characterized by a structural lack of financial resources, there are numerous factors suggesting growth of the sector on the domestic level. The infrastructure gap with the main European countries means a need for infrastructures that has consolidated the identifiable growth opportunities, especially in the sector of motorway, railway and underground transport infrastructures, in construction, and in concessions operations, especially for the expansion of urban transport and cross-border links. The assignment of Expo 2015 to the City of Milan means further opportunities for improved growth rates, in the fields of civil and industrial construction, and of transport and mobility. It should also be recalled that the new national energy strategy, among other things, calls for the return to nuclear energy, an area where the Astaldi Group can boast significant accrued experience. For the Group, the probable expansion of high speed/high capacity transport infrastructures may represent another especially interesting objective. In the light of all these requirements, a way to respond to the current lack of resources is the PPP (public-private partnership) solution, fostering collaboration between the public and private sector. Astaldi has long acquired in-depth financial and technical know-how in this respect, as well as sufficient expertise and competences to fully comprehend the potentials of this solution. Eastern Europe. There are interesting development opportunities in the new EU Member States, especially Romania and Poland, thanks to the cohesion funds provided by the European Union. The timing aspects and

11
operational procedures by which these funds will be converted into public tender announcements have yet to be clarified. Turkey. Major initiatives in the transport sector are expected here. A further acceleration of infrastructure investments in Turkey could occur as a direct consequence of privatization in the energy and motorways sectors. Algeria. Significant investments are expected here, above all in the light of the huge resources deriving from the sale of gas, of which Algeria has enormous reserves. On the basis of the Report for the VI Euro-Mediterranean Workshop of the Milan Chamber of Commerce, investments expected in the sector of transport infrastructures alone (ports, airports, railways and motorways), could reach EUR 140 billion for the next three years. In particular, the aim of the National Rail Transport Company (SNTF) is to increase the share of the national transport system covered by railways from 5% to 20% by 2015. Middle East. A significant rise in infrastructure investments is taking place in the area, thanks to the high price of crude oil. The credibility acquired by the Group, above all in the field of plant engineering applied to the petrochemical sector, makes a growing role of the Group increasingly likely. We can recall that in the Middle East the Group interests are mainly concentrated in the oil&gas sector, in partnership with the major international plant and engineering firms, a sector in which the operational capacity and reliability demonstrated by the Group now represent an important asset for starting a new growth phase. Latin America. Considerable development opportunities can be identified in this area. In particular, Venezuela is a market where the Astaldi Group has operated successfully for over 20 years, and where there are major new business potentials that could arise on the basis of the current bilateral agreements signed between the Italian Government and the Venezuelan Government in January 2008, for the expansion of the country’s infrastructures. It should likewise be pointed out that commercial initiatives are underway in Central America to strengthen the Group’s presence in the area, especially in the sector of waterworks. In the light of all this, it should in any case be pointed out that the overall risk management policy adopted by the Group aims to guarantee an adequate geographical diversification of business. Therefore, every single commercial initiative is assessed in the context of an overall strategic framework outlined in business planning, which tends not to increase the weight of any single area beyond certain limits.

12
Reclassified account schedules
Reclassified consolidated income statement
Euro/000 Reference 30/06/08 30/06/07
to notes in financial
statements June June
Revenues 1 672,769 95.5% 565,609 95.1%
Other operating revenues 2 31,886 4.5% 29,389 4.9%
Total Revenues 704,655 100.0% 594,998 100.0%
Production costs 3 - 4 (506,190) -71.8% (421,106) -70.8%
Added value 198,465 28.2% 173,892 29.2%
Personnel costs 5 (104,322) -14.8% (92,071) -15.5%
Other operating costs 7 (14,059) -2.0% (9,817) -1.6%
EBITDA 80,084 11.4% 72,004 12.1%
Depreciation/amortization 6 (19,580) -2.8% (16,534) -2.8%
Provisions 7 (382) -0.1% (5,474) -0.9%
(Capitalization of internal construction costs) 391 0.1% 270 0.0%
EBIT 60,514 8.6% 50,267 8.4%
Net financial income and charges 8 - 9 (21,373) -3.0% (18,982) -3.2%
Effects of evaluation of equity investments using equity method 10 319 0.0% 1,292 0.2%
Pre-tax Profit (loss) 39,460 5.6% 32,577 5.5%
Taxes 11 (15,389) -2.2% (13,705) -2.3%
Profit (loss) for the year 24,071 3.4% 18,873 3.2%
Profit (loss) attributable to minority interests (2,943) -0.4% 432 0.1%
Group net profit 21,128 3.0% 19,305 3.2%

13
Reclassified consolidated balance sheet
Euro/000
Reference to notes in financial
statements
30 June 2008 31
December 2007
Intangible assets 3,081 3,374Tangible assets 12 264,695 246,675Equity investments 13 98,463 96,877Other net fixed assets 11 - 14 - 15 25,866 30,364TOTAL fixed assets (A) 392,106 377,290Inventories 16 76,356 60,915Contracts in progress 17 639,576 519,229Trade receivables 18 30,998 36,844Accounts receivables 18 428,264 426,223Other assets 15 180,350 160,091Tax receivables 19 82,846 88,592Advances from customers 17 (260,620) (237,466)Subtotal 1,177,771 1,054,428Trade payables 15 - 24 (71,512) (88,474)Payables to suppliers 15 - 24 (429,198) (383,834)Other liabilities 11 - 22 (204,967) (213,518)Subtotal (705,677) (685,826)Working capital (B) 472,093 368,603Employee benefits (10,271) (10,932)Provisions for non-current risks and charges 25 (24,323) (24,333)Total funds (C) (34,595) (35,265)Net invested capital ( D ) = ( A ) + ( B ) + ( C ) 829,605 710,628Cash and cash equivalents 20 291,156 295,538Current receivables from banks 14 12,668 22,943Non-current receivables from banks 15 5 2,423Securities 14 24,632 14,764Current financial payables 22 (348,067) (322,385)Non-current financial payables 22 (481,560) (411,826)Net financial payables / receivables ( E ) (501,166) (398,543)Group equity 21 (321,810) (310,251)Minority interests equity 21 (6,629) (1,834)Equity ( G ) = ( D ) - ( E ) 328,439 312,085

14
Comment on the balance sheet, assets and financial results of the Group
The dynamics leading to the Group’s economic, assets and financial performance during the first half of 2008 are basically due to the further improvement of the revenues and operational situation, and the improved quality of the orders backlog, in line with the forecasts made by business planning. The Group accounts at 30 June 2008 are likewise affected by the significant stimulus to production activities during the period, especially in Italy, following the implementation of recently acquired general contracting and project finance projects. The trend in the growth in revenues and the orders backlog, characterizing Group performance in recent financial years, has been confirmed, thus showing the validity of the strategic guidelines adopted. In order to better understand the economic and financial dynamics of the Group, we should stress that in recent years, the growth process has undergone a significant acceleration, thanks to the strategic choices aimed at controlled expansion in the areas of interest and in the corresponding capital invested. The current phase is therefore a turning point, after which the benefits will be seen in terms of contribution to the margins of the capital invested, with the consequent generation of major cash flows. There follow comments on the changes recorded at 30 June 2008 in the main items of the consolidated income statement and balance sheet. For further details, see the contents of the summarized half-yearly consolidated financial statements.
Economic performance of the Group
The accounts for the half-year reflect the trend towards the gradual improvement of the revenues and operational performance of the Group, in line with what was recorded during in 2007. The volume of production has grown as a direct consequence of the expansion of activities undertaken in the traditional international markets, but also due to the benefits from the achievement of the full production phase for the general contracting and project finance projects started up last year on the domestic market. There has also been a higher quality works being undertaken, leading to a higher average performance of the orders backlog, favored by the prevalence of works under general contracting, and thus characterized by a higher technological content. There follow the comments on the changes occurring in the main items of the profit and loss account.
REVENUES FROM CORE ACTIVITIES
The revenues for the half-year period was EUR 672.8 million, up by +18.9% compared to EUR 565.6 million at 30 June 2007. The increase recorded reflects the acceleration of production activities, especially in Italy,
15
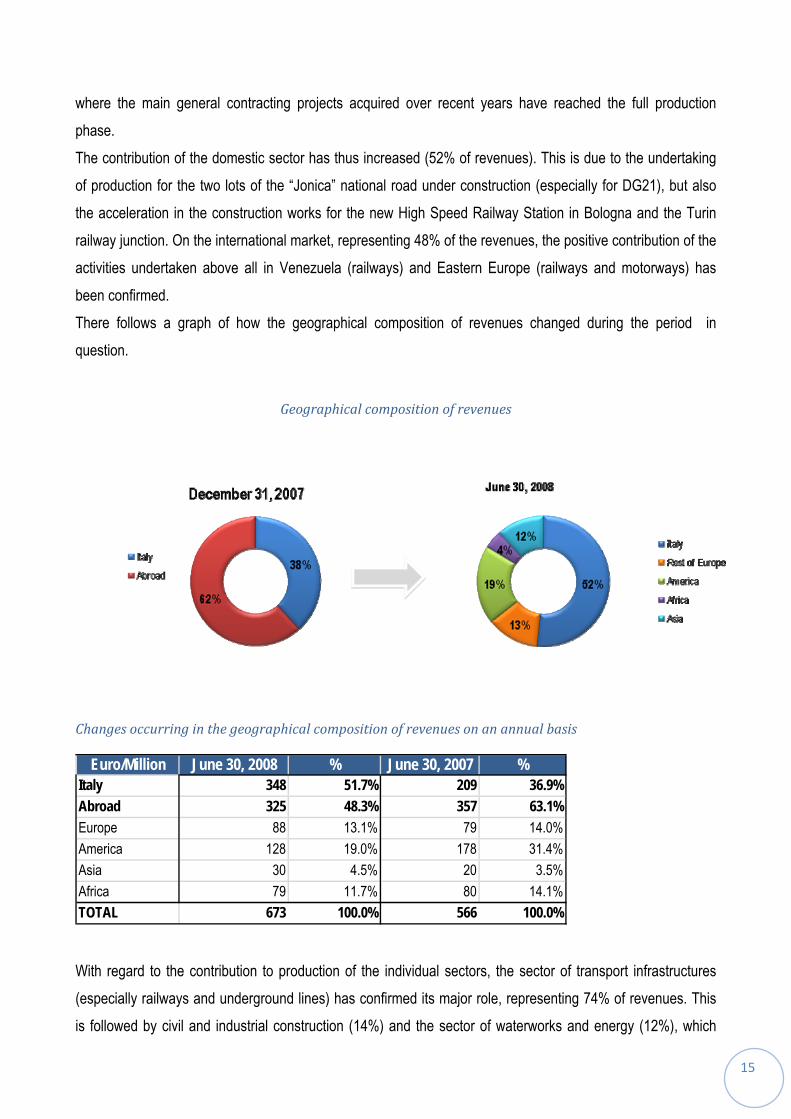
where the main general contracting projects acquired over recent years have reached the full production phase. The contribution of the domestic sector has thus increased (52% of revenues). This is due to the undertaking of production for the two lots of the “Jonica” national road under construction (especially for DG21), but also the acceleration in the construction works for the new High Speed Railway Station in Bologna and the Turin railway junction. On the international market, representing 48% of the revenues, the positive contribution of the activities undertaken above all in Venezuela (railways) and Eastern Europe (railways and motorways) has been confirmed. There follows a graph of how the geographical composition of revenues changed during the period in question.
Geographical composition of revenues
Changes occurring in the geographical composition of revenues on an annual basis
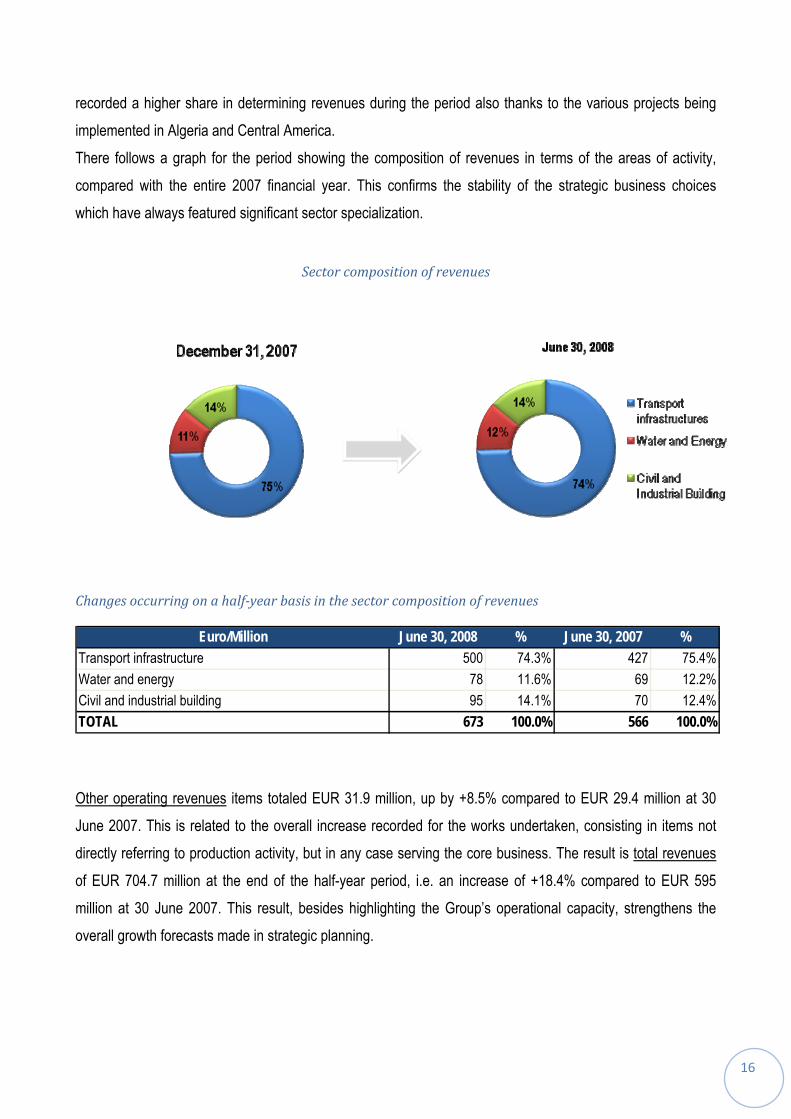
Euro/Million June 30, 2008 % June 30, 2007 %Italy 348 51.7% 209 36.9%Abroad 325 48.3% 357 63.1%Europe 88 13.1% 79 14.0%America 128 19.0% 178 31.4%Asia 30 4.5% 20 3.5%Africa 79 11.7% 80 14.1%TOTAL 673 100.0% 566 100.0% With regard to the contribution to production of the individual sectors, the sector of transport infrastructures (especially railways and underground lines) has confirmed its major role, representing 74% of revenues. This is followed by civil and industrial construction (14%) and the sector of waterworks and energy (12%), which
16
recorded a higher share in determining revenues during the period also thanks to the various projects being implemented in Algeria and Central America. There follows a graph for the period showing the composition of revenues in terms of the areas of activity, compared with the entire 2007 financial year. This confirms the stability of the strategic business choices which have always featured significant sector specialization.
Sector composition of revenues
Changes occurring on a halfyear basis in the sector composition of revenues
Euro/Million June 30, 2008 % June 30, 2007 %Transport infrastructure 500 74.3% 427 75.4%Water and energy 78 11.6% 69 12.2%Civil and industrial building 95 14.1% 70 12.4%TOTAL 673 100.0% 566 100.0% Other operating revenues items totaled EUR 31.9 million, up by +8.5% compared to EUR 29.4 million at 30 June 2007. This is related to the overall increase recorded for the works undertaken, consisting in items not directly referring to production activity, but in any case serving the core business. The result is total revenues of EUR 704.7 million at the end of the half-year period, i.e. an increase of +18.4% compared to EUR 595 million at 30 June 2007. This result, besides highlighting the Group’s operational capacity, strengthens the overall growth forecasts made in strategic planning.
17
COSTS OF PRODUCTION
The amount and structure of costs reflect the increase recorded for the production volumes and the greater orientation of the orders backlog towards general contracting initiatives. The direct production costs amounted to EUR 506.2 million (+20.2%, compared to EUR 421.1 million at 30 June 2007), with the impact on total revenues rising from 70.8% to 71.8% compared to the corresponding period of the previous year. Personnel costs totaled EUR 104.3 million (+13.3%, compared to EUR 92.1 million in the first half of 2007), with an impact on revenues falling to 14.8% (from 15.5% in the corresponding period of the previous year), also following greater use of outsourcing for the contracting activities typically involved in general contracting projects. Other operating costs totaled EUR 14.1 million (+43.2%, compared to EUR 9.8 million in the first half of 2007); as the productions costs, they recorded an increase mainly related to activities underway abroad.
OPERATING RESULTS
The overall performance of the Group reflects the positive trend in production activities and the good margin rates for the current orders backlog, with a balance of margins between the domestic and international sector. The EBITDA is EUR 80.1 million (+11.2% compared to EUR 72 million of the previous year), with an EBITDA margin of 11.4%. The EBIT totaled EUR 60.6 million, with a considerable rise of +20.4% (compared to EUR 50.3 million at 30 June 2007), with an EBIT margin rising to 8.6% from the 8.4% recorded in the corresponding period of the previous year. These figures also reflect the benefits of the need for lower allocations and of the greater economies of scale recorded in the half, aspects which are increasingly characterizing the Group’s growth.
NET FINANCIAL CHARGES
Net financial charges amounted to EUR 21.4 million (EUR 19 million at 30 June 2007), basically due to the increased operations of the Group, which involve higher average borrowing due to the capital invested usually associated with the increase of production volumes and as well as business cycles. At the same time, there are also higher commitments in terms of guarantees issued by the Group, and therefore higher charges, considering the higher average value of the orders, and of the orders in the current backlog as well as those being evaluated (bid bonds, performance bonds). It should, however, be pointed out that this aspect, in any case in line with the Business Plan for 2008-2012, has also produced a significant rise in the return on capital invested (ROI), which is well over 15%. Moreover, despite the sharp fluctuations on the credit market, the

18
changes in the cost of borrowing were rather low for the half-year period, also thanks to the prudent policy applied in the previous financial years to hedge borrowing rate risks.
TAX
The tax rate has fallen compared to the same period last year (39% compared to 42% at 30 June 2007), considering the actions undertaken to optimize the international taxation situation. It should be pointed out that the fall in the tax rate is not definitive for the entire year, since this figure depends on the “geographical mix” of income for the second half.
NET PROFIT
The net profit totaled EUR 21.1 million, with an increase of +9.4% compared to EUR 19.3 million recorded at 30 June 2007, with a net margin of 3%.
Assets and financial structure of the Group
The assets and financial structure of the Group, as already stated previously, highlights the significant commitments related to operational efforts in construction for general contracting and project financing initiatives, i.e. the activities which by their very nature involve a growing return on the capital invested and debt structures which are, by their nature, self-liquidating. In line with planning, the changes occurring in the assets and financial structure of the Group reflect the effects of an investments policy highlighting and promoting advanced technology initiatives (general contracting) and project finance initiatives which by their very nature involve lower financial risk profiles due to non-recourse structures.
NET FIXED ASSETS
Net fixed assets totaled EUR 392.1 million, higher with respect to EUR 377.3 million recorded at the end of 2007. The increase is basically due to the change in tangible assets, rising to EUR 264.7 million from EUR 246.7 million at 31 December 2007, also in connection with the investment program in project finance initiatives. In any case, the percentage of investments on total production tends to correspond to the indications already provided at the time of presentation of the business plan.
19
WORKING CAPITAL
Working capital totaled EUR 472.1 million (EUR 368.6 million at 31 December 2007), as a direct consequence of the increased revenues recorded during the period, which has involved an increase in contracts in progress. The latter amounted to EUR 639.6 million (EUR 519.2 million at the end of last year) with an increase basically due to the acceleration in projects abroad, especially in Venezuela, Romania and Algeria, areas where a fall in working capital is forecast starting from the third quarter of 2008. It should be pointed out that during the month of July, clients certified and approved works totaling just under EUR 200 million.
NET INVESTED CAPITAL
Net invested capital totaled EUR 829.6 million, higher compared to EUR 710.6 million recorded at 31 December 2007, as a direct consequence of the support provided to new initiatives in terms of investments and the trends recorded in the working capital. In general, this phenomenon, already forecast in strategic planning, is clearly explained by the increase of economic margins and, in the medium term, by cash flows forecast for 2009.
EQUITY
The equity totaled EUR 328.4 million, compared to EUR 312.1 million recorded at 31 December 2007. The change in the half-year period, amounting to EUR 16 million in absolute terms, is basically due to the profit recorded in the period and the change in reserves net of the dividend paid totaling EUR 9.8 million.
NET FINANCIAL POSITION
The net financial position at 30 June 2008, net of treasury shares totaled EUR (496.5) million. The comparison with the equivalent figure recorded at the end of 2007 (totaling EUR (393.5) million), shows an increase on a half-year basis of EUR 103 million, of which EUR 59.5 million regarding the second quarter. This change is due to the dynamics of the projects underway, with working phases requiring considerable capital invested, and in delays in payments, for current works. The support guaranteed to works underway and major stimulus provided by the Group for starting up the important initiatives acquired over the last two years have resulted in greater financial resources to support production; the return is guaranteed by cash flows deriving from the construction activities for general contracting initiatives and, for the concession sector, from the management phase. The figures of the net financial position in half-year period has been affected by normal business cycles, a factor further amplified by the increase recorded in production volumes (+18.9%) and the delays in some
20
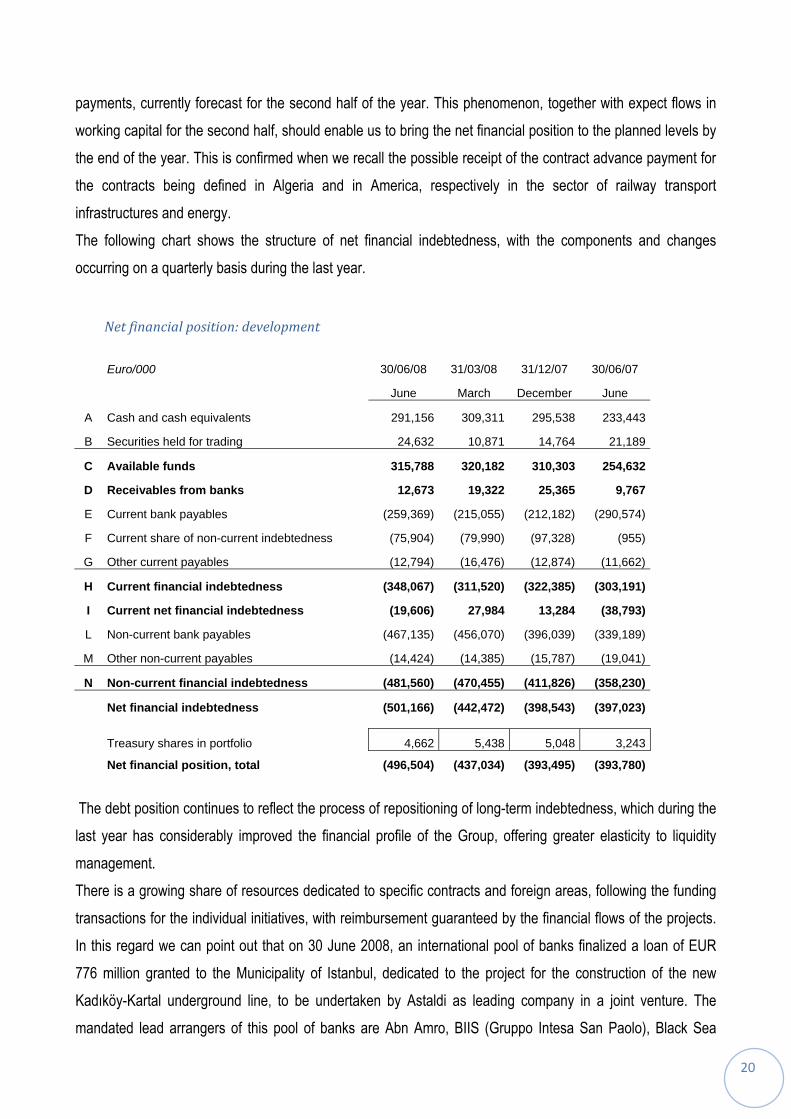
payments, currently forecast for the second half of the year. This phenomenon, together with expect flows in working capital for the second half, should enable us to bring the net financial position to the planned levels by the end of the year. This is confirmed when we recall the possible receipt of the contract advance payment for the contracts being defined in Algeria and in America, respectively in the sector of railway transport infrastructures and energy. The following chart shows the structure of net financial indebtedness, with the components and changes occurring on a quarterly basis during the last year.
Net financial position: development
Euro/000 30/06/08 31/03/08 31/12/07 30/06/07
June March December June
A Cash and cash equivalents 291,156 309,311 295,538 233,443
B Securities held for trading 24,632 10,871 14,764 21,189
C Available funds 315,788 320,182 310,303 254,632
D Receivables from banks 12,673 19,322 25,365 9,767
E Current bank payables (259,369) (215,055) (212,182) (290,574)
F Current share of non-current indebtedness (75,904) (79,990) (97,328) (955)
G Other current payables (12,794) (16,476) (12,874) (11,662)
H Current financial indebtedness (348,067) (311,520) (322,385) (303,191)
I Current net financial indebtedness (19,606) 27,984 13,284 (38,793)
L Non-current bank payables (467,135) (456,070) (396,039) (339,189)
M Other non-current payables (14,424) (14,385) (15,787) (19,041)
N Non-current financial indebtedness (481,560) (470,455) (411,826) (358,230)
Net financial indebtedness (501,166) (442,472) (398,543) (397,023)
Treasury shares in portfolio 4,662 5,438 5,048 3,243
Net financial position, total (496,504) (437,034) (393,495) (393,780)
The debt position continues to reflect the process of repositioning of long-term indebtedness, which during the last year has considerably improved the financial profile of the Group, offering greater elasticity to liquidity management. There is a growing share of resources dedicated to specific contracts and foreign areas, following the funding transactions for the individual initiatives, with reimbursement guaranteed by the financial flows of the projects. In this regard we can point out that on 30 June 2008, an international pool of banks finalized a loan of EUR 776 million granted to the Municipality of Istanbul, dedicated to the project for the construction of the new Kadıköy-Kartal underground line, to be undertaken by Astaldi as leading company in a joint venture. The mandated lead arrangers of this pool of banks are Abn Amro, BIIS (Gruppo Intesa San Paolo), Black Sea
21
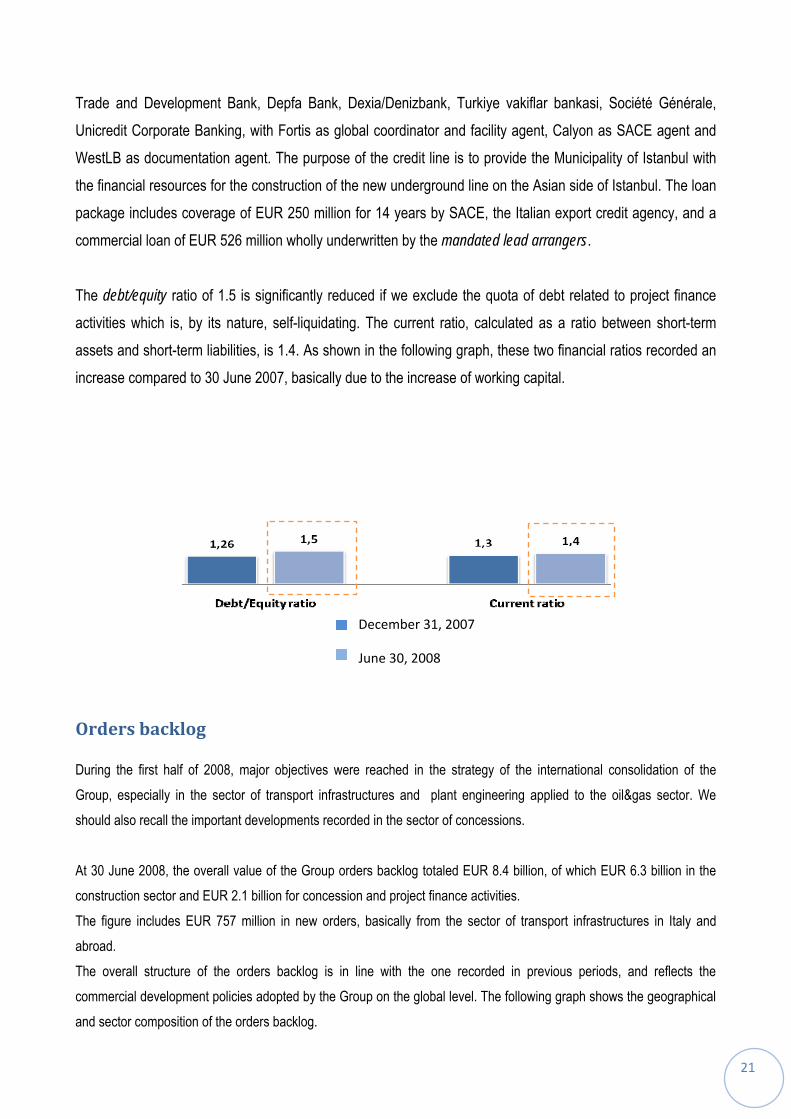
Trade and Development Bank, Depfa Bank, Dexia/Denizbank, Turkiye vakiflar bankasi, Société Générale, Unicredit Corporate Banking, with Fortis as global coordinator and facility agent, Calyon as SACE agent and WestLB as documentation agent. The purpose of the credit line is to provide the Municipality of Istanbul with the financial resources for the construction of the new underground line on the Asian side of Istanbul. The loan package includes coverage of EUR 250 million for 14 years by SACE, the Italian export credit agency, and a commercial loan of EUR 526 million wholly underwritten by the mandated lead arrangers. The debt/equity ratio of 1.5 is significantly reduced if we exclude the quota of debt related to project finance activities which is, by its nature, self-liquidating. The current ratio, calculated as a ratio between short-term assets and short-term liabilities, is 1.4. As shown in the following graph, these two financial ratios recorded an increase compared to 30 June 2007, basically due to the increase of working capital.
Orders backlog
During the first half of 2008, major objectives were reached in the strategy of the international consolidation of the Group, especially in the sector of transport infrastructures and plant engineering applied to the oil&gas sector. We should also recall the important developments recorded in the sector of concessions. At 30 June 2008, the overall value of the Group orders backlog totaled EUR 8.4 billion, of which EUR 6.3 billion in the construction sector and EUR 2.1 billion for concession and project finance activities. The figure includes EUR 757 million in new orders, basically from the sector of transport infrastructures in Italy and abroad. The overall structure of the orders backlog is in line with the one recorded in previous periods, and reflects the commercial development policies adopted by the Group on the global level. The following graph shows the geographical and sector composition of the orders backlog.
December 31, 2007
June 30, 2008
22
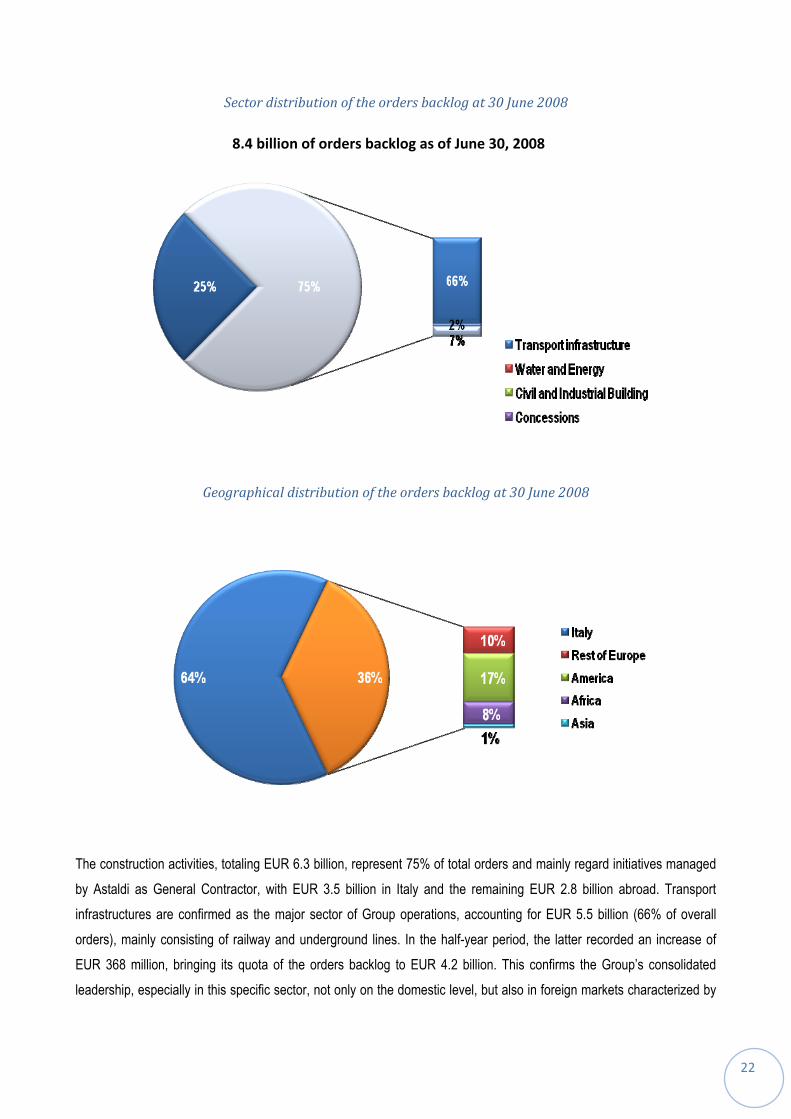
Sector distribution of the orders backlog at 30 June 2008
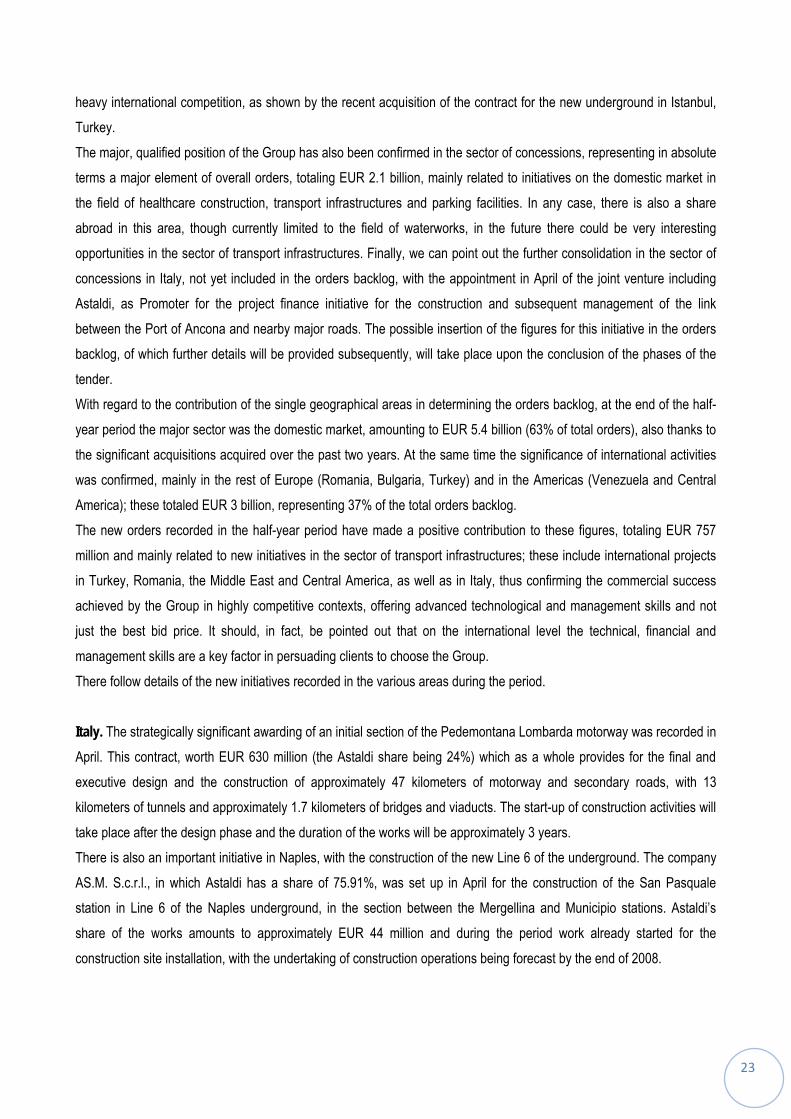
Geographical distribution of the orders backlog at 30 June 2008
The construction activities, totaling EUR 6.3 billion, represent 75% of total orders and mainly regard initiatives managed by Astaldi as General Contractor, with EUR 3.5 billion in Italy and the remaining EUR 2.8 billion abroad. Transport infrastructures are confirmed as the major sector of Group operations, accounting for EUR 5.5 billion (66% of overall orders), mainly consisting of railway and underground lines. In the half-year period, the latter recorded an increase of EUR 368 million, bringing its quota of the orders backlog to EUR 4.2 billion. This confirms the Group’s consolidated leadership, especially in this specific sector, not only on the domestic level, but also in foreign markets characterized by
8.4 billion of orders backlog as of June 30, 2008
23
heavy international competition, as shown by the recent acquisition of the contract for the new underground in Istanbul, Turkey. The major, qualified position of the Group has also been confirmed in the sector of concessions, representing in absolute terms a major element of overall orders, totaling EUR 2.1 billion, mainly related to initiatives on the domestic market in the field of healthcare construction, transport infrastructures and parking facilities. In any case, there is also a share abroad in this area, though currently limited to the field of waterworks, in the future there could be very interesting opportunities in the sector of transport infrastructures. Finally, we can point out the further consolidation in the sector of concessions in Italy, not yet included in the orders backlog, with the appointment in April of the joint venture including Astaldi, as Promoter for the project finance initiative for the construction and subsequent management of the link between the Port of Ancona and nearby major roads. The possible insertion of the figures for this initiative in the orders backlog, of which further details will be provided subsequently, will take place upon the conclusion of the phases of the tender. With regard to the contribution of the single geographical areas in determining the orders backlog, at the end of the half-year period the major sector was the domestic market, amounting to EUR 5.4 billion (63% of total orders), also thanks to the significant acquisitions acquired over the past two years. At the same time the significance of international activities was confirmed, mainly in the rest of Europe (Romania, Bulgaria, Turkey) and in the Americas (Venezuela and Central America); these totaled EUR 3 billion, representing 37% of the total orders backlog. The new orders recorded in the half-year period have made a positive contribution to these figures, totaling EUR 757 million and mainly related to new initiatives in the sector of transport infrastructures; these include international projects in Turkey, Romania, the Middle East and Central America, as well as in Italy, thus confirming the commercial success achieved by the Group in highly competitive contexts, offering advanced technological and management skills and not just the best bid price. It should, in fact, be pointed out that on the international level the technical, financial and management skills are a key factor in persuading clients to choose the Group. There follow details of the new initiatives recorded in the various areas during the period. Italy. The strategically significant awarding of an initial section of the Pedemontana Lombarda motorway was recorded in April. This contract, worth EUR 630 million (the Astaldi share being 24%) which as a whole provides for the final and executive design and the construction of approximately 47 kilometers of motorway and secondary roads, with 13 kilometers of tunnels and approximately 1.7 kilometers of bridges and viaducts. The start-up of construction activities will take place after the design phase and the duration of the works will be approximately 3 years. There is also an important initiative in Naples, with the construction of the new Line 6 of the underground. The company AS.M. S.c.r.l., in which Astaldi has a share of 75.91%, was set up in April for the construction of the San Pasquale station in Line 6 of the Naples underground, in the section between the Mergellina and Municipio stations. Astaldi’s share of the works amounts to approximately EUR 44 million and during the period work already started for the construction site installation, with the undertaking of construction operations being forecast by the end of 2008.

24
Turkey. As for the commercial success shown by the Group in highly dynamic international situations we can recall the success achieved in Turkey, where Astaldi, as leader of a joint venture, has been awarded the contract with the Municipality of Istanbul for the general contracting construction of a new underground line in Istanbul, with an overall value of EUR 751 million (the Astaldi share being 42%). The contract provides for the construction of a double track underground line with approximately 20 kilometers of tunnels on the Kadıköy-Kartal section; besides the civil engineering works, it includes the supply of the electromechanical and signaling equipment. The duration of the works is expected to be 3 years, with the start-up of operations in the second half of 2008. This project is expected to contribute to the expansion of the city’s public transportation network, and currently represents the most significant project planned for the near future by the Municipality of Istanbul. The awarding of the contract thus confirms the Group’s leadership on the international and in the sector of urban transport infrastructures. At the same time, it provides recognition for what Astaldi has already done in this country, in the project for the Istanbul-Ankara motorway, characterized by considerable design and construction complexity. Romania. The role of Astaldi is also important in this area. In January, the company was awarded the contract for the new phase of the project for development and modernization of the Henri Coanda (formerly Otopeni) International Airport in Bucharest, with a contract value of EUR 76 million. Astaldi has already completed the first two phases of this project. The contract for this new phase of the works provides for the construction of plant engineering and civil works, among other things, for the extension of the passenger arrivals and departures terminals, the refurbishing of the headquarters building, the reorganization of passenger flows and the construction of new surface car parking facilities. Works will start by the first half of 2008, and the forecast duration is approximately 36 months. This contract is a recognition of the Group’s operating capacities for the works completed in the previous stages of this project. At the same time, it reflects the role of major player that Astaldi intends to have in Eastern Europe; for the Group, this means not only Romania, but also Bulgaria, where it is already active, and in coming years, Poland. As for the latter, results will be forthcoming from a series of tenders in the sector of healthcare construction and transport infrastructures, and positive developments are expected. Middle East. Activities are also growing in the Middle East, which up to now in 2008 has accounted for over EUR 89 million to the growth of the consolidated orders backlog. In February, the Astaldi Group acquired a project worth US$ 140 million for the design and construction of civil engineering works for an aluminum production plant in the Mesaieed industrial area, in Qatar. The most important aspects of the contract, awarded to Astaldi by a major company on the international level, include the design and construction of storage silos with a diameter of 40 meters and a total volume capacity of over 300,000 cubic meters. The following tables show the performance of the orders backlog during the period, indicating the contribution of the sectors and countries concerned.
24

25
Performance of the orders backlog and contribution of activity sectors
Million euro Start of period
01/01/2008 Increases Decreases for
production End of period
30/06/2008 Transport infrastructures 5,386 630 -500 5,517 of which:
Railways and undergrounds 4,127 368 -323 4,173
Roads and motorways 1,169 183 -158 1,194
Airports and ports 89 80 -19 150 Waterworks and hydroelectric plants 237 11 -78 170 Civil and industrial construction 574 115 -95 594 Concessions 2,119 0 0 2,119 Situation of orders backlog 8,316 757 (673) 8,400
Performance of orders backlog and contribution of geographical areas
Million euro Start of period 01/01/2008 Increases Decreases for
production End of period
30/06/2008 Italy 5,539 200 (348) 5,392 Abroad 2,777 557 (325) 3,008
Europe 480 406 (88) 799 America 1,516 54 (128) 1,442
Africa 747 0 (79) 668 Asia 34 96 (30) 100
Situation of orders backlog 8,316 757 (673) 8,400
The figures of the orders backlog at 30 June 2008 do not take into account orders acquired after the closing of the half-year period, or the possible developments of the initiatives being taken in Venezuela and Italy.
26
In particular, for the domestic market, we can recall that the joint venture consisting of Astaldi (24%), Impregilo (leader and mandatary with 47%), Pizzarotti (18%) and Itinera (11%) was appointed as Promoter for the project finance initiative for the construction and subsequent management of the link between the Port of Ancona, the A14 motorway and “Adriatica” national road (SS 16). The overall value of the investment totaled approximately EUR 580 million and the concession contract, involving a management period of 30 years, will be awarded after the completion of the tender and the negotiated procedure in which the Promoter will enjoy the right of pre-emption. The new double-lane road will be approximately 11 kilometers long, of which 8 kilometers of main road and the remainder for connections. Much of the route will be underground, with the construction of approximately 4 kilometers of two-tube tunnels and two viaducts approximately 1.6 kilometers long. The duration of the works is 72 months, including the design and testing phase; the time will be calculated starting from the signing of the agreement.
Events subsequent to the closing of the period
Since the closing of the half-year period, there have been some major achievements for the Group on the domestic level. In particular, the Milan rail link was inaugurated on 17 July. This maxi-tunnel was built mainly under the city center to link the railway lines coming from the north-west (Milan-Turin, Milan-Domodossola and the regional lines managed by Ferrovie del Nord), with those coming from the north-east (Milan-Genoa, Milan-Bologna, Mortara-Milan). The link has 3.5 kilometers of double track leading from Porta Vittoria to Rogoredo station, creating a junction between long distance traffic and trains on the four regional lines that terminate at Rogoredo; this is an important solution for the city’s traffic requirements, also in view of Expo 2015. We should also point out the operation of the TBMs (Tunnel Boring Machines) to be used to excavate the tunnels for the construction project of the new Line C of the Rome underground and the new Line 5 of the Milan underground. On 3 July, excavation started for the tunnel linking the 30 stations planned for the new Line C of the Rome underground, on the Pantano-Piazzale Clodio section. On 1 August, the TBM started operations in the project for the construction of the new Line 5 of the Milan underground. TBMs, also known as “mechanical moles”, are actually highly mechanized mobile construction facilities, allowing excavation to advance from 8 to 12 meters per day, with maximum safety conditions for the workers and the residents of the areas affected by excavation, with considerable advantages in terms of construction time. Astaldi is currently using TBMs in Rome and Milan, as well as in Brescia, where the company is building the new underground line.
Main risks and contingencies regarding the second half
With regard to current requirements on “description of the main risks and contingencies for the remaining months of the financial year”, it should be pointed out that there are currently no special situations likely to have any significant impact on the economic and financial performance of the Group in the second half 2008.
27
Nevertheless, in the general macroeconomic scenario and the sector in which the company operates, there is concern for the following areas, which the Group is carefully monitoring. Raw materials. The increase, in some cases significant, in the price of some raw materials may involve an increase in the costs of production, though the Group tends to counter these by policies for the diversification of purchases, framework agreements with strategic suppliers, contract clauses for price review and the use of specific measures by local authorities aimed at mitigating these economic effects. Capital market. Critical factors should be highlighted in the current situation on the financial markets, in terms of the credit squeeze, the rise in interest rates and fluctuations on the currency markets. Starting from previous financial years, the Group has adjusted and repositioned borrowing in favor of medium/long-term instruments, containing the rise in interest rates by a specific policy of hedging the interest rate risk and implementing suitable transactions for the direct and indirect hedging of exchange rate risk. Country/customer risk. For the rest of the financial year, the activity undertaken by the Group is concentrated in the construction of major infrastructures, which besides having adequate financial coverage, also represent priority goals in the investment policies of the countries where the Astaldi Group operates. In particular, in some parts of the world, these initiatives are undertaken under “bilateral agreements” between the Italian Government and the Government of the countries concerned, thus producing a more favorable country/customer risk profile.
Information on operations with related parties
With regard to operations with related parties, it should be pointed out that these come within the normal activities of the Group companies, and are regulated by market conditions. For information on these relationships, see note 26 of the summarized half-yearly consolidated financial statements at 30 June 2008.
Performance forecasts
For over 80 years, the Astaldi Group has been a protagonist on the international scene, and considers the expansion of its sphere of actions to be a strategic challenge that has proved to be successful. In Europe and the rest of the world, Astaldi is a widely known and appreciated name, and the Group can boast the range of works completed, the dimension of the projects, and the undeniable development taking place in the countries and areas where it operates. These are the factors enabling the Group to enjoy the results of the commercial and production efforts made in recent years, also confirming for the first half of 2008 its capacity to achieve and support its strategic guidelines.
28
For the future, the consolidation of the Group is expected in the areas, such as Latin America, the Maghreb, Eastern Europe and the Arabian Peninsula, where the Astaldi has long been established. These areas will ensure the pursuit of increasingly ambitions growth targets, also thanks to the contribution from the opening of markets in neighboring areas, such as Poland with respect to Eastern Europe and Peru and the Chile with respect to Central America, areas which already have a regulatory framework and infrastructure investment plans of indubitable interest. The current orders backlog in the Middle East is expected to increase further due to the growth strategy already adopted, which has led to the opening of a new branch in Abu Dhabi and the setting up of a mixed company in Dubai. The domestic market will also represent a major strategic opportunity to be developed, especially for all the initiatives related to the assignment of Expo 2015 to the city of Milan. In particular, new scenarios could come about in the cities for underground lines, a sector in which the current network of 75 kilometers and 88 stations is expected to increase to 142 kilometers with 152 stations by 2015; in other words, a doubling of capacity from 3 to 6 underground lines. A step forward for implementing this project is the approval by the CIPE (Inter-Ministry Committee for Economic Planning) of the alternate route relative to the Garibaldi station in the context of the project for the construction of the new Line 5 of the Milan underground, now being undertaken by Astaldi, leading company of a joint venture. This change provides the technical conditions for the further extension of the line towards the western districts of the city. Again on the domestic market, further scenarios could also open up in Rome medium term for the new Line C of the Rome underground, now being built by Astaldi, and for the new Line D for which the tender procedures are currently underway. Abroad, a further contribution could come from Latin America, especially Venezuela, where there are already significant contract options to be exercised for railway contracts in progress. With regard to other commercial initiatives being studied, in accordance with strategic planning guidelines, the focus of the Group is on general contracting and project financing initiatives, developed in Italy and abroad, mainly in the sectors of transport infrastructures, energy production facilities, civil and healthcare construction, and parking facilities. For some of these initiatives, we are awaiting the outcome of the tenders; for others, the procedures for pre-qualification, verification and awarding are still underway. In this context, the Astaldi Group is prepared on the whole to examine and take advantage of all the growth opportunities that might occur, but at the same time it will continue to develop a sector with considerable growth potential, like the concessions sector. In particular, there will be a positive impact of new scenarios on the domestic market in the sector of motorway concessions, with the appointment in April of the joint venture consisting of Astaldi (24%), Impregilo (leader and mandatary with 47%), Pizzarotti (18%) and Itinera (11%) as Promoter for the project finance initiative for the construction and subsequent management of the links between the Port of Ancona, the A14 motorway and “Adriatica” national road (SS 16), already mentioned in the paragraph of this report on the orders backlog. This initiative is a concrete step in the strategy of the Astaldi Group to enter the sector of motorway concessions, long considered a sector that is complementary to concessions for the construction of hospitals, parking facilities and underground lines. At the same time, this new success has consolidated the know-how and expertise achieved by the Group in the field of concessions, creating the premises for further growth in this sector, not only in Italy, but also abroad.
29
Finally, with regard to the entire year 2008, the economic objectives set forth in business planning have been confirmed; from the assets and financial point of view, the second half of 2008 should show a reduction in working capital in some foreign areas, with the generation of resources for further investments in the concessions sector. It should also be pointed out that starting from this financial year, the accounts will also reflect the effects of the management operation of the new hospital in Mestre, built by Astaldi in joint venture, in just 4 years. This is a significant result not only from the construction point of view, but also with regard to the economic and financial equilibrium of the project, and thus for the management activities. Finally, we can point out that in 2008, the arbitration proceedings of 28.3.2006, advanced by Astaldi with respect to Consorzio di Bonifica Alli Punta di Copanello, in relation to the contract for the construction of the dam on the river Melito, has made further progress. The Board of Arbitrators has ordered two technical inspections which have ascertained, among other things, that the work as designed by the Consortium, cannot be implemented, and that the executive design drawn up by them requires significant revision. Considering the present situation of the arbitration proceedings and the outcome of the two technical inspections, it is reasonable to assume that the arbitration proceedings will conclude by September 2008.
Alternative performance indicators: nonGAAP measures
The Astaldi management has assessed the economic and financial performance of the Group and of business segments on the basis of some indicators not provided for by IFRS. As requested by Communication CESR/05 - 178b, the components of each of these indicators are described below. EBIT (Earnings Before Interest and Taxes): this is the result before tax and before financial income and charges, without any adjustment. EBIT also exclude income and charges derived from the management of non-consolidated equity investments and securities, as well as the results of any disposals of consolidated equity investments, recorded in the financial statements under “financial income and charges” or, for the results of equity investments alone evaluated by the equity method, under the item “effects of the evaluation of equity investments with the equity method”. EBITDA (Earnings Before Interest Taxes Depreciation and Amortization): is determined by excluding the following elements from EBIT as defined above:
- Write-down of intangible and tangible assets - Devaluation and provisions - Capitalization of internal construction costs.
Debt/Equity ratio: this indicator is the ratio between the net financial position in the numerator and the equity in the denominator, net of treasury shares in portfolio.
30
ROI (Return on Investment): this indicator is calculated as the ratio between EBIT (net operating result) and the average capital invested in the period. Current ratio: this indicator is calculated as the ratio between short-term assets and short-term liabilities.
For The Board of Directors
(Chairman)
Vittorio Di Paola

32
Summarized half-yearly consolidated financial statements at 30 June 2008
Consolidated income statement
(Euro/000) Operations
Notes 30/06/08 30/06/07
Revenues 1 672,769 565,609 Other operating revenues 2 31,886 29,389 of which from related parties 26 3,506 3,091 Total revenues 704,655 594,998 Purchase costs 3 (138,453) (136,375) of which for related parties 26 (61) (1) Service costs 4 (367,738) (284,731) of which for related parties 26 (44,596) (32,492) Personnel costs 5 (104,322) (92,071) Amortization, depreciation and write-downs 6 (19,580) (16,534) Other operating costs 7 (14,441) (15,290) Total costs (644,533) (545,002) (Capitalization of internal construction costs) 391 270 Operating result 60,514 50,267 Financial income 8 26,334 16,729 of which from related parties 639 200 Financial charges 9 (47,706) (35,711)
Effects of evaluation of equity investments with the equity method 10 319 1,292
TOTAL FINANCIAL AREA AND EQUITY INVESTMENTS (21,054) (17,690)
PRE-TAX PROFIT (LOSS) OF CONTINUED OPERATIONS 39,460 32,577 Taxes 11 (15,389) (13,705)
PROFIT (LOSS) OF CONTINUED OPERATIONS 24,071 18,873 PROFIT (LOSS) FOR THE PERIOD 24,071 18,873 Profit attributable to the Group 21,128 19,305 Profit attributable to third parties 2,943 (432) Profit per basic share 0,217 0,229 Diluted profit per share 0,217 0,229

33
Consolidated balance sheet (Euro/000) Notes 30/06/08 31/12/07 ASSETS Non-current assets Property, plant and equipment 12 264,506 246,483 Investment property 189 192 Intangible assets 3,081 3,374 Equity investments 13 98,463 96,877 of which:
Equity investments valued using the equity method 96,454 94,851 Non-current financial assets 14 6,913 10,329 of which from related parties 26 6,913 7,911 Other non-current assets 15 14,329 15,380 Deferred tax assets 11 4,629 7,078 TOTAL Non-current assets 392,111 379,712 Current assets Inventories 16 76,356 60,915 Amounts due by customers 17 639,576 519,229 Trade receivables 18 459,262 463,067 of which from related parties 26 31,000 36,859 Current financial assets 14 37,300 37,463 Tax receivables 19 82,846 88,592 Other current assets 15 244,624 252,167 of which from related parties 26 32,995 23,549 Cash and cash equivalents 20 291,156 295,538 Total Current assets 1,831,120 1,716,973 Total Assets 2,223,231 2,096,685 EQUITY 21 Share capital 194,094 195,050 Reserves: Legal reserve 13,542 12,152 Extraordinary reserve 77,164 61,857 Profit (loss) carried forward 26,808 19,583 Other reserves -10,926 -16,488 Total capital and reserves 300,682 272,153 Profit (loss) for the period 21,128 38,097 Total Group equity 321,810 310,251 Reserves 3,686 1,515 Profit (loss) for the period 2,943 319 Minority interests equity 6,629 1,834 Total equity 328,439 312,085 LIABILITIES
34
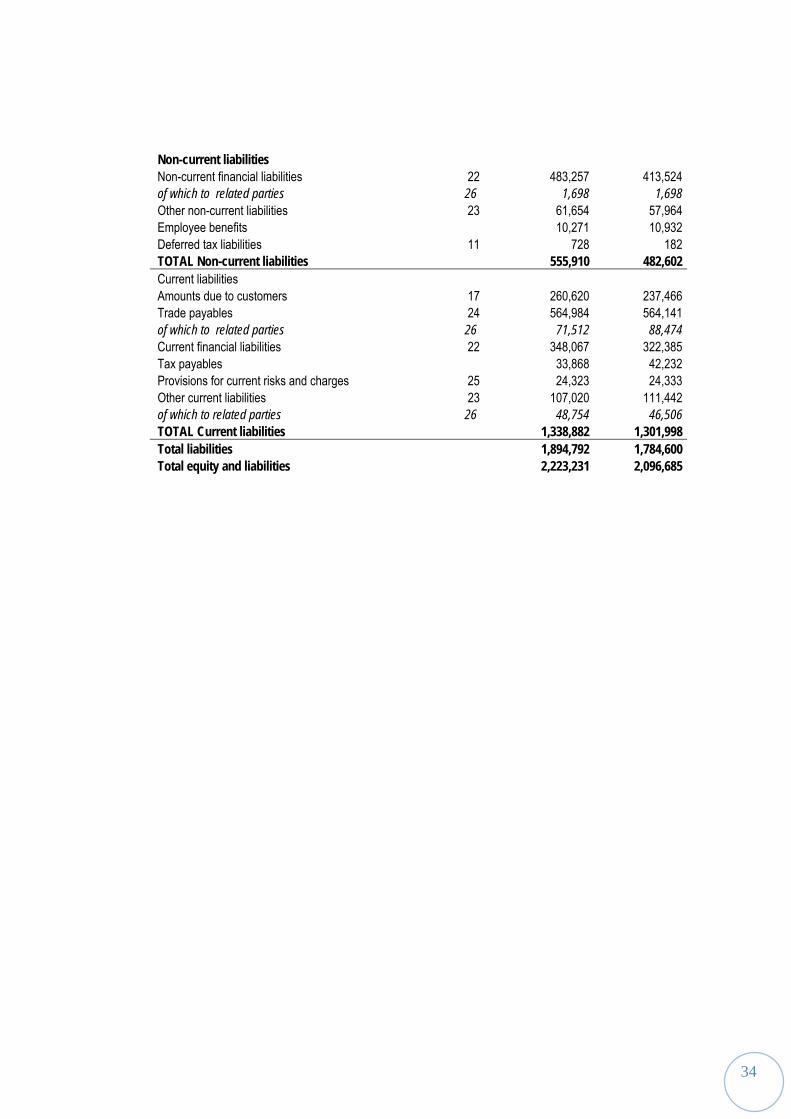
Non-current liabilities Non-current financial liabilities 22 483,257 413,524 of which to related parties 26 1,698 1,698 Other non-current liabilities 23 61,654 57,964 Employee benefits 10,271 10,932 Deferred tax liabilities 11 728 182 TOTAL Non-current liabilities 555,910 482,602 Current liabilities Amounts due to customers 17 260,620 237,466 Trade payables 24 564,984 564,141 of which to related parties 26 71,512 88,474 Current financial liabilities 22 348,067 322,385 Tax payables 33,868 42,232 Provisions for current risks and charges 25 24,323 24,333 Other current liabilities 23 107,020 111,442 of which to related parties 26 48,754 46,506 TOTAL Current liabilities 1,338,882 1,301,998 Total liabilities 1,894,792 1,784,600 Total equity and liabilities 2,223,231 2,096,685

35
Schedule of changes in consolidated equity
Share capital
Legal reserve
Extraordinary reserve
Other reserves
Total Accumulated profit
Profit for the period
Total Minority interests
Total equity
(Euro/000) IAS/IFRS balance at 1 January 2007 195,391 10,767 43,475 (18,987) 230,646 18,930 30,091 279,667 1,392 281,059
Cash flow hedge reserve 4,651 4,651 4,651 4,651
Income (charges) from equity valuation 1,018 1,018 1,018 1,018
Exchange rate differences from conversion (366) (366) (366) (366)
Treasury shares 292 289 207 788 788 788
Net income (charges) entered directly under equity 292 289 5,510 6,091 6,091 6,091
Profit at 30 June 2007 19,304 19,304 (432) 18,872
Dividends (8,323) (8,323) (8,323)
Fund pursuant to Art. 27 (415) (415) (415)
Allocation of 2006 result 1,385 19,264 241 20,890 (20,890)
Other changes 225 225 315 (463) 77 (12) 65
IAS/IFRS balance at 30 June 2007 195,683 12,152 63,028 (13,011) 257,852 19,245 19,304 296,401 948 297,349
Share capital
Legal reserve
Extraordinary reserve
Other reserves
Total Accumulated profit
Profit for the period
Total Minority interests
Total equity
(Euro/000) IAS/IFRS balance at 1 January 2008 195,049 12,152 61,857 (16,488) 252,570 19,583 38,097 310,250 1,834 312,085
Cash flow hedge reserve 5,587 5,587 5,587 5,587
Exchange rate differences from conversion (1,122) (1,122) (1,122) 2,551 1,429
Treasury shares (955) (1,150) (2,105) (2,105) (2,105)
Net income (charges) entered directly under equity (955) (1,150) 4,465 2,360 2,360 2,551 4,911
Profit for the year 2008 21,128 21,128 2,943 24,071
Dividends (9,752) (9,752) (838) (10,590)
Fund pursuant to Art. 27 (417) (417) (417)
Allocation of 2007 result 1,390 16,457 17,847 10,081 (27,928)
Other changes (14) (14) (2,857) (2,871) (139) (2,732)
Stock grant assignment reserve 1,111 1,111 1,111 1,111
IAS/IFRS balance at 30 June 2008 194,094 13,542 77,164 (10,926) 273,874 26,807 21,128 321,809 6,629 328,439
36
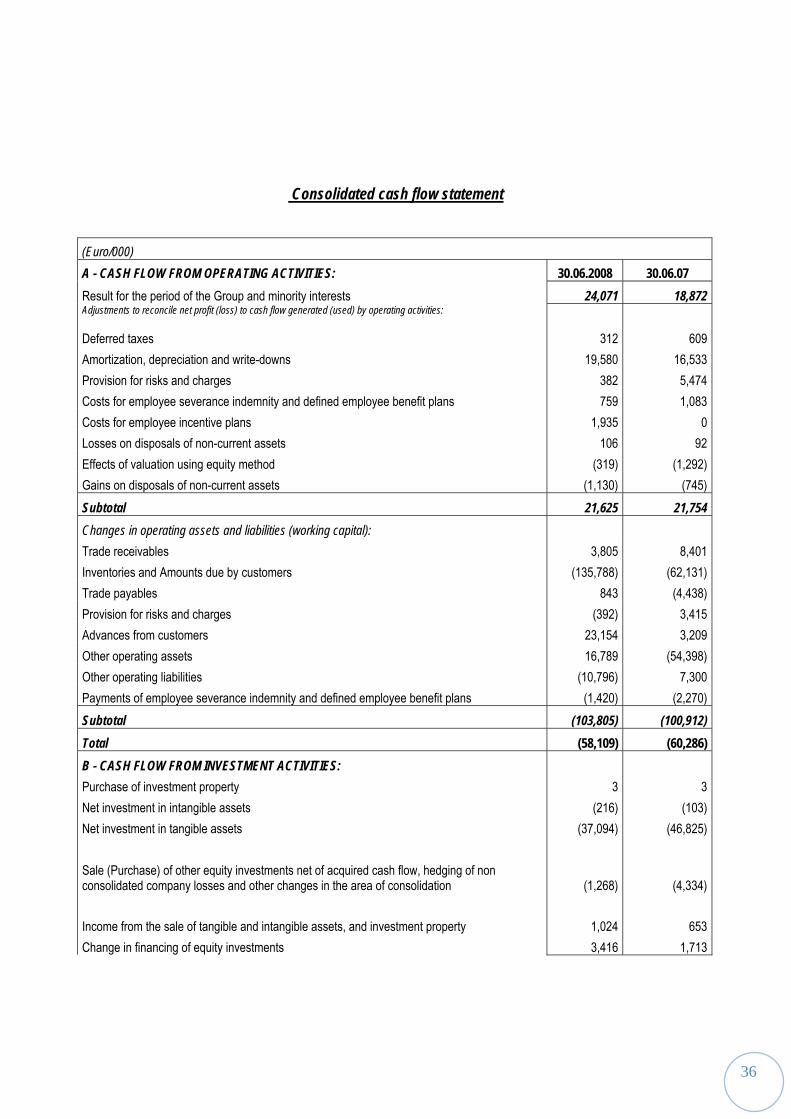
Consolidated cash flow statement
(Euro/000) A - CASH FLOW FROM OPERATING ACTIVITIES: 30.06.2008 30.06.07 Result for the period of the Group and minority interests 24,071 18,872 Adjustments to reconcile net profit (loss) to cash flow generated (used) by operating activities: Deferred taxes 312 609 Amortization, depreciation and write-downs 19,580 16,533 Provision for risks and charges 382 5,474 Costs for employee severance indemnity and defined employee benefit plans 759 1,083 Costs for employee incentive plans 1,935 0 Losses on disposals of non-current assets 106 92 Effects of valuation using equity method (319) (1,292) Gains on disposals of non-current assets (1,130) (745) Subtotal 21,625 21,754 Changes in operating assets and liabilities (working capital): Trade receivables 3,805 8,401 Inventories and Amounts due by customers (135,788) (62,131) Trade payables 843 (4,438) Provision for risks and charges (392) 3,415 Advances from customers 23,154 3,209 Other operating assets 16,789 (54,398) Other operating liabilities (10,796) 7,300 Payments of employee severance indemnity and defined employee benefit plans (1,420) (2,270) Subtotal (103,805) (100,912) Total (58,109) (60,286) B - CASH FLOW FROM INVESTMENT ACTIVITIES: Purchase of investment property 3 3 Net investment in intangible assets (216) (103) Net investment in tangible assets (37,094) (46,825)
Sale (Purchase) of other equity investments net of acquired cash flow, hedging of non consolidated company losses and other changes in the area of consolidation (1,268) (4,334)
Income from the sale of tangible and intangible assets, and investment property 1,024 653 Change in financing of equity investments 3,416 1,713

37
Total (34,135) (48,893) C - CASH FLOW FROM FINANCING ACTIVITIES: Dividends paid + other changes (7,717) (2,583) Opening (repayment) of non-current loans net of commissions 69,733 19,031 Net change in current financial payables (including leasing agreements) 25,682 78,999 Sale (purchase) securities/bonds and treasury shares 164 9,552 Total 87,862 104,999 NET INCREASE (DECREASE) OF CASH AND CASH EQUIVALENTS (4,382) (4,180) CASH AND CASH EQUIVALENTS AT START OF PERIOD 295,538 237,623 CASH AND CASH EQUIVALENTS AT END OF PERIOD 291,156 233,443
38
EXPLANATORY NOTES TO THE CONSOLIDATED ACCOUNTS
General Information
The Astaldi Group, which has operated for over 80 years in Italy and abroad in the sector of
the design and construction of major civil engineering works, is one of the most important
groups operating in the international construction sector, and is a leading general contractor
and promoter of project finance initiatives in Italy.
The Group operates through the Parent Company, Astaldi, a public company with registered
offices in Rome, Via Giulio Vincenzo Bona 65, listed in the STAR segment of the Milan
Stock Exchange since June 2002.
Form, Contents and Criteria of Financial Statements
The summarized half-yearly consolidated financial statements (henceforth referred to as the
half-yearly consolidated financial statements) of the Astaldi Group at 30 June 2008,
formulated pursuant to Art. 154-ter paragraph 2 and 3 of the Finance Consolidation Act, has
been drawn up in compliance with the International Financial Reporting Standards approved
by the European Union and in accordance with CONSOB regulations regarding international
accounting standards.
These standards are integrated with the interpretations by the IFRIC (International Financial
Reporting Interpretations Committee) and SIC (Standing Interpretations Committee) also
approved by the European Union.
The Group opted to present its half-yearly consolidated financial statements in a concise
format as provided for in IAS 34.
39
Therefore, this document, does not contain all the information normally provided for in
financial statements and must be read jointly with the consolidated financial statements of
the Group at 31 December 2007.
Specifically, the half-yearly consolidated financial statements comprise:
1. Income Statement;
2. Balance Sheet;
3. Schedule of changes in equity;
4. Cash flow statement;
5. Notes.
The accounting standards adopted in the drafting of the half-yearly consolidated financial
statements are in compliance with the ones applied for drafting the consolidated financial
statements of the Group for the year ended at 31 December 2007. It is expected that the
same standards will be applied in drafting the consolidated financial statements for 2008.
However, these standards may not coincide with the provisions of the IAS/IFRS in force at
31 December 2007 as a result of future European Commission policies being approved and
modifying international accounting standards or their interpretation. Finally, it should be
pointed out that in first half 2008 there were no approval measures by the European Union.
In this regard, see the contents of the consolidated financial statements at 31 December
2007. On the other hand, in relation to the amendments and new versions of accounting
principles and interpretations issued respectively by the IASB and IFRIC in the first half
2008, but as already stated not yet approved on the date when this report was drawn up,
the following table shows the innovations currently assumed to be significant for the Group.
After an initial analysis, the Group believes that the possible impact on the financial
statements is not likely to be especially significant. It should in any case be recalled that the

40
first date for the application of many of these will start from 1 January 2009, while for the
others it will be subsequent to 2009.
Standard –
Interpretation
Type Summary – contents Date of
application
IFRS 3 New version The main changes to IFRS 3 regard the
elimination of the requirement to evaluate the
single assets and liabilities of the subsidiary at
fair value in any subsequent acquisition, in the
case of the gradual acquisition of subsidiaries.
In the case of acquisitions of equity under
100%, the share of minority interests equity may
be evaluated either at fair value, or using the
method already provided for previously in IFRS
3.
1 January 2010
IAS 27 Amendment Changes in the share of equity not involving the
loss of control must be regarded as equity
transactions with the equity method. Losses
attributable to minority shareholders shall be
allocated to the quota of minority interests
equity, even when these exceed their
corresponding share in the capital of the
company concerned.
1 January 2010
IFRS 2 Amendment For purposes of valuation of instruments of
remuneration based on shares, only the
1 January 2009
41
employment conditions and performance
conditions may be considered as conditions for
accrual in the plans. Furthermore, in case of
cancellation of the plan, the same accounting
conditions shall be applied, whether the plan
derives from the company, or from the
counterpart.
IFRS 5 Change If an enterprise has agreed to a disposal plan
involving the loss of control over a subsidiary,
all the assets and liabilities of the subsidiary
shall be reclassified under assets earmarked for
sale, even if after the disposal the company
retains a minority stake in the former subsidiary.
1 January 2010
IAS 1 Change The assets and liabilities deriving from
derivatives not held for investment purposes
shall be classified in the financial statements
distinguishing between current and non-current
assets and liabilities.
1 January 2009
IAS 20 Change The benefits deriving from loans granted by a
government authority at an interest rate far
below the market rate shall be treated as public
subsidies and thus follow the rules for
classification set forth in IAS 20
1 January 2009
42
IAS 28 Change In the case of equity holdings valued under the
equity method, no eventual loss of value must
be allocated to single assets (and in particular
to goodwill) composing the book value of the
equity, but rather to the overall value of the
subsidiary. Therefore, when there are the
conditions for the subsequent recovery of the
value, this recovery must be entered to the full.
1 January 2009
IAS 39 Change Definition of new effective yield rates for a
financial instrument at the end of the status of
hedging of fair value.
1 January 2009
The half-yearly consolidated financial statements are drawn up in Euro, which is the
operating and reference currency of the Parent Company; in this regard it should also be
pointed out that Annex “C” shows the exchange rates utilized by the Group on 30 June 2008
for the conversion of the financial statements and accounting items expressed in currencies
other than the Euro.
All the figures are shown in thousands of Euros unless otherwise stated. Consequently, in
some schedules, the total amounts may differ slightly from the sum of the amounts
composing them due to rounding-up.
Finally, these half-yearly consolidated financial statements at 30 June 2008 are subject to
limited auditing as set forth by CONSOB Ruling no. 10867 of 31 July 1997.
The results of this activity, undertaken by the auditing company Reconta Ernst & Young
S.p.A., will be made public in compliance with applicable regulations.

43
Use of Estimates
In compliance with the IFRSs, drafting of the half-yearly consolidated financial statements
and accompanying notes requires the formulation of estimates and undertakings which
affect the values of the financial statement assets and liabilities and the information related
to potential assets and liabilities. The estimates are used, for example, to enter provisions
for bad debts, contracts in progress, amortizations, write-down of receivables, employee
benefits, taxes, other provisions and allocations. In particular, for employee benefits, we
should point out the new type of defined contribution plan for employee severance
indemnity, the details of which are discussed in detail in the 2007 financial statements.
The estimates are based on the most recent information available to company management
at the time of drafting of this document, without adverse effects on its reliability.
The results which might emerge could differ from these estimates. The estimates and
undertakings are reviewed periodically and the effects of any changes are reflected in the
income statement in the period in which the change occurred. More specifically, taking into
account the specific sector of the Group, which provides for a fee payment at the time of
awarding of the single contracts, it should be pointed out that the margins on these
contracts, recorded in the income statement on the basis of systematic calculation criteria,
may change with respect to the original estimate. This is related to the probability of
recovering the higher charges that may be incurred during the performance of the works.
Finally, with regard to the taxes calculated in these financial statements, it should be pointed
out that they were allocated on the basis of current tax rates, deemed to be applicable to the
expected annual results on the basis of the rules in force, also in the countries where the
Group operates.
Area of Consolidation

44
There follows a list of the subsidiaries companies included in the area of consolidation.
Subsidiaries %
1 Astaldi Algerie E.U.r.l. 100.00%
2 Astaldi Arabia Limited 100.00%
3 Astaldi Construction Corporation 100.00%
4 Astaldi International Inc. 100.00%
5 Astaldi International Limited 100.00%
6 Astaldi-Astaldi International J.V. 100.00%
7 Astaldi-Burundi Association Momentanée 100.00%
8 Cospe S.C.r.l. 100.00%
9 Diga di Arcichiaro S.C.r.l. in liquidation 100.00%
10 DIP.A. S.C.r.l. in liquidation 100.00%
11 Euroast S.r.l. in liquidation 100.00%
12 Groupement G.R.S.H. 100.00%
13 Linea A S.C.r.l. in liquidation 100.00%
14 Montedil-Astaldi S.p.A. (MONTAST) in liquidation 100.00%
15 Redo-Association Momentanée 100.00%
16 Sartori Sud S.r.l. 100.00%
17 Seac S.p.a.r.l. in liquidation 100.00%
18 Italstrade IS S.r.l. 100.00%
19 Todaro S.r.l. in liquidation 100.00%
20 Astaldi Bulgaria LTD 100.00%
21 AR.GI S.p.A. 99.99%
22 CO.MERI S.p.A. 99.99%
23 Consorzio Astaldi-C.M.B. Due in liquidation 99.99%
24 I.F.C. Due S.C.a.r.l. in liquidation 99.99%
25 Astaldi Finance S.A. 99.96%
26 Astaldi de Venezuela C.A. 99.80%
27 Romairport S.r.l. 99.26%
28 ASTALROM S.A. 99.12%
29 Astur Construction and Trade A.S. 99.00%
30 Palese Park S.r.l. 99.00%
31 Silva S.r.l. in liquidation 99.00%
32 Toledo S.C.r.l. 90.39%
33 Susa Dora Quattro S.C.r.l. 90.00%
34 CO.N.O.C.O. S.C.r.l. 80.00%
35 Eco Po Quattro S.C.r.l. in liquidation 80.00%
36 Portovesme S.C.r.l. 80.00%
37 S.Filippo S.C.r.l. in liquidation 80.00%
45
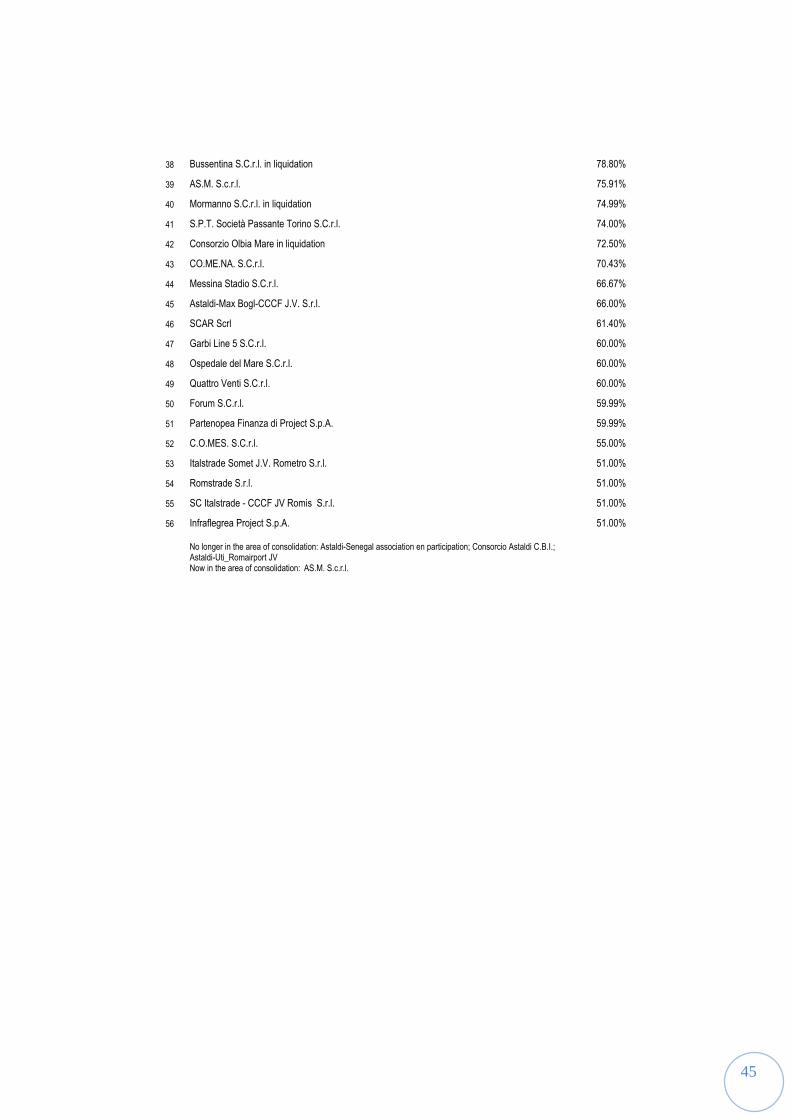
38 Bussentina S.C.r.l. in liquidation 78.80%
39 AS.M. S.c.r.l. 75.91%
40 Mormanno S.C.r.l. in liquidation 74.99%
41 S.P.T. Società Passante Torino S.C.r.l. 74.00%
42 Consorzio Olbia Mare in liquidation 72.50%
43 CO.ME.NA. S.C.r.l. 70.43%
44 Messina Stadio S.C.r.l. 66.67%
45 Astaldi-Max Bogl-CCCF J.V. S.r.l. 66.00%
46 SCAR Scrl 61.40%
47 Garbi Line 5 S.C.r.l. 60.00%
48 Ospedale del Mare S.C.r.l. 60.00%
49 Quattro Venti S.C.r.l. 60.00%
50 Forum S.C.r.l. 59.99%
51 Partenopea Finanza di Project S.p.A. 59.99%
52 C.O.MES. S.C.r.l. 55.00%
53 Italstrade Somet J.V. Rometro S.r.l. 51.00%
54 Romstrade S.r.l. 51.00%
55 SC Italstrade - CCCF JV Romis S.r.l. 51.00%
56 Infraflegrea Project S.p.A. 51.00%
No longer in the area of consolidation: Astaldi-Senegal association en participation; Consorcio Astaldi C.B.I.; Astaldi-Uti_Romairport JV Now in the area of consolidation: AS.M. S.c.r.l.

46
Analysis of the main changes in income statement and balance sheet items
1. Revenues: EUR 672,769 (EUR 565,609)
Revenues from works at 30 June 2008, shows an increase of approximately 19% compared
to the same period of the previous year. This item consists of the following: 30/06/08 30/06/07 Change Revenues from sales and services 258,590 295,883 (37,294)
Change in products in progress, semi-finished and finished, and building initiatives 3,956 391 3,565 Change in contracts in progress 410,223 269,335 140,888
Total 672,769 565,609 107,160
The increase derives mainly from the domestic area as well as the European and Asian
areas, where major contracts have recently been acquired, in particular in Turkey and Qatar.
The geographical composition of the item is the following:
30/06/08 % 30/06/07 % Change
Italy 347,902 51.7% 210,428 37.2% 137,474
Europe 88,261 13.1% 77,870 13.8% 10,391
America 127,733 19.0% 177,597 31.4% (49,865)
Africa 79,238 11.8% 79,920 14.1% (682)
Asia 29,636 4.4% 19,794 3.5% 9,841
Total 672,769 100.0% 565,609 100.0% 107,160
For further details see the Interim Management Report.
2. Other revenues: EUR 31,886 (EUR 29,389)
Other revenues rose by approximately 8.5% with respect to the last period and comprised
items not directly related to the Group’s production activity, but in any case secondary to the
core business and of a lasting nature. This item is composed as follows:
30/06/08 30/06/07 Change
Revenues from sales of goods 3,957 3,285 672
Services to third parties 11,059 10,699 360
Services for the management of joint initiatives 1,304 1,129 175
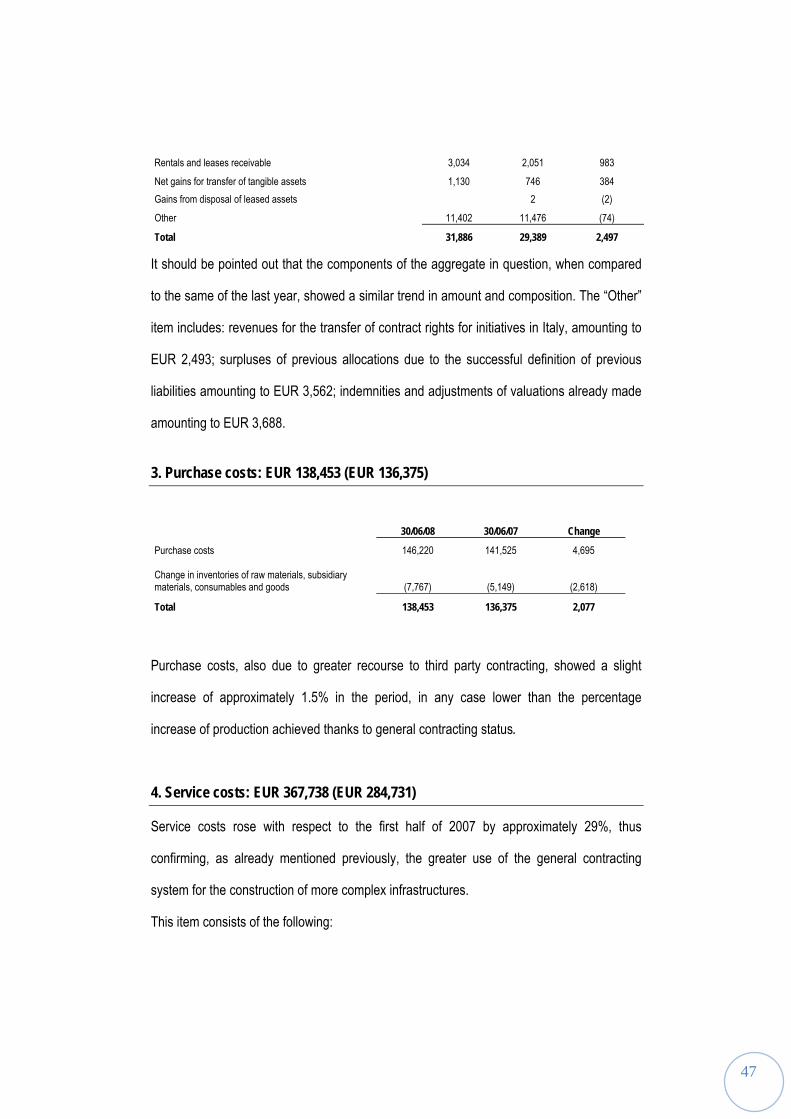
47
Rentals and leases receivable 3,034 2,051 983
Net gains for transfer of tangible assets 1,130 746 384 Gains from disposal of leased assets 2 (2)
Other 11,402 11,476 (74)
Total 31,886 29,389 2,497
It should be pointed out that the components of the aggregate in question, when compared
to the same of the last year, showed a similar trend in amount and composition. The “Other”
item includes: revenues for the transfer of contract rights for initiatives in Italy, amounting to
EUR 2,493; surpluses of previous allocations due to the successful definition of previous
liabilities amounting to EUR 3,562; indemnities and adjustments of valuations already made
amounting to EUR 3,688.
3. Purchase costs: EUR 138,453 (EUR 136,375)
30/06/08 30/06/07 Change
Purchase costs 146,220 141,525 4,695
Change in inventories of raw materials, subsidiary materials, consumables and goods (7,767) (5,149) (2,618)
Total 138,453 136,375 2,077
Purchase costs, also due to greater recourse to third party contracting, showed a slight
increase of approximately 1.5% in the period, in any case lower than the percentage
increase of production achieved thanks to general contracting status.
4. Service costs: EUR 367,738 (EUR 284,731)
Service costs rose with respect to the first half of 2007 by approximately 29%, thus
confirming, as already mentioned previously, the greater use of the general contracting
system for the construction of more complex infrastructures.
This item consists of the following:
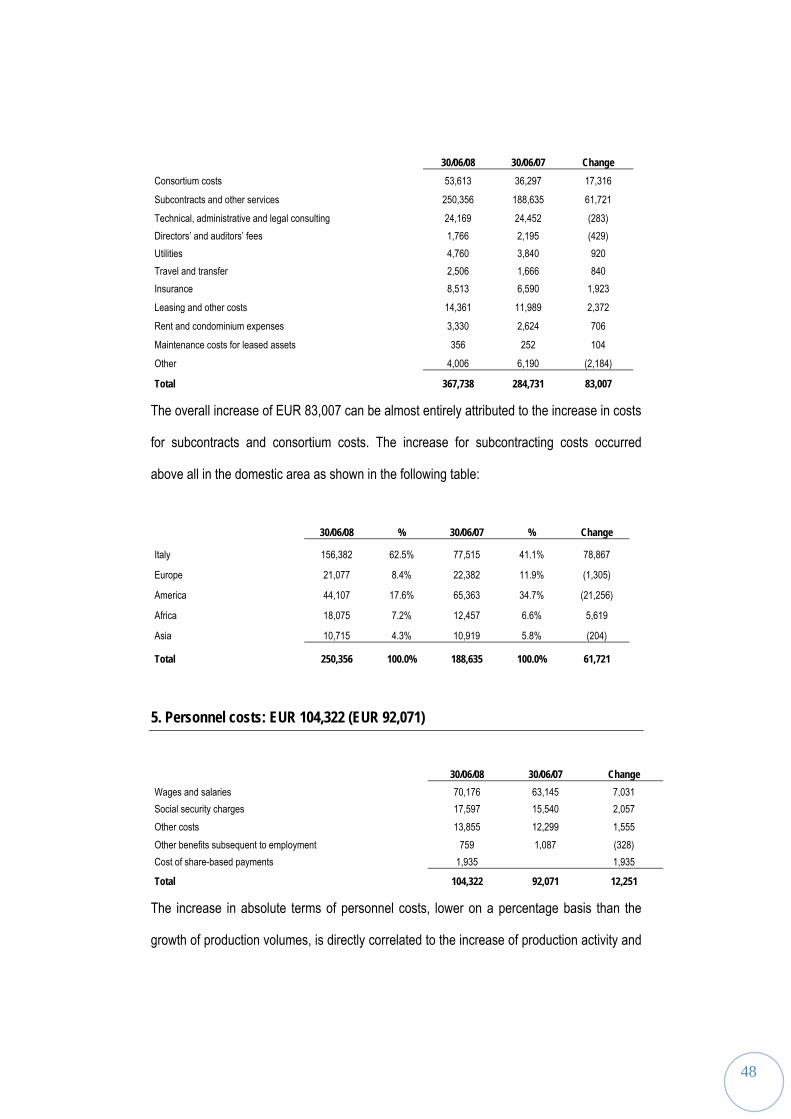
48
30/06/08 30/06/07 Change Consortium costs 53,613 36,297 17,316
Subcontracts and other services 250,356 188,635 61,721
Technical, administrative and legal consulting 24,169 24,452 (283) Directors’ and auditors’ fees 1,766 2,195 (429) Utilities 4,760 3,840 920 Travel and transfer 2,506 1,666 840 Insurance 8,513 6,590 1,923
Leasing and other costs 14,361 11,989 2,372
Rent and condominium expenses 3,330 2,624 706
Maintenance costs for leased assets 356 252 104
Other 4,006 6,190 (2,184)
Total 367,738 284,731 83,007
The overall increase of EUR 83,007 can be almost entirely attributed to the increase in costs
for subcontracts and consortium costs. The increase for subcontracting costs occurred
above all in the domestic area as shown in the following table:
30/06/08 % 30/06/07 % Change
Italy 156,382 62.5% 77,515 41.1% 78,867
Europe 21,077 8.4% 22,382 11.9% (1,305)
America 44,107 17.6% 65,363 34.7% (21,256)
Africa 18,075 7.2% 12,457 6.6% 5,619
Asia 10,715 4.3% 10,919 5.8% (204)
Total 250,356 100.0% 188,635 100.0% 61,721
5. Personnel costs: EUR 104,322 (EUR 92,071)
30/06/08 30/06/07 Change Wages and salaries 70,176 63,145 7,031 Social security charges 17,597 15,540 2,057 Other costs 13,855 12,299 1,555 Other benefits subsequent to employment 759 1,087 (328) Cost of share-based payments 1,935 1,935
Total 104,322 92,071 12,251
The increase in absolute terms of personnel costs, lower on a percentage basis than the
growth of production volumes, is directly correlated to the increase of production activity and
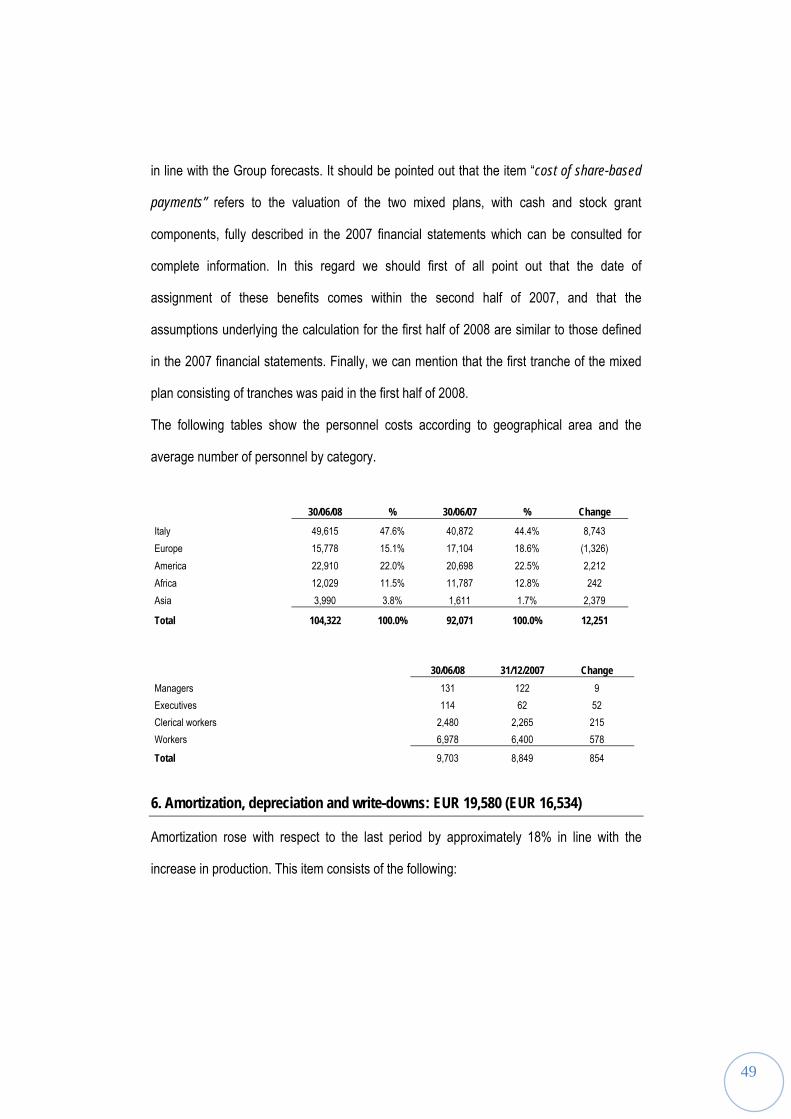
49
in line with the Group forecasts. It should be pointed out that the item “cost of share-based
payments” refers to the valuation of the two mixed plans, with cash and stock grant
components, fully described in the 2007 financial statements which can be consulted for
complete information. In this regard we should first of all point out that the date of
assignment of these benefits comes within the second half of 2007, and that the
assumptions underlying the calculation for the first half of 2008 are similar to those defined
in the 2007 financial statements. Finally, we can mention that the first tranche of the mixed
plan consisting of tranches was paid in the first half of 2008.
The following tables show the personnel costs according to geographical area and the
average number of personnel by category.
30/06/08 % 30/06/07 % Change
Italy 49,615 47.6% 40,872 44.4% 8,743 Europe 15,778 15.1% 17,104 18.6% (1,326) America 22,910 22.0% 20,698 22.5% 2,212 Africa 12,029 11.5% 11,787 12.8% 242 Asia 3,990 3.8% 1,611 1.7% 2,379
Total 104,322 100.0% 92,071 100.0% 12,251
30/06/08 31/12/2007 Change Managers 131 122 9 Executives 114 62 52 Clerical workers 2,480 2,265 215 Workers 6,978 6,400 578
Total 9,703 8,849 854
6. Amortization, depreciation and write-downs: EUR 19,580 (EUR 16,534)
Amortization rose with respect to the last period by approximately 18% in line with the
increase in production. This item consists of the following:
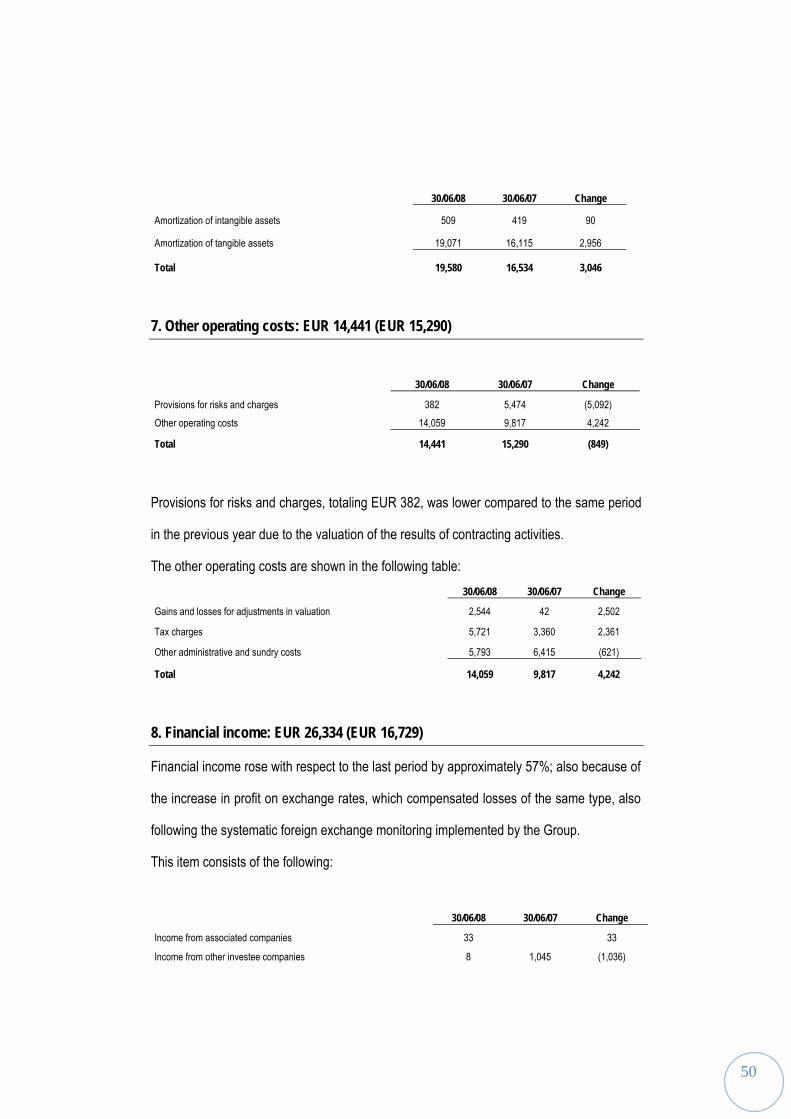
50
30/06/08 30/06/07 Change
Amortization of intangible assets 509 419 90
Amortization of tangible assets 19,071 16,115 2,956
Total 19,580 16,534 3,046
7. Other operating costs: EUR 14,441 (EUR 15,290)
30/06/08 30/06/07 Change
Provisions for risks and charges 382 5,474 (5,092) Other operating costs 14,059 9,817 4,242
Total 14,441 15,290 (849)
Provisions for risks and charges, totaling EUR 382, was lower compared to the same period
in the previous year due to the valuation of the results of contracting activities.
The other operating costs are shown in the following table: 30/06/08 30/06/07 Change
Gains and losses for adjustments in valuation 2,544 42 2,502
Tax charges 5,721 3,360 2,361
Other administrative and sundry costs 5,793 6,415 (621)
Total 14,059 9,817 4,242
8. Financial income: EUR 26,334 (EUR 16,729)
Financial income rose with respect to the last period by approximately 57%; also because of
the increase in profit on exchange rates, which compensated losses of the same type, also
following the systematic foreign exchange monitoring implemented by the Group.
This item consists of the following:
30/06/08 30/06/07 Change
Income from associated companies 33 33
Income from other investee companies 8 1,045 (1,036)

51
Income from financial operations with banks 7,605 3,873 3,732 Surety fees 539 236 302
Exchange rate profit 9,154 4,888 4,267 Income from derivatives 3,209 2,993 216
Revaluation of securities 392 (392)
Other financial income 5,785 3,302 2,483
Total 26,334 16,729 9,605
The item other financial income totaling EUR 5,785 consists mainly of: recording by the
Croatia branch of interest receivable on the arbitration proceedings for the construction of
the Zagreb-Goričan motorway, accrued for the period, with reference to the period
concerned in this report, totaling EUR 2,034; recording by the Parent Company of interest
for arrears by clients, mainly public clients.
9. Financial charges: EUR 47,706 (EUR 35,711)
The financial charges totaling EUR 47,706, with respect to the previous period, rose by
approximately 33%, considerably lower in percentage terms with respect to the increase of
financial income.
This item consists of the following:
30/06/08 30/06/07 Change
Surety fees 5,863 6,081 (-219)
Charges from financial transactions with banks 26,939 17,022 9,917
Exchange rate losses 5,586 3,890 1,696
Charges from derivatives 1,094 1,150 (-56)
Financial charges on leasing agreements 612 684 (-73)
Other financial charges 7,393 4,781 2,612
Total 47,486 33,609 13,878
Depreciation of equity 85 41 44
Depreciation of securities and receivables 135 2,061 (1,926)
Total 220 2,102 (1,882)
Total financial charges 47,706 35,711 11,995

52
In particular, the item “charges from financial transactions with banks” mainly refers to:
EUR 20,204: interest payable on bank lending;
EUR 5,722: current account interest payable;
For the remainder, to other sundry charges, of a secondary nature, accrued in favor
of the banks.
It should finally be pointed out that the amount for sureties refers to operational bonds - Bid
Bonds and Performance Bonds - regarding the initiatives of the Group, party current and
party in the tender phase. The other financial charges item mainly refers to charges deriving
from the transfer of all risks and benefits to third parties, regarding certain financial assets
(trade receivables), in the context of the complex activity of financial planning of contracts in
progress.
10. Effects of valuation of equity investments with the equity method: EUR 319
(EUR 1,292)
The effects of valuation of equity investments with the equity method recorded an economic
decrease above all in relation to:
The conversion into a consortium company of “Metro C”, operating, in compliance
with current legislation, on its own behalf but on behalf of the consortium members;
The end of the works regarding the activities of the Metro Los Teques Consortium,
already operating in Venezuela, for the construction of an underground line.
11. Taxes: EUR 15,389 (EUR 13,705)
The taxes of the Group at 30 June 2008 totaled EUR 15,389, with an increase of
approximately EUR 1,684 with respect to the same period last year. However, the tax rate

53
fell with respect to the last period of 2007 (2008: 39%; 2007: 42%), although at the time of
the drafting of this report, this fall is not expected to occur for the end of the current financial
year.
This item consists of the following:
30/06/08 30/06/07 Change Current taxes 13,481 10,969 2,512 Net deferred taxes (anticipated) 2.220 609 1,611 Taxes related to previous years (312) 2,126 (2,438)
Total 15,389 13,705 1,684
Finally, it should be pointed out that at 30 June 2008 deferred taxation showed a positive
balance totaling EUR 3,901 as shown in the following table:
30/06/08 30/06/07 Change Deferred taxes receivable 4,629 7,078 (2,449) Deferred taxes payable 728 182 546
Total 3,901 6,896 2,995
12. Property, plant and equipment: EUR 264,506 (EUR 246,483)
This item increased by approximately EUR 18,023 compared to 31 December 2007 as
shown in the following table.
Land and Specific
and Excavators,
power shovels
Various equipment
Fixed assets in progress Total
buildings general plant
and vehicles
and machinery
and advances
Value at 31/12/2007, net of depreciation (1) 40,849 57,427 48,103 34,674 65,429 246,483 Increases
- deriving from acquisitions 601 13,895 7,540 8,740 12,795 43,571
41,451 71,323 55,643 43,414 78,224 290,054

54
Depreciation -471 -6,147 -7,704 -4,745 -19,068
Other disposals -757 -1,371 -2,757 -1,287 -6,172 Exchange rate differences -151 -94 -70 -7 -322 Other changes 44 -10 -15 -5 -1 13
Value at 30.06.2008, net of depreciation (2) 40,872 64,314 46,483 35,900 76,936 264,506 (1) of which
- Cost 44,914 89,780 97,317 62,547 65,429 359,988 - Provision for depreciation -4,065 -32,353 -49,214 -27,873 -113,505
Net value 40,849 57,427 48,103 34,674 65,429 246,483 (2) of which
- Cost 45,351 100,566 100,344 68,424 76,936 391,622 - Provision for depreciation -4,479 -36,252 -53,861 -32,523 -127,115
Net value 40,872 64,314 46,483 35,900 76,936 264,506
For further details see the Half-Yearly Management Report.
13. Equity investments: EUR 98,463 (EUR 96,877)
The value of equity investments showed a slight increase with respect to 31 December 2007
and has the following composition:
30/06/08 31/12/07 Change Equity investments valued with the equity method
96,454 94,851 1,603 Equity investments valued at cost
2,010 2,026 (16)
Total 98,463 96,877 1,586
Non-current equity investments entered at cost are represented net of the depreciation
provision totaling EUR 8.
14. Financial assets
Non-current financial assets: EUR 6,913 (EUR 10,329)
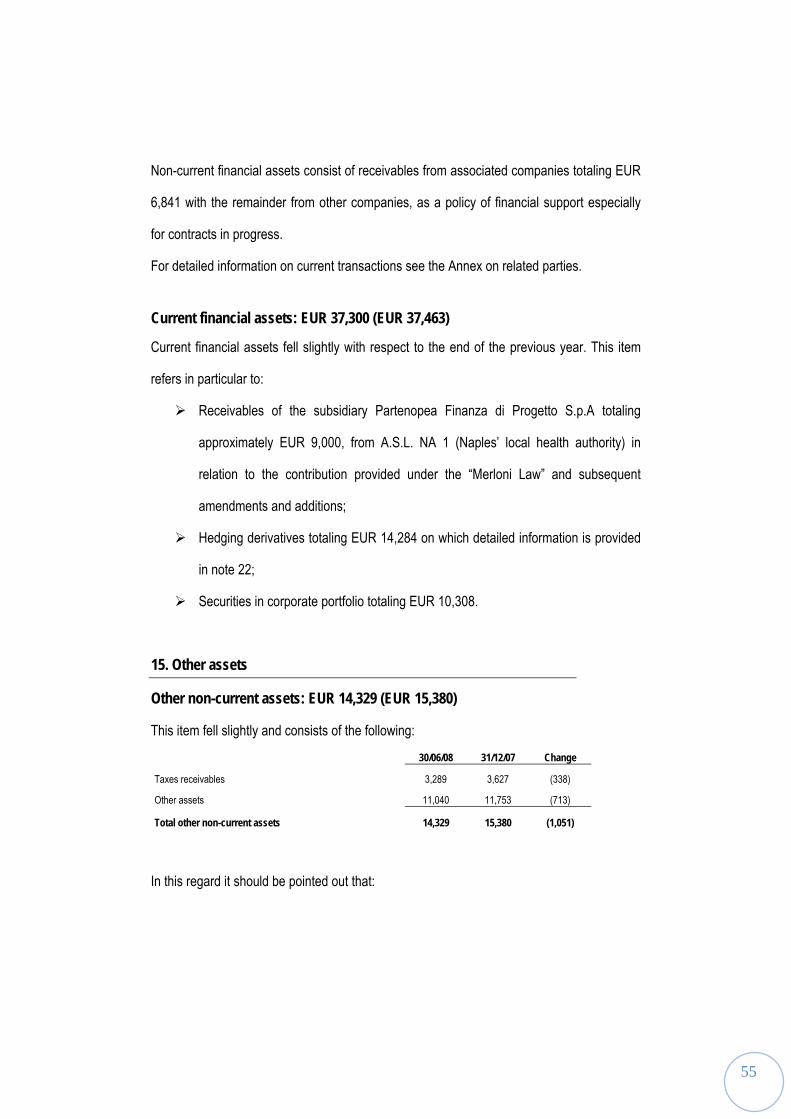
55
Non-current financial assets consist of receivables from associated companies totaling EUR
6,841 with the remainder from other companies, as a policy of financial support especially
for contracts in progress.
For detailed information on current transactions see the Annex on related parties.
Current financial assets: EUR 37,300 (EUR 37,463)
Current financial assets fell slightly with respect to the end of the previous year. This item
refers in particular to:
Receivables of the subsidiary Partenopea Finanza di Progetto S.p.A totaling
approximately EUR 9,000, from A.S.L. NA 1 (Naples’ local health authority) in
relation to the contribution provided under the “Merloni Law” and subsequent
amendments and additions;
Hedging derivatives totaling EUR 14,284 on which detailed information is provided
in note 22;
Securities in corporate portfolio totaling EUR 10,308.
15. Other assets
Other non-current assets: EUR 14,329 (EUR 15,380)
This item fell slightly and consists of the following:
30/06/08 31/12/07 Change
Taxes receivables 3,289 3,627 (338)
Other assets 11,040 11,753 (713)
Total other non-current assets 14,329 15,380 (1,051)
In this regard it should be pointed out that:
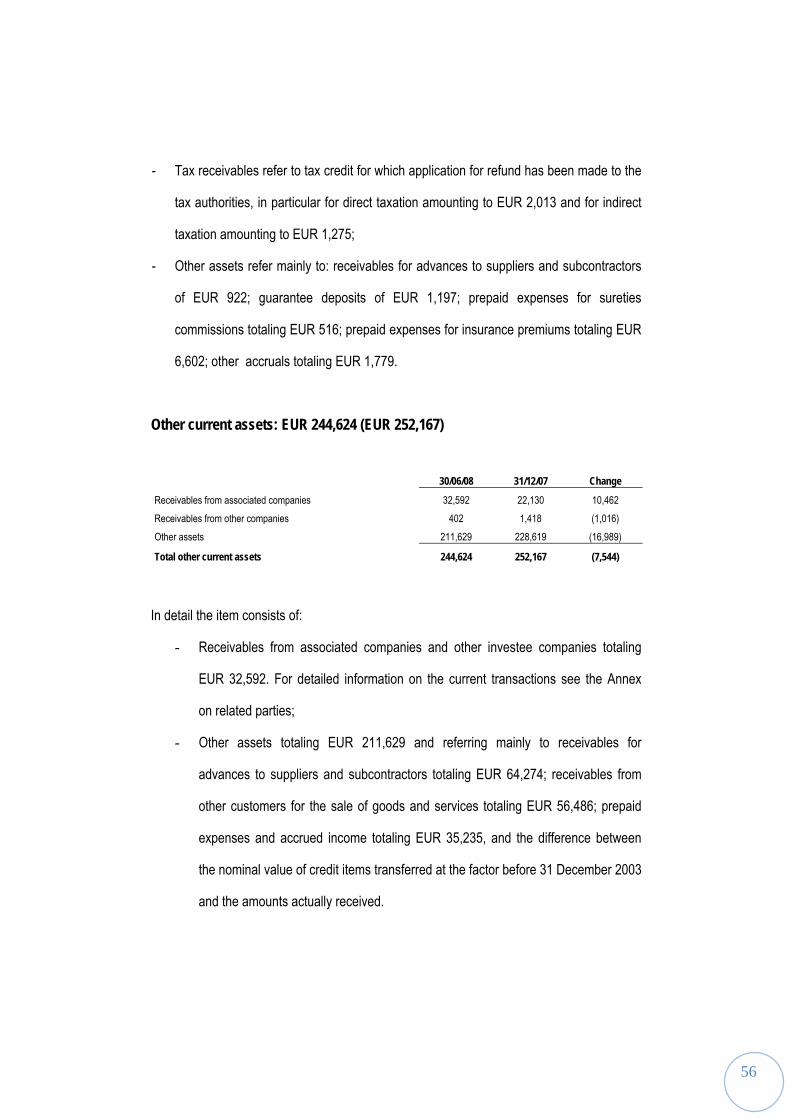
56
- Tax receivables refer to tax credit for which application for refund has been made to the
tax authorities, in particular for direct taxation amounting to EUR 2,013 and for indirect
taxation amounting to EUR 1,275;
- Other assets refer mainly to: receivables for advances to suppliers and subcontractors
of EUR 922; guarantee deposits of EUR 1,197; prepaid expenses for sureties
commissions totaling EUR 516; prepaid expenses for insurance premiums totaling EUR
6,602; other accruals totaling EUR 1,779.
Other current assets: EUR 244,624 (EUR 252,167)
30/06/08 31/12/07 Change
Receivables from associated companies 32,592 22,130 10,462 Receivables from other companies 402 1,418 (1,016) Other assets 211,629 228,619 (16,989)
Total other current assets 244,624 252,167 (7,544)
In detail the item consists of:
- Receivables from associated companies and other investee companies totaling
EUR 32,592. For detailed information on the current transactions see the Annex
on related parties;
- Other assets totaling EUR 211,629 and referring mainly to receivables for
advances to suppliers and subcontractors totaling EUR 64,274; receivables from
other customers for the sale of goods and services totaling EUR 56,486; prepaid
expenses and accrued income totaling EUR 35,235, and the difference between
the nominal value of credit items transferred at the factor before 31 December 2003
and the amounts actually received.
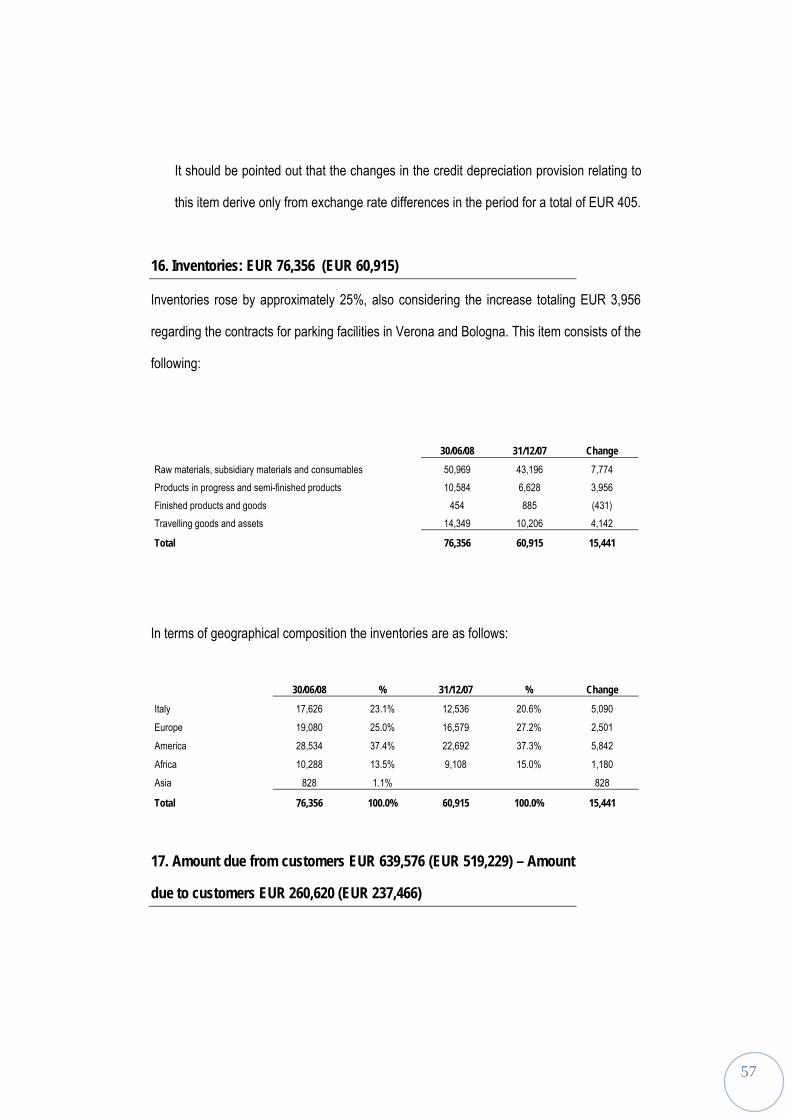
57
It should be pointed out that the changes in the credit depreciation provision relating to
this item derive only from exchange rate differences in the period for a total of EUR 405.
16. Inventories: EUR 76,356 (EUR 60,915)
Inventories rose by approximately 25%, also considering the increase totaling EUR 3,956
regarding the contracts for parking facilities in Verona and Bologna. This item consists of the
following:
30/06/08 31/12/07 Change Raw materials, subsidiary materials and consumables 50,969 43,196 7,774 Products in progress and semi-finished products 10,584 6,628 3,956 Finished products and goods 454 885 (431) Travelling goods and assets 14,349 10,206 4,142
Total 76,356 60,915 15,441
In terms of geographical composition the inventories are as follows:
30/06/08 % 31/12/07 % Change
Italy 17,626 23.1% 12,536 20.6% 5,090
Europe 19,080 25.0% 16,579 27.2% 2,501 America 28,534 37.4% 22,692 37.3% 5,842
Africa 10,288 13.5% 9,108 15.0% 1,180
Asia 828 1.1% 828
Total 76,356 100.0% 60,915 100.0% 15,441
17. Amount due from customers EUR 639,576 (EUR 519,229) – Amount
due to customers EUR 260,620 (EUR 237,466)
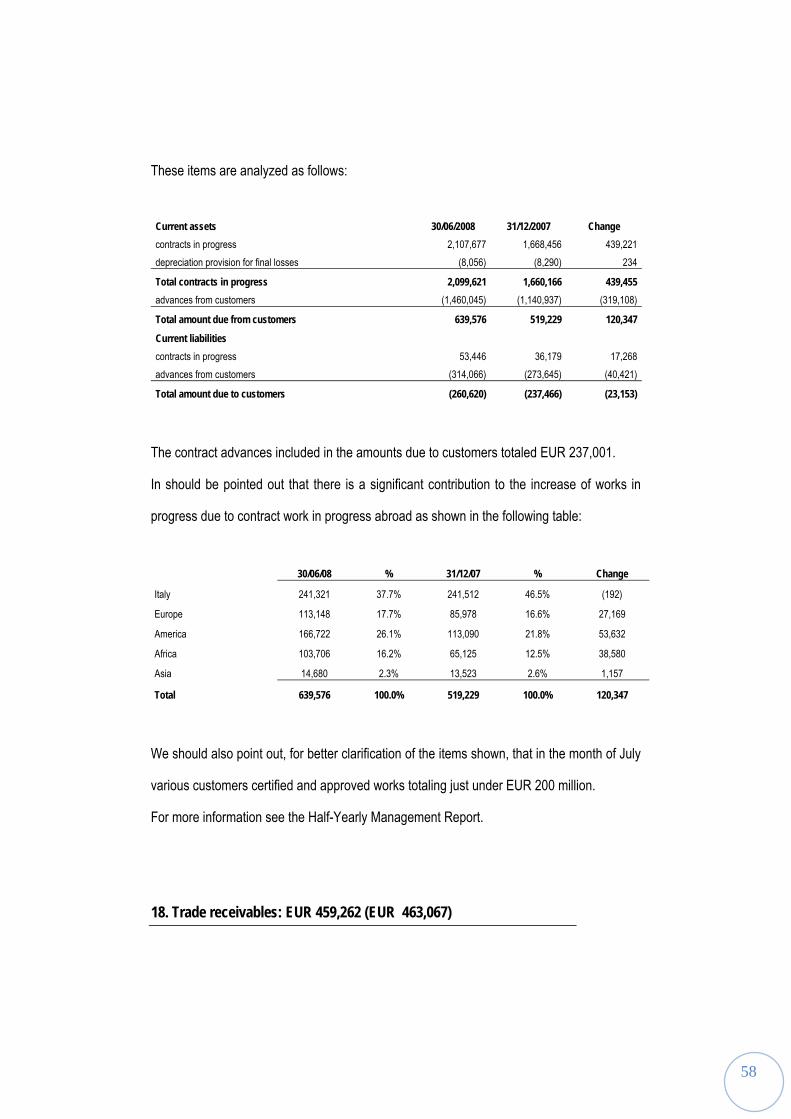
58
These items are analyzed as follows:
Current assets 30/06/2008 31/12/2007 Change contracts in progress 2,107,677 1,668,456 439,221 depreciation provision for final losses (8,056) (8,290) 234
Total contracts in progress 2,099,621 1,660,166 439,455 advances from customers (1,460,045) (1,140,937) (319,108)
Total amount due from customers 639,576 519,229 120,347
Current liabilities contracts in progress 53,446 36,179 17,268 advances from customers (314,066) (273,645) (40,421)
Total amount due to customers (260,620) (237,466) (23,153)
The contract advances included in the amounts due to customers totaled EUR 237,001.
In should be pointed out that there is a significant contribution to the increase of works in
progress due to contract work in progress abroad as shown in the following table:
30/06/08 % 31/12/07 % Change
Italy 241,321 37.7% 241,512 46.5% (192)
Europe 113,148 17.7% 85,978 16.6% 27,169
America 166,722 26.1% 113,090 21.8% 53,632
Africa 103,706 16.2% 65,125 12.5% 38,580
Asia 14,680 2.3% 13,523 2.6% 1,157
Total 639,576 100.0% 519,229 100.0% 120,347
We should also point out, for better clarification of the items shown, that in the month of July
various customers certified and approved works totaling just under EUR 200 million.
For more information see the Half-Yearly Management Report.
18. Trade receivables: EUR 459,262 (EUR 463,067)

59
30/06/08 31/12/07 Change Receivables from customers 465,006 474,026 (9,021) Receivables from associated companies 30,138 36,187 (6,050) Receivables from parent companies 24 18 6 Receivables from other investee companies 838 654 184 Depreciation funds (36,743) (47,818) 11,075
Total 459,262 463,067 (3,805)
Trade receivables show a slight expected decrease with respect to 31 December 2007 and
have the following geographical composition:
30/06/08 % 31/12/07 % Change
Italy 148,317 32.3% 129,495 28.0% 18,823
Europe 60,378 13.1% 68,957 14.9% (8,580)
America 175,132 38.1% 172,744 37.3% 2,388
Africa 65,742 14.3% 82,876 17.9% (17,134)
Asia 9,692 2.1% 8,996 1.9% 697
Total 459,262 100.0% 463,067 100.0% (3,805)
Bad debt provision
The bad debt provision, which is the result of an analytical valuation of receivables and the
provision for arrears interest, underwent the following changes during the period:
31/12/2007 Allocation Use
B/S Absorption
I/S Reclassification(*) Exchange rate diff. 30/06/2008
Receivables from customers
Provision for bad debts 17,538 381 (1,138) (10,190) 376 (90) 6,877
Provision for arrears interest 30,280 135 - (549) - - 29,866
Total 47,818 516 (851) (11,026) 376 (90) 36,743
(*) See note 25
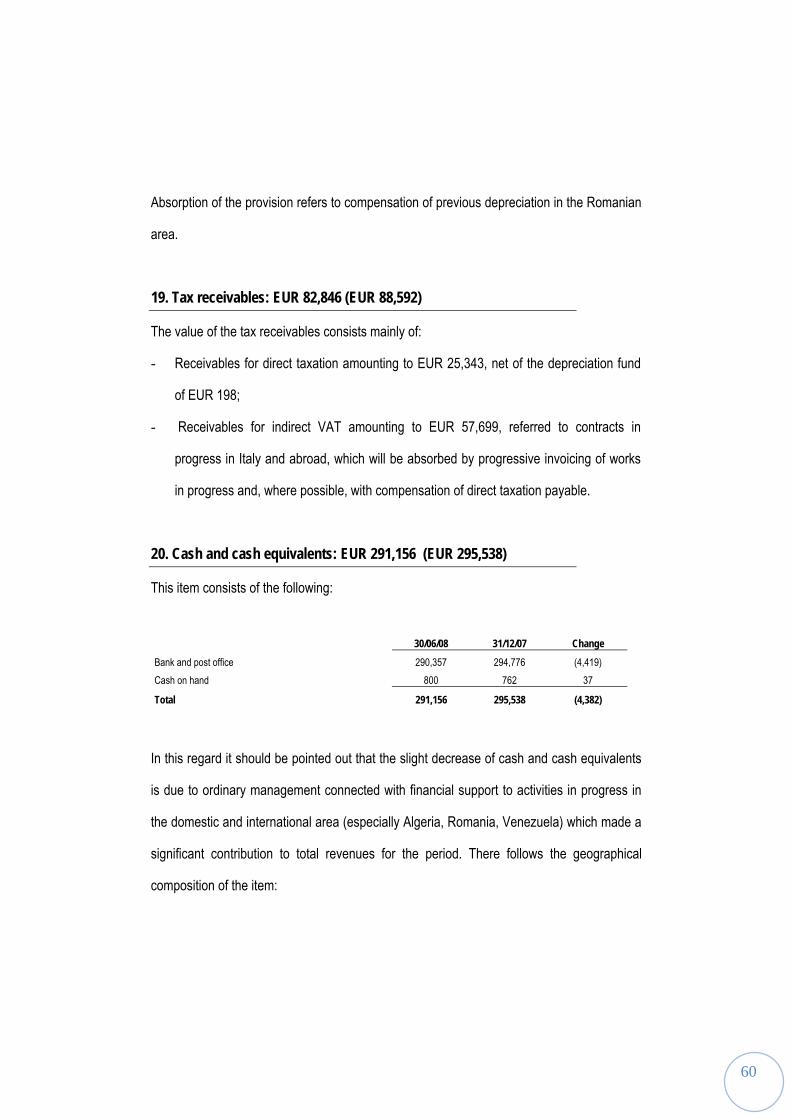
60
Absorption of the provision refers to compensation of previous depreciation in the Romanian
area.
19. Tax receivables: EUR 82,846 (EUR 88,592)
The value of the tax receivables consists mainly of:
- Receivables for direct taxation amounting to EUR 25,343, net of the depreciation fund
of EUR 198;
- Receivables for indirect VAT amounting to EUR 57,699, referred to contracts in
progress in Italy and abroad, which will be absorbed by progressive invoicing of works
in progress and, where possible, with compensation of direct taxation payable.
20. Cash and cash equivalents: EUR 291,156 (EUR 295,538)
This item consists of the following:
30/06/08 31/12/07 Change Bank and post office 290,357 294,776 (4,419) Cash on hand 800 762 37
Total 291,156 295,538 (4,382)
In this regard it should be pointed out that the slight decrease of cash and cash equivalents
is due to ordinary management connected with financial support to activities in progress in
the domestic and international area (especially Algeria, Romania, Venezuela) which made a
significant contribution to total revenues for the period. There follows the geographical
composition of the item:

61
30/06/08 31/12/07 Change
Italy 188,958 201,170 (12,212)
Europe 58,730 43,846 14,884 America 18,567 21,554 (2,987)
Africa 13,428 28,521 (15,093)
Asia 11,473 447 11,026
Total 291,156 295,538 (4,382)
It should be pointed out that cash and cash equivalents, in order to implement a cash
management policy for the single contracts, are subordinated to the same, and their use is
accurately planned with reference to the performance of works in the specific geographical
areas. In particular, we can report cash and cash equivalents totaling approximately EUR
30,000 made available for the recently acquired contract for the construction of the
underground line in Istanbul (Turkey).
21. Share capital and reserves: EUR 328,439 (EUR 312,085)
The share capital, subscribed and fully paid-up, comprises no. 98,424,900 ordinary shares
with a nominal value of 2 Euros each.
In this regard it should be pointed out that the share capital in the period considered was
reduced, amounting to EUR 956, with no. 478,000 acquired in the period and made
available to the stock grant plan. The number of treasury shares held at the end of this
period is no. 900,000 shares, as at 31 December 2007. It is furthermore specified that there
are no shares subjected to constraints or capital increases in progress subject to options.
Equity reserves are as follows:
- Legal reserve EUR 13,542
- Extraordinary reserve EUR 77,164
- Profit (loss) carried forward EUR 26,806
- Other reserves EUR (10,926)
62
The changes in share capital and reserves are illustrated in the “Schedule of changes in
equity”.
Nature, purpose and composition of reserves.
Legal reserve
The legal reserve amounts to EUR 13,542 (31.12.2007 EUR 12,152) and its composition is
in compliance with Article 2430 of the Italian Civil Code.
Extraordinary reserve
The extraordinary reserve amounts to EUR 77,164 (31.12.2007 EUR 61,857) and is credited
or charged in accordance with the resolutions of the Shareholders’ Meeting. In particular,
the reserve rose by EUR 15,307 with respect to 31 December 2007; this represents the
effect amounting to EUR 16,457, of them remaining allocation of the profit for the year 2007,
and of buy-back operations totaling EUR (1,150).
Profit carried forward
The item amounted to EUR 26,806 and reflects the economic consequences of application
of the IFRSs, consolidation of equity investments in subsidiaries, and application of the
equity method for the valuation of the associated companies and joint ventures, as well as
profit remaining among the available funds of shareholders of the individual Group
Companies.
Other reserves
This item recorded a loss of EUR 10,926. It represents an adjustment to the equity and
comprised the following:
1. The overall consequences resulting from first-time application of the International
Accounting Standards (01/01/2004 – 01/01/2005 for IAS 32/39), which were
negative for EUR 2.121;
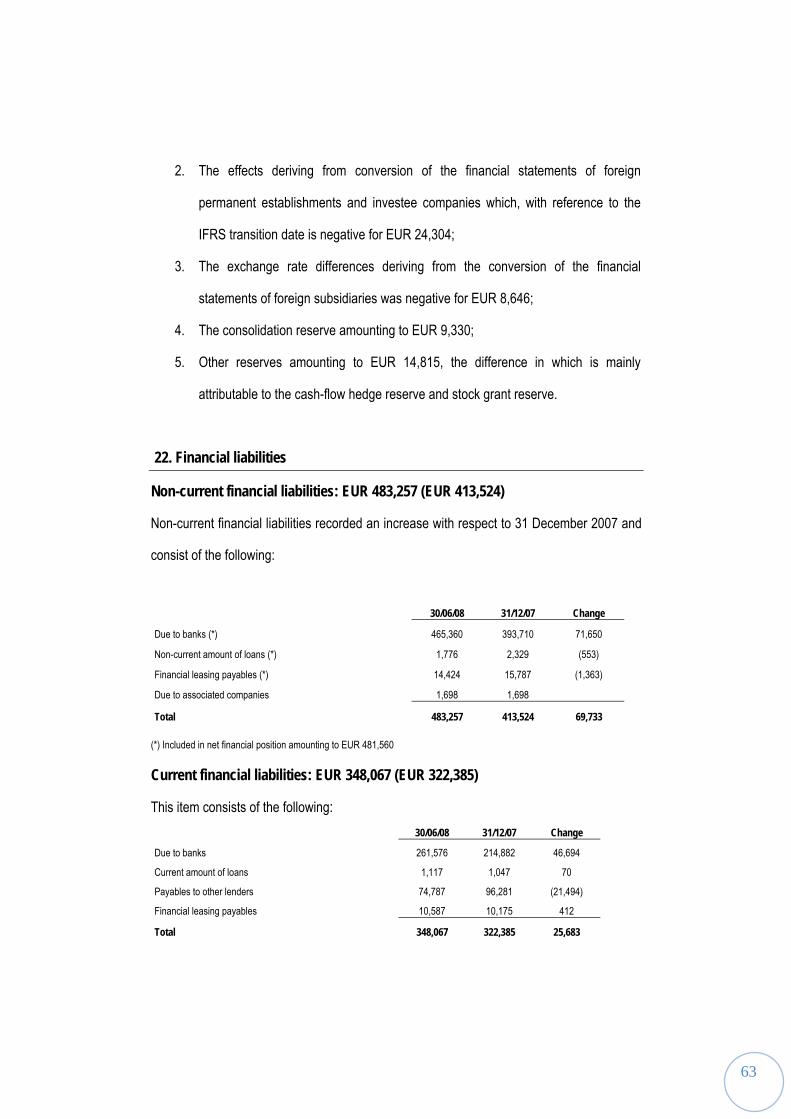
63
2. The effects deriving from conversion of the financial statements of foreign
permanent establishments and investee companies which, with reference to the
IFRS transition date is negative for EUR 24,304;
3. The exchange rate differences deriving from the conversion of the financial
statements of foreign subsidiaries was negative for EUR 8,646;
4. The consolidation reserve amounting to EUR 9,330;
5. Other reserves amounting to EUR 14,815, the difference in which is mainly
attributable to the cash-flow hedge reserve and stock grant reserve.
22. Financial liabilities
Non-current financial liabilities: EUR 483,257 (EUR 413,524)
Non-current financial liabilities recorded an increase with respect to 31 December 2007 and
consist of the following:
30/06/08 31/12/07 Change
Due to banks (*) 465,360 393,710 71,650
Non-current amount of loans (*) 1,776 2,329 (553)
Financial leasing payables (*) 14,424 15,787 (1,363)
Due to associated companies 1,698 1,698
Total 483,257 413,524 69,733
(*) Included in net financial position amounting to EUR 481,560
Current financial liabilities: EUR 348,067 (EUR 322,385)
This item consists of the following: 30/06/08 31/12/07 Change
Due to banks 261,576 214,882 46,694
Current amount of loans 1,117 1,047 70
Payables to other lenders 74,787 96,281 (21,494)
Financial leasing payables 10,587 10,175 412
Total 348,067 322,385 25,683

64
It should be pointed out that during the period, the Group, in relation to the new
characteristics of the concession contract for the “ex-Manifattura Tabacchi” parking facilities,
has reviewed the contract terms of the loan (expiry and amount) for the construction of
these parking facilities. In particular, the new expiry date is 21 May 2025 (it was previously 4
October 2019) and the new amount is EUR 12.3 million (the previous amount was EUR 11
million). Likewise, with regard to the funding to the subsidiary Co.meri S.p.A. for the
construction of the “Jonica” national road, the duration of the funding was changes, with the
new expiry date in April 2010 (previously June 2008) thus adjusting it to the duration of the
works.
For completeness of information on these items, it is pointed out that in July 2008 the Group
has contracted some loans, in any case to be used for funding of working capital, in relation
to the planned operational requirements; the main characteristics are listed below.
1) A loan of EUR 50,000, agreed on 14 July 2008 with Efibanca, as pool leader, and
Banca Popolare di Lodi and Credito Bergamasco as lending banks.
The loan does not involve real guarantees, has a duration of 6 years and has the
final expiry date of 14 July 2014; it is structured with a Period of Utilization of 1
year, by which the Company has the option of using the credit line in one or more
tranches. Repayment shall take place starting in the fourth year, in four equal half-
year installments starting on 14 January 2013.
The interest rate payable is the euribor rate plus a spread which, for the first year,
amounts to 1.25% and subsequently is adjustable every year within the 1.05 –
1.45% range on the basis of the value of the ratio between the net financial position
on consolidated Group level and EBITDA.

65
There follow details on the financial covenants for borrowing, calculated on an
annual basis:
• Ratio between the net financial position and Group equity: lower than or equal
to 1.60x for the whole year;
• Ratio between net financial position and EBITDA: lower than or equal to 3.50x
for the whole year.
Failure to comply with these parameters, save for other specific agreements with
the bank, would result in the automatic cancellation of the loan and the acceleration
of repayment.
2) A loan of US$ 60,000, agreed on 14 July 2008 with BNP Paribas.
The loan provides for a back-to-back guarantee issued by the SACE in favor of the
bank, covering 70% of the amount; the purpose of the loan is to cover the
difference between costs and revenues of the Venezuela branch, as well as
repayment of a previous loan with similar characteristics agreed with Banca
Nazionale del Lavoro.
The technical form of utilization is a stand-by revolving credit line, with utilization in
1, 2 or 3 months, and provides for the following financial covenants on an annual
basis, based on the consolidated financial statements of the Group:
• Ratio between the net financial position and Group equity: lower than or equal
to 1.60x for the whole year;
• Ratio between net financial position and EBITDA: lower than or equal to 3.50x
for the whole year.
Hedging derivatives
Interest rate

66
At 30 June 2008 the notional value of hedging in operational derivatives amounted to
approximately EUR 559,197.
There follow tables summarizing these operations, all based on the principles for hedging of
financial flows, divided between cash flow hedging and those for which the Group has
decided not to apply hedge accounting,
Cash flow hedging derivatives:
Type of derivative Type of operation NOTIONAL
VALUE FAIR VALUE 30/06/2008
FAIR VALUE 31/12/2007
OPTIONS 78,569 2,128 923 Short-term indebtedness 29,641 663 806 Medium/Long-term indebtedness 48,929 1,465 116 IRS 390,892 10,317 4,030 Financial assets 167,941 1,604 (288) Short-term indebtedness 35,000 1,182 1,796 Medium/Long-term indebtedness 185,357 7,472 2,448 Mortgage loan payable 2,593 59 74
Grand total 469,461 12,445 4,953
The financial flow hedging stated above is considered to be highly effective and has
involved the entering under equity of unrealized profit amounting to EUR 12,398.
There follows the table showing operations to which hedge accounting has not been
applied; the effects of these items have been entered directly into the Group Company
income statements at 30 June 2008:
No hedge accounting items:

67
Type of derivative Type of operation NOTIONAL
VALUE FAIR VALUE 30/06/2008
FAIR VALUE 31/12/2007
OPTIONS (111)
Short-term indebtedness (111)
IRS 89,736 1,609 939
Short-term indebtedness 71,000 1,094 825
Medium/long-term indebtedness 10,000 381 0
Leasing agreements 8,736 134 114
Grand total 89,736 1,609 828
Exchange rate risk
At 30 June 2008 the portfolio of exchange rate derivates included forward purchase
operations of US Dollars against Euro, to cover forecast costs of the Bolivia branch, and
forward purchase operations of Romanian Lei (RON) against Euro, to cover forecast
payments in the Romanian branch.
Company Instrument Underlying
(Euro equiv.) Fair Value 31/12/2007
Fair Value 30/06/2008 Equity
Income Statement
Bolivian Branch Forward
-532 -282 -89 -193 5,142
Bolivian Branch Total
-532 -282 -89 -193 5,142
Romanian Branch Forward
-837 -822 -822 0 9,000
Options
-785 -974 -852 -121 9,500
Romanian Branch Total
-1,622 -1,796 -1,674 -121 18,500
Grand total 23,642 -2,154 -2,078 -1,763 -314
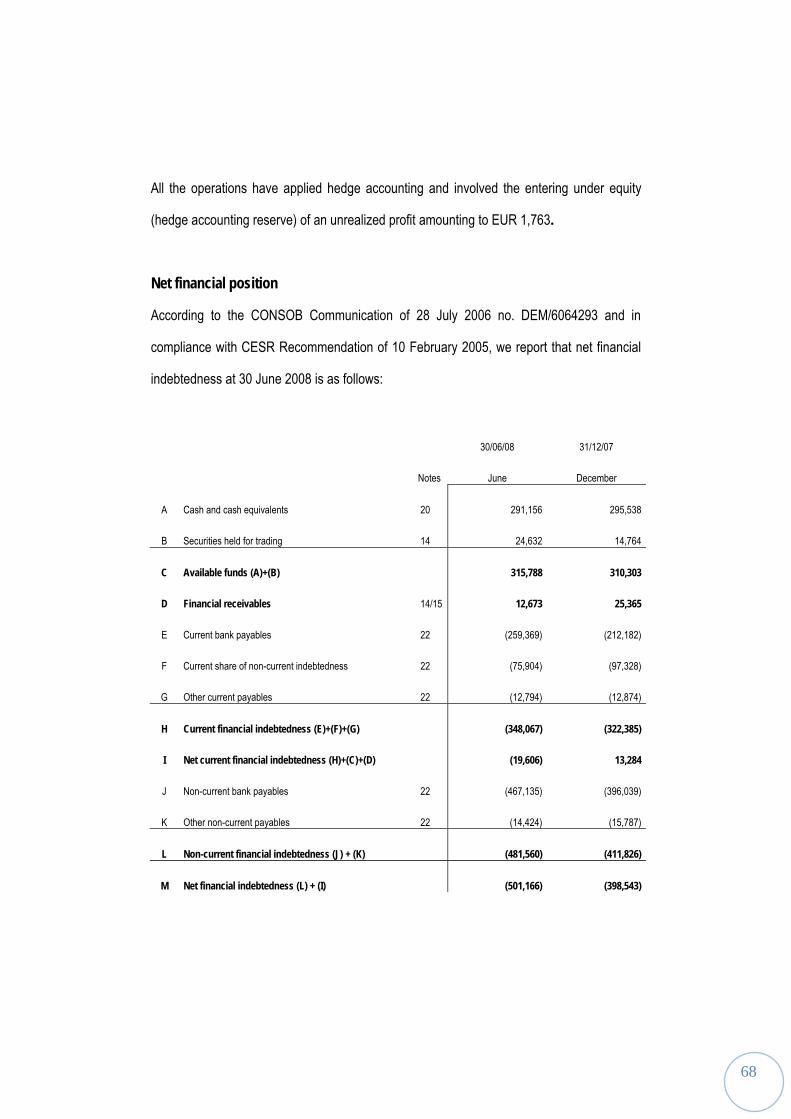
68
All the operations have applied hedge accounting and involved the entering under equity
(hedge accounting reserve) of an unrealized profit amounting to EUR 1,763.
Net financial position
According to the CONSOB Communication of 28 July 2006 no. DEM/6064293 and in
compliance with CESR Recommendation of 10 February 2005, we report that net financial
indebtedness at 30 June 2008 is as follows:
30/06/08 31/12/07
Notes June December
A Cash and cash equivalents 20 291,156 295,538
B Securities held for trading 14 24,632 14,764
C Available funds (A)+(B) 315,788 310,303
D Financial receivables 14/15 12,673 25,365
E Current bank payables 22 (259,369) (212,182)
F Current share of non-current indebtedness 22 (75,904) (97,328)
G Other current payables 22 (12,794) (12,874)
H Current financial indebtedness (E)+(F)+(G) (348,067) (322,385)
I Net current financial indebtedness (H)+(C)+(D) (19,606) 13,284
J Non-current bank payables 22 (467,135) (396,039)
K Other non-current payables 22 (14,424) (15,787)
L Non-current financial indebtedness (J) + (K) (481,560) (411,826)
M Net financial indebtedness (L) + (I) (501,166) (398,543)
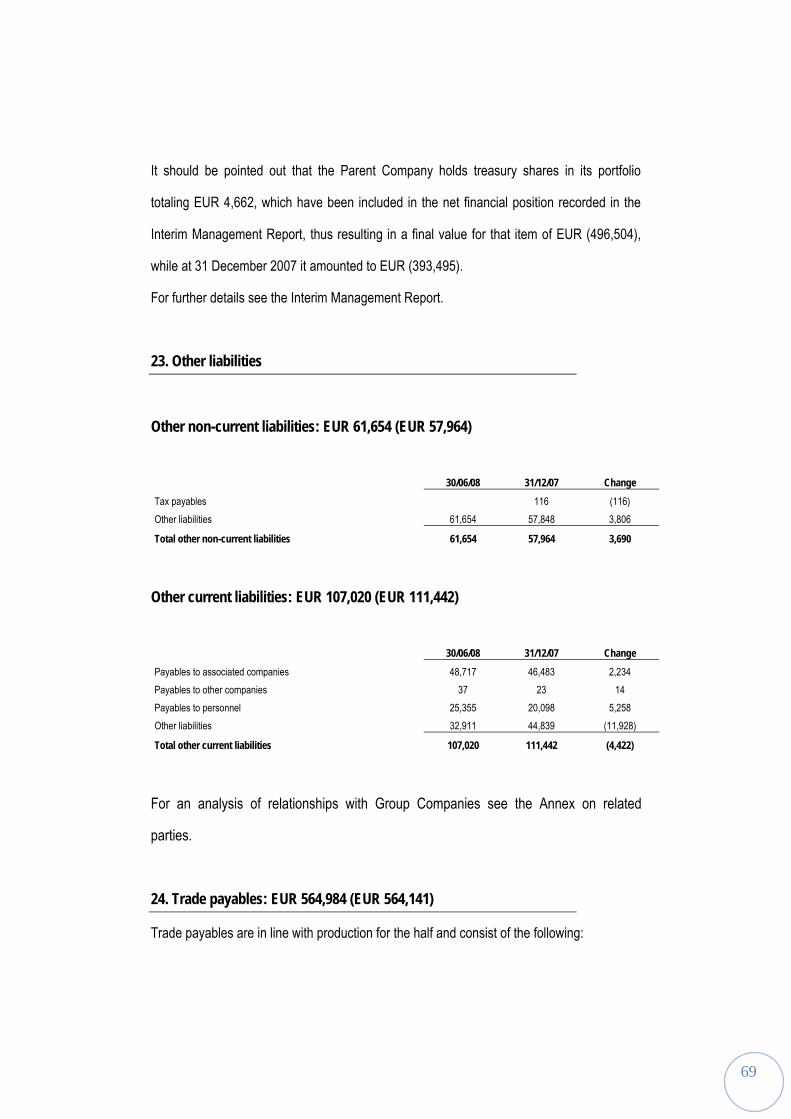
69
It should be pointed out that the Parent Company holds treasury shares in its portfolio
totaling EUR 4,662, which have been included in the net financial position recorded in the
Interim Management Report, thus resulting in a final value for that item of EUR (496,504),
while at 31 December 2007 it amounted to EUR (393,495).
For further details see the Interim Management Report.
23. Other liabilities
Other non-current liabilities: EUR 61,654 (EUR 57,964)
30/06/08 31/12/07 Change Tax payables 116 (116) Other liabilities 61,654 57,848 3,806
Total other non-current liabilities 61,654 57,964 3,690
Other current liabilities: EUR 107,020 (EUR 111,442)
30/06/08 31/12/07 Change Payables to associated companies 48,717 46,483 2,234 Payables to other companies 37 23 14 Payables to personnel 25,355 20,098 5,258 Other liabilities 32,911 44,839 (11,928)
Total other current liabilities 107,020 111,442 (4,422)
For an analysis of relationships with Group Companies see the Annex on related
parties.
24. Trade payables: EUR 564,984 (EUR 564,141)
Trade payables are in line with production for the half and consist of the following:
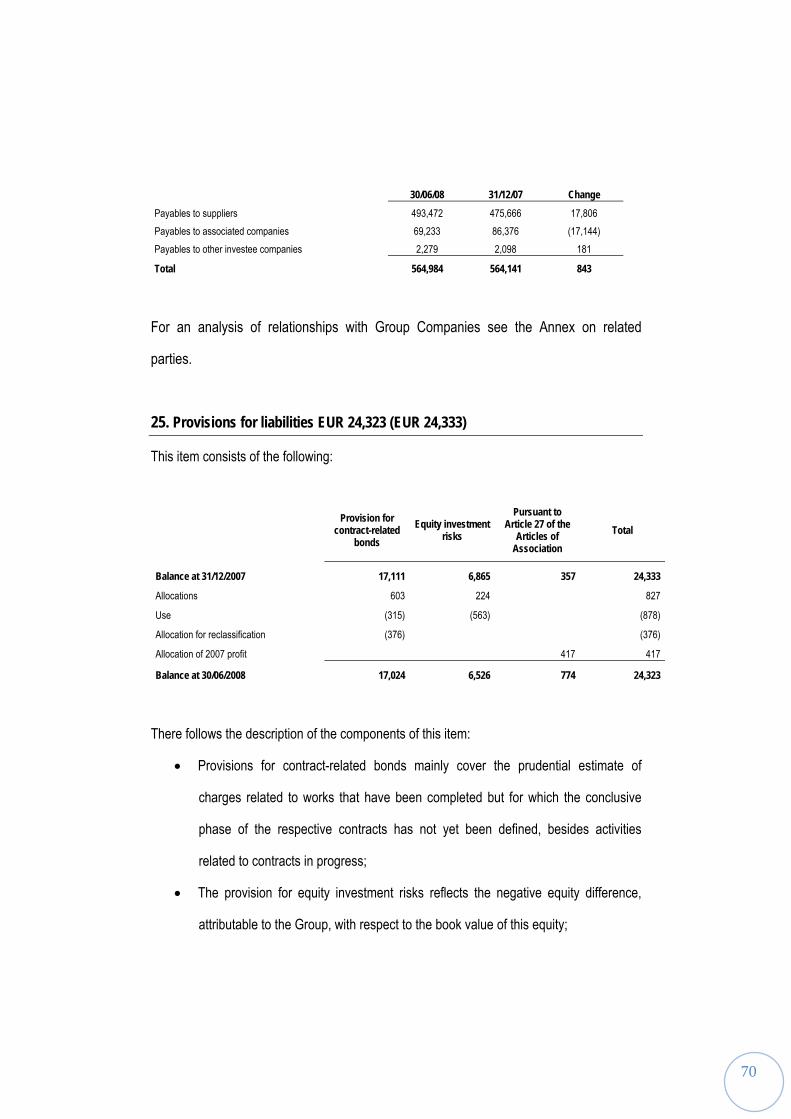
70
30/06/08 31/12/07 Change Payables to suppliers 493,472 475,666 17,806 Payables to associated companies 69,233 86,376 (17,144) Payables to other investee companies 2,279 2,098 181
Total 564,984 564,141 843
For an analysis of relationships with Group Companies see the Annex on related
parties.
25. Provisions for liabilities EUR 24,323 (EUR 24,333)
This item consists of the following:
Provision for contract-related
bonds Equity investment
risks
Pursuant to Article 27 of the
Articles of Association
Total
Balance at 31/12/2007 17,111 6,865 357 24,333
Allocations 603 224 827
Use (315) (563) (878)
Allocation for reclassification (376) (376)
Allocation of 2007 profit 417 417
Balance at 30/06/2008 17,024 6,526 774 24,323
There follows the description of the components of this item:
• Provisions for contract-related bonds mainly cover the prudential estimate of
charges related to works that have been completed but for which the conclusive
phase of the respective contracts has not yet been defined, besides activities
related to contracts in progress;
• The provision for equity investment risks reflects the negative equity difference,
attributable to the Group, with respect to the book value of this equity;
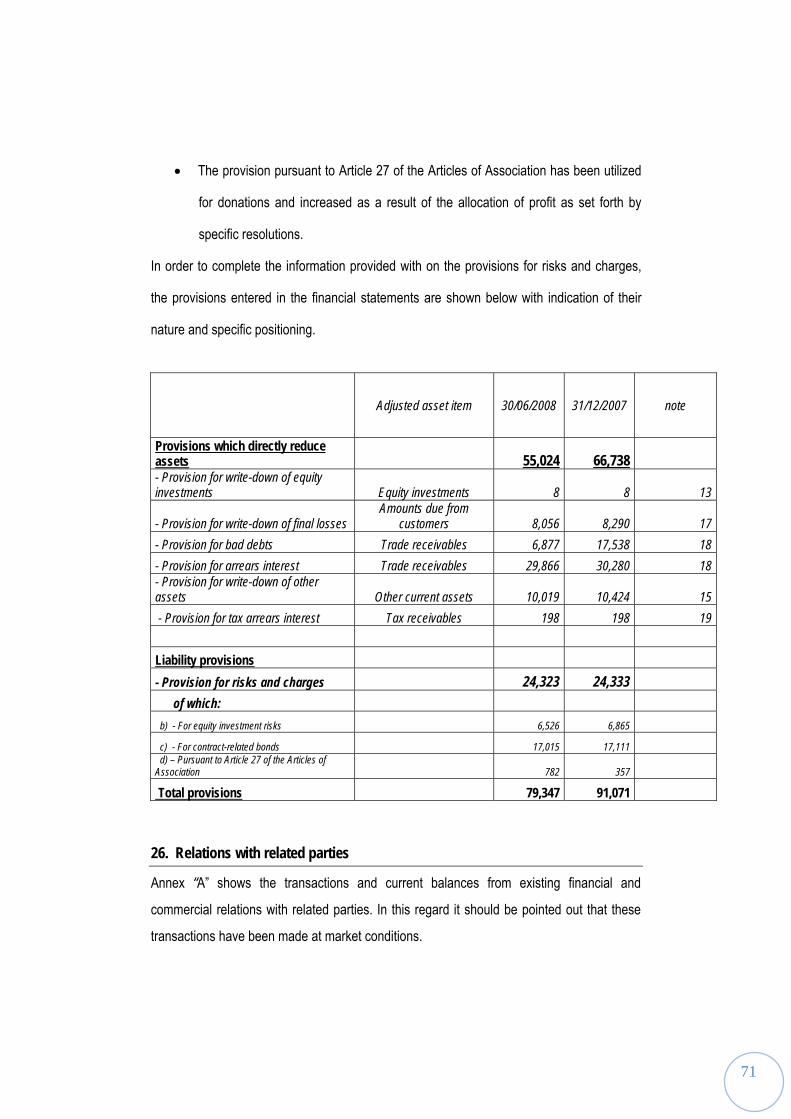
71
• The provision pursuant to Article 27 of the Articles of Association has been utilized
for donations and increased as a result of the allocation of profit as set forth by
specific resolutions.
In order to complete the information provided with on the provisions for risks and charges,
the provisions entered in the financial statements are shown below with indication of their
nature and specific positioning.
Adjusted asset item 30/06/2008 31/12/2007 note
Provisions which directly reduce assets 55,024 66,738 - Provision for write-down of equity investments Equity investments 8 8 13
- Provision for write-down of final losses Amounts due from
customers 8,056 8,290 17 - Provision for bad debts Trade receivables 6,877 17,538 18 - Provision for arrears interest Trade receivables 29,866 30,280 18 - Provision for write-down of other assets Other current assets 10,019 10,424 15 - Provision for tax arrears interest Tax receivables 198 198 19 Liability provisions - Provision for risks and charges 24,323 24,333 of which: b) - For equity investment risks 6,526 6,865
c) - For contract-related bonds 17,015 17,111 d) – Pursuant to Article 27 of the Articles of Association 782 357
Total provisions 79,347 91,071
26. Relations with related parties
Annex “A” shows the transactions and current balances from existing financial and
commercial relations with related parties. In this regard it should be pointed out that these
transactions have been made at market conditions.

72
However, it should be noted that relations with consortiums and consortium companies
(special-purpose companies), taking into account the particular sector in which the
Company operates, must be correlated to the receivables from third parties (entered under
trade receivables) that are not summarized in the table attached to these notes.
Other information
Revenues and results by geographical area
The following table shows the value of production and operating result by geographical
area.
Information at 30/06/2008 (thousands of Euros) Italy Europe America Africa Asia Other
activities Adjustments
and cancellations
Total consolidated
Revenues 471,540 90,880 127,733 79,238 29,636 (31) (126,225) 672,769 Operating result 30,709 8,089 24,963 11,945 (1,542) (15,312) 1,661 60,514
Information at 30/06/2007 (thousands of Euros) Italy Europe America Africa Asia Other
activities Adjustments
and cancellations
Total consolidated
Revenues 278,668 81,388 176,086 79,920 19,794 1,182 (71,430) 565,609 Operating result 12,717 (11,100) 45,402 8,481 1,294 (7,158) 631 50,267
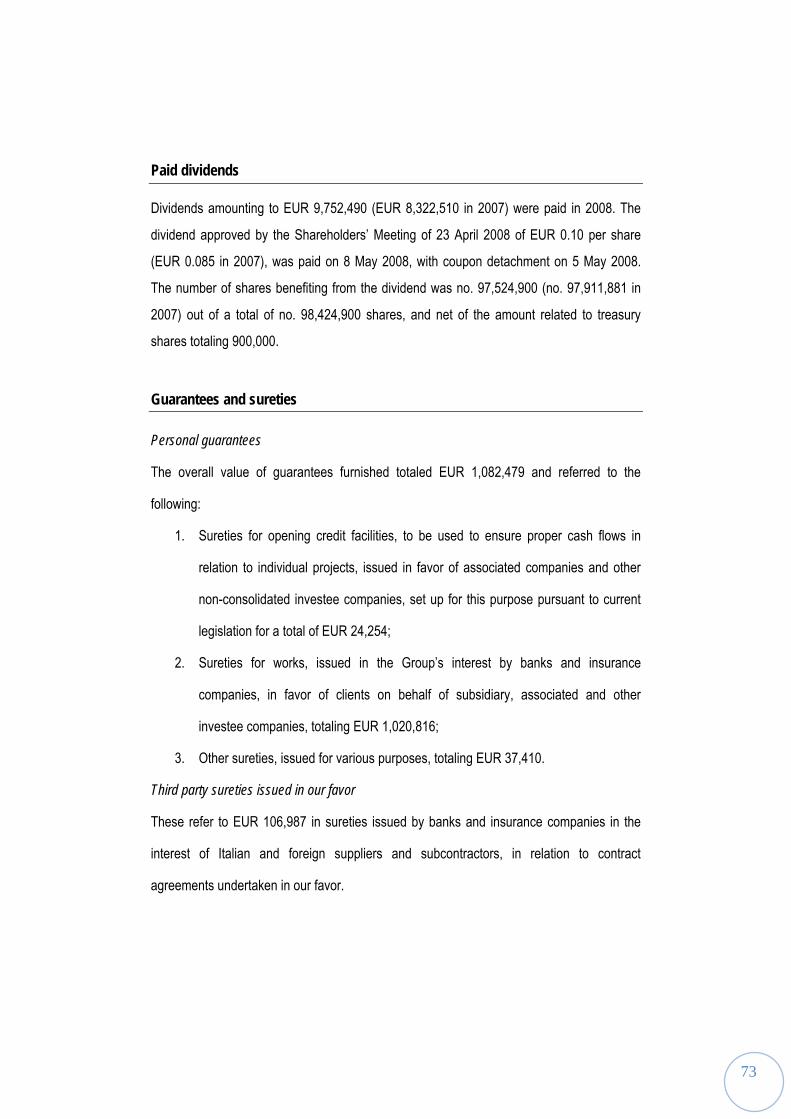
73
Paid dividends
Dividends amounting to EUR 9,752,490 (EUR 8,322,510 in 2007) were paid in 2008. The
dividend approved by the Shareholders’ Meeting of 23 April 2008 of EUR 0.10 per share
(EUR 0.085 in 2007), was paid on 8 May 2008, with coupon detachment on 5 May 2008.
The number of shares benefiting from the dividend was no. 97,524,900 (no. 97,911,881 in
2007) out of a total of no. 98,424,900 shares, and net of the amount related to treasury
shares totaling 900,000.
Guarantees and sureties
Personal guarantees
The overall value of guarantees furnished totaled EUR 1,082,479 and referred to the
following:
1. Sureties for opening credit facilities, to be used to ensure proper cash flows in
relation to individual projects, issued in favor of associated companies and other
non-consolidated investee companies, set up for this purpose pursuant to current
legislation for a total of EUR 24,254;
2. Sureties for works, issued in the Group’s interest by banks and insurance
companies, in favor of clients on behalf of subsidiary, associated and other
investee companies, totaling EUR 1,020,816;
3. Other sureties, issued for various purposes, totaling EUR 37,410.
Third party sureties issued in our favor
These refer to EUR 106,987 in sureties issued by banks and insurance companies in the
interest of Italian and foreign suppliers and subcontractors, in relation to contract
agreements undertaken in our favor.
74
Subsequent events
Since the closing of the half-year period, there have been some major achievements for the Group on the domestic level.
In particular, the Milan rail link was inaugurated on 17 July. This maxi-tunnel was built mainly under the city center to link the railway lines coming from the north-west (Milan-Turin, Milan-Domodossola and the regional lines managed by Ferrovie del Nord), with those coming from the north-east (Milan-Genoa, Milan-Bologna, Mortara-Milan). The link has 3.5 kilometers of double track leading from Porta Vittoria to Rogoredo station, creating a junction between long distance traffic and trains on the four regional lines that terminate at Rogoredo; this is an important solution for the city’s traffic requirements, also in view of Expo 2015.
We should also point out the operation of the TBMs (Tunnel Boring Machines) to be used to
excavate the tunnels for the construction project of the new Line C of the Rome
Underground and the new Line 5 of the Milan Underground. On 3 July, excavation started
for the tunnel linking the 30 stations planned for the new Line C of the Rome Underground,
on the Pantano-Piazzale Clodio section. On 1 August, the TBM started operations in the
project for the construction of the new Line 5 of the Milan Underground. TBMs, also known
as “mechanical moles”, are actually highly mechanized mobile construction facilities,
allowing excavation to advance from 8 to 12 meters per day, with maximum safety
conditions for the workers and the residents of the areas affected by excavation, with
considerable advantages in terms of construction time. Astaldi is currently using TBMs in
Rome and Milan, as well as in Brescia, where the company is building the new underground
line.
List of equity investments
In compliance with regulatory requirements, Annex “B” contains information on equity
investments at 30 June 2008.

75
Date of publication of the Half-Yearly Financial Report On 6 August 2008 the Board of Directors of Astaldi S.p.A., pursuant to the law in force,
authorized the publication of this Half-Yearly Financial Report.
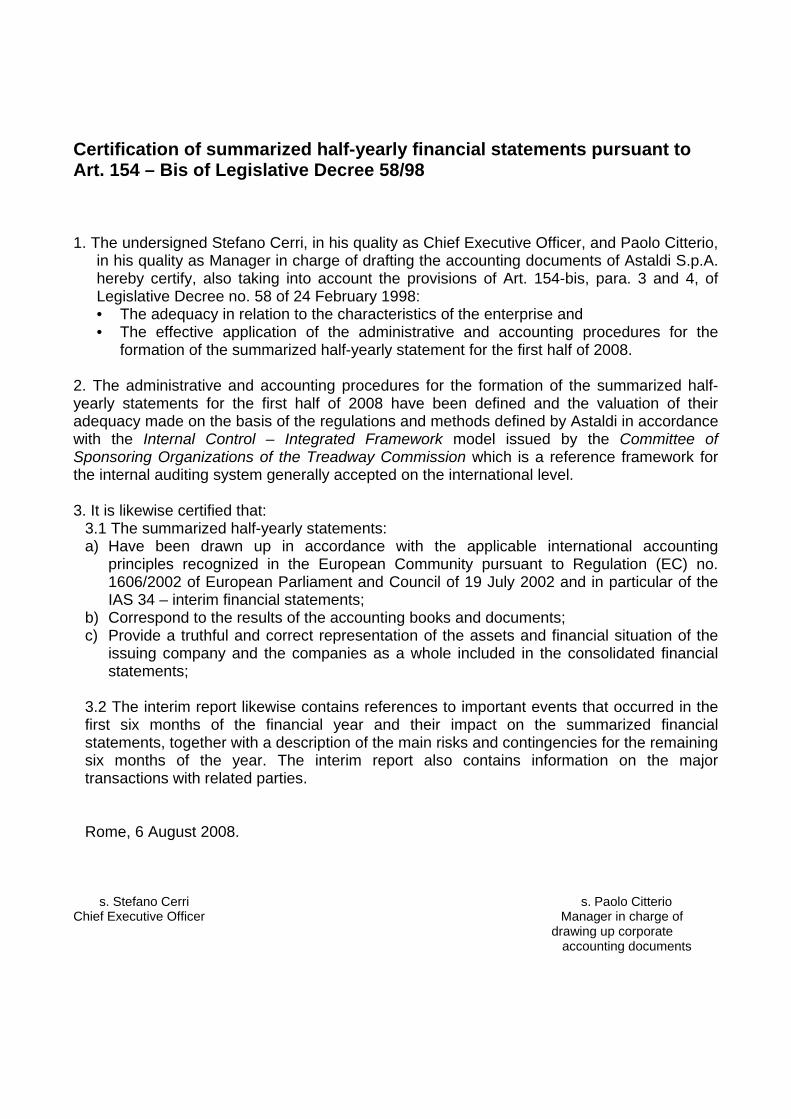
Certification of summarized half-yearly financial statements pursuant to Art. 154 – Bis of Legislative Decree 58/98
1. The undersigned Stefano Cerri, in his quality as Chief Executive Officer, and Paolo Citterio, in his quality as Manager in charge of drafting the accounting documents of Astaldi S.p.A. hereby certify, also taking into account the provisions of Art. 154-bis, para. 3 and 4, of Legislative Decree no. 58 of 24 February 1998: • The adequacy in relation to the characteristics of the enterprise and • The effective application of the administrative and accounting procedures for the
formation of the summarized half-yearly statement for the first half of 2008. 2. The administrative and accounting procedures for the formation of the summarized half-yearly statements for the first half of 2008 have been defined and the valuation of their adequacy made on the basis of the regulations and methods defined by Astaldi in accordance with the Internal Control – Integrated Framework model issued by the Committee of Sponsoring Organizations of the Treadway Commission which is a reference framework for the internal auditing system generally accepted on the international level. 3. It is likewise certified that:
3.1 The summarized half-yearly statements: a) Have been drawn up in accordance with the applicable international accounting
principles recognized in the European Community pursuant to Regulation (EC) no. 1606/2002 of European Parliament and Council of 19 July 2002 and in particular of the IAS 34 – interim financial statements;
b) Correspond to the results of the accounting books and documents; c) Provide a truthful and correct representation of the assets and financial situation of the
issuing company and the companies as a whole included in the consolidated financial statements;
3.2 The interim report likewise contains references to important events that occurred in the first six months of the financial year and their impact on the summarized financial statements, together with a description of the main risks and contingencies for the remaining six months of the year. The interim report also contains information on the major transactions with related parties. Rome, 6 August 2008.
s. Stefano Cerri s. Paolo Citterio Chief Executive Officer Manager in charge of drawing up corporate accounting documents
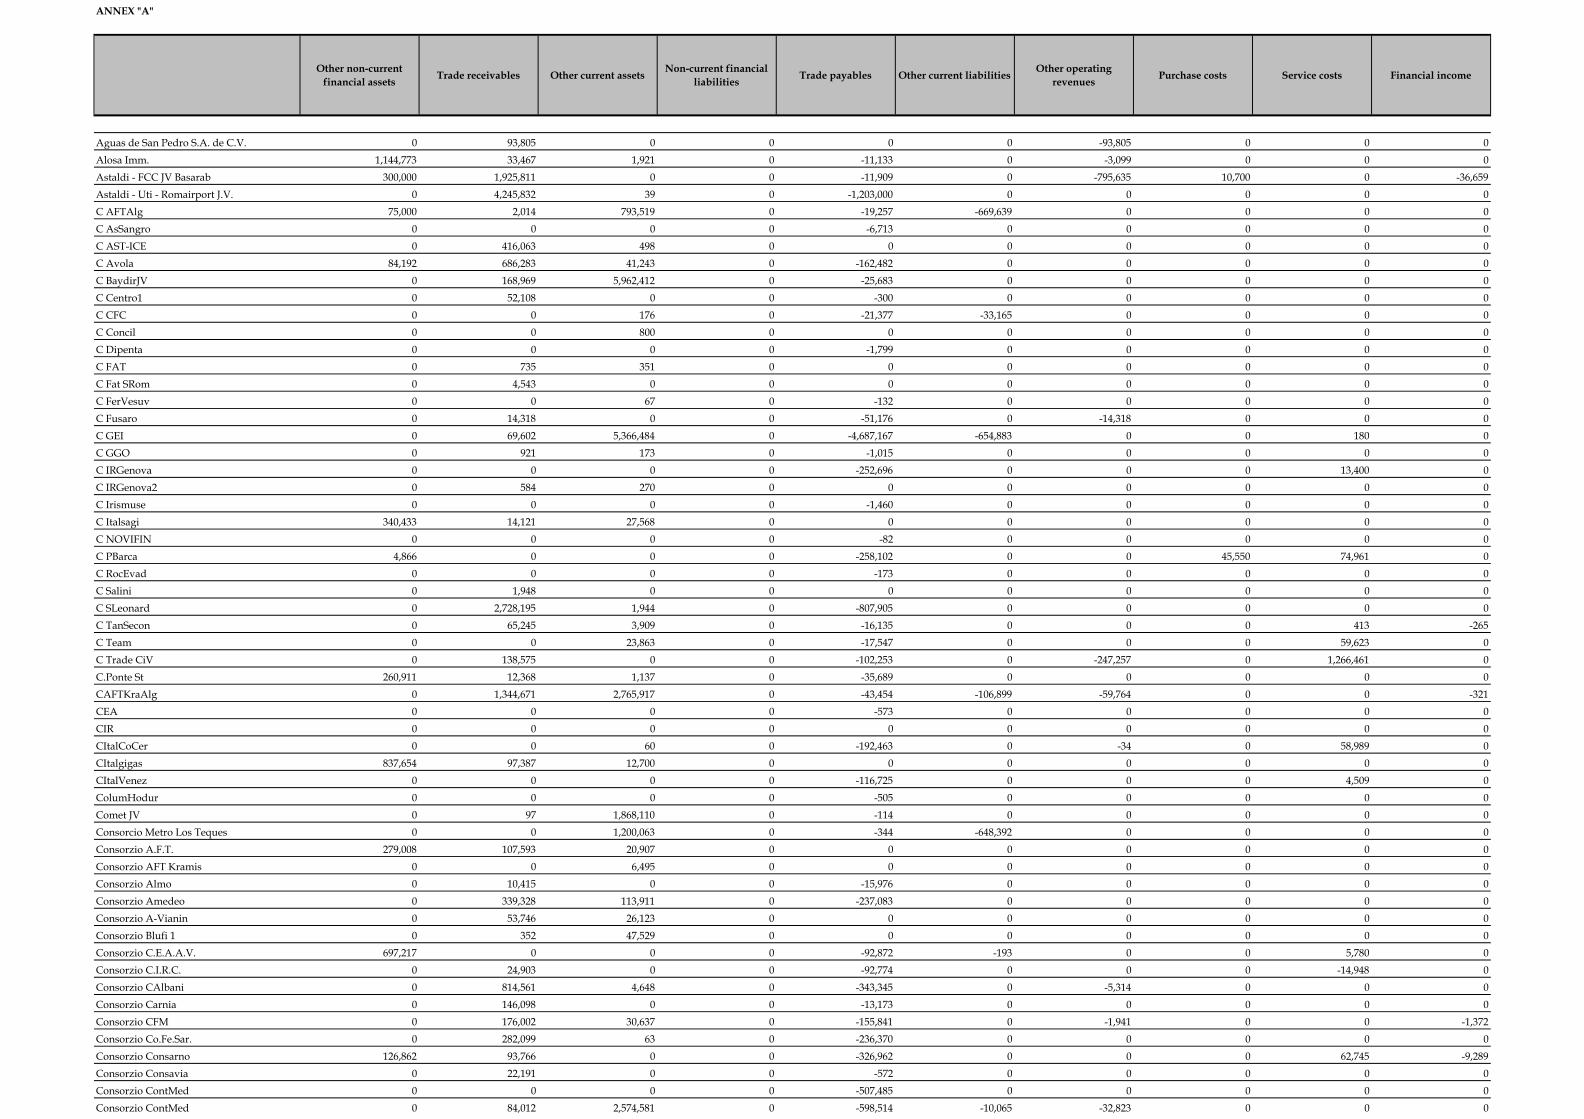
ANNEX "A"
Other non-current financial assets Trade receivables Other current assets Non-current financial
liabilities Trade payables Other current liabilities Other operating revenues Purchase costs Service costs Financial income
Aguas de San Pedro S.A. de C.V. 0 93,805 0 0 0 0 -93,805 0 0 0Alosa Imm. 1,144,773 33,467 1,921 0 -11,133 0 -3,099 0 0 0Astaldi - FCC JV Basarab 300,000 1,925,811 0 0 -11,909 0 -795,635 10,700 0 -36,659Astaldi - Uti - Romairport J.V. 0 4,245,832 39 0 -1,203,000 0 0 0 0 0C AFTAlg 75,000 2,014 793,519 0 -19,257 -669,639 0 0 0 0C AsSangro 0 0 0 0 -6,713 0 0 0 0 0C AST-ICE 0 416,063 498 0 0 0 0 0 0 0C Avola 84,192 686,283 41,243 0 -162,482 0 0 0 0 0C BaydirJV 0 168,969 5,962,412 0 -25,683 0 0 0 0 0C Centro1 0 52,108 0 0 -300 0 0 0 0 0C CFC 0 0 176 0 -21,377 -33,165 0 0 0 0C Concil 0 0 800 0 0 0 0 0 0 0C Dipenta 0 0 0 0 -1,799 0 0 0 0 0C FAT 0 735 351 0 0 0 0 0 0 0C Fat SRom 0 4,543 0 0 0 0 0 0 0 0C FerVesuv 0 0 67 0 -132 0 0 0 0 0C Fusaro 0 14,318 0 0 -51,176 0 -14,318 0 0 0C GEI 0 69,602 5,366,484 0 -4,687,167 -654,883 0 0 180 0C GGO 0 921 173 0 -1,015 0 0 0 0 0C IRGenova 0 0 0 0 -252,696 0 0 0 13,400 0C IRGenova2 0 584 270 0 0 0 0 0 0 0C Irismuse 0 0 0 0 -1,460 0 0 0 0 0C Italsagi 340,433 14,121 27,568 0 0 0 0 0 0 0C NOVIFIN 0 0 0 0 -82 0 0 0 0 0C PBarca 4,866 0 0 0 -258,102 0 0 45,550 74,961 0C RocEvad 0 0 0 0 -173 0 0 0 0 0C Salini 0 1,948 0 0 0 0 0 0 0 0C SLeonard 0 2,728,195 1,944 0 -807,905 0 0 0 0 0C TanSecon 0 65,245 3,909 0 -16,135 0 0 0 413 -265C Team 0 0 23,863 0 -17,547 0 0 0 59,623 0C Trade CiV 0 138,575 0 0 -102,253 0 -247,257 0 1,266,461 0C.Ponte St 260,911 12,368 1,137 0 -35,689 0 0 0 0 0CAFTKraAlg 0 1,344,671 2,765,917 0 -43,454 -106,899 -59,764 0 0 -321CEA 0 0 0 0 -573 0 0 0 0 0CIR 0 0 0 0 0 0 0 0 0 0CItalCoCer 0 0 60 0 -192,463 0 -34 0 58,989 0CItalgigas 837,654 97,387 12,700 0 0 0 0 0 0 0CItalVenez 0 0 0 0 -116,725 0 0 0 4,509 0ColumHodur 0 0 0 0 -505 0 0 0 0 0Comet JV 0 97 1,868,110 0 -114 0 0 0 0 0Consorcio Metro Los Teques 0 0 1,200,063 0 -344 -648,392 0 0 0 0Consorzio A.F.T. 279,008 107,593 20,907 0 0 0 0 0 0 0Consorzio AFT Kramis 0 0 6,495 0 0 0 0 0 0 0Consorzio Almo 0 10,415 0 0 -15,976 0 0 0 0 0Consorzio Amedeo 0 339,328 113,911 0 -237,083 0 0 0 0 0Consorzio A-Vianin 0 53,746 26,123 0 0 0 0 0 0 0Consorzio Blufi 1 0 352 47,529 0 0 0 0 0 0 0Consorzio C.E.A.A.V. 697,217 0 0 0 -92,872 -193 0 0 5,780 0Consorzio C.I.R.C. 0 24,903 0 0 -92,774 0 0 0 -14,948 0Consorzio CAlbani 0 814,561 4,648 0 -343,345 0 -5,314 0 0 0Consorzio Carnia 0 146,098 0 0 -13,173 0 0 0 0 0Consorzio CFM 0 176,002 30,637 0 -155,841 0 -1,941 0 0 -1,372Consorzio Co.Fe.Sar. 0 282,099 63 0 -236,370 0 0 0 0 0Consorzio Consarno 126,862 93,766 0 0 -326,962 0 0 0 62,745 -9,289Consorzio Consavia 0 22,191 0 0 -572 0 0 0 0 0Consorzio ContMed 0 0 0 0 -507,485 0 0 0 0 0Consorzio ContMed 0 84,012 2,574,581 0 -598,514 -10,065 -32,823 0 0 0

Other non-current financial assets Trade receivables Other current assets Non-current financial
liabilities Trade payables Other current liabilities Other operating revenues Purchase costs Service costs Financial income
Consorzio DEI 117 0 0 0 0 0 0 0 0 0Consorzio FCanna 204,743 239,100 6,193 0 -82,755 0 0 0 0 -7,274Consorzio Ferrofir 0 39,868 188 0 -1,096,609 0 -2,164 0 124,383 0Consorzio GI.IT 0 0 0 0 -219,182 0 0 0 935 0Consorzio Iricav Due 0 61,975 0 0 -534,859 0 -48,914 0 197,918 0Consorzio Iricav Uno 0 402,399 2,462,013 0 -1,804,616 0 -129,676 0 4,425,514 0Consorzio LAR 1,437,228 0 0 0 -1,806,932 0 -8,128 0 421,094 -33,341Consorzio Licata 294,957 178,662 1,800 0 -139,073 0 0 0 0 0Consorzio Marsico 29,545 0 0 0 0 0 0 0 0 0Consorzio NOVMetro 0 0 0 0 -22,799 0 -2,232 0 4,564 0Consorzio Novocen 1,896 0 0 0 -276 0 0 0 14,821 0Consorzio Qalat 0 5,102 0 0 -413,429 0 0 0 0 0Consorzio Santang 219,168 71 0 0 0 -110 0 0 0 -71Consorzio Siracusa 0 3,145 0 0 -16,907 0 -299 0 0 0Consorzio Truncu 0 165,142 12,500 0 -4,263 0 0 0 534 -655Consorzio Vasco 0 266,717 0 0 -1,950 0 0 0 0 0Consorzio VCaudina 0 754,036 6,164 0 -613,005 0 0 0 -52,376 0Diga di Blufi S.c.r.l. 0 6,201,263 636,627 0 -5,407,101 0 0 0 2,092 -883Ecosarno S.c.r.l. 128,312 0 0 0 -310,142 0 0 0 588,293 0Eurolep 0 0 0 0 0 -24,962 -3,436 0 0 0FINAST 0 24,342 5,909 0 0 0 -5,000 0 0 0Groupe ETRHB HADDAD 0 0 2,059,041 0 0 0 0 0 0 0Groupement ASTEH 0 0 2,728,746 0 0 0 0 0 0 0Groupemet T.J. 0 0 11,734 0 0 0 0 0 0 0Infraflegrea Scrl 0 623,380 9,057 0 -890,238 0 -99,735 0 14,391 0Irminio scrl 0 0 0 0 -1,258 0 0 0 0 0Isclero Scrl 0 0 112,601 0 0 0 -149,811 0 0 0M.O.MES Scrl 0 0 0 0 0 -4,125 0 0 0 0Max Boegl - Astaldi 0 2,053 0 0 -308,000 0 -89,340 0 0 -2,053Max Bogl-Astaldi-CCCF Asocierea JV Srl 0 332,827 0 0 -228,601 0 -2,250 263 0 -2,331Metro 5 S.p.A. 0 161,644 65,804 0 -757,798 -4,724,737 -284,782 259 760,933 0Metro C 0 240,093 5,400 0 -26,882,985 -39,168,487 -356,261 0 24,199,867 0Metro Veneta S.c.r.l. 0 360 0 0 -19,041 0 0 0 798 0Metrogenova S.c.r.l. 0 598,107 232,167 0 -1,775,540 -82,046 -273,711 0 1,942,714 0MN MetroNA 0 23,799 0 0 -3,543 0 0 0 0 0Monte Vesuvio S.c.r.l. 250,000 477,460 0 0 -59,858 0 -18,224 0 0 0Mose Treporti S.c.r.l. 0 353,338 0 0 -8,156,849 0 -85,410 0 5,510,300 0N.P.F - Nuovo Polo Fieristico 0 100,453 1,687,798 0 0 0 -72,925 0 1,345,698 0Pantano S.c.r.l. 71,797 0 1 0 -1,116,346 0 -4,471 0 1,038,948 0Pegaso S.c.r.l. 0 249,637 1,067,038 0 -732,430 0 -156,688 0 1,493,634 0Pont Ventoux S.c.r.l. 0 3,170,128 579,403 0 -6,529,312 0 -12,701 4,550 930,201 -388,660Roma Lido S.c.r.l. 0 141,545 0 0 -541,552 0 0 0 31,123 0SA.T. S.p.A. 0 454,100 0 0 0 -2,625,000 -378,417 0 0 0SACES 0 0 0 -1,697,560 0 0 0 0 0 0Seas - Astaldi Sarl 0 0 370,583 0 -6,708 -1,525 0 0 0 0SEIS 124,802 0 0 0 0 0 0 0 0 0Sharaf-Astaldi LLC 0 673 0 0 0 0 0 0 0 0TransEuro 0 11,765 0 0 0 0 0 0 0 0Veneta Sanitaria di Progetto SpA 0 682,326 655 0 -200,044 0 -52,000 0 23,520 -151,847Vesuviana Strade S.c.r.l. 0 72,925 14,737 0 -49,576 0 -15,835 0 43,766 -3,651Viadotti di Courmayeur S.c.r.l. 0 598,083 20,323 0 -107,896 0 0 0 149 0Yellow River Contractor JV 0 90,300 80 0 0 0 0 0 0 0Total 6,913,481 30,999,546 32,994,682 -1,697,560 -71,511,803 -48,754,228 -3,506,400 61,322 44,595,927 -638,672% ratio on operations 100% 6.7% 13.5% 0.4% 12.7% 45.6% 11.0% 0.04% 12.1% 2.4%

ANNEX "B"
Astaldi Group companiesat 30 June 2008
Companies Address CurrencyNominal value of share capital % Direct % Indirect Holder of indirect interest
A - Companies consolidated using line-by-line methodAR.GI S.p.A. Via G.V. Bona, 65 - Rome - Italy EUR 35,000,000 99,990% 0,000%AS. M. S.c.r.l. Via Raffaele Morghen, 36 - Naples - Italy EUR 10,000 75,910% 0,000%Astaldi Algerie - E.u.r.l. 25 Citè Mohamed Hadj Ahmed Hydra wilaya d'Alger - Algiers - Algeria DZD 50,000,000 100,000% 0,000%Astaldi Arabia Ltd. P.O. Box 58139 - Riyad - Saudi Arabia SAR 5,000,000 60,000% 40,000% Astaldi International Ltd.Astaldi Bulgaria LTD 67 Tsanko Tserkovski Str., Entrance V, 4 floor - Sofia - Bulgaria BGN 5,000 100,000% 0,000%Astaldi Construction Corporation 8220 State Road 85 Davie - Florida - U.S.A. US$ 27,400,000 100,000% 0,000%Astaldi de Venezuela C.A. C.C. C.T. 1ra Etapa Piso 6 Of. 620 - Caracas - Venezuela VEF 110,300,000 99,804% 0,000%Astaldi Finance S.A. Boulevard du Prince Henri 19-21 - Luxembourg EUR 250,000 99,960% 0,000%Astaldi International Inc. Bank of Liberia Building P.O. Box 660 - Monrovia - Liberia US$ 3,000,000 0,000% 100,000% Astaldi International Ltd.Astaldi International Ltd. 34-36 Gray's Inn Road - London - United Kingdom GBP 2,000,000 100,000% 0,000%Astaldi-Astaldi International J.V. R. Armando Tivane, 466 - Matola Maputo - Mozambique US$ 10,000 0,000% 100,000% Astaldi International Ltd.Astaldi-Burundi Association Momentanée Avenue de l'O.U.A. B.P. 325 - Bujumbura - Burundi US$ 50,000 0,000% 100,000% Astaldi International Ltd.Astaldi-Max Bogl-CCCF JV S.r.l. Str.Carol Davilla n°70 - Bucharest - Romania EUR 10,000 66,000% 0,000%ASTALROM S.A. Varianta Nord, 1 - Calarasi - Romania LEI 13,618,975,000 99,118% 0,000%Astur Construction and Trade A.S. Aydinpinar Cad. Kucukmehmetler Koyu - Ankara - Turkey TRL 23,790,610,000 99,000% 0,000%Bussentina S.c.r.l. in liquidation Via G.V. Bona, 65 - Rome - Italy EUR 25,500 78,800% 0,000%C.O.MES. S.C.r.l. Via G.V.Bona, 65 - Rome - Italy EUR 20,000 55,000% 0,000%CO.ME.NA. S.c.r.l. in liquidation Via Cappella Vecchia, 8 - Naples - Italy EUR 20,658 70,432% 0,000%CO.MERI S.p.A. Via G.V. Bona, 65 - Rome - Italy EUR 35,000,000 99,990% 0,000%CO.NO.CO. S.c.r.l. in liquidation Via G.V. Bona, 65 - Rome - Italy EUR 25,500 80,000% 0,000%Consorzio Astaldi-C.M.B. Due in liquidation Via G.V. Bona, 65 - Rome - Italy EUR 10,329 99,995% 0,000%Consorzio Olbia Mare in liquidation Via G.V. Bona, 65 - Rome - Italy EUR 15,494 72,500% 0,000%Cospe S.c.r.l. in liquidation Via G.V. Bona, 65 - Rome - Italy EUR 10,200 0,000% 100,000% Italstrade IS SrlDiga di Arcichiaro S.c.r.l. in liquidation Via G.V. Bona, 65 - Rome - Italy EUR 35,700 0,000% 100,000% Italstrade IS SrlDIP.A. S.c.r.l. in liquidation Via G.V. Bona, 65 - Rome - Italy EUR 10,200 0,000% 100,000% Italstrade IS SrlEco Po Quattro S.c.r.l. in liquidation Via G.V. Bona, 65 - Rome - Italy EUR 25,500 80,000% 0,000%Euroast S.r.l. in liquidation Via G.V. Bona, 65 - Rome - Italy EUR 15,300 100,000% 0,000%Forum S.c.r.l. Via G.V. Bona, 65 - Rome - Italy EUR 51,000 79,989% 0,000%Garbi Linea 5 S.c.a.r.l. Via G.V. Bona, 65 - Rome - Italy EUR 10,000 60,000% 0,000%Groupement de Raccordement de la Station d'El Hamma (G.R.S.H.) 25 Rue Mohamed Hadj Ahmed Hydra - Algiers - Algeria 0 72,000% 28,000% Astaldi Algerie EurlI.F.C. Due S.c.r.l. in liquidation Via G. V. Bona, 65 - Rome - Italy EUR 45,900 99,990% 0,000%Infraflegrea Progetto S.p.A. Via privata D. Giustino, 3/A - Naples - Italy EUR 500,000 51,000% 0,000%Italstrade CCCF JV Romis S.r.l. Piata Pache Protopopescu, 9 - Bucharest - Romania LEI 5,400,000,000 51,000% 0,000%Italstrade IS S.r.l. Via G.V. Bona, 65 - Rome - Italy EUR 232,200 100,000% 0,000%Italstrade Somet JV Rometro S.r.l. Str. Cap. Av. A. Serbanescu, 49 Sector 1 - Bucharest - Romania LEI 22,000,000 51,000% 0,000%Linea A S.c.r.l. in liquidation Via G.V. Bona, 65 - Rome - Italy EUR 25,500 0,000% 100,000% Italstrade IS SrlMessina Stadio S.c.r.l. Via G.V. Bona, 65 - Rome - Italy EUR 45,900 66,660% 0,000%Montedil-Astaldi S.p.A. (MONTAST) in liquidation Via G.V. Bona, 65 - Rome- Italy EUR 408,000 0,000% 100,000% Italstrade IS SrlMormanno S.c.r.l. in liquidation Via G.V. Bona, 65 - Rome - Italy EUR 10,200 74,990% 0,000%Ospedale del Mare S.C.r.l. Via G.V. Bona, 65 - Rome - Italy EUR 50,000 60,000% 0,000%Palese Park S.r.l. Via G.V. Bona, 65 - Rome - Italy EUR 1,020,000 99,000% 0,000%Partenopea Finanza di Progetto S.p.A. Via Galileo Ferraris 113-B - Naples - Italy EUR 9,300,000 59,990% 0,000%Portovesme S.c.r.l. in liquidation Via G.V. Bona, 65 - Rome - Italy EUR 25,500 80,000% 0,000%Quattro Venti S.c.r.l. Via G.V. Bona, 65 - Rome - Italy EUR 51,000 60,000% 0,000%Redo-Association Momentanée Av. De la Justice, 1257 - Kinshasa - Democratic Republic of Congo ZRZ 50,000 75,000% 25,000% Astaldi International Ltd.Romairport S.r.l. Via G.V. Bona, 65 - Rome - Italy EUR 500,000 99,260% 0,000%Romstrade S.r.l. Piata Pache Protopopescu, 9 - Bucharest - Romania LEI 10,000,000,000 51,000% 0,000%S. Filippo S.c.r.l. in liquidation Via G.V. Bona, 65 - Rome - Italy EUR 10,200 80,000% 0,000%
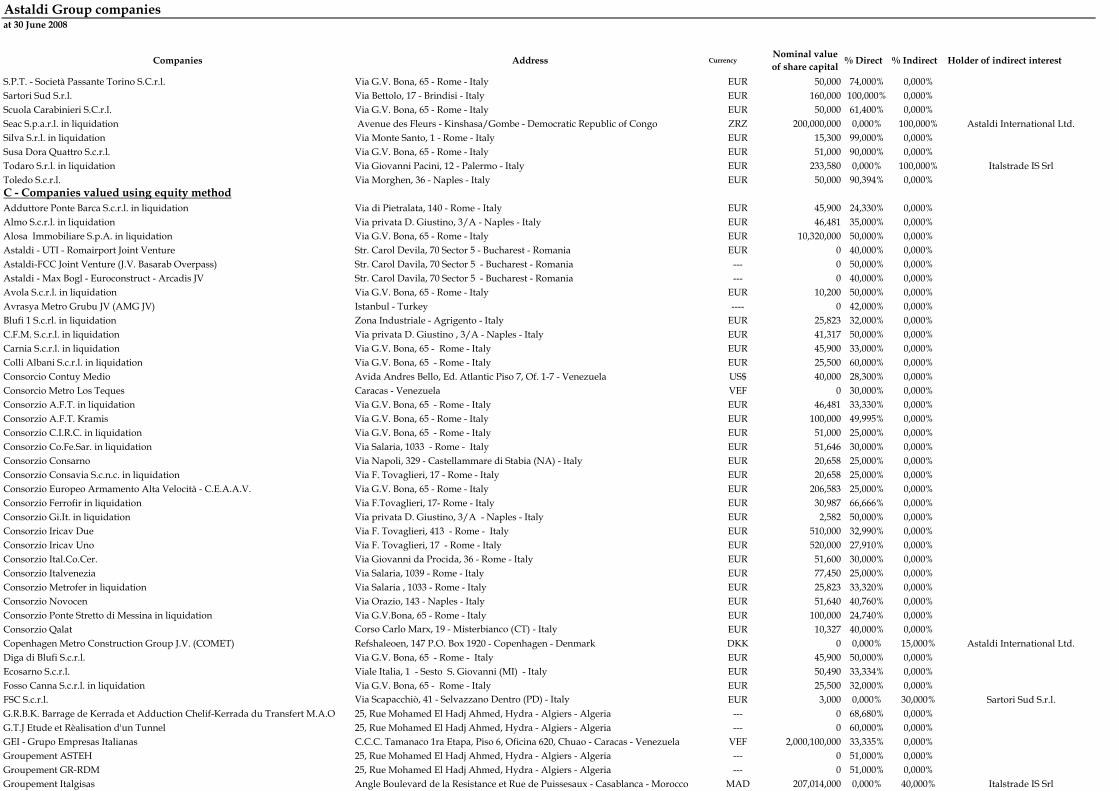
Astaldi Group companiesat 30 June 2008
Companies Address CurrencyNominal value of share capital % Direct % Indirect Holder of indirect interest
S.P.T. - Società Passante Torino S.C.r.l. Via G.V. Bona, 65 - Rome - Italy EUR 50,000 74,000% 0,000%Sartori Sud S.r.l. Via Bettolo, 17 - Brindisi - Italy EUR 160,000 100,000% 0,000%Scuola Carabinieri S.C.r.l. Via G.V. Bona, 65 - Rome - Italy EUR 50,000 61,400% 0,000%Seac S.p.a.r.l. in liquidation Avenue des Fleurs - Kinshasa/Gombe - Democratic Republic of Congo ZRZ 200,000,000 0,000% 100,000% Astaldi International Ltd.Silva S.r.l. in liquidation Via Monte Santo, 1 - Rome - Italy EUR 15,300 99,000% 0,000%Susa Dora Quattro S.c.r.l. Via G.V. Bona, 65 - Rome - Italy EUR 51,000 90,000% 0,000%Todaro S.r.l. in liquidation Via Giovanni Pacini, 12 - Palermo - Italy EUR 233,580 0,000% 100,000% Italstrade IS SrlToledo S.c.r.l. Via Morghen, 36 - Naples - Italy EUR 50,000 90,394% 0,000%C - Companies valued using equity methodAdduttore Ponte Barca S.c.r.l. in liquidation Via di Pietralata, 140 - Rome - Italy EUR 45,900 24,330% 0,000%Almo S.c.r.l. in liquidation Via privata D. Giustino, 3/A - Naples - Italy EUR 46,481 35,000% 0,000%Alosa Immobiliare S.p.A. in liquidation Via G.V. Bona, 65 - Rome - Italy EUR 10,320,000 50,000% 0,000%Astaldi - UTI - Romairport Joint Venture Str. Carol Devila, 70 Sector 5 - Bucharest - Romania EUR 0 40,000% 0,000%Astaldi-FCC Joint Venture (J.V. Basarab Overpass) Str. Carol Davila, 70 Sector 5 - Bucharest - Romania --- 0 50,000% 0,000%Astaldi - Max Bogl - Euroconstruct - Arcadis JV Str. Carol Davila, 70 Sector 5 - Bucharest - Romania --- 0 40,000% 0,000%Avola S.c.r.l. in liquidation Via G.V. Bona, 65 - Rome - Italy EUR 10,200 50,000% 0,000%Avrasya Metro Grubu JV (AMG JV) Istanbul - Turkey ---- 0 42,000% 0,000%Blufi 1 S.c.rl. in liquidation Zona Industriale - Agrigento - Italy EUR 25,823 32,000% 0,000%C.F.M. S.c.r.l. in liquidation Via privata D. Giustino , 3/A - Naples - Italy EUR 41,317 50,000% 0,000%Carnia S.c.r.l. in liquidation Via G.V. Bona, 65 - Rome - Italy EUR 45,900 33,000% 0,000%Colli Albani S.c.r.l. in liquidation Via G.V. Bona, 65 - Rome - Italy EUR 25,500 60,000% 0,000%Consorcio Contuy Medio Avida Andres Bello, Ed. Atlantic Piso 7, Of. 1-7 - Venezuela US$ 40,000 28,300% 0,000%Consorcio Metro Los Teques Caracas - Venezuela VEF 0 30,000% 0,000%Consorzio A.F.T. in liquidation Via G.V. Bona, 65 - Rome - Italy EUR 46,481 33,330% 0,000%Consorzio A.F.T. Kramis Via G.V. Bona, 65 - Rome - Italy EUR 100,000 49,995% 0,000%Consorzio C.I.R.C. in liquidation Via G.V. Bona, 65 - Rome - Italy EUR 51,000 25,000% 0,000%Consorzio Co.Fe.Sar. in liquidation Via Salaria, 1033 - Rome - Italy EUR 51,646 30,000% 0,000%Consorzio Consarno Via Napoli, 329 - Castellammare di Stabia (NA) - Italy EUR 20,658 25,000% 0,000%Consorzio Consavia S.c.n.c. in liquidation Via F. Tovaglieri, 17 - Rome - Italy EUR 20,658 25,000% 0,000%Consorzio Europeo Armamento Alta Velocità - C.E.A.A.V. Via G.V. Bona, 65 - Rome - Italy EUR 206,583 25,000% 0,000%Consorzio Ferrofir in liquidation Via F.Tovaglieri, 17- Rome - Italy EUR 30,987 66,666% 0,000%Consorzio Gi.It. in liquidation Via privata D. Giustino, 3/A - Naples - Italy EUR 2,582 50,000% 0,000%Consorzio Iricav Due Via F. Tovaglieri, 413 - Rome - Italy EUR 510,000 32,990% 0,000%Consorzio Iricav Uno Via F. Tovaglieri, 17 - Rome - Italy EUR 520,000 27,910% 0,000%Consorzio Ital.Co.Cer. Via Giovanni da Procida, 36 - Rome - Italy EUR 51,600 30,000% 0,000%Consorzio Italvenezia Via Salaria, 1039 - Rome - Italy EUR 77,450 25,000% 0,000%Consorzio Metrofer in liquidation Via Salaria , 1033 - Rome - Italy EUR 25,823 33,320% 0,000%Consorzio Novocen Via Orazio, 143 - Naples - Italy EUR 51,640 40,760% 0,000%Consorzio Ponte Stretto di Messina in liquidation Via G.V.Bona, 65 - Rome - Italy EUR 100,000 24,740% 0,000%Consorzio Qalat Corso Carlo Marx, 19 - Misterbianco (CT) - Italy EUR 10,327 40,000% 0,000%Copenhagen Metro Construction Group J.V. (COMET) Refshaleoen, 147 P.O. Box 1920 - Copenhagen - Denmark DKK 0 0,000% 15,000% Astaldi International Ltd.Diga di Blufi S.c.r.l. Via G.V. Bona, 65 - Rome - Italy EUR 45,900 50,000% 0,000%Ecosarno S.c.r.l. Viale Italia, 1 - Sesto S. Giovanni (MI) - Italy EUR 50,490 33,334% 0,000%Fosso Canna S.c.r.l. in liquidation Via G.V. Bona, 65 - Rome - Italy EUR 25,500 32,000% 0,000%FSC S.c.r.l. Via Scapacchiò, 41 - Selvazzano Dentro (PD) - Italy EUR 3,000 0,000% 30,000% Sartori Sud S.r.l.G.R.B.K. Barrage de Kerrada et Adduction Chelif-Kerrada du Transfert M.A.O 25, Rue Mohamed El Hadj Ahmed, Hydra - Algiers - Algeria --- 0 68,680% 0,000%G.T.J Etude et Rèalisation d'un Tunnel 25, Rue Mohamed El Hadj Ahmed, Hydra - Algiers - Algeria --- 0 60,000% 0,000%GEI - Grupo Empresas Italianas C.C.C. Tamanaco 1ra Etapa, Piso 6, Oficina 620, Chuao - Caracas - Venezuela VEF 2,000,100,000 33,335% 0,000%Groupement ASTEH 25, Rue Mohamed El Hadj Ahmed, Hydra - Algiers - Algeria --- 0 51,000% 0,000%Groupement GR-RDM 25, Rue Mohamed El Hadj Ahmed, Hydra - Algiers - Algeria --- 0 51,000% 0,000%Groupement Italgisas Angle Boulevard de la Resistance et Rue de Puissesaux - Casablanca - Morocco MAD 207,014,000 0,000% 40,000% Italstrade IS Srl

Astaldi Group companiesat 30 June 2008
Companies Address CurrencyNominal value of share capital % Direct % Indirect Holder of indirect interest
Infraflegrea S.c.r.l. in liquidation Via privata D. Giustino, 3/A - Naples - Italy EUR 46,600 50,000% 0,000%Isclero S.c.r.l. in liquidation Via G.V. Bona, 65 - Rome - Italy EUR 12,000 31,170% 0,000%JV Bogl - Astaldi - Euroconstruct - Tecnologica - Proiect Bucuresti Bd. Eroii Sanitari, 49 Sector 5 - Bucharest - Romania 0 26,000% 0,000%M.N. Metropolitana di Napoli S.p.A. Via Galileo Ferraris, 101 - Naples - Italy EUR 3,655,397 22,620% 0,000%M.O.MES S.c.r.l. Via G.V. Bona, 65 - Rome - Italy EUR 10,000 55,000% 0,000%Marsico Nuovo S.c.r.l. in liquidation Viale Italia, 1 - Sesto San Giovanni (MI) - Italy EUR 10,200 25,000% 0,000%Max Boegl - Astaldi J.V. 0 40,000% 0,000%Max Bogl-Astaldi-CCCF Asocierea JV S.r.l. Blv.Eroi Sanitar,49 - Bucharest - Romania EUR 10,000 33,000% 0,000%Metro 5 S.p.A. Via Gastone Pisoni, 2 - Milan - Italy EUR 25,000,000 23,300% 0,000%METRO C S.c.p.a. Via di Torre Spaccata, 172 - Rome - Italy EUR 150,000,000 34,500% 0,000%Metrogenova S.c.r.l. Via IV Novembre snc -Spianata Acquasola - 16121 Genoa - Italy EUR 25,500 21,810% 0,000%Metroveneta S.c.r.l. in liquidation Via G. V. Bona, 65 - Rome - Italy EUR 25,500 50,000% 0,000%Monte Vesuvio S.c.r.l. in liquidation Viale Italia, 1 - Sesto S. Giovanni (MI) - Italy EUR 45,900 50,000% 0,000%Mose-Treporti S.c.r.l. Via C.Battisti n°2 - Venice - Mestre - Italy EUR 10,000 35,000% 0,000%N.P.F. - Nuovo Polo Fieristico S.c.r.l. Via G.V. Bona, 65 - Rome - Italy EUR 40,000 50,000% 0,000%Nova Metro S.c.r.l. in liquidation Via Montello, 10 - Rome - Italy EUR 40,800 24,100% 0,000%Pegaso S.c.r.l. Via F. Tovaglieri, 17 - Rome - Italy EUR 260,000 43,750% 0,000%Piana di Licata S.c.r.l. in liquidation Via G. V. Bona, 65 - Rome - Italy EUR 10,200 43,750% 0,000%Pont Ventoux S.c.r.l. Via G.V. Bona, 65 - Rome - Italy EUR 51,000 56,250% 0,000%Principe Amedeo S.c.r.l. in liquidation Via G.V. Bona, 65 - Rome - Italy EUR 10,200 50,000% 0,000%Priolo Siracusa S.c.r.l. in liquidation Piazza Velasca, 4 - Milan - Italy EUR 11,000 20,000% 0,000%Raggruppamento Astaldi-Vianini in liquidation S.P. per Fisciano Km.1 - Fisciano (SA) - Italy EUR 25,823 50,000% 0,000%S. Leonardo S.c.r.l. in liquidation Via G.V. Bona, 65 - Rome - Italy EUR 10,200 51,000% 0,000%S.A.C.E.S. S.r.l. in liquidation Via G.V. Bona, 65 - Rome - Italy EUR 26,000 37,000% 0,000%S.E.I.S. S.p.A. Via Baiamonti, 10 - Rome - Italy EUR 3,877,500 48,330% 0,000%SA.T. S.p.A. Via G.V. Bona, 65 - Rome - Italy EUR 10,000,000 35,000% 0,000%Santangelo S.c.r.l. in liquidation Via G.V. Bona, 65 - Rome - Italy EUR 51,000 45,000% 0,000%SHARAF - ASTALDI LLC Emirate of Dubai - United Arab Emirates AED 3,000,000 49,000% 0,000%Tangenziale Seconda S.c.r.l. in liquidation Via G.V. Bona, 65 - Rome - Italy EUR 45,900 42,730% 0,000%Transeuropska Autocesta d.o.o Maksimirska 120/III 10000 - Zagreb - Croatia HRK 49,019,600 49,000% 0,000%Truncu Reale S.c.r.l. Via G.V. Bona, 65 - Rome - Italy EUR 30,600 34,000% 0,000%V.A.S.CO. Imprese Riunite Via Montello, 10 - Rome - Italy EUR 51,646 29,000% 0,000%Valle Caudina S.c.r.l. in liquidation Via G.V. Bona, 65 - Rome - Italy EUR 50,000 52,240% 0,000%Veneta Sanitaria Finanza di Progetto S.p.A. - V.S.F.P. S.p.A. Piazzetta Monsignor Olivotti, 9 - Mestre - VE - Italy EUR 20,500,000 31,000% 0,000%Vesuviana Strade S.c.r.l. Via G.V. Bona, 65 - Rome - Italy EUR 45,900 30,000% 0,000%Viadotti di Courmayeur S.c.r.l. in liquidation Via G.V. Bona, 65 - Rome - Italy EUR 10,200 66,670% 0,000%Yellow River Contractors P.O. Box 073 - Luoyang - People's Republic of China US$ 999,336 14,000% 0,000%D - Companies valued at costAguas de San Pedro S.A. de C.V. Barrio Las Palmas entre 20 y 27 calle, 3a avenida - San Pedro Sula - Honduras HNL 100,000,000 15,000% 0,000%Association en participation SEP Astaldi-Somatra-Bredero Tunisia TND 0 40,000% 0,000%Astaldi Africa S.p.A. in liquidation Addis Abeba - Ethiopia EUR 1,033 100,000% 0,000%Astaldi Bayindir J.V. Ilkadim Sokak, 19 Gaziomanpasa- Ankara - Turkey ---- 0 50,000% 0,000%Astaldi-Sarantopulos J.V. Athens - Greece ---- 0 14,000% 0,000%C.F.C. S.c.r.l. Via privata D. Giustino, 3/A - Naples - Italy EUR 45,900 0,010% 0,000%Co.Sa.Vi.D. S.c.r.l. Carini - Contrada Foresta Z.I. - Palermo - Italy EUR 25,500 0,010% 0,000%Consorcio Astaldi - C.B.I. Av. Iturralde 1308 Esquina San Salvador - La Paz - Bolivia US$ 100,000 60,000% 0,000%Consorcio Astaldi-ICE Av. Libertador Bolivar, 1842 - Cochabamba - Bolivia ---- 0 50,000% 0,000%Consorcio Grupo Contuy - Proyectos y Obras de Ferrocarriles CCC T. 1ra Etapa Piso 6 Of. 620 Chuao - Caracas - Venezuela VEF 0 32,330% 0,000%Consorzio Asse Sangro in liquidation Via della Fonte di Fauno, 2/A bis - Rome - Italy EUR 464,811 4,762% 0,000%Consorzio Centro Uno C.so Vittorio Emanuele, 130 - Naples - Italy EUR 154,937 2,000% 0,000%Consorzio Dipenta S.p.A. - Ugo Vitolo in liquidation Via Chiatamone, 57 - Naples - Italy EUR 2,582 50,000% 0,000%

Astaldi Group companiesat 30 June 2008
Companies Address CurrencyNominal value of share capital % Direct % Indirect Holder of indirect interest
Consorzio Ferroviario Vesuviano Via Argine, 425 - Naples - Italy EUR 154,937 0,004% 0,000%Consorzio Groupement Lesi-Dipenta Via Indonesia, 100 - Rome - Italy EUR 258,228 0,010% 0,000%Consorzio Team Viale Sarca, 336 - Milan - Italy EUR 45,900 11,111% 0,000%Consorzio TRA.DE.CI.V. Via Galileo Ferraris, 101 - Naples - Italy EUR 154,937 17,727% 0,000%Costruttori Romani Riuniti Grandi Opere S.p.A. Via P. Stanislao Mancini, 2 - Rome - Italy EUR 5,164,568 1,000% 0,000%Fondazione Accademia Nazionale di S. Cecilia Via Vittoria, 6 - Rome - Italy EUR 0 0,001% 0,000%Fondazione Filarmonica Arturo Toscanini Strada della Repubblica, 57 - Parma - Italy EUR 0 0,001% 0,000%Fusaro S.C.r.l. Via privata D. Giustino, 3/A - Naples - Italy EUR 10,200 0,010% 0,000%G.G.O. S.c.r.l. in liquidation Zona Industriale - Agrigento - Italy EUR 25,500 10,000% 0,000%Groupement Eurolep Shifflandestrasse, 35 - Aaran 5000 - Switzerland CHF 100,000 22,000% 0,000%IGI - Istituto Grandi Infrastrutture Via Ovidio,n°32 - Rome - Italy EUR 0 0,001% 0,000%Imprese Riunite Genova S.c.r.l. in liquidation Brigata Liguria, 1/18 - Genoa - Italy EUR 25,500 16,100% 0,000%Imprese Riunite Genova Seconda S.c.r.l. in liquidation Via Serra, 2/9 - Genoa - Italy EUR 25,000 16,100% 0,000%Irimuse S.c.r.l. in liquidation Via Salaria, 1039 - Rome - Italy EUR 619,745 0,100% 0,000%Italsagi Sp. Zo. O. Ul. Powstancow - Katowice - Poland PLN 100,000,000 0,000% 34,000% Italstrade IS SrlItalstrade CCCF JV Bucuresti S.r.l. Gheorghe Manu, 20 Sector 1 - Bucharest - Romania LEI 2,000,000 1,000% 0,000%M.N.6 S.C.r.l. Via G.Ferraris n.101 - Naples - Italy EUR 51,000 1,000% 0,000%NO.VI.F.IN. Nova Via Festinat Industrias S.c.r.l. Riviera di Chiaia, 72 - Naples - Italy EUR 10,329 0,010% 0,000%Pantano S.c.r.l. Via Montello, 10 - Rome - Italy EUR 40,800 10,000% 0,000%Pavimental S.p.A. Piazza Ferdinando De Lucia, 15 - Rome - Italy EUR 4,669,132 1,303% 0,000%Platamonas Sarantopulos J.V. Athens - Greece ---- 0 14,450% 0,000%Roma Lido S.c.r.l. Via Parigi, 11 - Rome - Italy EUR 10,200 19,115% 0,000%Skiarea Valchiavenna S.p.A. Via del Crotto, 52 - Campodolcino - Italy EUR 8,118,182 0,227% 0,000%Sociedad Concesionaria BAS S.A. Santiago de Chile - Chile CLP 8,876,340,000 0,100% 0,000%Societe SEAS - ASTALDI SARL (SE.AS SARL) B.P. 1426 - Pointe Noire - Democratic Republic of Congo XAF 10,000,000 10,000% 0,000%

ANNEX "C"EXCHANGE RATES USED TO CONVERT FINANCIAL STATEMENTSSHOWN IN FOREIGN CURRENCIES Source: Banca d'Italia
COUNTRY CURRENCY June-08 Average 1st half 2008
December-07 Average 2007
Albania Lek ALL 122.0510 122.9300 120.9590 123.6310Algeria Algerian dinar DZD 98.0380 99.7429 97.6409 95.3088Angola Kwanza AOA 116.6650 114.8445 109.2940 105.0200Saudi Arabia Saudi riyal SAR 5.8325 5.7409 5.4599 5.1353Bolivia Boliviano BOB 11.2328 11.4016 11.1137 10.7478Bulgaria Bulgarian lev BGN 1.9558 1.9558 1.9558 1.9558Burundi Burundian franc BIF 1,840.2000 1,788.6067 1,652.3100 1,483.3800Caribbean Caribbean dollar XCD 4.1993 4.1334 3.9340 3.7003Central African Republic CFA franc XOF 655.9570 655.9570 655.9570 655.9570Chile Chilean peso CLP 769.9030 714.4742 727.0980 714.9480Colombia Colombian peso COP 2,683.7600 2,809.2467 2,936.4000 2,841.5000Democratic Republic of Congo Franc Congolais CDF 858.1590 842.7862 806.0380 760.6620Costa Rica Costa Rica colon CRC 809.0910 768.9383 725.7690 708.7770Croatia Croatian kuna HRK 7.2469 7.2698 7.3178 7.3376Denmark Danish krone DKK 7.4586 7.4567 7.4599 7.4507El Salvador Salvadoran colon SVC 13.6087 13.3953 12.7491 11.9917United Arab Emirates Unit.Ar. Emirates dirham AED 5.7125 5.6224 5.3512 5.0328Japan Japanese yen JPY 166.2640 160.5627 163.5530 161.2530Djibouti Djibouti franc DJF 276.4050 272.0703 258.9460 243.5630Guatemala Quetzal GTQ 11.6684 11.6224 11.1202 10.5197Guinea Guinea franc GNF 6,797.1800 6,581.9167 6,055.0900 5,970.3100Honduras Lempira HNL 29.5183 29.0479 27.6362 25.9466Libya Libyan dinar LYD 1.8567 1.8347 1.7789 1.7289Malawi Kwacha MWK 218.7970 215.0070 204.0860 191.6640Morocco Moroccan dirham MAD 11.4596 11.4305 11.3467 11.2203Mozambique Metical MZN 37.4656 36.8849 35.0611 35.0346Nicaragua Cordoba Oro NIO 30.0622 29.2994 27.4843 25.2953Norway Norwegian krone NOK 7.9916 7.9493 8.0117 8.0165Pakistan Pakistan rupee PKR 104.8350 98.7559 89.1597 83.2468Panama Balboa PAB 1.5553 1.5309 1.4570 1.3705Peru Nuevo Sol PEN 4.4878 4.3605 4.3439 4.2848Qatar Qatari riyal QAR 5.6620 5.5712 5.3027 4.9879United Kingdom Pound sterling GBP 0.7915 0.7753 0.7206 0.6843Dominican Republic Dominican peso DOP 53.1115 51.9768 48.8266 45.2820Romania Romanian new leu RON 3.6556 3.6709 3.5351 3.3353Rwanda Rwanda franc RWF 844.4090 832.2207 793.7390 749.5820Singapore Singapore dollar SGD 2.1278 2.1232 2.1108 2.0636United States US dollar USD 1.5553 1.5309 1.4570 1.3705South Africa South African rand ZAR 12.3467 11.7434 9.9626 9.6596Switzerland Swiss franc CHF 1.6139 1.6059 1.6592 1.6427Taiwan New Taiwan dollar TWD 47.2353 47.4060 47.2268 45.0098Tanzania Tanzanian shilling TZS 1,842.9600 1,816.5333 1,682.6000 1,700.0800Tunisia Tunisian dinar TND 1.8304 1.8123 1.7885 1.7515Turkey New Turkish lira TRY 1.9207 1.8896 1.7195 1.7865European Monetary Union Euro EUR 1.0000 1.0000 1.0000 1.0000Venezuela Bolivar fuerte VEF 3.3396 3.2873 3,128.7000 2,942.8300Zambia Kwacha ZMK 5,072.3600 5,457.7950 5,588.6600 5,476.0600 Please note that the exchange rate expresses the foreign currency required to buy 1 Euro.Source: Banca d'Italia