half yearly june 2021
TRANSCRIPT


a more prosperous and secure future.
Missionfinancial solutions to create and nurture long-term relationships with ourcustomers. In doing so, we ensure that our shareholders can invest withconfidence in us.
Core ValuesThe standards and principles which determine our behavior and how weinteract with our customers and each other.
Credit Rating

Board of Directors:
Audit Committee:
3
ChairmanMember Member Member
MianMohammadManshaMr. S.M. MuneerMr. Muhammad Tariq RafiMian Umer ManshaMrs. Iqraa Hassan ManshaMr. Muhammad Ali ZebMr. Mohd Suhail Amar Suresh bin AbdullahMr. Yahya SaleemMr. Salman Khalid ButtMr. Masood Ahmed PuriMr. Shahzad HussainMr. Shariffuddin Bin KhalidMr. Imran Maqbool
ChairmanVice-ChairmanDirectorDirectorDirectorDirectorDirectorDirectorDirectorDirectorDirectorDirectorPresident & CEO
Mr.ShahzadHussainMian Umer Mansha Mr. Muhammad Ali Zeb Mr. Shariffuddin Bin Khalid
ChiefFinancialOfficer:
CompanySecretary:
Auditors:
LegalAdvisors:
Registered/PrincipalOffice:
Contactus:
Registrar'sandShareRegistrationOffice(s):
Mr. Hammad Khalid
Mr. Fida Ali Mirza
M/s. A. F. Ferguson & Co. Chartered Accountants
M/s. Khalid Anwer & Co.Advocates & Legal Consultants
MCB Building, 15-Main Gulberg, Jail Road, Lahore, Pakistan.
UAN: + 92 42 111 000 622 E-mail: [email protected] Visit us:
HeadOffice:M/s. THK Associates (Pvt.) Limited Plot No. 32-C, Jami Commercial Street 2, D.H.A., Phase VII, Karachi, Pakistan.
BranchOffice:M/s. THK Associates (Pvt.) Limited Siddique Trade Centre, Office No. PL-29, PL Floor, 72 Main Boulevard Gulberg -2, Lahore, Pakistan.

4 5
Directors’ Review - June 2021
On the provision front, the equity scrip disposals resulted in net reversal of Rs. 529 million for the six month period ended June 30, 2021. Proactive monitoring and recovery efforts led to a net provision reversal against non-performing loans (NPL's) aggregating to Rs. 1,387 million for the period under review.
On the financial position side, the total asset base of the Bank on an unconsolidated basis was reported at Rs. 1,861 billion (+6%). Analysis of the asset mix highlights that while the growth in gross advances remained subdued amidst a dearth of quality lending opportunities, the excess liquidity was diverted towards the investment book; which in turn grew by Rs. 80 billion and contributed the major share to the total increase. However, the consumer lending book grew by Rs. 3.98 billion (+14%) on account of significant activity in the construction and auto segment.
Persistent focus on maintaining a robust risk management framework encompassing structured assessment models, effective pre-disbursement evaluation tools and an array of post disbursement monitoring systems has enabled MCB to effectively manage its credit risks despite realization of systematic risks emanating from the evolving macroeconomic situation. The non-performing loan (NPLs) base of the Bank hence registered a decline over December 2020 to report at Rs. 51.06 billion.
The Bank has not taken FSV benefit in calculation of specific provision and carries un-encumbered general provision reserve of Rs. 3.06 billion. The coverage and infection ratios of the Bank were reported at 95.67% and 9.98% respectively.
On the liabilities side, achieving growth in no-cost current account base remained a key strategic objective for the Bank. Thereby, non-remunerative deposits grew by 20% to close at Rs. 589 billion; improving their mix in the total deposits to 41% in absolute terms as at June 30, 2021 compared to 38% as at December 31, 2020. CASA mix was reported at 92% whereas the total deposits of the Bank grew by 12% to close the period at Rs. 1.44 trillion.
Return on Assets and Return on Equity reported at 1.63% and 18.66% respectively, whereas the book value per share was reported at Rs. 129.68.
Under Roshan Digital Account (RDA), the Bank has brought in over USD 125 million since the inception of the proposition in September 2020. The volume of foreign trade showed tremendous growth of 64% over H1'2020.
While complying with the regulatory capital requirements, the Bank's total Capital Adequacy Ratio (CAR) is 19.51% against the requirement of 11.5% (including capital conservation buffer of 1.50% as reduced under the BPRD Circular Letter No. 12 of 2020). Quality of the capital is evident from Bank's Common Equity Tier-1 (CET1) to total risk weighted assets ratio which comes to 16.07% against the requirement of 6%. Bank's capitalization also resulted in a Leverage Ratio of 6.33% which is well above the regulatory limit of 3.0%. The Bank reported Liquidity Coverage Ratio (LCR) of 245.82% and Net Stable Funding Ratio (NSFR) of 187.82% against requirement of 100%.
The Board of Directors has declared 2nd interim cash dividend of Rs. 5.0 per share i.e. 50% bringing the total cash dividend for
the year ending 2021 to 95%, continuing with its highest dividend payout trend.
Ratings The Bank enjoys highest local credit ratings of AAA / A1+ categories for long term and short term respectively, based on PACRA notification dated June 23, 2021.
Economy ReviewDuring the last quarter of FY 2021, Pakistan's macroeconomic fundamentals remained largely robust. However, the spread of the COVID-19 Delta variant and an increasing monthly current account deficit highlighted the developing challenges for the economy.
Rs. in Million
On behalf of the Board of Directors, we are pleased to place before you, the financial statements of MCB Bank Limited (MCB) for the six months period ended June 30, 2021.
Introduction
Despite the challenges posed to the operating environment by the recently witnessed resurgence in COVID-19 infections amidst the most virulent wave of the outbreak, MCB remained operationally resilient and capitalized on the earlier gained business traction to post another period of sustainable financial growth for its stakeholders.
The Bank's exceptional performance has also been recognized by the globally coveted Finance Asia's Country Awards wherein it has been bestowed with the “Best Bank in Pakistan” accolade for the year 2020.
Performance Review
25,01310,270
14,743
69,835
209
69,925 84,668
(24,583)
60,085
Profit Before Taxation
Taxation
Profit After Taxation
Un-appropriated Profit Brought Forward Re-measurement loss on defined benefit obligations - net of taxSurplus realized on disposal of revalued fixed assets - net of taxSurplus realized on disposal of non-banking assets - net of tax
Transfer in respect of incremental depreciation from surplus onrevaluation of fixed assets to unappropriated profit - net of tax
Profit Available for Appropriation Appropriations:
Statutory Reserve
Final Cash Dividend at Rs. 15.0 per share - December 2020
Total Appropriations
Un-appropriated Profit Carried Forward
MCB's unconsolidated Profit After Tax (PAT) for the six month period ended June 30, 2021 increased to Rs. 14.74 billion (+12%); translating into an Earning Per Share (EPS) of Rs. 12.44 against an EPS of Rs. 11.15 reported in the corresponding period last year.
Net Interest income reported at Rs. 31.55 billion with a drop of 12% on account of decreased earning margins due to the expansionary monetary policy regime adopted by the State Bank of Pakistan to combat the downside risks emanating from COVID-19 outbreak. Low policy rate diluted the impact of positive volumetric growth achieved by the Bank in its average earning assets.
Non-markup income registered phenomenal growth of 34% and aggregated to Rs. 9.50 billion against Rs. 7.08 billion in the corresponding period last year. Improved transactional volumes, surge in business activities, diversification of revenue streams through continuous enrichment of Bank's product suite, investments towards digital transformation and an unrelenting focus on upholding the high service standards in the industry supplemented a growth of 17% in fee income while the dividend income increased by 83%.
On the operating expenses side, despite sustained inflationary pressures amidst currency devaluation, higher compliance related regulatory charges, expansion in branch outreach and regular performance and merit adjustments of the Human Capital, the Bank was able to contain the growth to 6%.
(166)
First Interim Dividend at Rs. 4.5 per share - March 2021
6
41
(1,474)(17,776)
(5,333)
76
Imran Maqbool
August 11, 2021
Muhammad Ali Zeb
Director
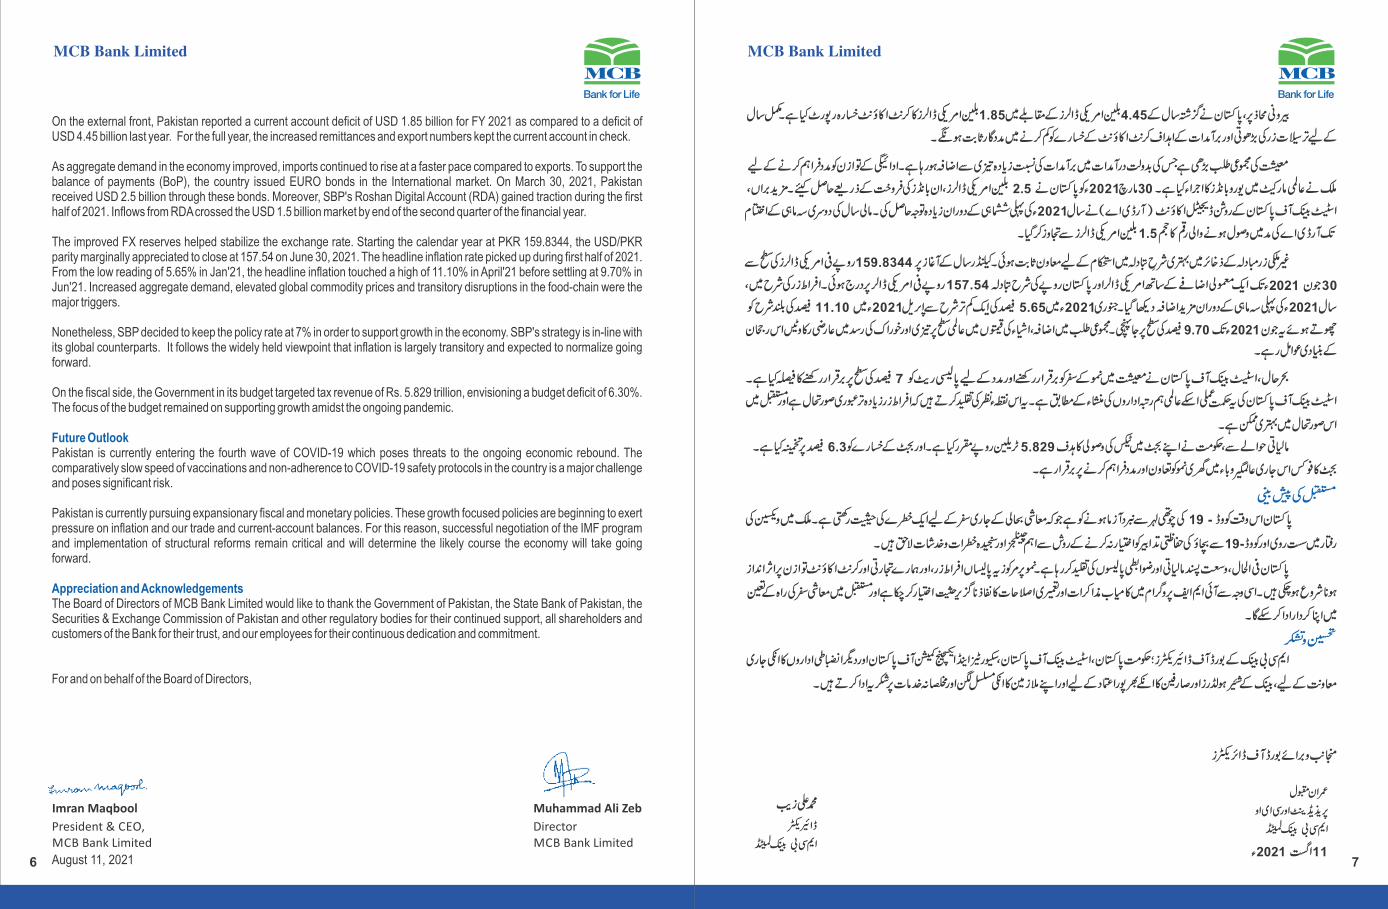
On the external front, Pakistan reported a current account deficit of USD 1.85 billion for FY 2021 as compared to a deficit of USD 4.45 billion last year. For the full year, the increased remittances and export numbers kept the current account in check.
As aggregate demand in the economy improved, imports continued to rise at a faster pace compared to exports. To support the balance of payments (BoP), the country issued EURO bonds in the International market. On March 30, 2021, Pakistan received USD 2.5 billion through these bonds. Moreover, SBP's Roshan Digital Account (RDA) gained traction during the first half of 2021. Inflows from RDA crossed the USD 1.5 billion market by end of the second quarter of the financial year.
The improved FX reserves helped stabilize the exchange rate. Starting the calendar year at PKR 159.8344, the USD/PKR parity marginally appreciated to close at 157.54 on June 30, 2021. The headline inflation rate picked up during first half of 2021. From the low reading of 5.65% in Jan'21, the headline inflation touched a high of 11.10% in April'21 before settling at 9.70% in Jun'21. Increased aggregate demand, elevated global commodity prices and transitory disruptions in the food-chain were the major triggers.
Nonetheless, SBP decided to keep the policy rate at 7% in order to support growth in the economy. SBP's strategy is in-line with its global counterparts. It follows the widely held viewpoint that inflation is largely transitory and expected to normalize going forward.
On the fiscal side, the Government in its budget targeted tax revenue of Rs. 5.829 trillion, envisioning a budget deficit of 6.30%. The focus of the budget remained on supporting growth amidst the ongoing pandemic.
Future OutlookPakistan is currently entering the fourth wave of COVID-19 which poses threats to the ongoing economic rebound. The comparatively slow speed of vaccinations and non-adherence to COVID-19 safety protocols in the country is a major challenge and poses significant risk.
Pakistan is currently pursuing expansionary fiscal and monetary policies. These growth focused policies are beginning to exert pressure on inflation and our trade and current-account balances. For this reason, successful negotiation of the IMF program and implementation of structural reforms remain critical and will determine the likely course the economy will take going forward.
Appreciation and AcknowledgementsThe Board of Directors of MCB Bank Limited would like to thank the Government of Pakistan, the State Bank of Pakistan, the Securities & Exchange Commission of Pakistan and other regulatory bodies for their continued support, all shareholders and customers of the Bank for their trust, and our employees for their continuous dedication and commitment.
For and on behalf of the Board of Directors,

8 9

11Salman Khalid Butt
Director S. M. Muneer
Director Imran MaqboolPresident / CEO Muhammad Ali Zeb
Director Hammad Khalid
Chief Financial Officer
ASSETS
Cash and balances with treasury banks
Balances with other banks
Lendings to financial institutions
Investments
Advances
Fixed assets
Intangible assets
Deferred tax assets
Other assets
LIABILITIES
Bills payable
Borrowings
Deposits and other accounts
Liabilities against assets subject to finance lease
Subordinated debt
Deferred tax liabilities
Other liabilities
NET ASSETS
REPRESENTED BY
Share capital
Reserves
Surplus on revaluation of assets
Unappropriated profit
CONTINGENCIES AND COMMITMENTS
The annexed notes 1 to 41 form an integral part of these unconsolidated condensed interim financial statements.
Note Unaudited June 30, 2021
Audited December 31, 2020
7 142,190,958 122,180,839
8 14,221,640 24,030,328
9 32,494,214 17,139,453
10 1,096,213,219 1,015,869,448
11 462,537,916 462,941,787
12 57,587,543 58,027,904
13 956,039 938,458
- -
14 54,721,830 56,334,253
1,860,923,359 1,757,462,470
16 12,928,523 23,980,692
17 139,594,324 164,001,533
18 1,441,208,405 1,289,502,304
- -
- -
19 6,989,155 6,975,158
20 81,584,666 82,900,828
1,682,305,073 1,567,360,515
178,618,286 190,101,955
11,850,600 11,850,600
21 81,744,621 80,696,335
22 24,938,570 27,720,418
60,084,495 69,834,602
178,618,286 190,101,955
23
---------Rupees in '000---------
10
Independent Auditor's Review Report
To The Members of MCB Bank LimitedReport on Review of Unconsolidated Condensed Interim Financial Statements
A. F. Ferguson & Co
Chartered Accountants
Lahore
Dated: August 25, 2021
Introduction
We have reviewed the accompanying unconsolidated condensed interim statement of financial position of MCB Bank Limited (“the
Bank”) as at June 30, 2021 and the related unconsolidated condensed interim profit and loss account, unconsolidated condensed
interim statement of comprehensive income, unconsolidated condensed interim statement of changes in equity, and
unconsolidated condensed interim cash flow statement, and notes to the unconsolidated condensed interim financial statements
for the six-month period then ended (here-in-after referred to as the “interim financial statements”). Management is responsible for
the preparation and presentation of this interim financial statements in accordance with the accounting and reporting standards as
applicable in Pakistan for interim financial reporting. Our responsibility is to express a conclusion on these financial statements
based on our review. The figures for the quarters ended June 30, 2021 and June 30, 2020 in the unconsolidated condensed interim
profit and loss account and unconsolidated condensed interim statement of comprehensive income have not been reviewed and
we do not express a conclusion on them.
Scope of Review
We conducted our review in accordance with International Standard on Review Engagements 2410, “Review of Interim Financial
Information Performed by the Independent Auditor of the Entity”. A review of interim financial statements consists of making
inquiries, primarily of persons responsible for financial and accounting matters, and applying analytical and other review
procedures. A review is substantially less in scope than an audit conducted in accordance with International Standards on Auditing
and consequently does not enable us to obtain assurance that we would become aware of all significant matters that might be
identified in an audit. Accordingly, we do not express an audit opinion.
Conclusion
Based on our review, nothing has come to our attention that causes us to believe that the accompanying interim financial
statements is not prepared, in all material respects, in accordance with the accounting and reporting standards as applicable in
Pakistan for interim financial reporting.
Other matter
The financial statements of the Bank for the year ended December 31, 2020 were audited by another firm of Chartered
Accountants who expressed an unqualified opinion thereon vide their report dated February 26, 2021.
The engagement partner on the review resulting in this independent auditor's review report is Hammad Ali Ahmad.
Unconsolidated Condensed Interim Statement of Financial PositionAS AT JUNE 30, 2021
12 13
Unconsolidated Condensed Interim Statement of Comprehensive Income (Un-audited)For The Half Year Ended June 30, 2021
Salman Khalid ButtDirector
S. M. MuneerDirector
Imran MaqboolPresident / CEO Muhammad Ali Zeb
Director Hammad Khalid
Chief Financial Officer
April 01 to
June 30, 2021
April 01 to
June 30, 2020
January 01to
June 30, 2021
January 01to
June 30, 2020
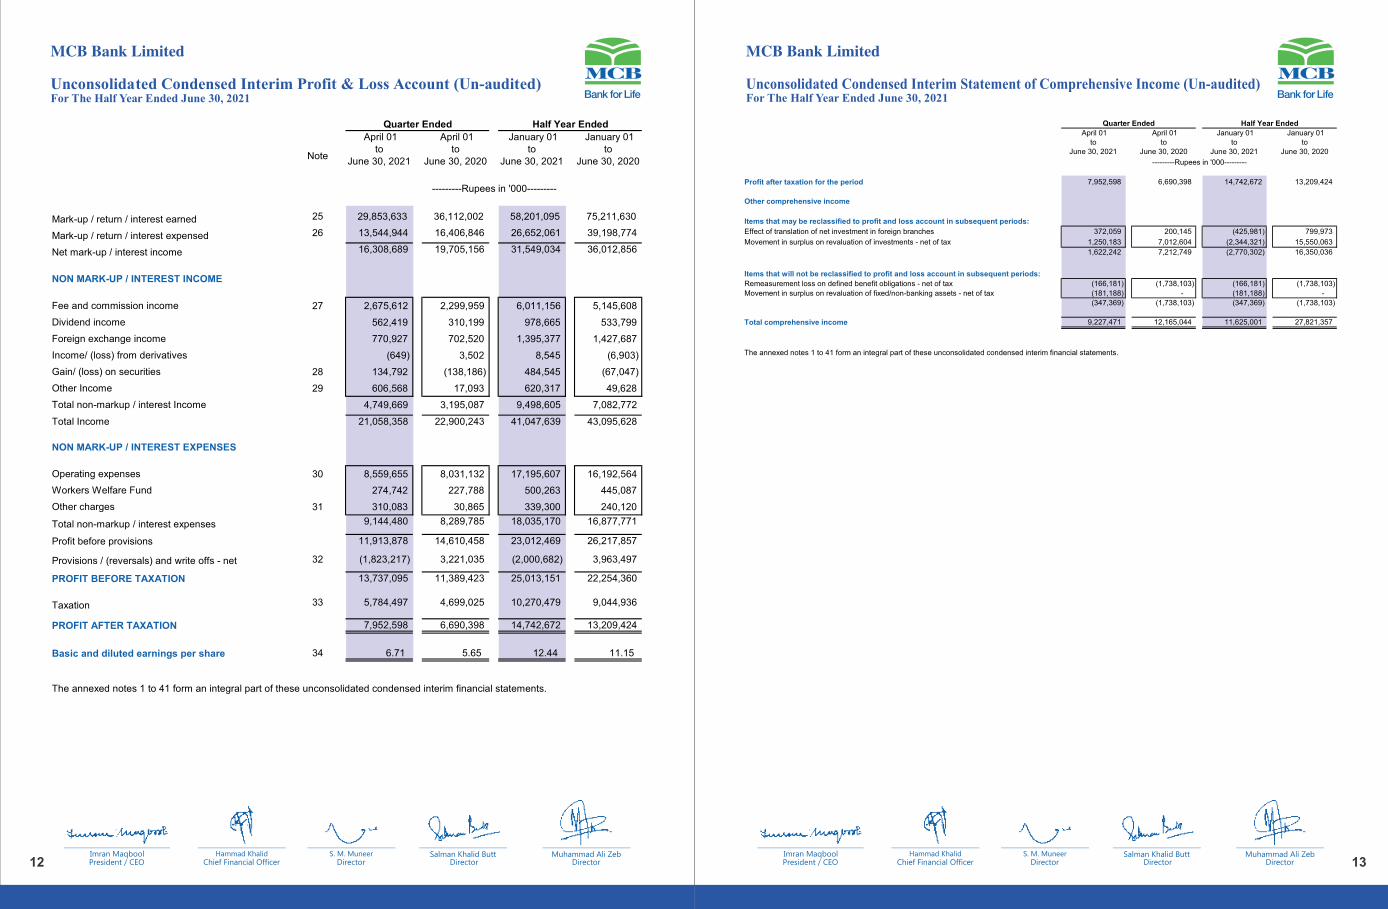
Profit after taxation for the period 7,952,598
6,690,398
14,742,672
13,209,424
Other comprehensive income
Items that may be reclassified to profit and loss account in subsequent periods:
Effect of translation of net investment in foreign branches 372,059 200,145 (425,981) 799,973
Movement in surplus on revaluation of investments - net of tax 1,250,183 7,012,604 (2,344,321) 15,550,063
1,622,242
7,212,749
(2,770,302)
16,350,036
Items that will not be reclassified to profit and loss account in subsequent periods:
Remeasurement loss on defined benefit obligations - net of tax (166,181)
(1,738,103)
(166,181)
(1,738,103)
Movement in surplus on revaluation of fixed/non-banking assets - net of tax (181,188)
-
(181,188)
-
(347,369)
(1,738,103)
(347,369)
(1,738,103)
Total comprehensive income 9,227,471 12,165,044 11,625,001 27,821,357
The annexed notes 1 to 41 form an integral part of these unconsolidated condensed interim financial statements.
---------Rupees in '000---------
Quarter Ended Half Year Ended
Salman Khalid ButtDirector
S. M. MuneerDirector
Imran MaqboolPresident / CEO Muhammad Ali Zeb
Director Hammad Khalid
Chief Financial Officer
Note
April 01 to
June 30, 2021
April 01 to
June 30, 2020
January 01to
June 30, 2021
January 01to
June 30, 2020
Mark-up / return / interest earned 25 29,853,633
36,112,002
58,201,095
75,211,630
Mark-up / return / interest expensed 26 13,544,944 16,406,846 26,652,061 39,198,774
Net mark-up / interest income 16,308,689 19,705,156 31,549,034 36,012,856
NON MARK-UP / INTEREST INCOME
Fee and commission income 27 2,675,612 2,299,959 6,011,156 5,145,608
Dividend income 562,419 310,199 978,665 533,799
Foreign exchange income 770,927 702,520 1,395,377 1,427,687
Income/ (loss) from derivatives (649) 3,502 8,545 (6,903)
Gain/ (loss) on securities 28 134,792 (138,186) 484,545 (67,047)
Other Income 29 606,568 17,093 620,317 49,628
Total non-markup / interest Income 4,749,669 3,195,087 9,498,605 7,082,772
Total Income 21,058,358 22,900,243 41,047,639 43,095,628
NON MARK-UP / INTEREST EXPENSES
Operating expenses 30 8,559,655 8,031,132 17,195,607 16,192,564
Workers Welfare Fund 274,742 227,788 500,263 445,087
Other charges 31 310,083 30,865 339,300 240,120
Total non-markup / interest expenses 9,144,480 8,289,785 18,035,170 16,877,771
Profit before provisions 11,913,878 14,610,458 23,012,469 26,217,857
Provisions / (reversals) and write offs - net 32 (1,823,217) 3,221,035 (2,000,682) 3,963,497
PROFIT BEFORE TAXATION 13,737,095 11,389,423 25,013,151 22,254,360
Taxation 33 5,784,497 4,699,025 10,270,479 9,044,936
PROFIT AFTER TAXATION 7,952,598 6,690,398 14,742,672 13,209,424
Basic and diluted earnings per share 34 6.71 5.65 12.44 11.15
The annexed notes 1 to 41 form an integral part of these unconsolidated condensed interim financial statements.
Quarter Ended Half Year Ended
---------Rupees in '000---------
Unconsolidated Condensed Interim Profit & Loss Account (Un-audited)For The Half Year Ended June 30, 2021
14 15
Unconsolidated Condensed Interim Cash Flow Statement (Un-audited)For The Half Year Ended June 30, 2021
Salman Khalid ButtDirector
S. M. MuneerDirector
Imran MaqboolPresident / CEO Muhammad Ali Zeb
Director Hammad Khalid
Chief Financial Officer
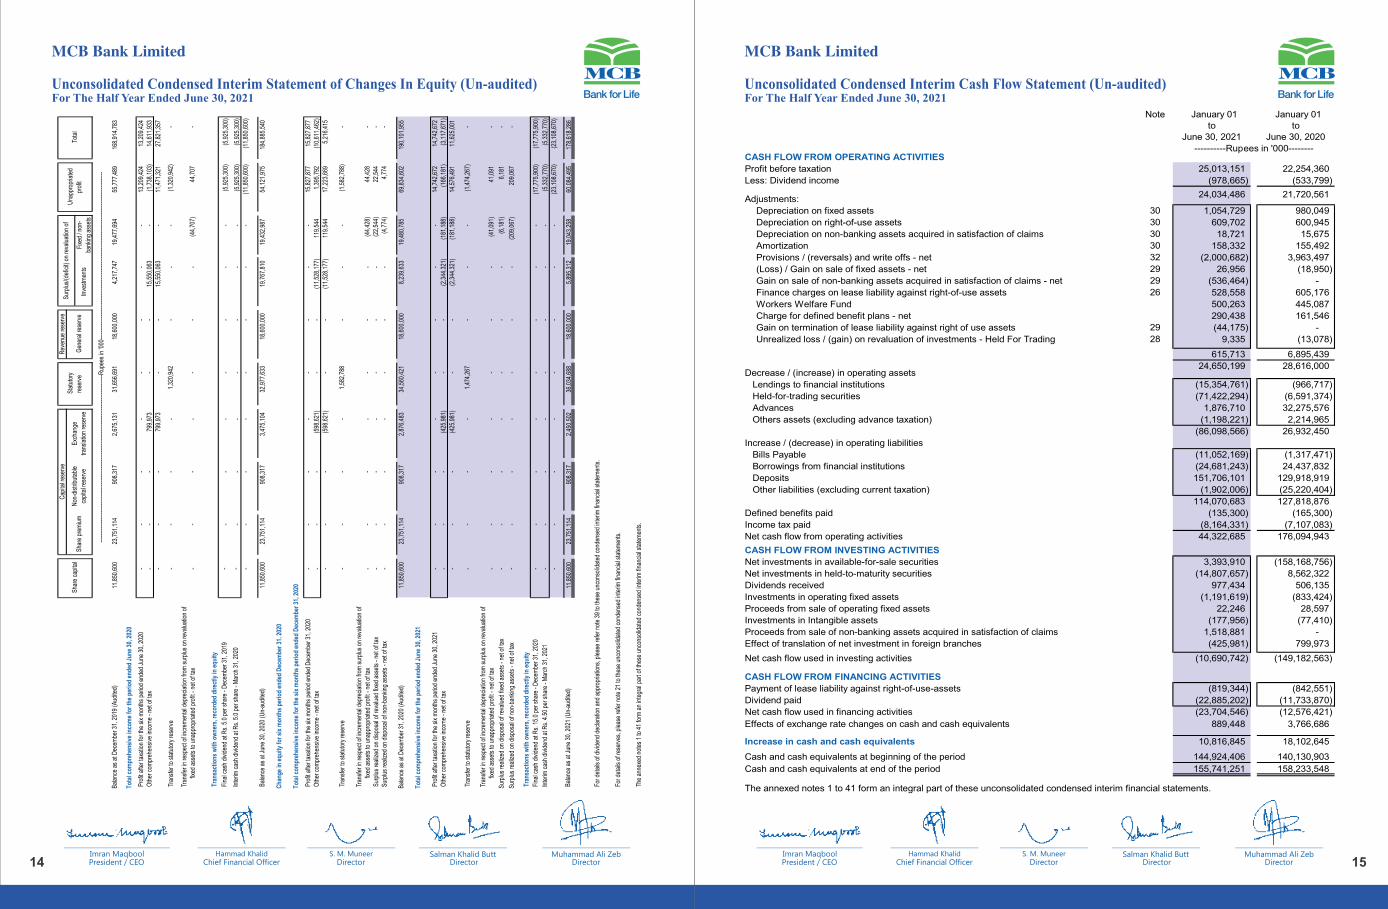
24,034,486 21,720,561
Note January 01to
June 30, 2021
January 01to
June 30, 2020
----------Rupees in '000--------CASH FLOW FROM OPERATING ACTIVITIES
Profit before taxation 25,013,151 22,254,360
Less: Dividend income (978,665)
(533,799)
Adjustments:
Depreciation on fixed assets 30 1,054,729
980,049
Depreciation on right-of-use assets 30 609,702
600,945
Depreciation on non-banking assets acquired in satisfaction of claims 30 18,721
15,675
Amortization 30 158,332
155,492
Provisions / (reversals) and write offs - net 32 (2,000,682) 3,963,497
(Loss) / Gain on sale of fixed assets - net 29 26,956 (18,950)
Gain on sale of non-banking assets acquired in satisfaction of claims - net 29 (536,464) -
Finance charges on lease liability against right-of-use assets 26 528,558 605,176 Workers Welfare Fund 500,263 445,087 Charge for defined benefit plans - net 290,438 161,546 Gain on termination of lease liability against right of use assets 29 (44,175) - Unrealized loss / (gain) on revaluation of investments - Held For Trading 28 9,335 (13,078)
615,713
6,895,439
24,650,199
28,616,000 Decrease / (increase) in operating assets
Lendings to financial institutions (15,354,761)
(966,717) Held-for-trading securities (71,422,294)
(6,591,374)
Advances 1,876,710
32,275,576 Others assets (excluding advance taxation) (1,198,221)
2,214,965
(86,098,566)
26,932,450
Increase / (decrease) in operating liabilities
Bills Payable (11,052,169)
(1,317,471)
Borrowings from financial institutions (24,681,243)
24,437,832
Deposits 151,706,101
129,918,919
Other liabilities (excluding current taxation) (1,902,006)
(25,220,404)
114,070,683
127,818,876
Defined benefits paid (135,300)
(165,300)
Income tax paid (8,164,331)
(7,107,083)
Net cash flow from operating activities 44,322,685
176,094,943
CASH FLOW FROM INVESTING ACTIVITIES
Net investments in available-for-sale securities 3,393,910
(158,168,756)
Net investments in held-to-maturity securities (14,807,657)
8,562,322
Dividends received 977,434
506,135
Investments in operating fixed assets (1,191,619)
(833,424)
Proceeds from sale of operating fixed assets 22,246
28,597
Investments in Intangible assets (177,956)
(77,410)
Proceeds from sale of non-banking assets acquired in satisfaction of claims 1,518,881
-
Effect of translation of net investment in foreign branches (425,981)
799,973
Net cash flow used in investing activities (10,690,742)
(149,182,563)
CASH FLOW FROM FINANCING ACTIVITIES
Payment of lease liability against right-of-use-assets (819,344)
(842,551)
Dividend paid (22,885,202)
(11,733,870)
Net cash flow used in financing activities (23,704,546)
(12,576,421)
Effects of exchange rate changes on cash and cash equivalents 889,448
3,766,686
Increase in cash and cash equivalents 10,816,845
18,102,645
Cash and cash equivalents at beginning of the period 144,924,406
140,130,903
Cash and cash equivalents at end of the period 155,741,251 158,233,548
The annexed notes 1 to 41 form an integral part of these unconsolidated condensed interim financial statements.
Salman Khalid ButtDirector
S. M. MuneerDirector
Imran MaqboolPresident / CEO Muhammad Ali Zeb
Director Hammad Khalid
Chief Financial Officer
Rev
enue
rese
rve
Inve
stm
ents
Fixe
d / n
on-
bank
ing
asse
ts
Bal
ance
as
at D
ecem
ber 3
1, 2
019
(Aud
ited)
11,8
50,6
0023
,751
,114
908,
317
2,67
5,13
131
,656
,691
18,6
00,0
004,
217,
747
19,4
77,6
9455
,777
,489
168,
914,
783
Tota
l com
preh
ensi
ve in
com
e fo
r th
e pe
riod
end
ed J
une
30, 2
020
Pro
fit a
fter t
axat
ion
for t
he s
ix m
onth
s pe
riod
ende
d Ju
ne 3
0, 2
020
--
--
--
--
13,2
09,4
2413
,209
,424
Oth
er c
ompr
ehen
sive
inco
me
- net
of t
ax-
--
799,
973
--
15,5
50,0
63-
(1,7
38,1
03)
14,6
11,9
33
--
-79
9,97
3-
-15
,550
,063
-11
,471
,321
27,8
21,3
57
Tran
sfer
to s
tatu
tory
rese
rve
-
-
-
-
1,32
0,94
2
-
-
-
(1,3
20,9
42)
-
Tra
nsfe
r in
resp
ect o
f inc
rem
enta
l dep
reci
atio
n fro
m s
urpl
us o
n re
valu
atio
n of
fix
ed a
sset
s to
una
ppro
pria
ted
prof
it - n
et o
f tax
-
-
-
-
-
-
-
(44,
707)
44,7
07-
Tran
sact
ions
with
ow
ners
, rec
orde
d di
rect
ly in
equ
ity
Fina
l cas
h di
vide
nd a
t Rs.
5.0
per
sha
re -
Dec
embe
r 31,
201
9-
-
-
-
-
-
-
-
(5,9
25,3
00)
(5,9
25,3
00)
Inte
rim c
ash
divi
dend
at R
s. 5
.0 p
er s
hare
- M
arch
31,
202
0-
-
-
-
-
-
-
-
(5,9
25,3
00)
(5,9
25,3
00)
-
-
-
-
-
-
-
-
(11,
850,
600)
(11,
850,
600)
Bal
ance
as
at J
une
30, 2
020
(Un-
audi
ted)
11,8
50,6
00
23,7
51,1
14
908,
317
3,47
5,10
4
32,9
77,6
33
18,6
00,0
00
19,7
67,8
10
19,4
32,9
87
54,1
21,9
7518
4,88
5,54
0
Cha
nge
in e
quity
for
six
mon
ths
peri
od e
nded
Dec
embe
r 31
, 202
0
Tota
l com
preh
ensi
ve in
com
e fo
r th
e si
x m
onth
s pe
riod
end
ed D
ecem
ber
31, 2
020
Pro
fit a
fter t
axat
ion
for t
he s
ix m
onth
s pe
riod
ende
d D
ecem
ber 3
1, 2
020
-
-
-
-
-
-
-
-
15,8
27,8
7715
,827
,877
Oth
er c
ompr
ehen
sive
inco
me
- net
of t
ax-
-
-
(598
,621
)
-
-
(11,
528,
177)
119,
544
1,39
5,79
2(1
0,61
1,46
2)
-
-
-
(598
,621
)
-
-
(11,
528,
177)
119,
544
17,2
23,6
695,
216,
415
Tran
sfer
to s
tatu
tory
rese
rve
-
-
-
-
1,58
2,78
8
-
-
-
(1,5
82,7
88)
-
Tra
nsfe
r in
resp
ect o
f inc
rem
enta
l dep
reci
atio
n fro
m s
urpl
us o
n re
valu
atio
n of
fix
ed a
sset
s to
una
ppro
pria
ted
prof
it - n
et o
f tax
-
-
-
-
-
-
-
(44,
428)
44,4
28-
Sur
plus
real
ized
on
disp
osal
of r
eval
ued
fixed
ass
ets
- net
of t
ax-
-
-
-
-
-
-
(22,
544)
22,5
44-
Sur
plus
real
ized
on
disp
osal
of n
on-b
anki
ng a
sset
s - n
et o
f tax
-
-
-
-
-
-
-
(4,7
74)
4,77
4-
Bal
ance
as
at D
ecem
ber 3
1, 2
020
(Aud
ited)
11,8
50,6
00
23,7
51,1
14
908,
317
2,87
6,48
3
34,5
60,4
21
18,6
00,0
00
8,23
9,63
3
19,4
80,7
85
69,8
34,6
0219
0,10
1,95
5
Tota
l com
preh
ensi
ve in
com
e fo
r th
e pe
riod
end
ed J
une
30, 2
021
Pro
fit a
fter t
axat
ion
for t
he s
ix m
onth
s pe
riod
ende
d Ju
ne 3
0, 2
021
-
-
-
-
-
-
-
-
14,7
42,6
7214
,742
,672
Oth
er c
ompr
ehen
sive
inco
me
- net
of t
ax-
-
-
(425
,981
)
-
-
(2,3
44,3
21)
(181
,188
)
(166
,181
)(3
,117
,671
)
-
-
-
(425
,981
)
-
-
(2,3
44,3
21)
(181
,188
)
14,5
76,4
9111
,625
,001
Tran
sfer
to s
tatu
tory
rese
rve
-
-
-
-
1,47
4,26
7
-
-
-
(1,4
74,2
67)
-
Tra
nsfe
r in
resp
ect o
f inc
rem
enta
l dep
reci
atio
n fro
m s
urpl
us o
n re
valu
atio
n of
fix
ed a
sset
s to
una
ppro
pria
ted
prof
it - n
et o
f tax
-
-
-
-
-
-
-
(41,
091)
41,0
91-
Sur
plus
real
ized
on
disp
osal
of r
eval
ued
fixed
ass
ets
- net
of t
ax-
-
-
-
-
-
-
(6,1
81)
6,18
1-
Sur
plus
real
ized
on
disp
osal
of n
on-b
anki
ng a
sset
s - n
et o
f tax
-
-
-
-
-
-
-
(209
,067
)
209,
067
-
Tran
sact
ions
with
ow
ners
, rec
orde
d di
rect
ly in
equ
ity
Fina
l cas
h di
vide
nd a
t Rs.
15.
0 pe
r sha
re -
Dec
embe
r 31,
202
0-
--
--
--
-(1
7,77
5,90
0)(1
7,77
5,90
0)
Inte
rim c
ash
divi
dend
at R
s. 4
.50
per s
hare
- M
arch
31,
202
1-
--
--
--
-(5
,332
,770
)(5
,332
,770
)
--
--
--
--
(23,
108,
670)
(23,
108,
670)
Bal
ance
as
at J
une
30, 2
021
(Un-
audi
ted)
11,8
50,6
0023
,751
,114
908,
317
2,45
0,50
236
,034
,688
18,6
00,0
005,
895,
312
19,0
43,2
5860
,084
,495
178,
618,
286
For d
etai
ls o
f div
iden
d de
clar
atio
n an
d ap
prop
riatio
ns, p
leas
e re
fer n
ote
39 to
thes
e un
cons
olid
ated
con
dens
ed in
terim
fina
ncia
l sta
tem
ents
.
For d
etai
ls o
f res
erve
s, p
leas
e re
fer n
ote
21 to
thes
e un
cons
olid
ated
con
dens
ed in
terim
fina
ncia
l sta
tem
ents
.
The
anne
xed
note
s 1
to 4
1 fo
rm a
n in
tegr
al p
art o
f the
se u
ncon
solid
ated
con
dens
ed in
terim
fina
ncia
l sta
tem
ents
.
----
----
----
----
----
----
----
----
----
----
----
----
----
----
----
----
----
----
----
----
----
----
----
---R
upee
s in
'000
----
----
----
----
----
----
----
----
----
----
----
----
----
----
----
----
----
----
----
----
----
----
----
---
Cap
ital r
eser
ve S
tatu
tory
rese
rve
Sha
re c
apita
l S
urpl
us/(d
efic
it) o
n re
valu
atio
n of
Sha
re p
rem
ium
N
on-d
istri
buta
ble
capi
tal r
eser
ve
Exc
hang
e
trans
latio
n re
serv
e G
ener
al re
serv
e
Una
ppro
pria
ted
prof
it T
otal
Unconsolidated Condensed Interim Statement of Changes In Equity (Un-audited)For The Half Year Ended June 30, 2021

16 17
3.6
The following new standards and amendments to existing accounting standards will be effective from the dates mentioned below against the respective standard or amendment:
Effective date (annual periodsbeginning on or after)
Property, Plant and Equipment: Proceeds before intended use – Amendments to IAS 16
Cost of Fulfilling an Onerous Contracts – Amendments to IAS 37
January 1, 2022
4 SIGNIFICANT ACCOUNTING POLICIES
5 CRITICAL ACCOUNTING ESTIMATES AND JUDGMENTS
6 FINANCIAL RISK MANAGEMENT
Updating a Reference to the Conceptual Framework – Amendments to IFRS 3
Classification of Liabilities as Current or Non-current – Amendments to IAS 1
January 1, 2022
January 1, 2022
January 1, 2023
IFRS 9, Financial Instruments: Classification and Measurement, addresses recognition, classification, measurement and derecognition of financial assets and financial liabilities. The standard has also introduced a new impairment model for financial assets which requires recognition of impairment charge based on an 'Expected Credit Losses' (ECL) approach rather than the 'incurred credit losses' approach as currently followed. The ECL approach has an impact on all assets of the Bank which are exposed to credit risk.
As per the SBP's BPRD Circular Letter no. 24 dated July 5, 2021, the applicability of IFRS 9 to banks in Pakistan has been deferred to accounting periods beginning on or after January 1, 2022. Therefore, these unconsolidated condensed interim financial statements have been prepared in accordance with the existing prudential regime to the extent of the Bank's domestic operations, whereas the requirements of this standard are incorporated for overseas jurisdictions where IFRS 9 has been adopted.
There are other new and amended standards and interpretations that are mandatory for the Bank's accounting periods beginning on or after January 1, 2022 but are considered not to be relevant or do not have any significant effect on the Bank's operations and are therefore not detailed in these unconsolidated condensed interim financial statements.
The significant accounting policies and methods of computation adopted in the preparation of these unconsolidated condensed interim financial statements are consistent with those applied in the preparation of the audited annual unconsolidated financial statements of the Bank for the year ended December 31, 2020.
The basis for accounting estimates adopted in the preparation of these unconsolidated condensed interim financial statements are the same as that applied in the preparation of the unconsolidated financial statements for the year ended December 31, 2020.
The financial risk management objectives and policies adopted by the Bank are consistent with those disclosed in the unconsolidated financial statements for the year ended December 31, 2020. These risk management policies continue to remain robust and the Bank is reviewing its portfolio regularly and conducts rapid portfolio reviews in line with emerging risks.
Standards, interpretations of and amendments to approved accounting standards that are not yet effective
Amended by Definition of Accounting Estimates – Amendments to IAS 8 January 1, 2023
Notes To The Unconsolidated Condensed Interim Financial Statements (Un-audited) Notes To The Unconsolidated Condensed Interim Financial Statements (Un-audited) For The Half Year Ended June 30, 2021For The Half Year Ended June 30, 2021
1.
2.
2.1
2.2
2.3
3.
3.1
2.4
3.2
3.3
3.4
3.5
MCB Bank Limited (the 'Bank') is a banking company incorporated in Pakistan and is engaged in commercial banking and related services. The Bank's ordinary shares are listed on the Pakistan stock exchange. The Bank's Registered Office and Principal Office are situated at MCB -15 Main Gulberg, Lahore. The Bank operates 1419 branches (2020: 1418 branches) within Pakistan and 11 branches (2020: 11 branches) outside Pakistan (including the Karachi Export Processing Zone branch).
STATUS AND NATURE OF BUSINESS
BASIS OF PREPARATION
These unconsolidated condensed interim financial statements represent separate financial statements of MCB Bank Limited. The consolidated condensed interim financial statements of the Group are being issued separately.
In accordance with the directives of the Federal Government regarding the shifting of the banking system to Islamic modes, the State Bank of Pakistan has issued various circulars from time to time. Permissible forms of trade-related modes of financing include purchase of goods by banks from their customers and immediate resale to them at appropriate profit in price on deferred payment basis. The purchases and sales arising under these arrangements are not reflected in these unconsolidated condensed interim financial statements as such but are restricted to the amount of facility actually utilized and the appropriate portion of profit thereon.
The unconsolidated condensed interim financial statements are presented in Pak Rupees, which is the Bank's functional and presentation currency. The amounts are rounded off to the nearest thousand.
These unconsolidated condensed interim financial statements have been prepared under the historical cost convention except that certain classes of fixed assets and non-banking assets acquired in satisfaction of claims are stated at revalued amounts and certain investments and derivative financial instruments have been marked to market and are carried at fair value. In addition, obligations in respect of staff retirement benefits are carried at present value.
STATEMENT OF COMPLIANCE
These unconsolidated condensed interim financial statements have been prepared in accordance with the accounting and reporting standards as applicable in Pakistan for interim financial reporting. The accounting and reporting standards as applicable in Pakistan for interim financial reporting comprise of:
- International Accounting Standard (IAS) 34, Interim Financial Reporting, issued by the International Accounting Standards Board (IASB) as notified under the Companies Act, 2017;
- Islamic Financial Accounting Standards (IFAS) issued by the Institute of Chartered Accountants of Pakistan as are notified under the Companies Act, 2017;
- Provisions of and directives issued under the Banking Companies Ordinance, 1962 and the Companies Act, 2017; and
- Directives issued by the State Bank of Pakistan (SBP) and the Securities and Exchange Commission of Pakistan (SECP).
Whenever the requirements of the Banking Companies Ordinance, 1962, the Companies Act, 2017 or the directives issued by the SBP and the SECP differ with the requirements of IAS 34 or IFAS, the requirements of the Banking Companies Ordinance, 1962, the Companies Act, 2017 and the said directives, shall prevail.
The State Bank of Pakistan has deferred the applicability of International Accounting Standards 40, 'Investment Property' for Banking Companies through BSD Circular No. 10 dated August 26, 2002. The Securities and Exchange Commission of Pakistan (SECP) has deferred applicability of IFRS-7 "Financial Instruments: Disclosures" on banks through S.R.O 411(1) /2008 dated April 28, 2008. Accordingly, the requirements of these standards have not been considered in the preparation of these unconsolidated condensed interim financial statements. However, investments have been classified and valued in accordance with the requirements prescribed by the State Bank of Pakistan through various circulars.
The SECP vide its notification SRO 633 (I)/2014 dated 10 July 2014, adopted IFRS 10 effective from the periods starting from June 30, 2014. However, vide its notification SRO 56 (I)/2016 dated January 28, 2016, it has been notified that the requirements of IFRS 10 and section 228 of the Companies Act, 2017 will not be applicable with respect to the investment in mutual funds established under trust structure.
The disclosures made in these unconsolidated condensed interim financial statements have been limited based on a format prescribed by the SBP vide BPRD Circular Letter No. 05 of 2019 dated March 22, 2019 and IAS 34, Interim Financial Reporting. These unconsolidated condensed interim financial statements do not include all the information and disclosures required in the audited annual financial statements, and should be read in conjunction with the audited annual unconsolidated financial statements for the financial year ended December 31, 2020.
There are certain new standards and interpretations of and amendments to existing accounting standards that have become applicable to the Bank for accounting periods beginning on or after January 1, 2021. These are considered either to not be relevant or not to have any significant impact on the Bank's unconsolidated condensed interim financial statements.
Amendments to approved accounting standards that are effective in the current period

18 19
Notes To The Unconsolidated Condensed Interim Financial Statements (Un-audited) Notes To The Unconsolidated Condensed Interim Financial Statements (Un-audited) For The Half Year Ended June 30, 2021For The Half Year Ended June 30, 2021
10
.IN
VE
ST
ME
NT
S
10
.1In
ves
tme
nts
by
typ
e:
He
ld-f
or-
tra
din
g s
ec
uri
tie
s
Fe
de
ral G
ove
rnm
en
t Se
curitie
s7
2,6
05
,84
6
-
(7,9
49
)
72
,59
7,8
97
1,3
09
,11
6
-
(22
4)
1,3
08
,89
2
Sh
are
s1
25
,34
0
-
(1,3
86
)
12
3,9
54
-
-
-
-
72
,73
1,1
86
-
(9,3
35
)
72
,72
1,8
51
1,3
09
,11
6
-
(22
4)
1,3
08
,89
2
Ava
ilab
le-f
or-
sa
le s
ec
uri
tie
s
Fe
de
ral G
ove
rnm
en
t Se
curitie
s9
42
,55
0,6
33
(5,0
28
)
6,4
65
,06
0
94
9,0
10
,66
5
94
6,6
41
,14
8
(4,7
19
)
9,5
37
,43
3
95
6,1
73
,86
2
Sh
are
s a
nd
un
its2
8,4
79
,45
0
(9,6
09
,35
8)
3,1
90
,22
8
22
,06
0,3
20
26
,58
2,0
88
(10
,11
6,2
83
)
3,1
19
,16
0
19
,58
4,9
65
No
n G
ove
rnm
en
t De
bt S
ecu
ritie
s1
,79
7,8
40
-
14
,88
9
1,8
12
,72
9
1,7
97
,84
0
-
2,2
52
1,8
00
,09
2
Fo
reig
n S
ecu
ritie
s6
,25
5,8
20
(1,7
14
)
(5,7
31
)
6,2
48
,37
5
7,4
63
,93
9
(1,7
14
)
17
,50
9
7,4
79
,73
49
79
,08
3,7
43
(9,6
16
,10
0)
9,6
64
,44
6
97
9,1
32
,08
9
98
2,4
85
,01
5
(1
0,1
22
,71
6)
12
,67
6,3
54
98
5,0
38
,65
3H
eld
-to
-ma
turi
ty s
ec
uri
tie
s
Fe
de
ral G
ove
rnm
en
t Se
curitie
s2
3,9
77
,23
9
(10
,80
1)
-
2
3,9
66
,43
8
4,6
12
,39
0
(1
1,5
42
)
-
4,6
00
,84
8
Pro
vin
cia
l Go
vern
me
nt S
ecu
ritie
s11
8
(11
8)
-
-
118
(11
8)
-
-
No
n G
ove
rnm
en
t De
bt S
ecu
ritie
s6
,66
2,7
63
(47
7,5
41
)
-
6,1
85
,22
2
9,2
70
,31
7
(4
90
,34
1)
-
8,7
79
,97
6
Fo
reig
n S
ecu
ritie
s1
,20
0,0
09
(11
,10
3)
-
1,1
88
,90
6
3,1
49
,64
7
(2
7,2
81
)
-
3,1
22
,36
63
1,8
40
,12
9
(49
9,5
63
)
-
3
1,3
40
,56
6
17
,03
2,4
72
(5
29
,28
2)
-
16
,50
3,1
90
As
so
cia
tes
70
0,4
01
-
-
70
0,4
01
70
0,4
01
-
-
70
0,4
01
Su
bs
idia
rie
s1
2,3
19
,03
7
(72
5)
-
1
2,3
18
,31
2
12
,31
9,0
37
(72
5)
-
12
,31
8,3
12
To
tal
Inve
stm
en
ts
1,0
96
,67
4,4
96
(10
,11
6,3
88
)
9,6
55
,11
1
1,0
96
,21
3,2
19
1,0
13
,84
6,0
41
(10
,65
2,7
23
)
12
,67
6,1
30
1,0
15
,86
9,4
48
10
.1.1
Inve
stm
en
ts g
ive
n a
s c
olla
tera
l
Un
au
dite
d
Jun
e 3
0, 2
02
1
Au
dite
d
De
cem
be
r 3
1, 2
02
0
- M
ark
et
Tre
asu
ry B
ills
14
,02
2,2
19
91
,27
9,2
73
- P
aki
sta
n In
vest
me
nt B
on
ds
45
,76
8,2
92
1,0
00
,28
3
59
,79
0,5
11
92
,27
9,5
56
10
.2P
rovi
sio
n f
or
dim
inu
tio
n in
va
lue
of
inve
stm
en
ts
10
.2.1
Op
en
ing
ba
lan
ce1
0,6
52
,72
3
10
,68
9,1
71
Exc
ha
ng
e a
nd
oth
er
ad
just
me
nts
(7,3
62
)
13
,47
4
Ch
arg
e /
(re
vers
als
)
Ch
arg
e f
or
the
pe
rio
d /
yea
r3
57
,51
4
1,9
56
,36
0
Re
vers
als
fo
r th
e p
eri
od
/ ye
ar
(13
,61
4)
(1,5
29
)
Re
vers
al o
n d
isp
osa
ls(8
72
,87
3)
(2
,00
4,7
53
)
(52
8,9
73
)
(49
,92
2)
Am
ou
nts
writte
n o
ff-
-
Clo
sin
g B
ala
nce
10
,11
6,3
88
10
,65
2,7
23
10
.2.2
Pa
rtic
ula
rs o
f p
rovi
sio
n a
ga
ins
t d
eb
t s
ec
uri
tie
s
Ca
teg
ory
of
cla
ss
ific
ati
on
NP
IP
rovi
sio
nN
PI
Pro
visi
on
Do
me
sti
c
Lo
ss4
77
,65
9
4
77
,65
9
4
90
,45
9
4
90
,45
9
10
.2.3
In a
dd
itio
n to
the
ab
ove
, ove
rse
as
bra
nch
es
ho
ld a
ge
ne
ral p
rovi
sio
n o
f R
s 2
6.9
31
mill
ion
(D
ece
mb
er
31
, 20
20
: Rs
43
.54
2 m
illio
n)
in a
cco
rda
nce
with
the
re
qu
ire
me
nts
of
IFR
S 9
.
10
.3T
he
ma
rke
t va
lue
of
secu
ritie
s cl
ass
ifie
d a
s h
eld
-to
-ma
turity
as
at J
un
e 3
0, 2
02
1 a
mo
un
ted
to R
s. 3
1,3
82
.00
8 m
illio
n (
De
cem
be
r 3
1, 2
02
0: R
s. 1
7,0
02
.90
8 m
illio
n).
----
----
--R
up
ee
s in
'00
0--
----
--
----
----
--R
up
ee
s in
'00
0--
----
--
Un
au
dite
d
J u
ne
30
, 20
21
Au
dite
d D
ece
mb
er
31
, 20
20
----
----
----
----
----
----
----
----
----
----
----
----
----
----
----
----
----
----
----
----
----
----
--R
up
ee
s in
'00
0--
----
----
----
----
----
----
----
----
----
----
----
----
----
----
----
----
----
----
----
----
----
----
Un
au
dite
d
J u
ne
30
, 20
21
Au
dite
d
De
cem
be
r 3
1, 2
02
0
Pro
visi
on
fo
r d
imin
utio
n
Su
rplu
s /
(De
ficit)
C
arr
yin
g V
alu
e
Co
st /
Am
ort
ise
d c
ost
S
urp
lus
/ (D
efic
it)
Ca
rryi
ng
Va
lue
C
ost
/ A
mo
rtis
ed
co
st
Pro
visi
on
fo
r d
imin
utio
n
7. CASH AND BALANCES WITH TREASURY BANKS
In hand
Local currency
Foreign currencies
With State Bank of Pakistan in
Local currency current accounts 57,100,505
47,257,342 Foreign currency current accounts 2,576,648
1,966,635
Foreign currency deposit accounts 9,952,524
10,215,984
69,629,677
59,439,961
With other central banks in
Foreign currency current accounts 3,153,826
11,851,311
With National Bank of Pakistan in
Local currency current accounts 36,673,318
21,673,576
Prize bonds 1,357,598
937,889
142,190,958
122,180,839
8. BALANCES WITH OTHER BANKS
Outside Pakistan
In current accounts 8,425,353
21,798,363
In deposit accounts 5,796,287
2,231,965
14,221,640
24,030,328
9. LENDINGS TO FINANCIAL INSTITUTIONS
Call / clean money lendings 29,220,496
11,002,195
Repurchase agreement lendings (Reverse Repo) 3,273,718 6,137,258
32,494,214 17,139,453
24,436,062
22,094,317
6,940,477
6,183,785
31,376,539 28,278,102
Unaudited June 30, 2021
Audited December 31, 2020
---------Rupees in '000---------

20 21
General provision against consumer loans represents provision maintained against fully secured performing portfolio and unsecured performing portfolio as required by the Prudential Regulations issued by the SBP. General provision against Small Enterprise Finance represents provision maintained at an amount equal to 1% of unsecured performing portfolio as required by the Prudential Regulations issued by the SBP. General provisions pertaining to overseas advances are made in accordance with the requirements of the regulatory authorities of the respective countries in which the overseas branches operate.
In addition, the Bank has also maintained an un-encumbered general provision of Rs 3,064 million (December 31, 2020: Rs 4,564 million) against financing made on prudent basis. This general provision is in addition to the requirements of Prudential Regulations.
11.3.1
11.3.2
State Bank of Pakistan vide BSD Circular No. 2 dated January 27, 2009, BSD Circular No. 10 dated October 20, 2009, BSD Circular No. 02 of 2010 dated June 03, 2010 and BSD Circular No.1 of 2011 dated October 21, 2011 has allowed benefit of forced sale value (FSV) of Plant & Machinery under charge, pledged stock and mortgaged residential, commercial & industrial properties (land and building only) held as collateral against NPLs for five years from the date of classification. However, management has not taken the FSV benefit in calculation of specific provision.
11.3.3
11.3 Particulars of provision against advances
Specific General Total Specific General Total
Opening balance 45,142,956 5,465,459 50,608,415 41,934,421 1,423,921 43,358,342
Exchange adjustments (67,350) (12,963) (80,313) 50,555 7,065 57,620 Charge for the period / year 1,723,824
20,038
1,743,862
5,703,057
4,097,524
9,800,581 Reversals (1,622,620)
(1,507,881)
(3,130,501)
(2,215,829)
(63,051)
(2,278,880)
101,204
(1,487,843)
(1,386,639)
3,487,228
4,034,473
7,521,701
Amounts written off (293,135)
-
(293,135)
(329,248)
-
(329,248)
Closing balance 44,883,675 3,964,653 48,848,328 45,142,956 5,465,459 50,608,415
Unaudited June 30, 2021 Audited December 31, 2020
------------------------------------Rupees in '000-----------------------------------
Note
Unaudited June 30, 2021
Audited December 31,
2020
12. FIXED ASSETS
Capital work-in-progress 12.1 1,158,792
802,966
Property and equipment 50,182,584
50,467,607
Right-of-use assets 6,246,167
6,757,331
57,587,543
58,027,904
12.1 Capital work-in-progress
Civil works 587,652
418,187
Equipment 240,649
98,383
Advances to suppliers 321,691
283,029
Others 8,800
3,367
1,158,792
802,966
UnauditedHalf Year ended
June 30, 2021
Unaudited Half Year
ended June 30, 2020
12.2 Additions to fixed assets
The following additions have been made to fixed assets during the period:
Capital work-in-progress - net additions 355,826
261,664
Property and equipment
Freehold land 35,108
25,327
Building on freehold land 175,672
34,316
Building on leasehold land 14,911
-
Electrical office and computer equipment 389,205
250,685
Furniture and fixture 77,915
99,721
Leasehold Improvements 109,340
107,016
Vehicles 33,642
47,696
Leasehold land -
6,999
835,793
571,760
1,191,619
833,424
12.3 Disposal of fixed assets
The net book value of fixed assets disposed off during the period is as follows:
Vehicles 2,018 6,971
Furniture and fixture 1,005 130
Electrical office and computer equipment 3,030 2,546
Building on freehold land 43,149 -
49,202 9,647
----------Rupees in '000--------
----------Rupees in '000--------
Notes To The Unconsolidated Condensed Interim Financial Statements (Un-audited) Notes To The Unconsolidated Condensed Interim Financial Statements (Un-audited) For The Half Year Ended June 30, 2021For The Half Year Ended June 30, 2021
11.
AD
VA
NC
ES
Loans
, cas
h cr
edi
ts, r
unn
ing
finan
ces,
etc
.44
3,5
00,
989
444,1
68,
998
49,9
99,5
90
50,5
24,7
53
493,5
00,
579
494,6
93,
751
Bill
s di
scoun
ted
and
purc
hase
d 16
,825
,569
18,1
92,1
57
1,06
0,09
6
664,2
94
17,8
85,6
65
18,8
56,4
51
Adva
nces
- g
ross
460,3
26,
558
462,3
61,
155
51,0
59,6
86
51,1
89,0
47
511,
386,
244
513,5
50,
202
Pro
visi
on a
gain
st a
dvanc
es
- S
peci
fic-
-
(44,
883,
675)
(45,
142
,956
)
(44,
883
,675
)
(45,
142
,956
)
- G
ener
al(3
,964,
653
)
(5,4
65,4
59)
-
-
(3,9
64,
653
)
(5,4
65,
459
)
(3,9
64,
653
)
(5,4
65,4
59)
(44,
883,
675)
(45,
142
,956
)
(48,
848
,328
)
(50,
608
,415
)
Adva
nces
- n
et o
f pro
visi
on45
6,3
61,
905
456,8
95,
696
6,17
6,01
1
6,04
6,09
1
462,5
37,
916
462,9
41,
787
Una
udite
d Ju
ne 3
0, 2
021
Audi
ted
Dec
em
ber
31, 2
020
11.
1P
art
icu
lars
of
adva
nce
s (
Gro
ss)
In lo
cal c
urre
ncy
468,2
36,
215
469,2
11,
685
In f
orei
gn c
urre
ncie
s43
,150
,029
44,3
38,5
17
511,
386,
244
513,5
50,
202
11.
2\
Not
e
Non
Per
form
ing
Loans
Pro
visi
onN
on P
erfo
rmin
g Loans
Pro
visi
on
Do
mes
tic
Oth
er
Ass
ets
Esp
ecia
lly M
ent
ione
d11.
2.1
100,3
59
4,04
8
43,5
08
1,98
3
Subs
tand
ard
239,8
64
59,6
22
211,
900
52,1
56
Dou
btfu
l20
5,0
73
102,5
37
264,7
59
132,3
80
Loss
42,2
56,4
79
41,3
58,1
40
42,2
24,4
38
41,4
85,9
49
42,8
01,7
75
41,5
24,3
47
42,7
44,6
05
41,6
72,4
68
Ove
rseas
Not
pas
t due
but
impa
ired
-
-
-
-
Ove
rdue
by:
Upt
o 90
day
s3,
842
961
5,32
1
4,91
3
91 to
180
day
s282
71
2,02
0
505
181 to
365
day
s9,
120
4,56
7
19,9
61
9,98
1
˃ 3
65 d
ays
8,24
4,66
7
3,35
3,72
9
8,41
7,14
0
3,45
5,08
9
8,25
7,91
1
3,35
9,32
8
8,44
4,44
2
3,47
0,48
8
Tota
l51
,059
,686
44,8
83,6
75
51,1
89,0
47
45,1
42,9
56
11.
2.1
----
----
----
----
----
----
----
----
----
----
----
----
----
----
----
----
----
---R
upees
in '0
00-
----
----
----
----
----
----
----
----
----
----
----
----
----
----
----
----
----
--
Perf
orm
ing
Non
Per
form
ing
Tota
l
Audi
ted
Dec
em
ber
31, 2
020
Una
udite
d Ju
ne 3
0, 2
021
Audi
ted
Dec
em
ber
31, 2
020
Unau
dite
d Ju
ne 3
0, 2
021
Audi
ted
Dec
em
ber
31, 2
020
Una
udite
d Ju
ne 3
0, 2
021
----
----
--R
up
ees
in '0
00-
----
---
Adva
nces
incl
ude
Rs.
51,0
59.
686
mill
ion
(202
0: R
s.51
,189
.047
mill
ion)
whi
ch h
ave
been
pla
ced u
nde
r th
e no
n-pe
rfor
min
g s
tatu
s as
deta
iled
belo
w:
Cat
ego
ry o
f C
lassi
fica
tio
n
----
----
----
----
----
----
----
----
----
Ru
pees
in '0
00-
----
----
----
----
----
----
----
----
--
Thi
sre
prese
nts
non-p
erfo
rmin
gpo
rtfo
lioof
agri
cultu
ral,
smal
len
terp
rise
and
Infr
ast
ruct
ure
Pro
ject
Fin
anci
ng
clas
sifie
das
"Oth
er
Ass
ets
Esp
ecia
llyM
entio
ned
"as
per
the
requ
irem
ents
of
resp
ectiv
e P
rude
ntia
l Reg
ulat
ions
issu
ed
by
the
Sta
te B
ank
of P
aki
stan
.
Unau
dite
d Ju
ne 3
0, 2
021
Audi
ted
D e
cem
ber
31,
202
0

2322
Unaudited June 30, 2021
Audited December 31,
2020
16. BILLS PAYABLE
In Pakistan 12,132,845
23,912,803
Outside Pakistan 795,678
67,889
12,928,523
23,980,692
17. BORROWINGS
Secured
Borrowings from State Bank of Pakistan
Under export refinance scheme 32,784,572
34,998,802
Under long term financing facility 22,152,006
22,150,335
Under renewable energy performance platform 1,035,699
74,760
Under payment of Wages & Salaries 8,257,075
10,074,011
Under temporary economic refinance facility 12,356,336
1,694,659
Under refinance facility for combating COVID-19 20,937
-
Under financing facility for storage of agricultural produce 167,162
191,254
76,773,787
69,183,821
Bai Muajjal 44,809,236
-
Repurchase agreement borrowings 14,798,148
92,225,530
Total secured 136,381,171
161,409,351
Unsecured
Borrowings from other financial institution 60,807 1,712,914
Call borrowings 2,318,713 319,669 Overdrawn nostro accounts 671,347
397,313
Others 162,286
162,286
Total unsecured 3,213,153
2,592,182 139,594,324
164,001,533
18. DEPOSITS AND OTHER ACCOUNTS
In Local Currency
In Foreign currencies
TotalIn Local Currency
In Foreign currencies
Total
Customers
Current deposits 467,879,532
65,063,523
532,943,055
397,258,854
53,823,514
451,082,368
Savings deposits 680,019,455
43,486,511
723,505,966
649,410,009
45,805,328
695,215,337
Term deposits 96,304,947
13,119,263
109,424,210
71,492,234
14,103,734
85,595,968
Others 41,279,645
3,015,917
44,295,562
23,319,545
3,218,232
26,537,777
1,285,483,579
124,685,214
1,410,168,793
1,141,480,642
116,950,808
1,258,431,450
Financial Institutions
Current deposits 10,451,795
1,362,091
11,813,886
10,885,621
659,092
11,544,713
Savings deposits 15,411,916
297,177
15,709,093
14,068,212
115,935
14,184,147
Term deposits 959,468 2,358,372 3,317,840 1,030,968 4,090,613 5,121,581
Others - 198,793 198,793 - 220,413 220,413
26,823,179 4,216,433 31,039,612 25,984,801 5,086,053 31,070,854
1,312,306,758 128,901,647 1,441,208,405 1,167,465,443 122,036,861 1,289,502,304
----------Rupees in '000--------
Unaudited June 30, 2021 Audited December 31, 2020
-----------------------------------------------Rupees in '000-----------------------------------------------
Notes To The Unconsolidated Condensed Interim Financial Statements (Un-audited) Notes To The Unconsolidated Condensed Interim Financial Statements (Un-audited) For The Half Year Ended June 30, 2021For The Half Year Ended June 30, 2021
13. INTANGIBLE ASSETS
Computer software
Capital work-in-progress
13.1 Additions to intangible assets
The following additions have been made to intangible assets during the period:
Computer software
Capital work-in-progress - net additions
14. OTHER ASSETS
Income/ Mark-up accrued in local currency
Income/ Mark-up accrued in foreign currencies
Advances, deposits, advance rent and other prepayments
Non-banking assets acquired in satisfaction of claims
Compensation for delayed income tax refunds
Branch adjustment account
Mark to market gain on forward foreign exchange contracts
Unrealized gain on derivative financial instruments
Acceptances
Receivable from the pension fund
Clearing and settlement accounts
Others
Less: Provision held against other assets
Other Assets (net of provision)
Surplus on revaluation of non-banking assets
acquired in satisfaction of claims
Other Assets - total
14.1 Provision held against other assets
Non banking assets acquired in satisfaction of claims
Claims receivable against fraud and forgeries
Others
14.1.1 Movement in provision held against other assets
Opening balance
Charge for the period / year
Reversals
Amounts written off
Exchange and other adjustments
Closing balance
15. CONTINGENT ASSETSThere were no contingent assets of the Bank as at June 30, 2021 (2020: NIL).
Unaudited June 30, 2021
Audited December 31,
2020
552,740 543,815
403,299
394,643
956,039
938,458
UnauditedHalf Year ended June 30, 2021
Unaudited Half Year ended June 30, 2020
169,300
63,258
8,656
14,152 177,956 77,410
NoteUnaudited
June 30, 2021
Audited December 31,
2020
19,614,597
17,085,615 551,277
305,759
1,714,589
2,249,497
2,624,726
3,277,778
133,809
133,809
263,289
276,102
2,225,445
4,854,527
276,993
517,033
20 18,584,386
20,030,754
3,007,326
3,370,179
4,560,383
2,698,271
3,236,229
3,263,384
56,793,049
58,062,708
14.1 2,582,715
2,582,686
54,210,334
55,480,022
22 511,496
854,231
54,721,830
56,334,253
89,745
95,095
493,733
478,773
1,999,237
2,008,818
2,582,715
2,582,686
2,582,686
2,604,137
24,898
54,269
(23,889)
(77,917)
1,009 (23,648)- (16,591)
(980) 18,788
2,582,715 2,582,686
----------Rupees in '000--------
----------Rupees in '000--------
----------Rupees in '000--------

24 25
Statutory reserve represents amount set aside as per the requirements of section 21 of the Banking Companies Ordinance, 1962.21.2
21.1 Under IFRS-3 a bargain purchase represents an economic gain which should be immediately recognized by the acquirer as income. However, the amount of bargain purchase gain was not been taken to the profit and loss account as the SBP, through its letter BPRD(R&PD)/2017/14330 dated June 13, 2017 recommended that the amount of gain may be routed directly into equity as a Non-distributable Capital Reserve (NCR). The NCR may become available for distribution through a stock dividend only with prior approval of the SBP. The Bank, before distribution of the gain as a stock dividend, may adjust any subsequent provisions/deficit, assessed by the Bank or recommended by the Banking Inspection Department of SBP, in the acquired assets and liabilities of NIB Bank Limited against the NCR.
NoteUnaudited
June 30, 2021
Audited December 31,
2020
22. SURPLUS ON REVALUATION OF ASSETS
Surplus / (deficit) on revaluation of
- Available for sale securities 10.1 9,664,446
12,676,354
- Fixed Assets 20,134,456
20,211,952
- Non-banking assets acquired in satisfaction of claims 14 511,496
854,231
30,310,398
33,742,537
Deferred tax on surplus / (deficit) on revaluation of:
- Available for sale securities 19 3,769,134
4,436,721
- Fixed Assets 19 1,403,211
1,286,416
- Non-banking assets acquired in satisfaction of claims 19 199,483
298,982
5,371,828
6,022,119
24,938,570
27,720,418
23. CONTINGENCIES AND COMMITMENTS
-Guarantees 23.1 181,681,521
178,571,960
-Commitments 23.2 505,584,578
507,506,107
-Other contingent liabilities 23.3 28,662,246
27,960,316
715,928,345 714,038,383
23.1 Guarantees:
Financial guarantees 157,215,086
149,925,920
Performance guarantees 22,168,028
25,900,273
Other guarantees 2,298,407
2,745,767
181,681,521
178,571,960
23.2 Commitments:
Documentary credits and short-term trade-related transactions
- letters of credit 193,920,928
172,617,563
Commitments in respect of:
- forward foreign exchange contracts 23.2.1 191,771,547
318,420,575
- forward government securities transactions 23.2.2 114,002,109
11,089,775
- derivatives 23.2.3 4,970,119
4,471,383
Commitments for acquisition of:
- operating fixed assets 765,647
710,570
- intangible assets 154,228
196,241
505,584,578
507,506,107
23.2.1 Commitments in respect of forward foreign exchange contracts
Purchase 107,347,223
168,432,858
Sale 84,424,324
149,987,717
191,771,547
318,420,575
23.2.2 Commitments in respect of forward government securities transactions
Purchase 112,502,109
11,089,775
Sale 1,500,000
-
114,002,109
11,089,775
23.2.3 Commitments in respect of derivatives
FX options
Purchase 1,356,125 182,800
Sale 1,356,125 182,800
2,712,250 365,600Cross Currency Swaps
Purchase 1,090,187 1,975,311
Sale 1,167,682 2,130,472
2,257,869 4,105,783
4,970,119 4,471,383
----------Rupees in '000--------
Notes To The Unconsolidated Condensed Interim Financial Statements (Un-audited) Notes To The Unconsolidated Condensed Interim Financial Statements (Un-audited) For The Half Year Ended June 30, 2021For The Half Year Ended June 30, 2021
NoteUnaudited
June 30, 2021
Audited December 31,
2020
19. DEFERRED TAX LIABILITIES
Deductible Temporary Differences on
- Provision against advances (2,256,969)
(2,782,530)
(2,256,969)
(2,782,530)
Taxable Temporary Differences on
- Surplus on revaluation of fixed assets 1,403,211
1,286,416
- Surplus/deficit on revaluation of investments 3,769,134
4,436,721
- Surplus on revaluation of non-banking assets 199,483
298,982
- Accelerated tax depreciation 1,996,222
1,850,789
- Receivable from pension fund 1,172,856
1,179,562
- Business combination 705,218
705,218
9,246,124
9,757,688
6,989,155
6,975,158
20. OTHER LIABILITIES
Mark-up/ return/ interest payable in local currency 3,433,914
2,272,650
Mark-up/ return/ interest payable in foreign currencies 130,090
247,926
Unearned commission income 653,083
212,337
Accrued expenses 4,960,096
5,898,224
Current taxation (provisions less payments) 11,373,995
10,185,375
Workers' welfare fund 20.1 9,338,947
8,838,684
Acceptances 14 18,584,386 20,030,754
Unclaimed / dividends payable 1,916,410 1,692,942
Mark to market loss on forward foreign exchange contracts 1,860,373 4,485,302
Unrealised loss on derivative financial instruments 273,411 513,343
Staff welfare fund 3,722 5,598 Provision for employees' compensated absences 1,145,701 919,407 Provision for post retirement medical benefits 2,156,504 2,004,122 Provision for employees' contributory benevolent scheme 219,007 222,084 Retention money 12,473 20,657 Insurance payable against consumer assets 665,370
698,949
Unclaimed balances 756,294
877,552
Duties and taxes payable 1,809,238
1,846,580
Provision against off-balance sheet obligations 46,210
46,189
Security deposits against lease 665,500
569,756 Lease liability against right of use assets 7,779,310
8,035,048
Clearing and settlement accounts 7,198,163
7,421,975 Others 6,602,469
5,855,374
81,584,666
82,900,828
20.1
NoteUnaudited
June 30, 2021
Audited December 31,
2020
21. RESERVES
Share premium 23,751,114
23,751,114
Non- distributable capital reserve - gain on bargain purchase option 21.1 908,317
908,317
Exchange translation reserve 2,450,502
2,876,483
Statutory reserve 21.2 36,034,688
34,560,421
General reserve 18,600,000 18,600,00081,744,621 80,696,335
----------Rupees in '000--------
Supreme Court of Pakistan vide its order dated November 10, 2016 has held that the amendments made in the lawintroduced by the Federal Government for the levy of Workers Welfare Fund were not lawful. The Federal Board of Revenuehas filed review petitions against this order which are currently pending.
Legal advice obtained on the matter indicates that consequent to filing of these review petitions the judgment may notcurrently be treated as conclusive. Accordingly, the Bank maintained its provision in respect of WWF.
----------Rupees in '000--------

26 27
(80,125)
(67,047)
(266,359)
(80,125)
Note
UnauditedHalf Year ended June 30, 2021
Unaudited Half Year ended June 30, 2020
----------Rupees in '000--------27. FEE & COMMISSION INCOME
Branch banking customer fees 1,351,456
941,135
Consumer finance related fees 251,823
187,430
Card related fees (debit and credit cards) 1,376,263
1,511,464
Credit related fees 115,877
26,381
Investment banking fee 97,430
71,482
Commission on trade 676,115
633,111
Commission on guarantees 321,196
295,762
Commission on cash management 335,391 286,992
Commission on remittances including home remittances 473,537 514,359 Commission on bancassurance 760,832 474,901 Rent on lockers 116,347
102,233
Commission on utility bills 37,679
36,734
Commission on investments services 19,782
17,503
Others 77,428
46,121
6,011,156
5,145,608
28. GAIN / (LOSS) ON SECURITIES
Realised 28.1 493,880
Unrealised - Held For Trading 10.1 (9,335)
13,078
484,545
28.1 Realised gain / (loss) on:Federal Government Securities 345,791
183,380
Shares 147,850
Others 239
2,854
493,880
29. OTHER INCOME
Rent on property 66,634
30,678
Gain on termination of lease liability against right of use assets 44,175
-
(Loss) / Gain on sale of fixed assets - net (26,956)
18,950
Gain on sale of non-banking assets acquired in satisfaction of claims - net 536,464 -
620,317 49,628
UnauditedHalf Year ended June 30, 2021
Unaudited Half Year ended June 30, 2020
30. OPERATING EXPENSES
Total compensation expense 8,610,124
7,936,780
Property expense
Rent and taxes 104,564
82,632
Insurance 10,650
11,507
Utilities cost 560,810
507,439
Security (including guards) 682,774
621,515
Repair and maintenance (including janitorial charges) 320,324
310,135
Depreciation on right-of-use assets 609,702
600,945
Depreciation 360,618
304,520
Fuel expense generators 185,700
156,053
2,835,142
2,594,746
Information technology expenses
Software maintenance 524,443
600,676
Hardware maintenance 83,773
116,075
Depreciation 287,333 262,974
Amortization 158,332 155,492
Network charges 285,351 301,910
Insurance 1,729 1,876
1,340,961 1,439,003
----------Rupees in '000--------
Notes To The Unconsolidated Condensed Interim Financial Statements (Un-audited) Notes To The Unconsolidated Condensed Interim Financial Statements (Un-audited) For The Half Year Ended June 30, 2021For The Half Year Ended June 30, 2021
23.2.4
23.3.1
23.4 Taxation
The Bank makes commitments to extend credit in the normal course of its business but these being revocable commitments do not attract any significant penalty or expense if the facility is unilaterally withdrawn.
These mainly represent counter claims by borrowers for damages and other claims relating to banking transactions. Based on legal advice and / or internal assessments, management is confident that the matters will be decided in the Bank’s favour and the possibility of any adverse outcome is remote. Accordingly, no provision has been made in these unconsolidated condensed interim financial statements.
For assessment year 1999-2000 through tax year 2020, the tax department disputed Bank's treatment on certain issues, where the Bank's appeals are pending at various appellate forums, entailing an additional tax liability of Rs. 2,400 million (2020: Rs. 6,033 million). Such issues inter alia principally include disallowance of expenses for non deduction of withholding tax and non availability of underlying records, provision for non performing loans, attribution of expenses to heads of income other than income from business and disallowance of credit for taxes paid in advance / deducted at source.
The Bank has filed appeals which are pending at various appellate forums. In addition, certain decisions made in favour of the Bank are being contested by the department at higher forums. No provision has been made in these unconsolidated condensed interim financial statements regarding the aforesaid additional tax demand and already issued favourable decisions where the department is in appeal, as the management is of the view that the issues will be decided in the Bank's favour as and when these are taken up by the Appellate Authorities.
NoteUnaudited June 30,
2021
Audited December 31,
2020
23.3 Other contingent liabilities
Claims against the Bank not acknowledged as debts 23.3.1 28,662,249 27,960,316
----------Rupees in '000--------
Issue of goodwill and other related assets amortization for few years has been assessed in Bank’s favour at appellate forums during the year, however, the tax department has filed appeal against these decisions. The management has not recorded any tax benefit because the issue has not attained finality.
23.5 Amortisation of goodwill and other intangibles amounting to Rs 28.08 billion of Ex. NIB
24. DERIVATIVE INSTRUMENTS
Notional Notional Notional
Principal Principal Principal
Total
Hedging 1,090,187 268,785 - - 1,356,125 8,208Market Making 1,167,682
(265,203)
-
-
1,356,125
(8,208)
Total
Hedging 1,975,311 512,508 - - 182,800 4,525Market Making 2,130,472 (508,818) - - 182,800 (4,525)
-------------------------------------------Rupees in '000-------------------------------------------
Audited December 31, 2020
-------------------------------------------Rupees in '000-------------------------------------------
Unaudited June 30, 2021
Interest Rate Swaps FX Options Cross Currency Swaps
Mark to market gain / loss
Mark to market gain / loss
Mark to market gain / loss
UnauditedHalf Year ended June 30, 2021
Unaudited Half Year ended June 30, 2020
----------Rupees in '000--------
25. MARK-UP/RETURN/INTEREST EARNEDLoans and advances 15,721,650
25,962,430
Investments 42,240,046 48,366,469 Lendings to financial institutions 199,429 736,991 Balances with banks 39,970 145,740
58,201,095
75,211,630
26. MARK-UP/RETURN/INTEREST EXPENSED
Deposits 21,399,893
33,820,985
Borrowings 3,987,814
3,572,092
Cost of foreign currency swaps against -
foreign currency deposits / borrowings 735,796
1,200,521
Finance charges on lease liability against right-of-use assets 528,558 605,176
26,652,061 39,198,774

28 29
35. FAIR VALUE MEASUREMENTS
35.1
Level 1:
Level 2:
Level 3:
(a) Financial instruments in level 1
(b) Financial instruments in level 2
(c) Financial instruments in level 3
The fair value of traded investments is based on quoted market prices, except for tradable securities classified by the Bank as 'held to maturity'. Quoted securities classified as held to maturity are carried at amortised cost. Fair value of unquoted equity investments other than investments in associates and subsidiaries is determined on the basis of break up value of these investments as per the latest available financial statements.
Fair value measurements using inputs other than quoted prices included within Level 1 that are observable for the assets or liability, either directly (i.e. as prices) or indirectly (i.e. derived from prices).
Fair value measurements using input for the asset or liability that are not based on observable market data (i.e. unobservable inputs).
Fair value measurements using quoted prices (unadjusted) in active markets for identical assets or liabilities.
Foreign exchange contracts
Derivatives
Operating fixed assets and
Non-banking assets
acquired in satisfaction of
claims
Term Finance and Bonds
Item
The fair values of Federal Government securities are determined using the PKRV rates.
Valuation approach and input used
Federal Governmentsecurities
Investments in debt securities (comprising term finance certificates, bonds and any other security issued by a company or a body corporate for the purpose of raising funds in the form of redeemable capital) are valued on the basis of the rates announced by the Mutual Funds Association of Pakistan (MUFAP) in accordance with the methodology prescribed by the Securities and Exchange Commission of Pakistan.
The valuation has been determined by interpolating the mid rates announced by the State Bank of Pakistan.
The fair values of derivatives which are not quoted in active markets are determined by using valuation techniques. The valuation techniques take into account the relevant underlying parameters including foreign currency involved, interest rates, yield curves, volatilities, contracts duration etc.
Land, buildings and non-banking assets acquired in satisfaction of claims are revalued on a periodic basis using professional valuers. The valuation is based on their assessment of the market value of the assets. The effect of changes in the unobservable inputs used in the valuations cannot be determined with certainty. Accordingly, a qualitative disclosure of sensitivity has not been presented in these unconsolidated financial statements.
The Bank's policy is to recognise transfers into and out of the different fair value hierarchy levels at the date the event or change in circumstances that caused the transfer occurred. There were no transfers between levels 1 and 2 during the period.
Financial instruments included in level 1 comprise of investments in listed ordinary shares and units of mutual funds.
Financial instruments included in level 2 comprise of Sukuk Bonds, Pakistan Investment Bonds, Market Treasury Bills, Term Finance certificates, FX options, Cross Currency Swaps, Interest Rate Swaps and Forward Exchange Contracts.
Currently, no financial instruments are classified in level 3.
Fair value of fixed term loans, other assets, other liabilities, fixed term deposits and borrowings cannot be calculated with sufficient reliability due to absence of current and active market for such assets and liabilities and reliable data regarding market rates for similar instruments.
In the opinion of the management, the fair value of the financial assets and financial liabilities are not significantly different from their carrying values since assets and liabilities are either short-term in nature or re-priced over short term.
Fair value of financial assets
The Bank measures fair values using the following fair value hierarchy that reflects the significance of the inputs used in making the measurements:
Valuation techniques used in determination of fair valuation of financial instruments within level 2
Notes To The Unconsolidated Condensed Interim Financial Statements (Un-audited) Notes To The Unconsolidated Condensed Interim Financial Statements (Un-audited) For The Half Year Ended June 30, 2021For The Half Year Ended June 30, 2021
Other operating expenses
Directors' fees and allowances 19,620
21,956
Legal and professional charges 146,090
145,138
Outsourced services costs 346,516
340,925
Travelling and conveyance 112,280
119,966
NIFT clearing charges 76,383
82,632
Depreciation 406,778
412,555
Depreciation on non-banking assets acquired in satisfaction of claims 18,721
15,675
Training and development 10,267
13,749
Postage and courier charges 107,787
136,650
Communication 169,549
164,080
Stationery and printing 284,988 270,983
Marketing, advertisement & publicity 291,099 330,612
Donations 6,600 112,596 Auditors' remuneration 33,488 16,298 Cash transportation charges 413,523 338,437 Repair and maintenance 220,133
165,097
Subscription 7,996
10,154
Entertainment 93,799
83,638 Remittance charges 95,691
95,524
Brokerage expenses 18,037
17,229
Card related expenses 475,423
419,694
CNIC verification charges 106,385
53,129
Insurance 836,767
743,134
Others 111,460
112,184
4,409,380 4,222,035
17,195,607 16,192,564
UnauditedHalf Year ended June 30, 2021
Unaudited Half Year ended June 30, 2020
----------Rupees in '000--------
Note
31. OTHER CHARGES
Penalties of State Bank of Pakistan
VAT & National Building tax & Crop Insurance Levy
32. PROVISIONS / (REVERSALS) & WRITE OFFS - NET
Provision / (reversal) against balance with Banks
(Reversal) / provision for diminution in value of investments 10.2.1
(Reversal) / provision against loans and advances 11.3
Provision / (reversal) against other assets 14.1.1
Recovery of written off / charged off bad debts
33. TAXATION
Current
Deferred
34. BASIC AND DILUTED EARNINGS PER SHARE
Profit after tax
Weighted average number of ordinary shares
Basic and diluted earnings per share
314,286
183,541
25,014
56,579
339,300
240,120
121
(1,813)
(528,973)
190,967
(1,386,639)
3,856,662
1,009 (17,877)
(86,200) (64,442) (2,000,682) 3,963,497
9,429,146
10,576,822 841,333
(1,531,886)
10,270,479
9,044,936
14,742,672
13,209,424
1,185,060,006
1,185,060,006
12.44 11.15
----------Rupees in '000--------
----------Number--------
----------Rupees-------

30 31
Notes To The Unconsolidated Condensed Interim Financial Statements (Un-audited) Notes To The Unconsolidated Condensed Interim Financial Statements (Un-audited) For The Half Year Ended June 30, 2021For The Half Year Ended June 30, 2021
36 SEGMENT INFORMATION
36.1 Segment details with respect to business activities
The segment analysis with respect to business activity is as follows:
Retail BankingConsumer
banking
Corporate
BankingTreasury
International
BankingOthers Sub-total Eliminations Total
Profit & Loss
Net mark-up/return/profit (17,518,820)
1,292,992
9,488,524
37,676,979
609,359
-
31,549,034
-
31,549,034
Inter segment revenue - net 36,173,493
(265,883)
(7,312,833)
(32,255,351)
(58,971)
3,719,545
-
-
-
Non mark-up / return / interest income 3,280,854
1,227,386
1,680,845
2,192,578
423,629
693,313
9,498,605
-
9,498,605
Total Income 21,935,527
2,254,495
3,856,536
7,614,206
974,017
4,412,858
41,047,639
-
41,047,639
Segment direct expenses 11,733,247
841,928
331,985
216,929
580,590
4,330,491
18,035,170
-
18,035,170
Inter segment expense allocation -
-
-
-
-
-
-
-
-
Total expenses 11,733,247
841,928
331,985
216,929
580,590
4,330,491
18,035,170
-
18,035,170
Provisions 1,243,978
42,413
(83,724)
(506,925)
90,918
(2,787,342)
(2,000,682)
-
(2,000,682)
Profit before tax 8,958,302
1,370,154
3,608,275
7,904,202
302,509
2,869,709
25,013,151
-
25,013,151
Balance Sheet
Cash & Bank balances 66,642,041
331,057
202,138
66,905,744
18,188,087
4,143,531
156,412,598
-
156,412,598
Investments -
-
7,996,236
1,075,901,706
12,315,277
-
1,096,213,219
-
1,096,213,219
Net inter segment lending 1,176,501,277
-
-
- -
193,326,604
1,369,827,881
(1,369,827,881)
-
Lendings to financial institutions -
-
-
3,373,718
29,120,496
-
32,494,214
-
32,494,214
Advances - performing 88,921,889
30,960,301
318,829,658
-
17,650,057
-
456,361,905
-
456,361,905
- non performing 292,668
103,700
2,382
-
4,898,583
878,678
6,176,011
-
6,176,011
Others 35,636,437
1,913,413
21,112,149
14,820,161
3,514,123
36,269,129
113,265,412
-
113,265,412
Total Assets 1,367,994,312
33,308,471
348,142,563
1,161,001,329
85,686,623
234,617,942
3,230,751,240
(1,369,827,881)
1,860,923,359
Borrowings 64,484,923
-
12,163,954
60,173,923
2,771,524
-
139,594,324
-
139,594,324
Deposits & other accounts 1,285,296,396
21,494,863
70,798,768
-
63,607,522
10,856
1,441,208,405
-
1,441,208,405
Net inter segment borrowing -
- - - - -
7,757,087
248,314,174
1,100,008,505
13,748,115
-
1,369,827,881
(1,369,827,881)
-
Others 18,212,993
4,056,521
16,865,667
818,901
5,559,462
55,988,800
101,502,344
-
101,502,344
Total liabilities 1,367,994,312
33,308,471
348,142,563
1,161,001,329
85,686,623
55,999,656
3,052,132,954
(1,369,827,881)
1,682,305,073
Equity 178,618,286
178,618,286
-
178,618,286
Total Equity & liabilities 1,367,994,312 33,308,471 348,142,563 1,161,001,329 85,686,623 234,617,942 3,230,751,240 (1,369,827,881) 1,860,923,359
Contingencies & Commitments 61,877,293 - 310,113,602 308,422,611 5,702,184 29,812,655 715,928,345 - 715,928,345
Retail BankingConsumer
banking
Corporate
BankingTreasury
International
BankingOthers Sub-total Eliminations Total
Profit & Loss
Net mark-up/return/profit (27,559,261)
1,413,318
17,388,362
44,012,291
758,146
-
36,012,856
-
36,012,856
Inter segment revenue - net 51,405,696
(341,750)
(14,511,898)
(40,745,318)
(40,431)
4,233,701
-
-
-
Non mark-up / return / interest income 3,001,626
839,091
1,560,124
1,081,216
389,622
211,093
7,082,772
-
7,082,772
Total Income 26,848,061
1,910,659
4,436,588
4,348,189
1,107,337
4,444,794
43,095,628
-
43,095,628
Segment direct expenses 10,709,498
734,317
291,724
205,675
658,988
4,277,569
16,877,771
-
16,877,771
Inter segment expense allocation -
-
-
-
-
-
-
-
-
Total expenses 10,709,498
734,317
291,724
205,675
658,988
4,277,569
16,877,771
-
16,877,771
Provisions 60,375
80,643
132,357
116,820
69,294
3,504,008
3,963,497
-
3,963,497
Profit before tax 16,078,188
1,095,699
4,012,507
4,025,694
379,055
(3,336,783)
22,254,360
-
22,254,360
Balance Sheet
Cash & Bank balances 58,362,119
317,242
394,030
64,577,425
21,166,578
1,393,773
146,211,167
-
146,211,167
Investments -
-
10,578,310
990,720,067
14,571,071
-
1,015,869,448
-
1,015,869,448
Net inter segment lending 1,050,376,236
-
-
-
-
201,834,399
1,252,210,635
(1,252,210,635)
-
Lendings to financial institutions -
-
-
6,137,258
11,002,195
-
17,139,453
-
17,139,453Advances - performing 94,735,206
26,845,772
313,633,477
-
21,681,241
-
456,895,696
-
456,895,696- non performing 171,804
177,613
2,382
-
4,973,954
720,338
6,046,091
-
6,046,091
Others 35,621,546
2,370,726
22,789,948
12,206,991
4,580,374
37,731,030
115,300,615
-
115,300,615
Total Assets 1,239,266,911
29,711,353
347,398,147
1,073,641,741
77,975,413
241,679,540
3,009,673,105
(1,252,210,635)
1,757,462,470
Borrowings 58,910,004
-
10,372,566
91,069,170
3,649,793
-
164,001,533
-
164,001,533
Deposits & other accounts 1,147,268,725
21,263,015
65,961,390
-
55,009,174
-
1,289,502,304
-
1,289,502,304
Net inter segment borrowing -
4,816,853
252,358,835
981,733,802
13,301,145
-
1,252,210,635
(1,252,210,635)
-
Others 33,088,182
3,631,485
18,705,356
838,769
6,015,301
51,577,585
113,856,678
-
113,856,678
Total liabilities 1,239,266,911
29,711,353
347,398,147
1,073,641,741
77,975,413
51,577,585
2,819,571,150
(1,252,210,635)
1,567,360,515
Equity -
-
-
-
-
190,101,955
190,101,955
-
190,101,955
Total Equity & liabilities 1,239,266,911 29,711,353 347,398,147 1,073,641,741 77,975,413 241,679,540 3,009,673,105 (1,252,210,635) 1,757,462,470
Contingencies & Commitments 55,974,597 - 288,001,956 320,068,131 20,930,195 29,063,504 714,038,383 - 714,038,383
36.2
Audited December 31, 2020
Transactions between reportable segments are based on an appropriate transfer pricing mechanism using agreed rates. Furthermore, segment assets and liabilities include intersegment balances. Costs which are not allocated to segments are included in the Head office. Income taxes are managed at bank level and are not allocated to operating segments.
Un audited
Half Year ended June 30, 2021
Un audited
Half Year ended June 30, 2020
----------------------------------------------------------------------Ru pees in '000----------------------------------------------------------------------
----------------------------------------------------------------------Ru pees in '000----------------------------------------------------------------------
The table below analyses the financial and non-financial assets carried at fair values, by valuation methods. For financial assets, the Bank essentially carries its investments in debt and equity securities at fair values. Valuation of investments is carried out as per guidelines specified by the SBP. In case of non-financial assets, the Bank has adopted revaluation model (as per IAS 16) in respect of land and building.
Unaudited June 30, 2021
Carrying / Notional Value
Level 1 Level 2 Level 3Total
On balance sheet financial instruments
Financial assets - measured at fair value
Investments
Federal Government Securities 1,021,608,562
-
1,021,608,562
-
1,021,608,562
Shares 20,719,752
20,719,752
-
-
20,719,752
Non-Government Debt Securities 1,812,729
1,812,729
-
1,812,729
Foreign Securities 6,248,375
-
6,248,375
-
6,248,375
Financial assets - disclosed but not measuredat fair value
45,823,801
-
-
-
-
Cash and balances with treasury banks 142,190,958
-
-
-
-
Balances with other banks 14,221,640
-
-
-
-
Lendings to financial institutions 32,494,214
-
-
-
-
Advances 462,537,916
-
-
-
-
Other assets 49,049,310
-
-
-
-
Non - Financial Assets measured at fair value
Operating fixed assets (land and buildings) 44,172,826
-
44,172,826
-
44,172,826
Non-banking assets 3,046,477
-
3,046,477
-
3,046,477
Off-balance sheet financial instruments - measured
at fair value
Forward purchase of foreign exchange 107,347,223
-
990,932
-
990,932
Forward sale of foreign exchange 84,424,324
-
1,356,004
-
1,356,004
Derivatives purchase 2,446,312 - 276,993 - 276,993
Derivatives sale 2,523,807 - 273,411 - 273,411
Audited December 31, 2020
Carrying / Notional Value
Level 1 Level 2 Level 3Total
On balance sheet financial instruments
Financial assets - measured at fair value Investments
Federal Government Securities 957,482,754
-
957,482,754
-
957,482,754
Shares 18,171,840
18,171,840
-
-
18,171,840
Non-Government Debt Securities 1,800,092
-
1,800,092
-
1,800,092
Foreign Securities 7,474,188
-
7,474,188
-
7,474,188
Financial assets - disclosed but not measuredat fair value
-
30,940,574
-
-
-
-
Cash and balances with treasury banks 122,180,839
-
-
-
-
Balances with other banks 24,030,328
-
-
-
-
Lendings to financial institutions 17,139,453
-
-
-
-
Advances 462,941,787
-
-
-
-
Other assets 46,267,752
-
-
-
-
Non - Financial Assets measured at fair value
Operating fixed assets (land and buildings) 44,275,487
-
44,275,487
-
44,275,487
Non-banking assets 4,036,914
-
4,036,914
-
4,036,914
-
Off-balance sheet financial instruments - measuredat fair value
Forward purchase of foreign exchange 168,432,858 - 3,902,198 - 3,902,198
Forward sale of foreign exchange 149,987,717 - 4,271,423 - 4,271,423
Derivatives purchase 2,158,111 - 517,033 - 517,033
Derivatives sale 2,313,272 - 513,343 - 513,343
------------------------------------------Rupees in '000--------------------------------------
Investments (HTM, AFS, unlisted ordinary shares, subsidiaries and associates)
Investments (HTM, AFS, unlisted ordinary shares, subsidiaries and associates)
------------------------------------------Rupees in '000--------------------------------------

32 33
Notes To The Unconsolidated Condensed Interim Financial Statements (Un-audited) Notes To The Unconsolidated Condensed Interim Financial Statements (Un-audited) For The Half Year Ended June 30, 2021For The Half Year Ended June 30, 2021
Dire
ctor
s K
ey
Man
agem
ent
Pers
onne
l S
ubsi
diar
ies
Ass
ocia
tes
Oth
er R
elat
ed
Parti
es
Dire
ctor
s K
ey
Man
agem
ent
Pers
onne
l S
ubsi
diar
ies
Ass
ocia
tes
Oth
er R
elat
ed
Parti
es
Oth
er A
sset
s
Mar
kup
rece
ivab
le-
2,
430
2,22
7
69
3
1,63
7
-
3,
149
2,33
889
52,
382
Adva
nces
, dep
osits
, adv
ance
rent
and
oth
er p
repa
ymen
ts-
-
9,97
7
18
4,94
1
28
,987
-
-
12,7
1531
0,50
427
,835
Rec
eiva
ble
from
Pen
sion
Fun
d-
-
-
-
3,00
7,32
6
-
-
--
3,37
0,17
9
Unr
ealiz
ed (l
oss)
/ gai
n on
forw
ard
fore
ign
exch
ange
con
tract
s -
outs
tand
ing
-
-
(196
)
-
-
-
-
39,4
15-
-
Prov
isio
n he
ld a
gain
st o
ther
ass
ets
-
-
-
-
-
-
-
--
-
Bor
row
ings
Ope
ning
bal
ance
-
-
25,3
56
-
77,1
39
-
-
3,90
2-
69,1
66
Borro
wing
s / e
xcha
nge
adju
stm
ent d
urin
g th
e pe
riod
/ yea
r-
-
278,
697
-
13,6
77
-
-
482,
356
-7,
973
Settl
ed d
urin
g th
e pe
riod
/ yea
r-
-
(279
,231
)
-
-
-
-
(460
,902
)-
-
Clo
sing
bal
ance
-
-
24,8
22
-
90,8
16
-
-
25,3
56-
77,1
39
Dep
osits
and
oth
er a
ccou
nts
Ope
ning
bal
ance
302,
130
138,
566
53,8
78
4,81
5,78
0
4,86
9,94
1
602,
381
140,
761
54,4
823,
657,
552
4,17
9,84
9
Rec
eive
d du
ring
the
perio
d / y
ear
2,29
6,86
2
756,
353
1,53
6,35
4
26,5
19,4
01
58,6
04,3
96
669,
282
1,18
9,43
7
2,34
9,11
144
,628
,206
76,3
75,9
87
With
draw
n du
ring
the
perio
d / y
ear
(2,1
21,1
48)
(720
,088
)
(1,5
29,5
81)
(27,
291,
714)
(50,
146,
921)
(969
,533
)
(1,1
63,8
32)
(2,3
46,8
30)
(43,
469,
978)
(75,
154,
115)
Tran
sfer
in /
(out
) - n
et-
(701
)
-
-
27
-
(27,
800)
(2,8
85)
-(5
31,7
80)
Clo
sing
bal
ance
477,
844
174,
130
60,6
51
4,04
3,46
7
13,3
27,4
43
302,
130
138,
566
53,8
784,
815,
780
4,86
9,94
1
Oth
er L
iabi
litie
s
Mar
kup
paya
ble
112
690
1
5,52
1
3,03
1
50
100
-42
,549
10,6
54
Accr
ued
expe
nses
and
oth
er p
ayab
le-
-
29,2
49
61,0
46
20
-
-
22,8
5062
,624
32
Paya
ble
to M
CB
Empl
oyee
Sec
urity
Ser
vice
s-
-
-
-
29,4
05
-
-
--
27,0
31
Adva
nce
rece
ived
aga
inst
sal
e of
pro
perty
-
-
20,0
00
-
-
-
-
20,0
00-
-
Con
tinge
ncie
s an
d C
omm
itmen
ts
Lette
r of C
redi
t-
-
-
-
3,66
0,28
9
-
-
--
1,36
1,77
6
Forw
ard
fore
ign
exch
ange
con
tract
s (N
otio
nal)
-
-
223,
772
-
-
-
-
1,34
2,10
6-
-
Bank
gua
rant
ee-
-
86,2
00
10,3
90
494,
360
-
-
102,
038
10,5
1239
4,49
5
Una
udite
d Ju
ne 3
0, 2
021
Audi
ted
Dec
embe
r 31,
202
0
------
------
------
------
------
------
------
------
------
------
------
------
------
------
------
------
(Ru
pees
in '0
00)--
------
------
------
------
------
------
------
------
------
------
------
------
------
------
------
----
37RE
LATE
D PA
RTY
TRAN
SACT
IONS
Dire
ctor
s K
ey
Man
agem
ent
Pers
onne
l S
ubsid
iarie
s A
ssoc
iate
s O
ther
Rel
ated
Pa
rties
Di
rect
ors
Key
M
anag
emen
t Pe
rson
nel
Sub
sidia
ries
Ass
ocia
tes
Oth
er R
elat
ed
Parti
es
Lend
ings
to F
inan
cial
Inst
itutio
ns
Ope
ning
bala
nce
-
-
-
-
-
-
-
880,
853
--
Addit
ion
durin
g th
e pe
riod
/ yea
r-
-
23,9
00,0
00
-
-
-
-
23,7
03,9
28
--
Repa
id du
ring
the
perio
d / y
ear
-
-
(23,
900,
000)
-
-
-
-
(24,
584,
781)
--
Clos
ing b
alan
ce-
-
-
-
-
-
-
-
--
Inve
stm
ents
Ope
ning
bala
nce
-
-
12,3
19,0
37
700,
401
254,
253
-
-
12,3
46,5
37
700,
401
254,
253
Inve
stm
ent m
ade
durin
g th
e pe
riod
/ yea
r-
-
-
-
-
-
-
-
--
Inve
stm
ent d
ispos
ed o
ff du
ring
the
perio
d / y
ear
-
-
-
-
-
-
-
(27,
500)
--
Adjus
tmen
t und
er a
mal
gam
ation
sch
eme
-
-
-
-
-
-
-
-
--
Clos
ing b
alan
ce-
-
12,3
19,0
37
700,
401
254,
253
-
-
12,3
19,0
37
700,
401
254,
253
Prov
isio
n fo
r dim
inut
ion
in v
alue
of i
nves
tmen
ts-
-
725
-
5,00
0
-
-
725
-5,
000
Adva
nces
Ope
ning
bala
nce
1,04
2
166,
757
856,
704
356,
898
152,
147
1,72
2
129,
048
889,
811
-33
9,52
0
Addit
ion
/ exc
hang
e ad
justm
ent d
uring
the
perio
d / y
ear
7,25
0
26,7
14
45,4
19
-
305,
457
18,2
02
60,2
57
-
356,
898
336,
695
Repa
id / e
xcha
nge
adjus
tmen
t dur
ing th
e pe
riod
/ yea
r(7
,103
)
(38,
144)
-
(89,
225)
(417
,191
)
(18,
882)
(21,
947)
(33,
107)
-(3
03,1
83)
Tran
sfer
in /
(out
)-
(24,
462)
--
--
(601
)-
-(2
20,8
85)
Clos
ing b
alan
ce1,
189
130,
865
902,
123
267,
673
40,4
131,
042
166,
757
856,
704
356,
898
152,
147
Prov
ision
held
aga
inst a
dvan
ces
--
--
--
--
--
------
------
------
------
------
------
------
------
------
------
------
------
------
------
------
------
(Ru
pees
in '0
00)--
------
------
------
------
------
------
------
------
------
------
------
------
------
------
------
----
The
Ban
k ha
s re
late
d pa
rty re
latio
nship
with
its
subs
idiar
ies, a
ssoc
iate
s, e
mpl
oyee
ben
efit
plan
s, it
s di
rect
ors
and
key m
anag
emen
t per
sonn
el a
nd th
eir c
lose
fam
ily m
embe
rs.
The
Bank
sen
ters
into
trans
actio
nswi
thre
lated
parti
esin
the
ordin
aryc
ours
eof
busin
ess
and
onsu
bsta
ntia
llyth
esa
me
term
sas
forc
ompa
rabl
etra
nsac
tions
with
pers
onof
simila
rsta
nding
.Con
tribu
tions
toan
dac
crua
lsin
resp
ecto
fsta
ffre
tirem
entb
enef
itsan
d ot
her b
enef
it pla
ns a
re m
ade
in ac
cord
ance
with
the
actu
aria
l val
uatio
ns /
term
s of
the
cont
ribut
ion
plan.
Rem
uner
atio
n to
the
exec
utive
s / o
ffice
rs is
det
erm
ined
in ac
cord
ance
with
the
term
s of
their
app
ointm
ent.
Det
ails
of tr
ansa
ctio
ns w
ith re
late
d pa
rties
dur
ing th
e pe
riod,
othe
r tha
n th
ose
which
hav
e be
en d
isclo
sed
else
wher
e in
thes
e un
cons
olida
ted
cond
ense
d int
erim
fina
ncia
l sta
tem
ents
are
as
follo
ws:
Unau
dite
d Ju
ne 3
0, 2
021
Audit
ed D
ecem
ber 3
1, 2
020

34 35
Notes To The Unconsolidated Condensed Interim Financial Statements (Un-audited) Notes To The Unconsolidated Condensed Interim Financial Statements (Un-audited) For The Half Year Ended June 30, 2021For The Half Year Ended June 30, 2021
Unaudited June 30, 2021
Audited December 31,
2020
38 CAPITAL ADEQUACY, LEVERAGE RATIO & LIQUIDITY REQUIREMENTS
Capital Adequacy
Minimum Capital Requirement (MCR):
Paid-up capital (net of losses) 11,850,600
11,850,600
Capital Adequacy Ratio (CAR):
Eligible Common Equity Tier 1 (CET 1) Capital 145,366,450
152,901,428
Eligible Additional Tier 1 (ADT 1) Capital -
-
Total Eligible Tier 1 Capital 145,366,450
152,901,428
Eligible Tier 2 Capital 31,041,712
35,507,111
Total Eligible Capital (Tier 1 + Tier 2) 176,408,162
188,408,539
Risk Weighted Assets (RWAs):
Credit Risk 621,239,083
635,599,185
Market Risk 143,368,094
122,603,850
Operational Risk 139,735,092
139,735,092
Total 904,342,269 897,938,127
Common Equity Tier 1 Capital Adequacy ratio 16.07% 17.03%
Tier 1 Capital Adequacy Ratio 16.07% 17.03%
Total Capital Adequacy Ratio 19.51% 20.98%
Leverage Ratio (LR):
Eligible Tier-1 Capital 145,366,450
152,901,428
Total Exposures 2,294,791,377
2,174,932,446
Leverage Ratio 6.33% 7.03%
Liquidity Coverage Ratio (LCR):
Total High Quality Liquid Assets 1,066,679,996
934,508,535
Total Net Cash Outflow 433,929,839
393,109,786
Liquidity Coverage Ratio 245.82% 237.72%
Net Stable Funding Ratio (NSFR):
Total Available Stable Funding 1,218,523,940 1,130,301,361
Total Required Stable Funding 648,774,308 646,417,507
Net Stable Funding Ratio 187.82% 174.86%
----------Rupees in '000-------
Dire
ctor
s K
ey
Man
agem
ent
Per
sonn
el
Sub
sidi
arie
s A
ssoc
iate
s O
ther
Rel
ated
P
artie
s D
irect
ors
Key
M
anag
emen
t P
erso
nnel
S
ubsi
diar
ies
Ass
ocia
tes
Oth
er R
elat
ed
Par
ties
Inco
me
Mar
kup
/ ret
urn
/ int
eres
t ear
ned
23
7,
985
32,7
14
1,
491
3,
917
-
6,70
5
114,
416
15
11,2
29
Fee
and
com
mis
sion
inco
me
-
-
19
,839
424,
967
2,09
7
-
-
17
,564
418,
858
836
Div
iden
d in
com
e-
-
83,1
53
87
,500
50,6
45
-
-
36
,957
105,
000
7,93
3
Gai
n / (
loss
) on
forw
ard
fore
ign
exch
ange
con
tract
s m
atur
ed d
urin
g th
e pe
riod
-
-
-
-
17,6
09
-
-
-
-
43
,062
Net
gai
n / (
loss
) on
sale
of s
ecur
ities
3
-
-
32
21
0
72
3
3
-
495
3,55
3
Gai
n on
sal
e of
fixe
d as
sets
-
72
-
-
-
-
17
-
-
-
Ren
t inc
ome
-
-
24
,198
5,68
5
1,14
0
-
-
19
,509
4,45
5
1,
140
Exp
ense
Mar
kup
/ ret
urn
/ int
eres
t exp
ense
d8,
927
1,48
7
55
3
61
,727
187,
476
22,7
74
1,20
2
1,4
66
11
0,42
1
10
8,47
8
-
-
-
-
-
-
-
-
-
-
Oth
er O
pera
ting
expe
nses
Cle
arin
g ex
pens
es p
aid
to N
IFT
-
-
-
-
76,3
83
-
-
-
-
82
,632
Con
tribu
tion
to p
rovi
dent
fund
-
-
-
-
216,
847
-
-
-
-
19
7,23
9
Ren
t exp
ense
s-
-
5,75
0
21
,688
23,2
63
-
-
5,
227
21,2
99
15,1
21
Cas
h so
rting
exp
ense
s-
-
-
-
54
,562
-
-
-
-
56
,415
Sta
tione
ry e
xpen
ses
-
-
-
-
128,
424
-
-
-
-
12
1,20
4
Sec
urity
gua
rds
expe
nses
-
-
-
-
173,
829
-
-
-
-
16
5,32
4
Rem
uner
atio
n to
key
exe
cutiv
es a
nd n
on-e
xecu
tive
dire
ctor
s fe
e11
4,48
3
32
6,63
3
-
-
-
1
08,4
75
32
8,03
6
-
-
-
Out
sour
cing
ser
vice
exp
ense
s-
-
-
10
6,27
3
-
-
-
-
13
8,30
1
-
Don
atio
n du
ring
the
year
-
-
-
-
-
-
-
-
-
95
,000
E-d
ivid
end
proc
essi
ng fe
e an
d C
DC
cha
rges
-
-
-
-
3,10
0
-
-
-
-
2,
638
Trav
ellin
g E
xpen
ses
-
-
-
-
22,6
81
-
-
-
-
17
,456
Hot
el s
tay
expe
nses
-
-
-
-
63
-
-
-
-
3,
110
Rep
air &
Mai
nten
ance
Cha
rges
-
-
-
-
1,06
3
-
-
-
-
93
8
Adv
ertis
emen
t Exp
ense
s-
-
-
-
-
-
-
-
-
6,
264
Mis
cella
neou
s ex
pens
es a
nd p
aym
ents
-
-
-
-
1,14
3
-
-
-
-
88
9
Insu
ranc
e pr
emiu
m-n
et o
f ref
und
-
-
-
240,
393
-
-
-
-
27
0,37
5
-
Insu
ranc
e cl
aim
set
tled
-
-
-
11,7
41
-
-
-
-
18
,232
-
Oth
er T
rans
actio
ns
Pro
ceed
s fro
m s
ale
of fi
xed
asse
ts-
72
-
-
-
-
18
-
-
-
Pur
chas
e of
fixe
d as
sets
-
-
-
14,6
24
12
,810
-
-
-
3,
277
-
Sal
e of
fore
ign
curr
ency
-
-
11
,044
,337
-
-
-
-
21
,656
,614
-
-
Pur
chas
e of
fore
ign
curr
ency
-
-
7,
211,
829
-
-
-
-
14
,173
,970
-
-
Pay
men
ts a
gain
st h
ome
rem
ittan
ces
-
-
2,
300,
794
-
-
-
-
1,
709,
813
-
-
Rei
mbu
rsem
ent o
f oth
er e
xpen
ses
-
-
15
,684
-
-
-
-
14
,536
-
-
Sal
e of
gov
ernm
ent s
ecur
ities
396,
165
4,13
1
-
4,30
3,66
8
2,
809,
322
188,
884
64
,784
-
3,15
4,64
5
1,
718,
066
Pur
chas
e of
gov
ernm
ent s
ecur
ities
-
-
-
10,8
42,1
26
2,46
3,27
8
19
,827
-
-
631,
712
546,
800
Forw
ard
exch
ange
con
tract
s m
atur
ed d
urin
g th
e pe
riod
-
-
-
-
2,83
8,22
8
-
-
-
-
10
,494
,150
The
Cha
irman
has
bee
n pr
ovid
ed w
ith fr
ee u
se o
f the
Ban
k m
aint
aine
d ca
r. Th
e C
hief
Exe
cutiv
e an
d ce
rtain
exe
cutiv
es a
re p
rovi
ded
with
free
use
of t
he B
ank'
s m
aint
aine
d ca
rs a
nd h
ouse
hold
equ
ipm
ent i
n ac
cord
ance
with
the
term
s of
thei
r em
ploy
men
t.
Una
udite
d Ju
ne 3
0, 2
021
Una
udite
d Ju
ne 3
0, 2
020
----
----
----
----
----
----
----
----
----
----
----
----
----
----
----
----
----
----
----
----
----
----
----
----
(Ru
pees
in '0
00)-
----
----
----
----
----
----
----
----
----
----
----
----
----
----
----
----
----
----
----
----
----
----
----
---

36 37
Consolidated Condensed Interim Financial Statements for the half year ended June 30, 2021
39 EVENTS AFTER THE REPORTING DATE
40 GENERAL
41 DATE OF AUTHORIZATION FOR ISSUE
The Board of Directors in its meeting held on August 11, 2021 has announced a cash dividend in respect of half year ended June 30, 2021 of Rs.5.00 per share (June 30, 2020: Rs. Nil per share). These unconsolidated condensed interim financial statements for the period ended June 30, 2021 do not include the effect of these appropriations which will be accounted for subsequent to the period end.
Comparative figures have been re-arranged and reclassified for comparison purposes. Figures have been rounded off to the nearest thousand of rupees unless otherwise stated.
These unconsolidated condensed interim financial statements were authorized for issue by the Board of Directors of the Bank in their meeting held on August 11, 2021.
Notes To The Unconsolidated Condensed Interim Financial Statements (Un-audited) For The Half Year Ended June 30, 2021
Salman Khalid ButtDirector
S. M. MuneerDirector
Imran MaqboolPresident / CEO Muhammad Ali Zeb
Director Hammad Khalid
Chief Financial Officer
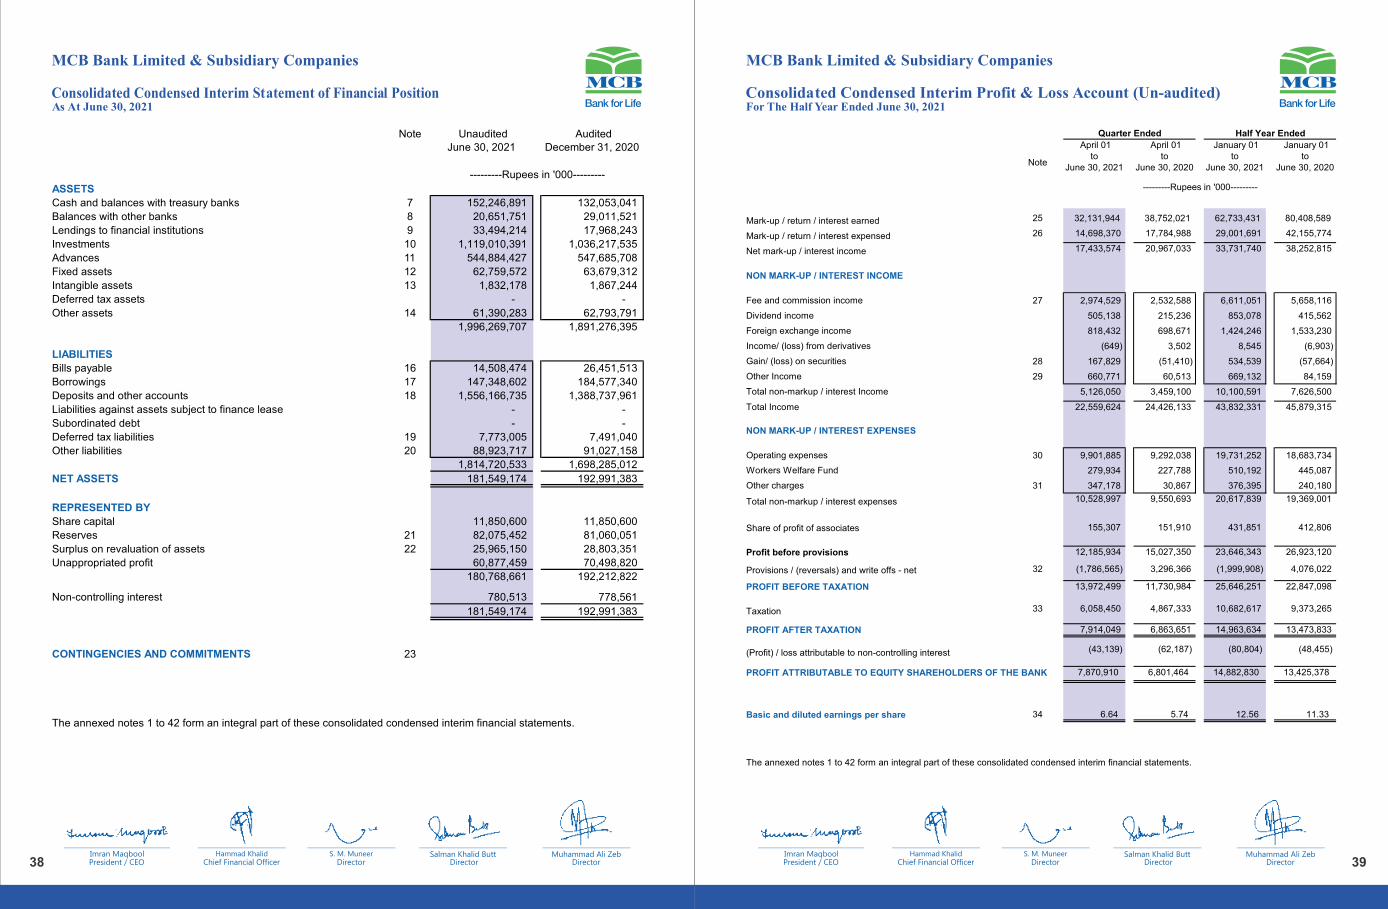
38 39
MCB Bank Limited & Subsidiary Companies MCB Bank Limited & Subsidiary Companies
Consolidated Condensed Interim Statement of Financial PositionAs At June 30, 2021
Salman Khalid ButtDirector
S. M. MuneerDirector
Imran MaqboolPresident / CEO Muhammad Ali Zeb
Director Hammad Khalid
Chief Financial Officer
Salman Khalid ButtDirector
S. M. MuneerDirector
Imran MaqboolPresident / CEO Muhammad Ali Zeb
Director Hammad Khalid
Chief Financial Officer
Note Unaudited June 30, 2021
Audited December 31, 2020
ASSETS
Cash and balances with treasury banks 7 152,246,891
132,053,041
Balances with other banks 8 20,651,751
29,011,521
Lendings to financial institutions 9 33,494,214
17,968,243
Investments 10 1,119,010,391
1,036,217,535
Advances 11 544,884,427
547,685,708
Fixed assets 12 62,759,572
63,679,312
Intangible assets 13 1,832,178
1,867,244
Deferred tax assets -
-
Other assets 14 61,390,283
62,793,791
1,996,269,707
1,891,276,395
LIABILITIES
Bills payable 16 14,508,474
26,451,513
Borrowings 17 147,348,602
184,577,340
Deposits and other accounts 18 1,556,166,735
1,388,737,961
Liabilities against assets subject to finance lease -
-
Subordinated debt -
-
Deferred tax liabilities 19 7,773,005
7,491,040
Other liabilities 20 88,923,717
91,027,158
1,814,720,533
1,698,285,012
NET ASSETS 181,549,174
192,991,383
REPRESENTED BY
Share capital 11,850,600
11,850,600
Reserves 21 82,075,452
81,060,051
Surplus on revaluation of assets 22 25,965,150
28,803,351
Unappropriated profit 60,877,459
70,498,820
180,768,661 192,212,822
Non-controlling interest 780,513 778,561
181,549,174 192,991,383
CONTINGENCIES AND COMMITMENTS 23
The annexed notes 1 to 42 form an integral part of these consolidated condensed interim financial statements.
---------Rupees in '000---------
Consolidated Condensed Interim Profit & Loss Account (Un-audited)For The Half Year Ended June 30, 2021
Note
April 01 to
June 30, 2021
April 01 to
June 30, 2020
January 01to
June 30, 2021
January 01to
June 30, 2020
Mark-up / return / interest earned 25 32,131,944
38,752,021
62,733,431
80,408,589
Mark-up / return / interest expensed 26 14,698,370 17,784,988 29,001,691 42,155,774
Net mark-up / interest income 17,433,574 20,967,033 33,731,740 38,252,815
NON MARK-UP / INTEREST INCOME
Fee and commission income 27 2,974,529 2,532,588 6,611,051 5,658,116
Dividend income 505,138 215,236 853,078 415,562
Foreign exchange income 818,432 698,671 1,424,246 1,533,230
Income/ (loss) from derivatives (649) 3,502 8,545 (6,903)
Gain/ (loss) on securities 28 167,829 (51,410) 534,539 (57,664)
Other Income 29 660,771 60,513 669,132 84,159
Total non-markup / interest Income 5,126,050 3,459,100 10,100,591 7,626,500
Total Income 22,559,624 24,426,133 43,832,331 45,879,315
NON MARK-UP / INTEREST EXPENSES
Operating expenses 30 9,901,885 9,292,038 19,731,252 18,683,734
Workers Welfare Fund 279,934 227,788 510,192 445,087
Other charges 31 347,178 30,867 376,395 240,180
Total non-markup / interest expenses 10,528,997 9,550,693 20,617,839 19,369,001
Share of profit of associates 155,307 151,910 431,851 412,806
Profit before provisions 12,185,934 15,027,350 23,646,343 26,923,120
Provisions / (reversals) and write offs - net 32 (1,786,565) 3,296,366 (1,999,908) 4,076,022
PROFIT BEFORE TAXATION 13,972,499 11,730,984 25,646,251 22,847,098
Taxation 33 6,058,450 4,867,333 10,682,617 9,373,265
PROFIT AFTER TAXATION 7,914,049 6,863,651 14,963,634 13,473,833
(Profit) / loss attributable to non-controlling interest (43,139) (62,187) (80,804) (48,455)
PROFIT ATTRIBUTABLE TO EQUITY SHAREHOLDERS OF THE BANK 7,870,910 6,801,464 14,882,830 13,425,378
Basic and diluted earnings per share 34 6.64 5.74 12.56 11.33
The annexed notes 1 to 42 form an integral part of these consolidated condensed interim financial statements.
Quarter Ended Half Year Ended
---------Rupees in '000---------
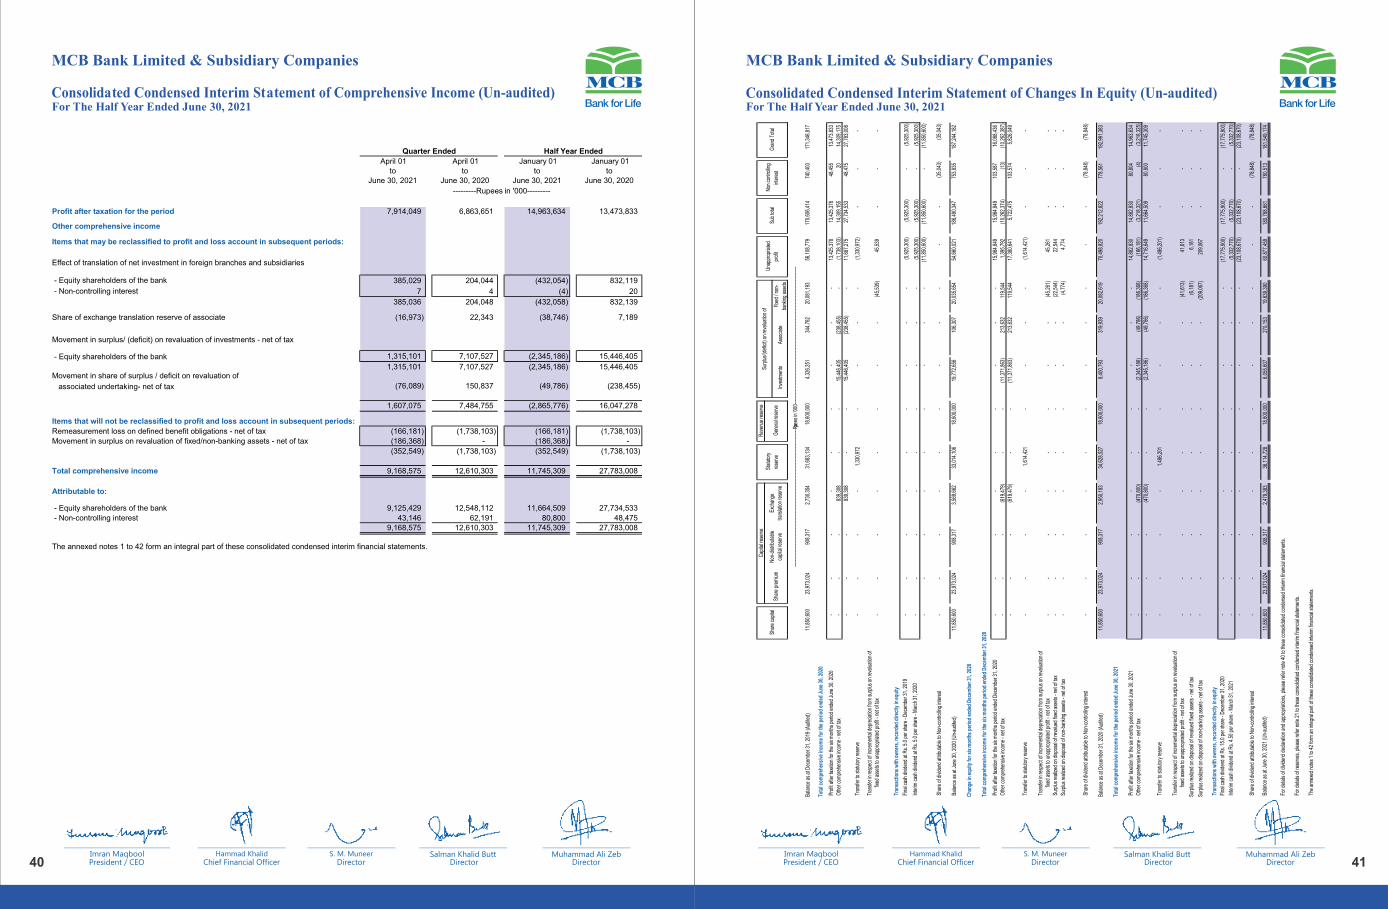
April 01 to
June 30, 2021
April 01 to
June 30, 2020
January 01to
June 30, 2021
January 01to
June 30, 2020
Profit after taxation for the period 7,914,049
6,863,651
14,963,634
13,473,833
Other comprehensive income
Items that may be reclassified to profit and loss account in subsequent periods:
Effect of translation of net investment in foreign branches and subsidiaries
- Equity shareholders of the bank 385,029
204,044
(432,054)
832,119
- Non-controlling interest 7
4
(4)
20
385,036
204,048
(432,058)
832,139
Share of exchange translation reserve of associate (16,973)
22,343
(38,746)
7,189
Movement in surplus/ (deficit) on revaluation of investments - net of tax
- Equity shareholders of the bank 1,315,101 7,107,527 (2,345,186) 15,446,405 1,315,101 7,107,527 (2,345,186) 15,446,405
Movement in share of surplus / deficit on revaluation of
associated undertaking- net of tax (76,089)
150,837
(49,786)
(238,455)
1,607,075
7,484,755
(2,865,776)
16,047,278
Items that will not be reclassified to profit and loss account in subsequent periods:
Remeasurement loss on defined benefit obligations - net of tax (166,181)
(1,738,103)
(166,181)
(1,738,103)
Movement in surplus on revaluation of fixed/non-banking assets - net of tax (186,368)
-
(186,368)
-
(352,549)
(1,738,103)
(352,549)
(1,738,103)
Total comprehensive income 9,168,575
12,610,303
11,745,309
27,783,008
Attributable to:
- Equity shareholders of the bank 9,125,429
12,548,112
11,664,509
27,734,533
- Non-controlling interest 43,146
62,191
80,800
48,475
9,168,575 12,610,303 11,745,309 27,783,008
The annexed notes 1 to 42 form an integral part of these consolidated condensed interim financial statements.
---------Rupees in '000---------
Quarter Ended Half Year Ended
40 41
MCB Bank Limited & Subsidiary Companies MCB Bank Limited & Subsidiary Companies
Consolidated Condensed Interim Statement of Changes In Equity (Un-audited) Consolidated Condensed Interim Statement of Comprehensive Income (Un-audited)
Salman Khalid ButtDirector
S. M. MuneerDirector
Imran MaqboolPresident / CEO Muhammad Ali Zeb
Director Hammad Khalid
Chief Financial Officer
Salman Khalid ButtDirector
S. M. MuneerDirector
Imran MaqboolPresident / CEO Muhammad Ali Zeb
Director Hammad Khalid
Chief Financial Officer
For The Half Year Ended June 30, 2021 For The Half Year Ended June 30, 2021
Rev
enue
rese
rve
Inve
stm
ents
Asso
ciate
Fixe
d / n
on-
bank
ing
asse
ts
Bala
nce
as a
t Dec
embe
r 31,
201
9 (A
udite
d)11
,850
,600
23,9
73,0
2490
8,31
72,
730,
354
31,6
83,1
3418
,600
,000
4,32
6,25
134
4,76
220
,081
,193
56,1
08,7
7917
0,60
6,41
474
0,40
317
1,34
6,81
7
Tota
l com
preh
ensi
ve in
com
e fo
r the
per
iod
ende
d Ju
ne 3
0, 2
020
Prof
it af
ter t
axat
ion
for t
he s
ix m
onth
s pe
riod
ende
d Ju
ne 3
0, 2
020
-
-
-
-
-
-
-
-
-
13,4
25,3
78
13,4
25,3
78
48,4
5513
,473
,833
Oth
er c
ompr
ehen
sive
inco
me
- net
of t
ax-
-
-
839,
308
-
-
15,4
46,4
05
(238
,455
)
-
(1,7
38,1
03)
14,3
09,1
55
2014
,309
,175
-
-
-
839,
308
-
-
15,4
46,4
05
(238
,455
)
-
11,6
87,2
75
27,7
34,5
33
48,4
7527
,783
,008
Tran
sfer
to s
tatu
tory
rese
rve
-
-
-
-
1,33
0,97
2
-
-
-
-
(1,3
30,9
72)
-
--
Tra
nsfe
r in
resp
ect o
f inc
rem
enta
l dep
recia
tion
from
sur
plus
on
reva
luat
ion
of
fixed
ass
ets
to u
napp
ropr
iate
d pr
ofit
- net
of t
ax-
-
-
-
-
-
-
-
(45,
539)
45,5
39
-
--
Tran
sact
ions
with
ow
ners
, rec
orde
d di
rect
ly in
equ
ity
Fina
l cas
h di
viden
d at
Rs.
5.0
per
sha
re -
Dec
embe
r 31,
201
9-
-
-
-
-
-
-
-
-
(5,9
25,3
00)
(5,9
25,3
00)
-(5
,925
,300
)
Inte
rim c
ash
divid
end
at R
s. 5
.0 p
er s
hare
- M
arch
31,
202
0-
-
-
-
-
-
-
-
-
(5,9
25,3
00)
(5,9
25,3
00)
-(5
,925
,300
)-
-
-
-
-
-
-
-
-
(11,
850,
600)
(11,
850,
600)
-(1
1,85
0,60
0)
Shar
e of
divi
dend
attr
ibut
able
to N
on-c
ontro
lling
inte
rest
-
-
-
-
-
-
-
-
-
-
-
(35,
043)
(35,
043)
Bala
nce
as a
t Jun
e 30
, 202
0 (U
n-au
dite
d)11
,850
,600
23,9
73,0
24
908,
317
3,56
9,66
2
33,0
14,1
06
18,6
00,0
00
19,7
72,6
56
106,
307
20,0
35,6
54
54,6
60,0
21
186,
490,
347
753,
835
187,
244,
182
Cha
nge
in e
quity
for s
ix m
onth
s pe
riod
ende
d D
ecem
ber 3
1, 2
020
Tota
l com
preh
ensi
ve in
com
e fo
r the
six
mon
ths
perio
d en
ded
Dec
embe
r 31,
202
0
Prof
it af
ter t
axat
ion
for t
he s
ix m
onth
s pe
riod
ende
d D
ecem
ber 3
1, 2
020
-
-
-
-
-
-
-
-
-
15,9
84,8
49
15,9
84,8
49
103,
587
16,0
88,4
36
Oth
er c
ompr
ehen
sive
inco
me
- net
of t
ax-
-
-
(619
,479
)
-
-
(11,
371,
863)
213,
632
119,
544
1,39
5,79
2
(10,
262,
374)
(13)
(10,
262,
387)
-
-
-
(619
,479
)
-
-
(11,
371,
863)
213,
632
119,
544
17,3
80,6
41
5,72
2,47
5
103,
574
5,82
6,04
9
Tran
sfer
to s
tatu
tory
rese
rve
-
-
-
-
1,61
4,42
1
-
-
-
-
(1,6
14,4
21)
-
--
Tra
nsfe
r in
resp
ect o
f inc
rem
enta
l dep
recia
tion
from
sur
plus
on
reva
luat
ion
of
fixed
ass
ets
to u
napp
ropr
iate
d pr
ofit
- net
of t
ax-
-
-
-
-
-
-
-
(45,
261)
45,2
61
-
--
Surp
lus
real
ized
on
disp
osal
of r
eval
ued
fixed
ass
ets
- net
of t
ax-
-
-
-
-
-
-
-
(22,
544)
22,5
44
-
--
Sur
plus
real
ized
on d
ispos
al o
f non
-ban
king
ass
ets
- net
of t
ax
-
-
-
-
-
-
-
-
(4,7
74)
4,77
4
-
--
Shar
e of
divi
dend
attr
ibut
able
to N
on-c
ontro
lling
inte
rest
-
-
-
-
-
-
-
-
-
-
-
(78,
848)
(78,
848)
Bala
nce
as a
t Dec
embe
r 31,
202
0 (A
udite
d)11
,850
,600
23,9
73,0
24
908,
317
2,95
0,18
3
34,6
28,5
27
18,6
00,0
00
8,40
0,79
3
319,
939
20,0
82,6
19
70,4
98,8
20
192,
212,
822
778,
561
192,
991,
383
Tota
l com
preh
ensi
ve in
com
e fo
r the
per
iod
ende
d Ju
ne 3
0, 2
021
Prof
it af
ter t
axat
ion
for t
he s
ix m
onth
s pe
riod
ende
d Ju
ne 3
0, 2
021
-
-
-
-
-
-
-
-
-
14,8
82,8
30
14,8
82,8
30
80,8
0414
,963
,634
Oth
er c
ompr
ehen
sive
inco
me
- net
of t
ax-
-
-
(470
,800
)
-
-
(2,3
45,1
86)
(49,
786)
(186
,368
)
(166
,181
)
(3,2
18,3
21)
(4)
(3,2
18,3
25)
-
-
-
(470
,800
)
-
-
(2,3
45,1
86)
(49,
786)
(186
,368
)
14,7
16,6
49
11,6
64,5
09
80,8
0011
,745
,309
Tran
sfer
to s
tatu
tory
rese
rve
-
-
-
-
1,48
6,20
1
-
-
-
-
(1,4
86,2
01)
-
--
Tra
nsfe
r in
resp
ect o
f inc
rem
enta
l dep
recia
tion
from
sur
plus
on
reva
luat
ion
of
fixed
ass
ets
to u
napp
ropr
iate
d pr
ofit
- net
of t
ax-
-
-
-
-
-
-
-
(41,
613)
41,6
13
-
--
Surp
lus
real
ized
on
disp
osal
of r
eval
ued
fixed
ass
ets
- net
of t
ax-
-
-
-
-
-
-
-
(6,1
81)
6,18
1
-
--
Surp
lus
real
ized
on
disp
osal
of n
on-b
anki
ng a
sset
s - n
et o
f tax
-
-
-
-
-
-
-
-
(209
,067
)
209,
067
-
--
Tran
sact
ions
with
ow
ners
, rec
orde
d di
rect
ly in
equ
ity
Fina
l cas
h di
viden
d at
Rs.
15.
0 pe
r sha
re -
Dec
embe
r 31,
202
0-
-
-
-
-
-
-
-
-
(17,
775,
900)
(17,
775,
900)
-(1
7,77
5,90
0)
Inte
rim c
ash
divid
end
at R
s. 4
.50
per s
hare
- M
arch
31,
202
1-
-
-
-
-
-
-
-
-
(5,3
32,7
70)
(5,3
32,7
70)
-(5
,332
,770
)-
--
--
--
--
(23,
108,
670)
(23,
108,
670)
-(2
3,10
8,67
0)
Shar
e of
divi
dend
attr
ibut
able
to N
on-c
ontro
lling
inte
rest
--
--
--
--
--
-(7
8,84
8)(7
8,84
8)
Bala
nce
as a
t Jun
e 30
, 202
1 (U
n-au
dite
d)11
,850
,600
23,9
73,0
2490
8,31
72,
479,
383
36,1
14,7
2818
,600
,000
6,05
5,60
727
0,15
319
,639
,390
60,8
77,4
5918
0,76
8,66
178
0,51
318
1,54
9,17
4
For d
etai
ls of
divi
dend
dec
lara
tion
and
appr
opria
tions
, ple
ase
refe
r not
e 40
to th
ese
cons
olid
ated
con
dens
ed in
terim
fina
ncia
l sta
tem
ents
.
For d
etai
ls of
rese
rves
, ple
ase
refe
r not
e 21
to th
ese
cons
olid
ated
con
dens
ed in
terim
fina
ncia
l sta
tem
ents
.
The
anne
xed
note
s 1
to 4
2 fo
rm a
n in
tegr
al p
art o
f the
se c
onso
lidat
ed c
onde
nsed
inte
rim fi
nanc
ial s
tate
men
ts.
Non
con
trollin
g
inte
rest
G
rand
Tot
al
------
------
------
------
------
------
------
------
------
------
------
------
------
------
------
-----R
upees
in '0
00---
------
------
------
------
------
------
------
------
------
------
------
------
------
------
------
--
Cap
ital r
eser
ve S
tatu
tory
rese
rve
Sha
re c
apita
l
Surp
lus/
(def
icit)
on
reva
luat
ion
of
Sha
re p
rem
ium
N
on-d
istrib
utab
le
capi
tal r
eser
ve
Exch
ange
trans
latio
n re
serv
e G
ener
al re
serv
e
Una
ppro
pria
ted
prof
it S
ub to
tal
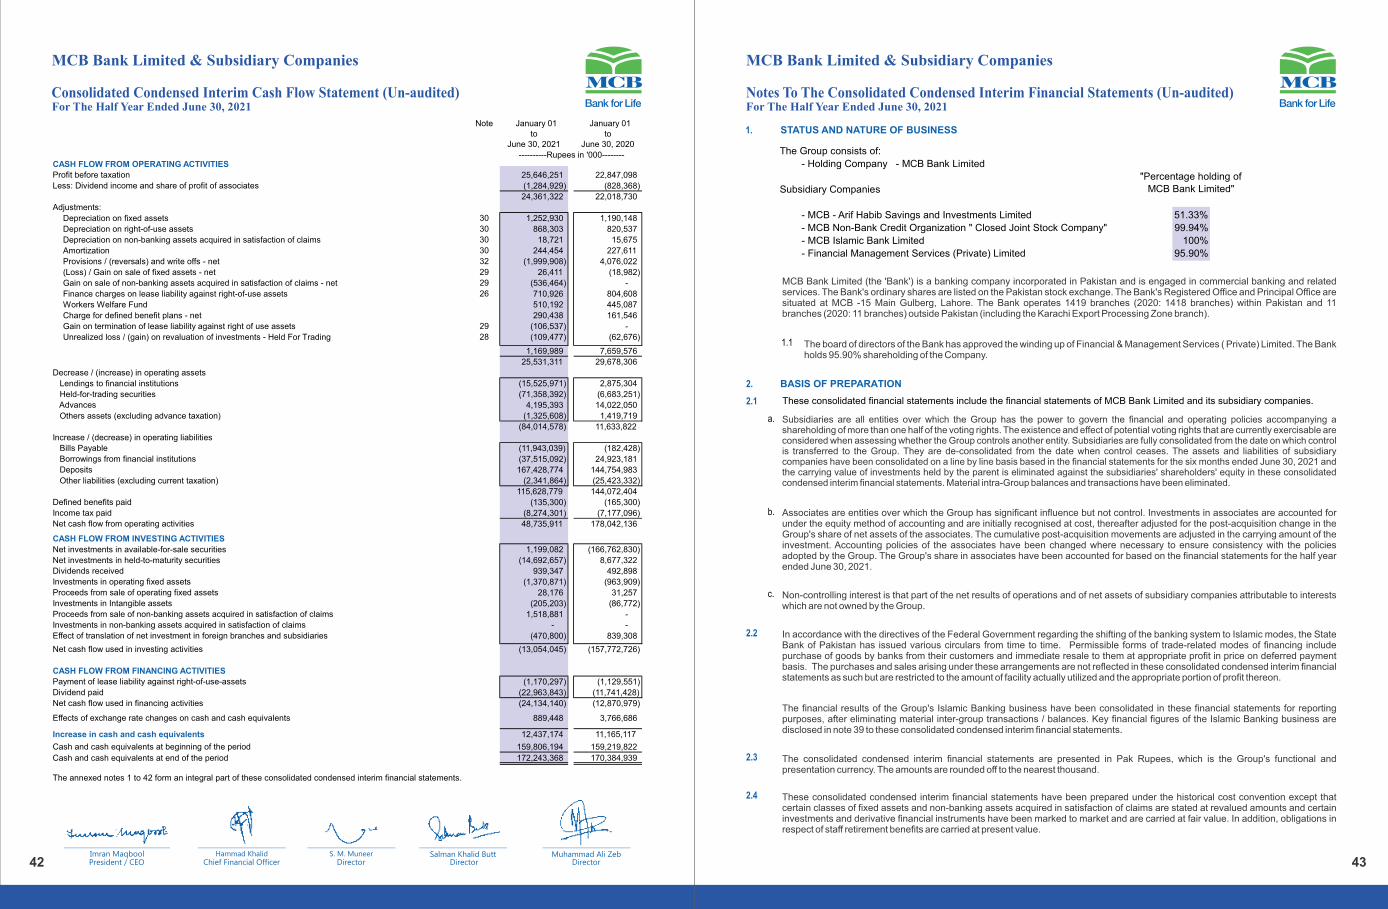
42 43
Notes To The Consolidated Condensed Interim Financial Statements (Un-audited)
2. BASIS OF PREPARATION
2.1
a.
These consolidated financial statements include the financial statements of MCB Bank Limited and its subsidiary companies.
1.1
1. STATUS AND NATURE OF BUSINESS
The Group consists of:
Subsidiary Companies
- MCB - Arif Habib Savings and Investments Limited
- MCB Non-Bank Credit Organization " Closed Joint Stock Company"
- Financial Management Services (Private) Limited
- Holding Company - MCB Bank Limited
"Percentage holding of MCB Bank Limited"
- MCB Islamic Bank Limited
MCB Bank Limited (the 'Bank') is a banking company incorporated in Pakistan and is engaged in commercial banking and related services. The Bank's ordinary shares are listed on the Pakistan stock exchange. The Bank's Registered Office and Principal Office are situated at MCB -15 Main Gulberg, Lahore. The Bank operates 1419 branches (2020: 1418 branches) within Pakistan and 11 branches (2020: 11 branches) outside Pakistan (including the Karachi Export Processing Zone branch).
The board of directors of the Bank has approved the winding up of Financial & Management Services ( Private) Limited. The Bank holds 95.90% shareholding of the Company.
Subsidiaries are all entities over which the Group has the power to govern the financial and operating policies accompanying a shareholding of more than one half of the voting rights. The existence and effect of potential voting rights that are currently exercisable are considered when assessing whether the Group controls another entity. Subsidiaries are fully consolidated from the date on which control is transferred to the Group. They are de-consolidated from the date when control ceases. The assets and liabilities of subsidiary companies have been consolidated on a line by line basis based in the financial statements for the six months ended June 30, 2021 and the carrying value of investments held by the parent is eliminated against the subsidiaries' shareholders' equity in these consolidated condensed interim financial statements. Material intra-Group balances and transactions have been eliminated.
b. Associates are entities over which the Group has significant influence but not control. Investments in associates are accounted for under the equity method of accounting and are initially recognised at cost, thereafter adjusted for the post-acquisition change in the Group's share of net assets of the associates. The cumulative post-acquisition movements are adjusted in the carrying amount of the investment. Accounting policies of the associates have been changed where necessary to ensure consistency with the policies adopted by the Group. The Group's share in associates have been accounted for based on the financial statements for the half year ended June 30, 2021.
Non-controlling interest is that part of the net results of operations and of net assets of subsidiary companies attributable to interests which are not owned by the Group.
c.
2.2 In accordance with the directives of the Federal Government regarding the shifting of the banking system to Islamic modes, the State Bank of Pakistan has issued various circulars from time to time. Permissible forms of trade-related modes of financing include purchase of goods by banks from their customers and immediate resale to them at appropriate profit in price on deferred payment basis. The purchases and sales arising under these arrangements are not reflected in these consolidated condensed interim financial statements as such but are restricted to the amount of facility actually utilized and the appropriate portion of profit thereon.
The financial results of the Group's Islamic Banking business have been consolidated in these financial statements for reporting purposes, after eliminating material inter-group transactions / balances. Key financial figures of the Islamic Banking business are disclosed in note 39 to these consolidated condensed interim financial statements.
2.3 The consolidated condensed interim financial statements are presented in Pak Rupees, which is the Group's functional and presentation currency. The amounts are rounded off to the nearest thousand.
2.4 These consolidated condensed interim financial statements have been prepared under the historical cost convention except that certain classes of fixed assets and non-banking assets acquired in satisfaction of claims are stated at revalued amounts and certain investments and derivative financial instruments have been marked to market and are carried at fair value. In addition, obligations in respect of staff retirement benefits are carried at present value.
95.90%
51.33%
99.94%
100%
MCB Bank Limited & Subsidiary Companies MCB Bank Limited & Subsidiary Companies Consolidated Condensed Interim Cash Flow Statement (Un-audited)
For The Half Year Ended June 30, 2021
Salman Khalid ButtDirector
S. M. MuneerDirector
Imran MaqboolPresident / CEO Muhammad Ali Zeb
Director Hammad Khalid
Chief Financial Officer
CASH FLOW FROM OPERATING ACTIVITIES
Profit before taxation
Less: Dividend income and share of profit of associates
Adjustments:
Depreciation on fixed assets
Depreciation on right-of-use assets
Depreciation on non-banking assets acquired in satisfaction of claims
Amortization
Provisions / (reversals) and write offs - net
(Loss) / Gain on sale of fixed assets - net
Gain on sale of non-banking assets acquired in satisfaction of claims - net
Finance charges on lease liability against right-of-use assets
Workers Welfare Fund
Charge for defined benefit plans - net
Gain on termination of lease liability against right of use assets
Unrealized loss / (gain) on revaluation of investments - Held For Trading
Decrease / (increase) in operating assets
Lendings to financial institutions
Held-for-trading securities
Advances
Others assets (excluding advance taxation)
Increase / (decrease) in operating liabilities
Bills Payable
Borrowings from financial institutions
Deposits
Other liabilities (excluding current taxation)
Defined benefits paid
Income tax paid
Net cash flow from operating activities
CASH FLOW FROM INVESTING ACTIVITIES
Net investments in available-for-sale securities
Net investments in held-to-maturity securities
Dividends received
Investments in operating fixed assets
Proceeds from sale of operating fixed assets
Investments in Intangible assets
Proceeds from sale of non-banking assets acquired in satisfaction of claims
Investments in non-banking assets acquired in satisfaction of claims
Effect of translation of net investment in foreign branches and subsidiaries
Net cash flow used in investing activities
CASH FLOW FROM FINANCING ACTIVITIES
Payment of lease liability against right-of-use-assets
Dividend paid
Net cash flow used in financing activities
Effects of exchange rate changes on cash and cash equivalents
Increase in cash and cash equivalents
Cash and cash equivalents at beginning of the period
Cash and cash equivalents at end of the period
The annexed notes 1 to 42 form an integral part of these consolidated condensed interim financial statements.
Note January 01to
June 30, 2021
January 01to
June 30, 2020
----------Rupees in '000--------
25,646,251
22,847,098
(1,284,929)
(828,368)
24,361,322
22,018,730
30 1,252,930
1,190,148
30 868,303
820,537
30 18,721
15,675
30 244,454
227,611
32 (1,999,908)
4,076,022
29 26,411
(18,982)
29 (536,464)
-
26 710,926
804,608
510,192
445,087
290,438
161,546
29 (106,537)
-
28 (109,477)
(62,676)
1,169,989
7,659,576
25,531,311
29,678,306
(15,525,971)
2,875,304
(71,358,392)
(6,683,251)
4,195,393
14,022,050
(1,325,608)
1,419,719
(84,014,578)
11,633,822
(11,943,039)
(182,428)
(37,515,092)
24,923,181
167,428,774
144,754,983
(2,341,864)
(25,423,332)
115,628,779
144,072,404
(135,300) (165,300)
(8,274,301) (7,177,096)
48,735,911
178,042,136
1,199,082 (166,762,830) (14,692,657)
8,677,322
939,347
492,898 (1,370,871)
(963,909)
28,176
31,257
(205,203)
(86,772)
1,518,881
-
-
-
(470,800)
839,308
(13,054,045)
(157,772,726)
(1,170,297)
(1,129,551)
(22,963,843)
(11,741,428)
(24,134,140)
(12,870,979)
889,448
3,766,686
12,437,174
11,165,117
159,806,194 159,219,822
172,243,368 170,384,939
For The Half Year Ended June 30, 2021

44 45
MCB Bank Limited & Subsidiary Companies MCB Bank Limited & Subsidiary Companies
4. SIGNIFICANT ACCOUNTING POLICIES
The significant accounting policies and methods of computation adopted in the preparation of these consolidated condensed interim financial statements are consistent with those applied in the preparation of the audited annual consolidated financial statements of the Group for the year ended December 31, 2020.
5. CRITICAL ACCOUNTING ESTIMATES AND JUDGMENTS
The basis for accounting estimates adopted in the preparation of these consolidated condensed interim financial statements are the same as that applied in the preparation of the consolidated financial statements for the year ended December 31, 2020.
6. FINANCIAL RISK MANAGEMENT
The financial risk management objectives and policies adopted by the Group are consistent with those disclosed in the consolidated financial statements for the year ended December 31, 2020. These risk management policies continue to remain robust and the Group is reviewing its portfolio regularly and conducts rapid portfolio reviews in line with emerging risks.
There are other new and amended standards and interpretations that are mandatory for the Group's accounting periods beginning on or after January 1, 2022 but are considered not to be relevant or do not have any significant effect on the Group's operations and are therefore not detailed in these consolidated condensed interim financial statements.
3.
3.1 These consolidated condensed interim financial statements have been prepared in accordance with the accounting and reporting standards as applicable in Pakistan for interim financial reporting. The accounting and reporting standards as applicable in Pakistan for interim financial reporting comprise of:
- International Accounting Standard (IAS) 34, Interim Financial Reporting, issued by the International Accounting Standards Board (IASB) as notified under the Companies Act, 2017;
- Islamic Financial Accounting Standards (IFAS) issued by the Institute of Chartered Accountants of Pakistan as are notified under the Companies Act, 2017;
- Provisions of and directives issued under the Banking Companies Ordinance, 1962 and the Companies Act, 2017; and
- Directives issued by the State Bank of Pakistan (SBP) and the Securities and Exchange Commission of Pakistan (SECP).
Whenever the requirements of the Banking Companies Ordinance, 1962, the Companies Act, 2017 or the directives issued by the SBP and the SECP differ with the requirements of IAS 34 or IFAS, the requirements of the Banking Companies Ordinance, 1962, the Companies Act, 2017 and the said directives, shall prevail.
3.2 The State Bank of Pakistan has deferred the applicability of International Accounting Standards 40, 'Investment Property' for Banking Companies through BSD Circular No. 10 dated August 26, 2002. The Securities and Exchange Commission of Pakistan (SECP) has deferred applicability of IFRS-7 "Financial Instruments: Disclosures" on banks through S.R.O 411(1) /2008 dated April 28, 2008. Accordingly, the requirements of these standards have not been considered in the preparation of these consolidated condensed interim financial statements. However, investments have been classified and valued in accordance with the requirements prescribed by the State Bank of Pakistan through various circulars.
3.3 The SECP vide its notification SRO 633 (I)/2014 dated 10 July 2014, adopted IFRS 10 effective from the periods starting from June 30, 2014. However, vide its notification SRO 56 (I)/2016 dated January 28, 2016, it has been notified that the requirements of IFRS 10 and section 228 of the Companies Act, 2017 will not be applicable with respect to the investment in mutual funds established under trust structure.
3.4 The disclosures made in these consolidated condensed interim financial statements have been limited based on a format prescribed by the SBP vide BPRD Circular Letter No. 05 of 2019 dated March 22, 2019 and IAS 34, Interim Financial Reporting. These consolidated condensed interim financial statements do not include all the information and disclosures required in the audited annual financial statements, and should be read in conjunction with the audited annual consolidated financial statements for the financial year ended December 31, 2020.
3.5 Amendments to approved accounting standards that are effective in the current period
There are certain new standards and interpretations of and amendments to existing accounting standards that have become applicable to the Group for accounting periods beginning on or after January 1, 2021. These are considered either to not be relevant or not to have any significant impact on the Group's consolidated condensed interim financial statements.
3.6 Standards, interpretations of and amendments to approved accounting standards that are not yet effective
The following new standards and amendments to existing accounting standards will be effective from the dates mentioned below against the respective standard or amendment:
Effective date (annual periodsbeginning on or after)
Property, Plant and Equipment: Proceeds before intended use – Amendments to IAS 16Cost of Fulfilling an Onerous Contracts – Amendments to IAS 37Updating a Reference to the Conceptual Framework – Amendments to IFRS 3Classification of Liabilities as Current or Non-current – Amendments to IAS 1Amended by Definition of Accounting Estimates – Amendments to IAS 8
January 1, 2022January 1, 2022January 1, 2022January 1, 2023January 1, 2023
IFRS 9, Financial Instruments: Classification and Measurement, addresses recognition, classification, measurement and derecognition of financial assets and financial liabilities. The standard has also introduced a new impairment model for financial assets which requires recognition of impairment charge based on an 'Expected Credit Losses' (ECL) approach rather than the 'incurred credit losses' approach as currently followed. The ECL approach has an impact on all assets of the Bank which are exposed to credit risk.
As per the SBP's BPRD Circular Letter no. 24 dated July 5, 2021, the applicability of IFRS 9 to banks in Pakistan has been deferred to accounting periods beginning on or after January 1, 2022. Therefore, these consolidated condensed interim financial statements have been prepared in accordance with the existing prudential regime to the extent of the Group's domestic operations, whereas the requirements of this standard are incorporated for overseas jurisdictions where IFRS 9 has been adopted.
3. STATEMENT OF COMPLIANCE
3.1
Notes To The Consolidated Condensed Interim Financial Statements (Un-audited) For The Half Year Ended June 30, 2021
Notes To The Consolidated Condensed Interim Financial Statements (Un-audited) For The Half Year Ended June 30, 2021
7. CASH AND BALANCES WITH TREASURY BANKS
In hand
Local currency
Foreign currencies
With State Bank of Pakistan in
Local currency current accounts
Foreign currency current accounts
Foreign currency deposit accounts
With other central banks in
Foreign currency current accounts
With National Bank of Pakistan in
Local currency current accounts
Prize bonds
8. BALANCES WITH OTHER BANKS
In Pakistan
In current accounts
In deposit accounts
Outside Pakistan
In current accounts
In deposit accounts
9. LENDINGS TO FINANCIAL INSTITUTIONS
Call / clean money lendings
Repurchase agreement lendings (Reverse Repo)
Musharaka arrangements
Bai Muajjal receivable - with State Bank of Pakistan
Unaudited June 30, 2021
Audited December 31,
2020
27,121,832 25,039,386 7,761,047
7,088,257
34,882,879
32,127,643
61,996,309
51,920,851
3,300,169
2,271,659
9,952,524
10,532,776 75,249,002
64,725,286
3,153,826
11,851,311
37,463,073
22,308,442
1,498,111
1,040,359
152,246,891
132,053,041
22,012
9,190
2,010,894
1,554
2,032,906
10,744
12,822,553
26,768,812
5,796,292
2,231,965
18,618,845
29,000,777
20,651,751
29,011,521
29,220,496
11,002,195
3,273,718
6,137,258
1,000,000
-
- 828,790
33,494,214 17,968,243
----------Rupees in '000--------

46 47
MCB Bank Limited & Subsidiary Companies MCB Bank Limited & Subsidiary Companies
Notes To The Consolidated Condensed Interim Financial Statements (Un-audited) For The Half Year Ended June 30, 2021
Notes To The Consolidated Condensed Interim Financial Statements (Un-audited) For The Half Year Ended June 30, 2021
10.
INV
ES
TME
NTS
10.1
Inve
stm
ents
by
type
:
Hel
d-fo
r-tr
adin
g se
curi
ties
Fede
ral G
over
nmen
t Sec
uriti
es72
,605
,846
-
(7,9
49)
72,5
97,8
97
1,30
9,11
6
-
(2
24)
1,30
8,89
2
Sha
res
and
units
1,33
0,88
3
-
117,
426
1,44
8,30
9
1,15
8,95
2
-
110,
493
1,
269,
445
73,9
36,7
29
-
109,
477
74,0
46,2
06
2,46
8,06
8
-
110,
269
2,
578,
337
Ava
ilabl
e-fo
r-sa
le s
ecur
ities
Fede
ral G
over
nmen
t Sec
uriti
es96
5,04
2,63
0
(5,0
28)
6,47
5,82
9
971,
513,
431
969,
144,
840
(4,7
19)
9,47
7,85
3
97
8,61
7,97
4
Sha
res
and
units
32,5
39,4
50
(10,
570,
789)
3,42
0,22
5
25,3
88,8
86
28,3
98,0
65
(11,
155,
719)
3,41
2,14
7
20
,654
,493
Non
Gov
ernm
ent D
ebt S
ecur
ities
2,80
4,34
0
-
36,9
02
2,84
1,24
2
2,84
1,84
0
-
16,7
80
2,85
8,62
0
Fore
ign
Sec
uriti
es6,
255,
820
(1,7
14)
(5,7
31)
6,24
8,37
5
7,46
3,93
9
(1,7
14)
17,5
09
7,47
9,73
41,
006,
642,
240
(10,
577,
531)
9,92
7,22
5
1,00
5,99
1,93
4
1,00
7,84
8,68
4
(11,
162,
152)
12,9
24,2
89
1,00
9,61
0,82
1H
eld-
to-m
atur
ity s
ecur
ities
Fede
ral G
over
nmen
t Sec
uriti
es26
,678
,066
(10,
801)
-
26,6
67,2
65
7,31
3,21
7
(11,
542)
-
7,30
1,67
5
Pro
vinc
ial G
over
nmen
t Sec
uriti
es11
8
(118
)
-
-
118
(118
)
-
-
Non
Gov
ernm
ent D
ebt S
ecur
ities
6,89
2,76
3
(477
,541
)
-
6,41
5,22
2
9,61
5,31
7
(490
,341
)
-
9,12
4,97
6
Fore
ign
Sec
uriti
es1,
200,
009
(11,
103)
-
1,18
8,90
6
3,14
9,64
7
(27,
281)
-
3,12
2,36
634
,770
,956
(499
,563
)
-
34,2
71,3
93
20,0
78,2
99
(529
,282
)
-
19,5
49,0
17
Ass
ocia
tes
4,70
0,85
8
-
-
4,70
0,85
8
4,47
9,36
0
-
-
4,47
9,36
0
Tota
l In
vest
men
ts
1,12
0,05
0,78
3
(11,
077,
094)
10,0
36,7
02
1,11
9,01
0,39
1
1,03
4,87
4,41
1
(11,
691,
434)
13,0
34,5
58
1,03
6,21
7,53
5
10.1
.1In
vest
men
ts g
iven
as
colla
tera
l
Una
udite
d Ju
ne 3
0, 2
021
Aud
ited
Dec
embe
r 31,
202
0
- Mar
ket T
reas
ury
Bill
s14
,022
,219
91,2
79,2
73
- Pak
ista
n In
vest
men
t Bon
ds45
,768
,292
1,00
0,28
3
59,7
90,5
11
92,2
79,5
56
10.2
Pro
visi
on fo
r di
min
utio
n in
val
ue o
f inv
estm
ents
10.2
.1O
peni
ng b
alan
ce11
,691
,434
11,7
47,6
18
Exc
hang
e an
d ot
her a
djus
tmen
ts(7
,362
)
13,4
74
Cha
rge
/ (re
vers
als)
Cha
rge
for t
he p
erio
d / y
ear
357,
514
1,
993,
335
Rev
ersa
ls fo
r the
per
iod
/ yea
r(1
3,61
4)
(1,5
29)
Rev
ersa
l on
disp
osal
s(9
50,8
78)
(2,0
61,4
64)
(606
,978
)(6
9,65
8)
Am
ount
s w
ritte
n of
f-
-
Clo
sing
Bal
ance
11,0
77,0
9411
,691
,434
----
----
--R
upee
s in
'000
----
----
----
----
----
----
----
----
----
----
----
----
----
----
----
----
----
----
----
----
----
----
----
----
--R
upee
s in
'000
----
----
----
----
----
----
----
----
----
----
----
----
----
----
----
----
----
----
----
----
----
----
--
Una
udite
d J
une
30, 2
021
Aud
ited
Dec
embe
r 31,
202
0
Pro
visi
on fo
r di
min
utio
n S
urpl
us /
(Def
icit)
C
arry
ing
Val
ue
Cos
t /
Am
ortis
ed c
ost
Sur
plus
/ (D
efic
it)
Car
ryin
g V
alue
C
ost /
A
mor
tised
cos
t P
rovi
sion
for
dim
inut
ion
10.2.2 Particulars of provision against debt securities
Category of classification
NPI Provision NPI Provision
Domestic
Loss 477,659
477,659
490,459
490,459
477,659
477,659
490,459
490,459
10.2.3
10.3
10.4
Unaudited June 30, 2021
Audited December 31,
2020
Opening balance 4,435,075 4,211,707
Share of profit for the period / year before tax 411,273 585,968 Dividend from associate (87,500) (192,500) Share of tax (16,888) (143,175)
306,885
250,293
Share of other comprehensive income (96,972) (26,925)
Closing balance 4,644,988 4,435,075
Share of other comprehensive income
Share of unrealized surplus on assets -net of tax (58,226) (34,246)
Share of exchange translation reserve of associate (38,746) 7,321
(96,972) (26,925)
10.5
Unaudited June 30, 2021
Audited December 31,
2020
Opening balance 44,285 63,951
Share of profit for the period / year before tax 20,578 (12,890)
Share of tax (8,993) (6,776)
Closing balance 11,585 (19,666)
55,870 44,285
Investment in Adamjee Insurance Company Limited under equity method - holding 20.00% (2020: 20.00%)
----------Rupees in '000--------
Investment of the Group in Euronet Pakistan Private Limited has been accounted for under the equity method ofaccounting in accordance with the treatment specified in International Accounting Standard 28, (IAS 28) 'Accountingfor Investments in Associates'.
Investment in Euronet Pakistan Private Limited under equity method - holding 30% (2020: 30.00%)
----------Rupees in '000--------
Investment of the Group in Adamjee Insurance Company Limited has been accounted for under the equity method ofaccounting in accordance with the treatment specified in International Accounting Standard 28, (IAS 28) 'Accountingfor Investments in Associates'. The market value of the investment in Adamjee Insurance Company Limited as at June30, 2021 amounted to Rs. 2,902.900 million (2020: Rs. 2,752.400 million).
Unaudited June 30, 2021
Audited December 31, 2020
----------Rupees in '000--------
In addition to the above, overseas branches hold a general provision of Rs 26.931 million (December 31, 2020: Rs43.542 million) in accordance with the requirements of IFRS 9.
The market value of securities classified as held-to-maturity as at June 30, 2021 amounted to Rs. 31,614.111 million(December 31, 2020: Rs. 17,531.392 million).

49
MCB Bank Limited & Subsidiary Companies MCB Bank Limited & Subsidiary Companies
48
Notes To The Consolidated Condensed Interim Financial Statements (Un-audited) For The Half Year Ended June 30, 2021
Notes To The Consolidated Condensed Interim Financial Statements (Un-audited) For The Half Year Ended June 30, 2021
11.
AD
VA
NC
ES
Lo
an
s, c
ash
cre
dits
, ru
nn
ing
fin
an
ces,
etc
.4
43
,55
0,6
91
44
4,0
22
,13
8
49
,99
9,5
90
50
,52
4,7
53
49
3,5
50
,28
1
49
4,5
46
,89
1
Isla
mic
fin
an
cin
g a
nd
re
late
d a
sse
ts8
2,3
29
,76
8
84
,20
5,9
62
113
,46
7
75
6,4
71
82
,44
3,2
35
84
,96
2,4
33
Bill
s d
isco
un
ted
an
d p
urc
ha
sed
1
6,8
25
,56
9
18
,19
2,1
57
1,0
60
,09
6
66
4,2
94
17
,88
5,6
65
18
,85
6,4
51
Ad
van
ces
- g
ross
54
2,7
06
,02
8
54
6,4
20
,25
7
51
,17
3,1
53
51
,94
5,5
18
59
3,8
79
,18
1
59
8,3
65
,77
5
Pro
visi
on
ag
ain
st a
dva
nce
s
- S
pe
cific
-
-
(44
,91
9,3
59
)
(45
,16
8,3
51
)
(44
,91
9,3
59
)
(45
,16
8,3
51
)
- G
en
era
l(4
,07
5,3
95
)
(5,5
11,7
16
)
-
-
(4,0
75
,39
5)
(5,5
11,7
16
)
(4,0
75
,39
5)
(5,5
11,7
16
)
(44
,91
9,3
59
)
(45
,16
8,3
51
)
(48
,99
4,7
54
)
(50
,68
0,0
67
)
Ad
van
ces
- n
et
of
pro
visi
on
53
8,6
30
,63
3
54
0,9
08
,54
1
6,2
53
,79
4
6,7
77
,16
7
54
4,8
84
,42
7
54
7,6
85
,70
8
Un
au
dite
d
Jun
e 3
0,
20
21
Au
dite
d
De
cem
be
r 3
1,
20
20
11.1
Pa
rtic
ula
rs o
f a
dva
nc
es
(G
ros
s)
In lo
cal c
urr
en
cy5
49
,72
9,4
73
5
54
,17
9,3
78
In f
ore
ign
cu
rre
nci
es
44
,14
9,7
08
4
4,1
86
,39
7
59
3,8
79
,18
1
5
98
,36
5,7
75
11.2
\N
ote
No
n P
erf
orm
ing
L
oa
ns
Pro
visi
on
No
n P
erf
orm
ing
L
oa
ns
Pro
visi
on
Do
me
sti
c
Oth
er A
sse
ts E
spe
cia
lly M
en
tion
ed
11.2
.11
09
,08
4
4,0
48
61
,61
2
1,9
83
Su
bst
an
da
rd2
54
,12
4
63
,18
7
30
9,1
91
60
,38
2
Do
ub
tfu
l2
79
,41
5
118
,36
1
45
9,0
53
13
7,3
41
Lo
ss4
2,2
72
,61
9
41
,37
4,4
35
42
,67
1,2
20
41
,49
8,1
57
42
,91
5,2
42
41
,56
0,0
31
43
,50
1,0
76
41
,69
7,8
63
Ove
rse
as
N
ot
pa
st d
ue
bu
t im
pa
ire
d-
-
-
-
Ove
rdu
e b
y:
Up
to 9
0 d
ays
3,8
42
96
1
5,3
21
4,9
13
91
to
18
0 d
ays
28
2
71
2,0
20
50
5
18
1 t
o 3
65
da
ys9
,12
0
4,5
67
19
,96
1
9,9
81
˃ 3
65
da
ys8
,24
4,6
67
3,3
53
,72
9
8,4
17
,14
0
3,4
55
,08
9
8,2
57
,911
3,3
59
,32
8
8,4
44
,44
2
3,4
70
,48
8
To
tal
51
,17
3,1
53
44
,91
9,3
59
51
,94
5,5
18
45
,16
8,3
51
11.2
.1
----
----
--R
up
ee
s in
'00
0--
----
--
Ad
van
ces
incl
ud
e R
s. 5
1,1
73
.15
3 m
illio
n (
20
20
: R
s.5
1,9
45
.51
8 m
illio
n)
wh
ich
ha
ve b
ee
n p
lace
d u
nd
er
the
no
n-p
erf
orm
ing
sta
tus
as
de
taile
d b
elo
w:
Ca
teg
ory
of
Cla
ss
ific
ati
on
----
----
----
----
----
----
----
----
----
Ru
pe
es
in '0
00
----
----
----
----
----
----
----
----
---
Th
isre
pre
sen
tsn
on
-pe
rfo
rmin
gp
ort
folio
of
ag
ricu
ltura
l,sm
all
en
terp
rise
an
dIn
fra
stru
ctu
reP
roje
ctF
ina
nci
ng
cla
ssifi
ed
as
"Oth
er
Ass
ets
Esp
eci
ally
Me
ntio
ne
d"
as
pe
rth
ere
qu
ire
me
nts
of
resp
ect
ive
Pru
de
ntia
l Re
gu
latio
ns
issu
ed
by
the
Sta
te B
an
k o
f P
aki
sta
n.
Un
au
dite
d
Jun
e 3
0,
20
21
Au
dite
d
De
cem
be
r 3
1,
20
20
----
----
----
----
----
----
----
----
----
----
----
----
----
----
----
----
----
---R
up
ee
s in
'00
0--
----
----
----
----
----
----
----
----
----
----
----
----
----
----
----
----
----
-
Pe
rfo
rmin
gN
on
Pe
rfo
rmin
gT
ota
l
Au
dite
d
De
cem
be
r 3
1,
20
20
Un
au
dite
d
Jun
e 3
0,
20
21
Au
dite
d
De
cem
be
r 3
1,
20
20
Un
au
dite
d
Jun
e 3
0,
20
21
Au
dite
d
De
cem
be
r 3
1,
20
20
Un
au
dite
d
Jun
e 3
0,
20
21
11.3 Particulars of provision against advances
Specific General Total Specific General Total
Opening balance 45,168,351 5,511,716 50,680,067 41,937,761 1,461,011 43,398,772
Exchange adjustments (67,350) (12,818) (80,168) 50,555 7,162 57,717
Charge for the period / year 1,745,044
60,963
1,806,007
5,730,579
4,106,594
9,837,173
Reversals (1,629,453)
(1,484,466)
(3,113,919)
(2,215,829)
(63,051)
(2,278,880)
115,591
(1,423,503)
(1,307,912)
3,514,750
4,043,543
7,558,293
Amounts written off (297,233)
-
(297,233)
(334,715)
-
(334,715)
Closing balance 44,919,359 4,075,395 48,994,754 45,168,351 5,511,716 50,680,067
Unaudited June 30, 2021 Audited D ecember 31, 2020
------------------------------------Rupees in '000-----------------------------------
11.3.1 General provision against consumer loans represents provision maintained against fully secured performing portfolio and unsecured performing portfolio as required by the Prudential Regulations issued by the SBP. General provision against Small Enterprise Finance represents provision maintained at an amount equal to 1% of unsecured performing portfolio as required by the Prudential Regulations issued by the SBP. General provisions pertaining to overseas advances are made in accordance with the requirements of the regulatory authorities of the respective countries in which the overseas branches operate.
11.3.2 In addition, the Group has also maintained an un-encumbered general provision of Rs 3,094 million (December 31, 2020: Rs 4,564 million) against financing made on prudent basis. This general provision is in addition to the requirements of Prudential Regulations.
11.3.3 State Bank of Pakistan vide BSD Circular No. 2 dated January 27, 2009, BSD Circular No. 10 dated October 20, 2009, BSD Circular No. 02 of 2010 dated June 03, 2010 and BSD Circular No.1 of 2011 dated October 21, 2011 has allowed benefit of forced sale value (FSV) of Plant & Machinery under charge, pledged stock and mortgaged residential, commercial & industrial properties (land and building only) held as collateral against NPLs for five years from the date of classification. The Bank (holding company) has not taken the FSV benefit in calculation of specific provision. However, one of the subsidiary of the Bank has availed benefit of forced sale values amounting to Rs.21.964 million (December 31, 2020: Rs.543.151 million) in determining the provisioning against non-performing Islamic financing and related assets as at June 30, 2021. The additional benefit on the Group's statement of profit and loss arising from availing the FSV benefit - net of tax amounts to Rs 13.398 million as at June 30, 2021 (December 31, 2020: Rs 353.048 million). However, the additional impact on profitability arising from availing the benefit of forced sales value is not available for payment of cash or stock dividends to shareholders.
12. FIXED ASSETS
Capital work-in-progress
Property and equipment
Right-of-use assets
12.1 Capital work-in-progress
Civil works
Equipment
Advances to suppliers
Others
12.2 Additions to fixed assets
The following additions have been made to fixed assets during the period:
Capital work-in-progress - net additions
Property and equipment
Freehold land
Building on freehold land
Building on leasehold land
Electrical office and computer equipment
Furniture and fixture
Leasehold Improvements
Vehicles
Leasehold land
12.3 Disposal of fixed assets
The net book value of fixed assets disposed off during the period is as follows:
Vehicles
Furniture and fixture
Electrical office and computer equipment
Leasehold Improvements
Building on freehold land
Note
Unaudited June 30, 2021
Audited December 31,
2020
12.1 1,212,421 871,274
52,899,053 53,190,768
8,648,098 9,617,270
62,759,572 63,679,312
611,395
472,314
240,649
98,383
333,268
296,456
27,109
4,121
1,212,421
871,274
Unaudited
Half Year ended
June 30, 2021
Unaudited
Half Year
ended June 30, 2020
341,147
314,899
35,108
25,327
176,108
34,833
14,911
-
471,883
315,941
91,906
103,916
206,166
111,765
33,642 50,229
-
6,999
1,029,724 649,010
1,370,871 963,909
2,018
6,971
2,756
614
4,930 3,390
1,734 1,300
43,149 -
54,587 12,275
----------Rupees in '000--------
----------Rupees in '000--------

13. INTANGIBLE ASSETS
Computer software
Goodwill
Management rights
Capital work-in-progress
13.1 Additions to intangible assets
The following additions have been made to intangible assets during the period:
Computer software
Capital work-in-progress - net additions
14. OTHER ASSETS
Income/ Mark-up accrued in local currency
Income/ Mark-up accrued in foreign currencies
Advances, deposits, advance rent and other prepayments
Non-banking assets acquired in satisfaction of claims
Compensation for delayed income tax refunds
Branch adjustment account
Mark to market gain on forward foreign exchange contracts
Unrealized gain on derivative financial instruments
Acceptances
Receivable from the pension fund
Clearing and settlement accounts
Others
Less: Provision held against other assets
Other Assets (net of provision)
Surplus on revaluation of non-banking assets
acquired in satisfaction of claims
Other Assets - total
14.1 Provision held against other assets
Non banking assets acquired in satisfaction of claims
Claims receivable against fraud and forgeries
Others
14.1.1 Movement in provision held against other assets
Opening balance
Charge for the period / year
Reversals
Amounts written off
Exchange and other adjustments
Closing balance
15. CONTINGENT ASSETS
There were no contingent assets of the Group as at June 30, 2021 (2020: NIL).
Unaudited June 30, 2021
Audited December 31,
2020
1,109,429 1,157,787
82,127 82,127
192,000 192,000
448,622
435,330
1,832,178
1,867,244
UnauditedHalf Year ended June 30, 2021
Unaudited Half Year ended June 30, 2020
175,390
72,242
29,813
14,530
205,203
86,772
NoteUnaudited
June 30, 2021Audited
December 31, 2020
22,207,249
19,451,779
598,814
311,024
2,088,599
2,524,851
2,624,726
3,277,778
133,809
133,809
303,692
421,204
2,248,549
4,847,284
276,993
517,033
20 21,361,862
22,747,369
3,007,326
3,370,179
4,560,383
2,698,271
4,049,500
4,221,665
63,461,502
64,522,246
14.1 2,582,715
2,582,686
60,878,787
61,939,560
22 511,496
854,231
61,390,283
62,793,791
89,745
95,095
493,733
478,773
1,999,237
2,008,818
2,582,715
2,582,686
2,582,686 2,604,137
24,898 54,269
(23,889) (77,917)
1,009 (23,648)
- (16,591)
(980) 18,788
2,582,715 2,582,686
----------Rupees in '000--------
----------Rupees in '000--------
----------Rupees in '000--------
51
MCB Bank Limited & Subsidiary Companies MCB Bank Limited & Subsidiary Companies
Notes To The Consolidated Condensed Interim Financial Statements (Un-audited) For The Half Year Ended June 30, 2021
Notes To The Consolidated Condensed Interim Financial Statements (Un-audited) For The Half Year Ended June 30, 2021
50
Unaudited June 30, 2021
Audited December 31,
2020
16. BILLS PAYABLE
In Pakistan 13,712,796
26,383,624
Outside Pakistan 795,678
67,889
14,508,474
26,451,513
17. BORROWINGS
Secured
Borrowings from State Bank of Pakistan
Under export refinance scheme 35,739,169
37,844,720
Under long term financing facility 22,928,390
22,596,183
Under renewable energy performance platform 1,035,699
74,760
Under payment of Wages & Salaries 9,662,331
11,789,824
Under temporary economic refinance facility 14,567,908
2,878,487
Under refinance facility for combating COVID-19 48,455
-
Under financing facility for storage of agricultural produce 167,162
191,254
84,149,114
75,375,228
Bai Muajjal 44,809,236
- Repurchase agreement borrowings 14,798,148
92,225,530
Total secured 143,756,498
167,600,758
Unsecured
Borrowings from other financial institution 262,316 1,720,341
Call borrowings 2,318,713 319,669
Overdrawn nostro accounts 655,274 368,920 Musharaka arrangements 193,515
14,405,366
Others 162,286
162,286
Total unsecured 3,592,104
16,976,582
147,348,602
184,577,340
18. DEPOSITS AND OTHER ACCOUNTS
In Local Currency
In Foreign currencies
TotalIn Local Currency
In Foreign currencies
Total
Customers
Current deposits 501,538,860
68,097,427
569,636,287
425,760,845
55,999,023
481,759,868
Savings deposits 721,439,183
45,341,982
766,781,165
689,241,146
47,759,213
737,000,359
Term deposits 119,435,457
13,129,026
132,564,483
89,353,999
14,182,837
103,536,836
Others 46,747,127
3,015,917
49,763,044
26,013,457
3,218,232
29,231,689
1,389,160,627
129,584,352
1,518,744,979
1,230,369,447
121,159,305
1,351,528,752
Financial Institutions
Current deposits 10,588,226
1,362,204
11,950,430
11,033,694
659,230
11,692,924
Savings deposits 17,153,897
298,796
17,452,693
16,530,222
117,569
16,647,791
Term deposits 5,461,468 2,358,372 7,819,840 4,557,468 4,090,613 8,648,081
Others - 198,793 198,793 - 220,413 220,413
33,203,591 4,218,165 37,421,756 32,121,384 5,087,825 37,209,209
1,422,364,218 133,802,517 1,556,166,735 1,262,490,831 126,247,130 1,388,737,961
----------Rupees in '000--------
Unaudited J une 30, 2021 Audited December 31, 2020
-----------------------------------------------Rupees in '000-----------------------------------------------

22. SURPLUS ON REVALUATION OF ASSETS
Surplus / (deficit) on revaluation of
- Available for sale securities
- Fixed Assets
- Non-banking assets acquired in satisfaction of claims
- Associated undertaking
Deferred tax on surplus / (deficit) on revaluation of:
- Available for sale securities
- Fixed Assets
- Non-banking assets acquired in satisfaction of claims
- Associated undertaking
23. CONTINGENCIES AND COMMITMENTS
-Guarantees
-Commitments
-Other contingent liabilities
23.1 Guarantees:
Financial guarantees
Performance guarantees
Other guarantees
23.2 Commitments:
Documentary credits and short-term trade-related transactions
- letters of credit
Commitments in respect of:
- forward foreign exchange contracts
- forward government securities transactions
- derivatives
- commitments to extent credit
Commitments for acquisition of:
- operating fixed assets
- intangible assets
23.2.1 Commitments in respect of forward foreign exchange contracts
Purchase
Sale
23.2.2 Commitments in respect of forward government securities transactions
Purchase
Sale
NoteUnaudited
June 30, 2021
Audited December 31,
2020
10.1 9,927,225
12,924,291
20,778,109
20,856,881
14 511,496
854,231
518,775
577,001
31,735,605
35,212,404
19 3,871,618
4,523,498
19 1,450,732
1,329,511
19 199,483
298,982
248,622
257,062
5,770,455
6,409,05325,965,150
28,803,351
23.1 191,254,813
186,572,634
23.2 524,800,624
525,404,920
23.3 29,113,010
28,397,749745,168,447
740,375,303
157,134,884
149,925,920
26,081,320
29,835,397
8,038,609
6,811,317
191,254,813
186,572,634
209,391,045 180,272,534
23.2.1 195,071,154
327,646,242
23.2.2 114,002,109
11,089,775
23.2.3 4,970,119
4,471,383
426,086
1,007,451
765,647
710,570
174,464
206,965524,800,624
525,404,920
107,726,251 172,137,589
87,344,903 155,508,653195,071,154 327,646,242
112,502,109 11,089,775
1,500,000 -114,002,109 11,089,775
----------Rupees in '000--------
52 53
MCB Bank Limited & Subsidiary Companies MCB Bank Limited & Subsidiary Companies
Notes To The Consolidated Condensed Interim Financial Statements (Un-audited) For The Half Year Ended June 30, 2021
Notes To The Consolidated Condensed Interim Financial Statements (Un-audited) For The Half Year Ended June 30, 2021
NoteUnaudited
June 30, 2021
Audited December 31,
2020
19. DEFERRED TAX LIABILITIES
Deductible Temporary Differences on
- Provision against advances (2,264,655)
(2,786,856)
- Tax losses carried forward (676,706) (772,357)
- Others (429,626) (366,547)
(3,370,987) (3,925,760) Taxable Temporary Differences on
- Surplus on revaluation of fixed assets 1,450,732 1,329,511 - Surplus/deficit on revaluation of investments 3,871,618 4,523,498 - Surplus on revaluation of non-banking assets 199,483 298,982 - Accelerated tax depreciation 2,185,212
2,054,509
- Receivable from pension fund 1,172,856
1,179,562
- Investments in associated undertaking 1,558,873
1,325,520
- Business combination 705,218
705,218 11,143,992
11,416,800
7,773,005
7,491,040
20. OTHER LIABILITIES
Mark-up/ return/ interest payable in local currency 3,857,823
2,884,255
Mark-up/ return/ interest payable in foreign currencies 135,717
254,433
Unearned commission income 697,722
252,312
Accrued expenses 5,824,344
6,888,435
Current taxation (provisions less payments) 11,339,783
10,130,229
Workers' welfare fund 20.1 9,338,947
8,838,684
Acceptances 14 21,361,862
22,747,369
Unclaimed / dividends payable 1,921,083
1,697,408
Mark to market loss on forward foreign exchange contracts 1,867,827
4,618,138
Unrealised loss on derivative financial instruments 273,411
513,343
Staff welfare fund 3,722
5,598
Provision for employees' compensated absences 1,145,701
919,407
Provision for post retirement medical benefits 2,156,504
2,004,122
Provision for employees' contributory benevolent scheme 219,007
222,084
Retention money 12,473
20,657
Insurance payable against consumer assets 665,370
698,949
Unclaimed balances 756,294
877,552
Duties and taxes payable 1,836,724
1,860,730
Charity fund balance 2,954
46,615
Provision against off-balance sheet obligations 46,210
46,188
Security deposits against lease 1,405,095
1,354,666
Lease liability against right of use assets 10,583,347
11,268,508
Clearing and settlement accounts 7,198,163
7,421,975
Others 6,273,634
5,455,501
88,923,717
91,027,158
20.1
NoteUnaudited
June 30, 2021
Audited December 31,
2020
21. RESERVES
Share premium 23,973,024
23,973,024
Non- distributable capital reserve - gain on bargain purchase option 21.1 908,317 908,317
Exchange translation reserve 2,479,383 2,950,183
Statutory reserve 21.2 36,114,728 34,628,527
General reserve 18,600,000 18,600,00082,075,452 81,060,051
----------Rupees in '000--------
Supreme Court of Pakistan vide its order dated November 10, 2016 has held that the amendments made in the lawintroduced by the Federal Government for the levy of Workers Welfare Fund were not lawful. The Federal Board ofRevenue has filed review petitions against this order which are currently pending.
Legal advice obtained on the matter indicates that consequent to filing of these review petitions the judgment may notcurrently be treated as conclusive. Accordingly, the Bank maintained its provision in respect of WWF.
----------Rupees in '000--------
21.1 Under IFRS-3 a bargain purchase represents an economic gain which should be immediately recognized by the acquirer as income. However, the amount of bargain purchase gain was not been taken to the profit and loss account as the SBP, through its letter BPRD(R&PD)/2017/14330 dated June 13, 2017 recommended that the amount of gain may be routed directly into equity as a Non-distributable Capital Reserve (NCR). The NCR may become available for distribution through a stock dividend only with prior approval of the SBP. The Group, before distribution of the gain as a stock dividend, may adjust any subsequent provisions/deficit, assessed by the Group or recommended by the Banking Inspection Department of SBP, in the acquired assets and liabilities of NIB Bank Limited against the NCR.
21.2 Statutory reserve represents amount set aside as per the requirements of section 21 of the Banking Companies Ordinance, 1962.

54 55
MCB Bank Limited & Subsidiary Companies MCB Bank Limited & Subsidiary Companies
Notes To The Consolidated Condensed Interim Financial Statements (Un-audited) For The Half Year Ended June 30, 2021
Notes To The Consolidated Condensed Interim Financial Statements (Un-audited) For The Half Year Ended June 30, 2021
23.2.3 Commitments in respect of derivatives
FX options
Purchase
Sale
Cross Currency Swaps
Purchase
Sale
1,356,125 182,800
1,356,125 182,800
2,712,250 365,600
1,090,187 1,975,311
1,167,682 2,130,472
2,257,869 4,105,783
4,970,119 4,471,383
Unaudited June 30, 2021
Audited December 31,
2020
----------Rupees in '000--------
23.2.4
NoteUnaudited
June 30, 2021
Audited December 31,
2020
23.3 Other contingent liabilities
Claims against the Group not acknowledged as debts 23.3.1 29,113,010
28,397,749
23.3.1
23.4 Taxation
23.5 Amortisation of goodwill and other intangibles amounting to Rs 28.08 billion of Ex. NIB
24. DERIVATIVE INSTRUMENTS
Notional Notional Notional
Principal Principal Principal
Total
Hedging 1,090,187
268,785
-
-
1,356,125
8,208
Market Making 1,167,682
(265,203)
-
-
1,356,125
(8,208)
Total
Hedging 1,975,311 512,508 - - 182,800 4,525Market Making 2,130,472 (508,818) - - 182,800 (4,525)
-------------------------------------------Rupees in '000-------------------------------------------
Audited December 31, 2020
-------------------------------------------Rupees in '000-------------------------------------------
Unaudited June 30, 2021
Interest Rate Swaps FX Options Cross Currency Swaps
Mark to market gain / loss
Mark to market gain / loss
Mark to market gain / loss
Issue of goodwill and other related assets amortization for few years has been assessed in Group’s favour at appellateforums during the year, however, the tax department has filed appeal against these decisions. The management has notrecorded any tax benefit because the issue has not attained finality.
For assessment year 1999-2000 through tax year 2020, the tax department disputed Group's treatment on certain issues,where the Group's appeals are pending at various appellate forums, entailing an additional tax liability of Rs. 2,400 million(2020: Rs. 6,033 million). Such issues inter alia principally include disallowance of expenses for non deduction ofwithholding tax and non availability of underlying records, provision for non performing loans, attribution of expenses toheads of income other than income from business and disallowance of credit for taxes paid in advance / deducted atsource.
The Group has filed appeals which are pending at various appellate forums. In addition, certain decisions made in favour ofthe Group are being contested by the department at higher forums. No provision has been made in these consolidatedcondensed interim financial statements regarding the aforesaid additional tax demand and already issued favourabledecisions where the department is in appeal, as the management is of the view that the issues will be decided in theGroup's favour as and when these are taken up by the Appellate Authorities.
The Group makes commitments to extend credit in the normal course of its business but these being revocablecommitments do not attract any significant penalty or expense if the facility is unilaterally withdrawn.
----------Rupees in '000--------
These mainly represent counter claims by borrowers for damages and other claims relating to banking transactions. Basedon legal advice and / or internal assessments, management is confident that the matters will be decided in the Group’sfavour and the possibility of any adverse outcome is remote. Accordingly, no provision has been made in theseconsolidated condensed interim financial statements.
Note
UnauditedHalf Year ended June 30, 2021
Unaudited Half Year ended June 30, 2020
----------Rupees in '000--------25. MARK-UP/RETURN/INTEREST EARNED
Loans and advances 19,118,798
29,887,052
Investments 43,323,374
49,453,561
Lendings to financial institutions 216,073
797,002
Balances with banks 75,186
270,974
62,733,431
80,408,589
26. MARK-UP/RETURN/INTEREST EXPENSED
Deposits 23,161,664
36,456,056
Borrowings 4,393,305
3,694,589
Cost of foreign currency swaps against
foreign currency deposits / borrowings 735,796
1,200,521
Finance charges on lease liability against right-of-use assets 710,926
804,608
29,001,691
42,155,774
27. FEE & COMMISSION INCOME
Branch banking customer fees 1,358,544
946,071
Consumer finance related fees 260,726
191,363
Card related fees (debit and credit cards) 1,428,972
1,556,444
Credit related fees 123,519
14,765
Investment banking fee 105,760
71,482
Commission on trade 720,528 665,174
Commission on guarantees 344,598 317,793
Commission on cash management 336,089 286,992 Commission on remittances including home remittances 477,768 519,685 Commission on bancassurance 789,453 498,653 Rent on lockers 123,119
106,977
Commission on utility bills 37,679
36,734
Commission on investments services 383,392
360,833
Others 120,904
85,150
6,611,051
5,658,116
28. GAIN / (LOSS) ON SECURITIES
Realised 28.1 425,062
(120,340)
Unrealised - Held For Trading 10.1 109,477
62,676
534,539
(57,664)
28.1 Realised gain / (loss) on:
Federal Government Securities 345,791
183,380
Shares and units 79,032
(315,800)
Others 239
12,080
425,062
(120,340)
29. OTHER INCOME
Rent on property 41,780
12,628
Gain on conversion of Ijarah agreements 10,762
52,549
Gain on termination of lease liability against right of use assets 106,537 -
(Loss) / Gain on sale of fixed assets - net (26,411) 18,982
Gain on sale of non-banking assets acquired in satisfaction of claims - net 536,464 -
669,132 84,159

NoteUnaudited
Half Year ended June 30, 2021
Unaudited Half Year ended June 30, 2020
31. OTHER CHARGES
Penalties of State Bank of Pakistan 351,381
183,601
VAT & National Building tax & Crop Insurance Levy 25,014
56,579
376,395
240,180
32. PROVISIONS / (REVERSALS) & WRITE OFFS - NET
Provision / (reversal) against balance with Banks 173
(1,658)
(Reversal) / provision for diminution in value of investments 10.2.1 (606,978)
200,967
(Reversal) / provision against loans and advances 11.3 (1,307,912) 3,959,032
Provision / (reversal) against other assets 14.1.1 1,009 (17,877)
Recovery of written off / charged off bad debts (86,200) (64,442) (1,999,908) 4,076,022
33. TAXATION
Current 9,563,497
10,719,826 Prior years (3,447)
(7,658)
Deferred 1,096,686
(1,437,013)
Share of tax of associates 25,881
98,110
10,682,617
9,373,265
34. BASIC AND DILUTED EARNINGS PER SHARE
Profit after tax attributable to Equity Shareholders of the Bank 14,882,830
13,425,378
Weighted average number of ordinary shares 1,185,060,006
1,185,060,006
Basic and diluted earnings per share 12.56 11.33
----------Rupees in '000--------
----------Rupees in '000--------
----------Number--------
----------Rupees-------
56 57
MCB Bank Limited & Subsidiary Companies MCB Bank Limited & Subsidiary Companies
Notes To The Consolidated Condensed Interim Financial Statements (Un-audited) For The Half Year Ended June 30, 2021
Notes To The Consolidated Condensed Interim Financial Statements (Un-audited) For The Half Year Ended June 30, 2021
UnauditedHalf Year ended June 30, 2021
Unaudited Half Year ended June 30, 2020
30. OPERATING EXPENSES
Total compensation expense 9,759,911
9,151,578
Property expense
Rent and taxes 112,346
116,291
Insurance 33,052
29,563
Utilities cost 622,890
552,665
Security (including guards) 792,336
717,700
Repair and maintenance (including janitorial charges) 374,900
360,166
Depreciation on right-of-use assets 868,303
820,537
Depreciation 474,450
403,281
Fuel expense generators 185,700
156,053
3,463,977
3,156,256
Information technology expenses
Software maintenance 659,035
657,788
Hardware maintenance 95,260
186,999
Depreciation 356,741
336,149
Amortization 244,454
227,611
Network charges 338,953
361,367
Insurance 3,572
3,070
1,698,015 1,772,984
Other operating expenses
Directors' fees and allowances 24,630 21,956 Remuneration to shariah board members 5,501 5,080 Legal and professional charges 171,534 167,249 Outsourced services costs 423,893
437,240
Travelling and conveyance 140,470
146,697
NIFT clearing charges 88,802
95,164 Depreciation 421,739
450,718
Depreciation on non-banking assets acquired in satisfaction of claims 18,721
15,675
Training and development 13,080
15,898
Postage and courier charges 130,345
166,202
Communication 189,573
167,607
Stationery and printing 316,903
296,161
Marketing, advertisement & publicity 305,743
344,796
Donations 6,600
112,596
Auditors' remuneration 38,132
21,730
Cash transportation charges 413,523
338,437
Repair and maintenance 221,191
165,693
Subscription 19,093
21,603
Entertainment 117,267
100,963
Remittance charges 95,691
95,524
Brokerage expenses 35,942
23,419
Card related expenses 475,423
419,694
CNIC verification charges 106,385
53,129
Insurance 891,560 788,743
Others 137,608 130,942
4,809,349 4,602,916
19,731,252 18,683,734
----------Rupees in '000--------

58 59
MCB Bank Limited & Subsidiary Companies MCB Bank Limited & Subsidiary Companies
35. FAIR VALUE MEASUREMENTS
35.1
Level 1:
Level 2:
Level 3:
(a) Financial instruments in level 1
(b) Financial instruments in level 2
(c) Financial instruments in level 3
Term Finance and Bonds
Item
The fair values of Federal Government securities are determined using the PKRV rates.
Valuation approach and input used
Federal Governmentsecurities
Financial instruments included in level 1 comprise of investments in listed ordinary shares and units of mutual funds.
Currently, no financial instruments are classified in level 3.
Foreign exchange contracts
Derivatives
Operating fixed assets andNon-banking assetsacquired in satisfaction ofclaims
The fair value of traded investments is based on quoted market prices, except for tradable securities classified by the Group as 'held to maturity'. Quoted securities classified as held to maturity are carried at amortised cost. Fair value of unquoted equity investments other than investments in associates is determined on the basis of break up value of these investments as per the latest available financial statements.
The Group measures fair values using the following fair value hierarchy that reflects the significance of the inputs used in making the measurements:
Fair value measurements using quoted prices (unadjusted) in active markets for identical assets or liabilities.
Fair value measurements using inputs other than quoted prices included within Level 1 that are observable for the assets or liability, either directly (i.e. as prices) or indirectly (i.e. derived from prices).
Fair value measurements using input for the asset or liability that are not based on observable market data (i.e. unobservable inputs).
Investments in debt securities (comprising term finance certificates, bonds and any other security issued by a company or a body corporate for the purpose of raising funds in the form of redeemable capital) are valued on the basis of the rates announced by the Mutual Funds Association of Pakistan (MUFAP) in accordance with the methodology prescribed by the Securities and Exchange Commission of Pakistan.
The valuation has been determined by interpolating the mid rates announced by the State Bank of Pakistan.
The fair values of derivatives which are not quoted in active markets are determined by using valuation techniques. The valuation techniques take into account the relevant underlying parameters including foreign currency involved, interest rates, yield curves, volatilities, contracts duration etc.
Land, buildings and non-banking assets acquired in satisfaction of claims are revalued on a periodic basis using professional valuers. The valuation is based on their assessment of the market value of the assets. The effect of changes in the unobservable inputs used in the valuations cannot be determined with certainty. Accordingly, a qualitative disclosure of sensitivity has not been presented in these consolidated financial statements.
The Group's policy is to recognise transfers into and out of the different fair value hierarchy levels at the date the event or change in circumstances that caused the transfer occurred. There were no transfers between levels 1 and 2 during the period.
Financial instruments included in level 2 comprise of Sukuk Bonds, Pakistan Investment Bonds, Market Treasury Bills, Term Finance certificates, FX options, Cross Currency Swaps, Interest Rate Swaps and Forward Exchange Contracts.
Fair value of fixed term loans, other assets, other liabilities, fixed term deposits and borrowings cannot be calculated with sufficient reliability due to absence of current and active market for such assets and liabilities and reliable data regarding market rates for similar instruments.
In the opinion of the management, the fair value of the financial assets and financial liabilities are not significantly different from their carrying values since assets and liabilities are either short-term in nature or re-priced over short term.
Fair value of financial assets
Valuation techniques used in determination of fair valuation of financial instruments within level 2
Notes To The Consolidated Condensed Interim Financial Statements (Un-audited) For The Half Year Ended June 30, 2021
Notes To The Consolidated Condensed Interim Financial Statements (Un-audited) For The Half Year Ended June 30, 2021
The table below analyses the financial and non-financial assets carried at fair values, by valuation methods. For financial assets, the Group essentially carries its investments in debt and equity securities at fair values. Valuation of investments is carried out as per guidelines specified by the SBP. In case of non-financial assets, the Group has adopted revaluation model (as per IAS 16) in respect of land and building.
Unaudited June 30, 2021
Carrying / Notional Value
Level 1 Level 2 Level 3Total
On balance sheet financial instruments
Financial assets - measured at fair value
Investments
Federal Government Securities 1,044,111,328
-
1,044,111,328
-
1,044,111,328
Shares 25,372,673
25,372,673
-
-
25,372,673
Non-Government Debt Securities 2,841,242
2,841,242
-
2,841,242
Foreign Securities 6,248,375
-
6,248,375
-
6,248,375
Financial assets - disclosed but notmeasured at fair value
40,436,773
-
-
-
-
Cash and balances with treasury banks 152,246,891
-
-
-
-
Balances with other banks 20,651,751
-
-
-
-
Lendings to financial institutions 33,494,214
-
-
-
-
Advances 544,884,427
-
-
-
-
Other assets -
-
-
-
-
Non - Financial Assets measured at fair value
Operating fixed assets (land and buildings) 44,172,826 - 44,172,826 - 44,172,826 Non-banking assets 3,046,477 - 3,046,477 - 3,046,477 Off-balance sheet financial instruments- measured at fair value
Forward purchase of foreign exchange 107,726,251
-
2,248,549
-
2,248,549
Forward sale of foreign exchange 87,344,903
-
1,867,827
-
1,867,827
Derivatives purchase 2,446,312
-
276,993
-
276,993
Derivatives sale 2,523,807
-
273,411
-
273,411
Audited D ecember 31, 2020
Carrying / Notional Value
Level 1 Level 2 Level 3Total
On balance sheet financial instruments
Financial assets - measured at fair value
Investments
Federal Government Securities 979,926,866
-
979,926,866
-
979,926,866
Shares 20,510,813
20,510,813
-
-
20,510,813
Non-Government Debt Securities 2,858,620
-
2,858,620
-
2,858,620
Foreign Securities 7,474,190
-
7,474,190
-
7,474,190
Financial assets - disclosed but not measured at fair value -
25,447,046
-
-
-
-
Cash and balances with treasury banks 132,053,041
-
-
-
-
Balances with other banks 29,011,521
-
-
-
-
Lendings to financial institutions 17,968,243
-
-
-
-
Advances 547,685,708
-
-
-
-
Other assets 52,518,097
-
-
-
-
Non - Financial Assets measured at fair value
Operating fixed assets (land and buildings) 45,595,081
-
45,595,081
-
45,595,081
Non-banking assets 4,036,914
-
4,036,914
-
4,036,914
-
Off-balance sheet financial instruments- measured at fair value -
-
Forward purchase of foreign exchange 172,137,589 - 4,011,602 - 4,011,602
Forward sale of foreign exchange 155,508,653 - 4,240,748 - 4,240,748
Derivatives purchase 2,158,111 - 517,033 - 517,033
Derivatives sale 2,313,272 - 513,343 - 513,343
------------------------------------------Rupees in '000--------------------------------------
Investments (HTM, AFS, unlisted ordinary shares and associates)
Investments (HTM, AFS, unlisted ordinary shares,and associates)
------------------------------------------Rupees in '000--------------------------------------
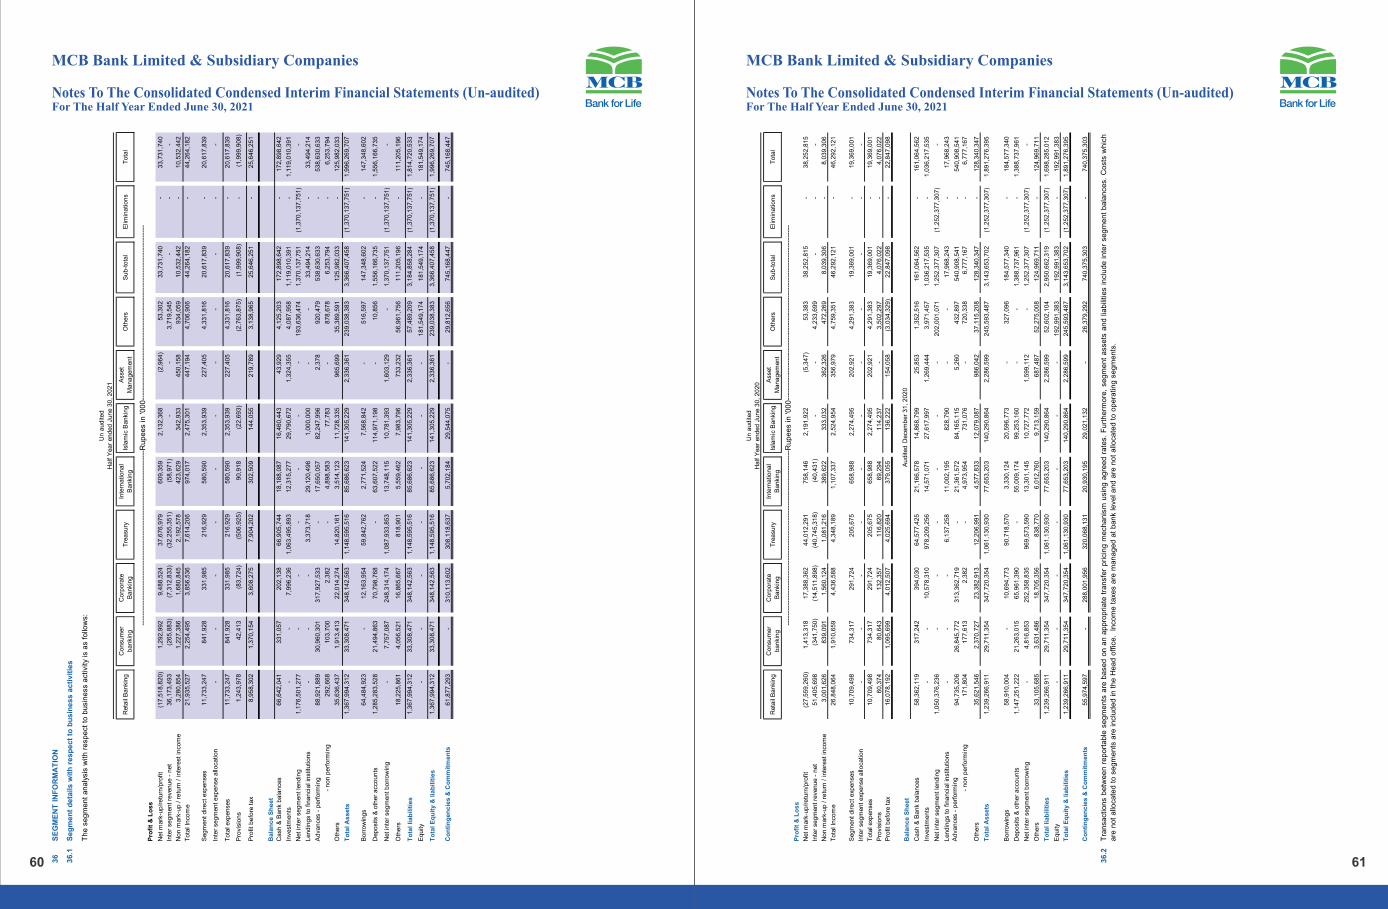
60 61
MCB Bank Limited & Subsidiary Companies MCB Bank Limited & Subsidiary Companies
Notes To The Consolidated Condensed Interim Financial Statements (Un-audited) For The Half Year Ended June 30, 2021
Notes To The Consolidated Condensed Interim Financial Statements (Un-audited) For The Half Year Ended June 30, 2021
36
SE
GM
EN
T IN
FO
RM
AT
ION
36.1
Seg
men
t d
eta
ils w
ith
resp
ect
to b
usin
ess a
cti
vit
ies
The s
egm
ent
analy
sis
with r
espect
to b
usin
ess a
ctivity
is a
s f
ollo
ws:
Reta
il B
anki
ng
Consu
mer
banki
ng
Corp
ora
te
Bankin
gT
reasu
ryIn
tern
atio
nal
Banki
ng
Isla
mic
Banki
ng
Ass
et
Managem
ent
Oth
ers
Sub-t
ota
lE
limin
ations
Tota
l
Pro
fit
& L
oss
Net m
ark
-up/r
etu
rn/p
rofit
(17,5
18,8
20)
1,2
92,9
92
9,4
88,5
24
37,6
76,9
79
609,3
59
2,1
32,3
68
(2,9
64)
53,3
02
33,7
31,7
40
-
33,7
31,7
40
Inte
r se
gm
ent re
venue -
net
36,1
73,4
93
(2
65,8
83)
(7
,312,8
33)
(32,2
55,3
51)
(5
8,9
71)
-
-
3,7
19,5
45
-
-
-
Non m
ark
-up / r
etu
rn / i
nte
rest
inco
me
3,2
80,8
54
1,2
27,3
86
1,6
80,8
45
2,1
92,5
78
423,6
29
342,9
33
450,1
58
934,0
59
10,5
32,4
42
-
10,5
32,4
42
Tota
l Inco
me
21,9
35,5
27
2,2
54,4
95
3,8
56,5
36
7,6
14,2
06
974,0
17
2,4
75,3
01
447,1
94
4,7
06,9
06
44,2
64,1
82
-
44,2
64,1
82
Segm
ent dire
ct e
xpense
s11,7
33,2
47
841,9
28
331,9
85
216,9
29
580,5
90
2,3
53,9
39
227,4
05
4,3
31,8
16
20,6
17,8
39
-
20,6
17,8
39
Inte
r se
gm
ent exp
ense
allo
catio
n-
-
-
-
-
-
-
-
-
-
-
Tota
l exp
ense
s11,7
33,2
47
841,9
28
331,9
85
216,9
29
580,5
90
2,3
53,9
39
227,4
05
4,3
31,8
16
20,6
17,8
39
-
20,6
17,8
39
Pro
visi
ons
1,2
43,9
78
42,4
13
(83,7
24)
(506,9
25)
90,9
18
(22,6
93)
(2,7
63,8
75)
(1,9
99,9
08)
-
(1,9
99,9
08)
Pro
fit b
efo
re tax
8,9
58,3
02
1,3
70,1
54
3,6
08,2
75
7,9
04,2
02
302,5
09
144,0
55
219,7
89
3,1
38,9
65
25,6
46,2
51
-
25,6
46,2
51
Bala
nce S
heet
Cash
& B
ank
bala
nce
s66,6
42,0
41
331,0
57
202,1
38
66,9
05,7
44
18,1
88,0
87
16,4
60,4
43
43,9
29
4,1
25,2
03
172,8
98,6
42
-
172,8
98,6
42
Inve
stm
ents
-
-
7,9
96,2
36
1,0
63,4
95,8
93
12,3
15,2
77
29,7
90,6
72
1,3
24,3
55
4,0
87,9
58
1,1
19,0
10,3
91
-
1,1
19,0
10,3
91
Net in
ter
segm
ent le
ndin
g1,1
76,5
01,2
77
-
-
--
--
193,6
36,4
74
1,3
70,1
37,7
51
(1,3
70,1
37,7
51)
-
Lendin
gs
to fin
anci
al in
stitu
tions
-
-
-
3,3
73,7
18
29,1
20,4
96
1,0
00,0
00
-- -
33,4
94,2
14
-
33,4
94,2
14
Adva
nce
s -
perf
orm
ing
88,9
21,8
89
30,9
60,3
01
317,9
27,5
33
-
17,6
50,0
57
82,2
47,9
96
2,3
78
920,4
79
538,6
30,6
33
-
538,6
30,6
33
- non p
erf
orm
ing
292,6
68
103,7
00
2,3
82
-
4,8
98,5
83
77,7
83
878,6
78
6,2
53,7
94
-
6,2
53,7
94
Oth
ers
35,6
36,4
37
1,9
13,4
13
22,0
14,2
74
14,8
20,1
61
3,5
14,1
23
11,7
28,3
35
965,6
99
35,3
89,5
91
125,9
82,0
33
-
125,9
82,0
33
To
tal A
ssets
1,3
67,9
94,3
12
33,3
08,4
71
348,1
42,5
63
1,1
48,5
95,5
16
85,6
86,6
23
141,3
05,2
29
2,3
36,3
61
239,0
38,3
83
3,3
66,4
07,4
58
(1,3
70,1
37,7
51)
1,9
96,2
69,7
07
Borr
ow
ings
64,4
84,9
23
-
12,1
63,9
54
59,8
42,7
62
2,7
71,5
24
7,5
68,8
42
516,5
97
147,3
48,6
02
-
147,3
48,6
02
Deposi
ts &
oth
er
acc
ounts
1,2
85,2
83,5
28
21,4
94,8
63
70,7
98,7
68
-
63,6
07,5
22
114,9
71,1
98
10,8
56
1,5
56,1
66,7
35
-
1,5
56,1
66,7
35
Net in
ter
segm
ent borr
ow
ing
- --
--
--
-
7,7
57,0
87
248,3
14,1
74
1,0
87,9
33,8
53
13,7
48,1
15
10,7
81,3
93
1,6
03,1
29
-
1,3
70,1
37,7
51
(1,3
70,1
37,7
51)
-
Oth
ers
18,2
25,8
61
4,0
56,5
21
16,8
65,6
67
818,9
01
5,5
59,4
62
7,9
83,7
96
733,2
32
56,9
61,7
56
111,2
05,1
96
-
111,2
05,1
96
To
tal liab
ilit
ies
1,3
67,9
94,3
12
33,3
08,4
71
348,1
42,5
63
1,1
48,5
95,5
16
85,6
86,6
23
141,3
05,2
29
2,3
36,3
61
57,4
89,2
09
3,1
84,8
58,2
84
(1,3
70,1
37,7
51)
1,8
14,7
20,5
33
Equity
181,5
49,1
74
181,5
49,1
74
-
181,5
49,1
74
To
tal E
qu
ity &
lia
bilit
ies
1,3
67,9
94,3
12
33,3
08,4
71
348,1
42,5
63
1,1
48,5
95,5
16
85,6
86,6
23
141,3
05,2
29
2,3
36,3
61
239,0
38,3
83
3,3
66,4
07,4
58
(1,3
70,1
37,7
51)
1,9
96,2
69,7
07
Co
nti
ng
en
cie
s &
Co
mm
itm
en
ts61,8
77,2
93
-
310,1
13,6
02
308,1
18,6
37
5,7
02,1
84
29,5
44,0
75
29,8
12,6
56
745,1
68,4
47
-
745,1
68,4
47
Un a
udite
d
Half
Year
ended J
une 3
0, 2021
----
----
----
----
----
----
----
----
----
----
----
----
----
----
----
----
----
--R
upees in '0
00--
----
----
----
----
----
----
----
----
----
----
----
----
----
----
----
----
----
Reta
il B
anki
ng
Consu
mer
banki
ng
Corp
ora
te
Bankin
gT
reasu
ryIn
tern
atio
nal
Banki
ng
Isla
mic
Banki
ng
Ass
et
Managem
ent
Oth
ers
Sub-t
ota
lE
limin
ations
Tota
l
Pro
fit
& L
oss
Net m
ark
-up/r
etu
rn/p
rofit
(27,5
59,2
60)
1,4
13,3
18
17,3
88,3
62
44,0
12,2
91
758,1
46
2,1
91,9
22
(5,3
47)
53,3
83
38,2
52,8
15
-
38,2
52,8
15
Inte
r se
gm
ent re
venue -
net
51,4
05,6
98
(3
41,7
50)
(1
4,5
11,8
98)
(4
0,7
45,3
18)
(4
0,4
31)
-
-
4,2
33,6
99
-
-
-
Non m
ark
-up / r
etu
rn / i
nte
rest
inco
me
3,0
01,6
26
839,0
91
1,5
60,1
24
1,0
81,2
16
389,6
22
333,0
32
362,3
26
472,2
69
8,0
39,3
06
-
8,0
39,3
06
Tota
l Inco
me
26,8
48,0
64
1,9
10,6
59
4,4
36,5
88
4,3
48,1
89
1,1
07,3
37
2,5
24,9
54
356,9
79
4,7
59,3
51
46,2
92,1
21
-
46,2
92,1
21
Segm
ent dire
ct e
xpense
s10,7
09,4
98
734,3
17
291,7
24
205,6
75
658,9
88
2,2
74,4
95
202,9
21
4,2
91,3
83
19,3
69,0
01
-
19,3
69,0
01
Inte
r se
gm
ent exp
ense
allo
catio
n-
-
-
-
-
-
-
-
-
-
-
Tota
l exp
ense
s10,7
09,4
98
734,3
17
291,7
24
205,6
75
658,9
88
2,2
74,4
95
202,9
21
4,2
91,3
83
19,3
69,0
01
-
19,3
69,0
01
Pro
visi
ons
60,3
74
80,6
43
132,3
57
116,8
20
69,2
94
114,2
37
-
3,5
02,2
97
4,0
76,0
22
-
4,0
76,0
22
Pro
fit b
efo
re tax
16,0
78,1
92
1,0
95,6
99
4,0
12,5
07
4,0
25,6
94
379,0
55
136,2
22
154,0
58
(3,0
34,3
29)
22,8
47,0
98
-
22,8
47,0
98
Bala
nce S
heet
Cash
& B
ank
bala
nce
s58,3
62,1
19
317,2
42
394,0
30
64,5
77,4
25
21,1
66,5
78
14,8
68,7
99
25,8
53
1,3
52,5
16
161,0
64,5
62
-
161,0
64,5
62
Inve
stm
ents
-
-
10,5
78,3
10
978,2
09,2
56
14,5
71,0
71
27,6
17,9
97
1,2
69,4
44
3,9
71,4
57
1,0
36,2
17,5
35
-
1,0
36,2
17,5
35
Net in
ter
segm
ent le
ndin
g1,0
50,3
76,2
36
-
-
-
-
-
-
202,0
01,0
71
1,2
52,3
77,3
07
(1,2
52,3
77,3
07)
-
Lendin
gs
to fin
anci
al in
stitu
tions
-
-
-
6,1
37,2
58
11,0
02,1
95
828,7
90
-
-
17,9
68,2
43
-
17,9
68,2
43
Adva
nce
s -
perf
orm
ing
94,7
35,2
06
26,8
45,7
72
313,3
62,7
19
-
21,3
61,5
72
84,1
65,1
15
5,2
60
432,8
97
540,9
08,5
41
-
540,9
08,5
41
- non p
erf
orm
ing
171,8
04
177,6
13
2,3
82
-
4,9
73,9
54
731,0
76
-
720,3
38
6,7
77,1
67
-
6,7
77,1
67
Oth
ers
35,6
21,5
46
2,3
70,7
27
23,3
82,9
13
12,2
06,9
91
4,5
77,8
33
12,0
79,0
87
986,0
42
37,1
15,2
08
128,3
40,3
47
-
128,3
40,3
47
To
tal A
ssets
1,2
39,2
66,9
11
29,7
11,3
54
347,7
20,3
54
1,0
61,1
30,9
30
77,6
53,2
03
140,2
90,8
64
2,2
86,5
99
245,5
93,4
87
3,1
43,6
53,7
02
(1,2
52,3
77,3
07)
1,8
91,2
76,3
95
Borr
ow
ings
58,9
10,0
04
-
10,6
94,7
73
90,7
18,5
70
3,3
30,1
24
20,5
96,7
73
-
327,0
96
184,5
77,3
40
-
184,5
77,3
40
Deposi
ts &
oth
er
acc
ounts
1,1
47,2
51,2
22
21,2
63,0
15
65,9
61,3
90
-
55,0
09,1
74
99,2
53,1
60
-
-
1,3
88,7
37,9
61
-
1,3
88,7
37,9
61
Net in
ter
segm
ent borr
ow
ing
-
4,8
16,8
53
252,3
58,8
35
969,5
73,5
90
13,3
01,1
45
10,7
27,7
72
1,5
99,1
12
-
1,2
52,3
77,3
07
(1,2
52,3
77,3
07)
-
Oth
ers
33,1
05,6
85
3,6
31,4
86
18,7
05,3
56
838,7
70
6,0
12,7
60
9,7
13,1
59
687,4
87
52,2
75,0
08
124,9
69,7
11
-
124,9
69,7
11
To
tal liab
ilit
ies
1,2
39,2
66,9
11
29,7
11,3
54
347,7
20,3
54
1,0
61,1
30,9
30
77,6
53,2
03
140,2
90,8
64
2,2
86,5
99
52,6
02,1
04
2,9
50,6
62,3
19
(1,2
52,3
77,3
07)
1,6
98,2
85,0
12
Equity
-
-
-
-
-
-
-
192,9
91,3
83
192,9
91,3
83
-
192,9
91,3
83
To
tal E
qu
ity &
lia
bilit
ies
1,2
39,2
66,9
11
29,7
11,3
54
347,7
20,3
54
1,0
61,1
30,9
30
77,6
53,2
03
140,2
90,8
64
2,2
86,5
99
245,5
93,4
87
3,1
43,6
53,7
02
(1,2
52,3
77,3
07)
1,8
91,2
76,3
95
Co
nti
ng
en
cie
s &
Co
mm
itm
en
ts55,9
74,5
97
-
288,0
01,9
56
320,0
68,1
31
20,9
30,1
95
29,0
21,1
32
-
26,3
79,2
92
740,3
75,3
03
-
740,3
75,3
03
36.2
Audite
d D
ece
mber
31, 2020
Tra
nsactions
betw
een
report
able
segm
ents
are
based
on
an
appro
priate
transfe
rpricin
gm
echanis
musin
gagre
ed
rate
s.
Furt
herm
ore
,segm
ent
assets
and
liabili
ties
inclu
de
inte
rsegm
ent
bala
nces.
Costs
whic
hare
not
allo
cate
d t
o s
egm
ents
are
inclu
ded in t
he H
ead o
ffic
e.
Incom
e t
axe
s a
re m
anaged a
t bank
level and a
re n
ot
allo
cate
d t
o o
pera
ting s
egm
ents
.
Un a
udite
d
Half
Year
ended J
une 3
0, 2020
----
----
----
----
----
----
----
----
----
----
----
----
----
----
----
----
----
--R
upees in '0
00--
----
----
----
----
----
----
----
----
----
----
----
----
----
----
----
----
----
---

62 63
MCB Bank Limited & Subsidiary Companies MCB Bank Limited & Subsidiary Companies
Notes To The Consolidated Condensed Interim Financial Statements (Un-audited) For The Half Year Ended June 30, 2021
Notes To The Consolidated Condensed Interim Financial Statements (Un-audited) For The Half Year Ended June 30, 2021
37RE
LATE
D PA
RTY
TRAN
SACT
IONS
Dire
ctors
Key
M
anag
emen
t Pe
rson
nel
Ass
ociat
es
Oth
er R
elate
d Pa
rties
Di
recto
rs K
ey
Man
agem
ent
Pers
onne
l A
ssoc
iates
O
ther
Rela
ted
Parti
es
Inve
stm
ents
Open
ing b
alanc
e-
-
4,47
9,36
0
254,
253
-
-
4,27
5,65
8
254,
253
Equ
ity m
etho
d ad
justm
ents
-
-
221,
498
-
-
-
203,
702
-
Clos
ing b
alanc
e-
-
4,70
0,85
8
254,
253
-
-
4,47
9,36
0
254,
253
Prov
isio
n fo
r dim
inut
ion
in v
alue
of i
nves
tmen
ts-
-
-
5,00
0
-
-
-
5,00
0
Adva
nces
Open
ing b
alanc
e1,
042
16
6,75
7
356,
898
152,
147
1,
722
129,
048
-
339,
520
Addit
ion /
exch
ange
adju
stmen
t dur
ing th
e pe
riod
/ yea
r7,
250
26,7
14
-
305,
457
18
,202
60,2
57
356,
898
336,
695
Repa
id / e
xcha
nge
adjus
tmen
t dur
ing th
e pe
riod
/ yea
r(7
,103
)
(38,
144)
(89,
225)
(417
,191
)
(18,
882)
(21,
947)
-
(303
,183
)
Tran
sfer i
n / (o
ut)-
(24,
462)
-
-
-
(601
)
-
(220
,885
)
Clos
ing b
alanc
e1,
189
13
0,86
5
267,
673
40,4
13
1,
042
166,
757
356,
898
152,
147
Prov
ision
held
aga
inst a
dvan
ces
-
-
-
-
-
-
-
-
------
------
------
------
------
------
------
------
------
------
------
--(Ru
pees
in '0
00)--
------
------
------
------
------
------
------
------
------
------
------
-
The
Gro
up ha
s rela
ted
party
relat
ionsh
ip wi
th its
ass
ociat
es, e
mplo
yee
bene
fit pla
ns, it
s dire
ctors
and
key m
anag
emen
t per
sonn
el an
d th
eir cl
ose
fam
ily m
embe
rs.
The
Grou
pen
ters
into
trans
actio
nswi
thre
lated
parti
esin
the
ordin
aryc
ours
eof
busin
essa
ndon
subs
tant
ially
the
sam
ete
rmsa
sfor
com
para
bletra
nsac
tions
with
pers
onof
simila
rsta
nding
.Con
tribu
tions
toan
dac
crua
lsin
resp
ecto
fsta
ffre
tirem
entb
enef
itsan
dot
herb
enef
itpla
nsar
em
ade
inac
cord
ance
with
the
actua
rialv
aluat
ions
/ter
ms
ofth
eco
ntrib
ution
plan.
Rem
uner
ation
toth
eex
ecut
ives
/offic
ers
isde
term
ined
inac
cord
ance
with
the
term
s of t
heir
appo
intm
ent.
Det
ails o
f tra
nsac
tions
with
relat
ed p
artie
s dur
ing th
e pe
riod,
othe
r tha
n tho
se w
hich h
ave
been
disc
losed
else
wher
e in
thes
e co
nsoli
date
d co
nden
sed
inter
im fin
ancia
l sta
tem
ents
are
as fo
llows
:
Unau
dited
June
30,
202
1Au
dited
Dec
embe
r 31,
202
0
Dire
ctor
s K
ey
Man
agem
ent
Pers
onne
l A
ssoc
iate
s O
ther
Rel
ated
Pa
rties
D
irect
ors
Key
M
anag
emen
t Pe
rson
nel
Ass
ocia
tes
Oth
er R
elat
ed
Parti
es
Oth
er A
sset
s
Mar
kup
rece
ivab
le-
2,43
0
693
1,63
7
-
3,14
9
895
2,38
2
Adva
nces
, dep
osits
, adv
ance
rent
and
oth
er p
repa
ymen
ts-
-
184,
941
28,9
87
-
-
310,
504
27
,835
Rec
eiva
ble
from
Pen
sion
Fun
d-
-
-
3,00
7,32
6
-
-
-
3,37
0,17
9
Unr
ealiz
ed (l
oss)
/ gai
n on
forw
ard
fore
ign
exch
ange
con
tract
s -
outs
tand
ing
-
-
-
-
-
-
-
-
Prov
isio
n he
ld a
gain
st o
ther
ass
ets
-
-
-
-
-
-
-
-
Bor
row
ings
Ope
ning
bal
ance
-
-
-
77,1
39
-
-
-
69,1
66
Borr
owin
gs /
exch
ange
adj
ustm
ent d
urin
g th
e pe
riod
/ yea
r-
-
-
13,6
77
-
-
-
7,97
3
Clo
sing
bal
ance
-
-
-
90,8
16
-
-
-
77,1
39
Dep
osits
and
oth
er a
ccou
nts
Ope
ning
bal
ance
302,
130
138,
566
4,81
5,78
0
4,86
9,94
1
602,
381
140,
761
3,65
7,55
2
4,17
9,84
9
Rec
eive
d du
ring
the
perio
d / y
ear
2,29
6,86
2
756,
353
26,5
19,4
01
58,6
04,3
96
669,
282
1,18
9,43
7
44,6
28,2
06
76,3
75,9
87
With
draw
n du
ring
the
perio
d / y
ear
(2,1
21,1
48)
(720
,088
)
(27,
291,
714)
(50,
146,
921)
(969
,533
)
(1,1
63,8
32)
(43,
469,
978)
(75,
154,
115)
Tran
sfer
in /
(out
) - n
et-
(701
)
-
27
-
(27,
800)
-
(531
,780
)
Clo
sing
bal
ance
477,
844
174,
130
4,04
3,46
7
13,3
27,4
43
302,
130
138,
566
4,81
5,78
0
4,86
9,94
1
Oth
er L
iabi
litie
s
Mar
kup
paya
ble
112
690
5,52
1
3,03
1
50
100
42,5
49
10,6
54
Accr
ued
expe
nses
and
oth
er p
ayab
le-
-
61,0
46
20
-
-
62,6
24
32
Paya
ble
to M
CB
Empl
oyee
Sec
urity
Ser
vice
s-
-
-
29,4
05
-
-
-
27,0
31
Adva
nce
rece
ived
aga
inst
sal
e of
pro
perty
-
-
-
-
-
-
-
-
Con
tinge
ncie
s an
d C
omm
itmen
ts
Lette
r of C
redi
t-
-
-
3,66
0,28
9
-
-
-
1,36
1,77
6
Forw
ard
fore
ign
exch
ange
con
tract
s (N
otio
nal)
-
-
-
-
-
-
-
-
Bank
gua
rant
ee-
-
10,3
90
494,
360
-
-
10,5
12
394,
495
Una
udite
d Ju
ne 3
0, 2
021
Audi
ted
Dec
embe
r 31,
202
0
----
----
----
----
----
----
----
----
----
----
----
----
----
----
----
----
----
--(R
upe
es in
'000
)---
----
----
----
----
----
----
----
----
----
----
----
----
----
----
----
----
----
----
--

64 65
MCB Bank Limited & Subsidiary Companies MCB Bank Limited & Subsidiary Companies
Notes To The Consolidated Condensed Interim Financial Statements (Un-audited) For The Half Year Ended June 30, 2021
Notes To The Consolidated Condensed Interim Financial Statements (Un-audited) For The Half Year Ended June 30, 2021
Direct
ors
Key
Mana
gem
ent
P
ers
onn
el
Ass
oci
ate
s O
ther
Rela
ted
Part
ies
Direct
ors
Key
Mana
gem
ent
P
ers
onn
el
Ass
oci
ate
s O
ther
Rela
ted
Part
ies
Inco
me
Mark
up / r
etu
rn /
inte
rest
earn
ed
23
7,9
85
1,4
91
3,9
17
-
6,7
05
15
11,2
29
Fee a
nd c
om
mis
sion in
com
e-
-
424,9
67
2,0
97
-
-
418,8
58
836
Div
idend
inco
me
-
-
87,5
00
50,6
45
-
-
105,0
00
7
,933
Gain
/ (
loss
) on
forw
ard
fore
ign
exc
hang
e c
ont
ract
s m
atu
red d
uring
the
period
-
-
-
17,6
09
-
-
-
43,0
62
Net g
ain
/ (
loss
) on s
ale
of
secu
ritie
s3
-
32
210
72
33
495
3,5
53
Gain
on
sale
of fix
ed a
ssets
-
72
-
-
-
17
-
-
Rent
inco
me
-
-
5,6
85
1,1
40
-
-
4,4
55
1,1
40
Exp
en
se
Mark
up / r
etu
rn /
inte
rest
exp
ens
ed
8,9
27
1,4
87
61,7
27
187,4
76
22,7
74
1,2
02
110,4
21
108,4
78
-
-
-
-
-
-
-
-O
ther
Op
era
tin
g e
xp
en
ses
Cle
aring
exp
ense
s paid
to N
IFT
-
-
-
76,3
83
-
-
-
82,6
32
Cont
ributio
n to
pro
vident
fun
d-
-
-
216,8
47
-
-
-
197,2
39
Rent
exp
ens
es
-
-
21,6
88
23,2
63
-
-
21,2
99
15,1
21
Cash
sort
ing
exp
ense
s-
-
-
5
4,5
62
-
-
-
56,4
15
Sta
tione
ry e
xpens
es
-
-
-
128,4
24
-
-
-
121,2
04
Secu
rity
gua
rds
exp
ens
es
-
-
-
173,8
29
-
-
-
165,3
24
Rem
unera
tion to k
ey
exe
cutiv
es
and
non-
exe
cutiv
e d
irect
ors
fee
114,4
83
326,6
33
-
-
108,4
75
328,0
36
-
-
Out
sour
cing
serv
ice e
xpense
s-
-
106,2
73
-
-
-
138,3
01
-
Dona
tion
dur
ing
the
year
-
-
-
-
-
-
-
95,0
00
E-d
ivid
end
pro
cess
ing
fee a
nd C
DC
cha
rges
-
-
-
3,1
00
-
-
-
2,6
38
Tra
velli
ng E
xpense
s-
-
-
22,6
81
-
-
-
17,4
56
Hote
l sta
y exp
ense
s-
-
-
63
-
-
-
3,1
10
Repair &
Main
tena
nce C
harg
es
-
-
-
1,0
63
-
-
-
938
Adve
rtis
em
ent E
xpens
es
-
-
-
-
-
-
-
6,2
64
Mis
cella
neous
exp
ens
es
and
paym
ent
s-
-
-
1,1
43
-
-
-
889
Insu
ranc
e p
rem
ium
-net
of
refu
nd-
-
240,3
93
-
-
-
270,3
75
-
Insu
ranc
e c
laim
settle
d-
-
11,7
41
-
-
-
18,2
32
-
Oth
er
Tra
nsacti
on
s
Pro
ceeds
from
sale
of
fixed a
ssets
-
72
-
-
-
18
-
-
Purc
hase
of fix
ed a
ssets
-
-
14,6
24
12,8
10
-
-
3,2
77
-
Sale
of fo
reig
n cu
rrenc
y-
-
-
-
-
-
-
-
Purc
hase
of fo
reig
n cu
rrenc
y-
-
-
-
-
-
-
-
Paym
ent
s ag
ain
st h
om
e r
em
ittance
s-
-
-
-
-
-
-
-
Reim
bur
sem
ent
of
oth
er
exp
ens
es
-
-
-
-
-
-
-
-
Sale
of g
ove
rnm
ent
secu
ritie
s396,1
65
4,1
31
4,3
03,6
68
2,8
09,3
22
188,8
84
64,7
84
3,1
54,6
45
1,7
18,0
66
Purc
hase
of g
ove
rnm
ent
secu
ritie
s-
-10,8
42,1
26
2,4
63,2
78
19,8
27
-631,7
12
546,8
00
Forw
ard
exc
hang
e c
ont
ract
s m
atu
red d
urin
g t
he p
eriod
--
-2,8
38,2
28
--
-10,4
94,1
50
The
Chairm
an
has
been
pro
vided
with
free
use
of
the
Gro
up's
main
tain
ed
car.
The
Chi
ef
Exe
cutiv
eand
cert
ain
exe
cutiv
es
are
pro
vided
with
free
use
of
the
Gro
up's
main
tain
ed
cars
and
hous
ehold
eq
uipm
ent
inacc
ord
anc
e w
ith t
he t
erm
s of
their e
mplo
yment
.
Unaud
ited J
une
30, 2021
Unaud
ited J
une
30, 2020
----
----
----
----
----
----
----
----
----
----
----
----
----
----
----
----
----
----
(Ru
pees
in '0
00)-
----
----
----
----
----
----
----
----
----
----
----
----
----
----
----
----
----
- Unaudited June 30, 2021
Audited December 31,
2020
38 CAPITAL ADEQUACY, LEVERAGE RATIO & LIQUIDITY REQUIREMENTS
Capital Adequacy
Minimum Capital Requirement (MCR):
Paid-up capital (net of losses) 11,850,600
11,850,600
Capital Adequacy Ratio (CAR):
Eligible Common Equity Tier 1 (CET 1) Capital 141,778,224
149,417,496
Eligible Additional Tier 1 (ADT 1) Capital -
-
Total Eligible Tier 1 Capital 141,778,224
149,417,496
Eligible Tier 2 Capital 32,207,915
36,710,001
Total Eligible Capital (Tier 1 + Tier 2) 173,986,139
186,127,497
Risk Weighted Assets (RWAs):
Credit Risk 655,411,104
668,413,516
Market Risk 154,254,584
128,392,302
Operational Risk 148,348,258
148,348,258
Total 958,013,946
945,154,076
Common Equity Tier 1 Capital Adequacy ratio 14.80% 15.81%
Tier 1 Capital Adequacy Ratio 14.80% 15.81%
Total Capital Adequacy Ratio 18.16% 19.69%
Leverage Ratio (LR):
Eligible Tier-1 Capital 141,778,224
149,417,496
Total Exposures 2,450,843,720
2,323,456,613
Leverage Ratio 5.78% 6.43%
Liquidity Coverage Ratio (LCR):
Total High Quality Liquid Assets 1,098,285,227
962,045,524
Total Net Cash Outflow 462,016,872
415,665,992
Liquidity Coverage Ratio 237.72% 231.45%
Net Stable Funding Ratio (NSFR):
Total Available Stable Funding 1,308,436,013 1,212,910,470
Total Required Stable Funding 720,550,201 715,405,667
Net Stable Funding Ratio 181.59% 169.54%
----------Rupees in '000-------

66 67
MCB Bank Limited & Subsidiary Companies MCB Bank Limited & Subsidiary Companies
Notes To The Consolidated Condensed Interim Financial Statements (Un-audited) For The Half Year Ended June 30, 2021
Notes To The Consolidated Condensed Interim Financial Statements (Un-audited) For The Half Year Ended June 30, 2021
Note
Unaudited June 30, 2021
Audited December 31,
2020
ASSETS
Cash and balances with treasury banks 10,055,928
9,872,197
Balances with other banks 6,404,515
4,996,602
Due from financial institutions 39.1 1,000,000
828,790
Investments - net 39.2 29,790,672
27,617,997
Islamic financing and related assets - net 39.3 82,325,779
84,896,191
Fixed assets 5,088,190
5,548,894
Intangible assets 591,482
639,428
Deferred tax assets - net 840,939
874,878
Other assets - net 6,050,237
5,895,909
Total Assets 142,147,742
141,170,886
LIABILITIES
Bills payable 1,579,951
2,470,821
Due to financial institutions 7,568,842
20,596,773
Deposits and other accounts 39.4 114,971,198
99,253,161
Liabilities against assets subject to finance lease -
-
Sub-ordinated debts -
-
Deferred tax liabilities - net -
-
Other liabilities 7,246,358
8,122,359
131,366,349
130,443,114
NET ASSETS 10,781,393
10,727,772
REPRESENTED BY
Share capital 11,550,000
11,550,000
Reserves 80,041
68,107
Surplus on revaluation of assets - net of tax 466,747
473,316
Accumulated loss (1,315,395)
(1,363,651)
10,781,393
10,727,772
CONTINGENCIES AND COMMITMENTS 39.5
----------Rupees in '000-------
39 ISLAMIC BANKING BUSINESS
The Group through a wholly owned subsidiary (MCB Islamic Bank Limited ) is operating 173 branches in Pakistan (December 31, 2020: 187 branches). The statement of financial position of the Group's Islamic Banking Business as at June 30, 2021 is as follows:
Note
April 01, 2021
to June 30,
2021
April 01, 2020
to June 30,
2020
January 01,
2021 to June
30, 2021
January 01,
2020 to June
30, 2020
Profit / return earned 39.6 2,248,685
2,671,478
4,495,274
5,233,242
Profit / return expensed 39.7 1,151,547
1,436,452
2,362,906
3,041,319
Net spread earned 1,097,138
1,235,026
2,132,368
2,191,923
OTHER INCOME
Fee and commission income 100,331
69,063
192,897
141,987
Dividend income 25,141
10,033
37,556
17,799
Foreign exchange income 47,504
(3,756)
28,868
105,543
Gain on securities -
9,226
3,602
9,590
Other income 71,743
55,226
80,010
58,113
Total other income 244,719
139,792
342,933
333,032
Total income 1,341,857
1,374,818
2,475,301
2,524,955
OTHER EXPENSES
Operating expenses 1,236,755 1,177,191 2,311,415 2,268,619 Workers welfare fund 2,692 4,145 5,429 5,816 Other charges 37,095 - 37,095 60 Total other expenses 1,276,542 1,181,336 2,353,939 2,274,495
Profit before provisions 65,315
193,482
121,362
250,460 Provisions and write offs - net 12,869
79,812
(22,693)
114,236 Extra ordinary / unusual items -
-
-
-
PROFIT BEFORE TAXATION 52,446
113,670
144,055
136,224
Taxation 47,548
69,721
84,387
86,073
PROFIT AFTER TAXATION 4,898
43,949
59,668
50,151
Unaudited
June 30, 2021
Audited December 31,
2020
39.1 DUE FROM FINANCIAL INSTITUTIONS
Secured
Bai Muajjal receivable - with State Bank of Pakistan -
828,790
Unsecured
Musharaka arrangements 1,000,000 -
1,000,000 828,790
The profit and loss account of the Group's Islamic banking branches for the three months period ended June 30, 2021 is as follows:
------------------------------Rupees in '000------------------------------
Quarter Ended Half Year Ended
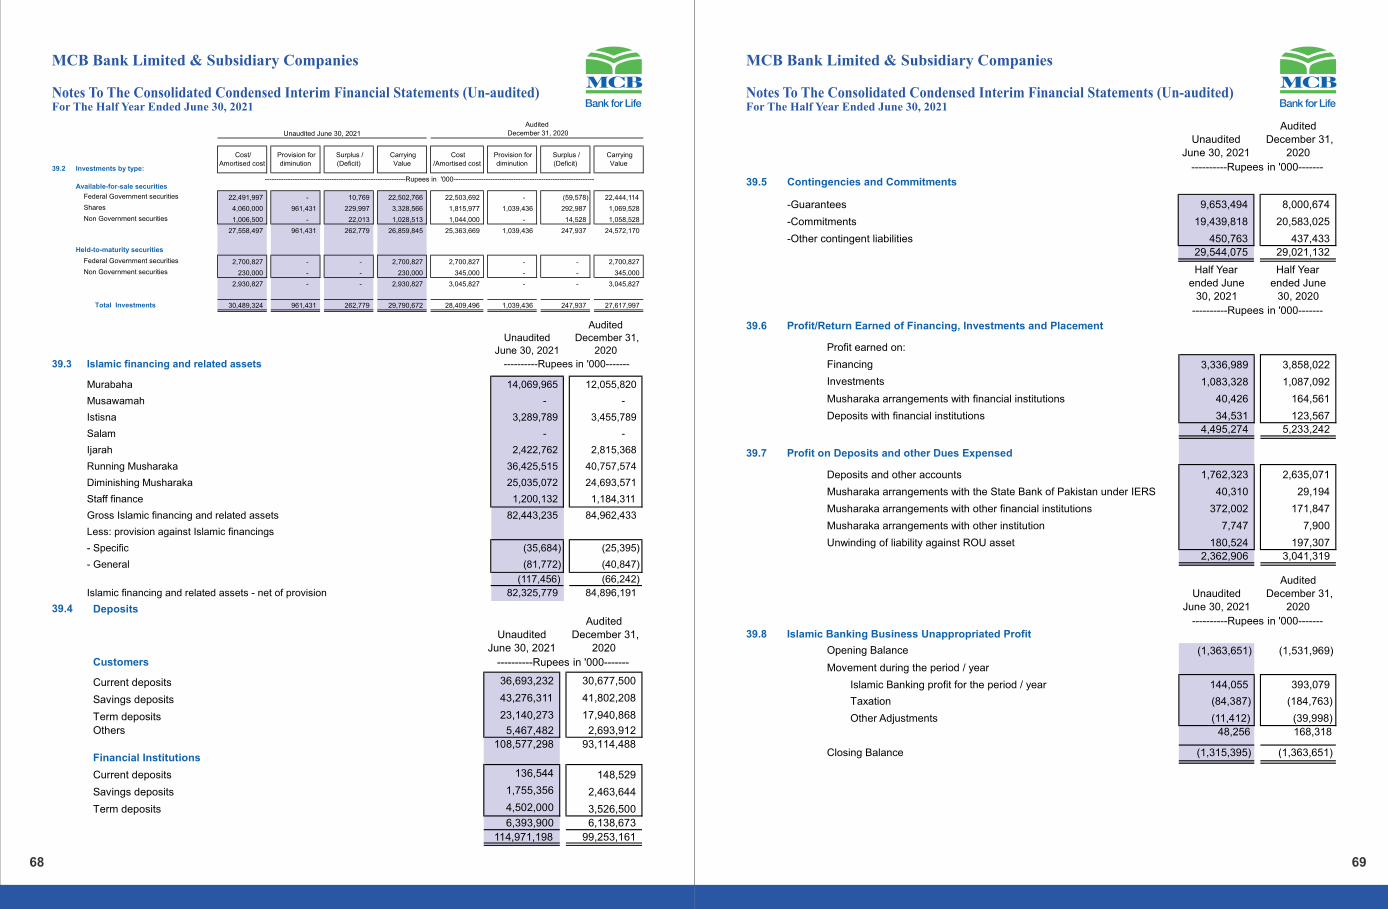
68
MCB Bank Limited & Subsidiary Companies
69
MCB Bank Limited & Subsidiary Companies
Notes To The Consolidated Condensed Interim Financial Statements (Un-audited) For The Half Year Ended June 30, 2021
Notes To The Consolidated Condensed Interim Financial Statements (Un-audited) For The Half Year Ended June 30, 2021
39.2 Investments by type:
Available-for-sale securities
Federal Government securities 22,491,997
-
10,769
22,502,766
22,503,692
- (59,578) 22,444,114
Shares 4,060,000
961,431
229,997
3,328,566
1,815,977
1,039,436 292,987 1,069,528
Non Government securities 1,006,500
-
22,013
1,028,513
1,044,000
- 14,528 1,058,528
27,558,497
961,431
262,779
26,859,845
25,363,669
1,039,436 247,937 24,572,170
Held-to-maturity securities
Federal Government securities 2,700,827
-
- 2,700,827 2,700,827 - - 2,700,827
Non Government securities 230,000
-
- 230,000 345,000 - - 345,000
2,930,827
-
- 2,930,827 3,045,827 - - 3,045,827
Total Investments 30,489,324
961,431
262,779 29,790,672 28,409,496 1,039,436 247,937 27,617,997
39.3 Islamic financing and related assets
Murabaha
Musawamah
Istisna
Salam
Ijarah
Running Musharaka
Diminishing Musharaka
Staff finance
Gross Islamic financing and related assets
Less: provision against Islamic financings
- Specific
- General
Islamic financing and related assets - net of provision
-------------------------------------------------------------Rupees in '000-------------------------------------------------------------
Unaudited June 30, 2021
Audited December 31, 2020
Cost/ Amortised cost
Provision for diminution
Surplus / (Deficit)
Carrying Value
Cost /Amortised cost
Provision for diminution
Surplus / (Deficit)
Carrying Value
39.4 Deposits
Customers
Current deposits
Savings deposits
Term deposits
Others
Financial Institutions
Current deposits
Savings deposits
Term deposits
Unaudited June 30, 2021
Audited December 31,
2020
14,069,965 12,055,820
- -
3,289,789 3,455,789
- -
2,422,762 2,815,368
36,425,515 40,757,574
25,035,072 24,693,571
1,200,132 1,184,311
82,443,235 84,962,433
(35,684) (25,395)
(81,772) (40,847)
(117,456) (66,242)
82,325,779 84,896,191
----------Rupees in '000-------
Unaudited
June 30, 2021
Audited
December 31,
2020
36,693,232 30,677,500
43,276,311 41,802,208
23,140,273 17,940,868
5,467,482 2,693,912
108,577,298 93,114,488
136,544 148,529
1,755,356 2,463,644
4,502,000 3,526,500
6,393,900 6,138,673
114,971,198 99,253,161
----------Rupees in '000-------
Half Year ended June
30, 2021
Half Year ended June
30, 2020
----------Rupees in '000-------
39.5 Contingencies and Commitments
-Guarantees
-Commitments
-Other contingent liabilities
9,653,494 8,000,674
19,439,818 20,583,025
450,763 437,433
29,544,075 29,021,132
39.6 Profit/Return Earned of Financing, Investments and Placement
Profit earned on:
Financing 3,336,989
3,858,022
Investments 1,083,328
1,087,092
Musharaka arrangements with financial institutions 40,426
164,561
Deposits with financial institutions 34,531
123,567
4,495,274
5,233,242
39.7 Profit on Deposits and other Dues Expensed
Deposits and other accounts 1,762,323
2,635,071
Musharaka arrangements with the State Bank of Pakistan under IERS 40,310
29,194
Musharaka arrangements with other financial institutions 372,002
171,847
Musharaka arrangements with other institution 7,747
7,900
Unwinding of liability against ROU asset 180,524
197,307
2,362,906 3,041,319
Unaudited June 30, 2021
Audited December 31,
2020
39.8 Islamic Banking Business Unappropriated Profit
Opening Balance (1,363,651) (1,531,969)
144,055 393,079
Taxation (84,387) (184,763)
Other Adjustments (11,412) (39,998)
48,256 168,318
Closing Balance (1,315,395) (1,363,651)
Islamic Banking profit for the period / year
----------Rupees in '000-------
Movement during the period / year
Unaudited
June 30, 2021
Audited
December 31,
2020
----------Rupees in '000-------
MCB Bank Limited & Subsidiary Companies
The Board of Directors in its meeting held on August 11, 2021 has announced a cash dividend in respect of half year ended June 30, 2021 of Rs.5.00 per share (June 30, 2020: Rs. Nil per share). These consolidated condensed interim financial statements for the period ended June 30, 2021 do not include the effect of these appropriations which will be accounted for subsequent to the period end.
40 EVENTS AFTER THE REPORTING DATE
Comparative figures have been re-arranged and reclassified for comparison purposes. Figures have been rounded off to the nearest thousand of rupees unless otherwise stated.
41 GENERAL
These consolidated condensed interim financial statements were authorized for issue by the Board of Directors of the Bank in their meeting held on August 11, 2021.
42 DATE OF AUTHORIZATION FOR ISSUE
70Salman Khalid Butt
Director S. M. Muneer
Director Imran MaqboolPresident / CEO Muhammad Ali Zeb
Director Hammad Khalid
Chief Financial Officer
Notes To The Consolidated Condensed Interim Financial Statements (Un-audited) For The Half Year Ended June 30, 2021