half yearly report presentation - marshalls
TRANSCRIPT
2014 HALF-YEARLY RESULTS REVIEW AND OUTLOOK


Agenda
● Highlights ● Financial Performance ● Update on Growth
● Landscape Products ● Smaller Businesses ● International
● Summary ● Questions
1
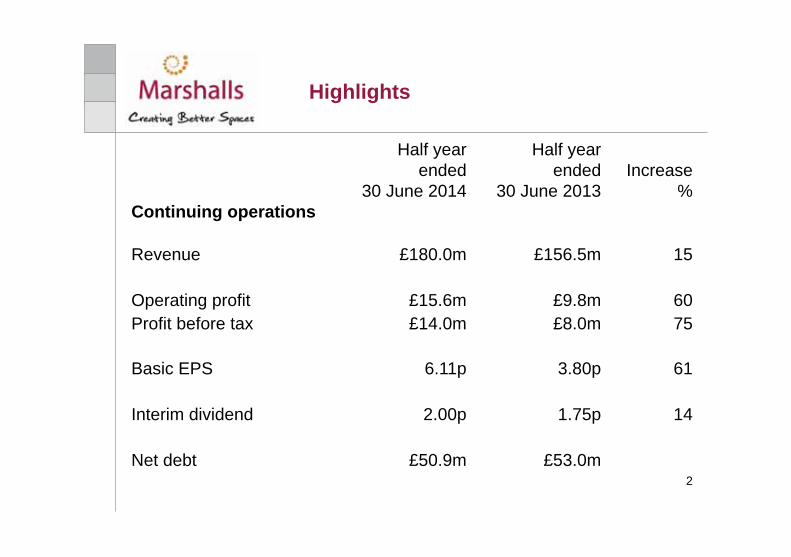
Highlights
Half year Half year ended ended Increase
30 June 2014 30 June 2013 % Continuing operations Revenue £180.0m £156.5m 15 Operating profit £15.6m £9.8m 60 Profit before tax £14.0m £8.0m 75 Basic EPS 6.11p 3.80p 61 Interim dividend 2.00p 1.75p 14 Net debt £50.9m £53.0m 2


Revenue Growth Revenue
£m H1 2013 156.5 Landscape Products 15.1 Other UK smaller businesses 4.9 International 3.5 H1 2014 180.0 * The 2012 comparative figure has been restated in respect of discontinued operations
Revenue £180.0m
Revenue
163.1 156.5180.0
2012 2013 2014
£m
*
4

Revenue Analysis
Public Sector and Commercial Revenue
● 62% of Group ● Revenue up 19% ● Price up 3% ● Volume and mix up 16%
Domestic UK Revenue
● 32% of Group ● Revenue up 4% ● Price up 4% ● Volume and mix neutral
International Revenue
● 6% of Group ● International sales grew by 42% 5

2014 2013 £m £m
Operating profit: Continuing operations EBITDA 22.2 17.0 Depreciation / amortisation (6.6) (7.2) Operating profit 15.6 9.8 Financial income and expense (net) (1.6) (1.8) Profit before tax 14.0 8.0
Profit for the Financial Period
6

Margin Reconciliation
Movement in Impact on Revenue Operating Margin Profit
Continuing operations £m £m % H1 2013 156.5 9.8 6.3 Price increases to recover costs (UK) 5.4 0.9 0.3 Volume and mix – Landscape Products 10.5 3.6 1.7 Volume and mix – other UK smaller businesses 4.1 1.7 0.8 Organic International expansion 3.5 (0.4) (0.4) H1 2014 180.0 15.6 8.7
7

Cash inflow arising from: 2014 2013
£m £m Operating profit 15.6 9.8 Depreciation and amortisation 6.6 7.2 EBITDA (continuing operations) 22.2 17.0 Discontinued operations - 0.5 EBITDA (total operations) 22.2 17.5 Net financial expenses paid (1.6) (2.0) Taxation paid (1.9) - Pensions paid (4.3) (5.3) Net loss on sale of property, plant and equipment 0.1 - Profit on disposal of discontinued operations - (0.2) Receivables / payables (23.6) (15.2) Inventory (0.5) 1.7 Works closure costs paid and other items 0.5 (0.1) Net cash flow from operating activities (9.1) (3.6)
Cash Flow from Operating Activities
8

2014 2013 £m £m
Net cash flow from operating activities (9.1) (3.6)
Capital expenditure (4.2) (3.7) Net proceeds from sale of surplus assets 2.2 0.1 Net proceeds from disposal of discontinued operations - 17.6 Payments to acquire own shares (4.3) - Sub-total (15.4) 10.4 Finance leases / exchange differences 0.1 0.1 Movement in net debt (15.3) 10.5 Net debt at 1 January (35.6) (63.5) Net debt at 30 June (50.9) (53.0) Gearing (%) 28.8% 29.0%
Cash Flow
9

Significant Borrowing Facilities
Expiry Date Facility Cumulative Facility
£m £m Committed facilities: Q3 2019 20 20 Q3 2018 20 40 Q3 2017 20 60 Q3 2016 25 85 Q3 2015 25 110 On demand facilities: Available all year 15 125 Seasonal (February to August inclusive) 20 145
020406080
100120140160180200220
Dec 2013 June 2014 Dec 2014 *
On demand: Seasonal (Feb to Aug)
On demand: Overdrafts (all year)
Committed
Net debt
£m
* Dec 2014 based on consensus information
10

-50
-40
-30
-20
-10
0
10
20
Pensions
= Accounting valuation
= Actuarial valuation: Formal
Risk Management 2000: Closed to new members 2006: Closed to future service accrual 2007: Investment strategy
Investment Strategy Moved from equities to LDIs Closer matching to liability profile
Balance Sheet Almost neutral at less than £(0.1)m
Income Statement: Notional interest Almost neutral at less than £(0.1)m
11

2014 2013 Interest charge:
Charge £1.6m £1.8m Cover 9.9 times 5.6 times
Tax rate 17.0% 10.7% EPS:
Continuing 6.11p 3.80p + 61% Total operations 6.11p 4.00p + 53%
Weighted average number of shares 196.0m 195.6m Interim dividend 2.00p 1.75p + 14%
Net asset value £177.0 m £182.7m
Additional Information and Ratios
12

Update on Growth

Market Recovery ONS Actual and Main Forecasters
All Work All Work Forecast CPA Experian Hewes
14
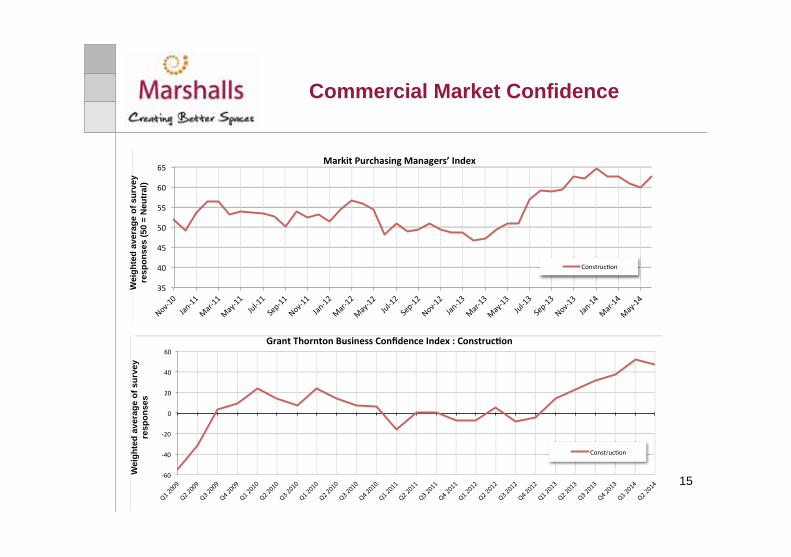
Commercial Market Confidence
Wei
ghte
d av
erag
e of
sur
vey
resp
onse
s (5
0 =
Neu
tral
) W
eigh
ted
aver
age
of s
urve
y re
spon
ses
15

Growth Focus: Rail
Sale
s Va
lue
Inde
xed
2013
Q2=
100
Sales recorded against “Rail & Transport” Project Types
16

Growth Focus: Water Management
Sale
s Va
lue
Inde
xed
2013
Q2=
100
Linear Drainage
17

Domestic Market Confidence C
onsu
mer
Con
fiden
ce
0 =
Neu
tral
%
of s
urve
y re
spon
dent
s w
ho w
ere
likel
y to
be
unde
rtak
ing
a pr
ojec
t in
the
next
12
mon
ths
18

Market Recovery Installer Order Books
4.05.06.07.08.09.0
10.011.012.0
Average Order Book in Weeks for all Installers
19

Market Recovery Installer Order Books - June
0%
10%
20%
30%
40%
50%
60%
70%
80%
90%
100%
Annual Averages - Spread of Order Book for Whole Market
< 2 weeks 2 – 4 weeks 4 – 6 weeks 6 - 8 weeks 8 – 12 weeks > 12 weeks
20

Marshalls Drivesys Patented Driveway System Reduces Installation Time by 50%

Growth Focus: Fairstone
Ord
er V
alue
Inde
xed
2013
Q2=
100
Fairstone Orders
22

Digital Outperformance Domestic
0%
10%
20%
30%
40%
50%
60%
70%
Industry Volume B2C Market Volume Marshalls Domestic
% g
row
th la
st 6
mon
ths
–v-
sam
e 6
last
yea
r
Marshalls Domestic Website Traffic –v- Industry Total
23

Smaller Businesses
● Street Furniture/Mineral Products/Stone Cladding/International ● 2013 Combined Revenue = 21% Group ● 2014 H1 Sales + 27% Growth ● 2014 H1 Operating Profit £2m improvement ● 2014 H1 2 out of 4 profitable ● 2014 FY 3 out of 4 profitable ● 2014/5 recovery plan agreed for Marshalls NV
24

International Strategy

International Strategy
Sales up 42% H1 2014 Commercial ● Premier projects in Middle East e.g. King Abdulaziz International Airport ● Landscape/street furniture/cladding/internal ● Specifiers/architects/contractors ● Convert specification to order ● Medium term develop Marshalls NV model
Domestic ● Distribution model in Europe through Marshalls NV ● Warehouse expansion into France 2015 ● Supply agreements in North America e.g. Unilock, Stonepavers
26
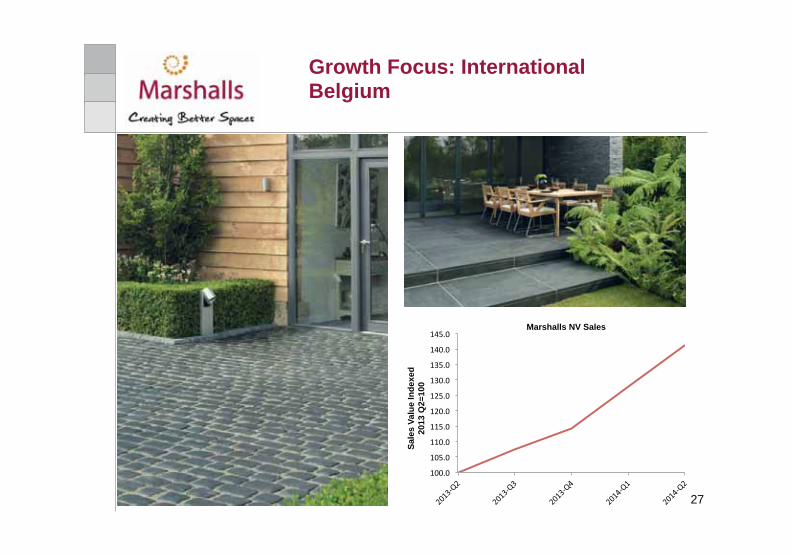
Growth Focus: International Belgium
Sale
s Va
lue
Inde
xed
2013
Q2=
100
Marshalls NV Sales
27

Summary
● Core business growing ahead of CPA numbers ● Key areas of focus achieving substantial growth ● Smaller businesses grown by 27% H1 ● Profit turnaround on target ● Re-branding complete, market share growth commenced ● International growth of 42% achieved H1 ● PBT growth of 75% achieved ● Medium term objective of return to pre-recession results
underway
28

Appendices

Construction Products Association
2013 2014 2015 2016 2017 2018 £m/% change Actual Forecast Forecast Forecast Forecast Forecast
Housing 21,669 23,610 25,686 26,773 27,209 27,653 9.0% 9.0% 8.8% 4.2% 1.6% 1.6%
Other New Work 47,272 49,221 51,597 54,379 57,106 60,558 -1.9% 4.1% 4.8% 5.4% 5.0% 6.0%
Repair, Maintenance and Improvement Private Housing 14,032 14,874 15,469 16,088 16,570 17,067 2.5% 6.0% 4.0% 4.0% 3.0% 3.0%
Total 43,145 44,538 45,693 46,830 47,809 48,727 2.3% 3.2% 2.6% 2.5% 2.1% 1.9%
Total All Work
112,086 117,369 122,976 127,982 132,124 136,938 1.6% 4.7% 4.8% 4.1% 3.2% 3.6%
30

Construction Products Association Forecasts
2013 2014 2015 2016 2017 2018
Source: ONS: Construction Products Association
-7.5%
1.6%
4.7% 4.8% 4.1%
3.2% 3.6%
Construction Output (% Growth)
2012
31

H1 2014 Actual
EBITA: Interest charge 8.3 times
Net Debt: EBITDA 1.4 times EBITA to interest charge must be greater than 2.5 x Net debt to EBITDA must be less than 3.0 x Net assets must be greater than £100 million
Financial Flexibility
32

£m £m 2013 Year End Net Assets 175.4 Impact of movements in year:
Profit for the financial period 12.0 Ordinary dividends (6.9) Actuarial movement on pensions (after tax) - Hedging reserve 0.2 Share-based expenses (after tax) 1.0 Purchase of own shares (4.3) Foreign currency translation differences (0.1) Non-controlling interest (0.3) 1.6
2014 Half Year Net Assets 177.0
Net Assets
33

Disclaimer
• For the purposes of the following disclaimer, references to this “presentation” shall be deemed to include references to the presenters’ speeches, the question and answer session and any other related verbal or written communications.
• This presentation, which is personal to the recipient and has been issued by Marshalls plc (“Marshalls”), comprises slides for a presentation in relation to Marshalls half-yearly results, and is solely for use at such presentation.
• This presentation and these slides are confidential and may not be reproduced, redistributed or passed on directly or indirectly to any other person or published in whole or in part for any purpose.
• This presentation and associated discussion includes forward-looking statements. Information contained in this presentation relating to Marshalls has been compiled from public sources. All statements other than statements of historical fact included in this announcement, including without limitation those regarding the plans, objectives and expected performance of Marshalls, are forward-looking statements. Marshalls has based these forward-looking statements on its current expectations and projections about future events, including numerous assumptions regarding its present and future business strategies, operations, and the environment in which it will operate in the future.
• Forward-looking statements generally can be identified by the use of forward-looking terminology such as 'ambition', 'may', 'will', 'could', 'would', 'expect', 'intend', 'estimate', 'anticipate', 'believe', 'plan', 'seek' or 'continue', or negative forms or variations of similar terminology. Such forward-looking statements involve known and unknown risks, uncertainties, assumptions and other factors related to Marshalls.
• By their nature, forward-looking statements involve risks, uncertainties and assumptions and many relate to factors which are beyond the control of Marshalls, such as future market and economic conditions, external factors affecting operations and the behaviour of other market participants. Actual results may differ materially from those expressed in forward-looking statements. Given these risks, uncertainties, and assumptions, you are cautioned not to put undue reliance on any forward-looking statements. In addition, the inclusion of such forward-looking statements should under no circumstances be regarded as a representation by Marshalls that Marshalls will achieve any results set out in such statements or that the underlying assumptions used will in fact be the case.
• Other than as required by applicable law or the applicable rules of any exchange on which securities of Marshalls may be listed, Marshalls has no intention or obligation to update or revise any forward-looking statements included in this presentation.
• This presentation is for information only and does not constitute or form part of any offer or invitation to sell, or any solicitation of any offer to purchase, any shares in Marshalls or any other securities, nor shall it or any part of it nor the fact of its distribution form the basis of, or be relied upon in connection with, any contract or investment decision related thereto. No investment advice is being given in this presentation.