halliburton high resolution induction...
TRANSCRIPT
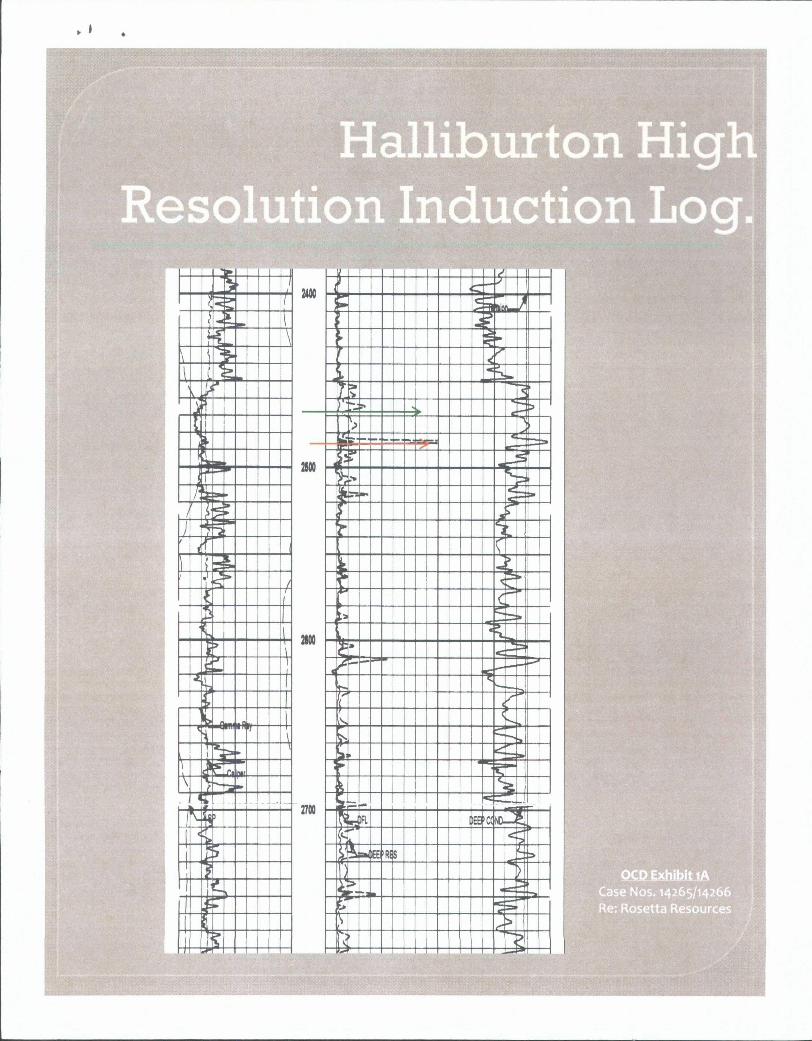
Halliburton High Resolution Induction Log.
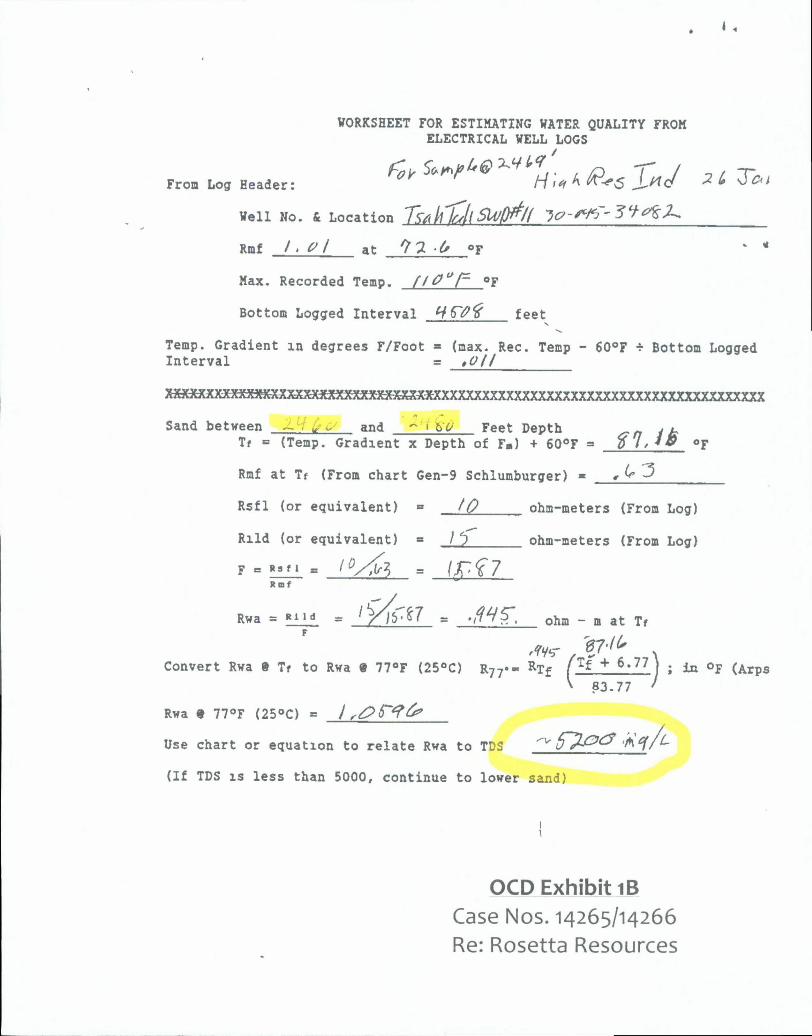
WORKSHEET FOR ESTIMATING VATER QUALITY FROM ELECTRICAL VELL LOGS
From Log Header:
Well Mo. & Location
Rmf / . V I a t 92 0 °F * "
Max. Recorded Temp. f l C ^ F °F
Bottom Logged Interval feet
Temp. Gradient in degrees F/Foot « (max. Rec. Temp - 60°F * Bottom Logged Interval = tOll
Sand between ~ • „ ~ and ~ ' b'U Feet Depth „ y u
Rmf at Tf (From chart Gen-9 Schlumburger) « «• ̂ 3
Rsfl (or equivalent) » ohm-meters (From Log)
Rild (or equivalent) « / ohm-meters (From Log)
Rmf
Use chart or equation to relate Rwa to TDS
(If TDS is less than 5000, continue to lower sand)
OCD Exhibit 1B Case Nos. 14265/14266 Re: Rosetta Resources
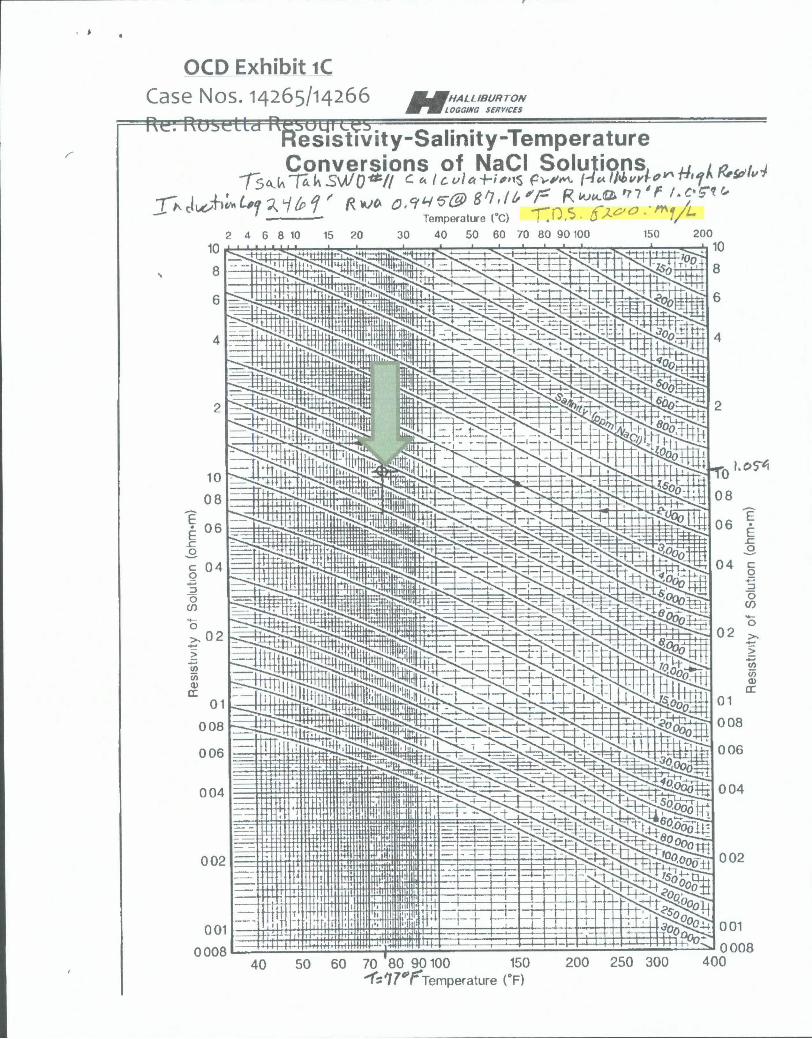
OCD Exhibit 1C Case Nos. 14265/14266 j y r
mm mat 'HALLIBURTON LOGGING sen VICES
Re. RuselLd Re>UL4iies. ft^s^tTvity-Salinity-Temperature Conversions of NaCI Solutions, „u 1^,4
Tb^T^SsA/O^// ^ / ^ ' f t + " ' " ' S f v m (J«U*vrl*»1*'1*W'"*
30 40 50 60 70 80 90100 150 200
40 50 60 70 '80 90100 150 ^ ^ T e m p e r a t u r e (°F)
200 250 300 0008
400
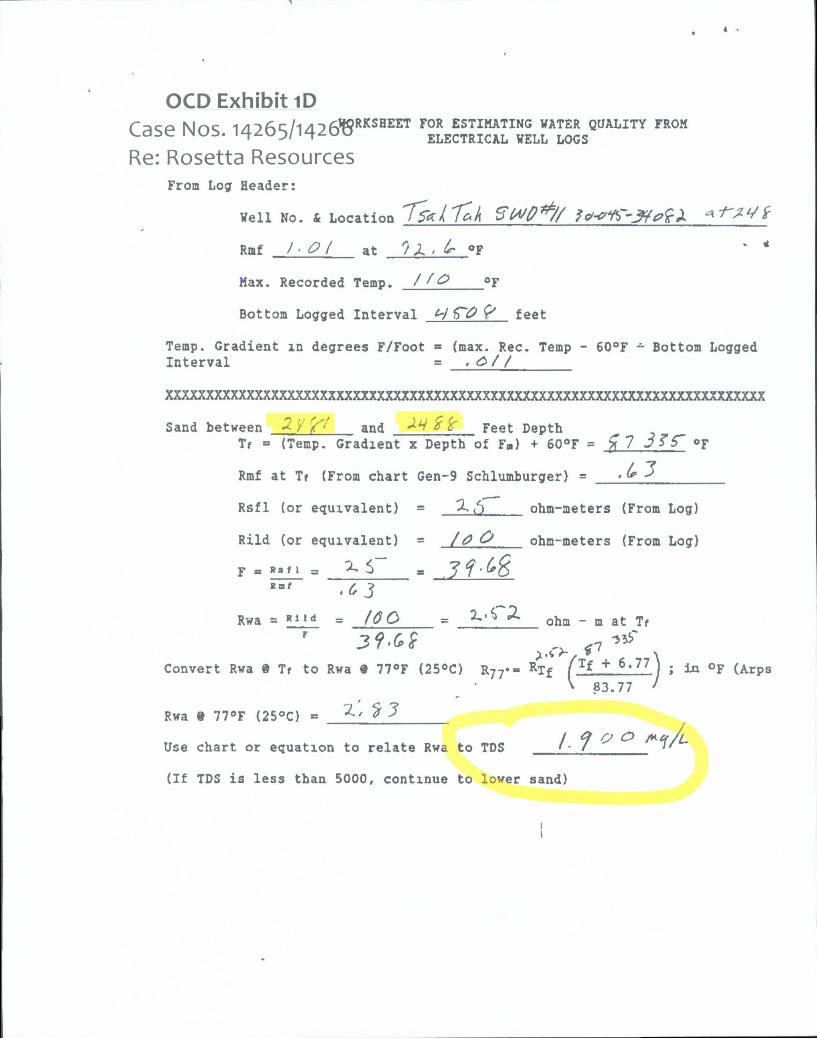
OCD Exhibit 1D f a < - p M n c 1 / l l ^c / l / lT< ' fQRKSHEET FOR ESTIMATING WATER QUALITY FROM
I ^ Z U ^ / I ^ U U ELECTRICAL WELL LOGS
Re: Rosetta Resources From Log Header:
Well Mo. & Locatioo
Rmf I - O I at 0 X . tr °F * *
Max. Recorded Temp. / f & °F
Bottom Logged Interval H P feet
Temp. Gradient in degrees F/Foot = (max. Rec. Temp - 60°F - Bottom Logged Interval = . 6 / /
xxxxxxxxxxmxxxxxxxxxxxxxxxxxxxxxxxxxxxxxxxxxxxxxxxxxxxxxxxxxxxxxxxxxxxxx
Sand between << y 'f' a n Q $ tf Feet Depth Tf •» (Temp. Gradient x Depth of Fm) + 60°F = £ 7 3 f S~ «F
Rmf at Tf (From chart Gen-9 Schlumburger) = ,U1
Rsfl (or equivalent) = X ohm-meters (From Log)
Rild (or equivalent) = / 0 & ohm-meters (From Log)
F - = ^ 6~ . Jf-6>8 .6 3
Rwa = = 1 6 0 = ^ ^ ohm - m at Tf
Convert Rwa 9 Tf to Rwa • 77°F (25°C) R77'- RTf ( T f + 6.77 J . ̂ o F ( A r p s
* 83.77 '
Rwa 9 77°F (25°C) » % 3
Use chart or equation to relate Rwa to TDS j *j o o
( I f TDS is less than 5000, continue to lower sand)
i i
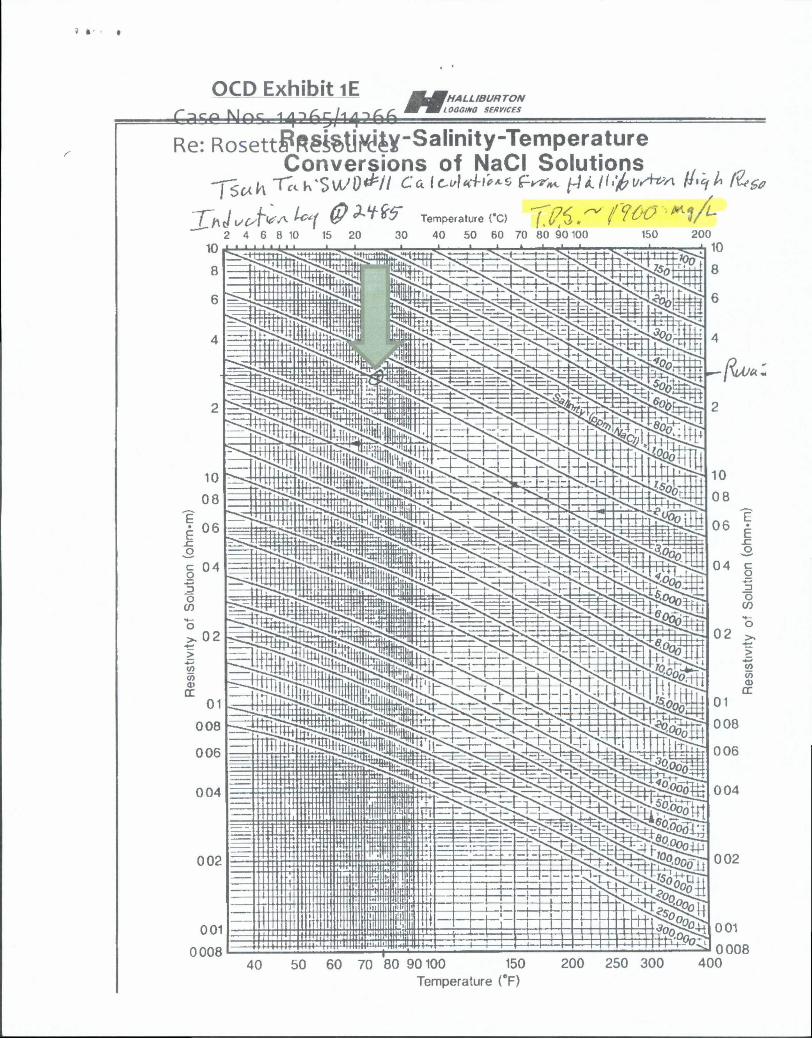
OCD Exhibit 1E HALLIBURTON
LOGGMO S£RVtC£S
Re: Rosetti?R§feliK!ey-Salinity-Temperature Conversions of NaCI Solutions
2 4 6 8 10 15 20 40 50 60 70 80 90100 • _1
0008 40 60 70 80 90100 150
Temperature (eF) 250 300
0008 400
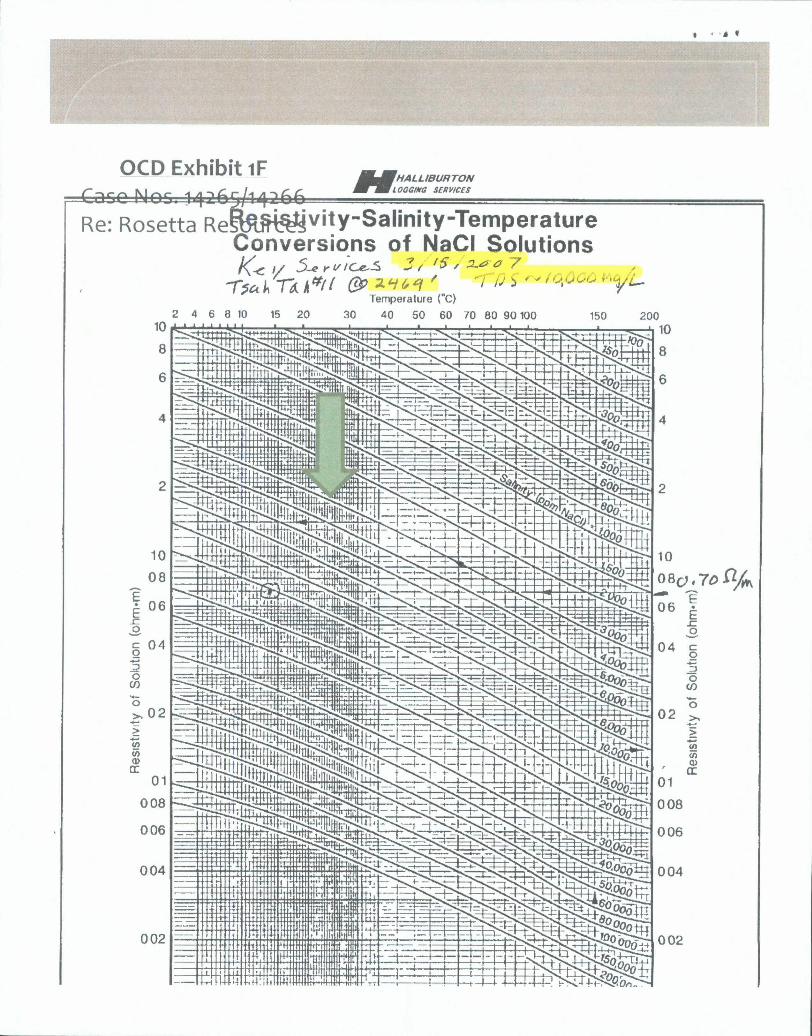
OCD Exhibit IF
Re: Rosetta Res^rr4^ v i ty-Salinity-Ternperature
HALLIBURTON LOGGING SERVICES
Conversions of NaCI Solutions
Temperature (°C) 2 4 6 8 10 15 20 30 40 50 60 70 80 90 100 150 200
10
8
10
U 06
04 |
o w o
02 >,
0) CL
01
008
006
004
002