halo effects and analytic scoring: a summary of two ... effects and analytic scoring: a summary of...
TRANSCRIPT

Halo Effects and Analytic Scoring: A Summary of Two Empirical Studies
Research Report
Emily R. Lai Edward W. Wolfe Daisy H. Vickers
November 2012

HALO AND ANALYTIC TRAIT SCORES
1
About Pearson Pearson, the global leader in education and education technology, provides innovative print and digital education materials for preK through college, student information systems and learning management systems, teacher licensure testing, teacher professional development, career certification programs, and testing and assessment products that set the standard for the industry. Pearson’s other primary businesses include the Financial Times Group and the Penguin Group. For more information about the Assessment & Information group of Pearson, visit http://www.pearsonassessments.com/.
About Pearson’s Research Reports Pearson’s research report series provides preliminary dissemination of reports and articles prepared by TMRS staff, usually prior to formal publication. Pearson’s publications in .pdf format may be obtained at: http://www.pearsonassessments.com/research.

HALO AND ANALYTIC TRAIT SCORES
2
Abstract
This report summarizes two empirical studies that address two related topics—rater halo
and how much unique information is provided by multiple analytic scores. Specifically,
we address the issue of whether unique information is provided by analytic scores
assigned to student writing, beyond what is depicted by holistic scores, and to what
degree multiple analytic scores assigned by a single rater display evidence of a halo
effect. To that end, we analyze scored student responses to an expository writing prompt
that were scored by six groups of raters—four groups assigned single analytic scores, one
group assigned multiple analytic scores, and one group assigned holistic scores—using
structural equation modeling. Our results suggest that there is evidence of a halo effect
when raters assign multiple analytic scores to a single student response and that, at best,
only two factors seem to be distinguishable in analytic writing scores assigned to
expository essays.
Keywords: halo effect, trait scores, analytic scores, holistic scores, writing assessment,
performance assessment
HALO AND ANALYTIC TRAIT SCORES
3
Companion Studies of Rater Halo and Uniqueness of Analytic Scores
Student responses to writing assessments are commonly evaluated using rubrics
that assign either a single holistic score of writing quality or a set of analytic scores
assigned to each of several traits. Under a holistic scoring model, raters are trained to
evaluate the writing according to its overall quality by jointly considering the multiple
facets of the essay. Typically, holistic scores can be assigned relatively quickly, but raters
may disagree on the assigned score because they weight the multiple facets differently. In
addition, holistic scores provide relatively little diagnostic information to students
concerning the basis of the score or how to improve the writing. Conversely, under an
analytic scoring model, raters are trained to evaluate each component of the writing
separately and assign a separate score to each trait (e.g., mechanics, organization, voice,
and development). Although analytic scores require relatively more time of the scorer,
they provide potentially useful diagnostic information to the student. However, analytic
scores may be subject to halo effects when a single rater assigns all analytic scores to a
particular essay.
A significant shortcoming of much of the extant research that compares analytic
and holistic scores is the potential confounding of trait correlations with halo effects due
to research designs that employ the same raters to assign holistic and multiple analytic
scores. In addition, most previous studies have focused on only a limited number of
potential dimensional structures, typically limiting attention to unidimensional or two-
dimensional structures. The purpose of the companion studies summarized in this report
is to addresses these problems directly, focusing on the following research questions:
What unique information do analytic scores assigned to student writing provide beyond

HALO AND ANALYTIC TRAIT SCORES
4
that depicted by holistic scores, and to what degree do multiple analytic scores assigned
by a single rater contain evidence of a halo effect?
Theoretical Framework
Holistic and Analytic Scores
Previous research comparing holistic and analytic scores has tended to focus on
three types of results: (a) interrater agreement and rater effects, (b) the rating process, and
(c) correlations between score types. Concerning rater agreement and rater effects, results
have been mixed with some studies supporting the notion that holistic scores produce
higher interrater agreement and reliability (Barkaoui, 2007; Schoonen, 2005) while others
suggest that analytic scores may be more reliable (Klein et al., 1998). Further, analytic
scores have been shown to be less prone to rater severity (Chi, 2001), although those
scores are also prone to halo effects when the same rater assigns the multiple analytic
scores (Robb Singer & LeMahieu, 2011).
Concerning the rating process, Klein (1998) found that holistic scores can be
assigned more quickly than can analytic scores. Hartel (1993) showed that raters who
exhibit field independence (e.g., those who see the forest rather than the trees) assign
holistic and analytic scores that are equally accurate, whereas raters who exhibit field
dependence (e.g., those who see the trees rather than the forest) are better at assigning
analytic scores. A study by Robb Singer and LeMahieu (2011) that employed think aloud
protocols suggests that scoring designs that couple holistic and analytic scores should be
structured so that holistic scores are assigned first.
Finally, concerning the correlations between scores, most studies have indicated
that analytic scores may provide a limited amount of information beyond what is
HALO AND ANALYTIC TRAIT SCORES
5
provided by holistic scores. Although Carr (2000) concluded that holistic and analytic
scores are qualitatively distinct among English as second language students, most other
studies have indicated that the correlations among analytic scores are too high to support
the intended distinctions (Aryadoust, 2010; Bacha, 2001; Lee, Gentile, & Kantor, 2008)
and that most analytic scores are very highly correlated with holistic scores (Klein, et al.,
1998; Lee, et al., 2008). More detailed analyses suggest that it may only be useful to
distinguish mechanics from a composite score that depicts other qualities of writing (e.g.,
organization, vocabulary, language, and development) (Bacha, 2001; Lee, et al., 2008).
Halo Effect
A common design for assigning analytic scores is to have a single rater assign the
multiple scores for each trait depicted by the rubric. This practice invites the possibility
of introducing one potential source of bias referred to as the “halo effect.” Originally
defined as “suffusing ratings of special features with a halo belonging to the individual as
a whole,” this effect is generally hypothesized to occur when examinees are rated along
multiple dimensions by the same person (Thorndike, 1920, p. 25). More contemporary
definitions of the halo effect characterize it as the effect of a rater’s overall or general
impression of an examinee on specific dimensions of performance (Murphy, Jako, &
Anhalt, 1993; Solomonson & Lance, 1997). Bechger, Maris, and Hsiao (2010) explain
that halo occurs “when judgments of one rated characteristic influence judgments of other
characteristics in a positive or negative direction” (p. 607). The halo effect is typically
manifested via the following “symptoms”: inflated correlations between observed scores
on different dimensions; high rater-by-examinee interactions; low within-examinee
dimensional variance; and a decrease in the number of independent opportunities for the

HALO AND ANALYTIC TRAIT SCORES
6
examinee to demonstrate his or her proficiency (Bechger, et al., 2010; Viswesvaran,
Schmidt, & Ones, 2005).
Researchers have used several approaches to study halo effect, including
examining correlations within and between raters and dimensions (Viswesvaran, et al.,
2005), conducting generalizability studies (Hoyt, 2000), and building structural equation
models (SEM) to capture this effect (Cheung, 1999; Conway, 1999; Marsh & Butler,
1984; Marsh & Yeung, 1997). Researchers tend to invoke the relationship between
observed, true, and error components of between-dimension correlations. In particular,
observed correlations are a function of “true” correlations, which represent the
correlations between the constructs or latent traits rather than the observed measures, and
an error component. In this case, the error component represents a combination of halo
bias and measurement error (Solomonson & Lance, 1997). Previous approaches to
quantifying halo effect typically attempt to “purify” observed correlations by isolating
true and error components, an approach that has been criticized due to the difficulty of
obtaining good measures of true correlation (Kozlowski & Kirsch, 1987; Murphy, et al.,
1993). To date, no studies that we are aware of have quantified halo by comparing ratings
obtained when raters score examinees on all dimensions to ratings obtained when each
rater scores examinees on only a single dimension.
Purpose
The purpose of this paper is to differentiate between-trait correlations from halo
effects in analytic scoring of writing assessments and to determine the incremental
information provided by analytic scores beyond what is captured by holistic scores.
Concerning the differentiation between analytic score and holistic score information, we

HALO AND ANALYTIC TRAIT SCORES
7
employ a data collection design in which halo effects cannot occur in order to capture the
true correlation between the analytic scores, and we investigate the dimensional structure
of the joint set of holistic and analytic scores using confirmatory factor analytic methods.
Concerning the evaluation of the magnitude of halo effects in scoring designs that allow a
single rater to assign multiple trait scores to a single response, we employ a multitrait-
multimethod (MTMM) framework that treats ratings obtained when raters score
examinees on all “traits” and ratings obtained when each rater scores examinees on only a
single trait as separate “methods.” We analyze the data via traditional MTMM methods,
as well as structural equation modeling approaches.
In sum, our research addresses the following research questions:
1. To what extent do dimensional analytic writing scores assigned by the same
raters exhibit a halo effect?
2. How highly correlated are holistic and analytic scores in the absence of halo
effect?
3. What dimensional configuration best captures the structure of holistic and
analytic writing assessment scores?
Method
Data Sources
Five groups of raters (N = 40 per group) participated in this study, with each
group assigning scores to student responses to an expository writing prompt (depicted in
Figure 1) using one or more scoring rubrics: (a) analytic-idea development (idea), (b)
analytic-organization (organization), (c) analytic-voice (voice), (d) analytic-conventions
(conventions), and (e) a holistic rubric designed to jointly consider the four traits upon

HALO AND ANALYTIC TRAIT SCORES
8
which the analytic rubrics were based. Each rubric contained four score points (0 to 3).
Raters were selected from two locations that house a Pearson scoring center (one in the
midwestern United States and one in the southwestern United States). Raters were
assigned to one of six scoring conditions, with conditions nested within location1: Group
1 scored only the development trait, Group 2 scored only organization, Group 3 scored
only voice, Group 4 scored only conventions, Group 5 scored all four traits, and Group 6
applied the holistic rubric. Hence, Groups 1 through 4 produced trait scores that were
assigned independently, Group 5 produced trait scores that were all assigned by a single
rater, and Group 6 produced holistic scores that were designed to be a composite of the
four traits.
Figure 1. Seventh-grade expository writing prompt
Because raters were not randomly assigned to groups, we conducted preliminary
comparisons of the scoring groups before training and qualification to ascertain their
comparability with respect to several demographic characteristics (education, gender,
age, and scoring background). Following training, we also compared the six groups with
respect to agreement on the qualifying sets and with respect to interrater agreement
during operational scoring. These comparisons are summarized in the Results section.
Raters were trained to use the scoring rubric, and each rater attained a
qualification standard of at least 80% perfect agreement with expert raters on two of three
HALO AND ANALYTIC TRAIT SCORES
9
sets of validity essays before participating in the study. Each group was trained and
qualified using the same sets of student responses, and training, qualification, and scoring
procedures were the same for all groups with the exception of the rubrics and rationales
provided for the student examples in the training sets. Although training for Group 5
encouraged raters to assign scores for the four traits in a particular order (development,
then organization, then voice, and finally conventions), raters in that group could score
the traits in any sequence during operational scoring. Following qualification, randomly
chosen pairs of raters assigned scores to each of 2,000 student responses. For each
student response, a pair of raters was randomly selected from each group, and the
assigned scores were summed across the pair of raters to produce a single score for each
student response.
Analysis
Separate analyses were conducted to answer research question 1, which focused
on halo effects, and research questions 2 and 3, which focused on the information
contributed by analytic scores. Note that the halo effects analyses focused only on scores
assigned by Groups 1 through 5, whereas the analytic versus holistic analyses focused
only on scores assigned by Groups 1 through 4 and Group 6, including only scores that
were not subject to potential halo effects.
Halo effect analyses. In our evaluation of halo effects, we examined bivariate
correlation patterns within traditional MTMM correlation methods, where the two
scoring approaches constituted the multiple methods. The MTMM correlation matrix is
organized to enable identification of convergent validity, discriminant validity, reliability,
and potential method effects (Campbell & Fiske, 1959).

HALO AND ANALYTIC TRAIT SCORES
10
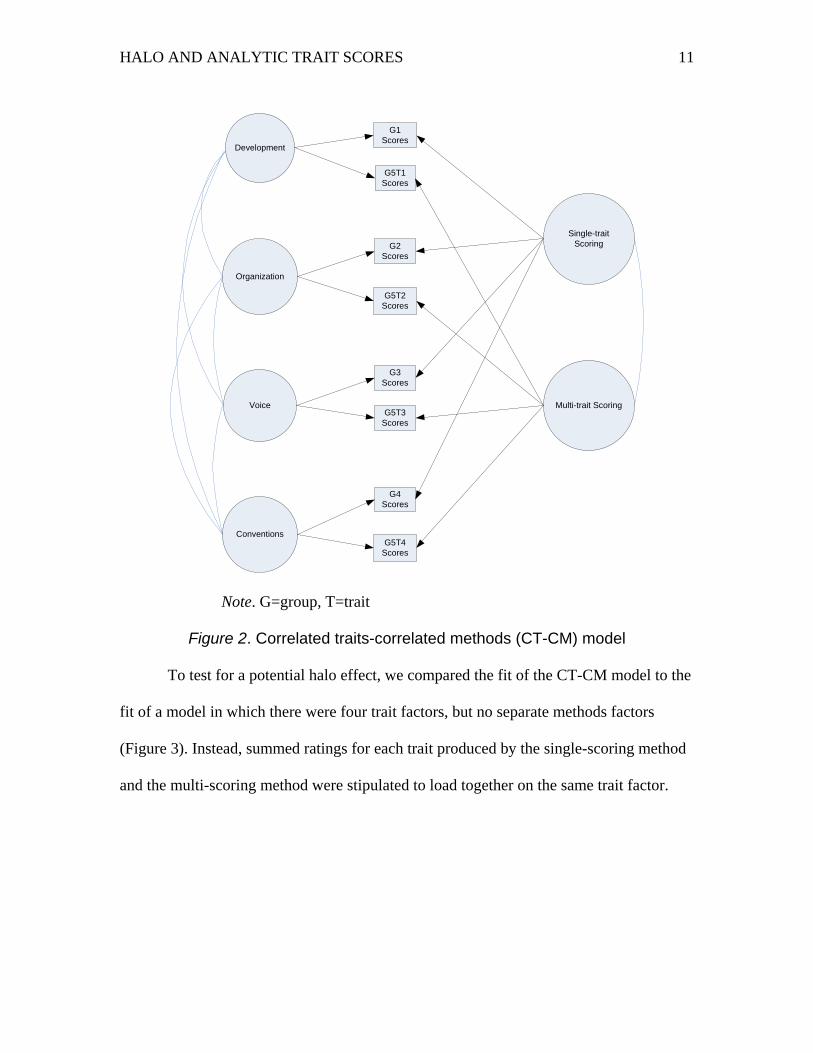
We also used SEMs that included separate latent factors for traits and methods. In
these models, each observed indicator loaded on both a trait and a method factor. Such an
approach allowed us to decompose observed variance into separate components: variance
due to trait (“true” variance), variance due to method (halo), and measurement error.
Such models are referred to as correlated traits-correlated methods (CT-CM) models
(Figure 2) when traits are allowed to covary and methods are allowed to covary.
Accordingly, our model had four trait factors (development, organization, voice, and
conventions of writing) and two method factors (single-trait scoring method and multi-
trait scoring method). Trait factors were allowed to covary, as were the method factors.
However, trait and method factors did not covary with one another.
HALO AND ANALYTIC TRAIT SCORES
11
Development
Organization
Voice
Conventions
G1 Scores
G5T1 Scores
G2 Scores
G5T2 Scores
G3 Scores
G5T3 Scores
G4 Scores
G5T4 Scores
Single-trait Scoring
Multi-trait Scoring
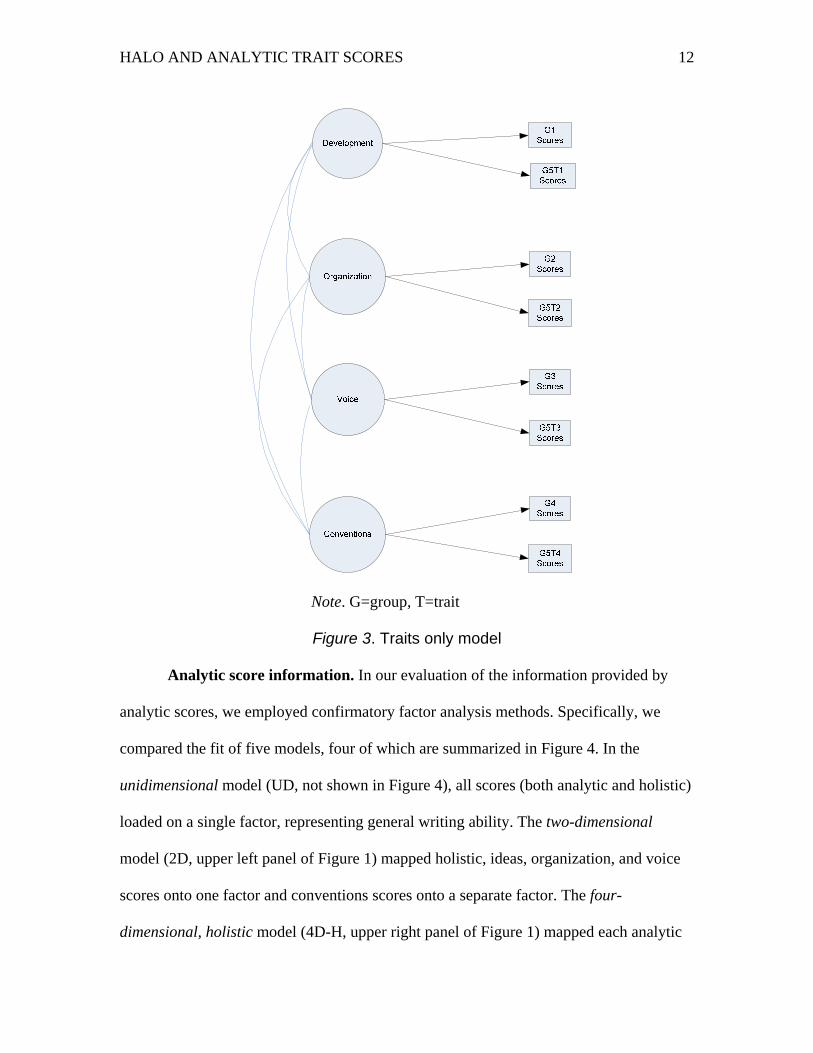
Note. G=group, T=trait
Figure 2. Correlated traits-correlated methods (CT-CM) model
To test for a potential halo effect, we compared the fit of the CT-CM model to the
fit of a model in which there were four trait factors, but no separate methods factors
(Figure 3). Instead, summed ratings for each trait produced by the single-scoring method
and the multi-scoring method were stipulated to load together on the same trait factor.
HALO AND ANALYTIC TRAIT SCORES
12
Note. G=group, T=trait
Figure 3. Traits only model
Analytic score information. In our evaluation of the information provided by
analytic scores, we employed confirmatory factor analysis methods. Specifically, we
compared the fit of five models, four of which are summarized in Figure 4. In the
unidimensional model (UD, not shown in Figure 4), all scores (both analytic and holistic)
loaded on a single factor, representing general writing ability. The two-dimensional
model (2D, upper left panel of Figure 1) mapped holistic, ideas, organization, and voice
scores onto one factor and conventions scores onto a separate factor. The four-
dimensional, holistic model (4D-H, upper right panel of Figure 1) mapped each analytic
HALO AND ANALYTIC TRAIT SCORES
13
score onto its own unique factor along with the holistic score. The four-dimensional,
conventions model (4D-C, lower left panel of Figure 1) mapped each analytic score onto
its own unique factor and loaded the holistic score onto the factors for ideas,
organization, and voice. Finally, the five-dimensional model (5D, lower right panel of
Figure 1) mapped each analytic score and the holistic score onto unique factors.

HALO AND ANALYTIC TRAIT SCORES
14
Figure 4. CFA models
Estimation and model fit. For both studies, we used SAS software to compute
descriptive statistics and Mplus (Muthén & Muthén, 1998-2007) to conduct all factor
analyses and SEM analyses. Due to the ordinal nature of the scores assigned to each trait,

HALO AND ANALYTIC TRAIT SCORES
15
we estimated the models using a robust maximum likelihood (MLR) estimator that
employs a numerical integration method to handle categorical data. For all models tested,
we fixed the factor loading of the first observed indicator for each factor to1 to establish a
scale and allow the model to be identified. Within each model, we treated errors as
uncorrelated. To determine the best-fitting model within each study, we compared several
fit indices across models, such as AIC and BIC and the Satorra-Bentler (SB) scaled chi-
square difference test for nested models (Satorra & Bentler, 1999). We also examined the
magnitude of estimated parameters (e.g., factor loadings, factor variances, observed-
indicator R2) relative to their standard errors and estimated latent factor correlations.
Results
Group Comparability
We report descriptive statistics in this section that summarize the similarity of
scoring groups with respect to demographics, qualifying, and operational agreement
rates. Table 1 summarizes demographic indicators by scoring group, including age,
gender, and ethnicity. The age of scorers varies slightly across the groups. In particular,
the percentage of scorers below the age of 60 ranges from a high of 85% in Group 1 to a
low of 40% for Group 5, with these differences being statistically significant, 2(10) Age =
23.87, p = .01. Although scorer gender and race also vary slightly across the groups,
neither of these differences is statistically significant: 2(5) Gender = 3.21, p = .67 and 2
(5)
Race = 7.31, p = .19. Hence, although the age distribution differed across scoring groups,
the two groups were comparable with respect to gender and race. We know of no
research to suggest that age of rater is related to quality of assigned scores.

HALO AND ANALYTIC TRAIT SCORES
16
Table 1
Rater Demographics by Scoring Group
Group Demographic Statistic
Percent Under 60 Percent Female Percent White
1 85.0 42.5 97.5
2 60.0 60.0 87.5
3 67.5 50.0 90.0
4 47.5 50.0 80.0
5 40.0 57.5 92.5
6 55.0 55.0 85.0
Table 2 summarizes qualifying and operational rates of exact agreement by
scoring group. For each analytic trait, both qualifying and operational agreement rates for
raters who assigned single scores and raters who assigned multiple scores were similar,
and none of the pair-wise comparisons between single- and multiple-score groups were
statistically significant. The level of qualifying agreement achieved by raters who
assigned holistic scores was comparable to that observed for raters who assigned analytic
scores, with no statistically significant difference between groups, Z = 0.55, p = .58.

HALO AND ANALYTIC TRAIT SCORES
17
Table 2
Qualifying and Operational Agreement Rates by Scoring Group
Trait Group Percent Exact Agreement
Qualifying Operational
Development 1 71 61
5 66 60
Organization 2 60 61
5 64 60
Voice 3 54 57
5 61 54
Conventions 4 50 56
5 57 55
Holistic 6 58 52
Traditional MTMM Results
One set of analyses that we utilized to address research question 1 (To what extent
do dimensional analytic writing scores assigned by the same raters exhibit a halo effect?)
involved examining the MTMM correlation matrix, which is shown in Table 3. This
matrix is organized to highlight reliability coefficients, validity coefficients, heterotrait-
monomethod correlations, and heterotrait-heteromethod correlations. We interpret each
of these in turn.

HA
LO
AN
D A
NA
LY
TIC
TR
AIT
SC
OR
ES
18
Table 3
Multitrait-Multimethod Matrix
Method Single-trait Multi-trait
Trait Dev Org Voice Con Dev Org Voice Con
Single-trait
Dev (.50)
Org .56 (.50)
Voice .59 0.63 (.47)
Con .42 0.52 .50 (.55)
Multi-trait
Dev .61 .55 .57 .48 (.43)
Org .51 .65 .58 .53 .73 (.48)
Voice .51 .56 .61 .51 .71 .75 (.39)
Con .39 .51 .49 .67 .55 .65 .62 (.49)
Note. Dev=Development, Org=Organization, Con=Conventions. Italicized values represent validity coefficients. Values in parentheses represent reliability coefficients, or the correlations between scores from randomly selected raters from the same group. Heterotrait-monomethod blocks are enclosed by solid lines. Heterotrait-heteromethod blocks are highlighted in gray.

HALO AND ANALYTIC TRAIT SCORES
19
Reliability coefficients (or monotrait-monomethod correlations), reported in
parentheses on the diagonal, represent the correlation between scores on the same trait
from two randomly selected raters in each group. As can be seen, reliability coefficients
are rather low, ranging from .47 to .55 for the single-trait groups and from .39 to .49 for
the multi-trait group. For each trait, the correlation between scores assigned by two
randomly selected raters from the multi-trait scoring group is lower than that between
two randomly selected raters from the single-trait scoring group. This pattern suggests
that it is more difficult to achieve consistent ratings when scorers are responsible for
multiple aspects of examinee performance than when scorers are rating only a single trait.
Overall, the low reliability coefficients imply that there is a substantial amount of
measurement error in these scores.
Validity coefficients are reported in italics and represent the correlation between
scores assigned by single-trait raters and those assigned by multi-trait raters for the same
trait. These coefficients depict convergent validity and range from .60 to .67, suggesting a
reasonable degree of agreement between trait scores assigned by those in the single-trait
and multi-trait groups.
Heterotrait-monomethod coefficients appear in solid blocks and represent
correlations between different trait scores assigned using the same scoring method. These
coefficients depict discriminant validity, or the extent to which distinct traits actually
capture meaningful differences in aspects of examinee performance. As can be seen,
correlations among traits for the single-trait scoring group range from .42 to .62,
suggesting that scores are tapping meaningfully different constructs. However,
corresponding correlations for the multi-trait scoring group are slightly higher, ranging

HALO AND ANALYTIC TRAIT SCORES
20
from .55 to .75. The difference between these two sets of correlations represents potential
method variance or bias due to the halo effect. Thus, multi-trait scoring group
correlations may be inflated by as much as 16–24% to the extent that scores on one trait
were influenced by scores on other traits.
Finally, heterotrait-heteromethod coefficients can be found in the shaded boxes.
These coefficients represent correlations between scores on different traits obtained using
different scoring methods. According to Campbell and Fiske (1959), validity coefficients
ought to be larger than corresponding correlations in both the heterotrait-monomethod
block and the heterotrait-heteromethod block. It is evident that each validity coefficient is
larger than values from its corresponding row and column within the heterotrait-
heteromethod block, and this criterion is nearly satisfied for the heterotrait-monomethod
block of the single-trait scoring group. However, several correlations within the
heterotrait-monomethod block of the multi-trait scoring group are larger than
corresponding validity coefficients. Again, this suggests the presence of potential method
variance or halo effects.
SEM Results
To further explore potential halo effects, we constructed two different structural
equation models: one that included both trait and method factors (the CT-CM model) and
one that included trait factors only. Table 4 presents fit indices for both the traits-only
model and the CT-CM model. Comparing the two models, results suggest that fit is
significantly improved by incorporating specific method factors into the model. Namely,
AIC and BIC decrease, whereas the log-likelihood increases. The Satorra-Bentler scaled

HALO AND ANALYTIC TRAIT SCORES
21
chi-square difference test suggests that the CT-CM model fits significantly better than a
model including only traits, which implies the presence of method-specific effects.
Table 4
Halo Effect Model Fit
Fit Index Traits-Only Model CT-CM Model
AIC 44419.54 43980.01
BIC 44766.79 44377.67
Log-likelihood -22147.80 -21919.00
2 difference test
(df)
NA 242.18***
(9)
Note. 2 difference test is the Satorra-Bentler scaled chi-square difference test using the log-likelihood (Satorra & Bentler, 1999). ***p < .0001
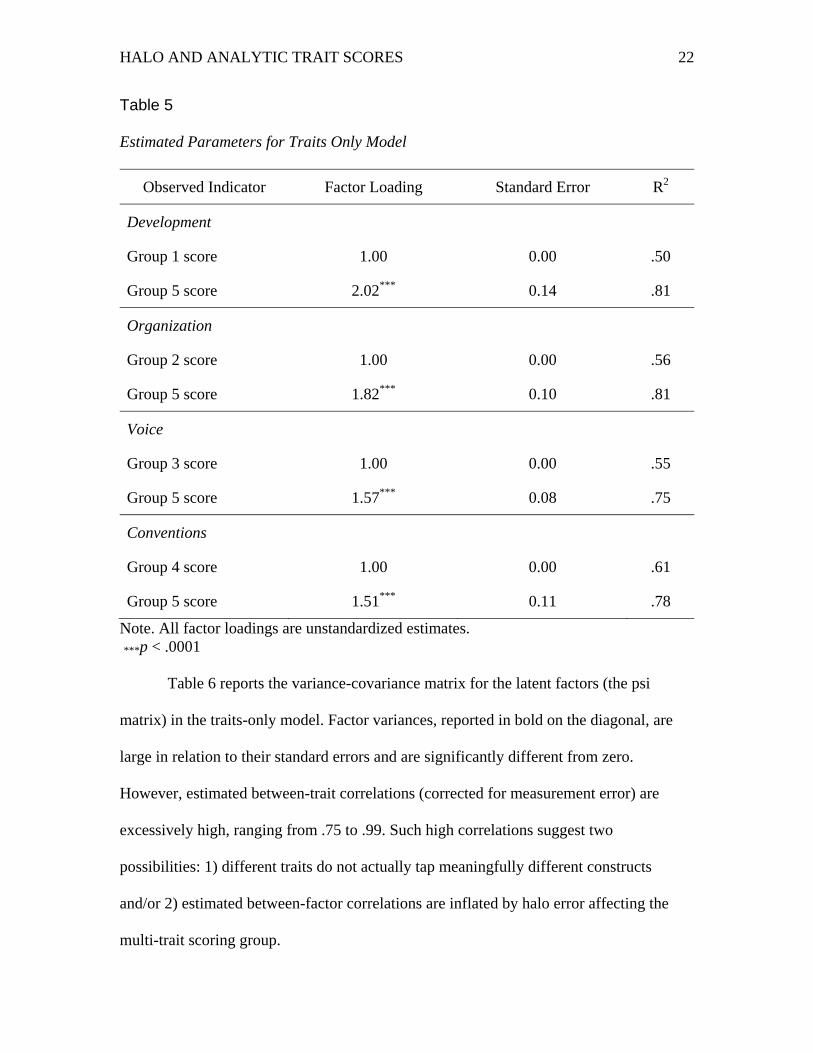
Table 5 reports estimated parameters for the traits-only model, which we review
here because results provide a telling comparison with those from the CT-CM model.
First, estimated factor loadings are positive and highly significant for all observed
indicators, which suggest strong relationships between ratings and their respective traits.
Interestingly, factor loadings for the multi-trait scoring group are uniformly larger than
those for the single-trait scoring group, suggesting these scores are weighted more
heavily within (and contribute more to) the composite trait factor. The proportion of
variance explained for each observed indicator in the traits-only model ranges from .50 to
.61 for the single-trait scores and from .75 to .81 for the multi-trait scores.
HALO AND ANALYTIC TRAIT SCORES
22
Table 5
Estimated Parameters for Traits Only Model
Observed Indicator Factor Loading Standard Error R2
Development
Group 1 score 1.00 0.00 .50
Group 5 score 2.02*** 0.14 .81
Organization
Group 2 score 1.00 0.00 .56
Group 5 score 1.82*** 0.10 .81
Voice
Group 3 score 1.00 0.00 .55
Group 5 score 1.57*** 0.08 .75
Conventions
Group 4 score 1.00 0.00 .61
Group 5 score 1.51*** 0.11 .78
Note. All factor loadings are unstandardized estimates. ***p < .0001
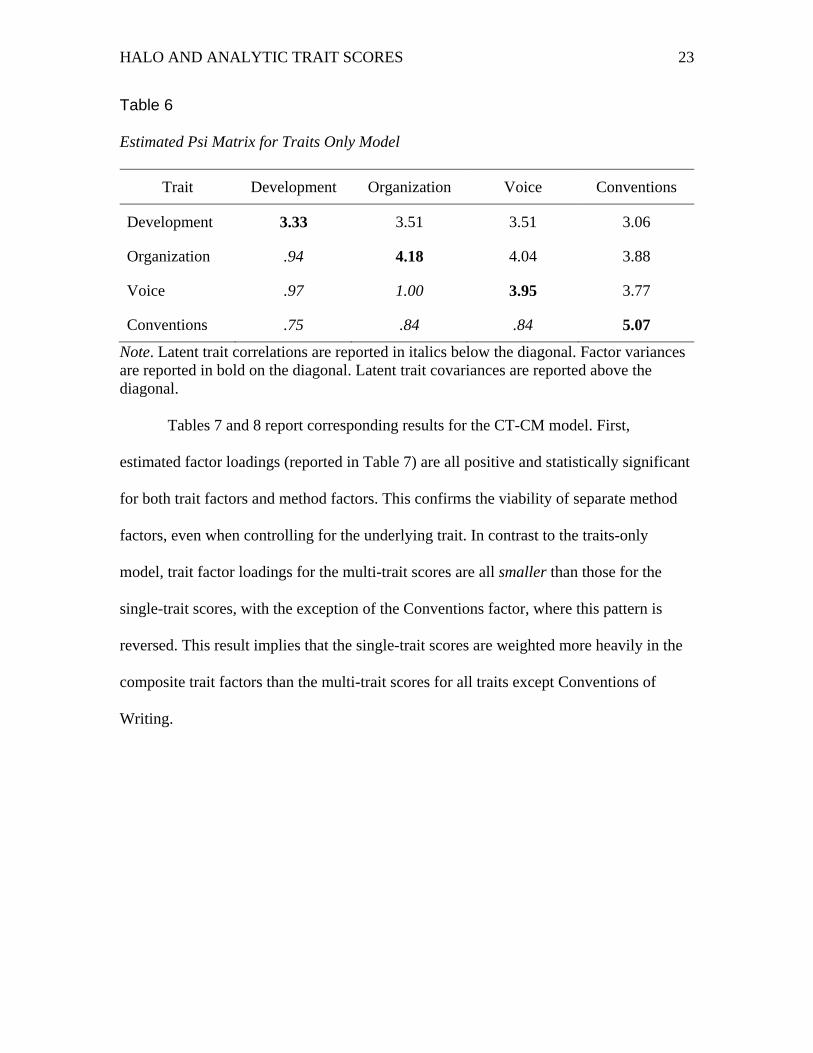
Table 6 reports the variance-covariance matrix for the latent factors (the psi
matrix) in the traits-only model. Factor variances, reported in bold on the diagonal, are
large in relation to their standard errors and are significantly different from zero.
However, estimated between-trait correlations (corrected for measurement error) are
excessively high, ranging from .75 to .99. Such high correlations suggest two
possibilities: 1) different traits do not actually tap meaningfully different constructs
and/or 2) estimated between-factor correlations are inflated by halo error affecting the
multi-trait scoring group.
HALO AND ANALYTIC TRAIT SCORES
23
Table 6
Estimated Psi Matrix for Traits Only Model
Trait Development Organization Voice Conventions
Development 3.33 3.51 3.51 3.06
Organization .94 4.18 4.04 3.88
Voice .97 1.00 3.95 3.77
Conventions .75 .84 .84 5.07
Note. Latent trait correlations are reported in italics below the diagonal. Factor variances are reported in bold on the diagonal. Latent trait covariances are reported above the diagonal.
Tables 7 and 8 report corresponding results for the CT-CM model. First,
estimated factor loadings (reported in Table 7) are all positive and statistically significant
for both trait factors and method factors. This confirms the viability of separate method
factors, even when controlling for the underlying trait. In contrast to the traits-only
model, trait factor loadings for the multi-trait scores are all smaller than those for the
single-trait scores, with the exception of the Conventions factor, where this pattern is
reversed. This result implies that the single-trait scores are weighted more heavily in the
composite trait factors than the multi-trait scores for all traits except Conventions of
Writing.

HALO AND ANALYTIC TRAIT SCORES
24
Table 7
Estimated Parameters for CT-CM Model
Trait Observed Indicator Factor Loading Standard Error R2
Development Group 1 score 1.00 0.00 .69
Group 5 score 0.70*** 0.14 .80
Organization Group 2 score 1.00 0.00 .76
Group 5 score 0.59*** 0.12 .86
Voice Group 3 score 1.00 0.00 .73
Group 5 score 0.44*** 0.07 .79
Conventions Group 4 score 1.00 0.00 .69
Group 5 score 1.15*** 0.22 .78
Single-trait method Group 1 score 1.00 0.00 .69
Group 2 score 1.26*** 0.09 .76
Group 3 score 1.16*** 0.09 .73
Group 4 score 1.06*** 0.09 .69
Multi-trait method Group 5, trait 1 1.00 0.00 .80
Group 5, trait 2 1.25*** 0.09 .86
Group 5, trait 3 0.98*** 0.09 .79
Group 5, trait 4 0.84*** 0.06 .78
Note. All factor loadings are unstandardized estimates. All R2 indices account for both variance due to trait and variance due to method. ***p < .0001

HALO AND ANALYTIC TRAIT SCORES
25
Table 8
Estimated Psi Matrix for CT-CM Model
Trait Dev Org Voice Con Single Multi
Dev 2.67 1.18 1.74 -0.27 0.00 0.00
Org .42 2.91 1.74 0.49 0.00 0.00
Voice .66 .63 2.66 0.46 0.00 0.00
Con -.11 .20 .19 2.15 0.00 0.00
Single .00 .00 .00 .00 4.74 6.93
Multi .00 .00 .00 .00 .91 12.21
Note. Dev=Development, Org=Organization, Con=Conventions, Single=Single-trait, Multi=Multi-trait. Latent trait correlations are reported in italics below the diagonal. Factor variances are reported in bold on the diagonal. Latent trait covariances are reported above the diagonal.
Comparing the relative magnitude of factor loadings for the methods factors, it is
evident that loadings for the single-trait method factor are all relatively similar. In
contrast, factor loadings for the multi-trait method factor are relatively variable, with
organization loading the strongest and conventions loading the weakest. Because the
multi-trait method factor represents variance due to halo bias, this result suggests that the
organization trait contributes most to halo, whereas the conventions trait contributes the
least.
For the CT-CM model, the proportion of variance explained in the observed
indicators (which encompasses variance due to both trait and method factors) ranges from
.69 to .76 for the single-trait scores and from .78 to .86 for the multi-trait scores. The
large disparity in R-squared indices for single-trait scores versus multi-trait scores
observed in the traits-only model shrinks to some extent in the CT-CM model. This is

HALO AND ANALYTIC TRAIT SCORES
26
mainly due to the fact that we appear to be explaining more of the variance in the single-
trait scores when we include separate methods factors than when we model only traits.
Notably, variance explained for the multi-trait scores remains virtually the same when we
include separate methods factors. This result is consistent with the argument that halo
effect frequently masquerades as valid trait variance. However, the fact that we are
explaining more of the variance in the single-trait scores with the CT-CM model is
puzzling and suggests the presence of some method-specific variance arising from the
single-trait scoring process.
Examining estimates from the psi matrix for the CT-CM model (reported in Table
8), one can see that all factor variances are large in relation to their standard errors and all
are significantly different from zero. Interestingly, the variance of the single-trait scoring
method factor is roughly twice the size of each of the trait factor variances, and the multi-
trait scoring factor variance is between 4 and 6 times larger than each of the trait factor
variances. This suggests that method-specific variance is contributing more to observed-
score variance than is trait-specific variance. Comparing the magnitude of the estimated
trait factor variances across the two models, one can see that these variances shrink when
specific method factors are included in the model. This result is consistent with the halo
effect: When specific method factors are not included in the model, method-specific
variance masquerades as valid trait variance.
Finally, estimated between-trait correlations (corrected for both measurement
error and halo bias) for the CT-CM model range from -.11 (for development –
conventions) to .65 (for development – voice). These correlations are uniformly smaller
than corresponding correlations from the traits-only model. Thus, between-trait

HALO AND ANALYTIC TRAIT SCORES
27
correlations appear to decrease when specific method factors are included in the model.
This result is also consistent with the presence of a halo effect. When specific method
factors are not included in the model, estimated between-trait correlations are inflated by
halo error to the extent that scores on one trait affect scores on the other traits for raters
who score multiple aspects of examinee performance. Interestingly, the two method
factors are correlated very highly (.91), which suggests that method-specific variance in
both scoring groups manifests itself in similar ways.
Uniqueness of Trait Scores
To address the second and third research questions (How highly correlated are
holistic and analytic scores in the absence of halo effect? and What dimensional
configuration best captures the structure of holistic and analytic writing assessment
scores?), we examined the data-to-model fit of the four confirmatory factor analytic
models discussed in Figure 4 in addition to a unidimensional model. Table 9 presents the
model fit indices (AIC, BIC, and SB chi-squared difference test) for each model. The
results are somewhat mixed, with the AIC suggesting that the 4D-C model is the best
fitting, while the BIC identifies the UD or 2D models as being equal in terms of fit.
Taken together, these indices suggest that neither the 4D-H nor the 5D models provide an
adequate depiction of the structure of the observed data. The SB chi-square difference
test statistic for nested models tells a slightly different story, suggesting that the 2D
model is a significant improvement over the 1D model; and in turn, model 4D-C is a
significant improvement over the 2D model. On the other hand, the SB chi-square
difference test statistic suggests that 4D-H does not improve significantly over 4D-C;
similarly, model 5D does not improve over 4D-H.

HALO AND ANALYTIC TRAIT SCORES
28
Table 9
Dimensionality Model Fit Statistics
Model AIC BIC SB 2
(p)
UD 29445.03 29641.06 NA
2D 29444.37 29646.01 14.28
(.0002)
4D-H 29411.26 29657.70 -0.25
4D-C 29410.03 29650.87 36.44
(.000006)
5D 29412.40 29664.44 0.15
(.49)
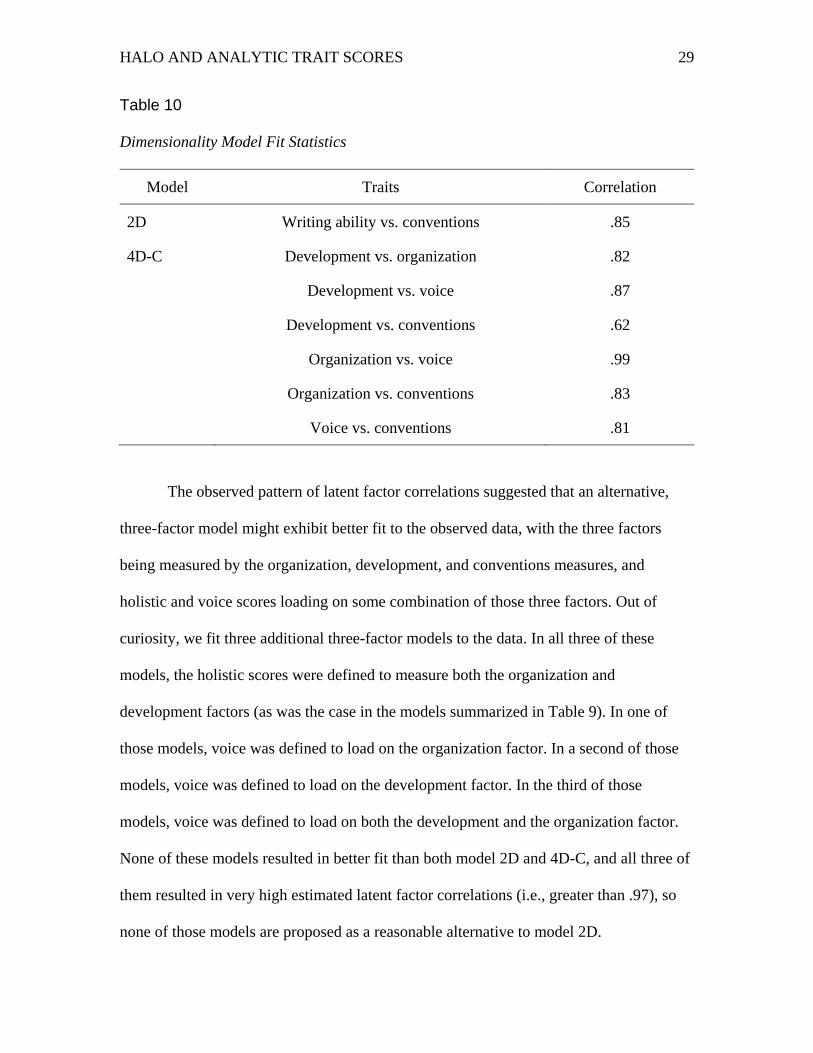
Inspection of the latent factor correlation estimates potentially provides
justification for differentiating between the usefulness of models UD, 2D, and 4D-C.
Table 10 summarizes those correlations, which indicate that model 4D-C may make
unnecessary distinctions between voice trait scores and trait scores for ideas and
organization, with estimated latent factor correlations equal to .87 and .99, respectively.
In addition, the correlation between the development and organization latent factors is not
altogether low, estimated to equal .82. In all cases, these correlations support the notion
that these three measures of writing ability are distinguishable from the conventions
latent factor, with all correlations being less than .85. Hence, our results support a two-
dimensional model that distinguishes conventions from the remaining scores.
HALO AND ANALYTIC TRAIT SCORES
29
Table 10
Dimensionality Model Fit Statistics
Model Traits Correlation
2D Writing ability vs. conventions .85
4D-C Development vs. organization
Development vs. voice
Development vs. conventions
Organization vs. voice
Organization vs. conventions
Voice vs. conventions
.82
.87
.62
.99
.83
.81
The observed pattern of latent factor correlations suggested that an alternative,
three-factor model might exhibit better fit to the observed data, with the three factors
being measured by the organization, development, and conventions measures, and
holistic and voice scores loading on some combination of those three factors. Out of
curiosity, we fit three additional three-factor models to the data. In all three of these
models, the holistic scores were defined to measure both the organization and
development factors (as was the case in the models summarized in Table 9). In one of
those models, voice was defined to load on the organization factor. In a second of those
models, voice was defined to load on the development factor. In the third of those
models, voice was defined to load on both the development and the organization factor.
None of these models resulted in better fit than both model 2D and 4D-C, and all three of
them resulted in very high estimated latent factor correlations (i.e., greater than .97), so
none of those models are proposed as a reasonable alternative to model 2D.

HALO AND ANALYTIC TRAIT SCORES
30
Discussion
This study sought to answer three research questions relating to analytic and trait
scores both in the presence and absence of opportunities for raters to exhibit halo effects.
In response to the first research question, To what extent do dimensional analytic writing
scores assigned by the same raters exhibit a halo effect?, collectively, our results imply
the presence of method-specific variance, and the pattern of parameter estimates across
models strongly suggests a halo effect for those in the multi-group scoring model. The
model incorporating both trait and method factors exhibits significantly better fit to the
data than a model with trait factors only. Patterns of factor loadings, R-squared indices,
factor variances, and between-trait correlations are all consistent with a halo effect for
scorers rating multiple aspects of examinee performance. Moreover, results suggest that
the halo effect does not affect all four traits equally. In particular, organization scores
appear to contribute the most and conventions scores the least to the halo effect. This
result is consistent with previous studies that have found inconsistent method effects
across traits (Eid, Lischetzke, Nussbeck, & Trierweiler, 2003). It is possible that certain
types of traits are inherently more influential on rater behavior than others.
It is also possible that variable factor loadings simply reflect the relative order in
which scorers tend to evaluate the traits. If examinee performance on the first or second
trait evaluated impacts ratings on subsequent traits, one might expect that the factor
loadings for those initial traits would be larger than those for traits rated subsequently. In
this study, no data were collected concerning the sequence in which scorers rated the
traits. Although scorers were trained to evaluate the traits in a certain order (development,
organization, voice, and conventions), scorers were free to evaluate the traits in any order
HALO AND ANALYTIC TRAIT SCORES
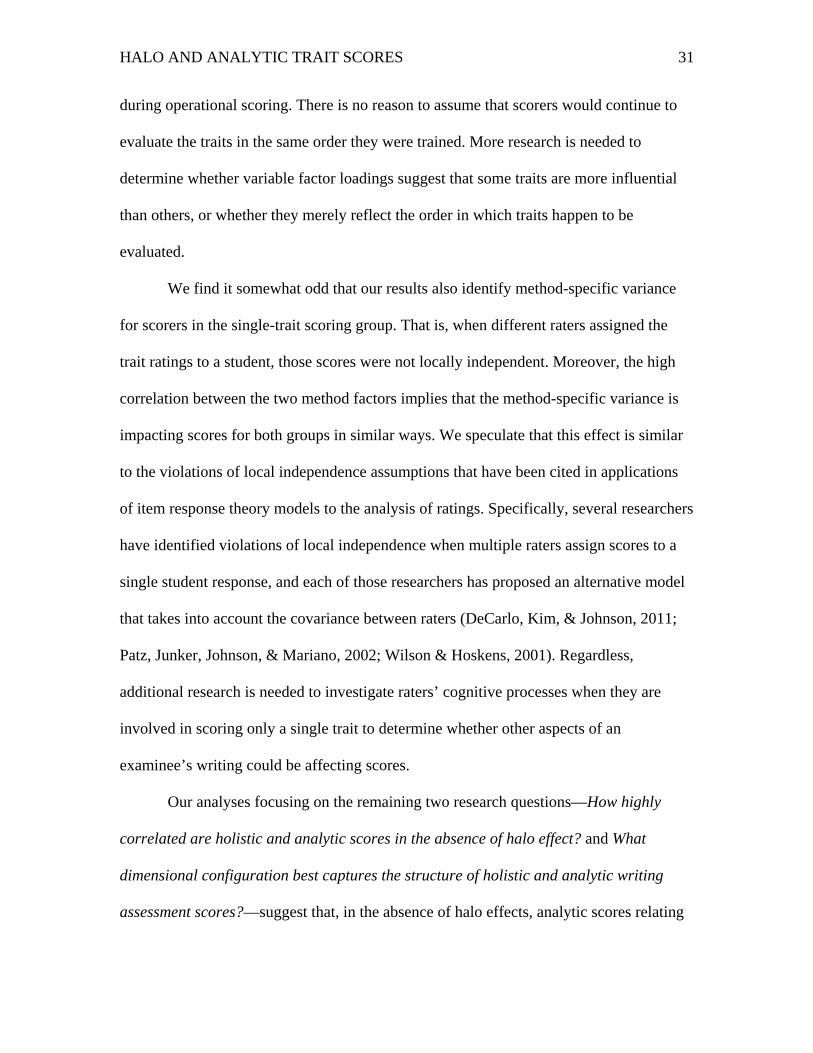
31
during operational scoring. There is no reason to assume that scorers would continue to
evaluate the traits in the same order they were trained. More research is needed to
determine whether variable factor loadings suggest that some traits are more influential
than others, or whether they merely reflect the order in which traits happen to be
evaluated.
We find it somewhat odd that our results also identify method-specific variance
for scorers in the single-trait scoring group. That is, when different raters assigned the
trait ratings to a student, those scores were not locally independent. Moreover, the high
correlation between the two method factors implies that the method-specific variance is
impacting scores for both groups in similar ways. We speculate that this effect is similar
to the violations of local independence assumptions that have been cited in applications
of item response theory models to the analysis of ratings. Specifically, several researchers
have identified violations of local independence when multiple raters assign scores to a
single student response, and each of those researchers has proposed an alternative model
that takes into account the covariance between raters (DeCarlo, Kim, & Johnson, 2011;
Patz, Junker, Johnson, & Mariano, 2002; Wilson & Hoskens, 2001). Regardless,
additional research is needed to investigate raters’ cognitive processes when they are
involved in scoring only a single trait to determine whether other aspects of an
examinee’s writing could be affecting scores.
Our analyses focusing on the remaining two research questions—How highly
correlated are holistic and analytic scores in the absence of halo effect? and What
dimensional configuration best captures the structure of holistic and analytic writing
assessment scores?—suggest that, in the absence of halo effects, analytic scores relating

HALO AND ANALYTIC TRAIT SCORES
32
to features of the ideas, development, and organization may be too highly correlated to
provide useful distinctions. For example, in the best fitting alternative to the two-
dimensional model, the estimated latent factor correlations between voice and the factors
defined by development and organization were greater than .87. Hence, we suggest that,
at best, we can differentiate between two dimensions of writing and, even then, the
correlation between what we refer to as “writing ability” and conventions is still quite
high (i.e., r = .85 in our analyses). We believe that this is an important result because
prior attempts to depict these correlations relied on data collection procedures that may
have confounded between-factor correlations with halo effects—a fact that may have
inflated estimates of the latent factor correlations. Our results suggest that these
correlations are indeed as high as those observed in prior studies, even in scoring designs
that minimize the influence of halo effects.
The use of constructed-response (CR) item formats and performance-based
assessments (PBAs) will most certainly increase in coming years as the Race to the Top
Assessment consortia roll out the next generation of large-scale assessments. Assessment
plans released by the consortia indicate an increased number of complex, multi-stage or
“integrative” performance tasks than have been used on large-scale assessments in the
past. Such tasks tend to create scores on multiple traits or multiple dimensions of
performance for the same response. Although automated scoring represents one potential
strategy for avoiding halo, not all task types can be automatically scored using current
technology. Also, such scoring engines must be calibrated using human-assigned scores.
Thus, human scoring will continue to be a requirement for assessment programs
employing CR item types or PBAs.
HALO AND ANALYTIC TRAIT SCORES
33
This trend has implications for the types of human scoring models that will be
most appropriate. Human scoring models in which a single rater scores all traits for a
single response are cheaper and more efficient. Thus, they are more common than scoring
models in which raters score only a single trait for a given response. However, results
from this study, which presents a unique approach to capturing halo, suggest that these
approaches may introduce bias due to the halo effect.
HALO AND ANALYTIC TRAIT SCORES
34
References
Aryadoust, V. (2010). Investigating writing sub-skill in testing English as a foreign
language: A structural equation modeling study. TESL-EJ, 13, 1-20.
Bacha, N. (2001). Writing evaluation: What can analytic versus holistic essay scoring tell
us? System, 29, 371-383.
Barkaoui, K. (2007). Rating scale impact on EFL essay marking: A mixed-method study.
Assessing Writing, 12, 86-107.
Bechger, T.M., Maris, G., & Hsiao, Y.P. (2010). Detecting halo effects in performance
based examinations. Applied Psychological Measurement, 34(607-619).
Campbell, D.T., & Fiske, D.W. (1959). Convergent and discriminant validation by the
multitrait-multimethod matrix. Psychological Bulletin, 56, 81-105.
Carr, N.T. (2000). A comparison of the effects of analytic and holistic rating scale type in
the context of composition tests. Issues in Applied Linguistics, 11, 207-241.
Cheung, G.W. (1999). Multifaceted conceptions of self-other ratings disagreement.
Personnel Psychology, 52, 1-36.
Chi, E. (2001). Comparing holistic and analytic scoring for performance assessment with
many-facet Rasch model. Journal of Applied Measurement, 2, 379-388.
Conway, J.M. (1999). Distinguishing contextual performance from task performance for
managerial jobs. Journal of Applied Psychology, 84, 3-13.

HALO AND ANALYTIC TRAIT SCORES
35
DeCarlo, L.T., Kim, Y.K., & Johnson, M.S. (2011). A hierarchical rater model for
constructed responses, with a signal detection rater model. Journal of Educational
Measurement, 48, 333-356.
Eid, M., Lischetzke, T., Nussbeck, F.W., & Trierweiler, L.I. (2003). Separating trait
effects from trait-specific method effects in multitrait-multimethod models: A
multiple indicator CT-C(M-1) model. Psychological Methods, 8, 38-60.
Hartel, C.E. (1993). Rating format research revisited: Format effectiveness and
acceptability depend on rater characteristics. Journal of Applied Psychology,
78(2), 212-217.
Hoyt, W.T. (2000). Rater bias in psychological research: When is it a problem and what
can we do about it? Psychological Methods, 5, 64-86.
Klein, S.P., Stecher, B.M., Shavelson, R.J., McCaffrey, D., Ormseth, T., Bell, R.M., . . .
Othman, A.R. (1998). Analytic versus holistic scoring of science performance
tasks. Applied Measurement in Education, 11, 121-137.
Kozlowski, S.W., & Kirsch, M.P. (1987). The systematic distortion hypothesis, halo, and
accuracy: An individual-level analysis. Journal of Applied Psychology, 72, 252-
261.
Lee, Y.W., Gentile, C., & Kantor, R. (2008). Analytic scoring of TOEFL CBT essays:
Scores from humans and E-rater. Princeton, NJ: ETS.
Marsh, H.W., & Butler, S. (1984). Evaluating reading diagnostic tests: An application of
confirmatory factor analysis to multitrait-multimethod data. Applied
Psychological Measurement, 8, 307-320.

HALO AND ANALYTIC TRAIT SCORES
36
Marsh, H.W., & Yeung, A.S. (1997). Causal effects of academic self-concept on
academic achievement: Structural equation models of longitudinal data. Journal
of Educational Psychology, 89, 41-54.
Murphy, K.R., Jako, R.A., & Anhalt, R.L. (1993). Nature and consequences of halo error:
A critical analysis. Journal of Applied Psychology, 78, 218-225.
Muthén, L.K., & Muthén, B.O. (1998-2007). Mplus user’s guide (5th ed.). Los Angeles,
CA: Muthén & Muthén.
Patz, R.J., Junker, B.W., Johnson, M.S., & Mariano, L.T. (2002). The hierarchical rater
model for rated test items and its application to large-scale educational assessment
data. Journal of Educational and Behavioral Statistics, 27, 341-384.
Robb Singer, N., & LeMahieu, P. (2011). The effect of scoring order on the
independence of holistic and analytic scores. Journal of Writing Assessment, 4.
Satorra, A., & Bentler, P.M. (1999). A scaled difference chi-square test statistic for
moment structure analysis. Technical Report. Department of Statistics, University
of California. Los Angeles.
Schoonen, R. (2005). Generalizability of writing scores: An application of structural
equation modeling. Language Testing, 22, 1-30.
Solomonson, A.L., & Lance, C.E. (1997). Examination of the relationship between true
halo and halo error in performance ratings. Journal of Applied Psychology, 82(5),
665-674.
Thorndike, E.L. (1920). A constant error in psychological ratings. Journal of Applied
Psychology, 4, 25-29.
HALO AND ANALYTIC TRAIT SCORES
37
Viswesvaran, C., Schmidt, F.L., & Ones, D.S. (2005). Is there a general factor in ratings
of job performance? A meta-analytic framework for disentangling substantive and
error influences. Journal of Applied Psychology, 90(1), 108-131.
Wilson, M., & Hoskens, M. (2001). The rater bundle model. Journal of Educational and
Behavioral Statistics, 26, 283-306.
HALO AND ANALYTIC TRAIT SCORES
38
Endnotes
1 Groups 1 and 2 were located at the midwestern scoring center, and Groups 3 through 6 were located at the southwestern scoring center.