halogenated very short-lived substances, in
TRANSCRIPT
CHAPTER 2Halogenated Very Short-Lived Substances
Lead Authors:K.S. Law
W.T. Sturges
Coauthors:D.R. BlakeN.J. Blake
J.B. BurkholderJ.H. Butler
R.A. CoxP.H. HaynesM.K.W. Ko
K. KreherC. Mari
K. PfeilstickerJ.M.C. Plane
R.J. SalawitchC. Schiller
B.-M. SinnhuberR. von Glasow
N.J. WarwickD.J. Wuebbles
S.A. Yvon-Lewis
Contributors:A. Butz
D.B. ConsidineM. Dorf
L. FroidevauxL.J. Kovalenko
N.J. LiveseyR. Nassar
C.E. SiorisD.K. Weisenstein
Final Release: February 2007From Scientific Assessment of Ozone Depletion: 2006

CHAPTER 2
HALOGENATED VERY SHORT-LIVED SUBSTANCES
Contents
SCIENTIFIC SUMMARY . . . . . . . . . . . . . . . . . . . . . . . . . . . . . . . . . . . . . . . . . . . . . . . . . . . . . . . . . . . . . . . . . . . . . 2.1
2.1 INTRODUCTION . . . . . . . . . . . . . . . . . . . . . . . . . . . . . . . . . . . . . . . . . . . . . . . . . . . . . . . . . . . . . . . . . . . . . . . 2.5
2.2 SOURCES, DISTRIBUTIONS, AND TRENDS OF VSLS . . . . . . . . . . . . . . . . . . . . . . . . . . . . . . . . . . . . . . . . 2.92.2.1 New Observations of the Distributions and Abundances of VSL Source Gases . . . . . . . . . . . . . . . . . 2.9
2.2.1.1 Bromine and Iodine . . . . . . . . . . . . . . . . . . . . . . . . . . . . . . . . . . . . . . . . . . . . . . . . . . . . . . . 2.122.2.1.2 Chlorine . . . . . . . . . . . . . . . . . . . . . . . . . . . . . . . . . . . . . . . . . . . . . . . . . . . . . . . . . . . . . . . . 2.13
2.2.2 Terrestrial Emissions . . . . . . . . . . . . . . . . . . . . . . . . . . . . . . . . . . . . . . . . . . . . . . . . . . . . . . . . . . . . . 2.132.2.3 Oceanic Emissions . . . . . . . . . . . . . . . . . . . . . . . . . . . . . . . . . . . . . . . . . . . . . . . . . . . . . . . . . . . . . . . 2.15
2.2.3.1 Bromine . . . . . . . . . . . . . . . . . . . . . . . . . . . . . . . . . . . . . . . . . . . . . . . . . . . . . . . . . . . . . . . . 2.152.2.3.2 Iodine . . . . . . . . . . . . . . . . . . . . . . . . . . . . . . . . . . . . . . . . . . . . . . . . . . . . . . . . . . . . . . . . . . 2.172.2.3.3 Chlorine . . . . . . . . . . . . . . . . . . . . . . . . . . . . . . . . . . . . . . . . . . . . . . . . . . . . . . . . . . . . . . . . 2.17
2.2.4 Industrial and Other Anthropogenic Emissions . . . . . . . . . . . . . . . . . . . . . . . . . . . . . . . . . . . . . . . . . 2.172.2.4.1 Bromine . . . . . . . . . . . . . . . . . . . . . . . . . . . . . . . . . . . . . . . . . . . . . . . . . . . . . . . . . . . . . . . . 2.172.2.4.2 Chlorine . . . . . . . . . . . . . . . . . . . . . . . . . . . . . . . . . . . . . . . . . . . . . . . . . . . . . . . . . . . . . . . . 2.182.2.4.3 New VSL Gases . . . . . . . . . . . . . . . . . . . . . . . . . . . . . . . . . . . . . . . . . . . . . . . . . . . . . . . . . . 2.18
2.2.5 Sources and Distributions of Inorganic Halogens of Marine Origin . . . . . . . . . . . . . . . . . . . . . . . . . 2.18
2.3 ATMOSPHERIC CHEMISTRY OF VSLS . . . . . . . . . . . . . . . . . . . . . . . . . . . . . . . . . . . . . . . . . . . . . . . . . . . 2.192.3.1 Removal of Halogen Source Gases . . . . . . . . . . . . . . . . . . . . . . . . . . . . . . . . . . . . . . . . . . . . . . . . . . 2.192.3.2 Tropospheric Lifetimes of Halocarbons . . . . . . . . . . . . . . . . . . . . . . . . . . . . . . . . . . . . . . . . . . . . . . . 2.202.3.3 Production and Gas-Phase Removal of VSL Organic Product Gases . . . . . . . . . . . . . . . . . . . . . . . . 2.212.3.4 Multiphase Processes Involving Inorganic Bromine and Iodine Compounds . . . . . . . . . . . . . . . . . . 2.21
2.3.4.1 Wet Deposition Processes . . . . . . . . . . . . . . . . . . . . . . . . . . . . . . . . . . . . . . . . . . . . . . . . . . 2.212.3.4.2 Heterogeneous Halogen Activation . . . . . . . . . . . . . . . . . . . . . . . . . . . . . . . . . . . . . . . . . . . 2.23
2.3.5 Iodine Chemistry . . . . . . . . . . . . . . . . . . . . . . . . . . . . . . . . . . . . . . . . . . . . . . . . . . . . . . . . . . . . . . . . 2.23
2.4 DYNAMICS AND TRANSPORT IN THE TROPOPAUSE REGION AND IMPLICATIONS FOR VSLS 2.242.4.1 Tropical Convection, the TTL, and Tropical Troposphere-to-Stratosphere Transport . . . . . . . . . . . . 2.252.4.2 Stratosphere-Troposphere Exchange in the Extratropics . . . . . . . . . . . . . . . . . . . . . . . . . . . . . . . . . . 2.282.4.3 Predictive Modeling of the Tropopause Region . . . . . . . . . . . . . . . . . . . . . . . . . . . . . . . . . . . . . . . . . 2.30
2.5 CONTRIBUTION OF HALOGENATED VSLS TO STRATOSPHERIC HALOGEN LOADING . . . . . . . . 2.312.5.1 Source Gas Injection (SGI) and Product Gas Injection (PGI) . . . . . . . . . . . . . . . . . . . . . . . . . . . . . . 2.31
2.5.1.1 Observational Evidence for SGI . . . . . . . . . . . . . . . . . . . . . . . . . . . . . . . . . . . . . . . . . . . . . 2.312.5.1.2 Observational Evidence for PGI . . . . . . . . . . . . . . . . . . . . . . . . . . . . . . . . . . . . . . . . . . . . . 2.322.5.1.3 Model Estimates of SGI and PGI . . . . . . . . . . . . . . . . . . . . . . . . . . . . . . . . . . . . . . . . . . . . . 2.34
2.5.2 Estimates of VSLS Contributions to Stratospheric Halogens Based onMeasurements of Inorganic Species . . . . . . . . . . . . . . . . . . . . . . . . . . . . . . . . . . . . . . . . . . . . . . . . . . 2.352.5.2.1 Bromine . . . . . . . . . . . . . . . . . . . . . . . . . . . . . . . . . . . . . . . . . . . . . . . . . . . . . . . . . . . . . . . . 2.362.5.2.2 Chlorine . . . . . . . . . . . . . . . . . . . . . . . . . . . . . . . . . . . . . . . . . . . . . . . . . . . . . . . . . . . . . . . . 2.412.5.2.3 Iodine . . . . . . . . . . . . . . . . . . . . . . . . . . . . . . . . . . . . . . . . . . . . . . . . . . . . . . . . . . . . . . . . . . 2.42
2.6 POTENTIAL IMPACT OF VSLS ON OZONE . . . . . . . . . . . . . . . . . . . . . . . . . . . . . . . . . . . . . . . . . . . . . . . . 2.432.6.1 Effects of Halogenated VSLS on Column Ozone . . . . . . . . . . . . . . . . . . . . . . . . . . . . . . . . . . . . . . . . 2.432.6.2 ODPs for Halogenated VSLS . . . . . . . . . . . . . . . . . . . . . . . . . . . . . . . . . . . . . . . . . . . . . . . . . . . . . . . 2.45

2.7 POTENTIAL FUTURE CONSIDERATIONS . . . . . . . . . . . . . . . . . . . . . . . . . . . . . . . . . . . . . . . . . . . . . . . . . 2.45
REFERENCES . . . . . . . . . . . . . . . . . . . . . . . . . . . . . . . . . . . . . . . . . . . . . . . . . . . . . . . . . . . . . . . . . . . . . . . . . . . . . 2.46
VERY SHORT-LIVED SUBSTANCES
2.1
SCIENTIFIC SUMMARY
Definition of Halogenated Very Short-Lived Substances (VSLS)
• Very short-lived substances (VSLS) are defined as trace gases whose local tropospheric lifetimes are comparable to,or shorter than, tropospheric transport time scales, such that their tropospheric distributions are non-uniform. Inpractice, VSLS are considered to have atmospheric lifetimes of less than 6 months. We consider only halogenatedVSLS, i.e., those that contain bromine, chlorine, or iodine. We consider VSLS to include very short-lived (VSL)source gases (SGs), halogenated organic and inorganic product gases (PGs) arising from SG degradation, and othersources of tropospheric inorganic halogens.
Importance of VSLS for Stratospheric Halogen and Ozone Trends
BROMINE
• Our quantitative understanding of how halogenated very short-lived substances contribute to halogen levelsin the stratosphere has improved significantly since the last Assessment (WMO, 2003), with brominatedVSLS believed to make a significant contribution to total stratospheric bromine and its effect on strato-spheric ozone. Various lines of evidence show that brominated VSLS contribute about 5 ppt (with estimatesranging from 3 to 8 ppt) to total stratospheric inorganic bromine (Bry):
– Estimates of total stratospheric Bry derived from different observations of bromine monoxide (BrO) relevantto the late 1990s are about 18 to 25 parts per trillion (ppt). This is greater than the 16 to 17 ppt of brominedelivered to the stratosphere by “long-lived” brominated source gases (i.e., the halons and methyl bromide,CH3Br) during this period.
– Measurements of organic brominated very short-lived source gases (VSL SGs) in the tropical upper tropo-sphere amount to about 3.5 ppt. Product gases (from SG degradation) and other sources of tropospheric inor-ganic bromine may also contribute comparable amounts.
• The inclusion of additional stratospheric Bry from VSLS in models leads to larger ozone destruction at mid-latitudes and polar regions compared with studies including only long-lived bromine source gases. In bothregions, the enhanced ozone loss occurs in the lower stratosphere via interactions of this bromine with anthro-pogenic chlorine. Midlatitude ozone loss is most enhanced during periods of high aerosol loading. Ozone lossthrough cycles involving bromine and odd-hydrogen (HOx) is also enhanced at midlatitudes under all conditions,becoming comparable with ozone loss by HOx cycles alone. This additional amount of stratospheric bromine hasnot, to date, been routinely included in model calculations of midlatitude ozone depletion.
• Levels of stratospheric Bry continue to show evidence for a trend that is consistent with that of tropospherictotal bromine. Further studies are required to determine if the recent decline in tropospheric bromine is reflected instratospheric bromine abundance.
IODINE
• It is unlikely that iodine is important for stratospheric ozone loss in the present-day atmosphere. There islittle evidence for inorganic iodine, in the form of iodine monoxide (IO), in the lower stratosphere at concentrationsabove about 0.1 ppt. This difference in behavior compared with bromine may be partly attributed to the short pho-tochemical lifetime of iodine SGs, their lower abundance, and aerosol uptake of iodine oxides.
CHLORINE
• The sum of the chlorine content from VSL SGs in the tropical upper troposphere is currently estimated to beabout 50 ppt, on the basis of available observations. While a 50 ppt contribution to total inorganic stratosphericchlorine (Cly) from VSLS represents only 1 to 2% of Cly from long-lived source gases (~3500 ppt), it would repre-sent a significant contribution compared with the background Cly from methyl chloride of about 550 ppt (Chapter 1).
VERY SHORT-LIVED SUBSTANCES
2.2
• Phosgene (COCl2), which can be produced from chlorinated VSL SGs as well as long-lived chlorine gases, hasbeen observed at levels of around 20 to 25 ppt in the tropical upper troposphere. The contribution of this gas tostratospheric Cly (up to about 40 to 50 ppt) is not currently included in most models.
• Analyses of upper stratospheric hydrogen chloride (HCl) measurements from satellite instruments are gener-ally consistent with a possible contribution of VSLS to stratospheric Cly. Further improvements in HCl meas-urement accuracy are required to quantify this contribution.
Sources and Trends of Halogenated Very Short-Lived Source Gases
BROMINE
• The majority of known brominated VSL SGs are of natural origin. A few brominated VSLS have almostexclusively anthropogenic sources, notably n-propyl bromide (n-PB). Some have small contributions fromanthropogenic sources, e.g., certain brominated trihalomethanes.
• Most brominated VSL SGs are emitted from the ocean, with higher emissions in tropical coastal regions. Sea sur-face supersaturations of some gases, due to production by marine microorganisms, have been found to be elevated in thetropical open ocean. High concentrations in air have been observed near coasts over tropical and temperate waters.
• Inorganic tropospheric sources of bromine, such as sea salt and volcanoes, may also contribute to inorganicbromine in the free troposphere. Some fraction of this contribution could be subsequently transported to thestratosphere.
• There is no evidence for a trend in the sum of brominated VSL SGs during the latter half of the 20th century.This is according to trend reconstructions from firn air studies, and reflects their predominantly natural origins. Theexceptions are some trihalomethane species, which have increased slightly in the Northern Hemisphere, possiblydue to small anthropogenic sources.
IODINE
• Iodinated VSLS are exclusively of natural origin in the present-day atmosphere, although the possibility ofdeliberate future anthropogenic use of new SGs exists. A notable example is the proposed use of trifluo-roiodomethane (CF3I).
• Iodinated VSL SGs are emitted from the ocean, with higher emissions in tropical ocean regions. Emissions inthe marine boundary layer are dominated by iodomethanes such as methyl iodide (CH3I) and chloroiodomethane(CH2ClI), which are produced both by marine organisms and by abiotic photochemical processes in surface waters.There is some evidence for enhanced marine emissions of iodinated VSL SGs in the tropics and subtropics, and alsoin regions of high productivity in coastal zones.
CHLORINE
• Chlorinated VSL SGs originate largely from anthropogenic emissions, although natural sources also con-tribute. Their principal emissions are, therefore, more likely to be located at northern midlatitudes.
• There is evidence for significant recent declines in concentrations of some chlorinated VSL SGs, notably chlo-roform, dichloromethane, and tetrachloroethene.
Transport, Lifetimes, and Sinks of Halogenated VSLS
• The predominant pathways for VSLS transport into the upper troposphere are likely to be in tropical convec-tion regions, co-located with high emissions of VSLS over tropical oceans. The fraction of a halogenated VSL SGthat reaches the stratosphere via the source gas injection (SGI) pathway depends on its local chemical lifetime relative
VERY SHORT-LIVED SUBSTANCES
2.3
to local transport time scales. Local SG lifetimes depend strongly on distributions of photochemical sinks and emis-sion patterns and, as such, this limits the value of using a single “global” lifetime, as has often been used previously.
• The amount of VSL PGs entering the stratosphere depends on the locations of their tropospheric productionand loss processes. The fraction of halogenated organic and inorganic PGs (produced from the decomposition ofVSL SGs) that enters the stratosphere via the product gas injection (PGI) pathway depends on the location in thetroposphere where the “parent” SG decomposes, and on subsequent loss processes such as (possibly irreversible)uptake of the PG on to aerosol/cirrus, or uptake of soluble species in precipitating clouds.
• Many more data have become available on Henry’s Law constants, uptake coefficients, and heterogeneousreactivity for a number of relevant surfaces and for a wide range of PGs. Many uncertainties, however, stillremain. Furthermore, incorporation of this knowledge into large-scale models is often lacking, thus limiting assess-ment of the location-dependent lifetimes and distributions of VSL PGs.
• The impact of halogens from VSL SGs on column ozone is likely to be greatest in the extratropics. The domi-nant transport pathway is likely to be via quasi-horizontal transport from the tropical upper troposphereinto the extratropical lowermost stratosphere. While transport time scales via this pathway, and back to the tro-posphere, are relatively short (a few months), the short chemical lifetime of VSL SGs means that they will be fullydegraded into inorganic halogen before they can be transported back into the troposphere. Quasi-horizontal trans-port from the tropical upper troposphere is highly seasonal, being much larger in the summer than winter.
• Recent model simulations continue to suggest that, depending on lifetime and location of emissions, less than1% of the VSL SG flux emitted at the surface enters the stratosphere via the SGI pathway, and a largeramount (up to a few percent) enters via the PGI pathway. Studies are limited, however, by the ability of currentglobal models to accurately simulate deep convection and transport into the lower stratosphere.
Ozone Depletion Potentials (ODPs) of Halogenated VSL SGs
• There are no new evaluations for the ODP of n-propyl bromide (0.1 for tropical emissions, and 0.02-0.03 foremissions restricted to northern midlatitudes).
• New analyses suggest ODPs for CF3I ranging from 0.011 to 0.018 for surface emissions at midlatitudes and in thetropics, respectively, which are higher than found previously (<0.008). The model studies do not include uptake ofiodine on aerosols, the inclusion of which could result in lower calculated values. If CF3I were to be used for firefighting/inhibition on aircraft, then it could be emitted at higher altitudes and the corresponding ODP would be larger.
• New analyses confirm previous estimates that the ODP of a chlorinated VSL SG with a lifetime of ~25 days,one chlorine atom, and similar molecular weight to CFC-11, is about 0.003.
Future Considerations for Halogenated VSLS
• Possible future changes in anthropogenic VSLS. If anthropogenic emissions increased, or if presently unusedhalogenated VSL SGs were to come into widespread commercial use, then halogenated VSLS would become ofincreased importance in affecting the future behavior of stratospheric ozone.
• Delivery of VSLS to the stratosphere may change in the future in response to circulation changes. The impactof natural halogenated VSLS might also be influenced by changes in the atmospheric circulation, which could, forexample, increase the rate of delivery of VSL SGs and PGs into the stratosphere.
• Natural VSLS emissions may respond to future changes in climate processes. Natural sources could respond tochanges in, for example, carbon dioxide (CO2), land use, wind speed, and temperature. Our knowledge about thesepotential effects, and many other relevant feedbacks, is very limited at present.

2.1 INTRODUCTION
An important goal of previous Assessments was toquantify the impact of halogen-containing source gaseson stratospheric ozone (e.g., WMO, 2003, 1999). In thelast Assessment (WMO, 2003), the possible contributionof very short-lived substances (VSLS) was examined indetail in Chapter 2 (Ko and Poulet et al., 2003) and anapproach for determining their Ozone Depletion Potentials(ODPs) was presented. VSLS are defined as substancesthat have atmospheric lifetimes comparable to, or less than,average tropospheric transport time scales of about 6months. We consider halogenated very short-lived (VSL)organic source gases (SGs), and the halogenated organicand inorganic product gases (PGs) arising from theatmospheric degradation of VSL SGs, and also inorganictropospheric halogen sources such as sea salt. Note that,in contrast to WMO (2003), sulfur-containing VSLS (e.g.,dimethyl sulfide (DMS), and sulfur dioxide (SO2)) aredealt with in Chapter 5 of this Assessment. Halogen atomsbound in SGs and intermediate degradation products arereferred to as organic halogen, and the final products arereferred to as inorganic halogen (containing no carbon)
(e.g., hydrogen chloride (HCl), hydrogen bromide (HBr),chlorine monoxide (ClO), bromine monoxide (BrO), andiodine monoxide (IO)). Some important acronyms usedin this chapter are defined in Box 2-1 below.
This chapter assesses the contribution of halo-genated VSLS to the halogen loading in the stratosphere,as well as their possible contribution to past, present, andfuture stratospheric ozone loss, and considers the ODPs ofsubstances that are, or might be, released as a result ofhuman activities. Table 2-1 provides a list of the VSL SGsdiscussed in this chapter, together with an estimation oftheir local photochemical lifetimes and an indication ofwhether these gases have predominantly natural or anthro-pogenic origins and/or are proposed for new commercialapplications. The majority of currently observable VSLSGs are thought to be partly or wholly of natural origin.A few halogenated VSLS have predominantly anthro-pogenic origins (e.g., n-propyl bromide (n-C3H7Br), 1,2-dibromoethane (CH2BrCH2Br), dichloromethane (CH2Cl2),tetrachloroethene (C2Cl4), and, to a lesser extent, chloro-form (CHCl3)). Currently, among the compounds listed inTable 2-1, only bromochloromethane (CH2BrCl) is con-sidered by the Montreal Protocol. In the light of observed
VERY SHORT-LIVED SUBSTANCES
2.5
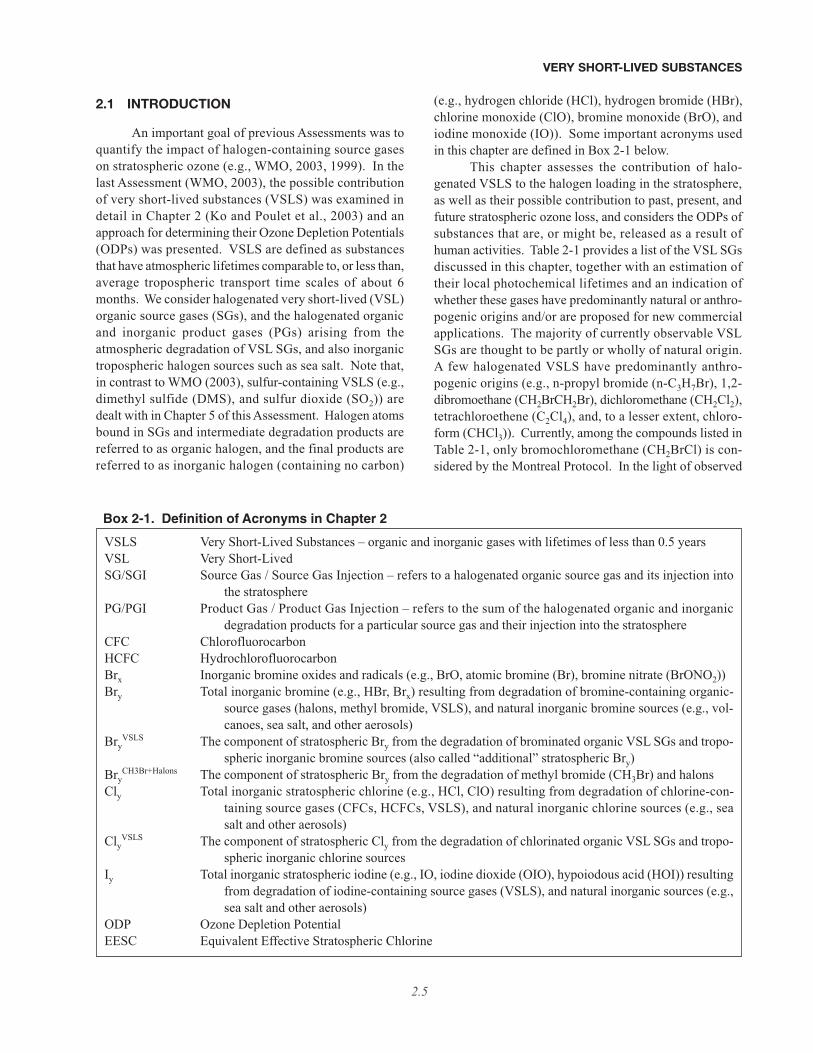
Box 2-1. Definition of Acronyms in Chapter 2
VSLS Very Short-Lived Substances – organic and inorganic gases with lifetimes of less than 0.5 yearsVSL Very Short-Lived SG/SGI Source Gas / Source Gas Injection – refers to a halogenated organic source gas and its injection into
the stratospherePG/PGI Product Gas / Product Gas Injection – refers to the sum of the halogenated organic and inorganic
degradation products for a particular source gas and their injection into the stratosphereCFC ChlorofluorocarbonHCFC HydrochlorofluorocarbonBrx Inorganic bromine oxides and radicals (e.g., BrO, atomic bromine (Br), bromine nitrate (BrONO2))Bry Total inorganic bromine (e.g., HBr, Brx) resulting from degradation of bromine-containing organic-
source gases (halons, methyl bromide, VSLS), and natural inorganic bromine sources (e.g., vol-canoes, sea salt, and other aerosols)
BryVSLS The component of stratospheric Bry from the degradation of brominated organic VSL SGs and tropo-
spheric inorganic bromine sources (also called “additional” stratospheric Bry)Bry
CH3Br+Halons The component of stratospheric Bry from the degradation of methyl bromide (CH3Br) and halonsCly Total inorganic stratospheric chlorine (e.g., HCl, ClO) resulting from degradation of chlorine-con-
taining source gases (CFCs, HCFCs, VSLS), and natural inorganic chlorine sources (e.g., seasalt and other aerosols)
ClyVSLS The component of stratospheric Cly from the degradation of chlorinated organic VSL SGs and tropo-
spheric inorganic chlorine sourcesIy Total inorganic stratospheric iodine (e.g., IO, iodine dioxide (OIO), hypoiodous acid (HOI)) resulting
from degradation of iodine-containing source gases (VSLS), and natural inorganic sources (e.g.,sea salt and other aerosols)
ODP Ozone Depletion PotentialEESC Equivalent Effective Stratospheric Chlorine
and predicted decreases in anthropogenic chlorofluoro-carbons (CFCs), halons, etc., it is important to quantify thecontribution of these VSLS to the natural backgroundhalogen loading in the stratosphere. Possible changes inthe emissions of naturally occurring compounds, forexample as a result of changing climatic factors, also needto be assessed.
In order to quantify the contribution of halogenatedVSLS to halogen loading and ozone loss in the strato-sphere, it is necessary to quantify the amount of VSLSentering the stratosphere directly via the SG injection(SGI) pathway, the degradation of SGs in the troposphere,transport of organic and inorganic PGs into the strato-sphere via the PG injection (PGI) pathway, and also injec-tion of inorganic tropospheric halogen. The contribution
to, for example, total inorganic bromine (Bry) in the strat-osphere, which derives from the sum of VSL SGs (via theSGI and PGI pathways) and tropospheric inorganichalogen, is denoted Bry
VSLS. The impact of such VSLS-derived inorganic halogen on stratospheric ozone loss willdepend on the abundance of different halogen radicals andtheir efficiency at destroying ozone. Note that one atomof iodine is much more efficient at removing ozone thanbromine, which in turn is more efficient than chlorine, asexpressed by so-called α-factors (see Chapter 8 andSection 2.6.1 for further discussion).
Figure 2-1 shows a schematic of the processes influ-encing the transport, degradation, and loss of VSL SGsand PGs in the troposphere and stratosphere. It is anupdated version of Figure 2-2 in Chapter 2, WMO (2003).
VERY SHORT-LIVED SUBSTANCES
2.6
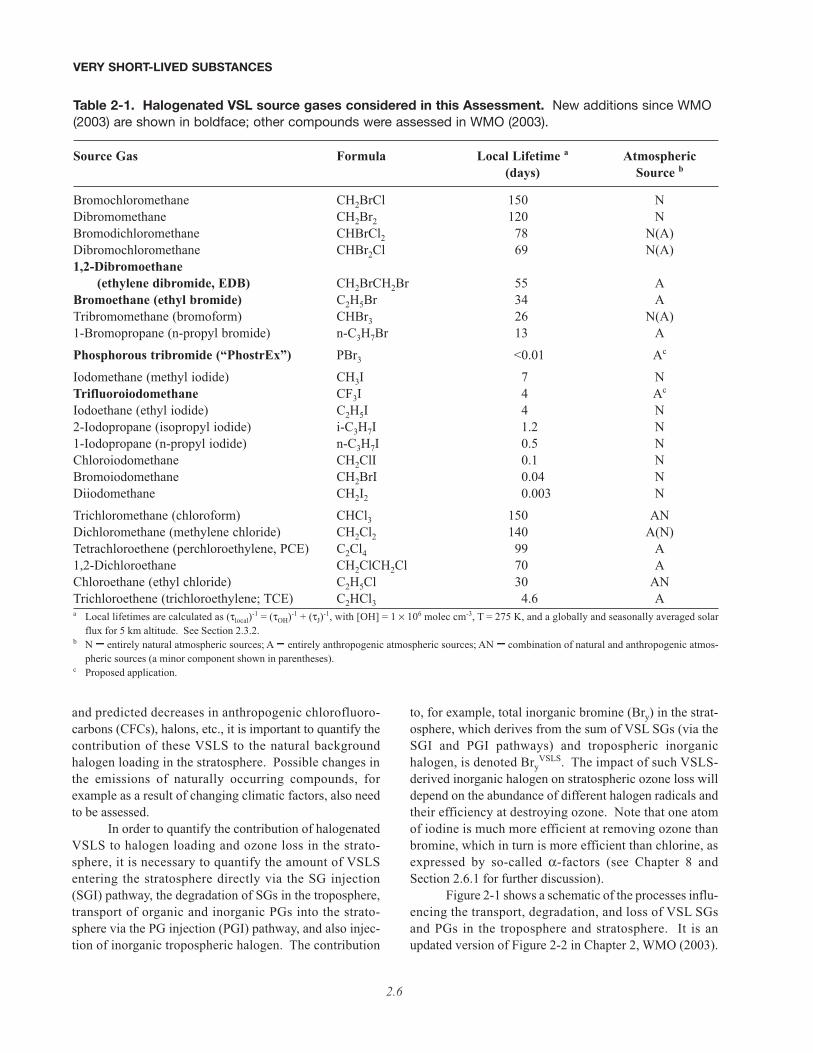
Table 2-1. Halogenated VSL source gases considered in this Assessment. New additions since WMO(2003) are shown in boldface; other compounds were assessed in WMO (2003).
Source Gas Formula Local Lifetime a Atmospheric(days) Source b
Bromochloromethane CH2BrCl 150 NDibromomethane CH2Br2 120 NBromodichloromethane CHBrCl2 78 N(A)Dibromochloromethane CHBr2Cl 69 N(A)1,2-Dibromoethane
(ethylene dibromide, EDB) CH2BrCH2Br 55 ABromoethane (ethyl bromide) C2H5Br 34 ATribromomethane (bromoform) CHBr3 26 N(A)1-Bromopropane (n-propyl bromide) n-C3H7Br 13 A
Phosphorous tribromide (“PhostrEx”) PBr3 <0.01 Ac
Iodomethane (methyl iodide) CH3I 7 NTrifluoroiodomethane CF3I 4 Ac
Iodoethane (ethyl iodide) C2H5I 4 N2-Iodopropane (isopropyl iodide) i-C3H7I 1.2 N1-Iodopropane (n-propyl iodide) n-C3H7I 0.5 NChloroiodomethane CH2ClI 0.1 NBromoiodomethane CH2BrI 0.04 NDiiodomethane CH2I2 0.003 N
Trichloromethane (chloroform) CHCl3 150 ANDichloromethane (methylene chloride) CH2Cl2 140 A(N)Tetrachloroethene (perchloroethylene, PCE) C2Cl4 99 A1,2-Dichloroethane CH2ClCH2Cl 70 AChloroethane (ethyl chloride) C2H5Cl 30 ANTrichloroethene (trichloroethylene; TCE) C2HCl3 4.6 Aa Local lifetimes are calculated as (τlocal)-1 = (τOH)-1 + (τJ)-1, with [OH] = 1 × 10⁶ molec cm-3, T = 275 K, and a globally and seasonally averaged solar
flux for 5 km altitude. See Section 2.3.2.b N ; entirely natural atmospheric sources; A; entirely anthropogenic atmospheric sources; AN ; combination of natural and anthropogenic atmos-
pheric sources (a minor component shown in parentheses).c Proposed application.
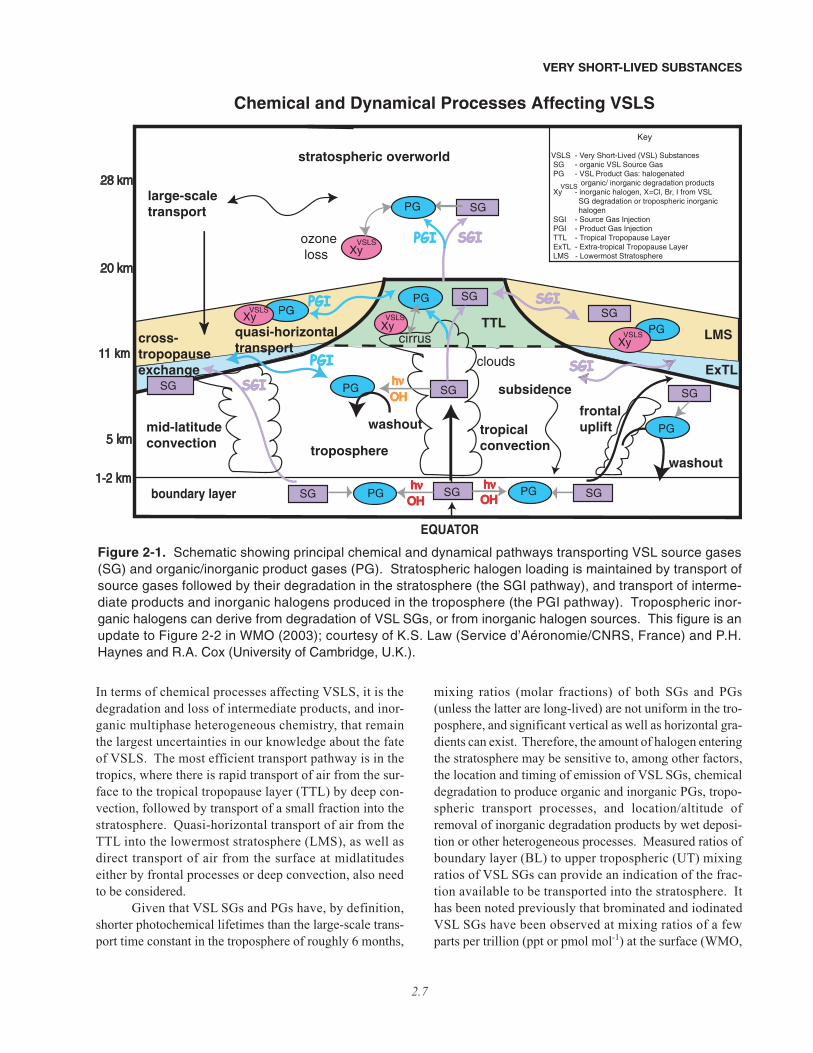
In terms of chemical processes affecting VSLS, it is thedegradation and loss of intermediate products, and inor-ganic multiphase heterogeneous chemistry, that remainthe largest uncertainties in our knowledge about the fateof VSLS. The most efficient transport pathway is in thetropics, where there is rapid transport of air from the sur-face to the tropical tropopause layer (TTL) by deep con-vection, followed by transport of a small fraction into thestratosphere. Quasi-horizontal transport of air from theTTL into the lowermost stratosphere (LMS), as well asdirect transport of air from the surface at midlatitudeseither by frontal processes or deep convection, also needto be considered.
Given that VSL SGs and PGs have, by definition,shorter photochemical lifetimes than the large-scale trans-port time constant in the troposphere of roughly 6 months,
mixing ratios (molar fractions) of both SGs and PGs(unless the latter are long-lived) are not uniform in the tro-posphere, and significant vertical as well as horizontal gra-dients can exist. Therefore, the amount of halogen enteringthe stratosphere may be sensitive to, among other factors,the location and timing of emission of VSL SGs, chemicaldegradation to produce organic and inorganic PGs, tropo-spheric transport processes, and location/altitude ofremoval of inorganic degradation products by wet deposi-tion or other heterogeneous processes. Measured ratios ofboundary layer (BL) to upper tropospheric (UT) mixingratios of VSL SGs can provide an indication of the frac-tion available to be transported into the stratosphere. Ithas been noted previously that brominated and iodinatedVSL SGs have been observed at mixing ratios of a fewparts per trillion (ppt or pmol mol-1) at the surface (WMO,
VERY SHORT-LIVED SUBSTANCES
2.7
5 km
TTL
SG
SG
SG SG PG
cirrus
Xyozone loss
OHOHOHOHhhνν hhνν
OHOHhhνν
1-2 km
11 km
20 km
28 km
boundary layer
EQUATOR
SG
washout
washout
Key
VSLS - Very Short-Lived (VSL) Substances SG - organic VSL Source Gas PG - VSL Product Gas: halogenated organic/ inorganic degradation products Xy - inorganic halogen, X=Cl, Br, I from VSL SG degradation or tropospheric inorganic halogen SGI - Source Gas Injection PGI - Product Gas Injection TTL - Tropical Tropopause Layer ExTL - Extra-tropical Tropopause Layer LMS - Lowermost Stratosphere
Chemical and Dynamical Processes Affecting VSLS
tropical convection
subsidence
cross-tropopauseexchange
clouds
large-scale transport
frontaluplift
ExTL
PG
PG PG
PG mid-latitudeconvection
Xy
SGPG
PG
PG SG
Xy
Xy
PGIPGI
PGIPGI
PGIPGI SGISGISGISGI
SGISGISGISGI
SGISGISGISGI
LMSquasi-horizontaltransport
SGISGISGISGI
stratospheric overworld
troposphere
VSLS
VSLSVSLS
VSLS
VSLS
SG SG
Figure 2-1. Schematic showing principal chemical and dynamical pathways transporting VSL source gases(SG) and organic/inorganic product gases (PG). Stratospheric halogen loading is maintained by transport ofsource gases followed by their degradation in the stratosphere (the SGI pathway), and transport of interme-diate products and inorganic halogens produced in the troposphere (the PGI pathway). Tropospheric inor-ganic halogens can derive from degradation of VSL SGs, or from inorganic halogen sources. This figure is anupdate to Figure 2-2 in WMO (2003); courtesy of K.S. Law (Service d’Aéronomie/CNRS, France) and P.H.Haynes and R.A. Cox (University of Cambridge, U.K.).
2003). An estimate was also given for the troposphericabundance of chlorinated VSL SGs ranging from 50 to 100ppt. This value also included phosgene (carbonyl dichlo-ride, COCl2), produced from the degradation of VSL SGsand long-lived chlorine gases. Apart from phosgene, veryfew measurements of organic VSL PGs are available inthe free troposphere or stratosphere. Measurements ofinorganic halogen are available and represent the final
degradation products of halogen-containing sources gases(e.g., CFCs, halons, VSLS) as well as direct emission ofinorganic halogens (e.g., sea salt, volcanoes).
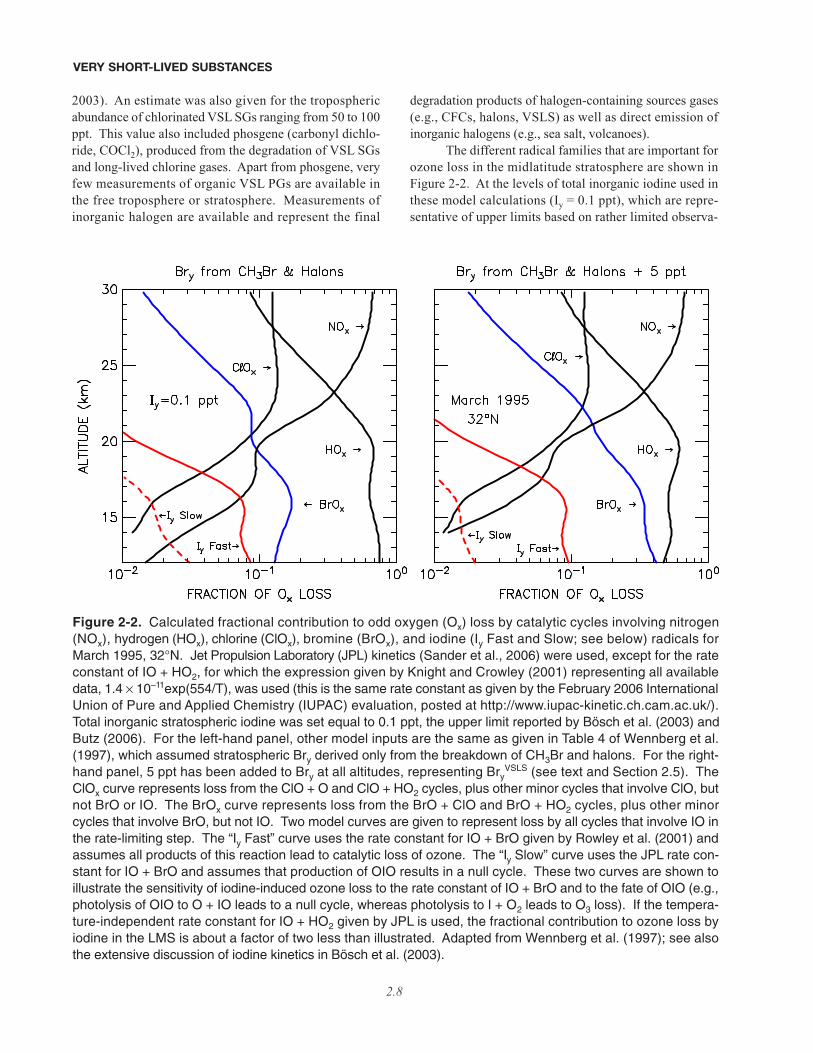
The different radical families that are important forozone loss in the midlatitude stratosphere are shown inFigure 2-2. At the levels of total inorganic iodine used inthese model calculations (Iy = 0.1 ppt), which are repre-sentative of upper limits based on rather limited observa-
VERY SHORT-LIVED SUBSTANCES
2.8
Figure 2-2. Calculated fractional contribution to odd oxygen (Ox) loss by catalytic cycles involving nitrogen(NOx), hydrogen (HOx), chlorine (ClOx), bromine (BrOx), and iodine (Iy Fast and Slow; see below) radicals forMarch 1995, 32°N. Jet Propulsion Laboratory (JPL) kinetics (Sander et al., 2006) were used, except for the rateconstant of IO + HO2, for which the expression given by Knight and Crowley (2001) representing all availabledata, 1.4 × 10⁻¹¹exp(554/T), was used (this is the same rate constant as given by the February 2006 InternationalUnion of Pure and Applied Chemistry (IUPAC) evaluation, posted at http://www.iupac-kinetic.ch.cam.ac.uk/).Total inorganic stratospheric iodine was set equal to 0.1 ppt, the upper limit reported by Bösch et al. (2003) andButz (2006). For the left-hand panel, other model inputs are the same as given in Table 4 of Wennberg et al.(1997), which assumed stratospheric Bry derived only from the breakdown of CH3Br and halons. For the right-hand panel, 5 ppt has been added to Bry at all altitudes, representing Bry
VSLS (see text and Section 2.5). TheClOx curve represents loss from the ClO + O and ClO + HO2 cycles, plus other minor cycles that involve ClO, butnot BrO or IO. The BrOx curve represents loss from the BrO + ClO and BrO + HO2 cycles, plus other minorcycles that involve BrO, but not IO. Two model curves are given to represent loss by all cycles that involve IO inthe rate-limiting step. The “Iy Fast” curve uses the rate constant for IO + BrO given by Rowley et al. (2001) andassumes all products of this reaction lead to catalytic loss of ozone. The “Iy Slow” curve uses the JPL rate con-stant for IO + BrO and assumes that production of OIO results in a null cycle. These two curves are shown toillustrate the sensitivity of iodine-induced ozone loss to the rate constant of IO + BrO and to the fate of OIO (e.g.,photolysis of OIO to O + IO leads to a null cycle, whereas photolysis to I + O2 leads to O3 loss). If the tempera-ture-independent rate constant for IO + HO2 given by JPL is used, the fractional contribution to ozone loss byiodine in the LMS is about a factor of two less than illustrated. Adapted from Wennberg et al. (1997); see alsothe extensive discussion of iodine kinetics in Bösch et al. (2003).
tions in the stratosphere (Bösch et al., 2003; Butz, 2006),loss of ozone by iodine is unlikely to be a driving factorfor present-day midlatitude ozone loss. Note that the effi-ciency of ozone loss by iodine is sensitive to unresolveddetails of the photochemical mechanism, regarding therate constant of the IO + BrO reaction and differentdecomposition products resulting from iodine dioxide(OIO) photolysis (“Iy Fast” versus “Iy Slow” in Figure 2-2; see caption). The likely relatively small contributionof iodine to stratospheric ozone loss is in contrast tobromine, which has been observed regularly in the strato-sphere at levels significantly higher than can be suppliedsolely by the longer lived brominated gases (CH3Br andhalons) and at sufficient concentrations in the lower strat-osphere to make a difference to present-day ozone.
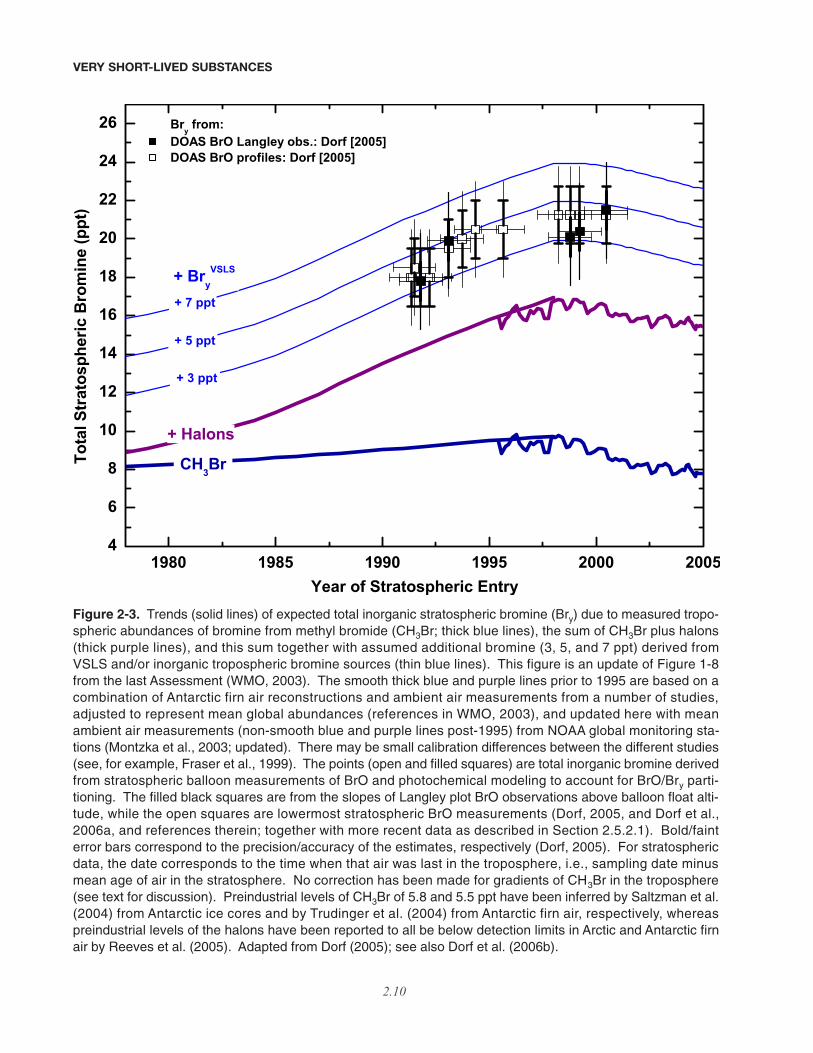
A key question for this chapter, then, is to whatextent brominated VSLS contribute to stratospheric Bry.The contributions of chlorinated and iodinated VSLS tostratospheric Cly and Iy budgets are also considered.Figure 2-3, which is an updated version of Figure 1-8,Chapter 1, WMO (2003), shows Bry estimated from bal-loonborne BrO observations adjusted to the time when themeasured air masses were last in the troposphere (seeFigure 2-3 caption for further details). In the late 1990s,this amounted to about 18 to 25 ppt of Bry. Also shownare observed trends in surface mixing ratios of bromine-containing halons and methyl bromide (CH3Br) since 1980(see Chapter 1 for details). Note that the trends of CH3Brhave not been corrected to account for vertical gradientsin the troposphere, so that this contribution to stratosphericBry may be overestimated, and therefore Bry
VSLS underes-timated. It can be seen that there is an apparent discrep-ancy between Bry from halons plus CH3Br, and Bryinferred from BrO data. In WMO (2003), this discrep-ancy, denoted “additional” stratospheric bromine, wasattributed to either direct injection into the stratosphere ofinorganic bromine from the troposphere as well as fromdegradation of organic VSLS, or to possible calibrationerrors in the measurement of either BrO or the organicsource gases. Since the last Assessment, there have beenmany studies focused on quantification of this “additional”bromine (Bry
VSLS). Figure 2-3 shows possible contribu-tions of Bry
VSLS varying between 3, 5, and 7 ppt, as indi-cated by the thin blue lines. If 5 ppt of Bry
VSLS is incorpo-rated into a photochemical model, then ozone loss in thelower stratosphere from reactions involving BrO occurs ata rate approaching that due to the traditionally consideredhydrogen oxide cycles alone (see Figure 2-2).
The structure of this chapter is as follows. Section2.2 discusses the emissions, observations, and trends ofVSL SGs, including vertical distributions at different loca-tions, and their likely mixing ratios in the upper tropo-
sphere. Section 2.3 provides an update to our knowledgeabout the atmospheric chemistry of halogenated VSL SGsand PGs (organic and inorganic), wet removal of PGs, anda discussion about the geographical variability of chem-ical lifetimes. The role of heterogeneous chemistry in theinorganic halogen budget is also discussed. Section 2.4revisits our understanding of transport processes that areimportant for the transport of VSL SGs and PGs to thestratosphere via the SGI and PGI pathways in both thetropics and extratropics. The ability of current models tosimulate the distributions of short-lived gases is also exam-ined, since these are the tools used to estimate the impactof VSLS on stratospheric halogen loading, ozone loss, andtheir ODPs. Section 2.5 presents an assessment of the con-tribution of VSL SGs and PGs to stratospheric halogenbudgets. Model estimates of the SGI and PGI fractionentering the stratosphere are also discussed. The possiblecontribution of VSLS (bromine) to stratospheric ozoneloss, and an update of ODPs for VSLS, are discussed inSection 2.6. Finally Section 2.7 summarizes recent evi-dence for, and speculates on, possible future changes inhalogenated VSLS that could affect future stratospherichalogen loadings and ozone loss.
2.2 SOURCES, DISTRIBUTIONS, AND TRENDSOF VSLS
2.2.1 New Observations of the Distributionsand Abundances of VSL SourceGases
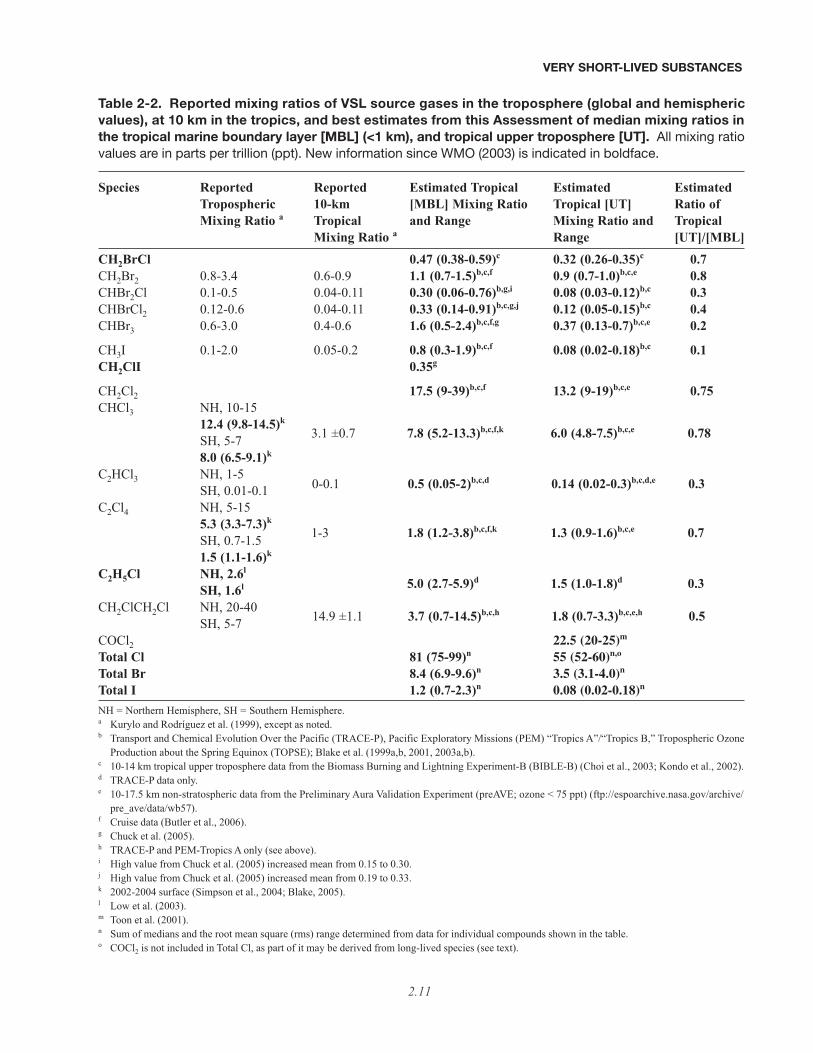
Since the last Assessment (WMO, 2003), a numberof shipboard, atmospheric, firn air, and coastal observa-tions have provided new information that either adds to orconstrains earlier estimates of atmospheric mixing ratiosof VSL SGs, which are known to exhibit significant geo-graphical variation. Table 2-2 provides updated informa-tion since the last Assessment on VSL SG mixing ratios inthe atmosphere and, in particular, it assesses the subset ofrelevant observations required to arrive at an estimatedrange of mixing ratios in the tropical marine boundarylayer and tropical upper troposphere for each source gas.It suggests mean tropical boundary layer mixing ratios of8.4, 1.2, and 81 ppt for total bromine, iodine, and chlo-rine, respectively, in VSL SGs; and corresponding mixingratios in the tropical upper troposphere of 3.5, 0.08, and55 ppt. It is clear from these observations that many ofthe chlorinated and brominated compounds are deliveredefficiently from the boundary layer to the upper tropo-sphere. Bromoform (CHBr3) and dibromomethane(CH2Br2) contribute the most VSL organic bromine
VERY SHORT-LIVED SUBSTANCES
2.9
VERY SHORT-LIVED SUBSTANCES
2.10
Figure 2-3. Trends (solid lines) of expected total inorganic stratospheric bromine (Bry) due to measured tropo-spheric abundances of bromine from methyl bromide (CH3Br; thick blue lines), the sum of CH3Br plus halons(thick purple lines), and this sum together with assumed additional bromine (3, 5, and 7 ppt) derived fromVSLS and/or inorganic tropospheric bromine sources (thin blue lines). This figure is an update of Figure 1-8from the last Assessment (WMO, 2003). The smooth thick blue and purple lines prior to 1995 are based on acombination of Antarctic firn air reconstructions and ambient air measurements from a number of studies,adjusted to represent mean global abundances (references in WMO, 2003), and updated here with meanambient air measurements (non-smooth blue and purple lines post-1995) from NOAA global monitoring sta-tions (Montzka et al., 2003; updated). There may be small calibration differences between the different studies(see, for example, Fraser et al., 1999). The points (open and filled squares) are total inorganic bromine derivedfrom stratospheric balloon measurements of BrO and photochemical modeling to account for BrO/Bry parti-tioning. The filled black squares are from the slopes of Langley plot BrO observations above balloon float alti-tude, while the open squares are lowermost stratospheric BrO measurements (Dorf, 2005, and Dorf et al.,2006a, and references therein; together with more recent data as described in Section 2.5.2.1). Bold/fainterror bars correspond to the precision/accuracy of the estimates, respectively (Dorf, 2005). For stratosphericdata, the date corresponds to the time when that air was last in the troposphere, i.e., sampling date minusmean age of air in the stratosphere. No correction has been made for gradients of CH3Br in the troposphere(see text for discussion). Preindustrial levels of CH3Br of 5.8 and 5.5 ppt have been inferred by Saltzman et al.(2004) from Antarctic ice cores and by Trudinger et al. (2004) from Antarctic firn air, respectively, whereaspreindustrial levels of the halons have been reported to all be below detection limits in Arctic and Antarctic firnair by Reeves et al. (2005). Adapted from Dorf (2005); see also Dorf et al. (2006b).
VERY SHORT-LIVED SUBSTANCES
2.11
Table 2-2. Reported mixing ratios of VSL source gases in the troposphere (global and hemisphericvalues), at 10 km in the tropics, and best estimates from this Assessment of median mixing ratios inthe tropical marine boundary layer [MBL] (<1 km), and tropical upper troposphere [UT]. All mixing ratiovalues are in parts per trillion (ppt). New information since WMO (2003) is indicated in boldface.
Species Reported Reported Estimated Tropical Estimated EstimatedTropospheric 10-km [MBL] Mixing Ratio Tropical [UT] Ratio ofMixing Ratio a Tropical and Range Mixing Ratio and Tropical
Mixing Ratio a Range [UT]/[MBL]CH2BrCl 0.47 (0.38-0.59)c 0.32 (0.26-0.35)c 0.7CH2Br2 0.8-3.4 0.6-0.9 1.1 (0.7-1.5)b,c,f 0.9 (0.7-1.0)b,c,e 0.8CHBr2Cl 0.1-0.5 0.04-0.11 0.30 (0.06-0.76)b,g,i 0.08 (0.03-0.12)b,c 0.3CHBrCl2 0.12-0.6 0.04-0.11 0.33 (0.14-0.91)b,c,g,j 0.12 (0.05-0.15)b,c 0.4CHBr3 0.6-3.0 0.4-0.6 1.6 (0.5-2.4)b,c,f,g 0.37 (0.13-0.7)b,c,e 0.2
CH3I 0.1-2.0 0.05-0.2 0.8 (0.3-1.9)b,c,f 0.08 (0.02-0.18)b,c 0.1CH2ClI 0.35g
CH2Cl2 17.5 (9-39)b,c,f 13.2 (9-19)b,c,e 0.75CHCl3 NH, 10-15
12.4 (9.8-14.5)k
SH, 5-78.0 (6.5-9.1)k
C2HCl3 NH, 1-5SH, 0.01-0.1
C2Cl4 NH, 5-155.3 (3.3-7.3)k
SH, 0.7-1.51.5 (1.1-1.6)k
C2H5Cl NH, 2.6l
SH, 1.6l
CH2ClCH2Cl NH, 20-40SH, 5-7
COCl2 22.5 (20-25)m
Total Cl 81 (75-99)n 55 (52-60)n,o
Total Br 8.4 (6.9-9.6)n 3.5 (3.1-4.0)n
Total I 1.2 (0.7-2.3)n 0.08 (0.02-0.18)n
NH = Northern Hemisphere, SH = Southern Hemisphere.a Kurylo and Rodríguez et al. (1999), except as noted.b Transport and Chemical Evolution Over the Pacific (TRACE-P), Pacific Exploratory Missions (PEM) “Tropics A”/“Tropics B,” Tropospheric Ozone
Production about the Spring Equinox (TOPSE); Blake et al. (1999a,b, 2001, 2003a,b).c 10-14 km tropical upper troposphere data from the Biomass Burning and Lightning Experiment-B (BIBLE-B) (Choi et al., 2003; Kondo et al., 2002). d TRACE-P data only. e 10-17.5 km non-stratospheric data from the Preliminary Aura Validation Experiment (preAVE; ozone < 75 ppt) (ftp://espoarchive.nasa.gov/archive/-
pre_ave/data/wb57).f Cruise data (Butler et al., 2006). g Chuck et al. (2005).h TRACE-P and PEM-Tropics A only (see above).i High value from Chuck et al. (2005) increased mean from 0.15 to 0.30. j High value from Chuck et al. (2005) increased mean from 0.19 to 0.33.k 2002-2004 surface (Simpson et al., 2004; Blake, 2005). l Low et al. (2003).m Toon et al. (2001).n Sum of medians and the root mean square (rms) range determined from data for individual compounds shown in the table.o COCl2 is not included in Total Cl, as part of it may be derived from long-lived species (see text).
3.1 ±0.7 7.8 (5.2-13.3)b,c,f,k 6.0 (4.8-7.5)b,c,e 0.78
1-3 1.8 (1.2-3.8)b,c,f,k 1.3 (0.9-1.6)b,c,e 0.7
0-0.1 0.5 (0.05-2)b,c,d 0.14 (0.02-0.3)b,c,d,e 0.3
5.0 (2.7-5.9)d 1.5 (1.0-1.8)d 0.3
14.9 ±1.1 3.7 (0.7-14.5)b,c,h 1.8 (0.7-3.3)b,c,e,h 0.5
(>80%) to both the marine boundary layer and the uppertroposphere. Similarly chloroform (CHCl3) and dichloro-methane (CH2Cl2) contribute most of the VSL organicchlorine (~80%) to the marine boundary layer and theupper troposphere. There are few observations of meas-urable iodine source gases in the upper troposphere orlower stratosphere.
As discussed later in this chapter, many of the com-pounds listed in Table 2-2 are converted to inorganicforms, but few of these have been measured in the uppertroposphere. A notable exception is phosgene (COCl2)which may account for an additional c. 45 ppt of chlorine(Cl) in the tropical upper troposphere although, as dis-cussed in Section 2.3.3, part of the phosgene might be asso-ciated with the decomposition of long-lived source gasesin either the troposphere or stratosphere.
The abundances, distributions, and sources of theseshort-lived, potentially ozone-depleting gases are consid-ered in more detail below.
2.2.1.1 BROMINE AND IODINE
Atmospheric mixing ratios of many brominated andiodinated VSLS are typically higher where marine influ-ence is significant. They tend to be highest near coastalareas, oceanic fronts, and in the tropics or subtropics (e.g.,Quack and Wallace, 2003; Carpenter, 2003; Chuck et al.,2005; Yokouchi et al., 2005b; Butler et al., 2006). Thetropics, including coastal areas, are significant in that theycomprise the main region where deep convection occurs,and are therefore the most likely location for transport ofgases emitted at the surface to be carried to the upper tro-posphere and lower stratosphere.
Carpenter et al. (2003) compared atmosphericmeasurements of a range of reactive organic halogens atMace Head, Ireland (September, 1998) and Cape Grim,Tasmania (January-February, 1999). Mixing ratios ofmethyl iodide (CH3I), chloroiodomethane (CH2ClI),dibromochloromethane (CHBr2Cl), CHBr3, and CH2Br2at Cape Grim were on average only 25-50% of those atMace Head, Ireland, which is more strongly influenced byemissions from local macroalgae (seaweeds). Averagetotal VSL bromine abundances at Cape Grim and MaceHead during these campaigns were 18 ppt and 39 ppt asbromine (Br), respectively. These amounts are muchhigher than the global averages of 2.4-3.5 ppt reported inthe last Assessment, and reflect the intense emissions fromcoastal waters. Bromoform contributed 45% and 54% ofthe total VSL bromine at these two sites, respectively, andaccounted for most of the variability. Peters et al. (2005)noted extremely high values of CH3I, CHBr3, and otherVSLS over seaweed beds in northern Europe. These
values, as high as 1830 ppt for CH3I and 393 ppt forCHBr3, have not been reported by any other investigations,the closest being 40 ppt of CHBr3 reported by Yokouchiet al. (2005b). Other iodinated VSLS have been observedin such coastal environments, including diiodomethane(CH2I2), bromoiodomethane (CH2BrI), iodoethane(C2H5I), and 1-iodopropane (n-C3H7I), but at smaller con-centrations (Carpenter et al., 2003; Peters et al., 2005).
Quack and Wallace (2003), summarizing global airand seawater mixing ratios of CHBr3 by oceanic region,showed that background mixing ratios of CHBr3 in marineboundary layer air are generally in the range 0.5-1.5 ppt.This is consistent with data in Butler et al. (2006), but itis about half of the range of 1.3-3.9 ppt reported by Chucket al. (2005) for the open ocean. This difference may haveresulted from natural temporal and spatial variability, butit may also be due to differences in calibration scales,which underscores the need for intercalibration of thesegases among laboratories. Quack and Wallace (2003) andButler et al. (2006) showed high and variable coastalmarine boundary layer CHBr3 mixing ratios rangingbetween 1 and 8.3 ppt, and levels in the open oceanranging between 0.4 and 2.5 ppt. These levels are con-sistent with the previous Assessment (WMO, 2003).Yokouchi et al. (2005b) recently reported over 40 ppt ofCHBr3 (i.e., >120 ppt as Br) in the first study of air overtropical coastal waters, suggesting that such areas may beparticularly important in delivering halogenated VSLS tothe stratosphere.
Seasonality in mixing ratios of VSLS is evidentover most of the ocean (Butler et al., 2006) and is particu-larly marked in coastal areas. Cohan et al. (2003) and Coxet al. (2005) reported high frequency, in situ observationsat Cape Grim. Average background levels of CH3I for1998-2001 were 1.4 ppt (Cox et al., 2005). Mixing ratiospeaked during the summer (amplitude 0.47 ppt) despitefaster photolytic loss, suggesting that the local oceanicemissions were a significant source of this gas (Cohan etal., 2003). Carpenter et al. (2005) found a strong, broadseasonal range of CHBr3 (1.8-5.3 ppt) at Mace Head,noting higher values in the summer, and identifying bothterrestrial and marine sources.
Although organic VSL source gases predominatein the marine boundary layer, it is possible that smallamounts of inorganic bromine or iodine in the boundarylayer could also be rapidly convected to the lower strato-sphere. Recent observations suggest that brominemonoxide (BrO) in the marine boundary layer, whetherfrom organic or inorganic sources, is on the order of 0-2ppt (Leser et al., 2003; Saiz-Lopez et al., 2004a), withhigher values observed locally. High amounts of iodinemonoxide (IO) are routinely observed in the marine
VERY SHORT-LIVED SUBSTANCES
2.12

boundary layer near macroalgae, with values as high as 7-8 ppt having been reported along the coasts of Ireland andFrance (Saiz-Lopez and Plane, 2004; Saiz-Lopez et al.,2004b; Peters et al., 2005). Saiz-Lopez and Plane (2004)suggest that emission of molecular iodine (I2) from macro-algae may be the dominant source of IO. Although VSLSproduced at midlatitudes are not as likely to be convectedinto the upper troposphere as are VSLS produced in trop-ical regions, this still underscores the potential contribu-tion of VSLS from coastal regions.
2.2.1.2 CHLORINE
Cox et al. (2005) reported background mixing ratiosof 6.3 ppt for CHCl3 at Cape Grim (1998-2000), andSimmonds et al. (2006) reported 8.7 ppt for CH2Cl2 alsoat Cape Grim (1998-2004). Observed elevated levels ofCHCl3 (55 ppt) were attributed to local natural sources,while elevated levels of CH2Cl2 (up to 70 ppt above back-ground) were attributed to anthropogenic sources. Datareferenced in Butler et al. (2006) show higher tropicalmarine air mixing ratios of CH2Cl2 (18.8 ppt), but similartropical mixing ratios of CHCl3 (7.4 ppt) to those observedat Cape Grim. Numerous studies (e.g., Prinn et al., 2000;Thompson et al., 2004; Simmonds et al., 2006) showhigher Northern Hemispheric mixing ratios of both ofthese gases, which suggest greater emissions in theNorthern Hemisphere and are consistent with a largeanthropogenic source.
Low et al. (2003) reported the first calibrated meas-urements of atmospheric chloroethane (C2H5Cl). Themedian mixing ratios observed at a clean California coastalsite were 3.3 and 0.3 ppt for C2H5Cl and C2H5Br, respec-tively. No significant correlation was found between theatmospheric concentrations of the methyl halides and theethyl halides, suggesting different source-sink relation-ships. These results, combined with data from theTransport and Chemical Evolution over the Pacific exper-iment (TRACE-P), suggest an average global mixing ratiofor C2H5Cl of 2.6 ppt. Using these data with an averagehydroxyl radical (OH) lifetime of ~1 month, the globalburden and required annual source of C2H5Cl to the atmos-phere are 25 Gg (1 Gg = 109 g), and 300 Gg yr-1, respec-tively (Redeker et al., 2003).
2.2.2 Terrestrial Emissions
Terrestrial emissions of brominated or iodinatedVSLS are generally thought to be smaller than from theocean (Table 2-3). Emissions from many terrestrialsources, such as rice cultivation, fires, and wastewatereffluents, are anthropogenically influenced. Several eval-
uations of fluxes from rice paddies, using both new dataand modeling techniques, indicate that rice paddies remaina significant source of CH3I to the atmosphere. Lee-Taylorand Redeker (2005) re-evaluated the global fluxes of CH3Ifrom rice cultivation, including the effects of temperature,seasonality, and soil moisture. Their best estimate was 16to 29 Gg yr-1 of CH3I. This range is similar to the previousestimate of Muramatsu and Yoshida (1995), but is consid-erably lower than the earlier estimates of Redeker et al.(2000) and Redeker and Cicerone (2004). Redeker andCicerone (2004) did note that CH3I emissions from pad-dies were positively correlated with temperature, essen-tially doubling with an increase of 10 degrees (25-35°C).
The first measurements of emissions of C2H5Cl,CHBr3, and bromodichloromethane (CHBrCl2) from ricepaddies, or any other terrestrial ecosystem, were reportedby Redeker et al. (2003). Integrated seasonal emissionsof C2H5Cl were 0.60 ± 0.50 milligrams (1 mg = 10-3 g)per meter squared (mg m-2), about 25 micrograms (1 µg =10-6 g) m-2 for CHBr3, and 2.9 µg m-2 for CHBrCl2.Redeker et al. (2003) extrapolated their findings to theglobal coverage of rice and calculated an annual emissionof about 1 Gg of C2H5Cl, which is insignificant comparedwith annual global emissions of c. 300 Gg yr-1.
Evidence for direct terrestrial input of inorganic andorganic halogens into the lower troposphere comes fromstudies of volcanoes and salt flats. Bureau et al. (2000)estimated the bromine yield of recent volcanic eruptionsbased on laboratory examination of ejected gases, andBobrowski et al. (2003) measured enhanced BrO in a vol-canic plume. Both authors suggest that these emissionscould contribute to stratospheric bromine. Bobrowski etal. (2003) further estimated that volcanoes might emit c.30 Gg BrO yr-1 into the lower atmosphere. Afe et al.(2004), however, showed that space-based measurementsof column BrO are not correlated with enhancements ofcolumn sulfur dioxide in volcanic plumes, casting somedoubt on the latter hypothesis. Volcanic perturbation tostratospheric bromine is not commonly considered inozone assessment simulations.
Stutz et al. (2002) recorded elevated levels of BrO(6 ± 0.4 ppt) and ClO (15 ± 2 ppt) associated with mobi-lization of halogens from salt near the Great Salt Lake inthe U.S. However, no flux estimates were provided, andit is not clear how widespread this phenomenon may be.Similarly, Zingler and Platt (2005) reported IO abundancesof 0.3-2 ppt, and occasionally more than 10 ppt, over DeadSea salt flats, apparently from inorganic sources. It isunlikely, however, that these emissions could contributesignificantly to stratospheric halogen loading.
VERY SHORT-LIVED SUBSTANCES
2.13
VERY SHORT-LIVED SUBSTANCES
2.14
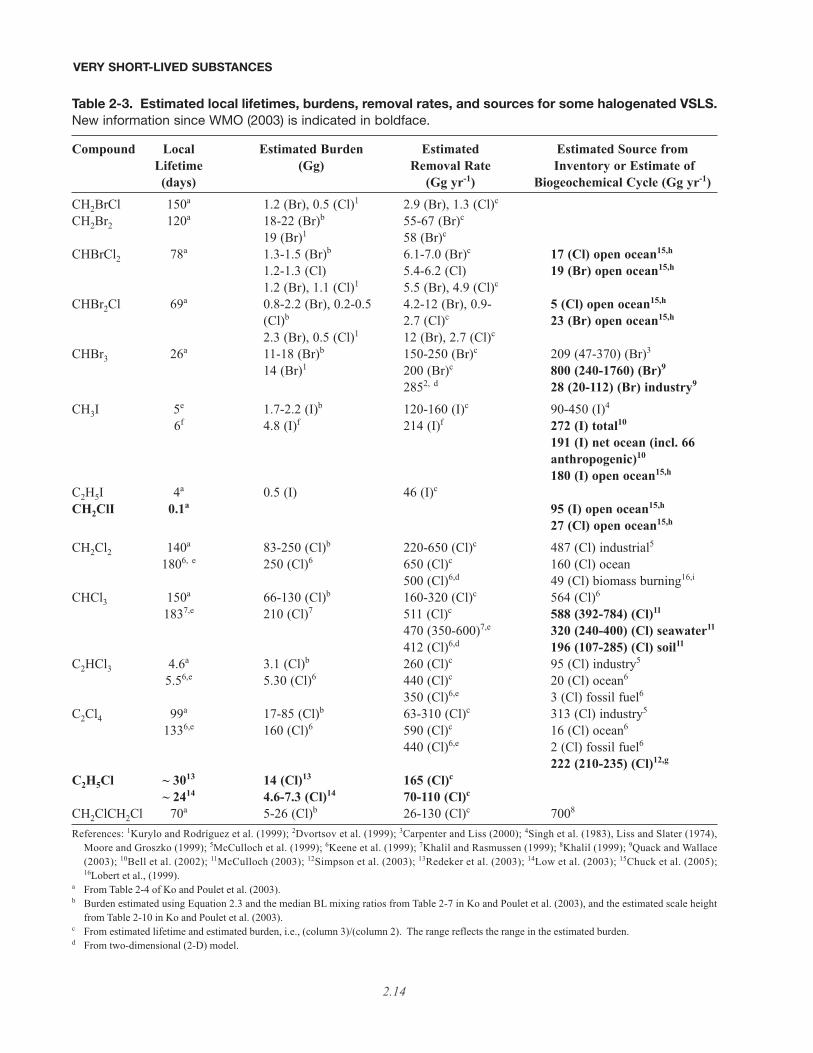
Table 2-3. Estimated local lifetimes, burdens, removal rates, and sources for some halogenated VSLS.New information since WMO (2003) is indicated in boldface.
Compound Local Estimated Burden Estimated Estimated Source fromLifetime (Gg) Removal Rate Inventory or Estimate of(days) (Gg yr-1) Biogeochemical Cycle (Gg yr-1)
CH2BrCl 150a 1.2 (Br), 0.5 (Cl)1 2.9 (Br), 1.3 (Cl)c
CH2Br2 120a 18-22 (Br)b 55-67 (Br)c
19 (Br)1 58 (Br)c
CHBrCl2 78a 1.3-1.5 (Br)b 6.1-7.0 (Br)c 17 (Cl) open ocean15,h
1.2-1.3 (Cl) 5.4-6.2 (Cl) 19 (Br) open ocean15,h
1.2 (Br), 1.1 (Cl)1 5.5 (Br), 4.9 (Cl)c
CHBr2Cl 69a 0.8-2.2 (Br), 0.2-0.5 4.2-12 (Br), 0.9- 5 (Cl) open ocean15,h
(Cl)b 2.7 (Cl)c 23 (Br) open ocean15,h
2.3 (Br), 0.5 (Cl)1 12 (Br), 2.7 (Cl)c
CHBr3 26a 11-18 (Br)b 150-250 (Br)c 209 (47-370) (Br)3
14 (Br)1 200 (Br)c 800 (240-1760) (Br)9
2852, d 28 (20-112) (Br) industry9
CH3I 5e 1.7-2.2 (I)b 120-160 (I)c 90-450 (I)4
6f 4.8 (I)f 214 (I)f 272 (I) total10
191 (I) net ocean (incl. 66 anthropogenic)10
180 (I) open ocean15,h
C2H5I 4a 0.5 (I) 46 (I)c
CH2ClI 0.1a 95 (I) open ocean15,h
27 (Cl) open ocean15,h
CH2Cl2 140a 83-250 (Cl)b 220-650 (Cl)c 487 (Cl) industrial5
1806, e 250 (Cl)6 650 (Cl)c 160 (Cl) ocean500 (Cl)6,d 49 (Cl) biomass burning16,i
CHCl3 150a 66-130 (Cl)b 160-320 (Cl)c 564 (Cl)6
1837,e 210 (Cl)7 511 (Cl)c 588 (392-784) (Cl)11
470 (350-600)7,e 320 (240-400) (Cl) seawater11
412 (Cl)6,d 196 (107-285) (Cl) soil11
C2HCl3 4.6a 3.1 (Cl)b 260 (Cl)c 95 (Cl) industry5
5.56,e 5.30 (Cl)6 440 (Cl)c 20 (Cl) ocean6
350 (Cl)6,e 3 (Cl) fossil fuel6
C2Cl4 99a 17-85 (Cl)b 63-310 (Cl)c 313 (Cl) industry5
1336,e 160 (Cl)6 590 (Cl)c 16 (Cl) ocean6
440 (Cl)6,e 2 (Cl) fossil fuel6
222 (210-235) (Cl)12,g
C2H5Cl ~ 3013 14 (Cl)13 165 (Cl)c
~ 2414 4.6-7.3 (Cl)14 70-110 (Cl)c
CH2ClCH2Cl 70a 5-26 (Cl)b 26-130 (Cl)c 7008
References: 1Kurylo and Rodríguez et al. (1999); 2Dvortsov et al. (1999); 3Carpenter and Liss (2000); 4Singh et al. (1983), Liss and Slater (1974),Moore and Groszko (1999); 5McCulloch et al. (1999); 6Keene et al. (1999); 7Khalil and Rasmussen (1999); 8Khalil (1999); 9Quack and Wallace(2003); 10Bell et al. (2002); 11McCulloch (2003); 12Simpson et al. (2003); 13Redeker et al. (2003); 14Low et al. (2003); 15Chuck et al. (2005);16Lobert et al., (1999).
a From Table 2-4 of Ko and Poulet et al. (2003).b Burden estimated using Equation 2.3 and the median BL mixing ratios from Table 2-7 in Ko and Poulet et al. (2003), and the estimated scale height
from Table 2-10 in Ko and Poulet et al. (2003). c From estimated lifetime and estimated burden, i.e., (column 3)/(column 2). The range reflects the range in the estimated burden. d From two-dimensional (2-D) model.
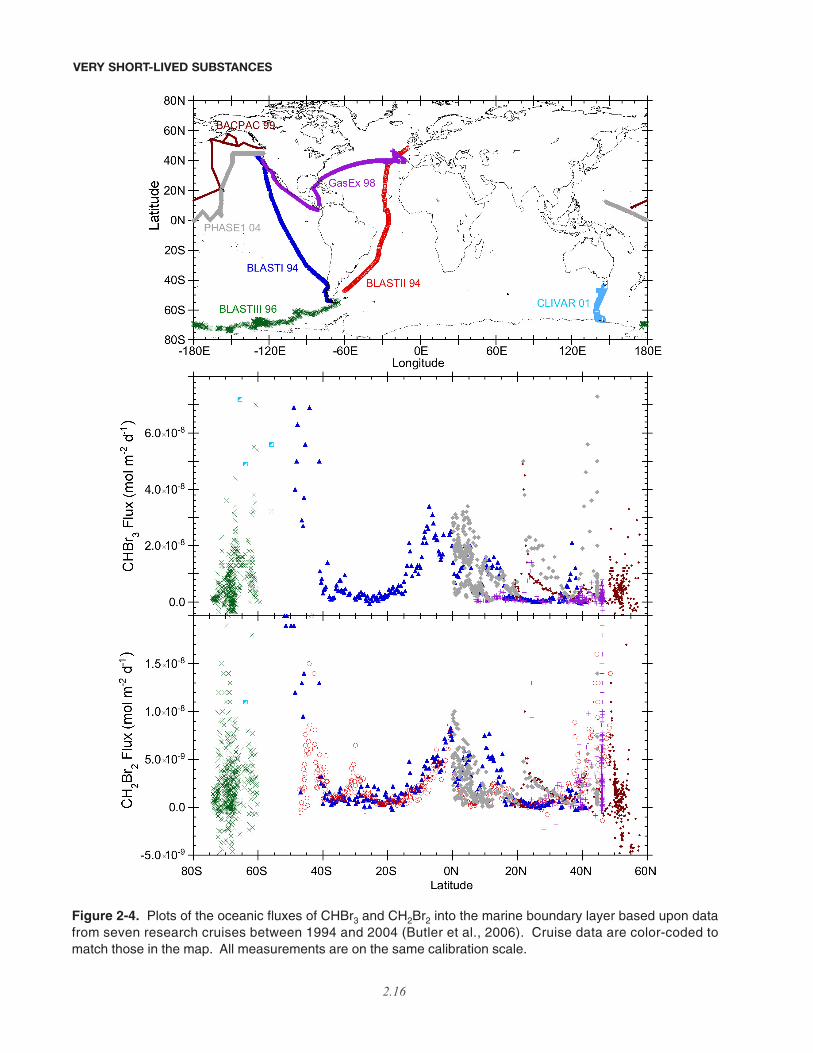
2.2.3 Oceanic Emissions
Numerous studies evaluating the oceanic produc-tion, degradation, and emission of VSLS suggest highspatial and temporal variability, with emissions gener-ally high in the tropics and near ocean fronts, and highestin coastal regions (Figure 2-4). These studies continueto suggest that oceanic emissions constitute by far thelargest source of brominated and iodinated VSLS to theatmosphere, making up 90-95% of the total global fluxof these gases. The potential for spatially and seasonallydependent variability is shown clearly in the work ofCohan et al. (2003), where model results indicate that themean oceanic flux of CH3I from the Southern Ocean intothe marine boundary layer at 40°S-50°S is 3.1 (1.9-5.2)µg m-2 day-1 during the summer. For comparison, theglobal annual oceanic flux estimate reported by Mooreand Groszko (1999) corresponds to 1.0 to 2.7 µg m-2 day-1,and the open ocean range given in Butler et al. (2006) is0.6 to 5.7 µg m-2 day-1.
2.2.3.1 BROMINE
Both Butler et al. (2006) and Quack et al. (2004)show the highest open ocean fluxes of CHBr3 in areas ofupwelling, such as near the equator and at ocean fronts,and their combined data suggest that tropical fluxes arehighest in the Pacific, where equatorial upwelling is mostintense. Quack and Wallace (2003) noted that subtrop-ical coastal and shelf oceans of both hemispheres con-tribute significantly to global emissions, with 180 (72-270) Gg Br (CHBr3) yr-1 emitted from their “shore”regime and 380 (240-940) Gg Br (CHBr3) yr-1 emittedfrom their “shelf” regime, representing 23 and 48% ofthe entire oceanic CHBr3 flux, respectively. Extrapo-lating Atlantic open ocean fluxes to the global oceanyielded 240 (32-800) Gg Br (CHBr3) yr-1, representingabout one-third of the global oceanic CHBr3 emission of~800 (240-1800) Gg Br (CHBr3) yr-1. These estimatesare similar to the 160 and 890 Gg Br yr-1 reported byButler et al. (2006) for open ocean and global sourcesrespectively. Quack and Wallace (2003) attribute much
of the source to CHBr3 production by phytoplankton,which they calculated to be ~240 Gg Br yr-1.
The large differences between estimated openocean fluxes and global fluxes underscore the impor-tance of coastal waters as a substantial source of CHBr3.High fluxes of many polyhalogenated VSLS are attrib-uted mainly to attached macroalgae (e.g., Laturnus etal., 1996; Carpenter et al., 2000), and numerous investi-gators have reported very high mixing ratios in andabove coastal waters (e.g., Carpenter and Liss, 2000).There have been, however, no systematic investigationsof these gases in tropical coastal regions until recently,when Yokouchi et al. (2005b) measured atmosphericconcentrations of CHBr3, CH2Br2, and CHBr2Cl overseveral areas, including both Arctic and tropical coastalwaters, and the open ocean, finding by far the highestamounts of these gases in association with tropicalcoasts. Their global estimate of the oceanic CHBr3source was 820 (± 310) Gg Br yr-1, which is consistentwith the independent estimates of Quack and Wallace(2003) and Butler et al. (2006).
Although coastal macroalgae are undoubtedly animportant global source, Quack et al. (2004) and Butler etal. (2006) also provide evidence that the sources of CHBr3and CH2Br2 throughout the tropical open ocean are asso-ciated with the deep chlorophyll maximum near the ther-mocline. Transport of these gases to the ocean surface inassociation with upwelling and mixing is consistent withthe higher concentrations and fluxes observed at theequator and near ocean fronts (Chuck et al., 2005; Butleret al., 2006). This may be significant because equatorialupwelling, which carries these gases to the surface wherethey are emitted, is influenced by wind speed and direc-tion, which in turn are affected by climate, weather, andEl Niño-Southern Oscillation (ENSO) events. This sug-gests a link between climate, wind-driven upwelling, andthe supply of bromine to the tropical upper troposphere,where it can be transported to the lower stratosphere (seeSection 2.4).
Several studies indicate that CHBr3 sources con-tribute more organic and reactive bromine to the loweratmosphere than other organobromines. Carpenter et al.
VERY SHORT-LIVED SUBSTANCES
2.15
Table 2-3, continued.
e Burden estimated from information given in Ko and Poulet et al. (2003): Equation 2.3, Table 2-7 (median BL mixing ratios), Table 2-10 (estimatedscale heights).
f From three-dimensional (3-D) model simulation of Bell et al. (2002). g Estimate for 2002. h Estimated using data from Chuck et al. (2005). The surface ocean during the Chuck et al. study was generally a sink for CHBr3. i May be a less significant and more uncertain source than estimated here, although no new global emission estimates are available (Simmonds et al.,
2006; Scheeren et al., 2002).
VERY SHORT-LIVED SUBSTANCES
2.16
3
3
3
3
3
3
3
Figure 2-4. Plots of the oceanic fluxes of CHBr3 and CH2Br2 into the marine boundary layer based upon datafrom seven research cruises between 1994 and 2004 (Butler et al., 2006). Cruise data are color-coded tomatch those in the map. All measurements are on the same calibration scale.

(2003) extrapolated their data to estimate molar sourcestrengths of CHBr2Cl and CH2Br2, suggesting that the fluxof CHBr2Cl is about 3-6% of that of CHBr3, and thatCH2Br2 emissions would be about 15-25% of the globalCHBr3 flux. Yokouchi et al. (2005b) suggest somewhatsimilar molar emission ratios, with CHBr2Cl amountingto ~7% and CH2Br2 to ~11% of the flux in coastal waters.Butler et al. (2006) noted that CH2Br2 fluxes were about25-35% of CHBr3 fluxes for data collected mostly in theopen ocean. These values all fall within ranges estimatedindependently from concentration and lifetime data.
2.2.3.2 IODINE
Fluxes of iodinated VSLS are driven in partthrough photochemistry in the surface waters. Results ofa study of the production of CH3I in the tropical AtlanticOcean support prior inferences that CH3I is produced inthe open ocean by a light-dependent production pathwaythat is not directly dependent on biological activity(Richter and Wallace, 2004). This assertion is supportedby data from Smythe-Wright et al. (2005) and Chuck etal. (2005). Also, photo- or biodegradation of some poly-halogenated methanes can lead to the production ofothers. For example, Martino et al. (2005) carried outlaboratory studies of aqueous degradation kinetics ofthe photolabile compounds CH2I2, CH2BrI, and CH2ClIin different types of natural and artificial seawater.Photolysis of CH2I2 in artificial and natural seawater gen-erated CH2ClI with a yield of 25-30%, suggesting thatthis reaction is an important source of marine CH2ClI.Dark-incubations indicated that photolysis is the mainabiotic degradation mechanism of CH2I2 in seawater andthat CH2I2 originating at depth and transported to the sur-face would be photolyzed before escaping into the atmos-phere. The longer aquatic photolytic lifetime of CH2ClIallows this compound to vent to the atmosphere andindeed, although CH2ClI has been detected at very lowlevels in the remote marine boundary layer, its sea-airfluxes appear to be of the same order as those of CH3I(Carpenter et al., 2003; Chuck et al., 2005).
2.2.3.3 CHLORINE
Although previous studies (e.g., Khalil et al., 1999)led Keene et al. (1999) to conclude that oceanic emissionsof dichloromethane (CH2Cl2) could account for about 25%of the total emissions to the atmosphere, recent work byMoore (2004) suggests that the apparent supersaturationof this gas in higher latitude waters is an artifact of circu-lation and mixing. Moore (2004) interpreted the measure-ments of CH2Cl2 in waters of the North Atlantic andLabrador Sea to show that the compound at depth in the
ocean is imprinted with an older atmospheric source, andappears to persist for years to decades in deeper waters.In this sense, the observed surface supersaturation of thegas would likely have resulted from the recent decline ofthis gas in the atmosphere (e.g., Simmonds et al., 2006;Thompson et al., 2004) with the ocean gradually re-equil-ibrating, and not necessarily the result of production in theocean. Thus, the ocean “source” of 200 Gg Cl yr-1 wouldlikewise be a matter of re-equilibration, not production.
2.2.4 Industrial and Other AnthropogenicEmissions
2.2.4.1 BROMINE
Except for the chlorinated VSLS, anthropogenicemissions of most halogenated VSLS are presentlydwarfed by natural emissions (Table 2-3). Emissions ofCHBr3 through water treatment, however, can be locallysignificant. Quack and Wallace (2003) reassessed theanthropogenic CHBr3 source from water chlorination,including reactions on saltwater effluents, and suggestedthat it would amount to about 28 Gg Br yr-1 (0.20-110 GgBr yr-1), which is minor compared with natural sources(<5% of biogenic CHBr3 emissions). Zhou et al. (2005)reported contributions from effluents from the chlorina-tion of drinking, waste, and recreational waters of ~1-10%of the CHBr3 emitted from the Great Bay area of NewEngland, U.S. In the same region, they determined thatthe contribution from coastal power plant cooling efflu-ents amounted to 15-50% of the CHBr3 measured in theGreat Bay, constituting most, if not all, of the anthro-pogenic source to the bay.
Because polar firn air provides a natural archiveof “old” (typically from early 20th century) air, long-termtrends of various gaseous species can, with some caveats,be reasonably reconstructed. Significant 20th centurytrends are often indicative of increasing anthropogenicemissions. For example, Worton et al. (2006) reportedfirn air measurements of the brominated trihalomethanes(THMs: CHBr3, CHCl2Br, CHClBr2) and dihalomethanes(DHMs: CH2Br2 and CH2ClBr) in Greenland. The bromi-nated DHMs showed no annual trend over time, sug-gesting that their sources are almost entirely natural. TheTHMs, however, appeared to increase by 20% from1950-1990. This translates to increases of ~16 ± 9, 0.7 ±0.4, and 0.8 ± 0.3 Gg Br yr-1 for CHBr3, CHBr2Cl, andCHBrCl2, respectively. Worton et al. (2006) noted thatsimilarities in the trends in the deepest sections of thefirn (oldest air) indicate that the three THMs may havesimilar sources. The authors further suggested that
VERY SHORT-LIVED SUBSTANCES
2.17
chlorination of seawater for cooling coastal power plantsmay be the largest anthropogenic source of the bromi-nated THMs. Emissions of THMs from water chlorina-tion could potentially increase in the future in responseto increasing demand for water treatment (potable andwaste water) and power generation.
2.2.4.2 CHLORINE
Antarctic firn air measurements from Trudinger etal. (2004) show CHCl3 and CH2Cl2 increasing in atmos-pheric mixing ratios from 3.9 ppt to 6.35 ppt and 1.4 pptto 8.9 ppt, respectively, between 1940 and 1990. Theynoted that records of anthropogenic emissions of CH2Cl2were consistent with their results. Northern Hemispherefirn air measurements from Worton et al. (2006) also sup-port an anthropogenic contribution to CHCl3. Theirmodel calculations suggest anthropogenic emissionswere ~14-20% of total CHCl3 emissions (270-335 Gg Clyr-1) in 1950, and increased to 41-50% of the total (417-506 Gg Cl yr-1) at the peak in global mixing ratio in about1990. Anthropogenic emissions subsequently decreasedto ~19% of total emissions (310 Gg Cl yr-1) in 2001. Thisanthropogenic component was attributed mostly to paperand pulp manufacture, and the declining emissions since~1990 to changes in working practices in this industry.
Recent ambient atmospheric data also suggest thatemissions of these two gases are declining. Prinn et al.(2000) report data for CHCl3 from 1983-1998 with a trendranging from −0.1 to −0.4 ppt yr-1. Simmonds et al. (2006)noted that measurements from Mace Head, Ireland, andfrom the National Oceanic and Atmospheric Adminis-tration (NOAA) U.S. global monitoring sites (Thompsonet al., 2004) show a decrease in CH2Cl2 mixing ratiosfrom 1995-2004 with trends of −0.7 ppt yr-1 (1995-2004)and −0.3 ppt yr-1 (1998-2004), while an increase of 0.05ppt yr-1 was observed at Cape Grim, Australia.
Emissions of some chlorinated gases such as tetra-chloroethene (C2Cl4) have been targeted for reductionowing to public health concerns. Levels of troposphericC2Cl4, for which sources were estimated in WMO (2003)to be 95% anthropogenic, declined substantially between1989 and 2002 (Simpson et al., 2004). During this period,annual mean C2Cl4 mixing ratios for the extratropicalNorthern Hemisphere dropped from 13.9 ± 0.5 ppt to lessthan half this value (6.5 ± 0.2 ppt), and global averagesdeclined from 6.3 ± 0.6 ppt to 3.5 ± 0.2 ppt (Simpson etal., 2004). These values suggest that the global C2Cl4burden decreased by roughly 820 Gg Cl between 1989-2002, and is consistent with decreasing anthropogenicNorthern Hemispheric emissions. Simmonds et al. (2006)
showed continued declines in C2Cl4 from 2000-2004.They report means (trends in parentheses) for Mace Head,Ireland, and Cape Grim, Australia, of 4.9 ppt (−0.18 pptyr-1) and 0.75 ppt (−0.01 ppt yr-1), respectively.
High regional variability in emissions of anthro-pogenic VSLS is underscored by the study of Barnes etal. (2003) who, in contrast to the above, found no uni-form trend of C2Cl4 between 1996 and 1999 at HarvardForest, Massachusetts, U.S., but suggested that urbanand industrial emissions of C2Cl4 for the New York City-Washington, D.C. corridor were increasing. Similarly,estimates from an aircraft study over Sagami Bay, Japan,suggest high emission rates of CH2Cl2 (61.8 Gg Cl yr-1)and C2Cl4 (28.0 Gg Cl yr-1) (Yokouchi et al., 2005a). Theseestimates, as well as those for CHCl3 (6.2 Gg Cl yr-1) andtrichloroethene C2HCl3 (39.8 Gg Cl yr-1), are consistentwith the Japanese Pollutant Release and Transfer Registerfor 2002 (PRTR, 2004).
2.2.4.3 NEW VSL GASES
Future emissions of VSLS in the upper troposphereare potentially problematic. Trifluoroiodomethane (CF3I)is being considered as a direct replacement for halon usein aircraft, and as a replacement for the potent greenhousegas, hexafluoroethane (C2F6), currently used in the plasmaetching industry. No information on its emission is cur-rently available, although its use on aircraft could poten-tially lead to emission at altitude. This species is rapidlyphotolyzed (Table 2-1), but emission at altitude couldprovide a pathway for future injection of iodine to thestratosphere (Li et al., 2006). A new product, “PhostrEx”(PBr3), has recently won approval from the U.S.Environmental Protection Agency for in-flight aircraftengine fire protection, and has passed all Federal AviationAdministration certification fire testing; future wide-spread use is possible. Although this compound ishighly soluble and consequently has a very short lifetime(<0.1 s at 50% humidity), its release during flight in theupper troposphere could be of concern because of thelow humidity and hence slower removal rates of the gasand its degradation products at these altitudes.
2.2.5 Sources and Distributions ofInorganic Halogens of Marine Origin
Any substance present in the upper troposphere canpotentially be exported to the stratosphere; therefore inor-ganic halogens in the upper troposphere have to be con-sidered to quantify the total import of halogens into thestratosphere. In the tropics, rapid convective transportmeans that VSLS may also be transported from the
VERY SHORT-LIVED SUBSTANCES
2.18
boundary layer into the tropical upper troposphere (seeSection 2.4.1).
BrO has been observed directly in the midlatitudemarine boundary layer (Leser et al., 2003; Saiz-Lopez etal., 2004a). The presence of inorganic bromine generallyin the marine boundary layer has also been inferred fromthe routinely observed large bromide deficit in sea saltaerosol (e.g., Sander et al., 2003). These occurrences arealmost certainly due to halogen activation from sea salt byheterogeneous reaction chemistry.
Combinations of space-, ground-, and balloon-based measurements indicate that BrO is widely presentin the free troposphere, with mixing ratios of 0.2-2 ppt(Harder et al., 1998; Wagner and Platt, 1998; Pundt et al.,2000; McElroy et al., 1999; Fitzenberger et al., 2000;Wagner et al., 2001; Van Roozendael et al., 2002; Richteret al., 2002; Schofield et al., 2004). The study by Yang etal. (2005), incorporating a detailed bromine chemistryscheme of gas-phase and heterogeneous reactions, showedthat monthly mean mixing ratios of 0.1-1.0 ppt of BrO inthe free troposphere can be explained by a combination ofbromine release from sea salt aerosol and the breakdownof bromomethanes. Other bromine sources were not con-sidered in this study, but might contribute (e.g., volcanicBrO, as noted above, and tropospheric decomposition ofother organic bromine gases). They suggest that sea saltmight contribute as much as 10% of the total Br in theupper troposphere.
In contrast to bromine, there is limited evidence forthe presence of inorganic chlorine radicals in the free tro-posphere.
McFiggans et al. (2004) and Saiz-Lopez et al.(2006) reported direct coastal boundary layer observationsof molecular iodine, ultrafine particle production, andiodocarbons. They demonstrated for the first time thatultrafine iodine-containing particles are produced by inter-tidal macroalgae exposed to ambient levels of ozone.However, the lifetime of inorganic iodine species releasedin the boundary layer is short, and they are generallyunlikely to be transported to the stratosphere.
2.3 ATMOSPHERIC CHEMISTRY OF VSLS
The halogenated source compounds consideredhere are listed in Table 2-1. The Table gives the estimatedlocal lifetimes (τlocal) for these compounds, defined as(τlocal)
-1 = (τOH)-1 + (τJ)-1 where (τOH) is the lifetime due to
reactions with hydroxyl radical (OH), and (τJ) is the life-time due to ultraviolet (UV) photolysis. It is worth notingthat even within these halogenated VSLS there is a widerange of local lifetimes, with values ranging from a fewminutes to 150 days. The atmospheric loss processes for
the source gases (organic halogens) occurs primarily inthe gas phase via reaction with OH and UV photolysis.Multiphase processing of source gases is not a significantloss process and is not considered in this chapter.
The removal of inorganic halogenated reservoirspecies (e.g., hydrogen chloride, HCl) by wet and dry dep-osition is the main atmospheric loss process for inorganichalogens. Heterogeneous processes that recycle inorganicbromine and (most probably) iodine to insoluble reactiveforms, may significantly increase the effective lifetime ofBrx and Ix (see boxed text in Section 2.1 for definition ofBrx; Ix is analogously defined) in the troposphere and thelower stratosphere and, as a result, enhance the efficiencyof halogen transport via the PG pathway into the lowerstratosphere, as discussed in Section 2.5.
Processing of both organic and inorganic halo-genated degradation products on atmospheric aerosoland cloud particles is currently not well represented inatmospheric models, although the knowledge of theseprocesses continues to improve. For example, a clearerpicture is evolving regarding the partitioning of tracegases onto ice surfaces in cirrus clouds (Abbatt, 2003),and the mechanisms of halogen reactions on ice surfacesunder tropospheric conditions (Fernandez et al., 2005).In this section, we assess the data needed to represent theatmospheric processing in both the gas and condensedphases of halogenated VSLS in atmospheric models.
2.3.1 Removal of Halogen Source Gases
The halogenated VSL SGs listed in Table 2-1,with the exception of CF3I, C2H5Br, 1,2-dibromoethane(CH2BrCH2Br), and PBr3 were evaluated in WMO (2003).The kinetic and photochemical parameters for the previ-ously assessed VSL source gases have been updated in therecent evaluations of the International Union of Pure andApplied Chemistry (IUPAC, Atkinson et al., 2005; http://-
www.iupac-kinetic.ch.cam.ac.uk), and the National Aero-nautics and Space Administration (NASA) Jet PropulsionLaboratory (JPL), U.S. (Sander et al., 2006; http://-
jpldataeval.jpl.nasa.gov), with only minor revisions.The atmospheric loss of the VSL SGs can be sum-
marized as follows: chlorinated VSL compounds have longphotolysis lifetimes and are predominantly removed in thetroposphere through reaction with OH; the brominatedVSLS are removed by a combination of UV photolysisand OH reaction depending on the degree of halogen sub-stitution (for example, increased importance of photolysiswith higher bromine substitution); and iodine-containingVSLS are removed almost exclusively by photolysis.Bayes et al. (2003) reported bromine atom quantum yieldsfor the photolysis of CHBr3 at several wavelengths be-
VERY SHORT-LIVED SUBSTANCES
2.19
tween 303 and 324 nanometers (nm). Their results implythat the UV absorption cross section data currently recom-mended for use in the determination of the atmosphericphotolysis rate of CHBr3 may be systematically high byas much as 20% over this wavelength region.
The OH rate coefficients and atmospheric photol-ysis rates for C2H5Br and CH2BrCH2Br are given in Table2-4. The photolysis lifetimes are significantly longer thantheir respective OH reaction lifetimes, and therefore pho-tolysis is not an important atmospheric loss process forthese compounds.
2.3.2 Tropospheric Lifetimes ofHalocarbons
The lifetimes given in Tables 2-1 and 2-3 provideonly an approximate estimate of the global mean lifetimes,because of significant regional variations in the OH rad-ical concentration, solar flux, and the spatial and seasonaldistributions of the halogen source gases. The geographicdistribution of VSL SG surface fluxes with respect to theseregional variations in the corresponding sinks is an impor-tant factor in determining the global mean atmosphericlifetimes of the VSL SGs. Warwick et al. (2006) have pro-vided an estimate of the importance of the geographic fluxdistribution on the atmospheric lifetime of CHBr3 by usinga global atmospheric three-dimensional (3-D) model tocalculate the CHBr3 global atmospheric lifetime for a setof prescribed oceanic CHBr3 emission data. In their cal-culations, the CHBr3 atmospheric lifetime, defined as theglobal burden divided by the annual global loss, variedfrom 37 days in a scenario containing emissions distrib-uted over the entire open ocean, to 15 days in a scenario inwhich CHBr3 was emitted from tropical coastline regionsonly (see Table 2-5). The shorter lifetime in the tropicalemission scenario is due to higher OH concentrations andUV levels in this region. This represents an uncertainty ofapproximately ±40% in the CHBr3 atmospheric lifetime
that is solely due to changes in the emission distribution.For halogen source gases with longer atmospheric life-times and better constrained flux distributions, this uncer-tainty will be reduced.
The different CHBr3 emission scenarios in theWarwick et al. (2006) study also showed a significantvariation in the amount of CHBr3 reaching the tropicalupper troposphere. A scenario based on a uniform oceanemission distribution of 210 Gg CHBr3 yr-1 (Kurylo andRodríguez et al., 1999; Carpenter and Liss, 2000)showed CHBr3 peak mixing ratios of 0.2 ppt at 110 hPa,whereas a scenario with larger emissions (587 Gg CHBr3yr-1) predominantly situated in the oceanic tropics,which showed better agreement to tropospheric obser-vations, contained peak CHBr3 mixing ratios of ~1 pptat the same altitude.
VERY SHORT-LIVED SUBSTANCES
2.20
Table 2-4. OH rate coefficient and photochemical parameters for bromoethanes added since the WMO(2003) Assessment. Temperatures (T) in Kelvin.
Compound k(OH) k300(OH) Photolysis Rate References(cm3 molec–1 s–1) (cm3 molec–1 s–1) Constant, J a (s–1)
Bromoethane 2.9 × 10⁻¹²exp(−640/T) 3.43 × 10⁻¹³ <1 × 10⁻⁹ Sander et al. (2006)(C2H5Br)
1,2-dibromoethane 1.44 × 10⁻¹¹exp(−1270/T) 2.1 × 10⁻¹³ <1 × 10⁻⁹ Qiu et al. (1992);(CH2BrCH2Br) Sander et al. (2006)a Atmospheric photolysis rate constants are globally and seasonally averaged estimates for 5 km altitude (because different models were used, the
values should be considered approximate).
Table 2-5. Bromoform emission scenarios usedby Warwick et al. (2006).
Global Flux Geographic Modeled(Gg CHBr3 Distribution of Atmospheric
yr-1) Emissions Lifetime (days)210 uniform ocean a 30
235 open ocean b 37
587 global coastlines b 26
400 tropical ocean c 21
587 tropical coastlines c 15595 tropical ocean and 18
tropical coastlines c
a Kurylo and Rodríguez et al. (1999).b Quack and Wallace (2003).c Warwick et al. (2006).
2.3.3 Production and Gas-Phase Removalof VSL Organic Product Gases
The first generation of stable reaction productsformed following the gas-phase degradation of the halo-genated VSL SGs was reviewed in WMO (2003). In gen-eral, the stable products consist of a variety of organiccarbonyl (RC(O)R′) and peroxide (ROOR′) compounds,and inorganic halogen species. Since the last Assessment,little new evidence for the atmospheric reactivity andphotolysis of these compounds has been reported. Therecent IUPAC and JPL evaluations include the updatesfor these compounds where available. Detailed degra-dation mechanisms for halomethanes in general, andn-propyl bromide (n-C3H7Br) specifically, were given inWMO (2003). A major uncertainty in the evaluation ofthe impact of the degradation products is a lack of experi-mental data for their reactivity and photolysis.
The atmospheric degradation mechanisms for theVSL SGs are reasonably well understood, although quan-tification of the various possible reaction channels anddegradation products is lacking in some cases. In general,the atmospheric degradation of the halogenated VSLsource gases leads to the formation of compounds withatmospheric lifetimes shorter than the lifetime of thesource gas. A notable exception is the formation of phos-gene, COCl2, which is a product formed in the degrada-tion of the VSLS chloroform (CHCl3) and tetra-chloroethene (C2Cl4). Phosgene is also formed in thedegradation of longer lived chlorinated compounds suchas carbon tetrachloride (CCl4) and methyl chloroform(CH3CCl3). In the stratosphere, COCl2 is removed mainlyby photolysis, since the rate constant for reaction with OHis relatively small (<5 × 10-15 centimeters cubed per mole-cule per second). On the basis of recently published crosssections (Atkinson et al., 2005; Sander et al., 2006), thelocal photolysis lifetime of COCl2 is estimated to be sim-ilar to that of CFC-11 (trichlorofluoromethane; CCl3F),and about twice that of CCl4, at altitudes above 18 km at30°N; thus significant stratospheric loss of COCl2 is to beexpected. Kindler et al. (1995), using a one-dimensional(1-D) model, reported a stratospheric lifetime for COCl2of ~2 years (for COCl2 produced in the stratosphere); lessthan lifetimes calculated for long-lived SGs such as CCl4.Kindler et al. calculated a much longer stratospheric life-time (>8 years) for COCl2 produced in the troposphere,which they explain as being due to the requirement forCOCl2 produced in the troposphere to be transported tohigher stratospheric altitudes, where photolysis rates aregreater. In the troposphere, removal of COCl2 is domi-nated by aerosol washout (total wet removal lifetime of~60 days from Kindler et al. (1995) and ~70 days from
WMO, 2003). Therefore, wet removal of COCl2 may fur-ther reduce the contribution of chlorinated source gases(both long-lived and VSLS) to stratospheric chlorine (seeSection 2.3.4.1).
When loss of CHBr3 is initiated by reaction withOH, the final organic decomposition product is likely tobe carbonyl dibromide (COBr2). When loss is initiated byphotolysis, then formyl bromide (COHBr) is thought to beproduced (Ko and Poulet et al., 2003). Present kinetics(Sander et al., 2006) indicate about two-thirds of the lossof CHBr3 occurs by photolysis. There are few kineticstudies of COBr2 and COHBr and no atmospheric obser-vations of these species. Measurements of the UV crosssections (Libuda, 1992) indicate, however, that these com-pounds have a shorter lifetime due to photolysis loss thandoes CHBr3. Many other organic intermediates are in-volved with the decomposition of other VSL SGs (e.g.,Ko and Poulet et al., 2003).
2.3.4 Multiphase Processes InvolvingInorganic Bromine and IodineCompounds
Models used to predict tropospheric amounts ofhalocarbons and their degradation products currently usevery simplified algorithms for heterogeneous processesand physical removal. Although the multiphase chem-istry for inorganic bromine, and especially iodine com-pounds, is still poorly known, there are significant newdata and understanding since the last Assessment, whichare summarized below. This opens the possibility for amore realistic treatment of multiphase chemistry andmore quantitative representation of the heterogeneousrecycling of reactive halogens, the potential importanceof which was highlighted in WMO (2003). In futuremodel studies, the partitioning of gases on ice should bedescribed using the suggested Langmuir description.Uptake on aqueous particles should, especially for verysoluble species (see Yin et al., 2001), be calculated kinet-ically, i.e., not assuming instant equilibrium between gasand aqueous phase. The relevant Henry’s law coeffi-cients are provided in this section.
2.3.4.1 WET DEPOSITION PROCESSES
The parameters needed to evaluate the rates of theprocesses leading to wet deposition are the partition coef-ficients for gas-phase degradation products into liquidwater (the effective Henry’s constants, Heff), and on to icesurfaces (the Langmuir equilibrium constants, Keq).Henry’s constants were given for HOX and XONO2 (X =Br and I) in the last Assessment. Subsequently, an exten-
VERY SHORT-LIVED SUBSTANCES
2.21
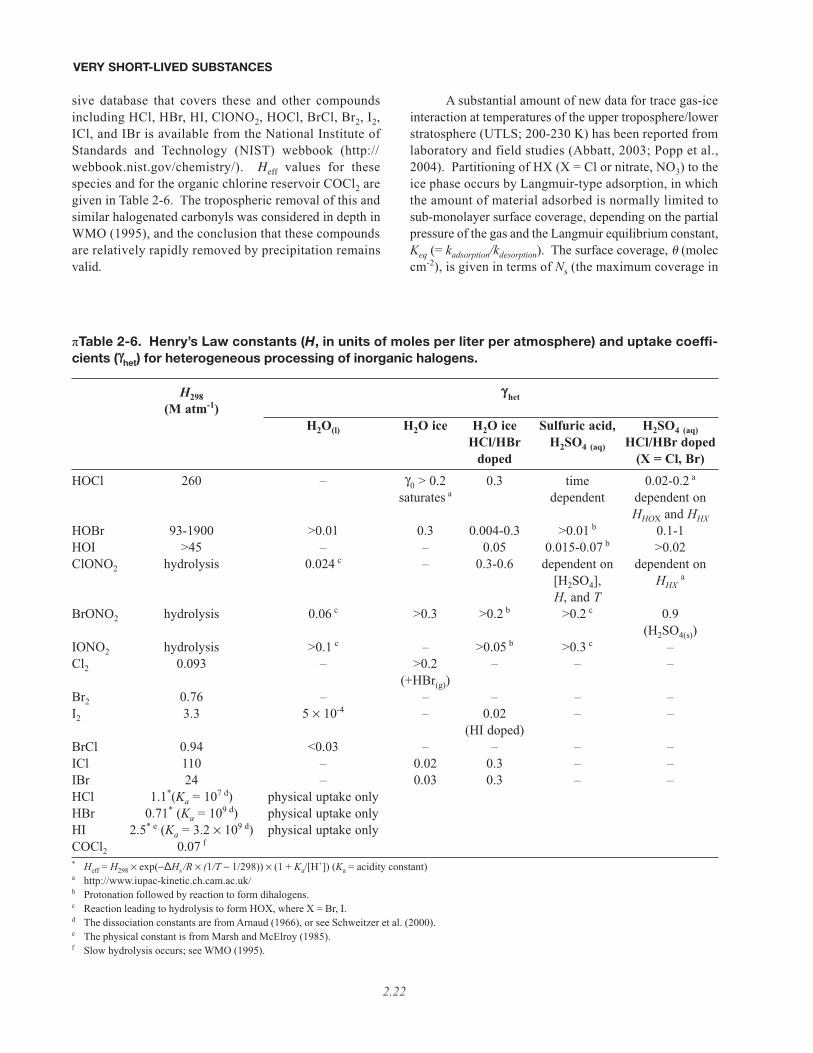
sive database that covers these and other compoundsincluding HCl, HBr, HI, ClONO2, HOCl, BrCl, Br2, I2,ICl, and IBr is available from the National Institute ofStandards and Technology (NIST) webbook (http://-
webbook.nist.gov/chemistry/). Heff values for thesespecies and for the organic chlorine reservoir COCl2 aregiven in Table 2-6. The tropospheric removal of this andsimilar halogenated carbonyls was considered in depth inWMO (1995), and the conclusion that these compoundsare relatively rapidly removed by precipitation remainsvalid.
A substantial amount of new data for trace gas-iceinteraction at temperatures of the upper troposphere/lowerstratosphere (UTLS; 200-230 K) has been reported fromlaboratory and field studies (Abbatt, 2003; Popp et al.,2004). Partitioning of HX (X = Cl or nitrate, NO3) to theice phase occurs by Langmuir-type adsorption, in whichthe amount of material adsorbed is normally limited tosub-monolayer surface coverage, depending on the partialpressure of the gas and the Langmuir equilibrium constant,Keq (= kadsorption/kdesorption). The surface coverage, u (moleccm-2), is given in terms of Ns (the maximum coverage in
VERY SHORT-LIVED SUBSTANCES
2.22
πTable 2-6. Henry’s Law constants (H, in units of moles per liter per atmosphere) and uptake coeffi-cients (γγhet) for heterogeneous processing of inorganic halogens.
H298 γγhet(M atm-1)
H2O(l) H2O ice H2O ice Sulfuric acid, H2SO4 (aq)HCl/HBr H2SO4 (aq) HCl/HBr doped
doped (X = Cl, Br)HOCl 260 – γ0 > 0.2 0.3 time 0.02-0.2 a
saturates a dependent dependent onHHOX and HHX
HOBr 93-1900 >0.01 0.3 0.004-0.3 >0.01 b 0.1-1HOI >45 – – 0.05 0.015-0.07 b >0.02ClONO2 hydrolysis 0.024 c – 0.3-0.6 dependent on dependent on
[H2SO4], HHXa
H, and TBrONO2 hydrolysis 0.06 c >0.3 >0.2 b >0.2 c 0.9
(H2SO4(s))IONO2 hydrolysis >0.1 c – >0.05 b >0.3 c –Cl2 0.093 – >0.2 – – –
(+HBr(g))Br2 0.76 – – – – –I2 3.3 5 × 10⁻⁴ – 0.02 – –
(HI doped)BrCl 0.94 <0.03 – – – –ICl 110 – 0.02 0.3 – –IBr 24 – 0.03 0.3 – –HCl 1.1*(Ka = 107 d) physical uptake onlyHBr 0.71* (Ka = 109 d) physical uptake onlyHI 2.5* e (Ka = 3.2 × 10⁹ d) physical uptake onlyCOCl2 0.07 f
* Heff = H298 × exp(−¢Hs /R × (1/T − 1/298)) × (1 + Ka/[H+]) (Ka = acidity constant)a http://www.iupac-kinetic.ch.cam.ac.uk/ b Protonation followed by reaction to form dihalogens.c Reaction leading to hydrolysis to form HOX, where X = Br, I.d The dissociation constants are from Arnaud (1966), or see Schweitzer et al. (2000).e The physical constant is from Marsh and McElroy (1985).f Slow hydrolysis occurs; see WMO (1995).
molec cm-2 at saturation), Keq, and the gas partial pressureof the gas (PHX):
For uptake on ice, the value of Ns is approximately 3 ×10¹⁴ molec cm-2 (Abbatt, 2003). At UTLS temperatures,nitric acid (HNO3) and HX (X = Cl, Br, I) are stronglyadsorbed and the process is important. Weak acids andorganic species are generally weakly adsorbed and do notpartition efficiently to ice. When formation of long-livedcompounds (e.g., nitric acid trihydrate: NAT) is thermo-dynamically favored, there is a greater capacity for parti-tioning, since adsorption is not confined to the surfacelayer.
2.3.4.2 HETEROGENEOUS HALOGEN ACTIVATION
Conversion of stable inorganic halogen reservoirs,which are removed by deposition, into reactive halogenradicals potentially lengthens the lifetime of inorganichalogen because the reactive products remain in thegaseous phase. The key heterogeneous reactions (whereX and Y are atoms of Br, Cl, or I) leading to release ofreactive halogens are:
HOX + Y– + H+ → XY + H2O
XONO2 + Y– + H+ → XY + HNO3
XONO2 + H2O (aq) → HOX + HNO3 (aq)
These reactions can occur in aqueous aerosols(water, sulfuric acid, sea salt) or on ice or solid aerosol,and XY is partitioned into the gas phase where it is pho-tolyzed.
Heterogeneous reaction kinetics are expressed interms of dimensionless reactive uptake coefficients, γhet,which allow the rate to be evaluated on a per-collisionbasis for a prescribed surface area of the condensed phase.Table 2-6 provides a summary, extended since the lastAssessment, of representative γhet values for surfaces rele-vant for the troposphere and the stratosphere. These arebased on the updated IUPAC and JPL evaluations, andother recent literature sources.
The large uptake coefficients of halogen nitrates(XONO2, where X = Cl or Br) into aqueous droplets(Deiber et al., 2004) means that uptake in liquid waterclouds will be efficient, and since concentrations of bro-mide and iodide in precipitating clouds are likely to bevery small, wet deposition will predominate over activa-tion. Evaporating cloud droplets, however, will lead to
reactive halogen recycling. Model calculations have sug-gested that uptake into cloud droplets can extend reactivehalogen lifetime and lead to a vertical redistribution ofinorganic bromine compounds (von Glasow et al., 2002).In their global model runs, von Glasow et al. (2004)showed that heterogeneous reactions can extend the life-time of Bry from about 6-9 days to about 9-15 days below500 hPa, with smaller changes in the free troposphere. Alaboratory study showed the release of labile dibrominemonoxide (Br2O) and molecular bromine (Br2) from sul-furic acid solutions following exposure to the solublespecies hypobromous acid (HOBr) and hydrogen bromide(HBr) (Iraci et al., 2005). These observations suggest thatthe PGI of Bry species should be evaluated for variousaerosol and cloud washout lifetimes.
Activation of halogens can also occur on ice sur-faces, such as those in cirrus clouds. Laboratory studieshave shown that Cl and Br activation by reaction of chlo-rine nitrate (ClONO2) and HOBr with hydrogen chloride(HCl) on ice surfaces at UTLS temperatures scale linearlywith the surface coverage of HCl (Mössinger et al., 2002;Fernandez et al., 2005). At typical tropospheric HCl con-centrations, the rate of activation of bromine on ice cloudsis probably fast, but chlorine activation is less efficient.Nevertheless recent field observations (Thornton et al.,2003) suggest that Cl activation is occurring on cirrusclouds, leading to the local production of ClO.
2.3.5 Iodine Chemistry
All iodine source gases with significant emissionsfall into the category of halogenated VSLS. However,ozone destruction in the lower stratosphere due to catalyticcycles involving iodine remains poorly understood. Newinformation on the chemistry of iodine species relevantfor the atmosphere has been obtained since the WMO(2003) Assessment. The new chemical kinetics informa-tion may have significance for the efficiency of transportof iodine species to the UTLS and the ozone destructionefficiency factor for stratospheric Iy. Relevant multiphaseiodine chemistry is presented in Section 2.3.4 above.
The IUPAC and JPL kinetics evaluations have crit-ically reviewed all but the most recent kinetic and photo-chemical studies. Rate coefficients for the reactions ofatomic iodine (I), IO, and nitric oxide (NO) with OIO(Joseph et al., 2005; Plane et al., 2006), and IO with methylperoxy radicals (CH3O2) (Bale et al., 2005) have sincebeen reported (in units of cm3 molec-1 s-1) to be 1.1 × 10-10,1.2 × 10-10, 7.6 × 10⁻¹³ exp(607/T), and 6.0 × 10⁻¹¹, respec-tively (rates are for room temperature only, except wherenoted). New photolysis quantum yield studies for OIOhave also been reported (Joseph et al., 2005; Tucceri et al.,
VERY SHORT-LIVED SUBSTANCES
2.23
θ =+
NK P
K Pseq HX
eq HX1
2006). The OIO quantum yield (Φ) measurements indi-cate Φ(O(3P)) < 0.007 at 532 nm and between 558 and 578nm, and Φ(I) < 0.24 at 532 nm and <0.05 between 560 and580 nm. Photolysis quantum yields at longer wavelengthshave not yet been reported.
Reactions between halogen monoxide radicals haveseveral product channels. The efficiency of ozone (O3)loss depends on the halogen species and the product yields.For example, the IO self-reaction produces OIO (~40%)and iodine oxide dimer IOIO (~55%) at 1000 hPa (Blosset al., 2001). The IOIO product is unstable (Misra andMarshall, 1998) and most likely rapidly thermally decom-poses to yield OIO. Therefore, the effective OIO yieldfrom the IO self-reaction is high. The efficiency of O3 lossis reduced by photolysis of the halogen dioxides formedin the IO + IO and IO + BrO reactions, if an oxygen atomis produced.
OIO has a series of strong diffuse absorption bandsin the region between 470 and 610 nm, but only the I atom-producing channel is energetically possible:
OIO + hν → I + O2
The alternate channel producing IO + O leading to no netO3 loss requires wavelengths <470 nm. Recent laboratorystudies (Joseph et al., 2005) show that OIO absorption at562 nm leads to internal conversion from the excited state(OIO*) to the vibrationally excited ground state (OIO#),rather than dissociation:
OIO + hν → OIO* → OIO#
OIO# + M → OIO + M
Nevertheless, a small probability of photolysis, integratedover the entire OIO absorption band, could still lead tosignificant photochemical conversion of OIO to I and con-sequent ozone loss.
Studies have shown that higher iodine oxides cannucleate to form new particles (Hoffmann et al., 2001;O’Dowd and Hoffmann, 2005). The formation of OIO inthe gas phase appears to initiate this process. In the atmos-phere, the oxidation of OIO by reaction with IO or OIOmay lead to the formation of higher oxides (e.g., I2O3 andI2O4) that are of low volatility and may condense on pre-existing particles, providing a sink for reactive iodine.This is different from the oxidation mechanisms of chlo-rine and bromine oxides that do not lead to the formationof unreactive low-volatility oxides. This mechanism pro-vides a possible explanation for the absence of detectableIO concentrations in the UTLS from degradation ofiodocarbons, while the BrO radical derived from the oxi-
dation of bromine source gases is clearly present in thisregion (see Sections 2.2.5 and 2.5).
2.4 DYNAMICS AND TRANSPORT IN THETROPOPAUSE REGION AND IMPLICA-TIONS FOR VSLS
The distribution of VSLS is governed by the distri-bution of surface sources, and by competition betweenvertical transport (boundary layer to free troposphere tostratosphere) and chemical destruction or removal viawashout. The implication for VSLS-related stratosphericozone loss therefore depends crucially on the strength andspatial distribution of transport processes, and of the chem-ical, microphysical, or moist processes that remove thedegradation product gases (PGs). Note in particular (seefollowing sections) that rapid vertical transport, whichpotentially takes VSL SGs and PGs from the boundarylayer to the tropopause region, is usually associated withmoist processes (warm conveyor belts, convective clouds)that can potentially remove soluble PGs through washout.Nevertheless, such processes are potentially effective inthe vertical transport of total bromine (or other halogens),since the time scale for such transport in an individual con-vection event (hours) is short compared with the time scalefor chemical breakdown of the VSLS.
Given that VSL SGs and PGs reach the upper tro-posphere through potentially rapid transport mecha-nisms, it is important to establish how rapidly they aresubsequently transported into the stratosphere via the SGIand PGI pathways. A schematic depiction of transportprocesses in the upper troposphere and lower stratosphererelevant to VSLS is shown in Figure 2-1. There is nettransport across the tropopause from troposphere to strat-osphere in the tropics and net transport across thetropopause from stratosphere to troposphere in the extrat-ropics, with this net transport controlled by global-scaleprocesses as part of the Brewer-Dobson circulation(Holton et al., 1995). However, when considering VSLS,it is particularly important to note first, that transportacross the tropopause is in fact two-way, especially at mid-latitudes, with both troposphere-to-stratosphere transport(TST) and stratosphere-to-troposphere transport (STT),and second, that the transition from tropospheric chemicalcharacteristics to stratospheric chemical characteristicstakes place not in a sharp jump across a uniquely definedtropopause, but across a finite tropopause transition layer,most notably in the tropics. In the tropics, it is now con-ventional to describe the transition layer as the “tropicaltropopause layer” (TTL). It is now clear that in the extra-tropics there is a corresponding “extratropical tropopause
VERY SHORT-LIVED SUBSTANCES
2.24
layer” (ExTL). In both the tropics and the extratropics,large-scale and small-scale processes together play impor-tant roles in determining the structure of the tropopauselayers. Representing these processes correctly poses par-ticular difficulties for global chemical models. In the fol-lowing, the tropics, including the tropical tropopause layer,and both vertical and quasi-horizontal exchange to thestratosphere, are discussed in Section 2.4.1. The extra-tropics and the extratropical tropopause layer are discussedin Section 2.4.2, and the representation of relevantprocesses in global models is discussed in Section 2.4.3.
2.4.1 Tropical Convection, the TTL, andTropical Troposphere-to-StratosphereTransport
The lower part of the tropical troposphere is domi-nated by ascent in convective clouds. The outflow fromthese clouds is concentrated in two distinct layers, a lowerlayer from about 2 to 5 km (800-550 hPa), and an upperlayer from about 10 to 15 km (300-150 hPa). The com-pensating descent in the regions surrounding the clouds isassociated with evaporative cooling in the lower layer, andradiative cooling in the upper layer (e.g., Folkins andMartin, 2005). In the lower part of the troposphere, moistconvection can efficiently transport chemical species ver-tically via strong convective updrafts, but at the same time,the scavenging associated with convective precipitationcan efficiently remove the soluble species (Crutzen andLawrence, 2000; Mari et al., 2000; Barth et al., 2001).Studies using explicit modeling of convection have shownthat scavenging in warm clouds should be considered as akinetic rather than an equilibrium process (Yin et al., 2001;Barth et al., 2001). Such treatment is not included in thevast majority of global chemical models.
So far, the observational data on soluble species inthe entrainment and detrainment zones of isolated ororganized convective systems in the tropics that mightbetter constrain these model results are still very limited.In cold clouds, as liquid water freezes and riming occursaround ice, chemical species are also absorbed into icecrystals by various processes, such as bubble inclusionswithin crystals. A limited number of field laboratory andtheoretical studies have proposed trapping coefficients ofchemicals in ice (e.g., Stuart and Jacobson, 2003; Krämeret al., 2006; see also Section 2.3.4.1). The current experi-mental data are apparently inconsistent, poorly under-stood, and only available for a limited set of chemicalspecies (e.g., HCl, HBr). Parameterization of scavengingby ice crystals is only now being implemented in globalmodels (Kärcher and Basko, 2004). For example, it hasbeen found that if the gas retention coefficient (the frac-
tion of dissolved gas that is retained as a liquid dropletfreezes) of a highly soluble gas is allowed to vary in a rel-atively narrow range (0.5-1.0), the corresponding bulk gastransport within the cloud varies, for maritime clouds, byas much as a factor of 4 (Yin et al., 2002). See also Section2.3 for a discussion of washout and solublities of VSL SGsand PGs. In addition, the microphysical structure of con-vective clouds and ice clouds is highly sensitive to theboundary layer aerosol concentration and shows varia-tions between, for example, maritime and continentalclouds (Yin et al., 2002; Kärcher and Lohmann, 2003;Nober et al., 2003; Ekman et al., 2004). This has implica-tions for the concentration of trace gases inside anvil icecrystals.
The part of the tropical atmosphere above the levelof maximum convective outflow (at about 12 km altitude,345K potential temperature), and below the cold pointtropopause (at about 17 km altitude, 380K potential tem-perature), is now commonly described as the TTL (see,for example, WMO, 2003; Gettelman and Forster, 2002).This definition of the TTL, equivalent to the “sub-strato-sphere” of Thuburn and Craig (2002), has it as the regionof the troposphere in which there is a transition betweenradiative-convective domination and radiative dominationof the thermal balance. The TTL acts as a source regionboth for the stratospheric overworld and for the extra-tropical lowermost stratosphere (see Figure 2-1). Netexchange from the TTL to the stratospheric overworld inthe tropics, say across the 100 hPa level as an approxima-tion to the cold point tropopause, is regarded as dominatedby large-scale ascent in the Brewer-Dobson circulation,with the strength of this circulation controlled by large-scale dynamical processes (e.g., Holton et al., 1995).
The overall picture of TTL processes is somewhatupdated from WMO (2003), though estimates of transporttime scales between the boundary layer and the lower partof the TTL are largely unchanged. A useful recent descrip-tion of the relevant processes is given, for example, inFolkins and Martin (2005). In the “lower TTL” (12-15km, 345-360K), convective penetration is sufficiently fre-quent so that most of the air detraining from convectiondescends to the lower troposphere. The upward mass fluxin convective clouds, the magnitude of the radiativecooling outside the clouds, and hence the magnitude ofthe implied descent decays with height. Küpper et al.(2004) give estimates of the upward cumulus mass flux asa function of height from various modeling and datastudies, but note that there are significant difficulties inestimating this flux. At a level z0 (the level of zero radia-tive heating) of about 15 km or 360K, there is a transitionfrom clear-sky radiative cooling to clear-sky radiative
VERY SHORT-LIVED SUBSTANCES
2.25
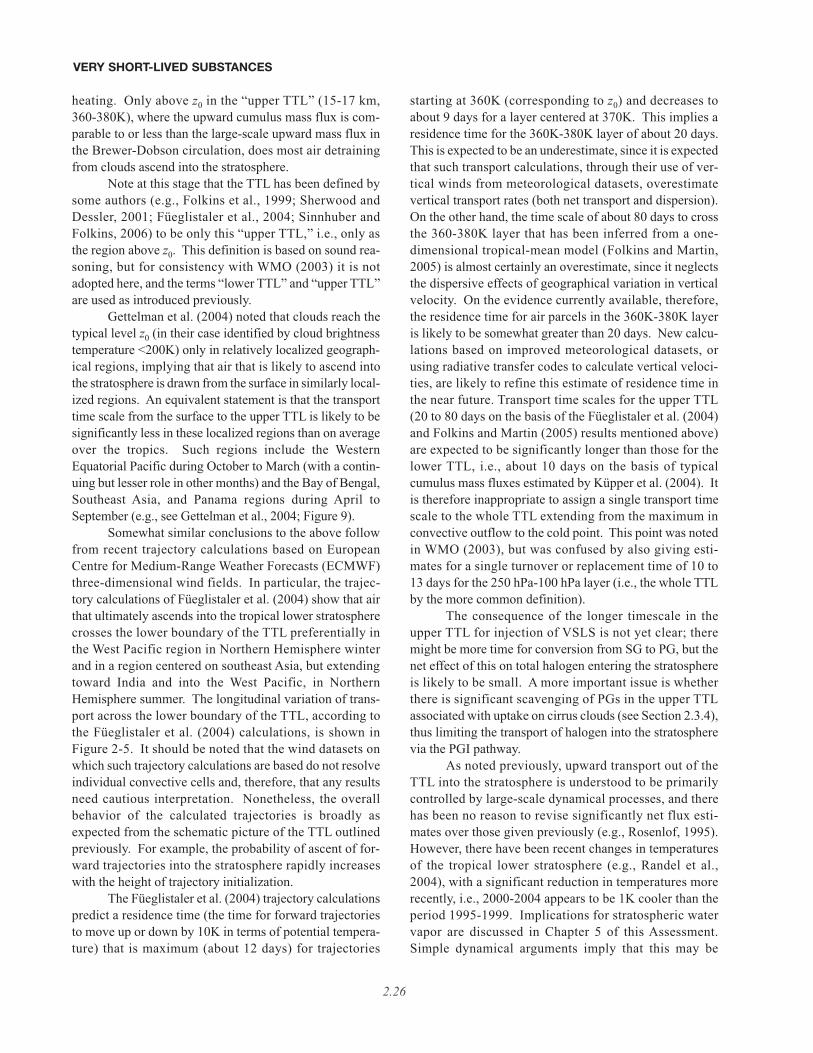
heating. Only above z0 in the “upper TTL” (15-17 km,360-380K), where the upward cumulus mass flux is com-parable to or less than the large-scale upward mass flux inthe Brewer-Dobson circulation, does most air detrainingfrom clouds ascend into the stratosphere.
Note at this stage that the TTL has been defined bysome authors (e.g., Folkins et al., 1999; Sherwood andDessler, 2001; Füeglistaler et al., 2004; Sinnhuber andFolkins, 2006) to be only this “upper TTL,” i.e., only asthe region above z0. This definition is based on sound rea-soning, but for consistency with WMO (2003) it is notadopted here, and the terms “lower TTL” and “upper TTL”are used as introduced previously.
Gettelman et al. (2004) noted that clouds reach thetypical level z0 (in their case identified by cloud brightnesstemperature <200K) only in relatively localized geograph-ical regions, implying that air that is likely to ascend intothe stratosphere is drawn from the surface in similarly local-ized regions. An equivalent statement is that the transporttime scale from the surface to the upper TTL is likely to besignificantly less in these localized regions than on averageover the tropics. Such regions include the WesternEquatorial Pacific during October to March (with a contin-uing but lesser role in other months) and the Bay of Bengal,Southeast Asia, and Panama regions during April toSeptember (e.g., see Gettelman et al., 2004; Figure 9).
Somewhat similar conclusions to the above followfrom recent trajectory calculations based on EuropeanCentre for Medium-Range Weather Forecasts (ECMWF)three-dimensional wind fields. In particular, the trajec-tory calculations of Füeglistaler et al. (2004) show that airthat ultimately ascends into the tropical lower stratospherecrosses the lower boundary of the TTL preferentially inthe West Pacific region in Northern Hemisphere winterand in a region centered on southeast Asia, but extendingtoward India and into the West Pacific, in NorthernHemisphere summer. The longitudinal variation of trans-port across the lower boundary of the TTL, according tothe Füeglistaler et al. (2004) calculations, is shown inFigure 2-5. It should be noted that the wind datasets onwhich such trajectory calculations are based do not resolveindividual convective cells and, therefore, that any resultsneed cautious interpretation. Nonetheless, the overallbehavior of the calculated trajectories is broadly asexpected from the schematic picture of the TTL outlinedpreviously. For example, the probability of ascent of for-ward trajectories into the stratosphere rapidly increaseswith the height of trajectory initialization.
The Füeglistaler et al. (2004) trajectory calculationspredict a residence time (the time for forward trajectoriesto move up or down by 10K in terms of potential tempera-ture) that is maximum (about 12 days) for trajectories
starting at 360K (corresponding to z0) and decreases toabout 9 days for a layer centered at 370K. This implies aresidence time for the 360K-380K layer of about 20 days.This is expected to be an underestimate, since it is expectedthat such transport calculations, through their use of ver-tical winds from meteorological datasets, overestimatevertical transport rates (both net transport and dispersion).On the other hand, the time scale of about 80 days to crossthe 360-380K layer that has been inferred from a one-dimensional tropical-mean model (Folkins and Martin,2005) is almost certainly an overestimate, since it neglectsthe dispersive effects of geographical variation in verticalvelocity. On the evidence currently available, therefore,the residence time for air parcels in the 360K-380K layeris likely to be somewhat greater than 20 days. New calcu-lations based on improved meteorological datasets, orusing radiative transfer codes to calculate vertical veloci-ties, are likely to refine this estimate of residence time inthe near future. Transport time scales for the upper TTL(20 to 80 days on the basis of the Füeglistaler et al. (2004)and Folkins and Martin (2005) results mentioned above)are expected to be significantly longer than those for thelower TTL, i.e., about 10 days on the basis of typicalcumulus mass fluxes estimated by Küpper et al. (2004). Itis therefore inappropriate to assign a single transport timescale to the whole TTL extending from the maximum inconvective outflow to the cold point. This point was notedin WMO (2003), but was confused by also giving esti-mates for a single turnover or replacement time of 10 to13 days for the 250 hPa-100 hPa layer (i.e., the whole TTLby the more common definition).
The consequence of the longer timescale in theupper TTL for injection of VSLS is not yet clear; theremight be more time for conversion from SG to PG, but thenet effect of this on total halogen entering the stratosphereis likely to be small. A more important issue is whetherthere is significant scavenging of PGs in the upper TTLassociated with uptake on cirrus clouds (see Section 2.3.4),thus limiting the transport of halogen into the stratospherevia the PGI pathway.
As noted previously, upward transport out of theTTL into the stratosphere is understood to be primarilycontrolled by large-scale dynamical processes, and therehas been no reason to revise significantly net flux esti-mates over those given previously (e.g., Rosenlof, 1995).However, there have been recent changes in temperaturesof the tropical lower stratosphere (e.g., Randel et al.,2004), with a significant reduction in temperatures morerecently, i.e., 2000-2004 appears to be 1K cooler than theperiod 1995-1999. Implications for stratospheric watervapor are discussed in Chapter 5 of this Assessment.Simple dynamical arguments imply that this may be
VERY SHORT-LIVED SUBSTANCES
2.26
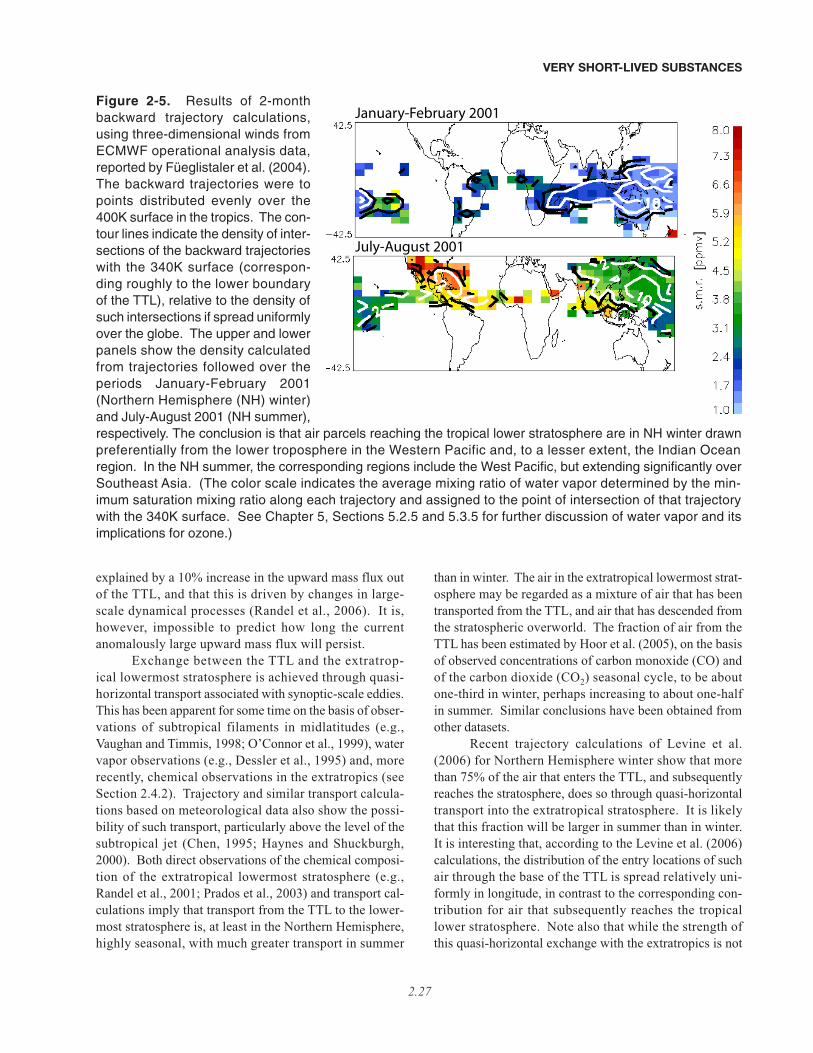
explained by a 10% increase in the upward mass flux outof the TTL, and that this is driven by changes in large-scale dynamical processes (Randel et al., 2006). It is,however, impossible to predict how long the currentanomalously large upward mass flux will persist.
Exchange between the TTL and the extratrop-ical lowermost stratosphere is achieved through quasi-horizontal transport associated with synoptic-scale eddies.This has been apparent for some time on the basis of obser-vations of subtropical filaments in midlatitudes (e.g.,Vaughan and Timmis, 1998; O’Connor et al., 1999), watervapor observations (e.g., Dessler et al., 1995) and, morerecently, chemical observations in the extratropics (seeSection 2.4.2). Trajectory and similar transport calcula-tions based on meteorological data also show the possi-bility of such transport, particularly above the level of thesubtropical jet (Chen, 1995; Haynes and Shuckburgh,2000). Both direct observations of the chemical composi-tion of the extratropical lowermost stratosphere (e.g.,Randel et al., 2001; Prados et al., 2003) and transport cal-culations imply that transport from the TTL to the lower-most stratosphere is, at least in the Northern Hemisphere,highly seasonal, with much greater transport in summer
than in winter. The air in the extratropical lowermost strat-osphere may be regarded as a mixture of air that has beentransported from the TTL, and air that has descended fromthe stratospheric overworld. The fraction of air from theTTL has been estimated by Hoor et al. (2005), on the basisof observed concentrations of carbon monoxide (CO) andof the carbon dioxide (CO2) seasonal cycle, to be aboutone-third in winter, perhaps increasing to about one-halfin summer. Similar conclusions have been obtained fromother datasets.
Recent trajectory calculations of Levine et al.(2006) for Northern Hemisphere winter show that morethan 75% of the air that enters the TTL, and subsequentlyreaches the stratosphere, does so through quasi-horizontaltransport into the extratropical stratosphere. It is likelythat this fraction will be larger in summer than in winter.It is interesting that, according to the Levine et al. (2006)calculations, the distribution of the entry locations of suchair through the base of the TTL is spread relatively uni-formly in longitude, in contrast to the corresponding con-tribution for air that subsequently reaches the tropicallower stratosphere. Note also that while the strength ofthis quasi-horizontal exchange with the extratropics is not
VERY SHORT-LIVED SUBSTANCES
2.27
Figure 2-5. Results of 2-monthbackward trajectory calculations,using three-dimensional winds fromECMWF operational analysis data,reported by Füeglistaler et al. (2004).The backward trajectories were topoints distributed evenly over the400K surface in the tropics. The con-tour lines indicate the density of inter-sections of the backward trajectorieswith the 340K surface (correspon-ding roughly to the lower boundaryof the TTL), relative to the density ofsuch intersections if spread uniformlyover the globe. The upper and lowerpanels show the density calculatedfrom trajectories followed over theperiods January-February 2001(Northern Hemisphere (NH) winter)and July-August 2001 (NH summer),respectively. The conclusion is that air parcels reaching the tropical lower stratosphere are in NH winter drawnpreferentially from the lower troposphere in the Western Pacific and, to a lesser extent, the Indian Oceanregion. In the NH summer, the corresponding regions include the West Pacific, but extending significantly overSoutheast Asia. (The color scale indicates the average mixing ratio of water vapor determined by the min-imum saturation mixing ratio along each trajectory and assigned to the point of intersection of that trajectorywith the 340K surface. See Chapter 5, Sections 5.2.5 and 5.3.5 for further discussion of water vapor and itsimplications for ozone.)
January-February 2001
July-August 2001
[
[
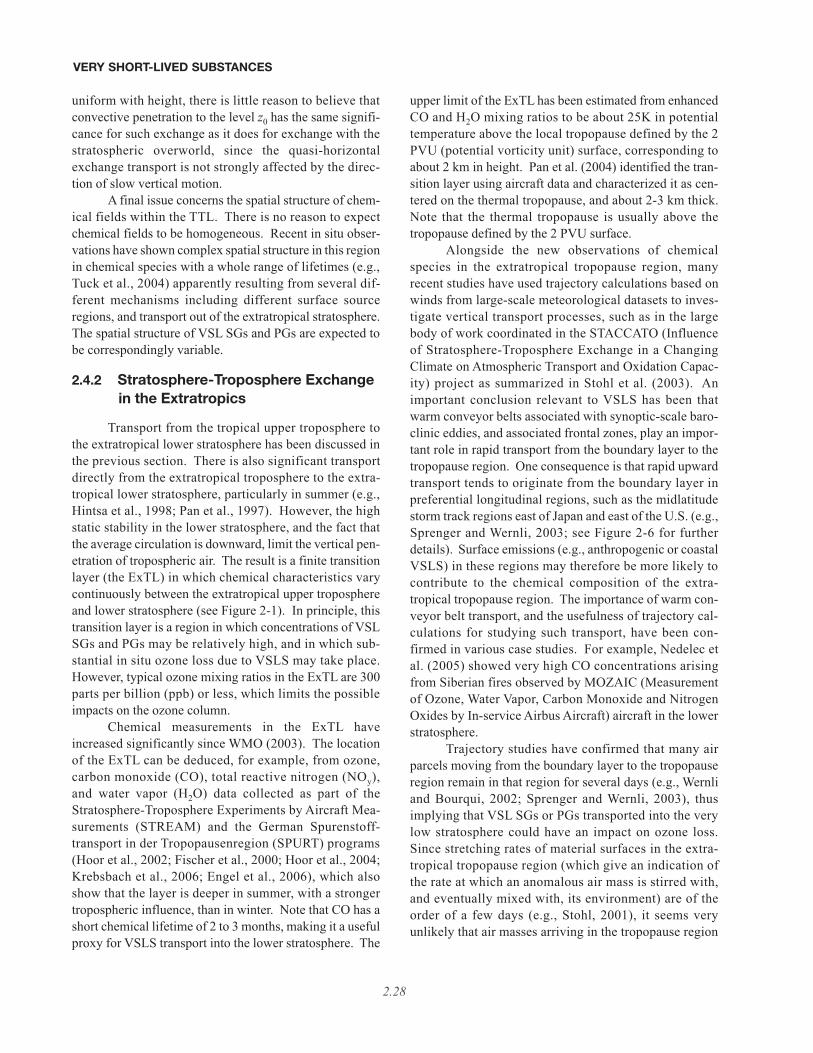
uniform with height, there is little reason to believe thatconvective penetration to the level z0 has the same signifi-cance for such exchange as it does for exchange with thestratospheric overworld, since the quasi-horizontalexchange transport is not strongly affected by the direc-tion of slow vertical motion.
A final issue concerns the spatial structure of chem-ical fields within the TTL. There is no reason to expectchemical fields to be homogeneous. Recent in situ obser-vations have shown complex spatial structure in this regionin chemical species with a whole range of lifetimes (e.g.,Tuck et al., 2004) apparently resulting from several dif-ferent mechanisms including different surface sourceregions, and transport out of the extratropical stratosphere.The spatial structure of VSL SGs and PGs are expected tobe correspondingly variable.
2.4.2 Stratosphere-Troposphere Exchangein the Extratropics
Transport from the tropical upper troposphere tothe extratropical lower stratosphere has been discussed inthe previous section. There is also significant transportdirectly from the extratropical troposphere to the extra-tropical lower stratosphere, particularly in summer (e.g.,Hintsa et al., 1998; Pan et al., 1997). However, the highstatic stability in the lower stratosphere, and the fact thatthe average circulation is downward, limit the vertical pen-etration of tropospheric air. The result is a finite transitionlayer (the ExTL) in which chemical characteristics varycontinuously between the extratropical upper troposphereand lower stratosphere (see Figure 2-1). In principle, thistransition layer is a region in which concentrations of VSLSGs and PGs may be relatively high, and in which sub-stantial in situ ozone loss due to VSLS may take place.However, typical ozone mixing ratios in the ExTL are 300parts per billion (ppb) or less, which limits the possibleimpacts on the ozone column.
Chemical measurements in the ExTL haveincreased significantly since WMO (2003). The locationof the ExTL can be deduced, for example, from ozone,carbon monoxide (CO), total reactive nitrogen (NOy),and water vapor (H2O) data collected as part of theStratosphere-Troposphere Experiments by Aircraft Mea-surements (STREAM) and the German Spurenstoff-transport in der Tropopausenregion (SPURT) programs(Hoor et al., 2002; Fischer et al., 2000; Hoor et al., 2004;Krebsbach et al., 2006; Engel et al., 2006), which alsoshow that the layer is deeper in summer, with a strongertropospheric influence, than in winter. Note that CO has ashort chemical lifetime of 2 to 3 months, making it a usefulproxy for VSLS transport into the lower stratosphere. The
upper limit of the ExTL has been estimated from enhancedCO and H2O mixing ratios to be about 25K in potentialtemperature above the local tropopause defined by the 2PVU (potential vorticity unit) surface, corresponding toabout 2 km in height. Pan et al. (2004) identified the tran-sition layer using aircraft data and characterized it as cen-tered on the thermal tropopause, and about 2-3 km thick.Note that the thermal tropopause is usually above thetropopause defined by the 2 PVU surface.
Alongside the new observations of chemicalspecies in the extratropical tropopause region, manyrecent studies have used trajectory calculations based onwinds from large-scale meteorological datasets to inves-tigate vertical transport processes, such as in the largebody of work coordinated in the STACCATO (Influenceof Stratosphere-Troposphere Exchange in a ChangingClimate on Atmospheric Transport and Oxidation Capac-ity) project as summarized in Stohl et al. (2003). Animportant conclusion relevant to VSLS has been thatwarm conveyor belts associated with synoptic-scale baro-clinic eddies, and associated frontal zones, play an impor-tant role in rapid transport from the boundary layer to thetropopause region. One consequence is that rapid upwardtransport tends to originate from the boundary layer inpreferential longitudinal regions, such as the midlatitudestorm track regions east of Japan and east of the U.S. (e.g.,Sprenger and Wernli, 2003; see Figure 2-6 for furtherdetails). Surface emissions (e.g., anthropogenic or coastalVSLS) in these regions may therefore be more likely tocontribute to the chemical composition of the extra-tropical tropopause region. The importance of warm con-veyor belt transport, and the usefulness of trajectory cal-culations for studying such transport, have been con-firmed in various case studies. For example, Nedelec etal. (2005) showed very high CO concentrations arisingfrom Siberian fires observed by MOZAIC (Measurementof Ozone, Water Vapor, Carbon Monoxide and NitrogenOxides by In-service Airbus Aircraft) aircraft in the lowerstratosphere.
Trajectory studies have confirmed that many airparcels moving from the boundary layer to the tropopauseregion remain in that region for several days (e.g., Wernliand Bourqui, 2002; Sprenger and Wernli, 2003), thusimplying that VSL SGs or PGs transported into the verylow stratosphere could have an impact on ozone loss.Since stretching rates of material surfaces in the extra-tropical tropopause region (which give an indication ofthe rate at which an anomalous air mass is stirred with,and eventually mixed with, its environment) are of theorder of a few days (e.g., Stohl, 2001), it seems veryunlikely that air masses arriving in the tropopause region
VERY SHORT-LIVED SUBSTANCES
2.28
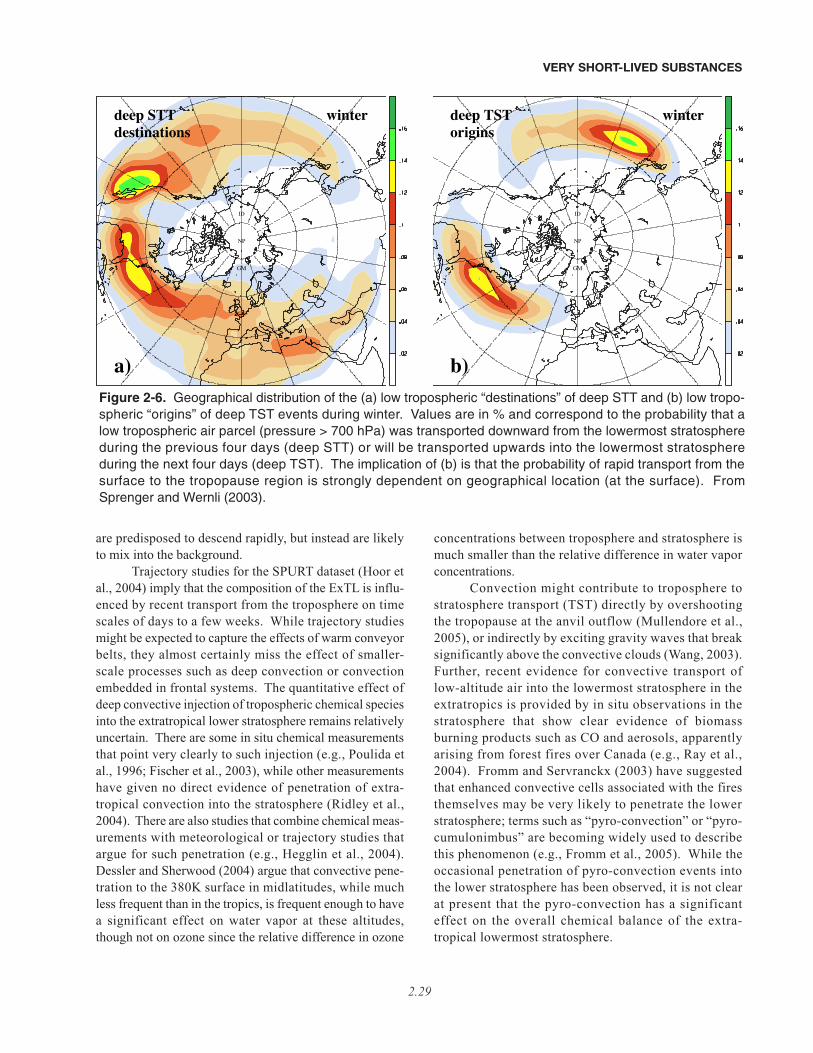
are predisposed to descend rapidly, but instead are likelyto mix into the background.
Trajectory studies for the SPURT dataset (Hoor etal., 2004) imply that the composition of the ExTL is influ-enced by recent transport from the troposphere on timescales of days to a few weeks. While trajectory studiesmight be expected to capture the effects of warm conveyorbelts, they almost certainly miss the effect of smaller-scale processes such as deep convection or convectionembedded in frontal systems. The quantitative effect ofdeep convective injection of tropospheric chemical speciesinto the extratropical lower stratosphere remains relativelyuncertain. There are some in situ chemical measurementsthat point very clearly to such injection (e.g., Poulida etal., 1996; Fischer et al., 2003), while other measurementshave given no direct evidence of penetration of extra-tropical convection into the stratosphere (Ridley et al.,2004). There are also studies that combine chemical meas-urements with meteorological or trajectory studies thatargue for such penetration (e.g., Hegglin et al., 2004).Dessler and Sherwood (2004) argue that convective pene-tration to the 380K surface in midlatitudes, while muchless frequent than in the tropics, is frequent enough to havea significant effect on water vapor at these altitudes,though not on ozone since the relative difference in ozone
concentrations between troposphere and stratosphere ismuch smaller than the relative difference in water vaporconcentrations.
Convection might contribute to troposphere tostratosphere transport (TST) directly by overshootingthe tropopause at the anvil outflow (Mullendore et al.,2005), or indirectly by exciting gravity waves that breaksignificantly above the convective clouds (Wang, 2003).Further, recent evidence for convective transport oflow-altitude air into the lowermost stratosphere in theextratropics is provided by in situ observations in thestratosphere that show clear evidence of biomassburning products such as CO and aerosols, apparentlyarising from forest fires over Canada (e.g., Ray et al.,2004). Fromm and Servranckx (2003) have suggestedthat enhanced convective cells associated with the firesthemselves may be very likely to penetrate the lowerstratosphere; terms such as “pyro-convection” or “pyro-cumulonimbus” are becoming widely used to describethis phenomenon (e.g., Fromm et al., 2005). While theoccasional penetration of pyro-convection events intothe lower stratosphere has been observed, it is not clearat present that the pyro-convection has a significanteffect on the overall chemical balance of the extra-tropical lowermost stratosphere.
VERY SHORT-LIVED SUBSTANCES
2.29
NP
GM
ID
a)
deep STTdestinations
winter
NP
GM
ID
b)
deep TSTorigins
winter
Figure 2-6. Geographical distribution of the (a) low tropospheric “destinations” of deep STT and (b) low tropo-spheric “origins” of deep TST events during winter. Values are in % and correspond to the probability that alow tropospheric air parcel (pressure > 700 hPa) was transported downward from the lowermost stratosphereduring the previous four days (deep STT) or will be transported upwards into the lowermost stratosphereduring the next four days (deep TST). The implication of (b) is that the probability of rapid transport from thesurface to the tropopause region is strongly dependent on geographical location (at the surface). FromSprenger and Wernli (2003).
2.4.3 Predictive Modeling of theTropopause Region
Predictive modeling of the impact of VSLS on ozonedepends on model representation of the processes discussedin Sections 2.4.1 and 2.4.2. In the tropics, the greatest chal-lenge for models is representing convective processes,although in the TTL the subtle interplay between differentprocesses, and the fact that significant changes in dynam-ical and chemical characteristics take place over 2-3 km,also present a challenge. In the extratropics, the transportcharacteristics of synoptic-scale eddies, and their interplaywith smaller-scale processes, must be captured. Thesesmaller-scale processes include gravity wave breaking,turbulence in the vicinity of jet streams, and radiativeprocesses associated with upper level clouds. From thechemistry point of view, the representation of solublespecies, as well as aerosols and microphysical processes, isstill poor in global models. Scaling up the heterogeneousreactions on ice and aerosols to realistic parameterizationsis still a major challenge for prediction of the tropopauseregion. Uncertainties in surface and lightning emissionsmay cause significant biases in simulating the chemicalcomposition of the upper troposphere.
The parameterization of tropical convective pro-cesses in global-scale models remains a conceptual chal-lenge, with different theoretical approaches possible.Basic thermodynamics are not well characterized, whiletransport and scavenging processes are even less wellunderstood. One widely used method for parameter-izing convective transport processes is based on themass-flux formulation (Arakawa and Schubert, 1974),in which transport processes are represented by anensemble of vertical mass fluxes at subgrid scales. Thisformulation however was originally developed for rep-resenting the subgrid-scale thermodynamic effects(phase changes and fluxes of heat and moisture) of con-vection, and its generalization to chemical transportprocesses is not straightforward (Donner et al., 2001).Lawrence and Rasch (2005) have shown that, for a singleconvection parameterization, differences in the imple-mentation of detrainment and entrainment fluxes canresult in significant differences in the upper troposphericmixing ratios of short-lived tracers (lifetimes of a fewdays or less). In particular, the bulk formulation of con-vection, widely used in global models, in which entrain-ment and detrainment are each assumed to occur ata single level, may lead to underestimation of up to 30%in zonal and monthly mean concentrations of suchtracers, relative to, for example, a more sophisticatedformulation in which a distribution of entrainment and
detrainment levels is assumed. One implication of theabove is that VSLS could play an even more importantrole in the upper troposphere than previously thought.
Detailed evaluation of cumulus parameterizations,in comparison with observations and cloud resolvingmodels, have recently taken place both with respect tothermodynamics (Yano et al., 2004) and with respect totracers (Bell et al., 2002; Collins et al., 2002). More accu-rate estimates of mass fluxes, based on high-resolutiondata from either observations or modeling, could lead toimproved parameterizations of these convective trans-ports. Evaluation of the mass flux formulation againsthigh-resolution spatial data obtained from explicit numer-ical models reveals that, in its standard form, it substan-tially underestimates vertical transport of heat, moisture,and momentum by deep convection (Yano et al., 2004),with improvement possible through nonlinear averagingof the large-scale variables. Similar issues will almost cer-tainly arise in the convective transport of chemical tracers.
Notwithstanding these recent results on convectivetransport and scavenging effects (see Section 2.4.1), cur-rent global models necessarily make significant simpli-fications in their representation of convective transport andscavenging processes. In some models the two are linked(e.g., Considine et al., 2005), whereas in others the two arecompletely separate. Lack of relevant observations andmodel simulations means that there has been no systematicvalidation of model representation of convective processesacting on halogenated VSLS against observations. His-torically, model representations of such processes havebeen validated against observations of radon and leadmixing ratios. Lead-210 (210Pb) is produced in the atmos-phere by radioactive decay of radon-222 (222Rn), whichhas a radioactive half-life of 3.8 days. Lead-210, whichhas a radioactive half-life of about 22 years and can there-fore be considered radioactively stable for this purpose, isremoved by attachment to aerosols and washout. Mostrecently, building on the large amount of previous work onthis subject, Considine et al. (2005) have presented an inter-comparison of 222Rn and 210Pb calculated by the NASAGoddard GMI (Global Modeling Initiative) model usingmeteorological fields from three different general circula-tion models (GCMs)/data assimilation systems, and com-parison with observations. The three different simulationsshow some common discrepancies relative to observationsand the authors deduce, in particular, that midlatitude con-vective transport may represent detrainment at too great analtitude, and that cloud scavenging frequency in midlati-tudes may be too great. Convective transport is confirmedto play a very important role in setting upper troposphereand lower stratosphere concentrations that are in goodagreement with observations, though part of this role may
VERY SHORT-LIVED SUBSTANCES
2.30
be indirect, for example, in bringing species from theboundary layer to the upper troposphere, from which theycan be transported effectively by the larger-scale circula-tions. These findings are all potentially relevant to modelsimulations of halogenated VSLS, though it is difficult toextrapolate results directly to model skill for predictingVSLS, since the chemical properties and the location andtime of emissions of the VSLS will be different from theseradioactive tracers.
In the extratropics, the role of convection is not asgreat as in the tropics, and the fact that many of the rele-vant processes are relatively large scale might seem tomake this region more accessible to global chemical trans-port models and global chemistry-climate models. Thesuccess of trajectory studies based on meteorological windfields in reproducing chemical distributions observed infield experiments is encouraging in this regard. However,“operational” resolutions used for global chemical modelsare still relatively coarse. Comparison between globalmodels and chemical data (e.g., Brunner et al., 2003) hasrevealed the limitations of such models that, for example,overestimate the two-way transport in the tropopauseregion, resulting in excessive ozone in the upper tropo-sphere and excessive CO in the lower stratosphere. Thisis an indication that, for current models, useful quantita-tive prediction of the effect of halogens from VSLS pene-trating the lower stratosphere in the extratropics remainsdifficult.
2.5 CONTRIBUTION OF HALOGENATED VSLSTO STRATOSPHERIC HALOGEN LOADING
2.5.1 Source Gas Injection (SGI) andProduct Gas Injection (PGI)
The concept of source gas injection (SGI) andproduct gas injection (PGI) into the stratosphere wasdescribed in Chapter 2 of the last Assessment (Ko andPoulet et al., 2003) as well as the introduction to thischapter. For SGI, the VSL source gas (SG) is transportedto the stratosphere and then reacts to release halogenatoms. Supply to the stratosphere depends on emissionlocation and time, as well as details of the tropospherictransport (e.g., convection) and troposphere-to-strato-sphere exchange. For PGI, either intermediate (i.e.,organic) products or final (i.e., inorganic) products areproduced in the troposphere, and these species are trans-ported to the stratosphere. The details of PGI depend onthe same factors as SGI, plus factors such as the photo-chemistry of the source species, intermediate products,and final products. The gas-phase partitioning between
radical and longer lived inorganic reservoirs, as well asthe solubility and heterogeneous reactivity of all species,are critical for assessing the efficiency of PGI (see Section2.3). Indeed, differences in the efficiency of stratosphericsupply of chlorine, bromine, and iodine from VSL organicsmight be due to differences in the photochemical proper-ties of the respective inorganic products. Another impor-tant consequence of PGI is that measurements of theorganic VSL SGs alone are not sufficient to determine theefficiency of stratospheric injection.
Injection of tropospheric particles into the strato-sphere is another mechanism for cross-tropopause trans-port of halogens, depending on the chemical compositionof the particles. The substantial organic content of manyaerosol particles just above the tropopause suggests injec-tion of tropospheric particles into the stratosphere, and thepresence of Br on these particles suggests that cross-tropopause transport of bromine, in both directions, canoccur by aerosols (Murphy et al., 1998; Murphy andThomson, 2000). However, observations of this processare limited and, as a consequence, quantification of cross-tropopause halogen transport by aerosols is a consider-able gap in our present state of knowledge. Most modelsimulations do not include cross-tropopause transport ofhalogens by aerosols in their estimates of PGI.
2.5.1.1 OBSERVATIONAL EVIDENCE FOR SGI
Bromine
Bromoform (CHBr3) is thought to be the mostabundant bromine-bearing VSL compound near the sur-face (Table 2-2). As noted previously in this chapter,CHBr3 levels can reach or exceed 40 ppt near sea level(Yokouchi et al., 2005b). Observations reveal between~0.2 ppt (Schauffler et al., 1998) and 1 ppt (Sturges et al.,2000) of CHBr3 in the tropical free troposphere (see alsoTable 2-2). Measurements in the upper troposphere andtropopause region by Sturges et al. (2000) indicatedCHBr3 abundances of 0.5 ± 0.2 ppt for data collectedduring three flights (June and August 1998 and March1999). Schauffler et al. (1998) measured 0.1 ppt of CHBr3at the tropical tropopause during February 1996. How-ever, CHBr3 was only detected at the tropical tropopausefor one of three flight series that sampled this region.Bromoform exhibits similar variability near the midlati-tude tropopause, ranging from near zero to a maximumabundance of ~0.7 ppt (Schauffler et al., 1999). The cross-tropopause transport of CHBr3 is difficult to quantify fromobservations because of atmospheric variability and lim-ited sampling. However, there are indications that, on
VERY SHORT-LIVED SUBSTANCES
2.31
occasions, values of CHBr3 are high enough near thetropical tropopause for SGI of CHBr3 to be important forthe bromine budget of the lowermost stratosphere.Specifically, if the approximately 0.5 ppt of CHBr3 meas-ured near the tropical tropopause by Sturges et al. (2000)turns out to be representative of the average mixing ratioin the TTL, it would provide an SGI flux that could main-tain an additional 1.5 ppt of Bry.
The VSL species CH2Br2 and CH2BrCl are lessabundant near the surface than CHBr3, but are longer livedand therefore more likely to enter the stratosphere via SGI(Tables 2-1 and 2-3). Wamsley et al. (1998) showed thatCH2Br2 and CH2BrCl cross the tropopause, supplying ~2.3ppt of Bry by the SGI pathway. The total bromine contentof the VSL species CH2Br2, CH2ClBr, CHCl2Br, CHClBr2,and CHBr3 was measured to be 2.2 ppt at the tropicaltropopause during February 1996 (Schauffler et al., 1998)(see also the compilation in Table 2-2, which concludes ahigher value of 3.5 ppt of bromine from these species).Plots of CH2BrCl versus CFC-11, and CH2Br2 versus CFC-11, in the Wamsley study show that bromine from thesecompounds is released in the lowermost stratosphere(LMS), prior to the release of the majority of bromine fromCH3Br and halons. Bromine release in the LMS has impor-tant consequences for the photochemistry of this region.Significant supply of inorganic bromine (Bry) leads tomuch faster ozone loss by two catalytic cycles representedby the rate-limiting steps defined by the BrO plus ClO,and BrO plus hydroperoxy radical (HO2) reactions, com-pared with calculations that consider supply of bromineonly from CH3Br plus halons (Salawitch et al., 2005). Asignificant role for SGI injection of CH2BrCl and CH2Br2at all times, and lack thereof for CHBr3 under some condi-tions, is consistent with their lifetimes for photochemicalremoval in the troposphere of 150, 120, and 26 days,respectively (Table 2-1).
Chlorine
Contributions to stratospheric inorganic chlorine(Cly) from VSL SGs are dominated by the species CHCl3,CH2ClCH2Cl, CH2Cl2, C2H5Cl, and C2Cl4 and can poten-tially supply about 55 ppt of chlorine to the stratosphere(Table 2-2). These gases have natural and anthropogenicsources, as described in Section 2.2. The tropospheric life-times of these gases (30 to 150 days) are comparable tothose for some of the brominated VSL SGs (see Table 2-1), so if SGI is important for bromine, it may also play arole for chlorine. Although the overall perturbation of Clyby VSLS is small (because the chlorine content of longerlived gases is much larger than that of the VSLS), this per-turbation could be significant for the LMS, where the VSL
SGs are more likely to release their chlorine content. Thiscould lead to significantly higher levels of ClO in the LMSthan would be present in models that only consider supplyof Cly from long-lived gases.
Iodine
The supply of stratospheric iodine presently appearsto be dominated by methyl iodide (CH3I) (e.g., Davis etal., 1996; Table 2-2). Abundances of CH3I range from~0.8 ppt in the marine boundary layer to ~0.08 ppt in thetropical upper troposphere (Table 2-2). Higher values ofCH3I, occasionally reaching ~1.0 ppt, were reported in thesubtropical upper troposphere (Davis et al., 1996). Themuch shorter lifetimes of iodinated VSLS compared withmost brominated VSLS (Table 2-1) suggests, in general,less efficient SGI of iodine to the stratosphere.
2.5.1.2 OBSERVATIONAL EVIDENCE FOR PGI
Bromine
PGI refers to cross-tropopause transport of degra-dation products of VSL source gases, as well as finalinorganic products. For bromine, the discussion ofobservational evidence for PGI begins with the sugges-tion of a global, ubiquitous background abundance of 1to 2 ppt of bromine monoxide (BrO) distributedthroughout the troposphere (Harder et al., 1998; Mülleret al., 2002; Richter et al., 2002; Van Roozendael et al.,2002). Model simulations indicate that Bry levels of 4to 8 ppt are needed in the middle troposphere to sustainthis much BrO (Yang et al., 2005). If 4 to 8 ppt of Bry ispresent in the global troposphere, then cross-tropopausetransport of these species could dominate the brominebudget of the LMS (Ko et al., 1997; Pfeilsticker et al.,2000). As explained below, it is unclear whether BrO ispresent at this level in the whole troposphere. There isno evidence of enough inorganic chlorine or iodine inthe global troposphere to perturb stratospheric Cly or Iyin a manner comparable to the potential perturbation tostratospheric Bry by tropospheric, inorganic bromine.
The presence of 1 to 2 ppt of BrO in the tropospherewas first suggested based on comparison of total columnBrO from the Global Ozone Monitoring Experiment(GOME) to stratospheric columns inferred from balloonmeasurements of BrO profiles (Harder et al., 1998).Observations of the solar zenith angle (SZA) variation ofdifferential slant column density of GOME BrO also indi-cated that much of the column measured by GOME liesbelow the tropopause, perhaps due to the presence of 2 to3 ppt of BrO between the tropopause and the surface
VERY SHORT-LIVED SUBSTANCES
2.32
(Müller et al., 2002; Van Roozendael et al., 2002).Measurements of BrO and O4 (the O2-dimer) columns overthe Pacific suggest 0.5 to 2.0 ppt of BrO uniformly dis-tributed throughout the troposphere (Richter et al., 2002).Aglobal, ubiquitous distribution of 2 to 3 ppt of BrO wouldaccount nearly completely for the “additional” strato-spheric bromine reported by GOME (Van Roozendael etal., 2002; Salawitch et al., 2005). The fact that excess BrOis seen year round by GOME, at all latitudes (e.g., Chance,1998; Hegels et al., 1998), argues against the springtimerelease of bromine from sea-ice and frost flowers (the so-called bromine explosion; see, for example McElroy etal., 1999) being the primary source of tropospheric back-ground BrO.
Other observations, however, contradict the notionof a global, background level of BrO at an abundance of 2to 3 ppt. Ground-based observations of direct and scat-tered sunlight reveal mean abundances of BrO in thetroposphere over Lauder, New Zealand (45°S), of ~0.2ppt and an upper limit of 0.9 ppt over this site (Schofieldet al., 2004). Low values of tropospheric BrO are alsoobserved over Arrival Heights, Antarctica (78°S), exceptfor bromine explosion events (Schofield et al., 2006).Balloon profiles of tropospheric BrO indicate levels thatpeak at ~2.3 ppt, but more commonly lie between ~0.4 and0.6 ppt (Fitzenberger et al., 2000). If BrO levels in theglobal free troposphere are less than 1 ppt, then the GOMEobservations of total BrO columns imply larger strato-spheric BrO columns than can be accounted for by thatsupplied by CH3Br and halons (Salawitch et al., 2005).
The role of VSLS in maintaining the global tropo-spheric background levels of BrO and total Bry is a sub-ject of active research. Von Glasow et al. (2004) showedthat the stratosphere-to-troposphere flux of inorganicbromine combined with the tropospheric decompositionof CH3Br was insufficient to maintain tropospheric levelsof BrO approaching ~2 ppt. They examined the sensitivityof tropospheric BrO to various latitudinal distributions ofsurface emissions of VSL SGs. Although the resulting dis-tributions of BrO and Bry differed, the available data weretoo sparse and uncertain to place strong constraints on thegeographic distribution of surface emissions. Yang et al.(2005) presented model results indicating that sea saltsources dominate the supply of bromine to the lower tro-posphere, and that VSL SGs are responsible for themajority of bromine in the upper troposphere. Warwick etal. (2006) suggested, based on a comparison of modeledand measured CHBr3, that a large portion of CHBr3 emis-sions occurs in the tropics. They also showed that emis-sions of VSL SGs (i.e., CHBr3, CH2Br2, CH2BrCl,CHBrCl2), together with CH3Br, could maintain ~2 ppt ofBry in the tropical free troposphere, and between 0 and 2
ppt of Bry in the rest of the troposphere. Levels of Brywere lower in the rest of the troposphere in this simula-tion, which involved only VSL SGs, because of aerosolwashout of product gas and the co-location of surfaceemissions and convection in the tropics.
There have been no atmospheric observations oforganic degradation products of VSL SG decompositionto date, such as COBr2 and COHBr from decompositionof CHBr3 (Section 2.3). Most modeling studies haveassumed direct conversion to inorganic bromine upon thedecomposition of CHBr3 and other VSL SGs. Field obser-vations to assess the accuracy of this assumption repre-sent another gap in our present knowledge.
Chlorine
In contrast to the situation for bromine and iodine,the tropospheric abundance of Cly is likely dominated byhydrogen chloride (HCl). The reason for the differentbehavior of the halogen families is that production of HClfrom Cl plus methane (CH4) is exothermic, while produc-tion of hydrogen bromide and hydrogen iodide (HBr andHI) by reactions involving CH4 is endothermic. As a result,PGI for chlorine should be defined by the troposphere-to-stratosphere transport of HCl. Efficient scavenging of HClby clouds and aerosols is generally considered to lead tonegligible PGI of inorganic chlorine species. Measure-ments of HCl in the subtropical upper troposphere revealabundances between 0 and 80 ppt, but simultaneousobservations of other species indicate these levels of HClare maintained by stratosphere-to-troposphere transportof Cly, rather than tropospheric degradation of VSL SGs(Marcy et al., 2004).
There are many organic decomposition productsof chlorinated VSLS, most of which have not been meas-ured in the atmosphere to date. An important exceptionis phosgene (COCl2), produced by the decomposition ofchlorinated organic gases (see Section 2.3.3). COCl2has a significant abundance in the upper tropical tro-posphere (on average 22.5 ppt, or 45 ppt as chlorine,Table 2-2), and a longer photochemical lifetime thansome of its VSLS parent compounds (Section 2.3.3).There are no known surface sources of COCl2. If COCl2were present in the TTL, where its removal processesare inefficient, it could potentially play a role in the PGIof chlorinated VSLS.
In this Assessment we have not, however, includedphosgene in our evaluation of the contribution of VSLSto stratospheric Cly. One reason for COCl2 not beingincluded is that tropospheric COCl2 is evidently producedby the decomposition of both long-lived and VSL sourcegases (Section 2.3.3). In the case of degradation of long-
VERY SHORT-LIVED SUBSTANCES
2.33
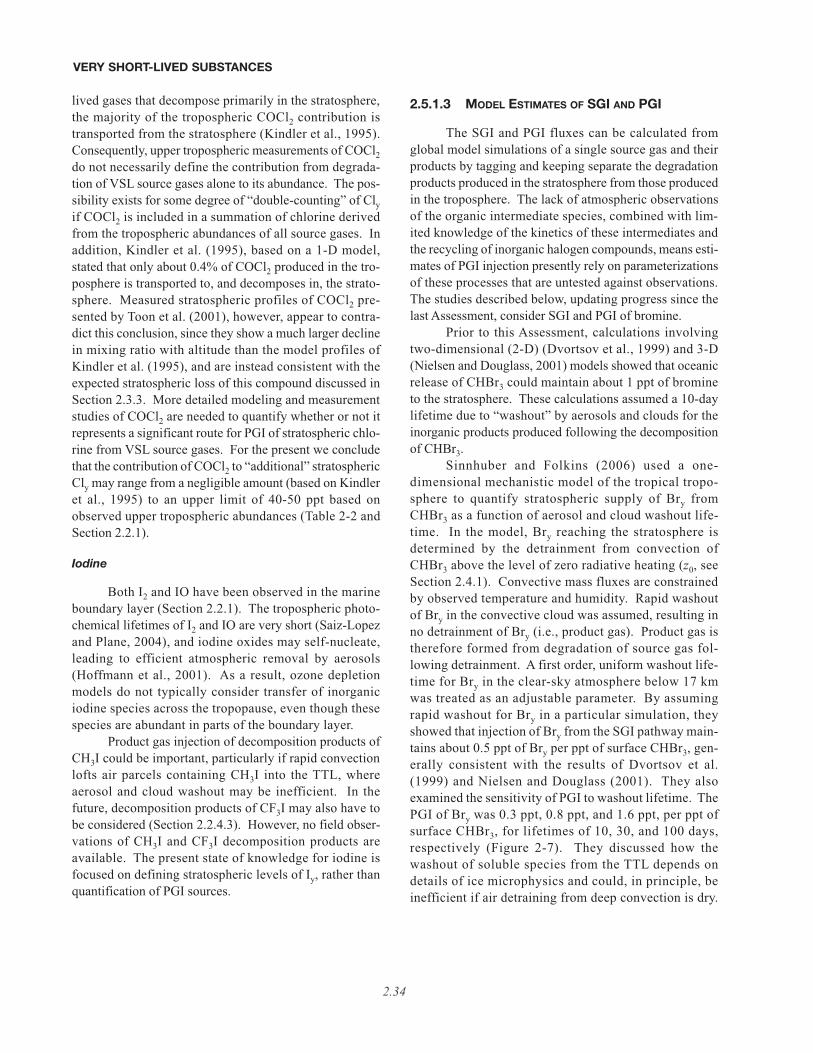
lived gases that decompose primarily in the stratosphere,the majority of the tropospheric COCl2 contribution istransported from the stratosphere (Kindler et al., 1995).Consequently, upper tropospheric measurements of COCl2do not necessarily define the contribution from degrada-tion of VSL source gases alone to its abundance. The pos-sibility exists for some degree of “double-counting” of Clyif COCl2 is included in a summation of chlorine derivedfrom the tropospheric abundances of all source gases. Inaddition, Kindler et al. (1995), based on a 1-D model,stated that only about 0.4% of COCl2 produced in the tro-posphere is transported to, and decomposes in, the strato-sphere. Measured stratospheric profiles of COCl2 pre-sented by Toon et al. (2001), however, appear to contra-dict this conclusion, since they show a much larger declinein mixing ratio with altitude than the model profiles ofKindler et al. (1995), and are instead consistent with theexpected stratospheric loss of this compound discussed inSection 2.3.3. More detailed modeling and measurementstudies of COCl2 are needed to quantify whether or not itrepresents a significant route for PGI of stratospheric chlo-rine from VSL source gases. For the present we concludethat the contribution of COCl2 to “additional” stratosphericCly may range from a negligible amount (based on Kindleret al., 1995) to an upper limit of 40-50 ppt based onobserved upper tropospheric abundances (Table 2-2 andSection 2.2.1).
Iodine
Both I2 and IO have been observed in the marineboundary layer (Section 2.2.1). The tropospheric photo-chemical lifetimes of I2 and IO are very short (Saiz-Lopezand Plane, 2004), and iodine oxides may self-nucleate,leading to efficient atmospheric removal by aerosols(Hoffmann et al., 2001). As a result, ozone depletionmodels do not typically consider transfer of inorganiciodine species across the tropopause, even though thesespecies are abundant in parts of the boundary layer.
Product gas injection of decomposition products ofCH3I could be important, particularly if rapid convectionlofts air parcels containing CH3I into the TTL, whereaerosol and cloud washout may be inefficient. In thefuture, decomposition products of CF3I may also have tobe considered (Section 2.2.4.3). However, no field obser-vations of CH3I and CF3I decomposition products areavailable. The present state of knowledge for iodine isfocused on defining stratospheric levels of Iy, rather thanquantification of PGI sources.
2.5.1.3 MODEL ESTIMATES OF SGI AND PGI
The SGI and PGI fluxes can be calculated fromglobal model simulations of a single source gas and theirproducts by tagging and keeping separate the degradationproducts produced in the stratosphere from those producedin the troposphere. The lack of atmospheric observationsof the organic intermediate species, combined with lim-ited knowledge of the kinetics of these intermediates andthe recycling of inorganic halogen compounds, means esti-mates of PGI injection presently rely on parameterizationsof these processes that are untested against observations.The studies described below, updating progress since thelast Assessment, consider SGI and PGI of bromine.
Prior to this Assessment, calculations involvingtwo-dimensional (2-D) (Dvortsov et al., 1999) and 3-D(Nielsen and Douglass, 2001) models showed that oceanicrelease of CHBr3 could maintain about 1 ppt of bromineto the stratosphere. These calculations assumed a 10-daylifetime due to “washout” by aerosols and clouds for theinorganic products produced following the decompositionof CHBr3.
Sinnhuber and Folkins (2006) used a one-dimensional mechanistic model of the tropical tropo-sphere to quantify stratospheric supply of Bry fromCHBr3 as a function of aerosol and cloud washout life-time. In the model, Bry reaching the stratosphere isdetermined by the detrainment from convection ofCHBr3 above the level of zero radiative heating (z0, seeSection 2.4.1). Convective mass fluxes are constrainedby observed temperature and humidity. Rapid washoutof Bry in the convective cloud was assumed, resulting inno detrainment of Bry (i.e., product gas). Product gas istherefore formed from degradation of source gas fol-lowing detrainment. A first order, uniform washout life-time for Bry in the clear-sky atmosphere below 17 kmwas treated as an adjustable parameter. By assumingrapid washout for Bry in a particular simulation, theyshowed that injection of Bry from the SGI pathway main-tains about 0.5 ppt of Bry per ppt of surface CHBr3, gen-erally consistent with the results of Dvortsov et al.(1999) and Nielsen and Douglass (2001). They alsoexamined the sensitivity of PGI to washout lifetime. ThePGI of Bry was 0.3 ppt, 0.8 ppt, and 1.6 ppt, per ppt ofsurface CHBr3, for lifetimes of 10, 30, and 100 days,respectively (Figure 2-7). They discussed how thewashout of soluble species from the TTL depends ondetails of ice microphysics and could, in principle, beinefficient if air detraining from deep convection is dry.
VERY SHORT-LIVED SUBSTANCES
2.34
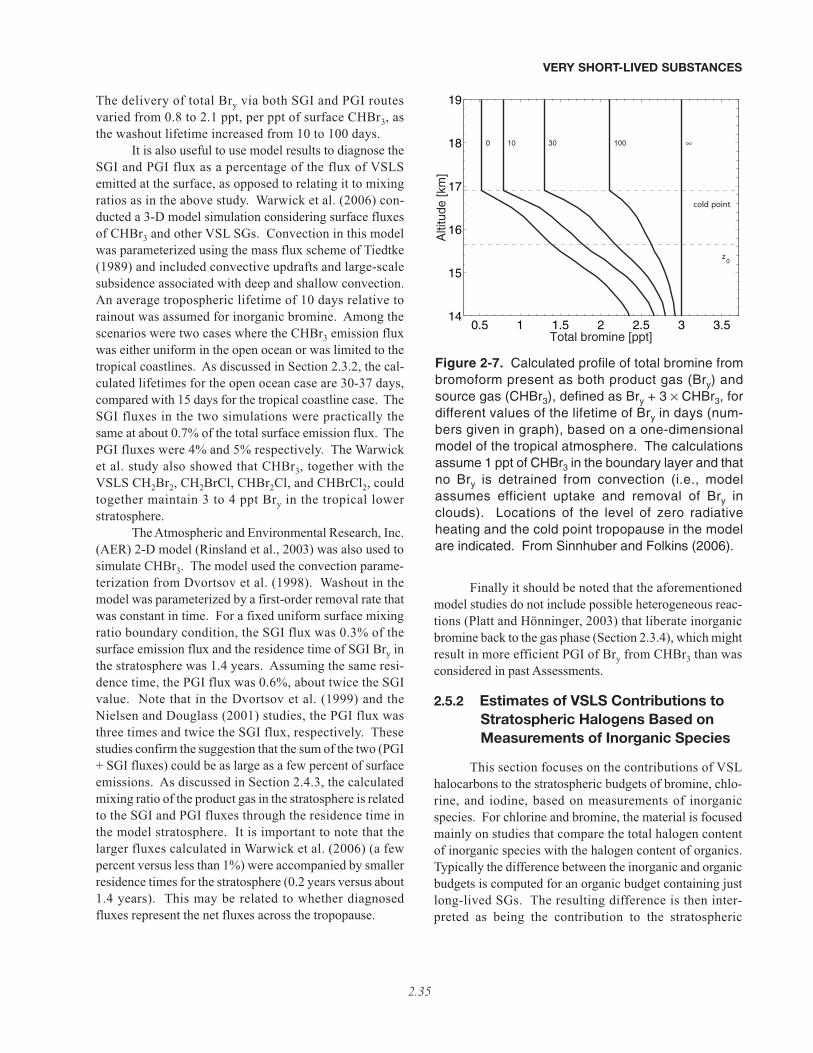
The delivery of total Bry via both SGI and PGI routesvaried from 0.8 to 2.1 ppt, per ppt of surface CHBr3, asthe washout lifetime increased from 10 to 100 days.
It is also useful to use model results to diagnose theSGI and PGI flux as a percentage of the flux of VSLSemitted at the surface, as opposed to relating it to mixingratios as in the above study. Warwick et al. (2006) con-ducted a 3-D model simulation considering surface fluxesof CHBr3 and other VSL SGs. Convection in this modelwas parameterized using the mass flux scheme of Tiedtke(1989) and included convective updrafts and large-scalesubsidence associated with deep and shallow convection.An average tropospheric lifetime of 10 days relative torainout was assumed for inorganic bromine. Among thescenarios were two cases where the CHBr3 emission fluxwas either uniform in the open ocean or was limited to thetropical coastlines. As discussed in Section 2.3.2, the cal-culated lifetimes for the open ocean case are 30-37 days,compared with 15 days for the tropical coastline case. TheSGI fluxes in the two simulations were practically thesame at about 0.7% of the total surface emission flux. ThePGI fluxes were 4% and 5% respectively. The Warwicket al. study also showed that CHBr3, together with theVSLS CH2Br2, CH2BrCl, CHBr2Cl, and CHBrCl2, couldtogether maintain 3 to 4 ppt Bry in the tropical lowerstratosphere.
The Atmospheric and Environmental Research, Inc.(AER) 2-D model (Rinsland et al., 2003) was also used tosimulate CHBr3. The model used the convection parame-terization from Dvortsov et al. (1998). Washout in themodel was parameterized by a first-order removal rate thatwas constant in time. For a fixed uniform surface mixingratio boundary condition, the SGI flux was 0.3% of thesurface emission flux and the residence time of SGI Bry inthe stratosphere was 1.4 years. Assuming the same resi-dence time, the PGI flux was 0.6%, about twice the SGIvalue. Note that in the Dvortsov et al. (1999) and theNielsen and Douglass (2001) studies, the PGI flux wasthree times and twice the SGI flux, respectively. Thesestudies confirm the suggestion that the sum of the two (PGI+ SGI fluxes) could be as large as a few percent of surfaceemissions. As discussed in Section 2.4.3, the calculatedmixing ratio of the product gas in the stratosphere is relatedto the SGI and PGI fluxes through the residence time inthe model stratosphere. It is important to note that thelarger fluxes calculated in Warwick et al. (2006) (a fewpercent versus less than 1%) were accompanied by smallerresidence times for the stratosphere (0.2 years versus about1.4 years). This may be related to whether diagnosedfluxes represent the net fluxes across the tropopause.
Finally it should be noted that the aforementionedmodel studies do not include possible heterogeneous reac-tions (Platt and Hönninger, 2003) that liberate inorganicbromine back to the gas phase (Section 2.3.4), which mightresult in more efficient PGI of Bry from CHBr3 than wasconsidered in past Assessments.
2.5.2 Estimates of VSLS Contributions toStratospheric Halogens Based onMeasurements of Inorganic Species
This section focuses on the contributions of VSLhalocarbons to the stratospheric budgets of bromine, chlo-rine, and iodine, based on measurements of inorganicspecies. For chlorine and bromine, the material is focusedmainly on studies that compare the total halogen contentof inorganic species with the halogen content of organics.Typically the difference between the inorganic and organicbudgets is computed for an organic budget containing justlong-lived SGs. The resulting difference is then inter-preted as being the contribution to the stratospheric
VERY SHORT-LIVED SUBSTANCES
2.35
0.5 1 1.5 2 2.5 3 3.514
15
16
17
18
19
0 10 30 100 ∞
Total bromine [ppt]
Alti
tude
[km
]
z0
cold point
Figure 2-7. Calculated profile of total bromine frombromoform present as both product gas (Bry) andsource gas (CHBr3), defined as Bry + 3 × CHBr3, fordifferent values of the lifetime of Bry in days (num-bers given in graph), based on a one-dimensionalmodel of the tropical atmosphere. The calculationsassume 1 ppt of CHBr3 in the boundary layer and thatno Bry is detrained from convection (i.e., modelassumes efficient uptake and removal of Bry inclouds). Locations of the level of zero radiativeheating and the cold point tropopause in the modelare indicated. From Sinnhuber and Folkins (2006).
halogen loading by VSLS. This method is unable to dis-tinguish between SGI and PGI, and would also includecontributions from product gases that do not originate fromVSLS. For bromine the long-lived SG budget is definedby the total bromine content of CH3Br and the three or fourhalons that are commonly used to define baseline halogenscenarios for this and previous Assessments. For chlorinespecies the long-lived SG budget is defined by the 12species (CFC-11, CFC-12, CFC-113, CFC-114, CFC-115,CCl4, CH3CCl3, HCFC-22, HCFC-141b, HCFC-142b,halon-1211, and CH3Cl; see Chapter 1) used to define thebaseline halogen loading scenarios in this and priorAssessments. As defined in the introduction, the termsBry
VSLS and ClyVSLS refer to the component of stratospheric
Bry and Cly, respectively, due to SGI and PGI of sourcesother than these long-lived SGs. For iodine, the discus-sion is focused on quantification of total stratospheric inor-ganic iodine (Iy) based on measurements of IO, sincesupply is thought to be exclusively from VSL SGs. Theseapproaches represent the present state of knowledgeregarding quantification of the contribution of VSLS onthe stratospheric halogen loadings.
2.5.2.1 BROMINE
Prior to this Assessment, balloonborne observationsof BrO in the middle stratosphere at midlatitudes wereshown to be consistent with stratospheric Bry of 21.5 ± 3ppt (Pfeilsticker et al., 2000). The total amount of organicbromine in the upper troposphere reported in this studywas 18.4 (+1.8 / −1.5) ppt, based on measurements ofCH3Br, four halons, and a variety of VSL SGs. The higherlevels of Bry inferred from BrO, compared with Bryinferred from the suite of organics, suggested either directtransport of VSL PGs or inorganic bromine across thetropopause, or perhaps larger abundances of VSL SGs inthe tropics compared with midlatitudes where the balloonobservations were obtained. Ground-based observationsof column BrO from many stations were shown to be con-sistent with a total stratospheric bromine abundance of20 ± 4 ppt, reflecting a ~5 ppt contribution from VSLS(Sinnhuber et al., 2002). Also in the last Assessment, atime series of Bry inferred from BrO measurements in themiddle stratosphere over several years was shown toexceed Bry from CH3Br + halons by an amount consistentwith supply of 4 to 5 ppt of Bry from VSLS (Figure 1-8,WMO, 2003). However, the interpretation of these datain the last Assessment was tentative, with the possibilityof “calibration errors either in the measurements of BrOor the organic source gases” being noted as a possibleexplanation of the observations.
Since the last Assessment, there have been manystudies, described below, that quantify Bry
VSLS. Mostof these studies, based on measurements of BrO bymany techniques, conclude that stratospheric Bry exceedsthe amount of bromine that can be supplied solely byCH3Br and halons. Therefore, since the last Assessment,we have gained greater confidence that the stratosphericbromine budget is affected by cross-tropopause transportof brominated VSLS, by either the SGI and/or PGI routes,and that the difference noted in the last Assessment is notdue to “calibration errors.”
Figure 2-3 updates the time series of stratosphericand tropospheric bromine shown in the last Assessment(Figure 1-8, WMO, 2003). Observations of BrO usingballoonborne differential optical absorption spectroscopy(DOAS) have been used to estimate stratospheric Bry(Dorf, 2005; Dorf et al., 2006a). The most accurateanalysis is based on estimating the mixing ratio of BrO forthe middle stratosphere from the slope of BrO slant columnversus air column above the balloon float altitude (the“Langley” method) and then using a photochemical modelto deduce Bry from measured BrO. Results for five flights,from 1996 to 2005, are illustrated (points labeled “DOASBrO Langley obs.”) in Figure 2-3. Numerical values arealso given in Table 2-7. Estimates of Bry
VSLS are based onthe difference between Bry inferred from BrO and thebromine content of CH3Br and halons (Bry
CH3Br+Halons).The estimate of Bry
CH3Br+Halons considers age of air, inferredfrom measured tracers, and neglects tropospheric gradi-ents (i.e., it assumes that the sum of bromine from sourceand associated product gases at the tropical tropopause,notably in the case of CH3Br, is represented by the meanof observed global surface mixing ratios). The differencebetween Bry inferred from BrO and Bry
CH3Br+Halons yieldsthe estimated value for Bry
VSLS (bottom row, Table 2-7).The mean and standard deviation for Bry
VSLS, consideringall five flights, is 4.1 ± 1 ppt. The overall uncertainty ofthis estimate, which is dominated by the accuracy of theBrO measurements and by the kinetics used to estimateBry from BrO, is ±2.5 ppt (see Table 2-7 for discussion ofuncertainties). Values of Bry
VSLS are illustrated in Figure2-3 by the difference between the time series of Bryinferred from BrO and Bry
CH3Br+Halons.Other DOAS-based estimates of Bry are also
shown in Figure 2-3. These estimates, labeled “DOASBrO profiles,” are derived from model interpretation ofBrO profiles in the lower stratosphere. The DOAS BrOprofile estimate is considered to be a less reliable methodfor inferring Bry
VSLS compared with the Langley method(Dorf, 2005). It is reassuring that the two methods givegood agreement, since this shows an overall level of con-
VERY SHORT-LIVED SUBSTANCES
2.36
sistency between the two methods that sample differentparts of the atmosphere. DOAS BrO profile estimates arealso available for more fights than the estimates based onthe Langley method, resulting in a more complete timeseries for stratospheric Bry. The fact that values of Bry inthe lower and middle stratosphere are similar lends cre-dence to the notion that VSLS contribute significantly tostratospheric Bry.
The values of Bry inferred from the balloon obser-vations of BrO shown in Figure 2-3 imply, by an amountthat is larger than the overall uncertainty, a significant con-tribution to stratospheric Bry from VSLS. In addition, thevalues of Bry observed during the past few years indicatea “leveling off” that appears to be consistent with thebehavior of Bry
CH3Br+Halons (Dorf et al., 2006b). This sug-gests that Bry
VSLS has not changed dramatically between1996 and 2005, the time period of the stratospheric obser-vations, and that changes in the surface emissions ofCH3Br and halons are being reflected in the stratosphericabundance of Bry.
As noted above, Figure 2-3 neglects troposphericgradients of CH3Br that may, at least partly, result from itstropospheric degradation. The mixing ratios of CH3Br inthe TTL may be about 7% smaller than the globally aver-aged surface value (Schauffler et al., 1999; Montzka et al.,2003). If the bromine compounds resulting from tropo-spheric decomposition of CH3Br do not reach the strato-sphere, then estimates of Bry
VSLS that rely on surfacemixing ratios of CH3Br may consequently be too low byup to 0.6 ppt.
Salawitch et al. (2005) examined GOME columnBrO as well as measurements of BrO from aircraft andballoons. Their study suggested Bry
VSLS between 4 and 10ppt; best agreement with aircraft data was achieved for a
value of 6.9 ppt, while a balloon profile of BrO in thesummer tropics (Pundt et al., 2002) suggested a valuecloser to 10 ppt. Sinnhuber et al. (2002, 2005) showedthat the gas-phase reaction of bromine nitrate (BrONO2)with oxygen atom triplet (O(3P)) proceeds quickly enough(Soller et al., 2001) to affect the partitioning of Bry species.Nearly all of the studies presented here consider this reac-tion, even though it is not included in any of the past JPLor IUPAC evaluations. The exception is the study ofSalawitch et al. (2005), who relied solely on JPL kinetics.Had they included this reaction, their values of Bry
VSLS
from the aircraft and balloon data would have been ~6 pptand ~8 ppt, respectively. The Salawitch et al. (2005) valuesof Bry
VSLS are a little higher than those derived from theDOAS measurements, but are generally consistent withthe picture presented in Figure 2-3.
Since the last Assessment, attention has alsofocused on the interpretation of satellite observations ofBrO. As noted previously, observations of column BrOfrom GOME reveal abundances of total column BrO,throughout the global atmosphere, that are much largerthan expected based on simulations that assume supply ofatmospheric bromine from only CH3Br and halons (Figure2-8, top panel). Measurements of column BrO from theScanning Imaging Absorption Spectrometer for Atmos-pheric Cartography (SCIAMACHY) satellite instrumentconfirm the accuracy of the GOME observations ofcolumn BrO (Sinnhuber et al., 2005; Sioris et al., 2006).Recent scientific studies have focused on quantifyingwhether the much higher than expected levels of BrOreported by GOME reside in the stratosphere, the tropo-sphere, or perhaps in both layers at levels important forthe photochemical environment. Evidence for and againsta global, background tropospheric level of BrO large
VERY SHORT-LIVED SUBSTANCES
2.37
Table 2-7. Contribution to stratospheric BryVSLS based on DOAS balloon BrO profiles.
Leon, Kiruna, Aire sur Kiruna, Teresina,Spain Sweden l’Adour, France Sweden Brazil1996 1999 2003 2003 2005
Bry from BrO (ppt)a 17.8 19.9 20.1 20.4 21.5Age (yrs) 5 6 5 5 5CH3Br (ppt)b 9.2 9.3 9.6 9.5 8.8Halons (ppt)b 5.2 5.8 7.2 7.2 7.5Bry
VSLS (ppt)c 3.4 4.8 3.3 3.7 5.2a The 1σ precision of Bry estimated using the Langley method is about 0.7 ppt. The total uncertainty is 2.5 ppt, which represents the precision as well
as uncertainties in the BrO cross section (±8%) and the photochemical correction used to convert BrO to Bry (±8%).b Estimates of Bry
CH3Br+Halons are obtained from Montzka et al. (2003), assuming no tropospheric gradient of CH3Br.c The mean and standard deviation of the 5 estimates of Bry
VSLS are 4.1 ± 1 ppt. The standard deviation is consistent with the estimated precision in Bry.Considering the overall uncertainty in Bry from BrO, and assuming that Bry
CH3Br+Halons is well known, leads to a range for BryVSLS of 4.1 ± 2.5 ppt,
which is the value for DOAS given in Table 2-8. From Dorf (2005).
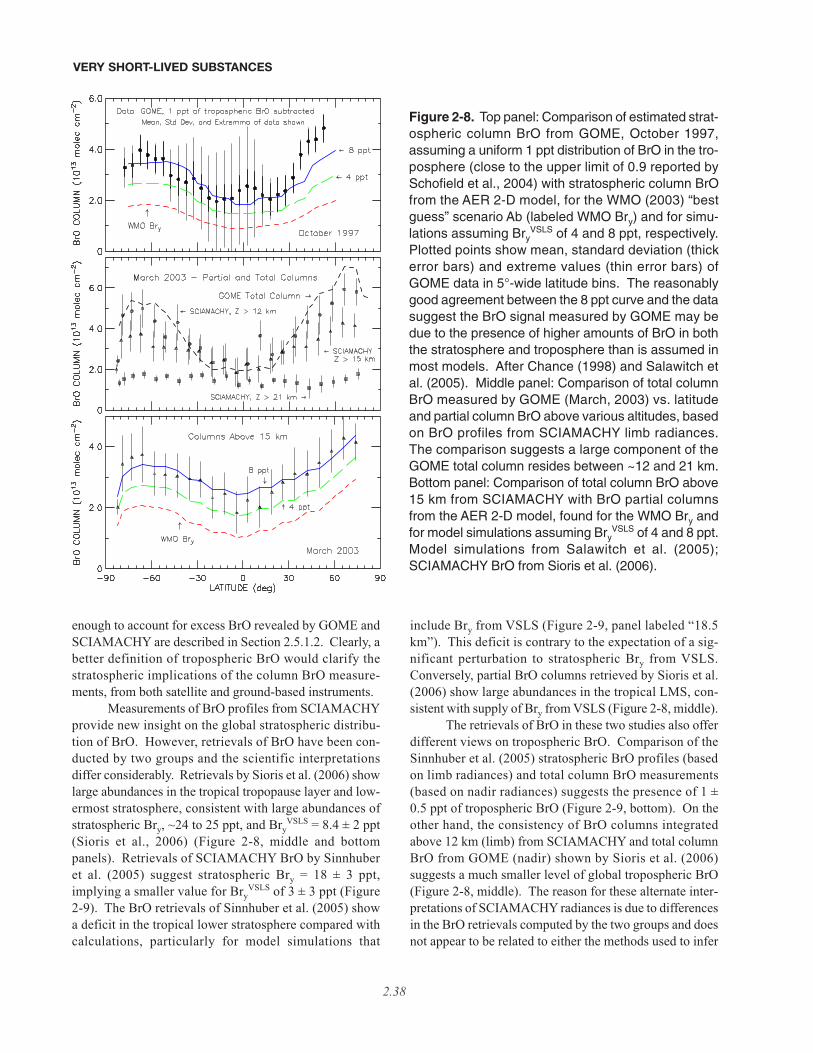
enough to account for excess BrO revealed by GOME andSCIAMACHY are described in Section 2.5.1.2. Clearly, abetter definition of tropospheric BrO would clarify thestratospheric implications of the column BrO measure-ments, from both satellite and ground-based instruments.
Measurements of BrO profiles from SCIAMACHYprovide new insight on the global stratospheric distribu-tion of BrO. However, retrievals of BrO have been con-ducted by two groups and the scientific interpretationsdiffer considerably. Retrievals by Sioris et al. (2006) showlarge abundances in the tropical tropopause layer and low-ermost stratosphere, consistent with large abundances ofstratospheric Bry, ~24 to 25 ppt, and Bry
VSLS = 8.4 ± 2 ppt(Sioris et al., 2006) (Figure 2-8, middle and bottompanels). Retrievals of SCIAMACHY BrO by Sinnhuberet al. (2005) suggest stratospheric Bry = 18 ± 3 ppt,implying a smaller value for Bry
VSLS of 3 ± 3 ppt (Figure2-9). The BrO retrievals of Sinnhuber et al. (2005) showa deficit in the tropical lower stratosphere compared withcalculations, particularly for model simulations that
include Bry from VSLS (Figure 2-9, panel labeled “18.5km”). This deficit is contrary to the expectation of a sig-nificant perturbation to stratospheric Bry from VSLS.Conversely, partial BrO columns retrieved by Sioris et al.(2006) show large abundances in the tropical LMS, con-sistent with supply of Bry from VSLS (Figure 2-8, middle).
The retrievals of BrO in these two studies also offerdifferent views on tropospheric BrO. Comparison of theSinnhuber et al. (2005) stratospheric BrO profiles (basedon limb radiances) and total column BrO measurements(based on nadir radiances) suggests the presence of 1 ±0.5 ppt of tropospheric BrO (Figure 2-9, bottom). On theother hand, the consistency of BrO columns integratedabove 12 km (limb) from SCIAMACHY and total columnBrO from GOME (nadir) shown by Sioris et al. (2006)suggests a much smaller level of global tropospheric BrO(Figure 2-8, middle). The reason for these alternate inter-pretations of SCIAMACHY radiances is due to differencesin the BrO retrievals computed by the two groups and doesnot appear to be related to either the methods used to infer
VERY SHORT-LIVED SUBSTANCES
2.38
Figure 2-8. Top panel: Comparison of estimated strat-ospheric column BrO from GOME, October 1997,assuming a uniform 1 ppt distribution of BrO in the tro-posphere (close to the upper limit of 0.9 reported bySchofield et al., 2004) with stratospheric column BrOfrom the AER 2-D model, for the WMO (2003) “bestguess” scenario Ab (labeled WMO Bry) and for simu-lations assuming Bry
VSLS of 4 and 8 ppt, respectively.Plotted points show mean, standard deviation (thickerror bars) and extreme values (thin error bars) ofGOME data in 5°-wide latitude bins. The reasonablygood agreement between the 8 ppt curve and the datasuggest the BrO signal measured by GOME may bedue to the presence of higher amounts of BrO in boththe stratosphere and troposphere than is assumed inmost models. After Chance (1998) and Salawitch etal. (2005). Middle panel: Comparison of total columnBrO measured by GOME (March, 2003) vs. latitudeand partial column BrO above various altitudes, basedon BrO profiles from SCIAMACHY limb radiances.The comparison suggests a large component of theGOME total column resides between ~12 and 21 km.Bottom panel: Comparison of total column BrO above15 km from SCIAMACHY with BrO partial columnsfrom the AER 2-D model, found for the WMO Bry andfor model simulations assuming Bry
VSLS of 4 and 8 ppt.Model simulations from Salawitch et al. (2005);SCIAMACHY BrO from Sioris et al. (2006).
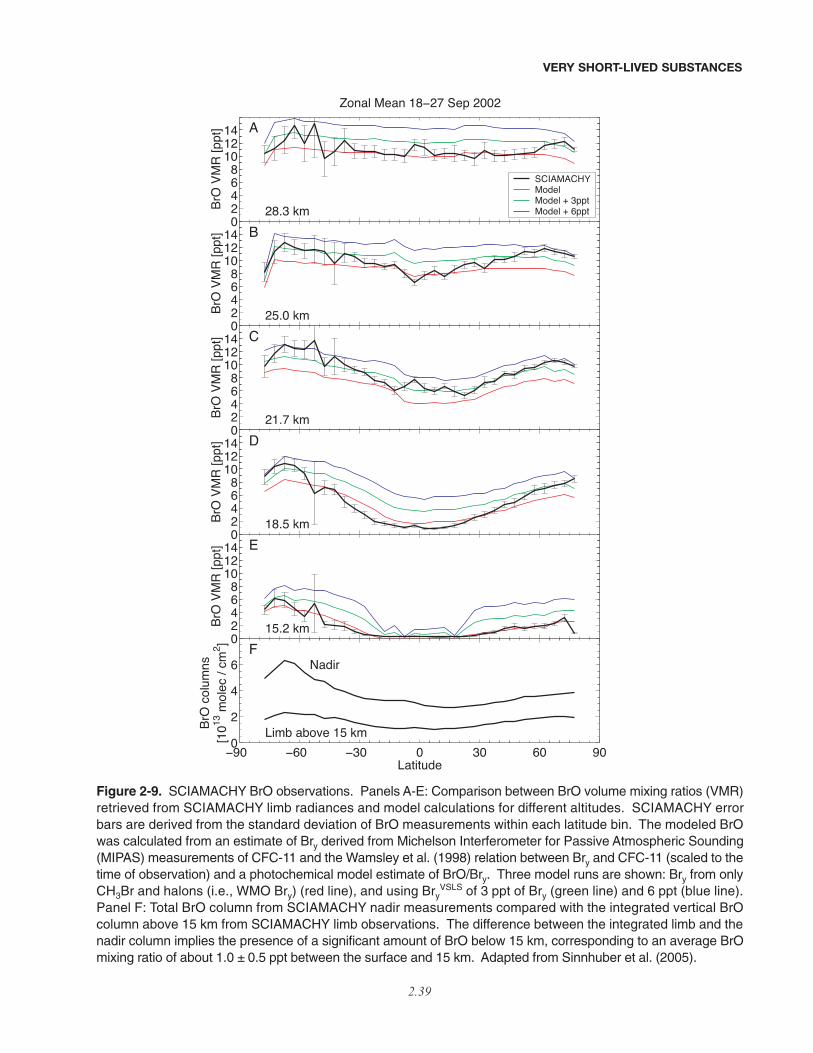
VERY SHORT-LIVED SUBSTANCES
2.39
02468
101214
BrO
VMR
[ppt
]28.3 km
AZonal Mean 18−27 Sep 2002
SCIAMACHYModelModel + 3pptModel + 6ppt
02468
101214
BrO
VMR
[ppt
]
25.0 km
B
02468
101214
BrO
VMR
[ppt
]
21.7 km
C
02468
101214
BrO
VMR
[ppt
]
18.5 km
D
02468
101214
BrO
VMR
[ppt
]
15.2 km
E
−90 −60 −30 0 30 60 900
2
4
6
Limb above 15 km
Nadir
Latitude
BrO
colum
ns[1
013m
olec/
cm2 ] F
Figure 2-9. SCIAMACHY BrO observations. Panels A-E: Comparison between BrO volume mixing ratios (VMR)retrieved from SCIAMACHY limb radiances and model calculations for different altitudes. SCIAMACHY errorbars are derived from the standard deviation of BrO measurements within each latitude bin. The modeled BrOwas calculated from an estimate of Bry derived from Michelson Interferometer for Passive Atmospheric Sounding(MIPAS) measurements of CFC-11 and the Wamsley et al. (1998) relation between Bry and CFC-11 (scaled to thetime of observation) and a photochemical model estimate of BrO/Bry. Three model runs are shown: Bry from onlyCH3Br and halons (i.e., WMO Bry) (red line), and using Bry
VSLS of 3 ppt of Bry (green line) and 6 ppt (blue line).Panel F: Total BrO column from SCIAMACHY nadir measurements compared with the integrated vertical BrOcolumn above 15 km from SCIAMACHY limb observations. The difference between the integrated limb and thenadir column implies the presence of a significant amount of BrO below 15 km, corresponding to an average BrOmixing ratio of about 1.0 ± 0.5 ppt between the surface and 15 km. Adapted from Sinnhuber et al. (2005).
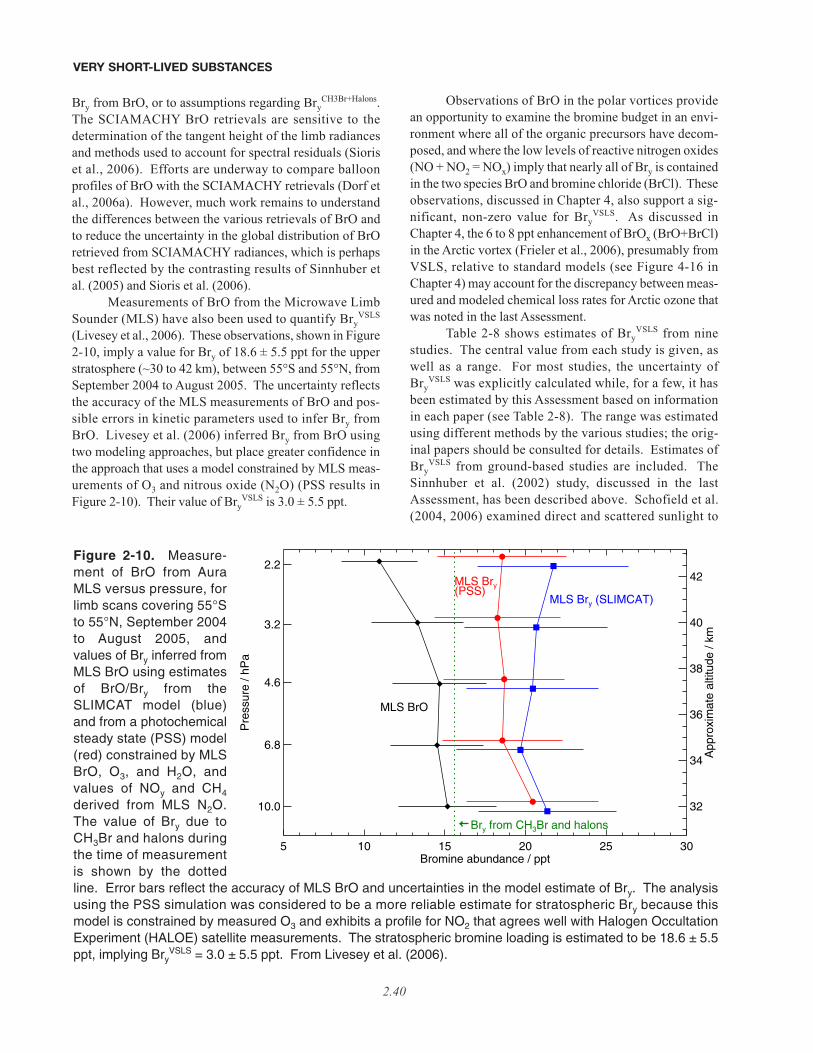
Bry from BrO, or to assumptions regarding BryCH3Br+Halons.
The SCIAMACHY BrO retrievals are sensitive to thedetermination of the tangent height of the limb radiancesand methods used to account for spectral residuals (Sioriset al., 2006). Efforts are underway to compare balloonprofiles of BrO with the SCIAMACHY retrievals (Dorf etal., 2006a). However, much work remains to understandthe differences between the various retrievals of BrO andto reduce the uncertainty in the global distribution of BrOretrieved from SCIAMACHY radiances, which is perhapsbest reflected by the contrasting results of Sinnhuber etal. (2005) and Sioris et al. (2006).
Measurements of BrO from the Microwave LimbSounder (MLS) have also been used to quantify Bry
VSLS
(Livesey et al., 2006). These observations, shown in Figure2-10, imply a value for Bry of 18.6 ± 5.5 ppt for the upperstratosphere (~30 to 42 km), between 55°S and 55°N, fromSeptember 2004 to August 2005. The uncertainty reflectsthe accuracy of the MLS measurements of BrO and pos-sible errors in kinetic parameters used to infer Bry fromBrO. Livesey et al. (2006) inferred Bry from BrO usingtwo modeling approaches, but place greater confidence inthe approach that uses a model constrained by MLS meas-urements of O3 and nitrous oxide (N2O) (PSS results inFigure 2-10). Their value of Bry
VSLS is 3.0 ± 5.5 ppt.
Observations of BrO in the polar vortices providean opportunity to examine the bromine budget in an envi-ronment where all of the organic precursors have decom-posed, and where the low levels of reactive nitrogen oxides(NO + NO2 = NOx) imply that nearly all of Bry is containedin the two species BrO and bromine chloride (BrCl). Theseobservations, discussed in Chapter 4, also support a sig-nificant, non-zero value for Bry
VSLS. As discussed inChapter 4, the 6 to 8 ppt enhancement of BrOx (BrO+BrCl)in the Arctic vortex (Frieler et al., 2006), presumably fromVSLS, relative to standard models (see Figure 4-16 inChapter 4) may account for the discrepancy between meas-ured and modeled chemical loss rates for Arctic ozone thatwas noted in the last Assessment.
Table 2-8 shows estimates of BryVSLS from nine
studies. The central value from each study is given, aswell as a range. For most studies, the uncertainty ofBry
VSLS was explicitly calculated while, for a few, it hasbeen estimated by this Assessment based on informationin each paper (see Table 2-8). The range was estimatedusing different methods by the various studies; the orig-inal papers should be consulted for details. Estimates ofBry
VSLS from ground-based studies are included. TheSinnhuber et al. (2002) study, discussed in the lastAssessment, has been described above. Schofield et al.(2004, 2006) examined direct and scattered sunlight to
VERY SHORT-LIVED SUBSTANCES
2.40
Figure 2-10. Measure-ment of BrO from AuraMLS versus pressure, forlimb scans covering 55°Sto 55°N, September 2004to August 2005, andvalues of Bry inferred fromMLS BrO using estimatesof BrO/Bry from theSLIMCAT model (blue)and from a photochemicalsteady state (PSS) model(red) constrained by MLSBrO, O3, and H2O, andvalues of NOy and CH4
derived from MLS N2O.The value of Bry due toCH3Br and halons duringthe time of measurementis shown by the dottedline. Error bars reflect the accuracy of MLS BrO and uncertainties in the model estimate of Bry. The analysisusing the PSS simulation was considered to be a more reliable estimate for stratospheric Bry because thismodel is constrained by measured O3 and exhibits a profile for NO2 that agrees well with Halogen OccultationExperiment (HALOE) satellite measurements. The stratospheric bromine loading is estimated to be 18.6 ± 5.5ppt, implying Bry
VSLS = 3.0 ± 5.5 ppt. From Livesey et al. (2006).
5 10 15 20 25 30Bromine abundance / ppt
10.0
6.8
4.6
3.2
2.2
Pre
ssur
e / h
Pa
MLS BrO
MLS Bry (SLIMCAT)
MLS Bry(PSS)
Bry from CH3Br and halons
32
34
36
38
40
42
App
roxi
mat
e al
titud
e / k
m
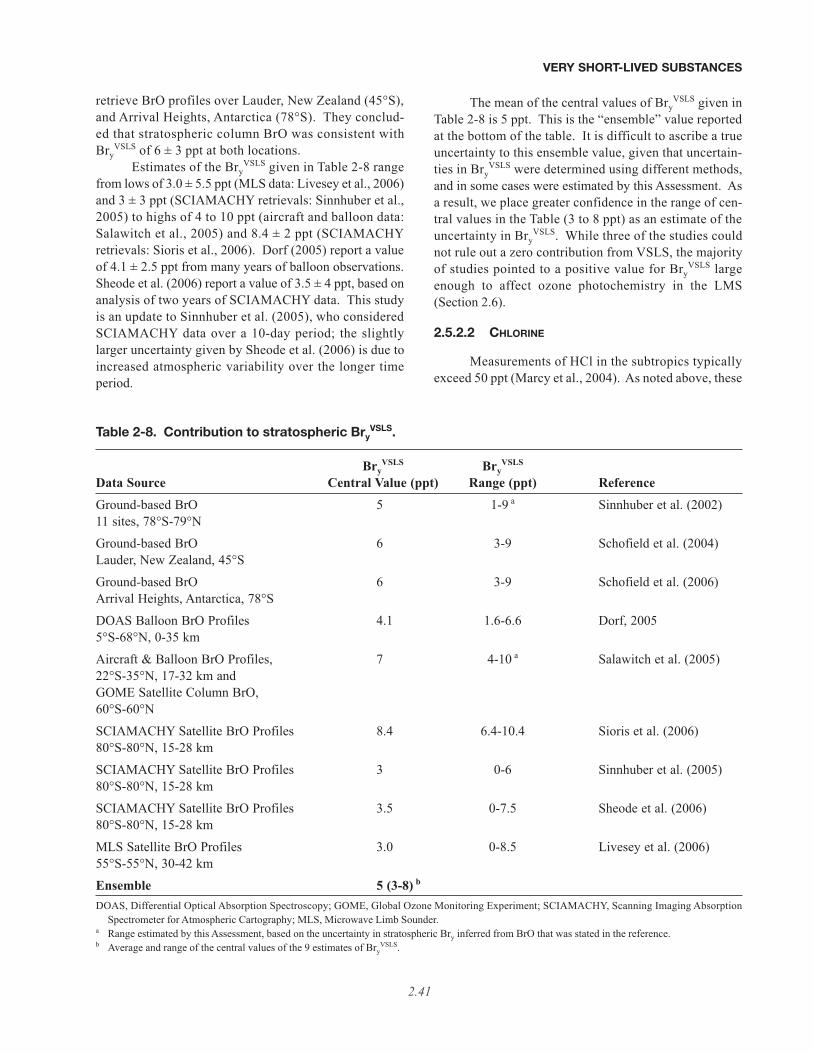
retrieve BrO profiles over Lauder, New Zealand (45°S),and Arrival Heights, Antarctica (78°S). They conclud-ed that stratospheric column BrO was consistent withBry
VSLS of 6 ± 3 ppt at both locations. Estimates of the Bry
VSLS given in Table 2-8 rangefrom lows of 3.0 ± 5.5 ppt (MLS data: Livesey et al., 2006)and 3 ± 3 ppt (SCIAMACHY retrievals: Sinnhuber et al.,2005) to highs of 4 to 10 ppt (aircraft and balloon data:Salawitch et al., 2005) and 8.4 ± 2 ppt (SCIAMACHYretrievals: Sioris et al., 2006). Dorf (2005) report a valueof 4.1 ± 2.5 ppt from many years of balloon observations.Sheode et al. (2006) report a value of 3.5 ± 4 ppt, based onanalysis of two years of SCIAMACHY data. This studyis an update to Sinnhuber et al. (2005), who consideredSCIAMACHY data over a 10-day period; the slightlylarger uncertainty given by Sheode et al. (2006) is due toincreased atmospheric variability over the longer timeperiod.
The mean of the central values of BryVSLS given in
Table 2-8 is 5 ppt. This is the “ensemble” value reportedat the bottom of the table. It is difficult to ascribe a trueuncertainty to this ensemble value, given that uncertain-ties in Bry
VSLS were determined using different methods,and in some cases were estimated by this Assessment. Asa result, we place greater confidence in the range of cen-tral values in the Table (3 to 8 ppt) as an estimate of theuncertainty in Bry
VSLS. While three of the studies couldnot rule out a zero contribution from VSLS, the majorityof studies pointed to a positive value for Bry
VSLS largeenough to affect ozone photochemistry in the LMS(Section 2.6).
2.5.2.2 CHLORINE
Measurements of HCl in the subtropics typicallyexceed 50 ppt (Marcy et al., 2004). As noted above, these
VERY SHORT-LIVED SUBSTANCES
2.41
Table 2-8. Contribution to stratospheric BryVSLS.
BryVSLS Bry
VSLS
Data Source Central Value (ppt) Range (ppt) ReferenceGround-based BrO 5 1-9 a Sinnhuber et al. (2002)11 sites, 78°S-79°N
Ground-based BrO 6 3-9 Schofield et al. (2004)Lauder, New Zealand, 45°S
Ground-based BrO 6 3-9 Schofield et al. (2006)Arrival Heights, Antarctica, 78°S
DOAS Balloon BrO Profiles 4.1 1.6-6.6 Dorf, 20055°S-68°N, 0-35 km
Aircraft & Balloon BrO Profiles, 7 4-10 a Salawitch et al. (2005)22°S-35°N, 17-32 km andGOME Satellite Column BrO,60°S-60°N
SCIAMACHY Satellite BrO Profiles 8.4 6.4-10.4 Sioris et al. (2006)80°S-80°N, 15-28 km
SCIAMACHY Satellite BrO Profiles 3 0-6 Sinnhuber et al. (2005)80°S-80°N, 15-28 km
SCIAMACHY Satellite BrO Profiles 3.5 0-7.5 Sheode et al. (2006)80°S-80°N, 15-28 km
MLS Satellite BrO Profiles 3.0 0-8.5 Livesey et al. (2006)55°S-55°N, 30-42 km
Ensemble 5 (3-8) b
DOAS, Differential Optical Absorption Spectroscopy; GOME, Global Ozone Monitoring Experiment; SCIAMACHY, Scanning Imaging AbsorptionSpectrometer for Atmospheric Cartography; MLS, Microwave Limb Sounder.
a Range estimated by this Assessment, based on the uncertainty in stratospheric Bry inferred from BrO that was stated in the reference.b Average and range of the central values of the 9 estimates of Bry
VSLS.

data have been interpreted as being evidence for supplyof HCl from the stratosphere, rather than being due tothe decomposition of VSL SGs. There have been nostudies, since the last Assessment, quantifying the influ-ence of VSL SGs on measured HCl in the tropical TTLor LMS. Such a study would require accurate and pre-cise measurement of HCl and a suite of organic chlorinespecies, including long-lived SGs and VSL SGs, pluseither detailed model analysis and/or observations ofdynamical tracers to be able to isolate the effects on chlo-rine of transport from above (where the longer lived SGsdecompose) and from below (where VSL SGs potentiallycontribute).
Another avenue for assessing the role of VSL com-pounds on stratospheric chlorine, which has received someattention since the last Assessment, is quantification ofstratospheric chlorine either by measurements of a suiteof compounds in the middle stratosphere or by measure-ment of HCl in the upper stratosphere. Nassar et al. (2006)quantified total stratospheric chlorine (ClTOT, the sum ofsimultaneous measurements of organic and inorganicspecies; see Figure 1-12 of Chapter 1) based primarily ondata from the Atmospheric Chemistry Experiment FourierTransform Spectrometer (ACE-FTS). They report a valueof ClTOT of 3.65 ppb over the period February 2004 toJanuary 2005, for both Southern and Northern Hemispheremidlatitudes. The 1σ precision of ClTOT is 0.09 ppb andthe estimated accuracy is 0.13 ppb. The estimated contri-bution of just long-lived species to Cly during this timeperiod is 3.41 ppb (this estimate is based on a mean agefor stratospheric air of 5 years and an age of air spectrumwidth of 3 years, applied to the WMO 2002 baseline sce-nario Ab (see Chapters 1 and 3 of this Assessment) for the12 long-lived chlorine species). The fact that the ACE-FTS value of ClTOT exceeds this value of Cly could beindicative of a contribution from VSLS. On the other hand,the combined uncertainty of the ACE-FTS value of ClTOT(accuracy + precision) nearly overlaps with the expectedvalue of Cly from just long-lived species.
Time series of HCl near 55 km from the ATMOS(Atmospheric Trace Molecule Spectroscopy experiment),HALOE (Halogen Occultation Experiment), MLS, andACE-FTS instruments are shown in Figure 1-12 of Chapter1, where it is discussed in terms of trends of Cly in the strat-osphere. In the Figure these measurements are comparedwith modeled stratospheric abundances of HCl due tolong-lived chlorinated gases alone (dashed line), andenhanced by the addition of 100 ppt of chlorine to repre-sent a possible contribution from VSLS and phosgene(solid lines). Because of the level of uncertainty in therespective satellite measurements (note the error bars inFigure 1-12, which represent 2-sigma uncertainty), it is
difficult to discriminate between the model runs with andwithout enhanced chlorine. The model run based on long-lived source gases alone appears closer to the HALOEmeasurements of HCl, which are lower than those obtainedby the other instruments (although within their reportederror limits). The MLS, ATMOS, and ACE-FTS measure-ments are suggestive of a contribution of chlorine fromVSLS. The contribution of VSLS to stratospheric Clycannot be quantified definitively given the current level ofaccuracy of the satellite HCl measurements.
2.5.2.3 IODINE
Solomon et al. (1994) suggested that if stratosphericinorganic iodine (Iy) levels were close to 1.0 ppt, catalyticcycles involving IO + BrO and IO + ClO could be respon-sible for a significant component of midlatitude ozonetrends. That suggestion has led to considerable effort tobetter understand the photochemistry of inorganic iodinespecies (e.g., Bösch et al., 2003, and references therein)and to define the stratospheric iodine budget.
Wennberg et al. (1997), based on analysis ofground-based spectra, reported an upper limit for Iy of 0.2ppt. Pundt et al. (1998) reported a similar upper limit,based on analysis of balloonborne spectra. Both studieswere summarized in the last Assessment. Since the lastAssessment, several additional studies of the Iy budgethave appeared. Bösch et al. (2003), based on balloonbornesolar occultation spectra in the UV/visible region fromflights at middle and high latitudes, report an upper limitfor Iy of 0.1 ppt. Recent measurements of IO in the tropics,using the same technique, also show very low levels of IO(Butz, 2006) (Figure 2-11). These observations suggestthat either much less iodine enters the stratosphere thanexpected based on levels of CH3I near the surface, or thatstratospheric iodine resides either in gaseous speciesbesides IO or perhaps in particulate form (see Section2.3.5). As noted above, the tropospheric lifetime of thedominant iodine VSL SGs is much smaller (i.e., ~5 days)than the tropospheric lifetime of many brominated VSLS(>100 days). This could account for SGI of bromine andlittle or no SGI of iodine. Furthermore, observations ofself-nucleation of iodine oxides (Hoffmann et al., 2001)and iodine uptake on tropospheric aerosols (Murphy andThomson, 2000) could account for inefficient transfer ofIy to the stratosphere via PGI.
The only evidence of significant levels of strato-spheric iodine is provided by ground-based observationsof spectra recorded at 79°N that show, on some days, signsof elevated column IO (Wittrock et al., 2000). The SZAvariation of slant column density of IO was used to sug-gest that the elevated IO lies in the stratosphere, with an
VERY SHORT-LIVED SUBSTANCES
2.42
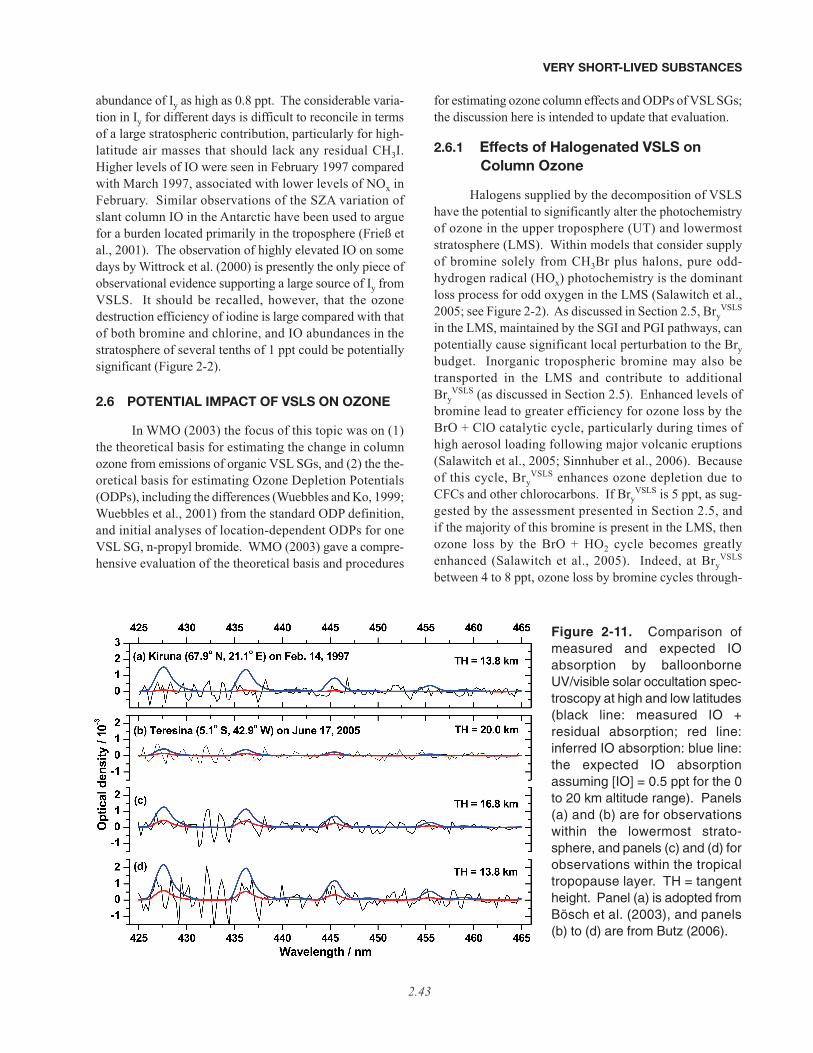
abundance of Iy as high as 0.8 ppt. The considerable varia-tion in Iy for different days is difficult to reconcile in termsof a large stratospheric contribution, particularly for high-latitude air masses that should lack any residual CH3I.Higher levels of IO were seen in February 1997 comparedwith March 1997, associated with lower levels of NOx inFebruary. Similar observations of the SZA variation ofslant column IO in the Antarctic have been used to arguefor a burden located primarily in the troposphere (Frieß etal., 2001). The observation of highly elevated IO on somedays by Wittrock et al. (2000) is presently the only piece ofobservational evidence supporting a large source of Iy fromVSLS. It should be recalled, however, that the ozonedestruction efficiency of iodine is large compared with thatof both bromine and chlorine, and IO abundances in thestratosphere of several tenths of 1 ppt could be potentiallysignificant (Figure 2-2).
2.6 POTENTIAL IMPACT OF VSLS ON OZONE
In WMO (2003) the focus of this topic was on (1)the theoretical basis for estimating the change in columnozone from emissions of organic VSL SGs, and (2) the the-oretical basis for estimating Ozone Depletion Potentials(ODPs), including the differences (Wuebbles and Ko, 1999;Wuebbles et al., 2001) from the standard ODP definition,and initial analyses of location-dependent ODPs for oneVSL SG, n-propyl bromide. WMO (2003) gave a compre-hensive evaluation of the theoretical basis and procedures
for estimating ozone column effects and ODPs of VSL SGs;the discussion here is intended to update that evaluation.
2.6.1 Effects of Halogenated VSLS onColumn Ozone
Halogens supplied by the decomposition of VSLShave the potential to significantly alter the photochemistryof ozone in the upper troposphere (UT) and lowermoststratosphere (LMS). Within models that consider supplyof bromine solely from CH3Br plus halons, pure odd-hydrogen radical (HOx) photochemistry is the dominantloss process for odd oxygen in the LMS (Salawitch et al.,2005; see Figure 2-2). As discussed in Section 2.5, Bry
VSLS
in the LMS, maintained by the SGI and PGI pathways, canpotentially cause significant local perturbation to the Brybudget. Inorganic tropospheric bromine may also betransported in the LMS and contribute to additionalBry
VSLS (as discussed in Section 2.5). Enhanced levels ofbromine lead to greater efficiency for ozone loss by theBrO + ClO catalytic cycle, particularly during times ofhigh aerosol loading following major volcanic eruptions(Salawitch et al., 2005; Sinnhuber et al., 2006). Becauseof this cycle, Bry
VSLS enhances ozone depletion due toCFCs and other chlorocarbons. If Bry
VSLS is 5 ppt, as sug-gested by the assessment presented in Section 2.5, andif the majority of this bromine is present in the LMS, thenozone loss by the BrO + HO2 cycle becomes greatlyenhanced (Salawitch et al., 2005). Indeed, at Bry
VSLS
between 4 to 8 ppt, ozone loss by bromine cycles through-
VERY SHORT-LIVED SUBSTANCES
2.43
Figure 2-11. Comparison ofmeasured and expected IOabsorption by balloonborneUV/visible solar occultation spec-troscopy at high and low latitudes(black line: measured IO +residual absorption; red line:inferred IO absorption: blue line:the expected IO absorptionassuming [IO] = 0.5 ppt for the 0to 20 km altitude range). Panels(a) and (b) are for observationswithin the lowermost strato-sphere, and panels (c) and (d) forobservations within the tropicaltropopause layer. TH = tangentheight. Panel (a) is adopted fromBösch et al. (2003), and panels(b) to (d) are from Butz (2006).
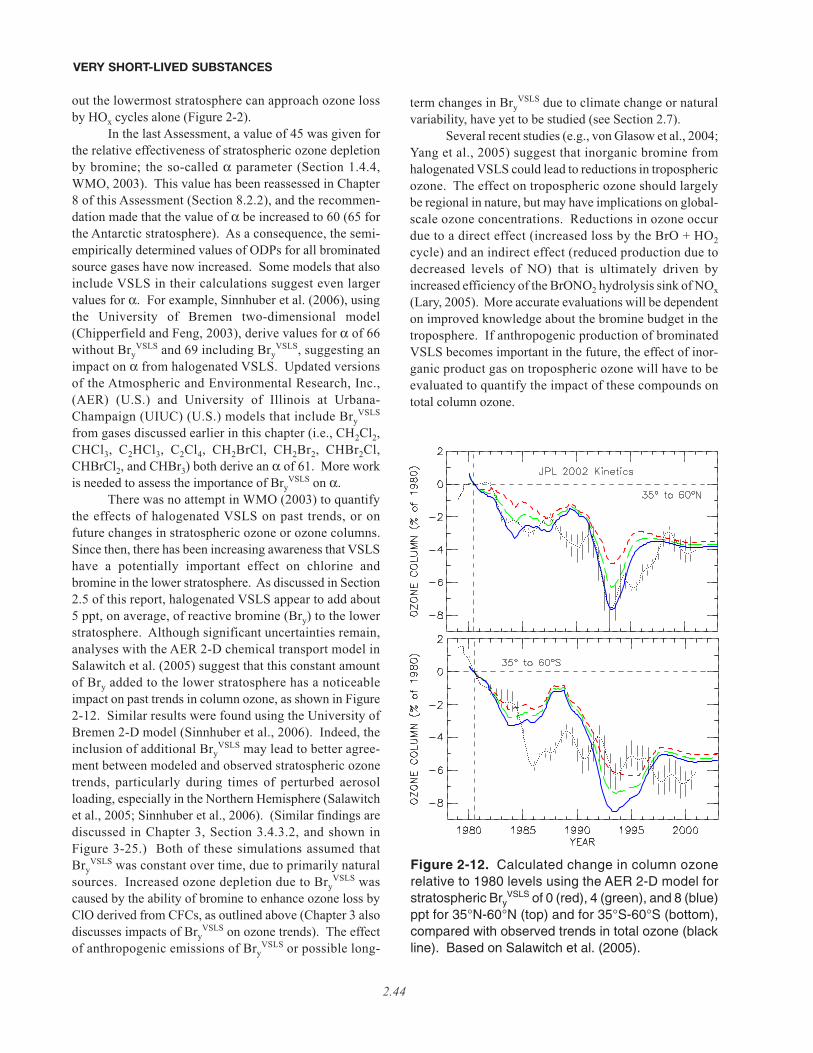
out the lowermost stratosphere can approach ozone lossby HOx cycles alone (Figure 2-2).
In the last Assessment, a value of 45 was given forthe relative effectiveness of stratospheric ozone depletionby bromine; the so-called α parameter (Section 1.4.4,WMO, 2003). This value has been reassessed in Chapter8 of this Assessment (Section 8.2.2), and the recommen-dation made that the value of α be increased to 60 (65 forthe Antarctic stratosphere). As a consequence, the semi-empirically determined values of ODPs for all brominatedsource gases have now increased. Some models that alsoinclude VSLS in their calculations suggest even largervalues for α. For example, Sinnhuber et al. (2006), usingthe University of Bremen two-dimensional model(Chipperfield and Feng, 2003), derive values for α of 66without Bry
VSLS and 69 including BryVSLS, suggesting an
impact on α from halogenated VSLS. Updated versionsof the Atmospheric and Environmental Research, Inc.,(AER) (U.S.) and University of Illinois at Urbana-Champaign (UIUC) (U.S.) models that include Bry
VSLS
from gases discussed earlier in this chapter (i.e., CH2Cl2,CHCl3, C2HCl3, C2Cl4, CH2BrCl, CH2Br2, CHBr2Cl,CHBrCl2, and CHBr3) both derive an α of 61. More workis needed to assess the importance of Bry
VSLS on α.There was no attempt in WMO (2003) to quantify
the effects of halogenated VSLS on past trends, or onfuture changes in stratospheric ozone or ozone columns.Since then, there has been increasing awareness that VSLShave a potentially important effect on chlorine andbromine in the lower stratosphere. As discussed in Section2.5 of this report, halogenated VSLS appear to add about5 ppt, on average, of reactive bromine (Bry) to the lowerstratosphere. Although significant uncertainties remain,analyses with the AER 2-D chemical transport model inSalawitch et al. (2005) suggest that this constant amountof Bry added to the lower stratosphere has a noticeableimpact on past trends in column ozone, as shown in Figure2-12. Similar results were found using the University ofBremen 2-D model (Sinnhuber et al., 2006). Indeed, theinclusion of additional Bry
VSLS may lead to better agree-ment between modeled and observed stratospheric ozonetrends, particularly during times of perturbed aerosolloading, especially in the Northern Hemisphere (Salawitchet al., 2005; Sinnhuber et al., 2006). (Similar findings arediscussed in Chapter 3, Section 3.4.3.2, and shown inFigure 3-25.) Both of these simulations assumed thatBry
VSLS was constant over time, due to primarily naturalsources. Increased ozone depletion due to Bry
VSLS wascaused by the ability of bromine to enhance ozone loss byClO derived from CFCs, as outlined above (Chapter 3 alsodiscusses impacts of Bry
VSLS on ozone trends). The effectof anthropogenic emissions of Bry
VSLS or possible long-
term changes in BryVSLS due to climate change or natural
variability, have yet to be studied (see Section 2.7).Several recent studies (e.g., von Glasow et al., 2004;
Yang et al., 2005) suggest that inorganic bromine fromhalogenated VSLS could lead to reductions in troposphericozone. The effect on tropospheric ozone should largelybe regional in nature, but may have implications on global-scale ozone concentrations. Reductions in ozone occurdue to a direct effect (increased loss by the BrO + HO2cycle) and an indirect effect (reduced production due todecreased levels of NO) that is ultimately driven byincreased efficiency of the BrONO2 hydrolysis sink of NOx(Lary, 2005). More accurate evaluations will be dependenton improved knowledge about the bromine budget in thetroposphere. If anthropogenic production of brominatedVSLS becomes important in the future, the effect of inor-ganic product gas on tropospheric ozone will have to beevaluated to quantify the impact of these compounds ontotal column ozone.
VERY SHORT-LIVED SUBSTANCES
2.44
Figure 2-12. Calculated change in column ozonerelative to 1980 levels using the AER 2-D model forstratospheric Bry
VSLS of 0 (red), 4 (green), and 8 (blue)ppt for 35°N-60°N (top) and for 35°S-60°S (bottom),compared with observed trends in total ozone (blackline). Based on Salawitch et al. (2005).
2.6.2 ODPs for Halogenated VSLS
There have been only a few new reported studies ofthe ODPs for VSL SGs since the last Assessment. Theadditional model estimates of SGI and PGI fluxes providean opportunity to update the estimates for ODP usingEquation 2.15 from Ko and Poulet et al. (2003). Using theresults discussed in Section 2.5.1 as a guideline, it is rea-sonable to assume that for a source gas with a local tropo-spheric lifetime of about 25 days and uniform landmassemissions, 1% of the emitted flux enters the stratospherevia the SGI and PGI pathways. We make the additionalassumption that the residence time of the Bry introducedby either pathway is similar to that of the Bry produced bylong-lived SGs. The order of magnitude estimate for theODP of a species with molecular weight comparable tothat of CFC-11, and a local lifetime of about 25 days, canbe determined to be c. 0.003 if it contains 1 chlorine atom,and c. 0.18 if it contains 1 bromine atom (assuming analpha factor of 60 for bromine). A simple scaling for iodi-nated compounds is not possible because of their shorterlifetimes and the uncertainty of the alpha factor for iodine.The resulting ODP for any given compound with the abovecharacteristics would be linearly dependent on the numberof chlorine or bromine atoms.
Using the UIUC zonally averaged 2-D model, Li etal. (2006) have re-evaluated the ODPs for surface emis-sions of trifluoroiodomethane (CF3I), a compound that isproposed as a replacement for bromotrifluoromethane(halon-1301, CBrF3) in firefighting and inhibition appli-cations. The model used an updated representation ofiodine chemistry relative to an earlier study of the ODP ofCF3I (Solomon et al., 1994). They found an ODP of 0.013for emissions evenly distributed over the NorthernHemisphere (compared with <0.008 from Solomon et al.(1994)), 0.011 for emissions distributed over 30°N to60°N, and 0.018 for emissions distributed over 5°S to30°N. Li et al. (2006) also consider the effects of poten-tially using CF3I in aircraft. The resulting ODPs dependheavily on the altitude and latitude of the emissions. Forexample, emissions peaking at 6-9 km were calculated togive an ODP of 0.084 for emissions occurring at 30°N-40°N and 0.25 for emissions occurring at 0-10°N. Anotherproposed replacement for halon-1301 in aircraft enginefire applications, phosphorus tribromide (PBr3), has notbeen evaluated, but should also have non-zero ODPs.
The ODP of n-propyl bromide was considered atlength in WMO (2003), but there have been no new eval-uations since that date.
2.7 POTENTIAL FUTURE CONSIDERATIONS
The impact of halogenated VSLS on stratospherichalogen loading and ozone depletion is, as discussed inSections 2.5.1 and 2.6.1, currently thought to be rela-tively small (but significant) compared with that fromthe long-lived halocarbons. The present-day impactarises principally from the brominated VSLS, whereasthe contributions from chlorinated and iodinated gases(for instance, to EESC) are small.
This situation could potentially change in the future.Small anthropogenic emissions of halogenated VSLSalready exist (e.g., n-C3H7Br, CHCl3, CH2Cl2, C2Cl4, etc.;see Section 2.2.4). These could increase in the future(although several of these have evidently decreased in thelast decade, as previously discussed), or new productscould enter commercial use (e.g., CF3I; Sections 2.2.4.3and 2.6.2). However, as noted previously, the majority ofhalogenated VSLS have partly or wholly natural origins,and therefore contribute to the natural background halogenloading of the stratosphere. This is set against a futuretrend of declining concentrations of long-lived anthro-pogenic halogenated gases, and hence a potentially largerrelative impact from halogenated VSLS.
The exact sources and intensities of natural VSLSemissions are largely linked to biogenic activity in boththe marine and terrestrial biospheres (there is also evi-dence of some abiotic marine emissions; see Section2.2.3.2). It is conceivable that biogenic emissions couldchange in response to, for example, changing globaltemperatures, atmospheric CO2, rainfall, land use, vegeta-tive cover, and oceanic productivity. Evidence for this ispresently sparse (Section 2.2). In one study (Butler et al.,2006), positive correlations between open ocean flux ratesof CHBr3 and CH3I with sea surface temperature (SST)were reported. The authors noted, however, that SSTmight simply be a proxy for some other driver (e.g., inci-dent radiation, latitude, etc.). They further noted that whileSST (and also wind speed) largely dictate sea-air flux rates,other significant parameters, such as nutrient supply andstratification of surface waters, are also affected by SSTand wind speed, and may have important modifying effects(both positive and negative) on overall emission rates.Another study, reported in Section 2.2.2, showed thatmeasurements of organo-halogen emissions from rice pad-dies indicate an apparent positive correlation between tem-perature and CH3I emissions (Redeker and Cicerone,2004). On the other hand, firn records of the atmosphericabundance of several halogenated VSLS suggest minimal
VERY SHORT-LIVED SUBSTANCES
2.45
long-term changes throughout the second half of the 20th
century, other than small changes in the Northern Hemi-sphere atmosphere for a few gases with evident anthro-pogenic sources (Worton et al., 2006; Sturges et al., 2001).
It is noted that inorganic VSLS in the boundarylayer, notably BrO from halogen activation reactions(Sections 2.2.5 and 2.5.1.2), might be sensitive to climaticchanges. Hollwedel et al. (2004), for instance, suggest alink between observed increases in springtime BrO columndensity with increased annual sea ice coverage, but we donot consider it likely that boundary layer VSLS from highlatitudes will be transported to the stratosphere. Theremight, however, be a potential link between inorganichalogen released from sea salt in the free troposphere andwind speed-dependent generation of marine aerosol (seealso Section 2.2.5).
It is significant that several of the limited studies todate point toward maximum flux rates of halogenatedVSLS in the tropics (Section 2.2). This coincides with theregion where strong convection can most effectively andquickly transport VSLS to the tropopause region (Section2.4). Changes in circulation and meteorology in the tropicsmight also exert a powerful modifying influence on thecontribution of VSLS to stratospheric halogen loading.These effects could be either positive or negative. Forexample, a stronger future Brewer-Dobson circulation(as suggested by Butchart et al., 2006) could increase therate of vertical transport of VSLS from the TTL into thestratosphere, whereas enhanced precipitation could de-crease the efficiency of the PGI route (Section 2.3.4.1).Changes in the latitudes of the subtropical jets, or equiv-alently the extent of the tropospheric Hadley circulation(Fu et al., 2006), might be associated with changes inquasi-horizontal transport of VSLS from the TTL intothe lowermost stratosphere.
Future changes in the chemical processing of VSLSand their product gases could also influence their atmos-pheric concentrations (Section 2.3), for example, throughchanges in OH abundance.
Our understanding of these many processes ispresently too poor to allow any quantitative prediction ofpossible future halogenated VSLS trends.
REFERENCES
Abbatt, J.P.D., Interactions of atmospheric trace gases withice surfaces: Adsorption and reaction, Chem. Rev.,103 (12), 4783-4800, 2003.
Afe, O.T., A. Richter, B. Sierk, F. Wittrock, and J.P.Burrows, BrO emission from volcanoes: A surveyusing GOME and SCIAMACHY measurements,Geophys. Res. Lett., 31, L24113, doi: 10.1029/-
2004GL020944, 2004.Arakawa, A., and W.H. Schubert, Interaction of a cumulus
cloud ensemble with the large-scale environment,Part 1, J. Atmos. Sci., 31 (3), 674-701, 1974.
Arnaud, P., Cours de Chimie Organique, 3rd ed., Gauthier-Villars, Paris, 1966.
Atkinson, R., D.L. Baulch, R.A. Cox, J.N. Crowley, R.F.Hampson, R.G. Hynes, M.E. Jenkin, J.A. Kerr, M.J.Rossi, and J. Troe, Summary of Evaluated Kinetic andPhotochemical Data for Atmospheric Chemistry,Available: http://www.iupac-kinetic.ch.cam.ac.uk,2005.
Bale, C.S.E., C.E. Canosa-Mas, D.E. Shallcross, and R.P.Wayne, A discharge-flow study of the kinetics ofthe reactions of IO with CH3O2 and CF3O2, Phys.Chem. Chem. Phys., 7 (10), 2164-2172, 2005.
Barnes, D.H., S.C. Wofsy, B.P. Fehlau, E.W. Gottleib, J.W.Elkins, G.S. Dutton, and S.A. Montzka, Urban/-
industrial pollution for the New York City-Washington, D.C., corridor, 1996-1998: 1.Providing independent verification of CO and PCEemissions inventories, J. Geophys. Res., 108 (D6),4185, doi: 10.1029/2001JD001116, 2003.
Barth, M.C., A.L. Stuart, and W.C. Skamarock, Numericalsimulations of the July 10, 1996, Stratospheric-Tropospheric Experiment: Radiation, Aerosols, andOzone (STERAO)-deep convection experimentstorm: Redistribution of soluble tracers, J. Geophys.Res., 106 (D12), 12381-12400, 2001.
Bayes, K.D., R.R. Friedl, S.P. Sander, and D.W. Toohey,Measurements of quantum yields of bromine atomsin the photolysis of bromoform from 266 to 324 nm,J. Geophys. Res., 108 (D3), 4095, doi:10.1029/2002JD002877, 2003.
Bell, N., L. Hsu, D.J. Jacob, M.G. Schultz, D.R. Blake,J.H. Butler, D.B. King, J.M. Lobert, and E. Maier-Reimer, Methyl iodide: Atmospheric budget anduse as a tracer of marine convection in globalmodels, J. Geophys. Res., 107 (D17), 4340, doi:10.1029/2001/JD001151, 2002.
Blake, D., Methane, nonmethane hydrocarbons, alkylnitrates, and chlorinated carbon compoundsincluding 3 chlorofluorocarbons (CFC-11, CFC-12,and CFC-113) in whole-air samples, in Trends: ACompendium of Data on Global Change, CarbonDioxide Information Analysis Center, Oak RidgeNational Laboratory, U.S. Department of Energy,Oak Ridge, Tenn., U.S.A., Available: http://-
cdiac.esd.ornl.gov/trends/otheratg/blake/blake.-
html, 2005.Blake, N.J., D.R. Blake, O.W. Wingenter, B.C. Sive, L.M.
McKenzie, J.P. Lopez, I.J. Simpson, H.E. Fuelberg,
VERY SHORT-LIVED SUBSTANCES
2.46
G.W. Sachse, B.E. Anderson, G.L. Gregory, M.A.Carroll, G. Albercook, and F.S. Rowland, Influenceof southern hemispheric biomass burning on mid-tropospheric distributions of nonmethane hydrocar-bons and selected halocarbons over the remoteSouth Pacific, J. Geophys. Res., 104 (D13), 16213-16232, doi: 10.1029/1999JD900067, 1999a.
Blake, N.J., D.R. Blake, O.W. Wingenter, B.C. Sive, C.H.Kang, D.C. Thornton, A.R. Bandy, E. Atlas, F.Flocke, J.M. Harris, and F.S. Rowland, Aircraftmeasurements of the latitudinal, vertical, and sea-sonal variations of NMHCs, methyl nitrate, methylhalides, and DMS during the First AerosolCharacterization Experiment (ACE 1), J. Geophys.Res., 104 (D17), 21803-21818, doi: 10.1029/1999-
JD900238, 1999b.Blake, N.J., D.R. Blake, I.J. Simpson, J.P. Lopez, N.A.C.
Johnston, A.L. Swanson, A.S. Katzenstein, S.Meinardi, B.C. Sive, J.J. Colman, E. Atlas, F. Flocke,S.A. Vay, M.A. Avery, and F.S. Rowland, Large-scale latitudinal and vertical distributions ofNMHCs and selected halocarbons in the troposphereover the Pacific Ocean during the March-April 1999Pacific Exploratory Mission (PEM-Tropics B), J.Geophys. Res., 106 (D23), 32627-32644, 2001.
Blake, N.J., D.R. Blake, I.J. Simpson, S. Meinardi, A.L.Swanson, J.P. Lopez, A.S. Katzenstein, B. Barletta,T. Shirai, E. Atlas, G. Sachse, M. Avery, S. Vay, H.E.Fuelberg, C.M. Kiley, K. Kita, F.S. Rowland,NMHCs and halocarbons in Asian continental out-flow during TRACE-P: Comparison to PEM-WestB, J. Geophys. Res., 108 (D20), 8806, doi:10.1029/2002JD003367, 2003a.
Blake, N.J., D.R. Blake, A.L. Swanson, E. Atlas, F.Flocke, and F.S. Rowland, Latitudinal, vertical, andseasonal variations of C1-C4 alkyl nitrates in thetroposphere over the Pacific Ocean during PEM-Tropics A and B: Oceanic and continental sources,J. Geophys. Res., 108 (D2), 8242, doi: 10.1029/-
2001JD001444, 2003b.Bloss, W.J., D.M. Rowley, R.A. Cox, and R.L. Jones,
Kinetics and products of the IO self-reaction, J.Phys. Chem. A, 105 (33), 7840-7854, 2001.
Bobrowski, N., G. Honninger, B. Galle, and U. Platt,Detection of bromine monoxide in a volcanicplume, Nature, 423 (6937), 273-276, 2003.
Bösch, H., C. Camy-Peyret, M.P. Chipperfield, R.Fitzenberger, H. Harder, U. Platt, and K.Pfeilsticker, Upper limits of stratospheric IO andOIO inferred from center-to-limb-darkening-corrected balloon-borne solar occultation visiblespectra: Implications for total gaseous iodine and
stratospheric ozone, J. Geophys. Res., 108 (D15),4455, doi: 10.1029/2002JD003078, 2003.
Brunner, D., J. Staehelin, H.L. Rogers, M.O. Köhler, J.A.Pyle, D. Hauglustaine, L. Jourdain, T.K. Berntsen,M. Gauss, I.S.A. Isaksen, E. Meijer, P. vanVelthoven, G. Pitari, E. Mancini, V. Grewe, and R.Sausen, An evaluation of the performance of chem-istry transport models by comparison with researchaircraft observations. Part 1: Concepts and overallmodel performance, Atmos. Chem. Phys., 3, 1609-1631, 2003.
Bureau, H., H. Keppler, and N. Métrich, Volcanicdegassing of bromine and iodine: Experimentalfluid/melt partitioning data and applications to strat-ospheric chemistry, Earth Planet. Sci. Lett., 183 (1-2), 51-60, 2000.
Butchart, N., A.A. Scaife, M. Bourqui, J. de Grandpré,S.H.E. Hare, J. Kettleborough, U. Langematz, E.Manzini, F. Sassi, K. Shibata, D.Shindell, and M.Sigmond, Simulations of anthropogenic change inthe strength of the Brewer-Dobson circulation,Clim. Dyn., 27 (7-8), 727-741, 2006.
Butler, J.H., D.B. King, S.A. Montzka, J.M. Lobert, S.A.Yvon-Lewis, and N.J. Warwick, Oceanic fluxes ofCHBr3, CH2Br2, and CH3I into the marine bound-ary layer, Global Biogeochem. Cycles, 21, doi:10.1029/2006GB002732, in press, 2006.
Butz, A., Case studies of stratospheric nitrogen, chlorine,and iodine photochemistry based on balloon borneUV/visible and IR absorption spectroscopy, Ph.D.thesis, University of Heidelberg, Heidelberg, Ger-many, Available: http://www.ub.uni-heidelberg.de/-
archiv/6696, 2006.Carpenter, L.J., Iodine in the marine boundary layer,
Chem. Rev., 103 (12), 4953-4962, 2003.Carpenter, L.J., and P.S. Liss, On temperate sources of bro-
moform and other reactive organic bromine gases,J. Geophys. Res., 105 (D16), 20539-20548, 2000.
Carpenter, L.J., G. Malin, P.S. Liss, and F.S. Küpper, Novelbiogenic iodine-containing trihalomethanes andother short-lived halocarbons in the coastal EastAtlantic, Global Biogeochem. Cycles, 14 (4), 1191-1204, 2000.
Carpenter, L.J., P.S. Liss, and S.A. Penkett, Marineorganohalogens in the atmosphere over the Atlanticand Southern Oceans, J. Geophys. Res., 108 (D9),4256, doi: 10.1029/2002JD002769, 2003.
Carpenter, L.J., D.J. Wevill, S. O’Doherty, G. Spain, andP.G. Simmonds, Atmospheric bromoform at MaceHead, Ireland: seasonality and evidence for a peat-land source, Atmos. Chem. Phys., 5, 2927-2934,2005.
VERY SHORT-LIVED SUBSTANCES
2.47
Chance, K., Analysis of BrO measurements from theGlobal Ozone Monitoring Experiment, Geophys.Res. Lett., 25 (17), 3335-3338, 1998.
Chen, P., Isentropic cross-tropopause mass exchange inthe extratropics, J. Geophys. Res., 100 (D8), 16661-16674, 1995.
Chipperfield, M.P., and W. Feng, Comment on: Strato-spheric ozone depletion at northern mid-latitudesin the 21st century: The importance of future con-centrations of greenhouse gases nitrous oxide andmethane, Geophys. Res. Lett., 30 (7), 1389, doi:10.1029/2002GL016353, 2003.
Choi, Y., S. Elliott, I.J. Simpson, D.R. Blake, J.J. Colman,M.K. Dubey, S. Meinardi, F.S. Rowland, T. Shirai,and F.A. Smith, Survey of whole air data from thesecond airborne Biomass Burning and LightningExperiment using principal component analysis, J.Geophys. Res., 108 (D5), 4163, doi: 10.1029/2002-
JD002841, 2003.Chuck, A.L., S.M. Turner, and P.S. Liss, Oceanic distribu-
tions and air-sea fluxes of biogenic halocarbons inthe open ocean, J. Geophys. Res., 110, C10022, doi:10.1029/2004JC002741, 2005.
Cohan, D.S., G.A. Sturrock, A.P. Biazar, and P.J. Fraser,Atmospheric methyl iodide at Cape Grim,Tasmania, from AGAGE observations, J. Atmos.Chem., 44 (2), 131-150, 2003.
Collins, W.J., R.G. Derwent, C.E. Johnson, and D.S.Stevenson, A comparison of two schemes for theconvective transport of chemical species in aLagrangian global chemistry model, Quart. J. Roy.Meteorol. Soc., 128 (581), 991-1009, 2002.
Considine, D.B., D.J. Bergmann, and H. Liu, Sensitivityof Global Modeling Initiative chemistry and trans-port model simulations of radon-222 and lead-210to input meteorological data, Atmos. Chem. Phys.,5, 3389-3406, 2005.
Cox, M.L., G.A. Sturrock, P.J. Fraser, S.T. Siems, and P.B.Krummel, Identification of regional sources ofmethyl bromide and methyl iodide from AGAGEobservations at Cape Grim, Tasmania, J. Atmos.Chem., 50 (1), 59-77, 2005.
Crutzen, P.J., and M.G. Lawrence, The impact of precipi-tation scavenging on the transport of trace gases: A3-dimensional model sensitivity study, J. Atmos.Chem., 37 (1), 81-112, 2000.
Davis, D., J. Crawford, S. Liu, S. McKeen, A. Bandy, D.Thornton, F. Rowland, and D. Blake, Potentialimpact of iodine on tropospheric levels of ozoneand other critical oxidants, J. Geophys. Res., 101(D1), 2135-2147, 1996.
Deiber, G., C. George, S. Le Calvé, F. Schweitzer, and P.
Mirabel, Uptake study of ClONO2 and BrONO2 byhalide containing droplets, Atmos. Chem. Phys., 4(5), 1291-1299, 2004.
Dessler, A.E., and S.C. Sherwood, Effect of convection onthe summertime extratropical lower stratosphere, J.Geophys. Res., 109, D23301, doi: 10.1029/2004-
JD005209, 2004.Dessler, A.E., E.J. Hintsa, E.M. Weinstock, J.G. Anderson,
and K.R. Chan, Mechanisms controlling watervapor in the lower stratosphere: “A tale of twostratospheres,” J. Geophys. Res., 100 (D11), 23167-23172, 1995.
Donner, L.J., C.J. Seman, R.S. Hemler, and S. Fan, Acumulus parameterization including mass fluxes,convective vertical velocities, and mesoscaleeffects: Thermodynamic and hydrological aspectsin a general circulation model, J. Clim., 14 (16),3444-3463, 2001.
Dorf, M., Investigation of inorganic stratospheric bromineusing balloon-borne DOAS measurements andmodel simulations, Ph.D. thesis, University ofHeidelberg, Heidelberg, Germany, Available:http://www.ub.uni-heidelberg.de/archiv/6093, 2005.
Dorf, M., H. Bösch, A. Butz, C. Camy-Peyret, M.P.Chipperfield, A. Engel, F. Goutail, K. Grunow, F.Hendrick, S. Hrechanyy, B. Naujokat, J.-P.Pommereau, M. Van Roozendael, C. Sioris, F.Stroh, F. Weidner, and K. Pfeilsticker, Balloon-borne stratospheric BrO measurements: compar-ison with Envisat/SCIAMACHY BrO limb profiles,Atmos. Chem. Phys., 6 (9), 2483-2501, 2006a.
Dorf, M., J.H. Butler, A. Butz, C. Camy-Peyret, M.P.Chipperfield, L. Kritten, S.A. Montzka, B. Simmes,F. Weidner, and K. Pfeilsticker, Long-term obser-vations of stratospheric bromine reveal slow downin growth, Geophys. Res. Lett., 33, doi: 10.1029/-
2006GL027714, in press, 2006b.Dvortsov, V.L., M.A. Geller, V.A. Yudin, and S.P.
Smyshlyaev, Parameterization of the convectivetransport in a two-dimensional chemistry-transportmodel and its validation with radon 222 and othertracer simulations, J. Geophys. Res., 103 (D17),22047-22062, 1998.
Dvortsov, V.L., M.A. Geller, S. Solomon, S.M. Schauffler,E.L. Atlas, and D.R. Blake, Rethinking reactivehalogen budgets in the midlatitude lower strato-sphere, Geophys. Res. Lett., 26 (12), 1699-1702,1999.
Ekman, A.M.L., C. Wang, J. Wilson, and J. Ström,Explicit simulations of aerosol physics in a cloud-resolving model: a sensitivity study based on anobserved convective cloud, Atmos. Chem. Phys.,
VERY SHORT-LIVED SUBSTANCES
2.48
4, 773-791, 2004.Engel, A., H. Bönisch, D. Brunner, H. Fischer, H. Franke,
G. Günther, C. Gurk, M. Hegglin, P. Hoor, R.Königstedt, M. Krebsbach, R. Maser, U. Parchatka,T. Peter, D. Schell, C. Schiller, U. Schmidt, N.Spelten, T. Szabo, U. Weers, H. Wernli, T. Wetter,and V. Wirth, Highly resolved observations of tracegases in the lowermost stratosphere and upper tro-posphere from the Spurt project: An overview,Atmos. Chem. Phys., 6, 283-301, 2006.
Fernandez, M.A., R.A. Cox, and R.G. Hynes, Kinetics ofClONO2 reactive uptake on ice surfaces at temper-atures of the upper troposphere, J. Phys. Chem. A,109 (44), 9986-9996, 2005.
Fischer, H., F.G. Wienhold, P. Hoor, O. Bujok, C. Schiller,P. Siegmund, M. Ambaum, H.A. Scheeren, and J.Lelieveld, Tracer correlations in the northern highlatitude lowermost stratosphere: Influence of cross-tropopause mass exchange, Geophys. Res. Lett., 27(1), 97-100, 2000.
Fischer, H., M. de Reus, M. Traub, J. Williams, J.Lelieveld, J. de Gouw, C. Warneke, H. Schlager, A.Minikin, R. Scheele, and P. Siegmund, Deep con-vective injection of boundary layer air into the low-ermost stratosphere at midlatitudes, Atmos. Chem.Phys., 3, 739-745, 2003.
Fitzenberger, R., H. Bösch, C. Camy-Peyret, M.P.Chipperfield, H. Harder, U. Platt, B.-M. Sinnhuber,T. Wagner, and K. Pfeilsticker, First profile meas-urements of tropospheric BrO, Geophys. Res. Lett.,27 (18), 2921-2924, 2000.
Folkins, I., and R.V. Martin, The vertical structure of trop-ical convection and its impact on the budgets ofwater vapor and ozone, J. Atmos. Sci., 62 (5), 1560-1573, 2005.
Folkins, I., M. Loewenstein, J. Podolske, S.J. Oltmans,and M. Proffitt, A barrier to vertical mixing at 14km in the tropics: Evidence from ozonesondes andaircraft measurements, J. Geophys. Res., 104,(D18), 22095-22102, 1999.
Fraser, P.J., D.E. Oram, C.E. Reeves, S.A. Penkett, and A.McCulloch, Southern hemispheric halon trends(1978-1998) and global halon emissions, J.Geophys. Res., 104 (D13), 15985-15999, 1999.
Frieler, K., M. Rex, R.J. Salawitch, T. Canty, M. Streibel,R.M. Stimpfle, K. Pfeilsticker, M. Dorf, D.K.Weisenstein, S. Godin-Beekmann, and P. von derGathen, Toward a better quantitative understandingof polar stratospheric ozone loss, Geophys. Res.Lett., 33, L10812, doi: 10.1029/2005GL025466,2006.
Frieß, U., T. Wagner, I. Pundt, K. Pfeilsticker, and U. Platt,
Spectroscopic measurements of tropospheric iodineoxide at Neumayer Station, Antarctica, Geophys.Res. Lett., 28 (10), 1941-1944, 2001.
Fromm, M.D., and R. Servranckx, Transport of forest firesmoke above the tropopause by supercell convec-tion, Geophys. Res. Lett., 30 (10), 1542, doi:10.1029/2002GL016820, 2003.
Fromm, M., R. Bevilacqua, R. Servranckx, J. Rosen, J.P.Thayer, J. Herman, and D. Larko, Pyro-cumu-lonimbus injection of smoke to the stratosphere:Observations and impact of a super blowup innorthwestern Canada on 3-4 August 1998, J.Geophys. Res., 110, D08205, doi: 10.1029/2004-
JD005350, 2005.Fu, Q., C.M. Johanson, J.M. Wallace, and T. Reichler,
Enhanced mid-latitude tropospheric warming insatellite measurements, Science, 312 (5777), 1179-1179, doi: 10.1126/science.1125566, 2006.
Füeglistaler, S., H. Wernli, and T. Peter, Tropical tropo-sphere-to-stratosphere transport inferred from tra-jectory calculations, J. Geophys. Res., 109, D03108,doi: 10.1029/2003JD004069, 2004.
Gettelman, A., and P.M.F. Forster, A climatology of thetropical tropopause layer, J. Meteorol. Soc. Japan,80 (4B), 911-924, 2002.
Gettelman, A., P.M.F. Forster, M. Fujiwara, Q. Fu, H.Vömel, L.K. Gohar, C. Johanson, and M.Ammerman, Radiation balance of the tropicaltropopause layer, J. Geophys. Res., 109, D07103,doi: 10.1029/2003JD004190, 2004.
Harder, H., C. Camy-Peyret, F. Ferlemann, R.Fitzenberger, T. Hawat, H. Osterkamp, M.Schneider, D. Perner, U. Platt, P. Vradelis, and K.Pfeilsticker, Stratospheric BrO profiles measuredat different latitudes and seasons: Atmosphericobservations, Geophys. Res. Lett., 25 (20), 3843-3846, 1998.
Haynes, P., and E. Shuckburgh, Effective diffusivity as adiagnostic of atmospheric transport 2. Troposphereand lower stratosphere, J. Geophys. Res., 105(D18), 22795-22810, 2000.
Hegels, E., P.J. Crutzen, T. Klüpfel, D. Perner, and J.P.Burrows, Global distribution of atmosphericbromine-monoxide from GOME on earth observingsatellite ERS-2, Geophys. Res. Lett., 25 (16), 3127-3130, 1998.
Hegglin, M.I., D. Brunner, H. Wernli, C. Schwierz, O.Martius, P. Hoor, H. Fischer, U. Parchatka, N.Spelten, C. Schiller, M. Krebsbach, U. Weers, J.Staehelin, and T. Peter, Tracing troposphere-to-stratosphere transport above a mid-latitude deepconvective system, Atmos. Chem. Phys., 4, 741-
VERY SHORT-LIVED SUBSTANCES
2.49
756, 2004.Hintsa, E.J., K.A. Boering, E.M. Weinstock, J.G.
Anderson, B.L. Gary, L. Pfister, B.C. Daube, S.C.Wofsy, M. Loewenstein, J.R. Podolske, J.J.Margitan, and T.P. Bui, Troposphere-to-stratospheretransport in the lowermost stratosphere from meas-urements of H2O, CO2, N2O and O3, Geophys. Res.Lett., 25 (14), 2655-2658, 1998.
Hoffmann, T., C.D. O’Dowd, and J.H. Seinfeld, Iodineoxide homogeneous nucleation: An explanation forcoastal new particle production, Geophys. Res.Lett., 28 (10), 1949-1952, 2001.
Hollwedel, J., M. Wenig, S. Beirle, S. Kraus, S. Kühl, W.Wilms-Grabe, U. Platt, and T. Wagner, Year-to-yearvariations of spring time polar tropospheric BrO asseen by GOME, Adv. Space Res., 34 (4), 804-808,2004.
Holton, J.R., P.H. Haynes, M.E. McIntyre, A.R. Douglass,R.B. Rood, and L. Pfister, Stratosphere-troposphereexchange, Rev. Geophys., 33 (4), 403-439, 1995.
Hoor, P., H. Fischer, L. Lange, J. Lelieveld, and D.Brunner, Seasonal variations of a mixing layer inthe lowermost stratosphere as identified by the CO-O3 correlation from in situ measurements, J.Geophys. Res., 107 (D5), 4044, doi: 10.1029/2000-
JD000289, 2002.Hoor, P., C. Gurk, D. Brunner, M.I. Hegglin, H. Wernli,
and H. Fischer, Seasonality and extent of extra-trop-ical TST derived from in-situ CO measurementsduring SPURT, Atmos. Chem. Phys., 4, 1427-1442,2004.
Hoor, P., H. Fischer, and J. Lelieveld, Tropical and extra-tropical tropospheric air in the lowermost strato-sphere over Europe: A CO-based budget, Geophys.Res. Lett., 32, L07802, doi: 10.1029/2004-
GL022018, 2005.Iraci, L.T., R.R. Michelsen, S.F.M. Ashbourn, T.A.
Rammer, and D.M. Golden, Uptake of hypobro-mous acid (HOBr) by aqueous sulfuric acid solu-tions: Low-temperature solubility and reaction,Atmos. Chem. Phys., 5, 1577-1587, 2005.
Joseph, D.M., S.H. Ashworth, and J.M.C. Plane, Theabsorption cross-section and photochemistry ofOIO, J. Photochem. Photobiol. A, 176 (1-3 Spec.Iss.), 68-77, 2005.
Kärcher, B., and M.M. Basko, Trapping of trace gases ingrowing ice crystals, J. Geophys. Res., 109,D22204, doi: 10.1029/2004JD005254, 2004.
Kärcher, B., and U. Lohmann, A parameterization of cirruscloud formation: Heterogeneous freezing, J.Geophys. Res., 108 (D14), 4402, doi: 10.1029/-
2002JD003220, 2003.
Keene, W.C., M.A.K. Khalil, D.J. Erickson III, A.McCulloch, T.E. Graedel, J.M. Lobert, M.L. Aucott,S.L. Gong, D.B. Harper, G. Kleiman, P. Midgley,R.M. Moore, C. Seuzaret, W.T. Sturges, C.M.Benkovitz, V. Koropalov, L.A. Barrie, and Y.F. Li,Composite global emissions of reactive chlorinefrom anthropogenic and natural sources: ReactiveChlorine Emissions Inventory, J. Geophys. Res.,104 (D7), 8429-8440, 1999.
Khalil, M.A.K., Reactive chlorine compounds in theatmosphere, Chapter 2 in Reactive HalogenCompounds in the Atmosphere, Vol. 4, Part E of TheHandbook of Environmental Chemistry, edited byP. Fabian, and O.N. Singh, 45-79, Springer-Verlag,Heidelberg, Germany, 1999.
Khalil, M.A.K., and R.A. Rasmussen, Atmospheric chlo-roform, Atmos. Environ., 33 (7), 1151-1158, 1999.
Khalil, M.A.K., R.M. Moore, D.B. Harper, J.M. Lobert,D.J. Erickson, V. Koropalov, W.T. Sturges, and W.C.Keene, Natural emissions of chlorine-containinggases: Reactive Chlorine Emissions Inventory, J.Geophys. Res., 104 (D7), 8333-8346, 1999.
Kindler, T.P., W.L. Chameides, P.H. Wine, D.M. Cunnold,F.N. Alyea, and J.A. Franklin, The fate of atmos-pheric phosgene and the stratospheric chlorine load-ings of its parent compounds: CCl4, C2Cl4, C2HCl3,CH3CCl3, and CHCl3, J. Geophys. Res., 100 (D1),1235-1252, 1995.
Knight, G.P., and J.N. Crowley, The reactions of IO withHO2, NO and CH3SCH3: Flow tube studies ofkinetics and product formation, Phys. Chem. Chem.Phys., 3, 393-401, 2001.
Ko, M.K.W., and G. Poulet (Lead Authors), D.R. Blake,O. Boucher, J.H. Burkholder, M. Chin, R.A. Cox,C. George, H.-F. Graf, J.R. Holton, D.J. Jacob, K.S.Law, M.G. Lawrence, P.M. Midgley, P.W. Seakins,D.E. Shallcross, S.E. Strahan, D.J. Wuebbles, andY. Yokouchi, Very short-lived halogen and sulfursubstances, Chapter 2 in Scientific Assessment ofOzone Depletion: 2002, Global Ozone Researchand Monitoring Project–Report No. 47, WorldMeteorological Organization, Geneva, Switzerland,2003.
Ko, M.K.W., N.D. Sze, C.J. Scott, and D.K. Weisenstein,On the relation between stratospheric chlorine/-
bromine loading and short-lived troposphericsource gases, J. Geophys. Res., 102 (D21), 25507-25518, 1997.
Kondo, Y., M. Koike, K. Kita, H. Ikeda, N. Takegawa, S.Kawakami, D. Blake, S.C. Liu, M. Ko, Y. Miyazaki,H. Irie, Y. Higashi, B. Liley, N. Nishi, Y. Zhao, andT. Ogawa, Effects of biomass burning, lightning,
VERY SHORT-LIVED SUBSTANCES
2.50
and convection on O3, CO, and NOy over the trop-ical Pacific and Australia in August–October 1998and 1999, J. Geophys. Res., 108 (D3), 8402, doi:10.1029/2001JD000820, 2002.
Krämer, M., C. Schiller, H. Ziereis, J. Ovarlez, and H.Bunz, Nitric acid partitioning in cirrus clouds: Therole of aerosol particles and relative humidity,Tellus, 58B (2), 141-147, 2006.
Krebsbach, M., C. Schiller, D. Brunner, G. Günther, M.I.Hegglin, D. Mottaghy, M. Riese, N. Spelten, andH. Wernli, Seasonal cycles and variability of O3 andH2O in the UT/LMS during SPURT, Atmos. Chem.Phys., 6, 109-125, 2006.
Küpper, C., J. Thuburn, G.C. Craig, and T. Birner, Massand water transport into the tropical stratosphere: Acloud-resolving simulation, J. Geophys. Res., 109,D10111, doi: 10.1029/2004JD004541, 2004.
Kurylo, M.J., and J.M. Rodríguez (Lead Authors), M.O.Andreae, E.L. Atlas, D.R. Blake, J.H. Butler, S. Lal,D.J. Lary, P.M. Midgley, S.A. Montzka, P.C.Novelli, C.E. Reeves, P.G. Simmonds, L.P. Steele,W.T. Sturges, R.F. Weiss, and Y. Yokouchi, Short-lived ozone-related compounds, Chapter 2 inScientific Assessment of Ozone Depletion: 1998,Global Ozone Research and Monitoring Project—Report No. 44, World Meteorological Organization,Geneva, Switzerland, 1999.
Lary, D.J., Halogens and the chemistry of the free tropo-sphere, Atmos. Chem. Phys., 5, 227-237, 2005.
Laturnus, F., C. Wiencke, and H. Kloser, Antarcticmacroalgae – Sources of volatile halogenatedorganic compounds, Mar. Environ. Res., 41 (2),169-181, 1996.
Lawrence, M.G., and P.J. Rasch, Tracer transport in deepconvective updrafts: Plume ensemble versus bulkformulations, J. Atmos. Sci., 62 (8), 2880-2894,2005.
Lee-Taylor, J., and K.R. Redeker, Reevaluation of globalemissions from rice paddies of methyl iodide andother species, Geophys. Res. Lett., 32, L15801, doi:10.1029/2005GL022918, 2005.
Leser, H., G. Hönninger, and U. Platt, MAX-DOAS meas-urements of BrO and NO2 in the marine boundarylayer, Geophys. Res. Lett., 30 (10), 1537, doi:10.1029/2002GL015811, 2003.
Levine, J.G., P. Braesicke, N.R.P. Harris, N.H. Savage,and J.A. Pyle, Pathways and timescales for tropo-sphere-to-stratosphere transport via the tropicaltropopause layer and their relevance for very shortlived substances, J. Geophys. Res., in press, 2006.
Li, Y., K.O. Patten, D. Youn, and D.J. Wuebbles, Potentialimpacts of CF3I on ozone as a replacement for
CF3Br in aircraft applications, Atmos. Chem. Phys..6, 4559-4568, 2006.
Libuda, H.G., Spektroskopische und kinetischeUntersuchungen an halogenierten Carbonylverbin-dungen von atmosphärischem Interesse, Ph.D.thesis, University of Wuppertal, Germany, 1992.
Liss, P.S., and P.G. Slater, Flux of gases across the air-seainterface, Nature, 247 (5438), 181-184, 1974.
Livesey, N.J., L.J. Kovalenko, R.J. Salawitch, I.A.MacKenzie, M.P. Chipperfield, W.G. Read, R.F.Jarnot, and J.W. Waters, EOS Microwave LimbSounder observations of upper stratospheric BrO:Implications for bromine, Geophys. Res. Lett., 33,L20817, doi: 10.1029/2006GL026930, 2006.
Lobert, J.M., W.C. Keene, J.A. Logan, and R. Yevich,Global chlorine emissions from biomass burning:Reactive Chlorine Emission Inventory, J. Geophys.Res., 104 (D7), 8373-8390, 1999.
Low, J.C., N.Y. Wang, J. Williams, and R.J. Cicerone,Measurements of ambient atmospheric C2H5Cl andother ethyl and methyl halides at coastal Californiasites and over the Pacific Ocean, J. Geophys. Res.,108 (19), 4608, doi: 10.1029/2003JD003620, 2003.
Marcy, T.P., D.W. Fahey, R.S. Gao, P.J. Popp, E.C.Richard, T.L. Thompson, K.H. Rosenlof, E.A. Ray,R.J. Salawitch, C.S. Atherton, D.J. Bergmann, B.A.Ridley, A.J. Weinheimer, M. Loewenstein, E.M.Weinstock, and M.J. Mahoney, Quantifying strato-spheric ozone in the upper troposphere with in situmeasurements of HCl, Science, 304 (5668), 261-265, 2004.
Mari, C., D.J. Jacob, and P. Bechtold, Transport and scav-enging of soluble gases in a deep convective cloud,J. Geophys. Res., 105 (D17), 22255-22268, 2000.
Marsh, A.R.W., and W.J. McElroy, The dissociation con-stant and Henry’s law constant of HCl in aqueoussolution, Atmos. Environ., 19 (7), 1075-1080, 1985.
Martino, M., P.S. Liss, and J.M.C. Plane, The photolysisof dihalomethanes in surface seawater, Environ. Sci.Technol., 39 (18), 7097-7101, 2005.
McCulloch, A., Chloroform in the environment: Occur-rence, sources, sinks and effects, Chemosphere, 50(10), 1291-1308, 2003.
McCulloch, A., M.L. Aucott, T.E. Graedel, G. Kleiman,P.M. Midgley, and Y.-F. Li, Industrial emissions oftrichloroethene, tetrachloroethene, and dichloro-methane: Reactive Chlorine Emissions Inventory,J. Geophys. Res., 104 (D7), 8417-8427, 1999.
McElroy, C.T., C.A. McLinden, and J.C. McConnell,Evidence for bromine monoxide in the free tropo-sphere during the Arctic polar sunrise, Nature, 397(6717), 338-341, 1999.
VERY SHORT-LIVED SUBSTANCES
2.51
McFiggans, G., H. Coe, R. Burgess, J. Allan, M. Cubison,M.R. Alfarra, R. Saunders, A. Saiz-Lopez, J.M.C.Plane, D. Wevill, L. Carpenter, A.R. Rickard, andP.S. Monks, Direct evidence for coastal iodine par-ticles from Laminaria macroalgae – Linkage toemissions of molecular iodine, Atmos. Chem. Phys.,4 (3), 701-713, 2004.
Misra, A., and P. Marshall, Computational investigationsof iodine oxides, J. Phys. Chem. A, 102 (45), 9056-9060, 1998.
Montzka, S.A., J.H. Butler, B.D. Hall, D.J. Mondeel, andJ.W. Elkins, A decline in tropospheric organicbromine, Geophys. Res. Lett., 30 (15), 1826, doi:10.1029/2003GL017745, 2003.
Moore, R.M., Dichloromethane in North Atlantic waters,J. Geophys. Res., 109, C09004, doi: 10.1029/2004-
JC002397, 2004.Moore, R.M., and W. Groszko, Methyl iodide distribution
in the ocean and fluxes to the atmosphere, J.Geophys. Res., 104 (C5), 11163-11172, 1999.
Mössinger, J.C., R.G. Hynes, and R.A. Cox, Interaction ofHOBr and HCl on ice surfaces in the temperaturerange 205-227 K, J. Geophys. Res., 107 (D24),4740, doi: 10.1029/2002JD002151, 2002.
Mullendore, G.L., D.R. Durran, and J.R. Holton, Cross-tropopause tracer transport in midlatitude convec-tion, J. Geophys. Res., 110, D06113, doi: 10.1029/-
2004JD005059, 2005.Müller, R.W., H. Bovensmann, J.W. Kaiser, A. Richter, A.
Rozanov, F. Wittrock, and J.P. Burrows, Consistentinterpretation of ground based and GOME BrOslant column data, Adv. Space Res., 29 (11), 1655-1660, 2002.
Muramatsu, Y., and S. Yoshida, Volatilization of methyliodide from the soil-plant system, Atmos. Environ.,29 (1), 21-25, 1995.
Murphy, D.M., and D.S. Thomson, Halogen ions and NO+
in the mass spectra of aerosols in the upper tropo-sphere and lower stratosphere, Geophys. Res. Lett.,27 (19), 3217-3220, 2000.
Murphy, D.M., D.S. Thomson, and T.J. Mahoney, In situmeasurements of organics, meteoritic material,mercury, and other elements in aerosols at 5 to 19kilometers, Science, 282 (5394), 1664-1669, 1998.
Nassar, R., P.F. Bernath, C.D. Boone, C. Clerbaux, P.F.Coheur, G. Dufour, L. Froidevaux, E. Mahieu, J.C.McConnell, S.D. McLeod, D.P. Murtagh, C.P.Rinsland, K. Semeniuk, R. Skelton, K.A. Walker,and R. Zander, A global inventory of stratosphericchlorine in 2004, J. Geophys. Res., 111, D22312,doi: 10.1029/2006JD007073, 2006.
Nedelec, P., V. Thouret, J. Brioude, B. Sauvage, J.-P.Cammas, and A. Stohl, Extreme CO concentrationsin the upper troposphere over northeast Asia in June2003 from the in situ MOZAIC aircraft data,Geophys. Res. Lett., 32, L14807, doi: 10.1029/-
2005GL023141, 2005.Nielsen, J.E., and A.R. Douglass, A simulation of bromo-
form’s contribution to stratospheric bromine, J.Geophys. Res., 106 (D8), 8089-8100, 2001.
Nober, F.J., H.F. Graf, and D. Rosenfeld, Sensitivity of theglobal circulation to the suppression of precipita-tion by anthropogenic aerosols, Global Planet.Change, 37 (1), 57-80, 2003.
O’Connor, F.M., G. Vaughan, and H. De Backer,Observations of subtropical air in the Europeanmid-latitude lower stratosphere, Quart. J. Roy.Meteorol. Soc., 125 (560), 2965-2986, 1999.
O’Dowd, C.D., and T. Hoffmann, Coastal new particle for-mation: A review of the current state-of-the-art,Environ. Chem., 2, 245-255, 2005.
Pan, L., S. Solomon, W. Randel, J.F. Lamarque, P. Hess, J.Gille, E.W. Chiou, and M.P. McCormick, Hemi-spheric asymmetries and seasonal variations of thelowermost stratospheric water vapor and ozonederived from SAGE II data, J. Geophys. Res., 102(D23), 28177-28184, 1997.
Pan, L.L., W.J. Randel, B.L. Gary, M.J. Mahoney, and E.J.Hintsa, Definitions and sharpness of the extra-tropical tropopause: A trace gas perspective, J.Geophys. Res., 109, D23103, doi: 10.1029/2004-
JD004982, 2004.Peters, C., S. Pechtl, J. Stutz, K. Hebestreit, G. Hönninger,
K.G. Heumann, A. Schwarz, J. Winterlik, and U.Platt, Reactive and organic halogen species in threedifferent European coastal environments, Atmos.Chem. Phys., 5, 3357-3375, 2005.
Pfeilsticker, K., W.T. Sturges, H. Bösch, C. Camy-Peyret,M.P. Chipperfield, A. Engel, R. Fitzenberger, M.Müller, S. Payan, and B.-M. Sinnhuber, Lower strat-ospheric organic and inorganic bromine budget forthe Arctic winter 1998/99, Geophys. Res. Lett., 27(20), 3305-3308, 2000.
Plane, J.M.C., D.M. Joseph, B.J. Allan, S.H. Ashworth,and J.S. Francisco, An experimental and theoreticalstudy of the reactions of OIO + NO and OIO + OH,J. Phys. Chem. A, 110 (1), 93-100, 2006.
Platt, U., and G. Hönninger, The role of halogen speciesin the troposphere, Chemosphere, 52 (2), 325-338,2003.
Popp, P.J., R.S. Gao, T.P. Marcy, D.W. Fahey, P.K. Hudson,T.L. Thompson, B. Kärcher, B.A. Ridley, A.J.Weinheimer, D.J. Knapp, D.D. Montzka, D.
VERY SHORT-LIVED SUBSTANCES
2.52
Baumgardner, T.J. Garrett, E.M. Weinstock, J.B.Smith, D.S. Sayres, J.V. Pittman, S. Dhaniyala, T.P.Bui, and M.J. Mahoney, Nitric acid uptake on sub-tropical cirrus cloud particles, J. Geophys. Res.,109, D06302, doi: 10.1029/2003JD004255, 2004.
Poulida, O., R.R. Dickerson, and A. Heymsfield,Stratosphere-troposphere exchange in a midlatitudemesoscale convective complex 1. Observations, J.Geophys. Res., 101 (D3), 6823-6836, 1996.
Prados, A.I., G.E. Nedoluha, R.M. Bevilacqua, D.R. Allen,K.W. Hoppel, and A. Marenco, POAM III ozone inthe upper troposphere and lowermost stratosphere:Seasonal variability and comparisons to aircraftobservations, J. Geophys. Res., 108 (D7), 4218,doi: 10.1029/2002JD002819, 2003.
Prinn, R.G., R.F. Weiss, P.J. Fraser, P.G. Simmonds, D.M.Cunnold, F.N. Alyea, S. O’Doherty, P. Salameh,B.R. Miller, J. Huang, R.H.J. Wang, D.E. Hartley,C. Harth, L.P. Steele, G. Sturrock, P.M. Midgley,and A. McCulloch, A history of chemically andradiatively important gases in air deduced fromALE/GAGE/AGAGE, J. Geophys. Res., 105 (D14),17751-17792, 2000.
PRTR, Pollutant Release and Transfer Register 2002-Japan, PRTR Data, (in Japanese), 197 pp., Minist.Econ. Trade Ind., Tokyo, Available at: http://-
www.chem.unep.ch/prtr/, 2004.Pundt, I., J.P. Pommereau, C. Phillips, and E. Lateltin,
Upper limit of iodine oxide in the lower strato-sphere, J. Atmos. Chem., 30 (1), 173-185, 1998.
Pundt, I., M. Van Roozendael, T. Wagner, A. Richter, M.Chipperfield, J.P. Burrows, C. Fayt, F. Hendrick,K. Pfeilsticker, U. Platt, and J.-P. Pommereau,Simultaneous UV-vis measurements of BrO fromballoon, satellite and ground: implications for tro-pospheric BrO, in Stratospheric Ozone 1999, Proc.5th European Symp., 27 September-1 October 1999,St. Jean de Luz, France, edited by N.R.P. Harris, M.Guirlet, and G.T. Amanatidis, Air PollutionResearch Rep. 73, EUR 19340, 316-319, EuropeanCommission, Luxembourg, 2000.
Pundt, I., J.-P. Pommereau, M.P. Chipperfield, M. VanRoozendael, and F. Goutail, Climatology of thestratospheric BrO vertical distribution by balloon-borne UV-visible spectrometry, J. Geophys. Res.,107 (D24), 4806, doi: 10.1029/2002JD002230,2002.
Qiu, L.X., S.H. Shi, S.B. Xing, and X.G. Chen, Rate con-stants for the reactions of hydroxyl with fivehalogen-substituted ethanes from 292 to 366 K, J.Phys. Chem., 96 (2), 685-689, 1992.
Quack, B., and D.W.R. Wallace, Air-sea flux of bromo-
form: Controls, rates, and implications, GlobalBiogeochem. Cycles, 17 (1), 1023, doi: 10.1029/-
2002GB001890, 2003.Quack, B., E. Atlas, G. Petrick, V. Stroud, S. Schauffler,
and D.W.R. Wallace, Oceanic bromoform sourcesfor the tropical atmosphere, Geophys. Res. Lett., 31,L23S05, doi: 10.1029/2004GL020597, 2004.
Randel, W.J., F. Wu , A. Gettelman, J.M. Russell III, J.M.Zawodny, and S.J. Oltmans, Seasonal variation ofwater vapor in the lower stratosphere observed inHalogen Occultation Experiment data, J. Geophys.Res., 106 (D13), 14313-14325, 2001.
Randel, W.J., F. Wu, S.J. Oltmans, K. Rosenlof, and G.E.Nedoluha, Interannual changes of stratosphericwater vapor and correlations with tropical trop-opause temperatures, J. Atmos. Sci., 61 (17), 2133-2148, 2004.
Randel, W.J., F. Wu, H. Vömel, G.E. Nedoluha, and P.Forster, Decreases in stratospheric water vapor after2001: Links to changes in the tropical tropopauseand the Brewer-Dobson circulation, J. Geophys.Res., 111, D12312, doi: 10.1029/2005JD006744,2006.
Ray, E.A., K.H. Rosenlof, E.C. Richard, P.K. Hudson, D.J.Cziczo, M. Loewenstein, H.-J. Jost, J. Lopez, B.Ridley, A. Weinheimer, D. Montzka, D. Knapp, S.C.Wofsy, B.C. Daube, C. Gerbig, I. Xueref, and R.L.Herman, Evidence of the effect of summertime mid-latitude convection on the subtropical lower strato-sphere from CRYSTAL-FACE tracer measurements,J. Geophys. Res., 109, D18304, doi: 10.1029/-
2004JD004655, 2004.Redeker, K.R., and R.J. Cicerone, Environmental controls
over methyl halide emissions from rice paddies,Global Biogeochem. Cycles, 18, GB1027, doi:10.1029/2003GB002092, 2004.
Redeker, K.R., N.-Y. Wang, J.C. Low, A. McMillan, S.C.Tyler, and R.J. Cicerone, Emissions of methylhalides and methane from rice paddies, Science,290 (5493), 966-969, 2000.
Redeker, K.R., S. Meinardi, D. Blake, and R. Sass,Gaseous emissions from flooded rice paddy agri-culture, J. Geophys. Res., 108 (D13), 4386, doi:10.1029/2002JD002814, 2003.
Reeves, C.E., W.T. Sturges, G.A. Sturrock, K. Preston,D.E. Oram, J. Schwander, R. Mulvaney, J.-M.Barnola, and J. Chappellaz, Trends of halon gasesin polar firn air: Implications for their emission dis-tributions, Atmos. Chem. Phys., 5 (8), 2055-2064,2005.
Richter, A., F. Wittrock, A. Ladstätter-Weißenmayer, andJ.P. Burrows, GOME measurements of strato-
VERY SHORT-LIVED SUBSTANCES
2.53
spheric and tropospheric BrO, Adv. Space Res., 29(11), 1667-1672, 2002.
Richter, U., and D.W.R. Wallace, Production of methyliodide in the tropical Atlantic Ocean, Geophys. Res.Lett., 31, L23S03, doi: 10.1029/2004GL020779,2004.
Ridley, B., E. Atlas, H. Selkirk, L. Pfister, D. Montzka, J.Walega, S. Donnelly, V. Stroud, E. Richard, K.Kelly, A. Tuck, T. Thompson, J. Reeves, D.Baumgardner, W.T. Rawlins, M. Mahoney, R.Herman, R. Friedl, F. Moore, E. Ray, and J. Elkins,Convective transport of reactive constituents to thetropical and mid-latitude tropopause region: I.Observations, Atmos. Environ., 38 (9), 1259-1274,2004.
Rinsland, C.P., D.K. Weisenstein, M.K.W. Ko, C.J. Scott,L.S. Chiou, E. Mahieu, R. Zander, and P. Demoulin,Post-Mount Pinatubo eruption ground-based infra-red stratospheric column measurements of HNO3,NO, and NO2 and their comparison with model cal-culations, J. Geophys. Res., 108 (D15), 4437, doi:10.1029/2002JD002965, 2003.
Rosenlof, K.H., Seasonal cycle of the residual mean merid-ional circulation in the stratosphere, J. Geophys.Res., 100 (D3), 5173-5191, 1995.
Rowley, D.M., W.J. Bloss, R.A. Cox, and R.L. Jones,Kinetics and products of the IO + BrO reaction, J.Phys. Chem. A, 105 (33), 7855-7864, 2001.
Saiz-Lopez, A., and J.M.C. Plane, Novel iodine chemistryin the marine boundary layer, Geophys. Res. Lett.,31, L04112, doi: 10.1029/2003GL019215, 2004.
Saiz-Lopez, A., J.M.C. Plane, and J.A. Shillito, Bromineoxide in the mid-latitude marine boundary layer,Geophys. Res. Lett., 31, L03111, doi: 10.1029/-
2003GL018956, 2004a.Saiz-Lopez, A., R.W. Saunders, D.M. Joseph, S.H.
Ashworth, and J.M.C. Plane, Absolute absorptioncross-section and photolysis rate of I2, Atmos.Chem. Phys., 4 (5), 1443-1450, 2004b.
Saiz-Lopez, A., J.M.C. Plane, G. McFiggans, P.I.Williams, S.M. Ball, M. Bitter, R.L. Jones, C.Hongwei, and T. Hoffmann, Modelling moleculariodine emissions in a coastal marine environment:the link to new particle formation, Atmos. Chem.Phys., 6 (4), 883-895, 2006.
Salawitch, R.J., D.K. Weisenstein, L.J. Kovalenko, C.E.Sioris, P.O. Wennberg, K. Chance, M.K.W. Ko, andC.A. McLinden, Sensitivity of ozone to bromine inthe lower stratosphere, Geophys. Res. Lett., 32 (5),L05811, doi: 10.1029/2004GL021504, 2005.
Saltzman, E.S., M. Aydin, W.J. De Bruyn, D.B. King, andS.A. Yvon-Lewis, Methyl bromide in preindustrial
air: Measurements from an Antarctic ice core, J.Geophys. Res., 109 (5), D05301, doi: 10.1029/-
2003JD004157, 2004.Sander, R., W.C. Keene, A.A.P. Pszenny, R. Arimoto, G.P.
Ayers, E. Baboukas, J.M. Cainey, P.J. Crutzen, R.A.Duce, G. Hönninger, B.J. Huebert, W. Maenhaut,N. Mihalopoulos, V.C. Turekian, and R. VanDingenen, Inorganic bromine in the marineboundary layer: A critical review, Atmos. Chem.Phys., 3 (5), 1301-1336, 2003.
Sander, S.P., R.R. Friedl, D.M. Golden, M.J. Kurylo , G.K.Moortgat, H. Keller-Rudek, P.H. Wine, A.R.Ravishankara, C.E. Kolb, M.J. Molina, B.J.Finlayson-Pitts, R.E., Huie, and V.L. Orkin,Chemical Kinetics and Photochemical Data for Usein Atmospheric Studies: Evaluation No. 15, JPLPublication 06-2, Jet Propulsion Laboratory,Pasadena, Calif., 2006.
Schauffler, S.M., E.L. Atlas, F. Flocke, R.A. Lueb, V.Stroud, and W. Travnicek, Measurements ofbromine containing organic compounds at the trop-ical tropopause, Geophys. Res. Lett., 25 (3), 317-320, 1998.
Schauffler, S.M., E.L. Atlas, D.R. Blake, F. Flocke, R.A.Lueb, J.M. Lee-Taylor, V. Stroud, and W. Travnicek,Distributions of brominated organic compounds inthe troposphere and lower stratosphere, J. Geophys.Res., 104 (D17), 21513-21535, 1999.
Scheeren, H.A., J. Lelieveld, J.A. de Gouw, C. van derVeen, and H. Fischer, Methyl chloride and otherchlorocarbons in polluted air during INDOEX, J.Geophys. Res., 107 (D19), 8015, doi: 10.1029/-
2001JD001121, 2002.Schofield, R., K. Kreher, B.J. Connor, P.V. Johnston, A.
Thomas, D. Shooter, M.P. Chipperfield, C.D.Rodgers, and G.H. Mount, Retrieved troposphericand stratospheric BrO columns over Lauder, NewZealand, J. Geophys. Res., 109, D14304, doi: 10.1029/-
2003JD004463, 2004.Schofield, R., P.V. Johnston, A. Thomas, K. Kreher, B.J.
Connor, S. Wood, D. Shooter, M.P. Chipperfield,A. Richter, R. von Glasow, and C.D. Rodgers,Tropospheric and stratospheric BrO columns overArrival Heights, Antarctica, 2002, J. Geophys. Res.,111, D22310, doi: 10.1029/2005JD007022, 2006.
Schweitzer, F., P. Mirabel, and C. George, Uptake ofhydrogen halides by water droplets, J. Phys. Chem.A, 104 (1), 72-76, 2000.
Sheode, N., B.-M. Sinnhuber, A. Rozanov, and J.P.Burrows, Towards a climatology of stratosphericbromine monoxide from SCIAMACHY limb obser-vations, Atmos. Chem. Phys. Discuss., 6, 6431-
VERY SHORT-LIVED SUBSTANCES
2.54
6466, 2006.Sherwood, S.C., and A.E. Dessler, A model for transport
across the tropical tropopause, J. Atmos. Sci., 58(7), 765-779, 2001.
Simmonds, P.G., A.J. Manning, D.M. Cunnold, A.McCulloch, S. O’Doherty, R.G. Derwent, P.B.Krummel, P.J. Fraser, B. Dunse, L.W. Porter, R.H.J.Wang, B.R. Greally, B.R. Miller, P. Salameh, R.F.Weiss, and R.G. Prinn, Global trends, seasonalcycles, and European emissions of dichloro-methane, trichloroethene, and tetrachloroethenefrom the AGAGE observations at Mace Head,Ireland, and Cape Grim, Tasmania, J. Geophys.Res., 111, D18304, doi: 10.1029/2006JD007082,2006.
Simpson, I.J., O.W. Wingenter, D.J. Westberg, H.E.Fuelberg, C.M. Kiley, J.H. Crawford, S. Meinardi,D.R. Blake, and F.S. Rowland, Airborne measure-ments of cirrus-activated C2Cl4 depletion in theupper troposphere with evidence against Cl reac-tions, Geophys. Res. Lett., 30 (20), 2025, doi:10.1029/2003GL017598, 2003.
Simpson, I.J., S. Meinardi, N.J. Blake, F.S. Rowland, andD.R. Blake, Long-term decrease in the globalatmospheric burden of tetrachloroethene (C2Cl4),Geophys. Res. Lett., 31, L08108, doi: 10.1029/-
2003GL019351, 2004.Singh, H.B., L.J. Salas, and R.E. Stiles, Methyl halides in
and over the eastern Pacific (40°N-32°S), J.Geophys. Res., 88 (C6), 3684-3690, 1983.
Sinnhuber, B.-M., and I. Folkins, Estimating the contribu-tion of bromoform to stratospheric bromine and itsrelation to dehydration in the tropical tropopauselayer, Atmos. Chem. Phys., 6, 4755-4761, 2006.
Sinnhuber, B.-M., D.W. Arlander, H. Bovensmann, J.P.Burrows, M.P. Chipperfield, C.-F. Enell, U. Frieß,F. Hendrick, P.V. Johnston, R.L. Jones, K. Kreher,N. Mohamed-Tahrin, R. Müller, K. Pfeilsticker, U.Platt, J.-P. Pommereau, I. Pundt, A. Richter, A.M.South, K.K. Tørnkvist, M. Van Roozendael, T.Wagner, and F. Wittrock, Comparison of measure-ments and model calculations of stratosphericbromine monoxide, J. Geophys. Res., 107 (D19),4398, doi: 10.1029/2001JD000940, 2002.
Sinnhuber, B.-M., A. Rozanov, N. Sheode, O.T. Afe, A.Richter, M. Sinnhuber, F. Wittrock, J.P. Burrows,G.P. Stiller, T. von Clarmann, and A. Linden, Globalobservations of stratospheric bromine monoxidefrom SCIAMACHY, Geophys. Res. Lett., 32,L20810, doi: 10.1029/2005GL023839, 2005.
Sinnhuber, B.-M., N. Sheode, M. Sinnhuber, M.P.Chipperfield, and W. Feng, The contribution of
anthropogenic bromine emissions to past strato-spheric ozone trends: A modelling study, Atmos.Chem. Phys. Discuss., 6, 6497-6524, 2006.
Sioris, C.E., L.J. Kovalenko, C.A. McLinden, R.J.Salawitch, M. Van Roozendael, F. Goutail, M. Dorf,K. Pfeilsticker, K. Chance, C. von Savigny, X. Liu,T.P. Kurosu, J.-P. Pommereau, H. Bösch, and J.Frerick, Latitudinal and vertical distribution ofbromine monoxide in the lower stratospherefrom Scanning Imaging Absorption Spectro-meter for Atmospheric Chartography limb scat-tering measurements, J. Geophys. Res., 111,D14301, doi: 10.1029/2005JD006479, 2006.
Smythe-Wright, D., S.M. Boswell, C.H. Lucas, A.L. New,and M.S. Varney, Halocarbon and dimethyl sul-phide studies around the Mascarene Plateau, Phil.Trans. R. Soc. Lond. A, 363 (1826), 169-185, 2005.
Soller, R., J.M. Nicovich, and P.H. Wine, Temperature-dependent rate coefficients for the reactions ofBr(2P3/2), Cl(2P3/2), and O(3PJ) with BrONO2, J.Phys. Chem. A, 105 (9), 1416-1422, 2001.
Solomon, S., R.R. Garcia, and A.R. Ravishankara, On therole of iodine in ozone depletion, J. Geophys. Res.,99 (D10), 20491-20499, 1994.
Sprenger, M., and H. Wernli, A northern hemispheric cli-matology of cross-tropopause exchange for theERA15 time period (1979-1993), J. Geophys. Res.,108 (D12), 8521, doi: 10.1029/2002JD002636,2003.
Stohl, A., A 1-year Lagrangian “climatology” of airstreamsin the Northern Hemisphere troposphere and low-ermost stratosphere, J. Geophys. Res., 106 (D7),7263-7279, 2001.
Stohl, A., P. Bonasoni, P. Cristofanelli, W. Collins, J.Feichter, A. Frank, C. Forster, E. Gerasopoulos, H.Gäggeler, P. James, T. Kentarchos, H. Kromp-Kolb,B. Krüger, C. Land, J. Meloen, A. Papayannis, A.Priller, P. Seibert, M. Sprenger, G.J. Roelofs, H.E.Scheel, C. Schnabel, P. Siegmund, L. Tobler, T.Trickl, H. Wernli, V. Wirth, P. Zanis, and C. Zerefos,Stratosphere-troposphere exchange: A review, andwhat we have learned from STACCATO, J.Geophys. Res., 108 (D12), 8516, doi: 10.1029/-
2002JD002490, 2003.Stuart, A.L., and M.Z. Jacobson, A timescale investigation
of volatile chemical retention during hydrometeorfreezing: Nonrime freezing and dry growth rimingwithout spreading, J. Geophys. Res., 108 (D6),4178, doi: 10.1029/2001JD001408, 2003.
Sturges, W.T., D.E. Oram, L.J. Carpenter, S.A. Penkett,and A. Engel, Bromoform as a source of strato-spheric bromine, Geophys. Res. Lett., 27 (14), 2081-
VERY SHORT-LIVED SUBSTANCES
2.55
2084, 2000.Sturges, W.T., H.P. McIntyre, S.A. Penkett, J. Chappellaz,
J.-M. Barnola, R. Mulvaney, E. Atlas, and V. Stroud,Methyl bromide, other brominated methanes andmethyl iodide in polar firn air, J. Geophys. Res., 106(D2), 1595-1606, 2001.
Stutz, J., R. Ackermann, J.D. Fast, and L. Barrie,Atmospheric reactive chlorine and bromine at theGreat Salt Lake, Utah, Geophys. Res. Lett., 29 (10),1380, doi: 10.1029/2002GL014812, 2002.
Thompson, T.M. (Ed.), J.H. Butler, B.C. Daube, G.S.Dutton, J.W. Elkins, B.D. Hall, D.F. Hurst, D.B.King, E.S. Kline, B.G. LaFleur, J. Lind, S. Lovitz,D.J. Mondeel, S.A. Montzka, F.L. Moore, J.D.Nance, J.L. Neu, P.A. Romashkin, A. Scheffer, andW.J. Snible, Halocarbons and other atmospherictrace species, in Climate Monitoring andDiagnostics Laboratory: Summary Report No. 27,2002-2003, edited by R.C. Schnell, A.-M. Buggle,and R.M. Rosson, 115-135, NOAA/ClimateMonitoring and Diagnostics Laboratory, Boulder,Colo., 2004.
Thornton, B.F., D.W. Toohey, L.M. Avallone, H. Harder,M. Martinez, J.B. Simpas, W.H. Brune, and M.A.Avery, In situ observations of ClO near the winterpolar tropopause, J. Geophys. Res., 108 (D8), 8333,doi: 10.1029/2002JD002839, 2003.
Thuburn, J., and G.C. Craig, On the temperature structureof the tropical substratosphere, J. Geophys. Res.,107 (D2), 4017, doi: 10.1029/2001JD000448 2002.
Tiedtke, M., A comprehensive mass flux scheme forcumulus parameterization in large-scale models,Mon. Wea. Rev., 117 (8), 1779-1800, 1989.
Toon, G.C., J.-F. Blavier, B. Sen, and B.J. Drouin,Atmospheric COCl2 measured by solar occultationspectrometry, Geophys. Res. Lett., 28 (14), 2835-2838, 2001.
Trudinger, C.M., D.M. Etheridge, G.A. Sturrock, P.J.Fraser, P.B. Krummel, and A. McCulloch,Atmospheric histories of halocarbons from analysisof Antarctic firn air: Methyl bromide, methyl chlo-ride, chloroform, and dichloromethane, J. Geophys.Res., 109, D22310, doi: 10.1029/2004JD004932,2004.
Tucceri, M.E., D. Holscher, A. Rodriguez, T.J. Dillon, andJ.N. Crowley, Absorption cross section and photol-ysis of OIO, Phys. Chem. Chem. Phys., 8 (7), 834-846, 2006.
Tuck, A.F., S.J. Hovde, K.K. Kelly, S.J. Reid, E.C.Richard, E.L. Atlas, S.G. Donnelly, V.R. Stroud,D.J. Cziczo, D.M. Murphy, D.S. Thomson, J.W.Elkins, F.L. Moore, E.A. Ray, M.J. Mahoney, and
R.R. Friedl, Horizontal variability 1-2 km belowthe tropical tropopause, J. Geophys. Res., 109,D05310, doi: 10.1029/2003JD003942, 2004.
Van Roozendael, M., T. Wagner, A. Richter, I. Pundt, D.W.Arlander, J.P. Burrows, M. Chipperfield, C. Fayt,P.V. Johnston, J.-C. Lambert, K. Kreher, K.Pfeilsticker, U. Platt, J.-P. Pommereau, B.-M.Sinnhuber, K.K. Tørnkvist, and F. Wittrock,Intercomparison of BrO measurements from ERS-2 GOME, ground-based and balloon platforms, Adv.Space Res., 29 (11), 1661-1666, 2002.
Vaughan, G., and C. Timmis, Transport of near-tropopauseair into the lower midlatitude stratosphere, Quart.J. Roy. Meteorol. Soc., 124 (549), 1559-1578, 1998.
von Glasow, R., R. Sander, A. Bott, and P.J. Crutzen,Modeling halogen chemistry in the marineboundary layer 2. Interactions with sulfur and thecloud-covered MBL, J. Geophys. Res., 107 (D17),4323, doi: 10.1029/2001JD000943, 2002.
von Glasow, R., R. von Kuhlmann, M.G. Lawrence, U.Platt, and P.J. Crutzen, Impact of reactive brominechemistry in the troposphere, Atmos. Chem. Phys.,4, 2481-2497, 2004.
Wagner, T., and U. Platt, Satellite mapping of enhancedBrO concentrations in the troposphere, Nature, 395(6701), 486-490, 1998.
Wagner, T., C. Leue, M. Wenig, K. Pfeilsticker, and U.Platt, Spatial and temporal distribution of enhancedboundary layer BrO concentrations measured bythe GOME instrument aboard ERS-2, J. Geophys.Res., 106 (D20), 24225-24235, 2001.
Wamsley, P.R., J.W. Elkins, D.W. Fahey, G.S. Dutton,C.M. Volk, R.C. Myers, S.A. Montzka, J.H. Butler,A.D. Clarke, P.J. Fraser, L.P. Steele, M.P. Lucarelli,E.L. Atlas, S.M. Schauffler, D.R. Blake, F.S.Rowland, W.T. Sturges, J.M. Lee, S.A. Penkett, A.Engel, R.M. Stimpfle, K.R. Chan, D.K.Weisenstein, M.K.W. Ko, and R.J. Salawitch,Distribution of halon-1211 in the upper troposphereand lower stratosphere and the 1994 total brominebudget, J. Geophys. Res., 103 (D1), 1513-1526,1998.
Wang, P.K., Moisture plumes above thunderstorm anvilsand their contributions to cross-tropopause trans-port of water vapor in midlatitudes, J. Geophys.Res., 108 (D6), 4194, doi: 10.1029/2002JD002581,2003.
Warwick, N.J., G. Carver, X. Yang, N. Savage, F.O’Connor, R.A. Cox, and J.A. Pyle, Global mod-eling of natural bromocarbons, J. Geophys. Res., inpress, 2006.
Wennberg, P.O., J.W. Brault, T.F. Hanisco, R.J. Salawitch,
VERY SHORT-LIVED SUBSTANCES
2.56
and G.H. Mount, The atmospheric column abun-dance of IO: Implications for stratospheric ozone,J. Geophys. Res., 102 (D7), 8887-8898, 1997.
Wernli, H., and M. Bourqui, A Lagrangian “1-year clima-tology” of (deep) cross-tropopause exchange in theextratropical Northern Hemisphere, J. Geophys.Res., 107 (D2), 4021, doi: 10.1029/2001JD000812,2002.
Wittrock, F., R. Müller, A. Richter, H. Bovensmann, andJ.P. Burrows, Measurements of iodine monoxide(IO) above Spitsbergen, Geophys. Res. Lett., 27(10), 1471-1474, 2000.
WMO (World Meteorological Organization), ScientificAssessment of Ozone Depletion: 1994, GlobalOzone Research and Monitoring Project–ReportNo. 37, Geneva, Switzerland, 1995.
WMO (World Meteorological Organization), ScientificAssessment of Ozone Depletion: 1998, GlobalOzone Research and Monitoring Project–ReportNo. 44, Geneva, Switzerland, 1999.
WMO (World Meteorological Organization), ScientificAssessment of Ozone Depletion: 2002, GlobalOzone Research and Monitoring Project–ReportNo. 47, Geneva, Switzerland, 2003.
Worton, D.R., W.T. Sturges, J. Schwander, R. Mulvaney,J.-M. Barnola, and J. Chappellaz, 20th centurytrends and budget implications of chloroform andrelated tri- and dihalomethanes inferred from firnair, Atmos. Chem. Phys., 6 (10), 2847-2863, 2006.
Wuebbles, D.J., and M.K.W. Ko, Summary of EPA/NASAWorkshop on the Stratospheric Impacts of Short-Lived Gases, March 30-31, 1999, Washington D.C.,available through the U.S. Environmental Pro-tection Agency, Stratospheric Protection Division,Washington D.C., 1999.
Wuebbles, D.J., K.O. Patten, M.T. Johnson, and R.Kotamarthi, New methodology for Ozone Deple-tion Potentials of short-lived compounds: n-Propylbromide as an example, J. Geophys. Res., 106
(D13), 14551-14571, 2001.Yang, X., R.A. Cox, N.J. Warwick, J.A. Pyle, G.D. Carver,
and F.M. O’Connor, Tropospheric bromine chem-istry and its impacts on ozone: A model study, J.Geophys. Res., 110, D23311, doi: 10.1029/2005-
JD006244, 2005.Yano, J.I., F. Guichard, J.P. Lafore, J.L. Redelsperger, and
P. Bechtold, Estimations of mass fluxes for cumulusparameterizations from high-resolution spatial data,J. Atmos. Sci., 61 (7), 829-842, 2004.
Yin, Y., D.J. Parker, and K.S. Carslaw, Simulation of tracegas redistribution by convective clouds – Liquidphase processes, Atmos. Chem. Phys., 1, 19-36,2001.
Yin, Y., K.S. Carslaw, and D.J. Parker, Redistribution oftrace gases by convective clouds – Mixed-phaseprocesses, Atmos. Chem. Phys., 2, 293-306, 2002.
Yokouchi, Y., T. Inagaki, K. Yazawa, T. Tamaru, T.Enomoto, and K. Izumi, Estimates of ratios ofanthropogenic halocarbon emissions from Japanbased on aircraft monitoring over Sagami Bay,Japan, J. Geophys. Res., 110, D06301, doi: 10.1029/-
2004JD005320, 2005a.Yokouchi, Y., F. Hasebe, M. Fujiwara, H. Takashima, M.
Shiotani, N. Nishi, Y. Kanaya, S. Hashimoto, P.Fraser, D. Toom-Sauntry, H. Mukai, and Y. Nojiri,Correlations and emission ratios among bromo-form, dibromochloromethane, and dibromo-methane in the atmosphere, J. Geophys. Res., 110,D23309, doi: 10.1029/2005JD006303, 2005b.
Zhou, Y., R.K. Varner, R.S. Russo, O.W. Wingenter, K.B.Haase, R. Talbot, and B.C. Sive, Coastal watersource of short-lived halocarbons in New England,J. Geophys. Res., 110, D21302, doi: 10.1029/2004-
JD005603, 2005.Zingler, J., and U. Platt, Iodine oxide in the Dead Sea
Valley: Evidence for inorganic sources of boundarylayer IO, J. Geophys. Res., 110, D07307, doi:10.1029/2004JD004993, 2005.
VERY SHORT-LIVED SUBSTANCES
2.57