hamburg university of applied sciences faculty of life
TRANSCRIPT

Hamburg University of Applied Sciences
Faculty of Life Sciences
Master in Public Health degree
Economics of the Diabetic Foot: A Cost-Of-Illness Study in Saudi Arabia
Master Thesis
Date of submission: 12.09.2016
Submitted by: Turki Bafaraj
Matriculation number: 2232574
Examination supervisor: Prof. Dr. York F. Zöllner
Secondary supervisor: Prof. Dr. med. Hasan A. Alzahrani,

ACKNOWLEDGEMENTS
First of all, I'm grateful to THE ALMIGHTY ALLAH for establishing me to complete this
project.
I give all my success and achievement to my parents, Ghazi Bafaraj and Amnah Alahdal. Also
to my wife Nidaa Zawawi, supportive brothers and lovely sisters for their unceasing
encouragement.
Thank you Prof. Dr. York F. Zöllner and Prof. Dr. med. Hasan A. Alzahrani who were more
than generous with their expertise and precious time.
A special thanks to Dr. Hani Jokhdar for his countless hours of helping to access the data, and
most of all patience throughout the entire process.
I would like to acknowledge and thank the Faculty of Life science, Hamburg University of
Applied Sciences for allowing me to conduct my research and providing any assistance
requested.
Finally, I would like to thank all teachers and administrators in my Faculty that assisted me
during my studying of MPH.

Turki Bafaraj “Economics of the diabetic foot: a cost-of-illness study in Saudi Arabia” ___________________________________________________________________________
2
Abstract
Background: Diabetes mellitus (DM) is a chronic disease today’s societies encounter.
Diabetes symptomatology implies a definitive hormonal background involving insulin
production, or its tissue uptake (types 1 and 2 diabetes, respectively); however its exact
etiology is still unknown. Diabetes is a disease of complications, e.g., angiopathy, neuropathy;
particularly diabetic foot disorders (DFDs) which can be devastating. Amputation, especially
following ulceration is a catastrophic endpoint of DFDs. Saudi Arabia suffers a terrifying DM
situation (>20% adults), aggravated by high obesity rates and modernized way of living.
Above 25% Saudi diabetics develop DFDs, >25% of whom end up with amputation. “Cost of
illness” (COI) can be used to estimate the economic burden of DFDs. This work focuses on
COI in DFDs in Saudi; identifying risks affecting this cost.
Methodology: Records of adult diabetics with DFDs enrolled with a major insurance agency
in Jeddah, KSA were reviewed. Studied data included demographics, intervention options, and
reimbursement as a COI measurement during fiscal year (FY) 2015. A quota sample of 60
diabetics was recruited; their risk factors for developed DFDs and COI analyzed.
Results: The median age of participants was 58y (IQR 3y). Male: female 2.53:1; and Saudi:
non-Saudi 4:1. Most subjects (43.3%) needed debridement, 35% minor amputation, 15%
major amputation, and 6.7% conservative treatment for their DFDs episodes. Age≥55
significantly required more intensive intervention compared to younger age (minor amputation
35% vs. 0%, major amputation 15% vs. 0%, respectively; Fisher’s exact 8.567, p=0.011). Age
significantly impacted COI [r(df=58) =0.333, p=0.009]. Saudis significantly experienced
amputation more frequently than non-Saudis (33.3% vs. 1.7% major amputation, 15.0% vs.
0.0% minor amputation, respectively; Fisher’s exact 11.98, p=0.004). They also bear higher
COI [t(df 55.6= 4.7, p<0.0001). Mean COI significantly varied by intervention option [F (df 3,
56) =101.3, p<0.0001]. Age could predict change in COI (Exp B = 1.84, 95% 1.2 - 2.74.
Although COI varied by type of intervention, the latter could not predict such change in COI.
Conclusion: Age is risk for a worsened DFDs prognosis and higher costs. Saudis are at risk of
more costly DFs. The change in COI could be predicted by studied risks. Findings from this
work can be used in developing an integrated DFDs database, planning to alleviate DFDs
burden and improve the health related quality of life Saudi diabetic patients.
Keywords: Diabetic foot, cost of illness, Saudi Arabia

Turki Bafaraj “Economics of the diabetic foot: a cost-of-illness study in Saudi Arabia” ___________________________________________________________________________
3
Table of Contents
Content Page
Abstract ……………………………………………………………………………………
Table of Contents ................................................................................................................
List of Tables ......................................................................................................................
Table of Figures ..................................................................................................................
List of Abbreviations ……………………………………………………………………...
1. Introduction .....................................................................................................................
1.1 Rationale ………………………………………………………………………………
1.2 Aim and Questions of the Thesis ……………………………………………...............
1.2.1. General Aim ………………………………………………………………………..
1.2.2. Specific Aims ………………………………………………………………………
1.3 Thesis Structure ……………………………………………………………………….
2. Theoretical Background ………………………………………………………………..
2.1 Literature Review ……………………………………………………………………..
2.1.1 Definition and Description of Diabetes Mellitus…………………………………….
2.1.2 Classification and Types of Diabetes Mellitus ……………………………..............
2.1.3 Pathophysiology of Diabetes Mellitus ………………………………………………
2.1.4 Categories of Increased Risk for Diabetes (Prediabetes)……………………………
2.1.5 Signs and Symptoms of Diabetes Mellitus ………………………………………….
2.2 Complications of Diabetes Mellitus …………………………………………………..
2.3 Diabetic Foot Disorders (DFDs) ……………………………………………...............
2.4 Pathophysiology of Diabetic Foot Disorders …………………………………………
2.5 The Saudi Healthcare System ………………………………………………................
2.5.1 Health Insurance Business in Saudi Arabia …………………………………………
2.5.2 Diabetes in Saudi Arabia…………………………………………………………….
2.6 Economic Burden in Diabetic Foot Disorders…………………………………………
2.6.1 Cost of Illness in Diabetic Foot Disorders Q ……………………………...
2.6.1.1 Types of Costs in DM and DFDs Economic Evaluation ………………………….
2.6.1.1.1 Direct Costs ……………………………………………………………………..
2
3
6
7
8
10
14
15
15
15
16
16
16
16
18
20
22
22
23
24
24
25
26
27
29
30
31
31

Turki Bafaraj “Economics of the diabetic foot: a cost-of-illness study in Saudi Arabia” ___________________________________________________________________________
4
2.6.1.1.2 Indirect Costs ……………………………………………………………………
2.6.1.2 Calculating Cost of Illness (COI) …………………………………………………
2.7 Diagnosis of Diabetes Mellitus ……………………………………………………….
2.7.1 Basis for Testing For Diabetes in Asymptomatic Adults …………………………...
2.7.2 What are Additional Risk Factors for Testing Asymptomatic Adults for DM? …….
2.7.3 Diagnostic Tests for DM ……………………………………………………………
2.7.4 Community Screening for Detecting Prediabetes and Undiagnosed Diabetes ……..
2.7.5 Criteria for Diagnostic Tests of Hyperglycemic States ……………………………..
2.8 Risk Factors for Type 2 Diabetes ……………………………………………………..
2.9 Prevention of DM ……………………………………………………………………..
2.10 Management of DM …………………………………………………………………
2.10.1 Lifestyle ……………………………………………………………………………
2.10.2 Medications ………………………………………………………………………..
2.10.3 Surgery……………………………………………………………………………..
2.10.4 Support …………………………………………………………………………….
3. Methods ………………………………………………………………………………...
3.1 Study setting …………………………………………………………………………..
3.2 Study design …………………………………………………………………………..
3.2.1 Study Participants …………………………………………………………………...
3.2.2 Inclusion Criteria ……………………………………………………………………
3.3 Sampling Technique and Sample Size ………………………………………………..
3.4 Data Collection ………………………………………………………………………..
3.5 The Study Variables…………………………………………………………………...
3.6 Statistical Analysis ……………………………………………………………………
3.7 Ethical Considerations ………………………………………………………………...
3.8 The Role of the Researcher …………………………………………………………...
4. Results ………………………………………………………………………………….
4.1 Descriptive Statistics Results …………………………………………………………
4.2 Analytical Statistics Results …………………………………………………………..
4.2.1 Phase 1: Influence of Study Determinants upon Type of DFDs Intervention ………
31
32
34
34
34
35
35
36
37
37
38
38
39
39
39
40
40
40
41
42
42
42
43
43
45
46
47
47
51
51

Turki Bafaraj “Economics of the diabetic foot: a cost-of-illness study in Saudi Arabia” ___________________________________________________________________________
5
4.2.1.1 The Relationship between Age and Type of Intervention ………………………...
4.2.1.2 The Relationship between Sex and Type of Intervention ………………………...
4.2.1.3 The Relationship between Nationality and Type of Intervention ………………...
4.2.2 Phase 2: Influence of Study Determinants Upon COI ………………………………
4.2.2.1 The Relationship between Age and COI: Correlation Analysis …………………..
4.2.2.2 The Relationship between Sex and COI: Student t-test …………………………..
4.2.2.3 The Relationship between Nationality and COI: Student t-Test ………………….
4.2.2.4 The Relationship between Type of Intervention and COI: ANOVA Test ………..
4.2.2.5 Predicting the Change in COI to Unit Changes in Selected Outputs ……………..
5. Discussion ........................................................................................................................
5.1 Interpreting Demographic Findings in Relation to DFDs Intervention Outcome …….
5.2 Discussing COI Findings ……………………………………………………………...
5.3 Discussing Regression Analysis ………………………………………………………
5.4 Study Aims and Answering the Research Questions …………………………………
5.5 Strengths and Limitations …………………………………………………………….
6. Conclusions .....................................................................................................................
References ...........................................................................................................................
Appendices
52
53
53
54
54
55
55
56
57
58
58
60
61
63
64
65
66

Turki Bafaraj “Economics of the diabetic foot: a cost-of-illness study in Saudi Arabia” ___________________________________________________________________________
6
List of Tables
Table Page
Table 1 Descriptive Criteria of Study Group: Age, Sex, Nationality, COI ……………… 47
Table 2 Distribution of the Study Group by Type of DFD Intervention ………………… 50
Table 3 Influence of Age upon the Prevalence of Specific DFDs Interventions:
Cross tabulation ………………………………………………………………………….
51
Table 4 Influence of Sex upon the Prevalence of Specific DFDs Interventions:
Cross-tabulation …………………………………………………………………………
53
Table 5 Influence of Nationality upon the Prevalence of Specific DFDs Interventions:
Cross tabulation …………………………………………………………………………
53
Table 6 The Relationship between Age and COI:
Correlations Analysis …………………………………………………………………….
54
Table 7 The Relationship between Sex and COI:
Two Independent Samples t-Test ………………………………………………………..
55
Table 8 The Relationship between Nationality and COI:
Two Independent Samples t-Test ………………………………………………………..
55
Table 9a Difference in the Mean COI of the Four Intervention Group Options
among the Study Population: ANOVA Test ……………………………………………..
56
Table 9b ANOVA Analysis: Mean Difference among DFDs Groups …………………... 56
Table 10 Predictability of Independent Variables Age and Sex on the Chnge in
COI: Logistc Rgerssion Analysis ………………………………………………………..
57

Turki Bafaraj “Economics of the diabetic foot: a cost-of-illness study in Saudi Arabia” ___________________________________________________________________________
7
List of Figures
Figure
Page
Figure 1a Histogram: Age Distribution Pattern of the Study Group …………………….
48
Figure 1b Histogram: Cost of Illness (COI) Distribution Pattern of the Study Group……
49
Figure 2 Sex Distribution Pattern of the Study Group ………………………………….
50
Figure 3 Intervention Options Distribution Pattern of the Study Group …………………
51
Figure 4 Distribution of the study DFDs Intervention Groups by Age Category ……….. 52
Figure 5 Distribution of the study DFDs Intervention Groups by Nationality:
Saudi vs. Non-Saudi ……………………………………………………………………...
54
Turki Bafaraj “Economics of the diabetic foot: a cost-of-illness study in Saudi Arabia” ___________________________________________________________________________
8
List of Abbreviations
AACE American Association of Clinical Endocrinologists
ADA American Diabetes Association
AGES Advanced Glycation End-Products
CVD Cardiovascular Disease
CBA Cost-Benefit Analysis
CDA Canadian Diabetes Association
CEA Cost-Effectiveness Analysis
CI Confidence interval
COI Cost of Illness
CUA Cost-Utility Analysis
DALYs Disability Adjusted Life Years
DFDs Diabetic Foot Disorders
DPP Diabetes Prevention Program
DM Diabetes Mellitus
FPG Fasting Plasma Glucose
GP General Practitioner
GDP Gross Domestic Product
GDM Gestational Diabetes Mellitus
GLP-1 Glucagon-Like Peptides 1 Receptor Agonists
HRQOL Health Related Quality of Life
ICD-10-CM International Classification of Diseases-Version 10 Coding Manual
IDF International Diabetes Federation
IGT Impaired Glucose Tolerance
IFG Impaired Fasting Glycaemia
IHD Ischemic Heart Disease
LICs Low Income Countries
LMICs Low and Middle Income Countries
LYG Life Year Gain
MI Myocardial Infarction

Turki Bafaraj “Economics of the diabetic foot: a cost-of-illness study in Saudi Arabia” ___________________________________________________________________________
9
NCDs Non-Communicable Diseases
OGTT Oral Glucose Tolerance Test
PHC Primary Health Care
PVD Peripheral Vascular Disease
QALYs Quality Adjusted Life Years
QOL Quality of Life
USD United States Dollar
WHO World Health Organization

Turki Bafaraj “Economics of the diabetic foot: a cost-of-illness study in Saudi Arabia” ___________________________________________________________________________
10
1. Introduction
Diabetes mellitus (DM) is a serious disease that occurs either when the pancreas does
not produce enough insulin (type 1 diabetes), or when the body cannot effectively utilize the
insulin it produces (type 2 DM) (WHO, 1999). Generally, the majority of diabetic patients are
affected by type 2 diabetes. The age predominance of type 2 diabetes traditionally used to
occur almost entirely among adult populations; but now it occurs in children too (WHO,
2013a). A sharp demarcation in the global prevalence of the two types thereby barely exists.
Diabetes literally represents a major concern for healthcare systems, globally, given the
increase in incidence rates among almost all population subsets, disregarding the variability in
the demographic or socio-economic status. Despite the higher opportunity for building up
sound health culture aided by a wider span of health education and the accessibility to quality
health services many developed countries enjoy, such merits failed to halt the alarming
statistics of diabetes and its complications in these countries. The prevalence of diabetes
competes with other non-communicable diseases (NCDs) which attract an utmost public
health’s attention, such as cardiovascular disease (CVD), cancer, and chronic respiratory
disorders. In spite of the presence of cost-effective interventions, NCDs, including DM receive
less than 3% of annual development assistance for health to low and middle income countries
(LMIC), offered by top donors in global health (e.g., Bill and Melinda Gates Foundation and
the World Bank) (Risko, et al., 2011). Undoubtedly, no significant change in DM situation
could be felt in the presence of this modest budgeting. And whether such meager funding
would be kept on the table for the prevention and control of NCDs and whether a global plan
of action to mitigate their ongoing spread will be achieved in the foreseen future are
questionable.
The global burden of DM is overwhelming. As of 2014, trends suggested the rate of
diabetes in the general populations would continue to rise (IDF, 2014). For instance, in 2015,
an estimated 415 million people had diabetes worldwide, with type 2 DM making about 90%
of the cases. This represents 8.3% of the adult population (Yuankai & Hu, 2014), and with
nearly equal rates in both women and men (Vost, et al., 2012). Importantly, the current
epidemiological profile of DM probably reflects a universally escalating tendency for risk
factors, such as being overweight or obese. Mortality-wise, too, diabetes occupies the 8th

Turki Bafaraj “Economics of the diabetic foot: a cost-of-illness study in Saudi Arabia” ___________________________________________________________________________
11
position among causes of death due to NCDs (WHO, 2014) e.g., accounting up to 1.5 million
deaths in 2012. Higher-than-optimal blood glucose caused an additional 2.2 million deaths by
increasing the risks of cardiovascular and other diseases. Forty-three percent of these 3.7
million deaths occur before the age of 70. The toll of diabetes and elevated blood glucose in
those under 70 is now higher in low- and middle-income countries than in high-income
countries (150 million vs. 0.3 million respectively) (WHO, 2016). Factoring the relatively
limited healthcare resources and support these countries might be suffering (Risko, et al.,
2011), an unfavorable health and economic outcome is justified.
In Saudi Arabia, the overall epidemiologic picture of diabetes with its risks and
consequences is no departure from the global situation. Like most oil-rich countries, leaving
behind the physically demanding life of the desert for air-conditioned comfort, servants, and
fast food and meat based dishes replacing fiber rich food, Saudi Arabia does struggle with
obesity and diabetes (Jalboukh, 2008). The prevalence of DM among adult Saudis has reached
23.7%, a proportion that is one of the highest in the world (Alwakeel, et al., 2009). The burden
of diabetes upon the Saudi society continues to be on the rise. Diabetes negatively impacts the
health standard of the Saudi populations and causes a considerable source of drainage in
national health funds in terms of the costs associated with treating affected cases and treating
the disability and losses incurred due to lost wages and hampered productivity.
Complications, risks, and burden of diabetes are increasingly stressing to medical,
social, economic and healthcare planners. The issue is that if not well controlled, diabetes can
possibly lead to those complications affecting almost all body systems. Knowledge and
awareness about DM, its risk factors, complications, and successful management plan
requirements are important aspects for a better control and a better health-related quality of
life (HRQOL) (Wild et al., 2004). Frequently, by the time people are diagnosed, they have
developed severe complications, e.g., microangiopathic processes (as in retinopathy), or
macroangiopathic processes [as in ischemic heart disease (IHD)]. Other body organs affected
as diabetes and more-than optimum blood glucose progress to complications include central
nervous system (e.g., stroke), peripheral nerves (e.g., diabetic neuropathy), kidney (diabetic
nephropathy), eye (diabetic retinopathy), and DFDs.
The cost of case negligence and the benefit of prevention and early intervention in diabetes is
a notion that is well addressed by the diabetes care providers’ community and stakeholders. If

Turki Bafaraj “Economics of the diabetic foot: a cost-of-illness study in Saudi Arabia” ___________________________________________________________________________
12
not well controlled, diabetes may cause blindness, kidney failure, lower limb amputation and
long-term disabilities that impact significantly on the patients’ QOL. Although many people
living with diabetes are prone to developing foot complications, there are no exact global
estimates regarding the particularly lower extremity amputations (Moxey, et al., 2011).
Moreover, diabetes, and its subsequent complications bring about substantial economic losses
to patients and their families. These losses involve direct medical costs and loss of work and
wages, as seen by the global economic cost of diabetes in 2014 estimated totaling a staggering
$612 billion (International Diabetes Federation- IDF, 2013). While the major cost drivers are
hospital and outpatient care, a contributing factor is the rise in cost for analogue insulins
(derived from human insulin by modifying its structure to change the pharmacokinetic
profile), which are increasingly prescribed, despite little evidence that they provide significant
advantages over cheaper human insulins (NCD Risk Factor Collaboration, 2007).
The facts that certain risks, (e.g., lifestyle, medical, and environmental factors), may
precipitate diabetes, especially in the genetically predisposed, and that diabetes itself leads to
consequences, some of which, are underlying disease triggers, e.g., hypertension, warrant
early intervention to interrupt the circle, and hence control the diabetes problem in the
community. Because blood glucose levels can rise to diabetic levels with little or nothing in
the way of symptoms, early detection of diabetes would lead to measures to reduce the risk of
heart disease, e.g., the use of statins to lower cholesterol, the reduction of blood glucose levels
initially by diet and exercise, supplemented with hypoglycemic drugs, as necessary (Waugh, et
al., 2007). The costs of case finding, e.g., through community screening programs for diabetes
are quite reasonable and are balanced in relation to health expenditures as a whole, and
facilities and resources available to treat newly diagnosed cases (Engelgau, et al., 2000).
Although type 1 diabetes cannot be prevented with current knowledge (World Health
Organization, 2014), effective approaches are available to prevent type 2 diabetes and to
prevent the complications and premature death that can result from all types of diabetes. These
include policies and practices across whole populations and within specific settings (school,
home, and workplace) that contribute to good health for everyone, regardless of whether they
have diabetes, such as exercising regularly, eating healthily, avoiding smoking, and
controlling blood pressure and lipids. That the starting point for living well with diabetes is

Turki Bafaraj “Economics of the diabetic foot: a cost-of-illness study in Saudi Arabia” ___________________________________________________________________________
13
early diagnosis; the longer a person lives with undiagnosed and untreated diabetes, the worse
their health outcomes are likely to be. For those who are diagnosed with diabetes, all types, a
series of cost-effective interventions can improve their outcomes, such as blood glucose
control, through a combination of diet, physical activity and, if necessary, medication; to
reduce the risk for complications; and regular screening for organs vulnerable to these
complications, including eyes, kidneys, nerves, and feet, to facilitate early treatment.
Especially foot in diabetics is seat for a sequence of insults due to multiple
pathological risks involving vascular changes, immune system integrity, neurological
impairment, and deranged cell metabolism; all intervene, particularly uncontrolled diabetes. In
fact, DFDs are among the most feared complications of DM Clinically, DFDs may present in
the form of foot ulceration, infection, neuropathy, deformity, gangrene and/or ischemia. (A
combination of any of DFDs symptoms may occur simultaneously, and both feet may be
affected). Infected foot ulcers can progress to gangrene and lower limb amputation. Diabetics
are 10-20 times more likely to experience amputation than normal population. Recently, a few
high-income countries have documented a reduction in amputation rates in people with
diabetes (Roglic, 2016). The derangement in the social, psychological, and QOL inflecting
diabetics with foot ulceration is truly painful. Cost- wise, the expenditure against caring for
diabetics with foot ulceration is five-times greater than that for no-ulcerative peers a year-time
after the first diabetic ulcer episode (Driver, et al., 2010). All health economies suffer from
such costs, e.g., account between 15% up to 40% of the of the world’s total healthcare
expenditure, (being highest in developing countries) (Boulton, et al., 2005). In practice,
patients with DF ulcers have a higher demand for health care at all settings, inpatient,
emergency or outpatient follow up services. The costs of such services should be endorsed in
the cost accounting for any ulcer episodes a diabetic patient may have gone through (Ali, et
al., 2008).
Despite the seriousness of DFDs there is limited research investigating the impact of
this group of diabetic health problems on the economic status of the Gulf countries, in general,
and Saudi Arabia, in particular. The scanty research on DFDs in Saudi Arabia has been
undertaken in hospital setting (Alzahrani, et al., 2013). The majority of other hospital-based
researcher done elsewhere used quantitative measures of HRQOL, such as, the Nottingham
health profile and the Diabetes QOL measure. From the societal perspective, too, it is

Turki Bafaraj “Economics of the diabetic foot: a cost-of-illness study in Saudi Arabia” ___________________________________________________________________________
14
therefore necessary to consider the economic impacts of DFDs, and identify interventions that
can reduce the burden of these health problems. Studying COI is an essential evaluation
technique in our attempts to measure and compare the economic burden of DFDs to society
(Jo, 2014). Findings from this work help healthcare decision-makers in setting up and
prioritize healthcare policies and interventions to improve diabetes outcomes in the
community.
1.1.Rationale
The major part of the burden of people with diabetes is their impaired HRQOL, largely
due the liability to chronic complications which DFDs take the greatest toll. Among those,
distressing DFDs, especially ulcers are common and often progress to lower extremity
amputation. Comprehensive data about the epidemiological characteristics, including disease
distribution and determinants, and scale of DFDs problem in Saudi Arabia are lacking.
Sources for gaining evidence-based information, especially about complicated DM, such as
diabetes national registry or large-scale systematic reviews, are either scarce or incomplete.
On the other hand, the prevalence of DM problem and subsequent risk of developing DFDs
among affected individuals is paramount. Likewise, the impact of DFDs problem per se upon
the diabetics’ QOL and the economic loss incurred are stressing. Even with recent emergence
of sporadic attempts to approach the burden of the DFDs problem in Saudi Arabia, little
research managed to embrace an integrated economic evaluation plan, using standardized
health economic outcome measures, such as COI. Adopting recognized economic evaluation
tools, such as the COI method helps understand the economic outcome of DFDs problem in
Saudi Arabia and hence enable integrating this understanding in designing and evaluating
intervention plans for preventing and managing DFDs and diabetes problem in Saudi Arabia
on sound scientific basis.
Only recently, a number of reports with various economic approaches have been
published from different countries addressing the economic impact of foot complications in
patients with diabetes. Relatively few studies discuss health economics, especially related to
foot ulceration, the severest and most devastating DFs complications of DM. The interest in
investigating the cost issues of DFDs is gaining momentum, perhaps due to increased
suffering societies started to experience from such health challenge. The disorders affect an

Turki Bafaraj “Economics of the diabetic foot: a cost-of-illness study in Saudi Arabia” ___________________________________________________________________________
15
increasingly large number of people around the world, putting them at risk for disability and
diminished QOL. The strains on the health care budget occur at the same time that newly
expensive technologies and treatment options have become available. Here, we analyze the
economic consequences of diabetic foot lesions among diabetic patients in Saudi Arabia, as
expressed by means of COI, where all DFDs types would be covered.
1.2 Aim and Questions of Thesis
1.2.1. General aim
This study aimed to explore and quantify the current economic burden associated with
diabetic foot disorders in Saudi Arabia.
1.2.2. Specific aims
1. To identify the distribution pattern of demographic criteria associated with DFDs.
2. To determine the prevalence of DFDs intervention options in reflection of these
disorders’ severity upon affected individuals.
3. To identify COI distribution pattern among different DFD intervention groups.
4. To realize and measure the impact of demographic and DFDs determinants upon
COI in the study population.
5. To predict the probability of change in COI of DFDs in response to a unit change in
selected predictors.
The research questions are as follows:
1. What is the distribution pattern of intervention options among the study’s DFDs population?
2. Is there a significant relationship between demographic criteria and the prevalence of the
intervention options used for treating DFDs?
3. What is the distribution pattern of the COI among different DFDs groups?
4. Is there a significant relationship between COI and DFD intervention options?
5. Can selected study determinants predict the change in COI of DFDs?

Turki Bafaraj “Economics of the diabetic foot: a cost-of-illness study in Saudi Arabia” ___________________________________________________________________________
16
1.3 Thesis Structure
The thesis is structured in six parts: First, the introduction and outline of the research
project, second, the theoretical background that gives an overview of the project’s
background, third, the methodological framework, fourth, the presentation of the results, fifth,
a subsequent discussion of the findings, and sixth, a short conclusion.
2. Theoretical Background
This investigator has conducted a thorough and meticulous search, considering reliable
and evidence-based sources available, in order to explore all what has is known up to date
relevant to diabetic foot disorders, their epidemiology, presentation, burden, economics,
particularly cost of illness, and apply these information to the Saudi Arabian populations.
Based on the comprehensive literature review done, the theoretical background of the
researched subject will be outlined in this section.
2.1 Literature Review
2.1.1 Definition and Description of Diabetes Mellitus
“Diabetes mellitus describes a metabolic disorder of multiple etiologies characterized
by chronic hyperglycemia with disturbances of carbohydrate, fat and protein metabolism
resulting from defects in insulin secretion, insulin action or both” (World Health organization,
1999). Other definitions for diabetes given by several scientific and professional diabetes
concerned organizations exist. All these definitions mainly focus on the state chronicity of
high blood glucose and the endocrinal background of the disorder where problems with insulin
and its role in cell metabolism is incriminated. In their description of diabetes, too, concerned
researches address the complexity of DM; its close association with underlying risk factors on
the one hand, and close association with detrimental consequences upon the body systems if
not adequately controlled, on the other. For instance, the American Diabetes Association
(ADA) (2004) endorses DM as a “group of metabolic diseases characterized by
hyperglycemia resulting from defects in insulin secretion, insulin action, or both.” The
chronic hyperglycemia of diabetes is associated with long-term damage, dysfunction, and

Turki Bafaraj “Economics of the diabetic foot: a cost-of-illness study in Saudi Arabia” ___________________________________________________________________________
17
failure of various organs, especially the eyes, kidneys, nerves, heart, and blood vessels.” The
Canadian Diabetes Association (CDA) (2013) envisions diabetes as being a “metabolic
disorder characterized by the presence of hyperglycemia due to defective insulin secretion,
defective insulin action or both.” In diabetes, ongoing patient self-management education and
support are critical to prevent acute complications and reducing the risk of long-term
complications. The chronic hyperglycemia of diabetes is associated with relatively specific
long-term microvascular complications affecting the eyes, kidneys and nerves, as well as an
increased risk for CVD. The diagnostic criteria for diabetes are based on thresholds of
glycemia that are associated with microvascular disease, especially retinopathy. On the other
hand, there is a large body of evidence in support of a range of interventions to significantly
mitigate the occurrence of these complications and hence improve diabetes outcomes.
(American Diabetes Association, 2015; Griffth, et al., 2011; Khan, et al., 2010).
In essence, diabetes as also defined in surveys as those having fasting plasma glucose
(FPG) value of greater than- or equal to- 7.0 mmol/L or on medication for diabetes/raised
blood glucose, involves a myriad of etiologic, deterministic, physiological, clinical, and
prognostic characteristics, many of which can be crippling. For instance, it has been postulated
that due to population growth and the increase in longevity, the prevalence of diabetes has
considerably risen at each age of human population. In parallel, a plenty of medical advances,
new health education, quality assurance measures, and health legislative actions have been
sustained and showed significant success in decreasing the prevalence and load of many health
challenges in a variety of regions, worldwide. Whether these advances would be able to
counteract or neutralize the impact of overpopulation alongside with other risks on the growth
of the diabetes rates then boost the opportunity of an improved HRQOL of diabetics is still
questionable. Since 1965 the WHO has published guidelines for the diagnosis and
classification of diabetes. These were reviewed in 1998 and periodically thereafter, and were
published as the guidelines for the “Definition, Diagnosis and Classification of Diabetes
Mellitus and its Complications” (World Health Organization, 1999). Ever since, more
information relevant to the diagnosis of diabetes has become available. In November 2005 a
joint WHO and International Diabetes Federation (IDF) Technical Advisory Group met in
Geneva to review and update the current WHO guidelines (World Health Organization, 2006).

Turki Bafaraj “Economics of the diabetic foot: a cost-of-illness study in Saudi Arabia” ___________________________________________________________________________
18
Diabetes mellitus poses a considerable burden upon the public health systems and
national economies, especially being one of the ten leading causes of all deaths, worldwide
(World Health Organization, 2014). The disease is recognized as one of the most important
causes of premature death and disability, the reason why it has been among four priority
NCDs targeted by world leaders in the 2011 Political Declaration on the Prevention and
Control of NCDs (United Nations, 2011). Again, despite the remarkable advance in the
healthcare research which has brought about innovative diagnostic and therapeutic solutions to
a large number of ailments like never before, diabetes with its immense challenge as a
complex community health problem remains on the rise. In the past three decades the
prevalence (age-standardized) of diabetes has increased substantially in countries of all
income levels, (probably mirroring the global increase in populations’ tendency for increased
weight problems and unhealthy diet and lifestyle). For instance, the prevalence of diabetes has
grown from 108 million (4.7% of the world’s population) in 1980 to 422 million (8.5% of the
world population) in 2014, during which time prevalence has increased; or at best remained
unchanged, in every country (NCD Risk Factor Collaboration, 2016).
2.1.2 Classification and Types of Diabetes Mellitus
According to the WHO guidelines for the classification and diagnosis of diabetes
(World Health Organization, 2015), which came into effect in June 2000, diabetes mellitus is
separated into four subcategories: type 1 diabetes, type 2 diabetes, gestational diabetes (GDM)
and other specific types of DM (e.g., drug induced or DM due to other endocrine diseases such
as Cushing’s’ disease). Type 1 DM (where the pancreas fails to produce enough insulin),
which was formerly known as "insulin-dependent diabetes mellitus" or "juvenile diabetes").
The condition can occur at any age but presents mainly in childhood and early adult life and
accounts for around 10% of all cases of diabetes. The main cause of type 1 diabetes is
autoimmune destruction of the islet beta cells of the pancreas. The etiology is complex and is
still not fully understood. The role of genetic predisposition in type 1 diabetes has not been
proven, but increased susceptibility to the disease may be inherited. Environmental factors
may trigger the auto-immune response in predisposed individuals. With type 1 diabetes insulin
replacement is a necessity, a lack of insulin results in hyperglycemia and ketoacidosis
[International Diabetes Federation (IDF), 2014].

Turki Bafaraj “Economics of the diabetic foot: a cost-of-illness study in Saudi Arabia” ___________________________________________________________________________
19
Type 2 DM begins with insulin resistance, a condition in which cells fail to respond to
insulin properly. As the disease progresses a lack of insulin may also develop (World Health
Organization, 2014). (This form was previously referred to as "non-insulin-dependent DM" or
"adult-onset diabetes"), and the primary cause is excessive body weight and not enough
exercise. Type 2 diabetes is more common, and unlike type 1 diabetes, usually begins in
middle age or in the elderly, but can begin at any age. Type 2 diabetes accounts for 80% of
cases of diabetes. The cause of Type 2 diabetes is thought to be primarily due to resistance to
the action of insulin at its target cells. A genetic factor has also been implicated and many
patients have a family history of diabetes. The majority of people with type 2 diabetes are
obese as this in itself causes or aggravates insulin resistance. Unlike people with type 1
diabetes, people with type 2 diabetes produce insulin; however, the insulin their pancreas
secretes is either insufficient (reduced insulin production) to maintain normal blood glucose
levels or the body tissues is unable to recognize the insulin and utilize in cell metabolism
(insulin resistance) (Kumar, et al., 2005). Symptoms may be similar to those of type 1
diabetes, but are often less marked or absent. As a result, the disease may go undiagnosed for
several years, until complications have already arisen (World health Organization, 1999).
Impaired glucose tolerance (IGT) and impaired fasting glycaemia (IFG) are intermediate
conditions in the transition between normal blood glucose levels and diabetes (especially type
2), though the transition is not inevitable (World Health Organization, 2014).
The term “prediabetes” indicates a condition that occurs when a person’s blood
glucose levels are higher than normal but not high enough for a diagnosis of type 2 DM. Many
people destined to develop type 2 DM spend many years in a state of prediabetes (Afifi, et al.,
2015). The cutoff for considering prediabetes as described by the American Diabetes
Association (ADA) is ≥200 mg/dl (=11.1 mmol/l) with or without symptoms of diabetes, and
without regard to time of last meal (American Diabetes Association-AMA, 2003). As such,
IFG is considered a pre-diabetic state. The condition is associated with insulin resistance and
increased risk of cardiovascular pathology, although of lesser risk than impaired glucose
tolerance (IGT). There is a 50% risk over 10 years of progressing to overt diabetes. In fact,
many newly identified IFG patients progress to diabetes in less than three years (Nicolas, et
al., 2007). Further, IFG is also a risk factor for mortality (Barr, et al., 2007). "Type 3

Turki Bafaraj “Economics of the diabetic foot: a cost-of-illness study in Saudi Arabia” ___________________________________________________________________________
20
diabetes" has been suggested as a term for Alzheimer’s disease as the underlying processes
may involve insulin resistance by the brain (de la Monte, 2014).
2.1.3 Pathophysiology of Diabetes Mellitus
Carbohydrates are the front-line source for energy in the body. Glucose is a
“monosaccharide” (the simplest carbohydrates form; also called single sugar) hexose (6-
carbon atom sugar molecule), which constitutes the most important source of carbohydrate
energy in human cells. (Monosaccharides are the building blocks from which all bigger
carbohydrates are made). Glucose is normally freely found in a concentration of an about
100mg/dl in the blood (Tawar, et al., 2016). Due to its small size and water solubility, glucose
molecules can pass through the cell membrane into the cell. Energy is released when glucose
molecules are metabolized (C6H12O6 + 6O2 6CO2 + 6H2O), (and this is part of the internal
cell respiration). Principally, it is insulin which is the hormone responsible for regulating the
uptake of glucose from blood into the body cells. Some tissues, particularly liver, muscle, and
adipose tissue have higher reliance on insulin with respect to the glucose regulatory process.
Therefore, deficiency of insulin or the diminished sensitivity of cell receptors to it plays a
central role in all forms of diabetes mellitus (American Diabetes Association, 2015). The
body maintains a continuous supply of glucose from three main places: the intestinal
absorption of food, the breakdown of glycogen (glycogenolysis), the storage form of glucose
found in the liver, and the generation of glucose from non-carbohydrate substrates in the body
(gluconeogenesis).
Insulin plays a key role in balancing glucose levels in the body. Insulin can inhibit the
breakdown of glycogen or the process of gluconeogenesis, it can stimulate the transport of
glucose into fat and muscle cells, and it can stimulate the storage of glucose in the form of
glycogen. (Dolores & Gardner, 2011). Insulin is released into the blood by beta cells (β-cells),
found in the islets of Langerhans in the pancreas, in response to rising levels of blood glucose,
typically after eating. Insulin is used by about two-thirds of the body’s cells to absorb glucose
from the blood for use as fuel, for conversion to other needed molecules, or for storage. Lower
glucose levels result in decreased insulin release from the beta cells and stimulates
glycogenolysis. This process is mainly controlled by hormone glucagon, which acts in the
opposite manner to insulin (Kim, et al., 2012). If the amount of insulin available is

Turki Bafaraj “Economics of the diabetic foot: a cost-of-illness study in Saudi Arabia” ___________________________________________________________________________
21
insufficient, if cells respond poorly to the effects of insulin (insulin insensitivity or insulin
resistance), or if the insulin itself is defective, then glucose will not be absorbed properly by
the body cells that require it, and it will not be stored appropriately in the liver and muscles.
The net effect is persistent hyperglycemia (high levels of blood glucose), poor protein
synthesis, and other metabolic derangements, such as acidosis (Dolores & Gardner, 2011).
When the glucose concentration in the blood remains high over time, the kidneys will reach a
threshold of reabsorption, and glucose will be excreted in the urine (glycosuria) (Murray, et
al., 2012). This increases the osmotic pressure of the urine and inhibits reabsorption of water
by the kidney, resulting in increased urine production (polyuria) and increased fluid loss. Lost
blood volume will be replaced osmotically from water held in body cells and other body
compartments, causing dehydration and increased thirst (polydipsia). All those processes
resulting from impaired insulin secretion and/or action mimic the pathologic mechanisms
occurring as part of the natural history of diabetes, (i.e., pathologic sequence when the disease
is not treated). The sequelae of chronic hyperglycemia in diabetes largely involves the
vascular bed, both small vessels and larger vessels. Small vessel insult (microvasculopathy)
affects tissues, namely eye, kidney, and nerves, ending up with blindness, renal failure, and
neuropathy, respectively. Larger vessels are also affected by time and drive to a peripheral
vascular disease (PVD) pathway leading to accelerated vessel injury (macrovasculopathy) (Al-
Rubeaan, et al., 2015; Boulton, et al., 2008). This type of vessel injury in turn leads to an
increased risk for myocardial infarction (MI), stroke, and lower limb amputation. In diabetic
vasculopathiesy, some biochemical pathways are abnormally hyper-activated [e.g., polyol
pathway flux, advanced glycation end-products (AGEs) formation, protein kinase C (PKC)
activation, and hexosamine pathway flux]. These enhanced pathways lead to an
overproduction of oxidants (“superoxide” by the mitochondrial electron transport chain). The
latter partially inhibits some glucose-utilization cycles (glycolysis) enzymes (e.g.,
glyceraldehyde-3-phosphate dehydrogenase- G3PH); decreased G3PH) leads to its limited
capacity to divert sustained substrate flux from glycolysis to pathways of glucose
overutilization, and thereby blood glucose build up) (Hammes, 2003). Preliminary
experimental evidence in vivo suggests that this new paradigm provides a novel basis for
research and drug development.

Turki Bafaraj “Economics of the diabetic foot: a cost-of-illness study in Saudi Arabia” ___________________________________________________________________________
22
2.1.4 Categories of Increased Risk for Diabetes (Prediabetes) Prediabetes is a practical and convenient term referring to IFG, IGT or a glycated
hemoglobin (A1C) of 6.0% to 6.4%, each of which places individuals at high risk of
developing diabetes and its complications (Canadian Diabetes Association, 20013). In 1997
and 2003, the Expert Committee on Diagnosis and Classification of Diabetes Mellitus (Expert
Committee, 1997). defined IFG as FPG levels 100–125 mg/dL (5.6–6.9 mmol/L) and IGT as
2-h PG after 75-g oral glucose tolerance (OGTT) levels 140–199 mg/dL (7.8–11.0 mmol/L). It
should be noted that the WHO and numerous diabetes organizations define the IFG cutoff at
110 mg/dL (6.1 mmol/L). As with the glucose measures, several prospective studies that used
A1C to predict the progression to diabetes demonstrated a strong, continuous association
between A1C and subsequent diabetes. In a systematic review of 44,203 individuals from
sixteen cohort studies with a follow-up interval averaging 5.6 years (range 2.8–12 years),
those with an A1C between 5.5–6.0% had a substantially increased risk of diabetes (5-year
incidence from 9 to 25%). An A1C range of 6.0–6.5% had a 5-year risk of developing diabetes
between 25–50% and a relative risk 20 times higher compared with an A1C of 5.0% (Zhang et
al., 2010). In a community-based study of African American and non-Hispanic white adults
without diabetes, baseline A1C was a stronger predictor of subsequent diabetes and
cardiovascular events than fasting glucose (Selvin, et al., 2010). Other analyses suggest that an
A1C of 5.7% is associated with a diabetes risk similar to that of the high-risk participants in
the Diabetes Prevention Program (DPP) (Ackermann, et al., 2011). Hence, it is reasonable to
consider an A1C range of 5.7–6.4% as identifying individuals with prediabetes. As with those
with IFG and/or IGT, individuals with an A1C of 5.7–6.4% should be informed of their
increased risk for diabetes and CVD and counseled about effective strategies to lower their
risks. Similar to glucose measurements, the continuum of risk is curvilinear, so as A1C rises,
the diabetes risk rises disproportionately (Zhang, et al., 2010). Aggressive interventions and
vigilant follow-up should be pursued for those considered at very high risk (e.g., those with
A1C .6.0%).
2.1.5 Signs and Symptoms of Diabetes Mellitus
The classic symptoms of untreated diabetes are weight loss, polyuria (increased
urination), polydipsia (increased thirst), and polyphagia (increased hunger). Symptoms may
Turki Bafaraj “Economics of the diabetic foot: a cost-of-illness study in Saudi Arabia” ___________________________________________________________________________
23
develop rapidly (weeks or months) in type 1 diabetes, while they usually develop much more
slowly and may be subtle or absent in type 2 DM. Several other signs and symptoms can mark
the onset of diabetes although they are not specific to the disease. In addition to the known
ones above, they include blurry vision, headache, fatigue, slow healing of cuts, and itchy skin.
Prolonged high blood glucose can cause glucose absorption in the lens of the eye, which leads
to changes in its shape, resulting in vision changes (Naidu, 2006). A number of skin rashes
that can occur in diabetes are collectively known as diabetic dermadromes (James, et al.,
2006).
2.2 Complications of Diabetes Mellitus
Uncontrolled diabetes leads to complications in many organs and tissues of human
body. All forms of diabetes increase the risk of long-term complications. These typically
develop after many years (10–20), but may be the first symptom in those who have otherwise
not received a diagnosis before that time. The major long-term complications relate to damage
to blood vessels (diabetic angiopathy) (Hammes, 2003). For instance, diabetes doubles the risk
of CVD and about 75% of deaths in diabetics are due to coronary artery disease (O'Gara, et al.,
2013). Other macrovascular diseases are stroke, and PVD of lower extremities, as addressed
elsewhere in this report (Al-Rubeaanet al., 2015; Boulton et al., 2008;). The primary
complications of diabetes due to damage in small blood vessels, include damage to the eye,
kidneys, and nerves. Damage to the eyes (diabetic retinopathy) is caused by damage to the
blood vessels in the retina of the eye, and can result in gradual vision loss and blindness
(World Health Organization, 2014). Damage to the kidneys (diabetic nephropathy) can lead to
renal scarring, proteinuria, and eventually chronic kidney disease, sometimes
requiring dialysis or kidney transplant. Damage to the nerves of the body (diabetic
neuropathy) is the most common complication of diabetes, too (World Health Organization,
2016). Symptoms include numbness, tingling, pain, and altered pain sensation, which
especially leads to damage to the skin. If the foot is inflected by such progressive skin damage,
a chain of events may find its way with the foot, including ulcer formation. The latter may be
difficult to treat until occasionally ends up with amputation (see later). Additionally, proximal
diabetic neuropathy causes painful muscle wasting and weakness.

Turki Bafaraj “Economics of the diabetic foot: a cost-of-illness study in Saudi Arabia” ___________________________________________________________________________
24
2.3 Diabetic Foot Disorders (DFDs)
Foot complications are among the most harmful and costly disorders diabetics may be
affected with (Al-Wahbi, et al., 2006; Tashkandi, et al., 2011). Estimates indicate that every
20 seconds a limb is lost to diabetes somewhere in the world. Particularly in the developing
world, it is associated with high morbidity and mortality rates (International Diabetes
Federation, 2014). The “term diabetic foot disorders” refers to a group of disorders which
clinically present with one or more of the following clinical manifestations: foot ulceration,
infection, neuropathy, deformity, gangrene and/or ischemia (Tashkandi, et al., 2011). All or
some of these clinical presentations may overlap in same patients and frequently affect the
feet. The annual incidence of diabetic foot ulceration varies between 2.1 to 7.4%, and the
lifetime risk of developing a diabetic foot ulcer has been estimated to be as high as 25%
(Alzahrani HA, et al., 2013). If not timely and properly managed, the ultimate endpoint of
diabetic foot ulcer is amputation in 15% – 27%. Furthermore, when amputation happens, it is
usually associated with significant morbidity and mortality in addition to immense emotional,
social, psychological and financial consequences (Al-Tawfiq, et al., 2009; Alzahrani, et al.,
2013; Boutoille, et al., 2008; Kalish & Hamdan, 2010;).
2.4 Pathophysiology of Diabetic Foot Disorders
Diabetic foot problems most often develop due to a combination of reasons and
mechanisms, important of which are peripheral neuropathy changes of the nerve supply to the
foot, augmented by ischemia (impoverished circulation) as a result of PVD due to the
macroangiopathic changes of the foot vasculature. Neuropathy and resulting parasthesia
(impaired sensations) is particularly dangerous as these patients are at great risk of painless
injury to their feet. However, neuropathy or PVD alone does not cause spontaneous ulceration
of the foot; mechanical factors coupled with these pathologies lead to ulceration. Extrinsic
ulceration is a result of trauma to the soft tissues from an extrinsic source such as tight fitting
footwear or a lack of cushioning. In contrast, intrinsic ulceration is a result of abnormalities in
the structure of the neuropathic foot which lead to deformities such as clawing of the lesser
digits that increases the pressure on the metatarsal heads and dorsal inter-phalangeal joints
(Green et al., 2002). This altered mechanics of the foot results in excessive pressures on the
exposed plantar aspect of the foot which when walking causes formation of callous that in

Turki Bafaraj “Economics of the diabetic foot: a cost-of-illness study in Saudi Arabia” ___________________________________________________________________________
25
itself may cause high pressure (Young et al., 1992), and ultimately leads to tissue damage and
ulceration (see Appendix E). Autonomic neuropathy can also lead to diabetic foot
complications as it causes reduced sweating. This results in dry skin that is prone to cracks and
fissures which then allows portal of entry for infection. The role of maintained hyperglycemia
in the causation of PVD and peripheral neuropathy in diabetes and hence accelerates foot
ulceration is evident. The DFDs vary in size and severity, ranging from superficial abrasions,
peeled dry skin, callus formation, and infection. Tissue breakdown together with poor healing
capacity of the injured tissue due to poor blood supply and diminished immune response can
turn quickly into an ulcer formation. And foot ulceration is one of the most distressing
complications of diabetes, the implication of which is witnessed daily within the clinical
setting (Reiber et al., 1998) defined foot ulceration as “A cutaneous erosion characterized by
a loss of epithelium that extends into or through the dermis to deeper tissues.” Foot infections
are the commonest cause of hospital admission in patients with diabetes and in many cases is
the cause of lower limb amputation. There is no compelling evidence that ulceration is directly
caused by infection. It is likely that once the skin surface has been breached the infection then
establishes.
2.5 The Saudi Healthcare System
Health care services in K.S.A. have been given a high priority by the government.
During the past few decades, health and health services have improved greatly in terms of
quantity and quality (Almalki, et al., 2011). The Saudi society spending on health comes from
four main sources: government-funded services, including ministry of health (MOH) auspices
which undertakes 59.5% of the service volume, other governmental health agencies which
undertakes 19.3% of the service volume, [including armed forces health services, security
forces medical services, health services in the Royal Commission premises, and health
services in the oil industry (run by the sole national oil industry owner in the country called
Arab American Oil Company - ARAMCO)] , and the private sector, which shares up to 21.2%
of the overall spending on health (Health Statistical Year Book, 2009). The health care
movement in Saudi Arabia sees a fast development in all health sectors, striving to catch up
with the updated international quality standards. In 2002, Gallagher stated:

Turki Bafaraj “Economics of the diabetic foot: a cost-of-illness study in Saudi Arabia” ___________________________________________________________________________
26
“Although many nations have seen sizable growth in their health care systems, probably no
other nation other than Saudi Arabia of large geographic expanse and population has, in
comparable time, achieved so much on a broad national scale with a relatively high level of
care made available to virtually all segments of the population).”
The Saudi health system is ranked 26th among 190 of the world’s health systems,
ranking before many international health systems such as Canada and other systems in the
region (World Health Organization, 2013b). As a result, health of the Saudi population has
markedly improved in recent decades. However, a number of issues remained challenging the
health system, such as shortage of Saudi health professionals, recently shrinking financial
resources, changing patterns of disease and the eruption of NCD epidemic of the time,
particularly obesity and diabetes. Meanwhile, the Saudi citizens have their high expectations
toward their government, demanding deployment of cutting edge technologies to cover up a
full spectrum of care for health services, all subsidized and free of charge. This perspective
puts clinicians, health professionals, and decision makers under pressure to live up to their
expectations and meet the people’s health demands, meanwhile contain cost and slow the
flowing drainage of resources in an all-out fee healthcare service.
2.5.1 Health insurance system in Saudi Arabia. Funding health services is becoming
a major challenge faced by the Saudi government. Since the total expenditure on public health
services comes from the government and the services are free-of-charge, this led to
considerable cost pressure on the government, particularly in view of the rapid growth in the
population, the high price of new technology and the growing awareness about health and
disease among the community. To meet the growing population demands for health care and
to ensure the quality of services provided, the Council for Cooperative Health Insurance
(CCHI) was established by the government in 1999. (Council of Health Services,
http://shc.gov.sa/En/default.htm). The main role of this Council is to regulate a health
insurance strategy for the Saudi health care market. The implementation of a cooperative
health insurance scheme was planned over three stages. In the first stage, cooperative health
insurance was applied for non-Saudis and Saudis in the private sector, in which their
employers have to pay for health cover costs. In the second stage, the cooperative health
insurance is to be applied for Saudis and non-Saudis working in the government sector. The

Turki Bafaraj “Economics of the diabetic foot: a cost-of-illness study in Saudi Arabia” ___________________________________________________________________________
27
government pays the cooperative health insurance costs for this category of employee. In the
third stage, the cooperative health insurance would be applied to employees of all companies
in Saudi Arabia, domestic workers, and other groups, such as pilgrims. (The implementation
of this phase is in progress). The first phase covered companies with 500 or more employees,
while the second phase applied to employers with more than 100 workers. (No information is
available yet regarding the cooperative health insurance scheme for the population of Saudi
Arabia other than employees and expatriates). While the market for cooperative health
insurance in Saudi Arabia started with only 1 company in 2004, it currently involves about 25
companies. The introduction of the scheme is intended to decrease the financial burden on
Saudi Arabia due to the costs associated with providing health services free of charge. It also
gives people more opportunity to choose the health services they require (Walston, et al.,
2008). The real challenge for policymakers in Saudi Arabia always remains is to introduce a
comprehensive, fair, and affordable service for the whole population.
2.5.2 Diabetes in Saudi Arabia. Within a changing economic environment in Saudi
Arabia, diabetes is a progressive challenge all stakeholders are facing. Figures on prevalence
rates and risks are alarming. Out of 35.4 million people who in 2015 had DM in the 19-
country “Middle East and North Africa” (MENA) region, almost 10% (n=3.4million) of them
where in Saudi Arabia. This diabetes population accounts over 17.5% of the adult (20-79
years) population in Saudi Arabia (International Diabetes Federation, 2015). The cost per
person with diabetes in the country mounts up to $1,145.3. Further, the number of
undiagnosed diabetics had been estimated at 1.2243 million; adding another dimension to the
challenge and raises resource issues, such as the need for more preventive support, screening
programs, health education, and innovative strategies to integrate these tactics into a common
diabetes management plan. Part of a broad community screening program to identify risks and
rates of some NCDs in Saudi, an enlisted population was interviewed and examined to
determine the prevalence rates of prediabetes and diabetes among this population stratum
(Afifi, et al., 2015). Afifi et al., indicated in that research that 21.4% of all screened persons
had random plasma glucose (RPG) ≥ 200 mg%, who were either uncontrolled diabetics (56%
of high RBG and 12% of the study population) or undiagnosed (prediabetic) (44% of high
RBG, and 9.4% of the study population). The participants had risk of high weight problems

Turki Bafaraj “Economics of the diabetic foot: a cost-of-illness study in Saudi Arabia” ___________________________________________________________________________
28
(mean BMI was 28.9 ± 4.1 kg/m2 = first degree obesity, 43.6% were overweight, and 41.8%
were obese). The study indicates that prediabetes and diabetes are prevalent in Saudi Arabia,
albeit between groups who supposedly should sustain a healthier fitness profile. A preventive
approach to control the diabetes-prediabetes problem was a top priority in this population
group, too.
The burden of diabetes upon the Saudi society is escalating; the more newly diagnosed
diabetes the more populations at risk for developing diabetic complications, including DFDs
(Al-Wakeel, et al., 2009). Knowledge and awareness about DM, its risk factors, complications
and management requirements are important aspects of a better control and a better QOL.
Saudi Arabia is at the heart of such region (MENA) which is already one of the highest rates
of diabetes, worldwide. The MENA diabetes problem is going to increase substantially over
the next few years, (e.g., from 32.8 million people in 2011 to 59.7 million people in 2030)
(International Diabetes Federation, 2015). The WHO expected that diabetes in Saudi Arabia
would grow 283% between 2000 and 2030, due to the changes in lifestyle and diet described
earlier leading to enhanced levels of obesity. Therefore, Saudi Arabia is the highest end of the
spectrum of diabetes prevalence in the MENA region with 21.8%. The diabetes problem is
more prevalent in urban Saudi (25.5%) compared to the rural (19.5%), same as commonly met
with other MENA populations. Despite the readily available access to healthcare facilities, a
large number of Saudi diabetics (27.9%) are unaware of having diabetes (Al-Nozha, et al.,
2015). Data from the Saudi National Diabetes Registry (SNDR) by Alrubean, et al. (2015)
were collected and analyzed to DFDs trends and risk factors among the Saudi populations. A
sample frame of anonymous 65,534 SNDR registered diabetics between 2000 till December
2012 was collected, out of which a cohort of 62,681 diabetic patients aged ≥25 years were
admitted to the study. Interestingly, the prevalence of DFDs in Saudi from this database
largely sets within what was reported internationally. For instance, the overall prevalence of
DFDs was estimated at 3.3%; 2.05% was foot ulcer and 1.14% was gangrene. Out of the total
2,071 registered DFD cases, 1285 (62.05%) had foot ulcers divided into 505 (39.30% of ulcers
and 24.4% of all DFDs) with past history of ulcer, and 780 (60.70% of ulcers and 75.6% of all
DFDs) with current ulcer. Further, 119 (5.75%) and 667 (32.20%) had foot gangrene and
amputation, respectively. Age, sex, and diabetes duration were consistently risk factors for
worse diagnoses. Moreover, DFDs were significantly associated with other chronic

Turki Bafaraj “Economics of the diabetic foot: a cost-of-illness study in Saudi Arabia” ___________________________________________________________________________
29
complications, especially neuropathy (61.98% of foot ulcer cases). Likewise,PVD contributed
to one third of foot ulcer development in the studied cohort, a finding which was similar to
what has been previously reported (Boulton, et al., 2008). More importantly, the ulcers were
responsible for more than 50% of the amputation cases. Peripheral neuropathy was one of the
strongest risk factors for all the foot complications amongst the studied cohort, with this
association also being significant in age and gender adjusted and multivariate logistic
regression models as having found in Danish and Saudi populations (Abolfotouh, et al., 2011;
Bruun, et al., 2013). This strong association of the PVD and peripheral neuropathy with DFDs
could reflect the high prevalence of peripheral nerve decompression to alleviate the probability
of DFDs in Saudi Arabia. Perhaps in support of this connotation is what has been reported that
33% of diabetic patients are suffering from chronic nerve compression (SharHashemi, et al.,
2013). In fact, this observation emphasizes the role of screening for lower extremities nerve
compression in diabetics and advocating, e.g., the surgical nerve decompression at lower
extremities. (This intervention has been recently proven to significantly prevent new ulcers
and amputations through improving nerve function and increasing microcirculation).
2.6 Economic Burden in Diabetic Foot Disorders
Diabetic foot is one of the most costly complications of diabetes. In 2007, the
treatment of diabetes and its complications in the U.S. involved at least $116 billion in direct
costs; at least 33% of these costs were linked to the treatment of foot ulcers (Driver, et al.,
2010). Therefore, diabetic foot complications result in large economic consequences, utilizing
up to 15% of healthcare spending in industrial economies, and as much as 40% spending in
developing countries. Diabetic foot individuals require more visits to healthcare facilities, and
when admitted to hospital for inpatient care or surgery they tend to stay longer (Alzahrani, et
al., 2013). In an Algerian study, nearly 80% of the financial expenditure on DFDs
management was on patients’ hospitalization (Lamri, et al., 2014). Diabetic foot complications
ending with lower extremity amputation, due mostly to limb ischemia have been major drivers
of diabetes-related direct health care costs. In the U.S.A. the direct costs of inpatient care and
prostheses for estimated 42,424 DFDs patients undergoing amputation totaled $1.65 billion in
annual total direct health care cost of DFDs (Davis et al, 2006). Ultimately, the high liability
for complications renders people with diagnosed diabetes to have medical expenditures almost

Turki Bafaraj “Economics of the diabetic foot: a cost-of-illness study in Saudi Arabia” ___________________________________________________________________________
30
2.3 times higher than those without diabetes (American Diabetes Association, 2007). Total
expenditure on diabetes, as well as DFDs includes direct and indirect costs. In the U.S.A. too,
indirect costs include increased absenteeism ($2.6 billion) and reduced productivity while at
work ($20.0 billion) for the employed population, reduced productivity for those not in the
labor force ($0.8 billion), unemployment from disease-related disability ($7.9 billion), and lost
productive capacity due to early mortality ($26.9 billion) (American Diabetes Association,
2007).
2.6.1 Cost of illness in DFDs. Cost of illness is a measurement tool used for economic
evaluation of a disease burden upon the patient, health system, and the society. So doing,
economists and researchers want to consider and prioritize financial, economic and social
inputs of interest to help develop healthcare policies aiming to minimize cost and disease
burden, and maximize saving and favorable social outcomes. Within the resourcing stream,
Jefferson et al. (2000) describes the economic nature of COI studies as that “they aim to
itemize, value, and sum the costs of a particular problem with the aim of giving an idea of its
economic burden." A basic assumption here is that COI represents the potential benefits of a
health care intervention if it had eradicated the illness. Thereby, COI analysis includes some
metric of “health loss” and it also attempts to measure the costs incurred, e.g., in treating
DFDs. The issue is that in economic decision making, “cost” should be considered, e.g., in
contrast with benefit [as in cost-benefit analysis (CBA)], with effectiveness [as cost-
effectiveness analysis (CEA)], with QALYs or latent utility assessment [as in cost-utility
analysis (CUA)]. Determining COI is eventually essential for selecting the most appropriate
intervention option, and then we become able to economically furnish appropriate required
resources, especially in the presence of budgetary constraints or shrinking resources many
healthcare environments are encountering (Jo, 2014).
Technically, several COI analysis methods are known; each can serve several certain
purposes. For instance, “cost estimates” may be used to argue if a disease should be given a
priority in the healthcare policy agenda; how much the society is “willing to pay” in medical
spending to obtain certain amount of social and economic savings. In comparison, disease
burden analysis counts on squeezing the postulated burden items into only the “number of
years of life lost” (YLL) due to premature death or the number of years lost due to disability

Turki Bafaraj “Economics of the diabetic foot: a cost-of-illness study in Saudi Arabia” ___________________________________________________________________________
31
(YLD). From the previous two health outcome measures, the concept of “disability-adjusted
life years” (DALYs) emerges, which involves costing of the disease management process,
e.g., in terms of lost economic or societal contribution as a result of disability. With the same
token, QALYs assesses the quantity of lost economic and societal contribution but due to
premature death from the disease under investigation.
2.6.1.1 Types of costs in DM and DFDs economic evaluation. In COI analysis, cost
is split into the traditional cost categories, direct – and – indirect costs. (The intangible costs
category is seldom applicable to COI due to controversies and difficulties in its quantification
and the weight they account).
2.6.1.1.1 Direct costs. All stakeholders of the healthcare process, including the individual
patient, family, society and the health system can be affected by direct cost accounting. Direct
costs also come from healthcare-related sources and non-healthcare related sources. As with
diabetic DFDs, direct costs include medical expenditures, (importantly, hospitalization,
physician office visits, prescription medications, laboratory works, surgeries, hypoglycemic
agents, insulins, disposables, devices, supplies, prosthetics, rehabilitation), and any other
expenditures going directly toward caring for the condition.
2.6.1.1.2 Indirect cost. Indirect costs in COI of DFDs mostly refer to productivity losses due
to morbidity and mortality, borne by the individual, family, society, or the employer,
(compared to supporting and overhead activities shared among the users in non-healthcare
businesses). Other indirect costs include cost of ambulatory or home care and rehabilitation.
Traditionally, there is little literature on the non-health related costs of DM or its
complications, but targeted literature searches could identify some data that had been used to
provide some estimates (Hex, et al., 2012). A number of methods for calculating indirect costs
in healthcare economics are known. These include: a) human capital method (HCM), b)
friction cost method (FCM), and c) willingness to pay method (WTP). The HCM is based on
recognizing human as one of the production inputs that can generate additional values by
employing it into a production process (van den Hout, 2010), whereas FCM estimates the
value of human productivity when another person (from the unemployment pool) replaces the
present value of a worker’s future earnings until the incapacitated worker returns or is
eventually replaced. In other words, HCM takes the patient’s perspective and counts any hour

Turki Bafaraj “Economics of the diabetic foot: a cost-of-illness study in Saudi Arabia” ___________________________________________________________________________
32
not worked as an hour lost, and FCM takes the employer’s perspective, and only counts as lost
those hours not worked until another employee takes over the patient’s work. The WTP
method measures the amount that an individual is eager to pay in order to reduce the
probability of illness or mortality (Hodgson & Meiner, 1982). Each one of these method has
its own advantages and disadvantages; usages and eventual criticism. Detailed information
about how these methods work, how to calculate, and technical differences between them are
beyond the scope of this work. However, generally, HCM is criticized that because it depends
on current socioeconomic status, certain groups are assigned a higher value than others, which
may cause a statistical bias that leads to spurious estimation results (Hodgson & Meiner,
1982). The WTP approach is thought to be giving higher estimates of the value of life than the
HCM attempts to ameliorate these problems. The FCM approach is favored over HCM by
some for overvaluing the indirect costs, claiming that the productivity losses are often
eliminated after a new employee is well-trained enough to replace the former sick one.
However many claim that the FCM itself is rarely used because it requires extensive data to
estimate only the losses during the friction period (Rothermich & Pathak, 1999).
2.6.1.2 Calculating COI. Computing for COI to describe and analyze the desired
economic consequence of DFDs, a clear discrimination between costs associated with DM
itself and costs related to the studied foot complication should be established. Naturally, no
such distinction can always be made because often the same medication, laboratory test or
procedure used in routine follow up of DM might have to be utilized to evaluate the degree
and severity of the diabetic foot problem studied (Tennvall & Apelqvist, 2004). The same
discrimination must be done to verify costs referable to the studied foot complication and
other types of DM complications. This differentiation is especially important in the use of
secondary data sources. For instance, one recent Swedish study showed that other conditions
were reported as the primary diagnosis in >80% of the discharges, when DFDs were actually
the main reason for inpatient treatment (Tennvall & Apelqvist, 2004). This demonstrates the
risk of underestimation of the costs of DFDs when analyses are based on primary diagnosis
from secondary data sources. Underestimation of costs for diabetes based on inpatient
statistics or secondary databases has been observed in the U.K., as well (Masson, et al., 2009).
This malpractice probably occurs in health care systems without a direct connection between

Turki Bafaraj “Economics of the diabetic foot: a cost-of-illness study in Saudi Arabia” ___________________________________________________________________________
33
the diagnosis and economic compensation and may be less likely to occur in such countries as
the U.S., where the reimbursement system provides incentives for more accurately coded
diagnoses.
In a retrospective study in Belarus (Kozhanova, et al., 2015), to describe costs and
outcomes pursuant to innovative techniques experimented to improve the health and economic
outcomes among DFD patients, the COI of diabetic foot ulcers and that of amputations were
compared. Both direct and indirect costs and also inpatient - and outpatient care financial data
were admitted. It was found that direct outpatient medical cost averaged $572 (78 - 636), and
indirect cost averaged $2604 (1042 – 4357), all per patient per year. Also, the cost of a major
amputation on average was $10976 (643 – 13,556) per hospitalization and $2404 (282 – 3702)
for a small amputation. Indirect cost averaged $368 (352 – 978) through the treatment duration
(Kozhanova, et al., 2015). These figures constitute a huge proportion of health spending;
probably why investing in exploring opportunities of expansive outpatient medical technology
use should be prioritized in enthusiastic DFDs care policies. Without careful COI assessment,
no valid conclusions about the value of adopting promising techniques for effective and
economic management of DM and its foot complications could have been made. Likewise,
high risk diabetics were studied in Peru (Cardenas, et al., 2015). to estimate the economic
costs of diabetic foot ulcers, and how they may be influenced by adopting secondary
prevention techniques (baseline care, standard care as per IDF recommendations, standard
care plus daily self-monitoring of foot temperature). The average direct cost per patient was
$5,153 for healing with a minor amputation and $7,360 for healing with a major amputation.
Healing with only debridement cost $1,022, and healing with outpatient visit was $79.
Ultimately, the implementation of a standard care strategy would avert 791 deaths and is cost-
saving in comparison to baseline care (Cardenas, et al., 2015). Regarding the total outcomes
averted and cost-effectiveness estimates modeled, the study it was concluded that the more
comprehensive the preventive strategy was the greater the number of deaths that were averted.
(Out of 1,757 predicted deaths from foot ulceration while on basic care, 791 would be averted
by standard care and 1,385 by standard care plus temperature monitoring strategy).

Turki Bafaraj “Economics of the diabetic foot: a cost-of-illness study in Saudi Arabia” ___________________________________________________________________________
34
2.7 Diagnosis of Diabetes Mellitus
The diagnosis of DM is readily entertained when a patient presents with classic
symptoms, i.e., polyuria, polydipsia, polyphagia, weight loss. Other symptoms that may
suggest hyperglycemia include blurred vision, lower extremity paresthesias, or yeast
infections, particularly balanitis in men (Khardori, 2016). However, many patients with type 2
diabetes are asymptomatic, and their disease remains undiagnosed for many years. In older
studies, the typical patient with type 2 diabetes had diabetes for at least 4-7 years at the time of
diagnosis. Among patients with type 2 diabetes, 25% had retinopathy; 9%, neuropathy; and
8%, nephropathy at the time of diagnosis (King, et al., 1999).
2.7.1 Basis for testing for diabetes in asymptomatic adults. According to the
American Diabetes Association (2015), testing to detect type 2 diabetes in asymptomatic
people and prediabetics should be considered in adults of any age who are overweight or
obese [body mass index (BMI) ≥25 kg/m2] and who have one or more additional risk factors
for diabetes. For all patients, particularly those who are overweight or obese, testing should
begin at age 45 years. If tests are normal, repeat testing carried out at a minimum of 3-year
intervals is reasonable. To test for diabetes, hemoglobin A1C (simply called A1C), FPG, and
2-h PG after 75-g OGTT are appropriate.
2.7.2 What are additional risk factors for testing asymptomatic adults for DM? As
above, overweight people should be tested for DM if they have additional risk factors
including: a) physical inactivity, b) first-degree relative with diabetes, c) high-risk
race/ethnicity (e.g., African American, Latino, Native American, Asian American), d) women
who delivered a baby weighing 0.9 lb or were diagnosed with GDM, e) hypertension (140/90
mmHg or on therapy for hypertension), f) HDL cholesterol level <35 mg/dL (0.90 mmol/L)
and/or a triglyceride level 0.250 mg/dL (2.82 mmol/L), g) women with polycystic ovary
syndrome, h) A1C 5.7%, IGT, or IFG on previous testing, i) other clinical conditions
associated with insulin resistance (e.g., severe obesity, acanthosis nigricans), j) history of
CVD (American Diabetes Association, 2015). Additional considerations regarding testing for
type 2 diabetes and prediabetes in asymptomatic patients include age which is a major risk
factor for diabetes. Testing should begin at age 45 years for all patients, particularly those who

Turki Bafaraj “Economics of the diabetic foot: a cost-of-illness study in Saudi Arabia” ___________________________________________________________________________
35
are overweight or obese. BMI and ethnicity testing should be considered in adults of any age
with BMI 25 kg/m2 and one or more additional risk factors for diabetes (Afifi, et al., 2015).
(However, recent data suggest that the BMI cut point should be lower, i.e., 23 kg/m2 for some
ethnic groups, e.g., Asian American population). Also some medications, such as
glucocorticoids, thiazide diuretics, and atypical antipsychotics (Erickson, et al., 2012) are risk
factors for diabetes and should be considered when ascertaining a diagnosis.
2.7.3 Diagnostic tests for DM. The A1C, FPG, and 2-h PG after 75-g OGTT are
appropriate for testing. It should be noted that the tests do not necessarily detect diabetes in the
same individuals. The efficacy of interventions for primary prevention of type 2 diabetes has
primarily been demonstrated among individuals with IGT, not for individuals with isolated
IFG or for those with prediabetes defined by A1C criteria. The appropriate interval between
tests is not known. The rationale for the 3-year interval is that with this interval, the number of
false-positive tests that require confirmatory testing will be reduced and individuals with false-
negative tests will be retested before substantial time elapses and complications develop
(Johnson & Tabaei, 2005). (That is why in determining risk measurement such as BMI cut
point in screening for diabetes, it is important to balance sensitivity and specificity so as to
provide a valuable screening tool without numerous false positives).
2.7.4 Community screening for detecting prediabetes and undiagnosed diabetes.
Diabetes and prediabetes meet criteria for conditions in which early detection is appropriate.
Both conditions are common and impose significant clinical and public health burdens. There
is often a long presymptomatic phase before the diagnosis of type 2 diabetes. Simple tests to
detect preclinical diabetes are readily available. The duration of glycemic burden is a strong
predictor of adverse outcomes. There are effective interventions that prevent progression from
prediabetes to diabetes and reduce the risk of diabetes complications. Approximately one-
quarter of people with diabetes in the U.S. are undiagnosed. Although screening of
asymptomatic individuals to identify those with prediabetes or diabetes might seem
reasonable, rigorous clinical trials to prove the effectiveness of such screening have not been
conducted and are unlikely to occur. A large European randomized controlled trial compared
the impact of screening for diabetes and intensive multifactorial intervention with that of

Turki Bafaraj “Economics of the diabetic foot: a cost-of-illness study in Saudi Arabia” ___________________________________________________________________________
36
screening and routine care (Griffin, et al., 2011). General practice patients between the ages of
40–69 years were screened for diabetes and randomized by practice to intensive treatment of
multiple risk factors or routine diabetes care. After 5.3 years of follow-up, CVD risk factors
were modestly but significantly improved with intensive treatment compared with routine
care, but the incidence of first CVD events or mortality was not significantly different between
the groups (Griffin, et al., 2011). The excellent care provided to patients in the routine care
group and the lack of an unscreened control arm limit our ability to prove that screening and
early intensive treatment impact outcomes. Mathematical modeling studies suggest that
screening, beginning at age 30 or 45 years and independent of risk factors, may be cost-
effective [<$11,000 per quality-adjusted life-year (QALY) gained] (Kahn, et al., 2010).
Ideally, testing should be carried out within a health care setting because of the need for
follow-up and treatment. Community testing outside a health care setting is not recommended
because people with positive tests may not seek, or have access to, appropriate follow-up
testing and care. Community testing may also be poorly targeted; i.e., it may fail to reach the
groups most at risk and inappropriately test those at very low risk or even those who have
already been diagnosed.
2.7.5 Criteria for diagnostic tests of hyperglycemic states. Diabetes mellitus is
characterized by recurrent or persistent high blood sugar, and is diagnosed by demonstrating
any one of the following: a) FPG level ≥ 7.0 mmol/l (126 mg/dl), b) PG ≥ 11.1 mmol/l
(200 mg/dl) two hours after a 75-g oral glucose load as in GTT, c) symptoms of high blood
sugar and casual plasma glucose ≥ 11.1 mmol/l (200 mg/dl), d) A1C ≥ 48 mmol/mol
(American Diabetes Association, 2010; World health organization, 1999). A positive result, in
the absence of unequivocal high blood sugar, should be confirmed by a repeat of any of the
above methods on a different day. It is preferable to measure a fasting glucose level because of
the ease of measurement and the considerable time commitment of formal glucose tolerance
testing, which takes two hours to complete and offers no prognostic advantage over the fasting
test.
According to the current definition, two fasting glucose measurements above
126 mg/dl (7.0 mmol/l) is considered diagnostic for diabetes mellitus; and people with FPG

Turki Bafaraj “Economics of the diabetic foot: a cost-of-illness study in Saudi Arabia” ___________________________________________________________________________
37
levels from 6.1 to 6.9 mmol/l (110 to 125 mg/dl) are considered to have IFG, people with PG
at or above 7.8 mmol/l (140 mg/dl) but not over 11.1 mmol/l (200 mg/dl) two hours after a
75 g oral glucose load are considered to have IGT (World health organization, 2006). Of the
two prediabetic states, the latter in particular is a major risk factor for progression to full-
blown diabetes mellitus, as well as CVD. Glycated hemoglobin is better than FPG for
determining risks of CVD and death from any cause (Selven, et al., 2010).
2.8 Risk Factors for Type 2 Diabetes
The risk of type 2 diabetes is determined by interplay of genetic and metabolic factors.
Ethnicity, family history of diabetes and previous gestational combine with older age, obesity,
unhealthy diet, physical inactivity, and smoking increase the disease risk (Global Burden
Disease Risk Factor Collaborators, 2015). Excess body fat, a summary measure of several
aspects of diet and physical activity, is the strongest risk factor for type 2 diabetes both in
terms of clearest evidence base and largest relative risk. Overweight and obesity, together with
physical inactivity, are estimated to cause a large proportion of the global diabetes burden.
Especially higher waist circumference and higher BMI are associated with increased risk of
type 2 diabetes (Afifi, et al., 2015; Hu, et al., 2001), though the relationship may vary in
different populations. Populations in South-East Asia, for example, develop diabetes at a
lower level of BMI than populations of European origin. Several dietary practices are linked to
unhealthy body weight and/or type 2 diabetes risk, including high intake of saturated fatty
acids, high total fat intake and inadequate consumption of dietary fiber.
2.9 Prevention of DM
Even in presence of a genetic background for DM, the development to an overt disease
can largely be prevented, (however, there is no known preventive measure for type 1
diabetes). Type 2 diabetes can be prevented by maintaining a normal body weight, engaging in
physical exercise, and consuming a healthful diet. Evidently, a well-managed and complied
with prevention plan adjusted to identify and abolish such risk factors in susceptible
candidates can postpone diabetes mellitus (Afifi, et al., 2015, Alrubean, e al., 2015). Data from
the Nurses’ health study suggest that 90% of type 2 diabetes in women can be attributed to
five such factors: excess weight, lack of exercise, a less-than-healthy diet, smoking, and

Turki Bafaraj “Economics of the diabetic foot: a cost-of-illness study in Saudi Arabia” ___________________________________________________________________________
38
abstaining from alcohol (Hu, et al., 2001). Dietary changes known to be effective in helping to
prevent diabetes include maintaining a diet rich in whole grains and fiber, and choosing good
fats, such as the polyunsaturated fats found in nuts, vegetable oils, and fish. The “Diabetes
Prevention Program” examined the effect of weight loss and increased exercise on the
development of type 2 diabetes among men and women with high blood sugar readings that
had not yet crossed the line to diabetes. In the group assigned to weight loss and exercise,
there were 58% fewer cases of diabetes after almost three years than in the group assigned to
usual care. Even after the program to promote lifestyle changes ended, the benefits persisted.
Active smoking is also associated with an increased risk of diabetes, so smoking cessation can
be an important preventive measure as well (Hu, et al., 2001).
2.10 Management of DM
Diabetes mellitus is a chronic disease, for which there is no known cure except in very
specific situations. Management concentrates on keeping blood sugar levels as close to
normal, without causing low blood sugar. This can usually be accomplished with a healthy
diet, exercise, weight loss, and use of appropriate medications (insulin in the case of type 1
diabetes; oral medications, as well as possibly insulin, in type 2 diabetes). Learning about the
disease and actively participating in the treatment is important, since complications are far less
common and less severe in people who have well-managed blood sugar levels. The goal of
treatment is an HbA1C level of 6.5%, but should not be lower than that, and may be set
higher. Attention is also paid to other health problems that may accelerate the negative effects
of diabetes. These include smoking, elevated cholesterol levels, obesity, high blood pressure,
and lack of regular exercise. Specialized footwear is widely used to reduce the risk of
ulceration, or re-ulceration, in at-risk diabetic feet. Evidence for the efficacy of this remains
equivocal, however (Cavanagh, 2004).
2.10.1 Lifestyle. People with diabetes can benefit from education about the disease and
treatment, good nutrition to achieve a normal body weight, and exercise, with the goal of
keeping both short-term and long-term blood glucose levels within acceptable bounds (Adler,
et al., 2000). In addition, given the associated higher risks of cardiovascular disease, lifestyle
modifications are recommended to control blood pressure.

Turki Bafaraj “Economics of the diabetic foot: a cost-of-illness study in Saudi Arabia” ___________________________________________________________________________
39
2.10.2 Medications. There is a number of medications used to lower blood sugar
levels; some are available by mouth, such as metformin, and others are only via parenteral
route, such as glucagon-like peptides 1 receptor (GLP-1) agonists. Type 1 diabetes can only be
treated with insulin, typically with a combination of regular and NPH insulin, or
synthetic insulin analogs. Metformin is generally recommended as a first line treatment for
type 2 diabetes, as there is good evidence that it decreases mortality (Ripsin, et al., 2009). It
works by decreasing the liver’s production of glucose. Several other oral hypoglycemic
medications include agents that increase insulin release, agents that decrease absorption of
sugar from the intestines, and agents that make the body more sensitive to insulin. If insulin
would be needed in type 2 diabetes, a long-acting formulation is usually added initially, while
continuing oral medications. Doses of insulin are then increased to yield the desired effect
(Ripsin, et al., 2009). Since CVD is a serious complication associated with diabetes, blood
pressure levels below 130/80 mmHg may be advisable (Kumar, et al., 2005). Also,
among medications that lower blood pressure, angiotensin converting enzyme
inhibitors (ACEIs) improve outcomes in those with DM while the similar
medications angiotensin receptor blockers (ARBs) do not (Cheng, et al., 2014).
2.10.3 Surgery. A pancreas transplant is occasionally considered for people with
type 1 diabetes who have severe complications of their disease, including renal
failure requiring kidney transplantation. Weight loss surgery in those with obesity and type 2
diabetes is often an effective measure. Many are able to maintain normal blood sugar levels
with little or no medications following surgery and long-term mortality is decreased
(Schulman, et al., 2009).
2.10.4 Support. In countries using a general practitioner (GP) system, care may take
place mainly outside hospitals, with hospital-based specialist care used only in case of
complications or difficult blood sugar control (Polisena, et al., 2009). In other circumstances,
GP and specialists share care in a team approach. Home “telehealth” support can be an
effective management technique.

Turki Bafaraj “Economics of the diabetic foot: a cost-of-illness study in Saudi Arabia” ___________________________________________________________________________
40
3. Methods
3.1 Study Setting
This study was conducted in Jeddah; K.S.A. Jeddah is a coastal city on the western
bank of the Red sea in the western region of the KSA. The city has around 3.4 million
populations, representing almost 13% of the total population of the kingdom (which is
estimated at 27,136,977: 18,707,576 Saudi nationals and 8,429,401 non-nationals, as in 2010
census, with a national growth rate around 1.49%), (Saudi Arabia Population Clock). Over the
last few decades, Jeddah has grown progressively until it became second largest city in the
country and center for money and business, and a major port for exporting non-oil related
goods, as well as importing domestic needs in the country. Jeddah is also considered the
touristic capital of Saudi Arabia especially that it is the main gateway for millions of
pilgrimages and visitors from all over the world to the Islamic holy cities Mecca and Medina.
The commercial and diversified nature of Jeddah gives room for private health care business
for a shared responsibility of community health in a rivalry-motivated environment, which can
be positively reflected upon the clienteles and the providers. Further, business organizations in
Jeddah compete in retaining good human resources base through securing health insurance for
staff and their families [Council of Cooperative health Insurance (CCHI), 2016]. The critical
nature of the disease under study, DM, necessitated resorting to a reliable source of health and
economic information in order to assure highest degree of validity and representativeness of
the study results to the general population. Our systematic search in the health insurance
marketplace in Jeddah led to a short list of reputed health insurance rivals. Bupa Arabia (BA)
(http://www.bupa.com.sa), a division of the international Bupa group, is one of the largest
health insurance corporations working in Saudi Arabia, since 1997. Official information
shows that over 3 million members are enrolled with this company up to date.
3.2 Study Design
As per the study plan, diabetic patients’ information congruent with the study
objectives would be outreached. Accordingly, BA had been selected and to whom the research
idea was conveyed, aiming to gain access to patient information which would serve the study
goal. A medical liaison from BA was assigned to cooperate in providing the dataset permitted
to us by the company’s authority. Patient records with type 2 diabetes mellitus since 2007 or

Turki Bafaraj “Economics of the diabetic foot: a cost-of-illness study in Saudi Arabia” ___________________________________________________________________________
41
earlier have been identified. Out of these records, patients who show history of DFDs and
were reimbursed for any DFDs care during 2015 were reviewed. Authorization to access
patient data with specific restrictions and fulfilling a series of confidentiality requirements on
the part of patients and BA had to be acknowledged and applied.
3.2.1 The study participants. According to the study design, a subject is labeled as
“type 2 diabetes mellitus” if she or he met the International Classification-9- Coding Manual
(ICD-9-CM) criteria for type 2 DM diagnosis (ICD-9-CM, 2011), ICD-9: 250.00 refers to
diabetes mellitus without mention of complication. As per ICD-9, any disease is given a 5-
digit number, the last pair of digits of which is left for complication coding. For instance,
250.70 is the code given to type 2 DM with peripheral circulatory disorders not stated as
uncontrolled and 250.72 is the code given to type 2 DM with peripheral circulatory disorders
stated uncontrolled, and so forth. (ICD-9-CM 250.80 is a billable medical code that can be
used to indicate a diagnosis on a reimbursement claim. (However, 250.80 should only be used
for claims with a date of service on or before September 30, 2015; and for claims with a date
of service on or after October 1, 2015, ICD-10-CM code equivalent can be used). (See
Appendix-B for DM ICD-9 coding).
According to ICD-9-CM, DFDs are coded as 250.00 which implies either diabetes with
other specified manifestations, type II or unspecified type, diabetes not stated as uncontrolled
plus codes for systemic diseases compatible with the DFDs. [Diabetic foot disorder include,
ulcer of heel and mid foot include carbuncle and furuncle of foot, heel, toe (680.7), cellulitis
and abscess of toe (681.1), cellulitis or abscess of foot(707.14), chronic osteomyelitis of ankle
and foot (730.17), unspecified infection of bone of ankle and foot (730.97), atherosclerosis of
the extremities with ulceration (440.23)]. (See Appendix B). The insurer uses industry
standard codes developed by “Clinical Coding & Schedule Development Group” (CCSD)
(CCSD, http://www.ccsd.org.uk/), which contain codes for produces guidance to enable
accurate coding of clinical activity in independent healthcare. Each ICD-9 diagnosis code of
participants and its CCSD equivalent used by BA were matched for accurate admission to the
study. (See Appendix C).
Cost information was based on the reimbursement schedules provided by BA and
according to the billing and reimbursement system in action the time of the study. The insurer

Turki Bafaraj “Economics of the diabetic foot: a cost-of-illness study in Saudi Arabia” ___________________________________________________________________________
42
uses a billing system which utilizes electronic submission of invoices for accurate
reimbursement. [The system is derived from the original International Classification of health
Interventions-ICHI- coding system (ICD-9-CM, 2011)], (Reimbursement policy information is
displayed in Appendix C).
3.2.2 Inclusion criteria. Patients included in the study if they fulfilled ICD-9-CM
diagnosis of type 2 DM, has been enrolled with BA and developed and received medical and /
or surgical care for any DFDs which have been reimbursed for during 2015. As such, only
direct costs for the DFD incidents covered from 2015 budget was analyzed. Patients should
also be adults who stay in Jeddah, as the place of permanent residence the time of the study.
Otherwise, no patient would be excluded from the study because of sex, marital status,
socioeconomic status or underlying health condition. Also all types of insurance policies were
allowed, whether part of a group insurance policy by the employer or individual and private
insurance policies.
3.3 Sampling Technique and Sample Size
A sample frame containing enrollees diagnosed with diabetes and who had developed
any DFD episode which was reimbursed in 2015 were identified. A quota sample of 60
patients had been permitted by BA to be included in the study.
3.4 Data Collection
A data collection form was predesigned by this researcher in order to administer the
required patient information. (See in Appendix A; spreadsheet). The form includes five major
fields, case and disease coding, demographic, clinical and procedural, as well as direct cost
data fields. At the beginning of this project, there was a sincere desire to gather a full scope of
demographic and clinical information to be used as potential risks of a hypothesized influence
on the development of DFDs in the study participants. However, restrictions imposed on
information pertinent with the patients’ socioeconomic status, education, underlying health
status and comorbidities, and also health care costs during enrollment other than those for
DFDs reimbursed in 2015 were not given. The rationale by BA was not to jeopardize patients’
confidentiality and not to breach the company’s billing and financial secrecy policy.

Turki Bafaraj “Economics of the diabetic foot: a cost-of-illness study in Saudi Arabia” ___________________________________________________________________________
43
3.5 The Study Variables
Demographic variables include age in years [an interval ratio scale (IRS) variable], sex
(male or female), and nationality (Saudi or non-Saudi), both of which are dichotomous.
Clinical variables include types of diabetic foot complication, as well as the specific medical
and/or surgical intervention applied to each condition. Intervention data consist of five
categories: a) conservative only, b) debridement, c) minor amputation, and d) major
amputation. (Appendix A). Eventually, two sets of risk variables are studied, demographic
criteria and intervention type. The terms “risk factor”, “risk”, “input“, “correlate” “dependent
variable”, all can be used exchangeable for these risk variables above. Cost data (expressed
here as an IRS variable) indicate cost of DFDs illness per diabetic foot disorder incident each
participant had encountered and led to one of the treatment procedures described above. The
COI accounting was based on the following financial information:
a) Subtotal direct medical costs, such as doctor’s fee, outpatient visits, medicines,
devices, hospital stay, and surgery.
b) Subtotal non-medical costs, such as transportation, communications, extra
accommodation or room accommodation and the likes.
c) COI = subtotal direct medical/surgical costs + subtotal direct medical/surgical costs,
less deducible and copayment, (i.e., deductibles and copayment are not included in
COI); all in Saudi Riyal (approximate transfer rate: $0.267).
NB. Indirect costs, such as employee time, rehabilitation or home care costs all were not
included in the study, since they are not covered by the insurance plan. Also, extra medical
charges paid at the patient’s expense or outside the insurance plan were not be included.
Eventually, two outcome (dependent) variables would be deployed for this study, type
of intervention (an intermediary outcome), and COI as the final outcome of interest.
3.6 Statistical Analysis
First, obtained data were entered into a Microsoft system with adequate back up.
Statistical analysis included both descriptive statics and analytical statistics. For instance, IRS
variables, such as COI and age would be described in terms of the mean ± standard deviation
(SD) or the median ± interquartile range (IQR), where appropriate. [Selecting either the mean
or the median as a most appropriate measure of central tendency depends on assumptions

Turki Bafaraj “Economics of the diabetic foot: a cost-of-illness study in Saudi Arabia” ___________________________________________________________________________
44
relevant to parametric techniques (PMTs), important of which are normality and sample size].
Categorical variables, such as sex and nationality would be described in count and percentage.
As far as inferential statistics, the influence of the study correlates, e.g., the difference in the
level of COI among the study’s gender groups could be measured using student t- test, or
Mann Whitney-U test, where appropriate (i.e., based on normality distribution of COI
variable, as well as other PMT assumptions, as applicable). Likewise, the influence of the type
of intervention upon COI may be measured using one-way analysis of variance (ANOVA) test
or its nonparametric alternative Kruskal Wallis test, where appropriate (based on PMT
assumptions fulfillment). Importantly, normality of the study’s interval scale data could be
assessed using one of the normality measuring techniques, such as the one-ample Kolmogorov
Smirnov (K-S) test. In this research we tended as a rule in analyzing the impact of the study
correlates on the study outcomes to run both PMT and non-PMTs for the same relationship.
Should there was a difference in the significance result between the two approaches the non-
PMT would be prioritized (not to violate the normality assumption for PMT calculation). If
the two approaches yielded significant results, PMT could be adopted and safely discussed.
[This strategy, for instance applies to t-test vs. Mann-Whitney-U test, ANOVA vs. Kruskal
Wallis test, linear regression vs. logistic regression analyses, and Pearson correlation vs.
Spearman rho techniques (see later)]. Also, the association between any of the demographic
categorical variables such as nationality and the type of DFD intervention could be assessed
using chi square test of independence, and either Pearson chi-square or Fisher’s exact test for
significance, where appropriate. (The latter is used if ≥25% of cells in cross-tabulation
contains less than 5 expected count). In case we wished to measure the relationship between
age and COI (both are IRS continuous variables), correlation analysis could be calculated.
(Both Pearson’s correlation and Spearman rho would be calculated, according to the
PMT/non-PMT testing policy above, and either of them is selected for display, where
appropriate). Finally, a model to predict the probability of the change in the dependent
variable “COI” as a result of a unit change in each predictor would be constructed. (Both
multivariate linear regression and logistic regression analysis would be tried, as per the
PMT/non-PMT policy). In case COI was skewed, the differences in the levels of COI among
sex, nationality, and intervention groups would be attempted both utilizing PMT and non-
PMTs alternatives, as above. Also COI may be transformed into a binary variable, namely

Turki Bafaraj “Economics of the diabetic foot: a cost-of-illness study in Saudi Arabia” ___________________________________________________________________________
45
SR<35,000 and ≥SR35,000 to calculate the logistic regression test of interest. The statistical
analysis plan would be set forth so that the influence of the independent variables may be
tested both upon the type of intervention and COI. Intervention, as an intermediary variable
may be tested against COI as the final outcome variable. Eventually, two phases of statistical
analyses would be conducted; each encompasses a set of tests. In the first phase, we will
measure the effect of selected study determinants upon the type of intervention. In the second
phase, the effect of selected determinants as well as the type of intervention upon COI will be
measured. The study findings would be displayed summarized as tables and graph charts, such
as histograms, bar graphs or pie charts, as appropriate. Besides, a brief narrative comment
opposite each finding would be added. The Statistical package for social sciences version 18
(SPSS Inc., Chicago, IL, USA) was used in the analysis. Our tolerable alpha error is 0.05 and
results with p-value <0.05 would be considered significant. Also the 95% confidence interval
(CI) of the odds ratio (OR) may be used to assess the significance of the strength of
association between risks and dependent variables measured by OR as in chi square or
regression analysis tests.
3.7 Ethical Considerations
Early in this work, it was quite expected to face difficulty in gaining access to patient
records, especially in a disease such as DM. This disease condition implies many personal and
moral concerns to individual patients, and thereby it was well-understood to abide by
confidentiality standards applicable to the selected data source, such as the selected insurance
agency. Especially the latter holds high accountability and liability for personal information
confidentiality. It was also understood that only anonymous patient data may be accessed and
utmost insured information confidentiality ascertained. On our part, we declared and
acknowledged before the insurer that the obtained information would remain anonymous by
de-personalizing names and places in the transcriptions and ascertained that only grouped
information would be disclosed to the public at scientific and research settings.

Turki Bafaraj “Economics of the diabetic foot: a cost-of-illness study in Saudi Arabia” ___________________________________________________________________________
46
3.8 The Role of the Researcher
The idea of this research arose from the desire of this researcher to apply some
valuable public health and health economics expertise acquired while in direct contact with
renowned public health sources in Germany and Europe to the quest of healthcare of Saudi
Arabia. Diabetes in particular was selected to study because of the tremendous impact upon
the Saudi Arabia, homeland for this investigator. During medical training in Saudi Arabia
before joining the master program of public health in Hamburg University, this researcher
realized the enormous burden of diabetes, especially associated with underlying comorbidities,
such as obesity and unhealthy nutritional habits widespread in today’s Saudi community.
Thereby, there was a wish to address diabetes from the angle of one of its severest
complications, which is DFDs. Thereby, this researcher was adamant to tackle all possible
sources of DM and DFDs data and could conclude this research plan with one of the largest
and most reputed insurance agencies in the country.
This researcher has developed the study’s goal and objectives plan, bearing in mind
highlighting objectives that are reproducible and measurable, using the available set of data.
Handled by this researcher, too, but not limited to, were data entry, coding, preliminary
handling, and conducting thorough literature review from best evidence resources relevant to
the topic, interpretation and discussion of the research findings, timeline setting (see appendix
F), write-up formatting, referencing, appendix arrangement, and abstract transcription. Help
was sought with respect to the statistical analysis which needed more specialized experience,
particularly deciding about most appropriate statistical techniques.

Turki Bafaraj “Economics of the diabetic foot: a cost-of-illness study in Saudi Arabia” ___________________________________________________________________________
47
4. Results
4.1 Descriptive Statistics Results
(Table 1, Table 2, Figure 1a, Figure 1b, Figure 2, Figure 3)
Variable
Age (year)
Mean
Median
Mode
Range
25th percentile
75th Percentile
Interquartile Range (IQR)
57.28±2.65
58.00
60.00
13 (Min 47; Max 60)
56.00
59.00
3.00
COI (SR)
Mean
Median
Mode
Range
25th percentile
75th Percentile
Interquartile Range (IQR)
33622.08±26067.073
27817.50
9859
131527 (Min 9859; Max 141386)
14582.75
38916.00
24333.25
n %
Sex
Male 43 71.7
Female 17 28.3
Nationality
Saudi 48 80.00
Non-Saudi
12 20.00
Table 1 Descriptive Criteria of Study Group: Age, Sex, Nationality, COI (n = 60)
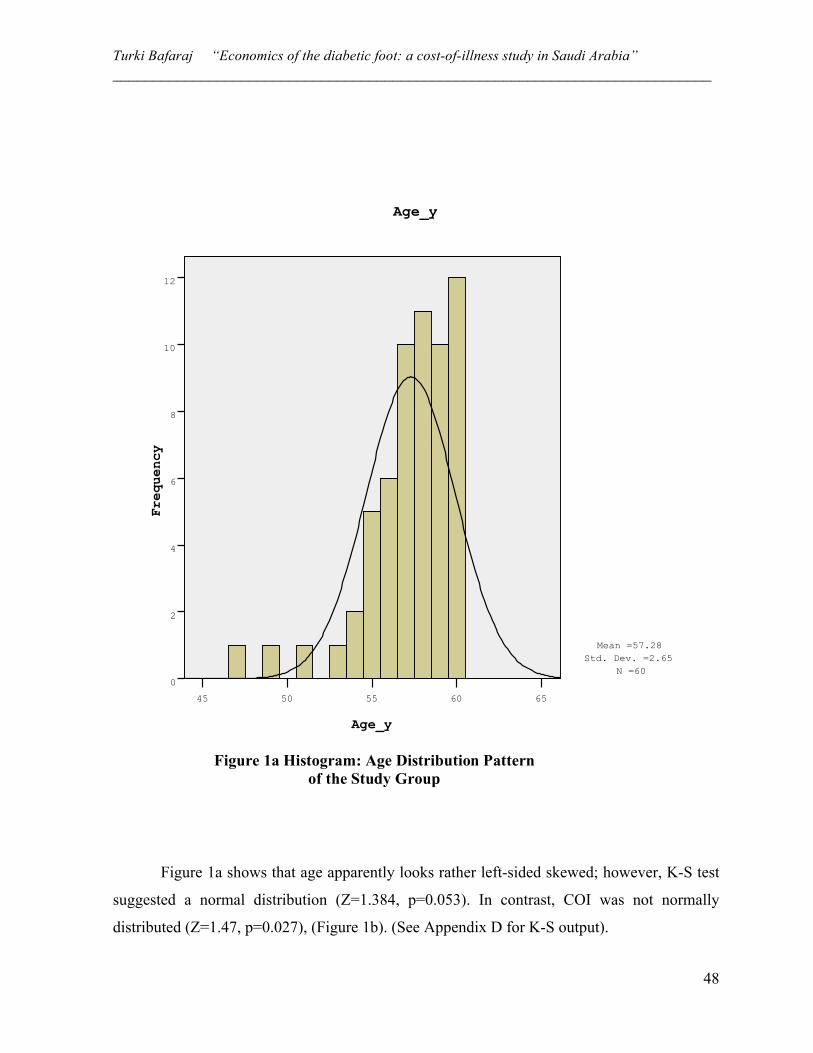
Turki Bafaraj “Economics of the diabetic foot: a cost-of-illness study in Saudi Arabia” ___________________________________________________________________________
48
Figure 1a shows that age apparently looks rather left-sided skewed; however, K-S test
suggested a normal distribution (Z=1.384, p=0.053). In contrast, COI was not normally
distributed (Z=1.47, p=0.027), (Figure 1b). (See Appendix D for K-S output).
Age_y
6560555045
Freq
uency
12
10
8
6
4
2
0
Age_y
Mean =57.28 Std. Dev. =2.65
N =60
Figure 1a Histogram: Age Distribution Pattern of the Study Group

Turki Bafaraj “Economics of the diabetic foot: a cost-of-illness study in Saudi Arabia” ___________________________________________________________________________
49
SR
140000120000100000800006000040000200000
Freq
uency
20
15
10
5
0
SR
Mean =33622.08 Std. Dev. =26067.073
N =60
Figure 1b Histogram: Cost of Illness (COI) Distribution Pattern of the Study Group

Turki Bafaraj “Economics of the diabetic foot: a cost-of-illness study in Saudi Arabia” ___________________________________________________________________________
50
Intervention N % Conservative treatment only 4 6.70 Debridement 26 43.3 Minor amputation 21 35.00 Major amputation 9 15.00 Total 60 100.00
Table 2 Distribution of the Study Group by Type of DFD Intervention (n = 60)
As in Table 2, the majority (43.3%, n=26) of the study group had debridement as the
first line of treatment for their DFD episode. Second to debridement was minor amputation in
the frequency of 21 (35%) incidents. Major amputations affected 15.0% (n=9) of the study
population. Least occurring was conservative treatment alone (6.7%, n=4 cases). (See also
Figure 3).
43 71.67%
17 28.33%
MF
Sex Distribution
Figure 2 Sex Distribution Pattern of the Study Group

Turki Bafaraj “Economics of the diabetic foot: a cost-of-illness study in Saudi Arabia” ___________________________________________________________________________
51
-----------------------------------------------------------------------------------------
4.2 Analytical Statistics Results
4.2.1 Phase 1: Influence of the Study Determinants upon Type of Intervention
Age category
Intervention Total Test statistic (p-value) (2-tailed)
n Conservative only
Debridement
Minor amputation
Major amputation
<55y
Count 2 (3.3%) 4 (6.7%) 0 (0.0%) 0 (0.0%) 6 (10.0%) Fisher’s exact =8.567 (p=0.011)
Expected 0.4 2.6 2.1 0.9 6.0 ≥55y
Count 2 (3.3%) 22 (36.7%) 21 (35.0%) 9 (15.0%) 54 (90.0%) Expected 3.6 23.4 18.9 8.1 54.0
Total 4 (6.7%) 26 (43.3%) 21 (35.0%) 9 (15.0%) 9 (15.0%) Table 3 Influence of Age upon the Prevalence of Specific DFDs Interventions:
Cross tabulation
21 35.00%
9 15.00%
26 43.33%
4 6.67%
Minor amputation
Major amputation
Debridement
Conservative only
Intervention Distribution
Figure 3 Intervention Options Distribution Pattern of the Study Group

Turki Bafaraj “Economics of the diabetic foot: a cost-of-illness study in Saudi Arabia” ___________________________________________________________________________
52
4.2.1.1 The relationship between age and type of intervention (Table 3, Figure 4).
As in Table 3, the effect of age (binary: <55y and ≥55y) was examined as a risk factor for the
type of intervention. a chi-square technique calculation shows that patients with DFDs who
were 55-years old or higher are significantly at greater risk of requiring lower extremity
amputation whether minor (35.0%) or major (15%) ones (Table 3). (See also Figure 4 for
comparative distribution). Among the non-amputation categories, diabetics ≥55 were also
more likely to need debridement (36.7%) compared to the <55y counterparts (6.7%); however
both age group did not differ in the need for frequency of conservative treatment alone
(Fisher’s exact 8.567, p=0.011).
Age Category
=>55y<55y
Coun
t
25
20
15
10
5
0
Intervention by Age
Minor amputation
Major amputation
Debridement
Conservative only
Intervention
Figure 4 Distribution of the study DFDs Intervention Groups by Age Category

Turki Bafaraj “Economics of the diabetic foot: a cost-of-illness study in Saudi Arabia” ___________________________________________________________________________
53
4.2.1.2 The relationship between sex and type of intervention (Table 4). In another
cross tabulation to evaluate the influence of sex upon the type of intervention, no significant
effect has been found (Fisher’s exact 0.427, p=0.968)), (Table 4).
Sex category
Intervention Total Test statistic
(p-value) (2-tailed) n
Conservative only
Debridement
Minor amputation
Major amputation
Male
Count 3 (5.0%) 19 (31.7%) 15 (25.0%) 6 (10.0%) 42 (71.7%) Fisher’s exact = 0.427 (p=0.968)
Expected 2.9 18.6 15.1 6.5 43 Female
Count 1 (1.7%) 7 (5.7%) 6 (10.0%) 3 (5.0%) 17 (28.3%) Expected 1.1 7.4 6.0 2.6 17.0
Total 4 (6.7%) 26 (43.3%) 21 (35.00%) 9 (15.9%) 9 (15.9%) Table 4 Influence of Sex upon the Prevalence of Specific DFDs Interventions:
Cross-tabulation ----------------------------------------------------------------------------------------------------------------------
4.2.1.3 The relationship between nationality and type of intervention
(Table 5, Figure 5).
Nationality
Intervention Total Test statistic
(p-value) (2-tailed) n
Conservative only
Debridement
Minor amputation
Major amputation
Saudi
Count 3 (5.0%) 15 (25.0%) 9 (15.0%) 20 (33.3%) 47 (78.3%) Fisher’s exact = 11.98 (p=0.004)
Expected 3.1 20.4 7.1 16.5 47.0 Non-Saudi
Count 1 (1.7.0%) 11 18.3(%) 0 (0.0%) 1 (1.7%) 13 (21.7%) Expected 0.9 5.6 2.0 4.6 13.0
Total 4 (6.7%) 31 (43.3%) 9 (15.0%) 21 (35.0%) 21 (35.0%) Table 5 Influence of Nationality upon the Prevalence of Specific DFDs Interventions:
Cross tabulation
Evaluating the relationship between nationality and type of intervention among our
DFDs group, chi-square testing showed that the prevalence of amputation incidents (both
major and minor) among Saudi diabetics significantly exceeds that among the non-Saudi
counterparts [33.3% vs. 1.7% major amputation, and 15.0% vs. 0.0% minor amputation,
respectively) (Table 5). The same trend is observed in regard to debridement and conservative
treatment [25.0% vs. 11.8%, and 5.0% vs. 1.7%, respectively], (Fisher’s exact 11.98, p=0.004)
(Table 5). (Also see Figure 5 for a comparative distribution).

Turki Bafaraj “Economics of the diabetic foot: a cost-of-illness study in Saudi Arabia” ___________________________________________________________________________
54
------------------------------------------------------------------------------------------------------------
4.2.2 Phase 2: Influence of the Study Determinants upon COI
4.2.2.1 The relationship between age and COI: correlation analysis. (Table 6)
Correlation COI (SR)
Age (y)
Pearson Correlation 0.333
p-value 0.009
n 60
Table 6 The Relationship between Age and COI: Correlations Analysis
Nationality
Non-SaudiSaudi
Coun
t20
15
10
5
0
Bar Chart
Major Amputation
MInor Amputation
Debridement
Conservative
Intervention
Figure 5 Distribution of the study DFDs Intervention Groups by Nationality: Saudi vs. Non-Saudi

Turki Bafaraj “Economics of the diabetic foot: a cost-of-illness study in Saudi Arabia” ___________________________________________________________________________
55
As in Table 6, there is a week (33.33%) but highly significantly correlation between
age and COI [r(df=58) =0.333, p=0.009]. [In a Spearman’s correlation test rho calculation,
correlation was as higher as moderate (Spearman’s rho= 0.467, p<0.0001]. (Appendix D). ---------------------------------------------------------------------------------------------------------------------- 4.2.2.2 The Relationship between sex and COI: student t-test. (Tables 7)
Levene's test (equality of Variances t-test for Equality of Means
95% CI of the difference
COI (SR)
F Sig. t df Sig. (2-tailed)
Mean Diff. SE Diff. Lower Upper
Equal variances assumed
0.122 0.728 0.075 58 0.941 562.78* 7531.83 -14513.8 15639.4
Equal variances not assumed
0.082 36.53 .935 562.78 6838.78 -13299.9 14425.5
* Mean COI male= 33462.63 (SD 27696.2). Mean COI female = 34028.4 (SD 22176.7) Table 7 The Relationship between Sex and COI: Two Independent Samples t-Test
In Table 7 above, the mean COI did not significantly differ between the two gender
groups (Mean COI male = SR33462.63± 27696.2, mean COI female = SR34025.41 ±22176.7)
(Table 8 footnote) (difference = SR562.78) (Table 8) [t(df = 0.075, p=0.941). ---------------------------------------------------------------------------------------------------------------------------
4.2.2.3 The relationship between nationality & COI: student t-test. (Tables 8)
Levene's test (equality of Variances t-test for Equality of Means
95% CI of the difference
COI
F Sig. t df
Sig. (2-tailed)
Mean Difference SE Diff. Lower Upper
Equal variances assumed
8.23 0.006 2.62 58 0.011 20383.2 7791.8 4786.1 35980.3
Equal variances not assumed
4.7 55.6 <0.0001 20383.2 4324.3 11719.1 29047.4
* Mean COI Saudi= SR38038.5 (SD 27781.7). Mean COI non-Saudi = SR17,655.2 (SD 5441.6) Table 8 The Relationship between Nationality and COI: Two Independent Samples t-Test

Turki Bafaraj “Economics of the diabetic foot: a cost-of-illness study in Saudi Arabia” ___________________________________________________________________________
56
In Table 8 above, the mean COI significantly differed between Saudi and non-Saudi
groups. Saudis incur average SR38038.5 (SD 27781.7) while non-Saudis incur average
SR17,655.2 (SD 5441.6) in COI (Table 8, footnote). The difference in the mean COI between
the two nationalities (SR20383.2) (Table 8) was statistically significant [t (df 55.6) = 4.7,
p<0.0001). (Mann-Whitney-U test also gave significant difference). (Appendix D). ---------------------------------------------------------------------------------------------------------------------- 4.2.2.4 The relationship between type of intervention and COI: one-way ANOVA.
(Tables 9a, 9b)
Intervention Category N Mean COI (SR) SD Std. error
95% CI of the difference Lower Upper
Conservative Only 4 10278.75 480.68 240.34 9513.88 11043.62 Debridement 26 17276.00 5396.72 1058.38 15096.22 19455.78 Minor amputation 21 35892.33 6109.51 1333.20 33111.32 38673.35 Major amputation 9 85921.67 24399.18 8133.06 67166.79 104676.54 Total 60 33622.08 26067.07 3365.25 26888.24 40355.92 Table 9a Difference in the Mean COI of the Four Intervention Group Options among the
Study Population: ANOVA Test
Sum of Squares df Mean square F p-value Between Groups 33852152781.167 3 11284050927.056
101.301
<0.0001 Within Groups 6237893043.417 56 111390947.204
Total 40090045824.583 59 Table 9b ANOVA Analysis: Mean Difference among DFDs Groups
As in Table 9b above, the mean COI increases gradually by the intensiveness of the
intervention procedure: The mean ± SD COI (SR) for the procedures are as follows:
conservative treatment only = 10278.75± 480.68; debridement = 17276.00± 5396.72; minor
amputation = 35892.33± 6109.51; and major amputation = 85921.67± 24399.18. The
difference in these means was statistically significant [F(df 3, 56)=101.301, p<0.0001]
(Table8b). A post-hoc test [least square difference (LSD)] was also conducted to measure the

Turki Bafaraj “Economics of the diabetic foot: a cost-of-illness study in Saudi Arabia” ___________________________________________________________________________
57
“within-groups” difference in COI. Most comparisons were significantly different. (See
Appendix D). (Kruskal Wallis test also gave significant difference). (Appendix D).
------------------------------------------------------------------------------------------- 4.2.2.5 Predicting the change in COI to changes in selected outputs (Table 10)
Independent variable B S.E. Wald df Sig. Exp (B)
95% CI for EXP (B) Lower Upper
Sex(1) ‒ 0.141 0.667 0.045 1 0.832 0.868 0.235 3.209 Age 0.596 0.210 8.003 1 0.005 1.814 1.201 2.740 Constant ‒ 35.221 12.262 8.250 1 0.004 0.000
Table 10 Predictability of Independent Variables Age and Sex on the Chnge in COI: Logistc Rgerssion Analysis
Near the end of the analysis, a multiple logistic regression model was fitted to measure
whether the selected independent variables could predict change in COI due to a unit change
in each independent variable. The COI was first modified as <SR35,000 and ≥SR35,000 as the
binary independent varlable for the model. In Table 9, the regression coefficint (B) for age is
positive 0.596. Exponent B for age (column 7, Table 9) is the odds ratio (OR) (which is anti-
log of B) of the impact of age upon COI. It indicates that a higher COI is 1.814 times
significantly more likely to be associated with higher age [ExpB=1.81, 95% confidence
interval (CI) 1.201 – 2.74]. Interpreting output Table 9, too, the fitted regression model for the
included variables would be constucted in the for of the following formula:
e‒ 35.221 + 0.596 (Age) ‒ 0.141 (Female)
[P/1 – P] Change in COI = ---------------------------------------------------------
1+e‒ 35.221 + 0.596 (Age) ‒ 0.141 (Female)

Turki Bafaraj “Economics of the diabetic foot: a cost-of-illness study in Saudi Arabia” ___________________________________________________________________________
58
5. Discussion
The cornerstone of mitigating diabetes complications and alleviate its burden is to
control blood glucose level and guard a higher than optimum glucose levels by all means and
under all circumstances. The longer the normalization of PG levels the farther postponement
of developing diabetic macrovasculopathy, neuropathy and impaired immune response to
infectious agents (Hammes, 2003; O'Gara, et al., 2013). These disorders endanger foot tissue
health and integrity and if not controlled DFDs of variable severity and implications are
precipitated (Macleod et al., 1996; Tashkandi, et al.,2011). Although many diabetics are at risk
of developing DFDs the exact estimate of DFDs and hence exact economic burden and COI
attributed to them are lacking, globally (Moxey, et al., 2011), and locally (Alzahrani, et al.,
2013).
5.1 Interpreting Demographic Findings in Relation to DFDs Intervention Outcome
We first found that both age and Saudi nationality were risk for a severer DFD
prognosis. On the other hand, sex had no influence upon our study outcomes. In Saudi Arabia,
too, Alrubean, et al. (2015) found that age, male sex, and diabetes duration were risk factors
for worse diabetes diagnoses. Alrubean and collaborates’ work was based on reviewing the
Saudi National Diabetes Registry (SNDR), whereas it was claimed that only a total 2,071 DFD
cases were registered with SNDR, and 32.20% of those who sustained worst diagnoses (ulcer
and gangrene) had major amputation. The amputation frequency in Alrubean, et al., also
closely compares to ours (35.0%). In our study we would be concerned about such high
amputation rate in a population who is fully covered and supposedly having access to good
medical care. Alrubean and colleagues’ finding that 2071 subjects with DFDs all through 2000
till 2012, raises another concern about DFDs situation in Saudi Arabia. Assuming the least
estimate of 3.3% DFDs in KSA, as in Alrubean et al., this should account to not less than
100,000 cases [considering 3.4 million with diabetes in KSA (International Diabetes
Federation, 2015) and that 90% of them are type 2 (International Diabetes Federation, 2014)].
The large difference in DFDs rates between the two reports warrants further inquiry about the
true reason for under-reporting diabetes disorders and the reluctance to administer DFDs
incidents in the SNDR.

Turki Bafaraj “Economics of the diabetic foot: a cost-of-illness study in Saudi Arabia” ___________________________________________________________________________
59
While between 15% and 35% of our DFD patients were victimized with amputation,
this rate also conforms to what has been speculated elsewhere that severer DFDs not timely
and properly managed might end up with amputation in 15%-27% of cases (Alzahrani, et al.,
2013). The issue is that Saudi Arabia envisions a progressive medical, strategic, and
administrative advance in health services (Almalki, et al., 2011; Walston, et al. 2008; World
Health Organization-WHO, 2013) including diabetes care capabilities. Therefore, the
discouraging DFDs outcome reported in our study perhaps fails our expectation of a better
outcome in a community that is well-served and driven by market economy such as Jeddah.
Many factors could be incriminated in our attempt to understand the mismatch between this
unfavorable health outcome and the reasonably good financial and health system inputs.
Little studies addressed the prevalence and risks of DFDs among Saudi Arabian
citizens (Alrubean, et al., 2015; Alzahrai, et al., 2013) in agreement with our instinct with this
regard. Instead, the prevalence of diabetes itself in Saudis compared with other nations has
been documented by many other studies (Afifi, et al., Al-Nozha, et al., 2015; Alrubean, et al.,
2015; Al-Wakeel, et al. 2009; IDF, 2015). Diabetes in Saudi Arabia reached 23.7% (Alwakeel,
et al., 2009) a proportion that is one of the highest not only in MENA zone but in the world
(Alwakeel, et al., 2009), and that is prone to grow to astronomical numbers, e.g., 283% by
2030, (International Diabetes Federation, 2015) if the Saudi diet style and physical inactivity
persist and no radical intervention plan has been enforced. In diabetes, early detection of
clinical and pathological risks for DFDs, namely vacuities, neuropathy and skin infection of
the foot, is critical (American Diabetes Association, 2015; Canadian Diabetes Association,
20013; Griffth, et al., 2010; Hammes, 2003; Khan, et al., 2010; Zhang, et al., 2010). These
pathologies frequently overlap in the same DFD episode and progress to resistant foot ulcer
and then amputation (Al-Rubeaan, et al., 2015; Boulton, et al., 2008). A radical strategy to
handle diabetes problem in Saudi should rest on prevention, early detection of prediabetes and
uncontrolled diabetes cases and continuous monitoring of A1C in known diabetics (Afifi, et
al., 2015). Especially the high risk, diabetics should be given specific consideration at family
medicine and primary healthcare setting. There should be also an emphasis on a combined
screening strategy for high risk groups, including the obese, less served communities, and the
low socioeconomic class (Ackermann, et al., 2011). Even the high socioeconomic class should
be considered in risk detection and prevention of DM. The two socioeconomic classes have

Turki Bafaraj “Economics of the diabetic foot: a cost-of-illness study in Saudi Arabia” ___________________________________________________________________________
60
reasons to an exaggerated diabetes opportunity. The unfortunates lack access health care both
in quantity and quality (Selvin, et al., 2010). The less educated may not have the enthusiasm
for health education and realizing its role in preventing chronic diseases that impact health,
survivability and QOL (Alzahrani, et al. 2013; American Diabetes Association- ADA, 2015;
Griffth, et al. 2011; Khan, et al., 2010; Moxey, et al., 2011; Tashkandi, et al. 2011; Wild et al.,
2004). The rich are often intimidated by easy life and often unhealthy diet (Jalboukh, 2008), as
well as technologies which bring the plenty of life utilities at their fingertips and persuade
physical inactivity.
5.2 Discussing COI Findings
I literature, the cost per person with diabetes in Saudi Arabia mounts up to $1,145.3
(IDF, 2015). This implies that the Saudi society spends over $15 billion on DM [$1145.3 * 3.4
million estimated diabetics, (IDF, 2015)], while the outcome, e.g., 15%-35% amputation as in
this study and 27.9% - 44% individuals with undiagnosed DM (Afifi, et al., 2015; Al-Nozha,
et al., 2015) does not live up to what was expected from such investment. The median COI for
DFDs care in our study was SR27,817.50 ($7,418 equivalent) (IQR= SR 24,333.25); the mean
COI was SR33,622.08 ± 26,067.073 (= $8965.9 ± 6951.2); and a range of SR131,527
(minimum SR9859 and maximum SR141,386). Data from a recent sample-based study on the
cost of DFD illnesses in Saudi Arabia by Alzahrani, et al. (2013) showed that the median COI
totaled SR12,819.5. The median COI of Alzahrani et al., is less than half that in our work.
Both Alzahrani et al., and our study share a common setting and some clinical criteria. For
instance, the two studies were conducted on Jeddah diabetic patients, and also the broad
clinical intervention categories were almost identical (conservative treatment alone,
debridement, minor amputation, major amputation). Other studies elsewhere on DFDs also
tended to use the same clinical intervention classification (Boulton, et al. 2005). According to
Alzahrani et al., study design, recruitment was limited to DFD patients upon a single hospital
admission to receive inpatient care for their stressing DFD condition. Further, the length of
hospital stay only averaged 9 days (compared to similar studies with longer hospital stay,
Benotmane, et al., 2008. In practice, however, patients with DFDs tend to require more
frequent emergency department visits and outpatient appointments, and probably other follow
up procedures in-between visits, Boulton, et al., 2005). Therefore, a larger-scale costing

Turki Bafaraj “Economics of the diabetic foot: a cost-of-illness study in Saudi Arabia” ___________________________________________________________________________
61
studies for DFDs not only included the immediate DFDs episode costs but other costs, such as
Benotmane, et al. (2008) and Boulton, et al. (2005) are often be required. Needless to say,
indirect cost items may also be calculated. However the estimation of these costs is not always
possible, especially in the presence of obstacles that limit the allocation of resources for a
comprehensive COI study. The frequency of debridement intervention in Alzahrani et al. and
us was highest among all DFDs procedures (48.8% vs. 43.3%) (See Appendix D for
comparative tables between the two studies developed by this researcher).
Findings from western DFDs costing research report variable median costs for DFDs
care. The trend was that lower limb amputations usually cost higher than non-surgical care.
The median cost in Australia for lower extremity amputation was A$12,485, (range 6,037-
24,415) (Davis, et al. 2006), i.e., compared to $9,288 – $20,569 median COI for minor
amputation and major amputation, respectively in our study) (see Appendix D for detailed
comparative COI Table). Highest among all, $32,129 is the median cost in admission for
ischemic limb ambulation in U.S.A. (Peacock, et al. 2008). The differences in study designs,
procedures, length of hospital stay, as well as the variability in health benefits and billing
systems alongside with the variability in each country’s economics and living expenses all can
cause variability in COI of DFDs care.
As in the type of intervention analyses, age and nationality were risks for incremental
COI. Comparable results have been reported by other COI in DFDs studies (Afifi, et al., 2015;
Alrubean, et al., 2015). Typically, diabetes complications develop after many years (10–20),
but may be the first symptom in those who have otherwise not received a diagnosis before that
time. As such, older diabetics are at greater risk of suffering a complicated disease
(Abulfotouh, et al., 2011; Alrubean, et al., 2015; Reiber, et al., 1998).
5.3 Discussing the Regression Analysis
Multiple linear regression analyses were first attepted and no significant predictibilities
by the entered predictots for the change in COI were found. Alternatively, logistic regression
would be conducted; in which case COI would be transformed into the binary dependent
variable for conducting the logistic regression technique. First a cutoff point at around the
median COI was selected (<SR60,000 and ≥60,000) but the model could not preict the change
in the COI. When the cutoff point was decreased gradually until 35,000, significant effect was

Turki Bafaraj “Economics of the diabetic foot: a cost-of-illness study in Saudi Arabia” ___________________________________________________________________________
62
obtained. Although type of DFDs care did impact the level of COI (ANOVA analysis), its
effect as a dummy variable on the change in COI was not significantly receognized wnen first
entered to the logistic model, thereby they were removed. Fnally, age only could predictor for
COI change. For instance, if a 60 year old (male) diabetic dveleoped DFDs (any type), the
probability for a change in COI because of age, (sex is not significant), will be:
e‒ 35.221 + 0.596 (60) ‒ 0.141 (Zero) 1.71 [P/1 – P] Change in COI = -------------------------------------------------- = ------- = 0.633
1+ e‒ 35.221 + 0.596 (60) ‒ 0.141 (Zero) 2.71
Abulfotouh, et al (2011) conducted a case-control study on 50 diabetic patients
attending outpatient diabetes clinic in King Abdulaziz Medical City (KAMC) in Riyadh, who
had DFD episodes between January 2009 and July 2010. The study methodology was based
on testing the impact of some predictors assembled in a multiple logistic regression model on
DFDs type and severity. Diabetic foot disorders studied included infection, ulceration,
neuropathy, and vascular insufficiency. Significant risk factors in individual chi-square tests
included male gender, age ≥40, illiteracy, DM durationn≥20y, peripheral neuropathy, PVD,
IHD, and erythrocyte sedimentation rate (ESR). Applying the logistic regression with the
presence of DF as the dependent variable, only neuropathy, DM duration and ESR were
significant predictors for DFDs. Other variables which were significant determinants on DFDs
development in separate chi square analyses were not significant predictors, in resemblance
with our findings profile.
A large-scale research from Denmark by Bruun and collaborates (2013) was conducted
to analyze the prevalence and determinants of diabetic foot ulcers and amputation rate in adult
diabetics observed over 19 years of disease diagnosis (at 6 year and 14 year observation
points). Age, gender, and co-morbidities were independent variables studied. Significant
predictors of any amputation were peripheral neuropathy (OR 2.09; 95% CI 1.19-3.69),
vasculopathy (OR 3.43; 95% CI 1.65-7.12), male gender (OR 2.40; 95% CI 1.31-4.41). Age in
women was risk of amputation, but men were at higher risk when they get DM at a younger
age. In other words, age here revolve around the number of years lived with diabetes until
DFDs has developed. For this very relationship, we were curious to invite to this study

Turki Bafaraj “Economics of the diabetic foot: a cost-of-illness study in Saudi Arabia” ___________________________________________________________________________
63
patients who had more eight years of enrollment with this insurer (since 2007), first to remove
the confounding effect of the difference in insurance package (e.g., health benefits, preferred
provider organization provision, billing and disease coding), and fluctuation on the quality of
the offered health service. Second, to incorporate disease duration issue in the study
background, which researchers now agreed on its role in provoking DFDs complications
(Abulfotouh, et al.. 2011; Alrubean, et al., 2015; Bruun, et al., 2013; Reiber, et al.. 1998).
With that in mind, we first tried to admit subjects with longer duration of enrollment with the
insurer (10-15y). However, this was not guaranteed owing to the relative newness of this
insurer in the Jeddah market (since 1997) and the restriction terms forced on release of patient
information to unauthorized persons or for research purpose.
5.4 Study Aims and Answering the Research Questions
The economic burden associated with DFDs in the study population could be
quantified using the dataset collected and analyzed. Results from this research, if related to the
scientific and healthcare policy maker community could be of an added value in understanding
and planning for improving DM the economic outcomes of diabetes and DFDs in Saudi
Arabia. Likewise, the research objectives have been achieved. For instance, the distribution
pattern of the study subjects’ demographic traits, as well as the prevalence of DFDs
intervention options have been identified and evaluated. The distribution pattern of these
DFDs reflects the severity of DFDs problem in the studied population, for further action by
interested healthcare planners. Specifically, the cost trends and levels linked to DFDs episodes
have been thoroughly examined and quantified.
The implications of the demographic and intervention correlates upon the COI have
been identified and measured and inferences from the studied relationships could be
concluded. Further, the predictability potential of the study variables to the change in COI
could be identified and interpreted. The obtained logistic model formula enables predicting
what COI category to expect (<SR35,000 or ≥SR35,000) if a diabetic patient would go
through a diabetic foot experience at a certain age. Inability of the type of intervention to
predict COI change does not mean they are ineffective because their effect on COI has already
been shown in a separate analysis. Probably including intervention type in a larger sample size

Turki Bafaraj “Economics of the diabetic foot: a cost-of-illness study in Saudi Arabia” ___________________________________________________________________________
64
study replicating the same methodological technique of this research may well generate a
significant result.
The research questions have been all answered, following the same logic advocated in
achieving the research objectives, as above. We now realize that 43.3% of DFDs could be
treated by simple surgical intervention in the form of debridement. Less likely, meanwhile still
concerning, are those who experience minor amputations (35%). This specific DFD stratum
should be given top priority in the form of close follow up and observation to retain them into
the less invasive DFD treatment groups. Better care and closer follow up can further improve
the outcome of the two amputation groups and raise the prevalence of conservative treatment
from 6.7% to tangibly higher levels in particular.
Answering question about how significant the impact of demographic criteria on the
prevalence of intervention options, both age and Saudi nationality have been of a significant
impact with this respect (Tables 3 and 5, respectively). Inquiring about the pattern of the COI
and whether there was a significant relationship between it and type of intervention, we found
that COI varies significantly by intervention type, a result that can explain the most part of this
research and can be used for estimating the economic burden of DFDs in the studied
population. Similarly, the prediction function for COI change by any significantly included
predictor was assessed using the multiple logistic technique approach, as in the methodology
plan.
5.5 Strengths and Limitations
This work has a number of strengths adding to the validity and reliability of the
obtained findings, e.g., planning for improved diabetes management in Saudi Arabia. The
source the information was gained from is a reputed agency working in the Saudi healthcare
market. From the methodology viewpoint, data entry and the sophisticated statistical analysis
approach, e.g., strict adherence to PMT technique assumptions before attempting any of these
techniques, enhance the validity of the study results and importantly depreciate the probability
of systematic or misclassification bias. Also, in our risk-outcome analysis plan, the
deployment of DFDs both as potential risk for COI and then as an intermediary outcome
enabled conducting a larger number of comparisons and helped us envisage DFDs from a
broader risk-outcome angle.

Turki Bafaraj “Economics of the diabetic foot: a cost-of-illness study in Saudi Arabia” ___________________________________________________________________________
65
On the other hand, some limitations, which are mostly related to access to the amount
of released patient data had been encountered. First it was not possible to get the exact
duration of diabetes of the recruited patients or when it had started. Had disease duration been
obtained it could have been added to the study correlates and a broader picture of the
epidemiology of DFDs in Jeddah could have been drawn. The sample size we were permitted
was rather small. Statistically-speaking sample size generally affects the study power due to
inflating type-two error (β- error). This may often limit generalizability of studies’ results.
However, the quota sampling approach, which involves a nonprobability technique, could
have some effect in offsetting type-2 error inflation and maintaining a better generalizability
potential on the population.
6. Conclusion
Despite good access to health care and coverage, the incidence of amputations among
our study population is worrying. Older age diabetic patients particularly the Saudis are at a
greater risk for complicated DFDs and amputation. These concerns warrant developing more
efficient and effective follow up policy on regular base for diabetic patients in general and
DFD patients in particular. High risk patients, e.g., the obese or those with CVD and other
comorbidities worth a closer follow up. The findings of this research emphasize the stressing
need to keep diabetic patients under continuous glycemic control to delay the occurrence of
ischemic vascular and neurological complications which in turn have serious implications
upon the diabetic patient’s foot wellbeing. When neglected, deranged foot vasculature and
peripheral nerves act as precursors for DFDs. A preventive approach both to minimize the
number of new diabetics and creating an unfavorable environment for developing
complications are mostly recommended. Improving the primary prevention programs,
adopting a multidisciplinary collaboration in delivering holistic healthcare service package in
Saudi Arabia is critical for alleviating diabetes problems burden upon the Saudi community
and the national economy. Further larger scale research highlighting other economic aspects of
DFDs and utilizing evaluation techniques enabling addressing indirect costs of lost
productivity, moral hazard, and impaired QOL due to loosing limbs to diabetes, is warranted
particularly in population with an exceptionally high rates of diabetes, such as Saudi Arabia.

Turki Bafaraj “Economics of the diabetic foot: a cost-of-illness study in Saudi Arabia” ___________________________________________________________________________
66
References
Abolfotouh, M. A., Alfaifi, S. A., & Al-Gannas, A. S. (2011). Risk factors of diabetic foot
in central. Saudi Arabia. Saudi Medical Journal, 32, 708–713.
Adler, A.I., Stratton, I. M., Neil, H. A., Yudkin, J. S., Matthews, D. R., Cull, C. A., et al.
(2000). "Association of systolic blood pressure with macrovascular and microvascular
complications of type 2 diabetes (UKPDS 36): prospective observational study".
British Medical Journal, 321(7258), 412–9.
Ackermann, R. T., Cheng, Y. J., Williamson, D. F., & Gregg, E.W. (2011). Identifying
adults at high risk for diabetes and cardiovascular disease using hemoglobin A1C.
American journal of Preventive Machine, 40(1):11-7.
Afifi, R., Omar, S., & El Raggal, A. (2015). A community screening plan for the prevalence
of some chronic diseases in specified adult populations: pre-diabetes and diabetes
mellitus. International Journal of Diabetes in Developing Countries. 35(3), 149-156.
Al-Nozha, M. M, Al-Maatouq, M. A., Al-Mazrou, Y. Y., Al-Harthi, S. S., Arafah, M. R.,
Khalil, M., Z. et al. (2004). Diabetes mellitus in Saudi Arabia. Saudi Medica; Journal,
25, 1603–1610.
Ali, S. M., Fareed, A., Humail, S. M., Basit, A., Ahmedani, M. Y., Fawwad, A., & Miyan Z.
(2008). The personal cost of diabetic foot disease in the developing world–a study
from Pakistan. Diabetes Medicine, 25, 1231–3.
Almalki, M., Fitzgerald, G., & Clark, M. (2011). Health care system in Saudi Arabia: an
overview. Eastern Mediterranean Health Journal,17(10), 784-93.
Al-Rubeaan, K. H., Al Derwish, M., Ouizi, S., Youssef, A. M., Subhani, S. N., Ibrahim,
H. M., et al. (2015). Diabetic foot complications and their risk factors from a large
retrospective cohort study. PLoS One, 10(5): e0124446.
doi: 10.1371/journal.pone.0124446
Al-Tawfiq, J. A., & Johndrow, & J. A. (2009). Presentation and outcome of diabetic foot
ulcers in Saudi Arabian patients. Advances in Skin Wound Care, 22, 119–21.
Al-Wahbi, & A. M. (2006). The diabetic foot in Arab world. Saudi Medical Journal. 27,
147–53.

Turki Bafaraj “Economics of the diabetic foot: a cost-of-illness study in Saudi Arabia” ___________________________________________________________________________
67
Alwakeel, J. S., Al-Suwaida, A,, Isnani, A. C, Al-Harbi, A., & Alam, A. (2009).
Concomitant macro and micro-vascular complications in Diabetic nephropathy.
Saudi Journal of Kidney Disease Transplantation, 20, 402–9.
Alzahrani, & A. H. (2013). The direct cost of diabetic foot management in some of private
hospitals in Jeddah, Saudi Arabia. International Journal of Diabetes in Developing
Countries, 33(1), 34–39. doi: 10.1007/s13410-012-0107-x.
Alzahrani, H. A., Hitos, K., Fletcher, & J. P. (2011). The diabetic foot. (1st ed.). Sydney:
Hemi Australian Pty Ltd.
American Diabetes Association (AMA). (2003). Screening for Type 2 Diabetes. Diabetes
Care; 26(suppl 1): s21-s24. Retrieved from:
http://dx.doi.org/10.2337/diacare.26.2007.S21
American Diabetes Association (ADA). (2004). Diagnosis and classification of diabetes
mellitus. Diabetes Care; 27(suppl 1): s5-
s10. http://dx.doi.org/10.2337/diacare.27.2007.S5
American Diabetes Association (ADA). (2008). Economic costs of diabetes in the U. S.
in 2007. Diabetes Care, 31, 596–615.
American Diabetes Association (ADA). (2010). "Diabetes Care". Summary of Revisions for
the 2010 Clinical Practice Recommendations”. Diabetes Care, 33(Supplement 1),S33.
American Diabetes Association (ADA). (2015). American Diabetes Association’s
“Standards of Medical Care in Diabetes” Summary of Revisions Diabetes Care,
38(Suppl. 1):S4. doi: 10.2337/dc15-S003.
Barr, E. L., Zimmet, P. Z., Welborn, T. A., Jolley, D., Magliano, D. J., Dunstan, D. W., et
al. (2007). Risk of cardiovascular and all-cause mortality in individuals with diabetes
mellitus, impaired fasting glucose, and impaired glucose tolerance: the Australian
diabetes, obesity, and lifestyle study (AusDiab). Circulation, 116(2), 151–7.
Benotmane, A., Mohammedi, F., Ayad, F., Kadi, K., & Azzouz, A. (2001). Management of
diabetic foot lesions in hospital: costs and benefits. Diabetes Medicine, 27, 688–
94.
Boulton, A. J, Vileikyte, L., Ragnarson-Tennvall, G., & Apelqvist, J. (2005). The global
burden of diabetic foot disease. The Lancet, 366, 1719–24.

Turki Bafaraj “Economics of the diabetic foot: a cost-of-illness study in Saudi Arabia” ___________________________________________________________________________
68
Boulton, A. J. M., Armstrong, D. G., Albert, S. F., Frykberg, R. G., Hellman, R.,
Kirkman, M.S., et al. (2008). Comprehensive foot examination and risk assessment: a
report of the task force of the foot care interest group of the American Diabetes
Association, with endorsement by the American Association of Clinical
Endocrinologists. Diabetes Care, 31, 1679–1685. doi: 10.2337/dc08-9021Brown, A.
F., Mangione, C. M., Saliba, D., & Sarkisian, C. A. (2003). California Healthcare
Foundation/American Geriatrics Society Panel on Improving Care for Elders with
Diabetes. Guidelines for improving the care of the older person with diabetes mellitus.
Journal of the American Geriatric Society, 51(Suppl. Guidelines), S265–S280. doi:
10.1046/j.1532-5415.51.5s.1.x
Bruun, C., Siersma, V., Guassora, A. D., Holstein, P., de Fine- & Olivarius N, (2013).
Amputations and foot ulcers in patients newly diagnosed with type 2 diabetes mellitus
and observed for 19 years. The role of age, gender and co-morbidity. Diabetes
Medicine, 30, 964–972. doi: 10.1111/dme.12196
Canadian Diabetes Association (CDA). (2013). Canadian diabetes association clinical
practice guidelines expert committee. Clinical practice guidelines for the prevention
and management of diabetes in Canada. Canadian Journal of Diabetes, 37(suppl
1):S1-S212. Retrieved from:
http://guidelines.diabetes.ca/app_themes/cdacpg/resources/cpg_2013_full_en.pdf
Cardenas, M. K., Mirelman, A. J., Galvin, C. J., Lazo-Porras, M., Pinto M., Jaime, J., et
al. (2015). The cost of illness attributable to diabetic foot and cost-effectiveness of
secondary prevention in Peru. Biomed Central (BMC) Health Services Research, 15,
483. doi: 10.1186/s12913-015-1141-4
Cavanagh, P. R. (2004). Therapeutic footwear for people with diabetes. Diabetes
Metabolism and Research Reviews, 20(Suppl 1), S51–5. doi:10.1002/dmrr.435.
Cheng, J., Zhang, W., Zhang, X., Han, F., Li X,, He. X., & Li, Q. (2014). Effect of
angiotensin-converting enzyme inhibitors and angiotensin ii receptor blockers on all-
cause mortality, cardiovascular deaths, and cardiovascular events in patients
with diabetes mellitus: a meta-analysis. Journal of American Medical Association,
174(5), 773–85. doi:10.1001/jamainternmed.2014.348.

Turki Bafaraj “Economics of the diabetic foot: a cost-of-illness study in Saudi Arabia” ___________________________________________________________________________
69
Clinical Coding and Schedule Development Group (CCSD). Retrieved from:
http://www.ccsd.org.uk/
Council of Cooperative Health Insurance (CCHI). (2016).
http://www.cchi.gov.sa/en/InsuranceCompanies/Pages/Companies.aspx
Council of Health Services. Vision and tasks of the Council of Health Services in Saudi
Arabia. Retrieved from: http://shc.gov.sa/En/default.htm
Davis, W. A., Norman, P. E., Bruce, D. G., Davis, & T. M. Predictors. (2006).
Consequences and costs of diabetes-related lower extremity amputation complicating
type 2 diabetes: The Fremantle diabetes study. Diabetologia, 6(49), 2634–41.
De la Monte, S. M. (2014). Type 3 diabetes is sporadic Alzheimer׳s disease:
mini-review". European neuropsychopharmacology: the journal of the European
College of Neuropsychopharmacology, 24(12), 1954–60.
doi:10.1016/j.euroneuro.2014.06.008.
Dellon, A. L., Muse, V. L., Nickerson, D. S., Akre, T., Anderson, S. R., Barrett, S. L., et
al. (2012). Prevention of ulceration, amputation, and reduction of hospitalization:
outcomes of a prospective multicenter trial of tibial neurolysis in patients with diabetic
neuropathy. Journal of Reconstructive Microsurgery, 28(4):241-6. doi: 10.1055/s-
0032-1306372
Dolores, S., & Gardner, D. G. (2011). Greenspan's basic and clinical endocrinology. (9th
ed.). New York: McGraw-Hill. ISBN 9780071622431.
Driver, V. R., Fabbi, M., Lavery, L. A., & Gibbons, G. (2011). The costs of diabetic foot:
the economic case for the limb salvage team. Journal of Vascular Surgery, 52(3
Suppl), 17S–22S. Retrieved form: http://www.ncbi.nlm.nih.gov/pubmed/20804928
Engelgau, M. M., Narayan, K. M. V., Herman, & W. H. (2000). Screening for Type 2
Diabetes. Diabetes Care, 23(10), 1563-80.
Erickson, S. C., Le, L., Zakharyan, A., Stockl, K. M., Harada, A.S., Borson, S., et al.
(2012). Newonset treatment-dependent diabetes mellitus and hyperlipidemia associated
with atypical antipsychotic use in older adults without schizophrenia or bipolar
disorder. Journal of the American Geriatrics Society, 60, 474–479

Turki Bafaraj “Economics of the diabetic foot: a cost-of-illness study in Saudi Arabia” ___________________________________________________________________________
70
Expert Committee on the Diagnosis and Classification of Diabetes Mellitus. (2007).
Diabetes Care, 20, 1183–1197
Gallagher, EB. (2002). Modernization and health reform in Saudi Arabia, Chapter 4. In:
Twaddle, A. C. ed. Health care reform around the world. London: Auburn House.
P.181–197.
Global Burden Disease Risk Factors Collaborators (GBD). (2015). Global, regional, and
national comparative risk assessment of 79 behavioural, environmental and
occupational, and metabolic risks or clusters of risks in 188 countries, 1990–2013: a
systematic analysis for the GBD Study 2013. The Lancet, 386(10010), 2287–323.
doi: http://dx.doi.org/10.1016/S0140-6736(15)00128-2
Green, M. F., Aliabadi, P. T. Z., & Green, B. T., (2002). Diabetic foot: Evaluation and
management. Southern Medical Journal, 95(1), 95-101.
Griffin, S. J., Borch-Johnsen, K., Davies, M. J., Khunti, K., Rutten, G. E., Sandbæk, A.,
et al. (2011). Effect of early intensive multifactorial therapy on 5-year cardiovascular
outcomes in individuals with type 2 diabetes detected by screening (addition-Europe):
a cluster-randomised trial. The Lancet, 378, 156–167.
Hammes, H. P. (2003). Pathophysiological mechanisms of diabetic angiopathy. Journal of
Diabetes Complications, 17(2 Suppl), 16-9.
Health Statistical Year Book. (2009). Ministry of Health (MOH), Riyadh, Saudi Arabia,
Retrieved from:
http://www.moh.gov.sa/Ministry/MediaCenter/News/Documents/healthybook.pdf
Hex, N., Bartlett C., Wright, D., Taylor, M., & Varley, D. (2012). Health Economics
Estimating the current and future costs of Type 1 and Type 2 diabetes in the UK,
including direct health costs and indirect societal and productivity costs. York Health
Economics Consortium Ltd, University of York, York, UK. doi: 10.1111/j.1464-
5491.2012.03698 x.
Hodgson, TA, & Meiners, MR. (1982). Cost of illness methodology: a guide to current
practices and procedures. Milbank memorial fund quarterly. Health and Society, 60,
429–462. doi: 10.2307/3349801. Retrieved from: http://www.jstor.org/stable/3349801

Turki Bafaraj “Economics of the diabetic foot: a cost-of-illness study in Saudi Arabia” ___________________________________________________________________________
71
Hu, F. B., Manson, J. E., Stampfer, M. J., Colditz, G., Liu, S., Solomon, C. G., & Willett, W.
C. (2001). Diet, lifestyle, and the risk of type 2 diabetes mellitus in women. New
England Journal of Medicine, 345, 790-7.
International Diabetes Federation (IDF). (2013). Diabetes atlas, (6th ed.) p. 7. ISBN
2930229853.
International Diabetes Federation (IDF). (2014). Annual report 2014. Retrieved from:
http://www.idf.org/sites/default/files/IDF-2014-Annual-Report-final.pdf
International Diabetes Federation (IDF). (2015). Middle East and North Africa. Diabetes
in Saudi Arabia-2015. Retrieved from: http://www.idf.org/membership/mena/saudi-
arabia
International Classification-9- Coding Manual (ICD-9-CM). (2011). ICD-9-CM official
guidelines for coding and reporting effective October 1, 2011. Retrieved from:
https://www.cdc.gov/nchs/data/icd/icd9cm_guidelines_2011.pdf
Jalboukh, T. (2008). Health report on Saudi Arabia. Available from:
http://www.ameinfo.com/136229.html
James, W. D., Berger, T., & Elston, D. (2006). Andrews’ diseases of the skin: clinical
dermatology. (12th ed.) Philadelphia: Saunders Elsevier. ISBN 0-7216-2921-0.
Jo C. (2014). Cost-of-illness studies: concepts, scopes, and methods. Clin Mol Hepatol.
20(4): 327–337. doi: 10.3350/cmh.2014.20.4.327
Jefferson, T., Demicheli, V, & Mugford, M. (2000). Cost-of-illness studies, elementary
economic evaluation in health care. 2nd ed. London: British medical Journal
Publishing Group; 2000. pp. 17–29.
Jo, C. (2014). Cost-of-illness studies: concepts, scopes, and methods. Clinical and
Molecular Hepatololgy, 20(4), 327–337. doi: 10.3350/cmh.2014.20.4.327
Johnson, S. L., Tabaei, B. P., & Herman, W. H. (2005). The efficacy and cost of alternative
strategies for systematic screening for type 2 diabetes in the U.S. population 45-74
years of age. Diabetes Care, 28, 307–311.
Kahn, R., Alperin, P., Eddy, D., Borch-Johnsen, K., Buse, J., Feigelman, J., et al. (2010).
Age at initiation and frequency of screening to detect type 2 diabetes: a cost-
effectiveness analysis. The Lancet, 375, 1365–1374

Turki Bafaraj “Economics of the diabetic foot: a cost-of-illness study in Saudi Arabia” ___________________________________________________________________________
72
Khardori, R. (2016). Medscape. Type 2 diabetes mellitus clinical presentation. Retrieved
from: http://emedicine.medscape.com/article/117853-clinical
Kim, E., Barrett, K. Barman, E., S. M., Boitano, S., & Brooks, H. (2012). Ganong’s review
of medical physiology. 24th ed. New York: McGraw-Hill. ISBN 0071780033.
King, P., Peacock, I., & Donnelly, R. (1999). The UK Prospective Diabetes Study
(UKPDS): clinical and therapeutic implications for type 2 diabetes. British Journal of
Clinical Pharmacology, 48(5), 643–648. doi: 10.1046/j.1365-
2125.1999.00092.x
Knowler, W. C., Fowler, S. E, Hamman, R. F., Christophi, C. A., Hoffman, H. J.
Brenneman, A. T, et al. (2009). 10-year follow-up of diabetes incidence and weight
loss in the Diabetes Prevention Program Outcomes Study. The Lancet. 374, 1677-86.
Kozhanova, I., Romanova, I., Gavrilenko, L., Sachek, L., Shepelkevich, A., Artsiomenka,
A., et al. (2015). Cost of illness analysis in patients with diabetic foot syndrome in
health care of republic of Belarus. Value Health, 18(7): A604.
doi: http://dx.doi.org/10.1016/j.jval.2015.09.2078
Kumar, V., Fausto, N., Abbas, A. K., Cotran R. S, & Robbins, S. L. (2005). Robbins and
Cotran pathologic basis of disease 7th ed. Philadelphia, Pa.: Saunders. pp. 1194–1195.
Lamri, L., Gripiotis, S., & Ferrario, A. (2014). Diabetes in Algeria and challenges for health
policy: a literature review of prevalence, cost, management and outcomes of diabetes
and its complications. Global Health. 2014; 10: 11. doi: 10.1186/1744-8603-10-11
Masson, E. A., MacFarlane, I. A., Power, E., & Wallymahmed, M. (2009). An audit of the
management and outcome of hospital inpatients with diabetes: resource planning
implications for diabetes care team. Diabetes Medicine, 9, 753-5.
Moxey, P. W., Gogalniceanu, P., Hinchliffe, R. J., Loftus, I. M., Jones, K. J., Thompson,
M. M., et al. (2011). Lower extremity amputations – a review of global variability in
incidence. Diabetic Medicine, 28(10), 1144–1153.
Murray, R. M., Bender, D. A., Botham, D. M., Kennelly, P. J., Rodwell, V. W., & Weil, P.
A.https://en.wikipedia.org/wiki/Diabetes_mellitus - cite_ref-46 (2012). Harper’s
illustrated biochemistry. 29th ed. New York: McGraw-Hill. ISBN 007176576X.
Naidu, K. M. (2006). Community health pursing. New Delhi: Gennext Publication. ISBN
978-81-908675-1-1. p. 314.

Turki Bafaraj “Economics of the diabetic foot: a cost-of-illness study in Saudi Arabia” ___________________________________________________________________________
73
NCD Risk Factor Collaboration (NCD-RisC). (2007). Worldwide trends in diabetes since
1980: a pooled analysis of 751 population-based studies with 4*4 million participants.
The Lancet, 387, 1513–1530. doi: http://dx.doi.org/10.1016/S0140-6736(16)00618-8
Nichols, G. A., Hillier, T. A., & Brown, J. B. (2007). Progression from newly acquired
impaired fasting glucose to type 2 diabetes. Diabetes Care. 30(2): 228–
233. doi:10.2337/dc06-1392.
O'Gara, P. T., Kushner, F. G., Ascheim, D. D, Casey, D. E, Chung, M. K., de Lemos,
J.A., et al. (2013). 2013 ACCF/AHA guideline for the management of ST-elevation
myocardial infarction: a report of the American College of Cardiology
Foundation/American Heart Association Task Force on Practice Guidelines."
Circulation, 127(4): e362–425. doi:10.1161/CIR.0b013e3182742cf6.
Peacock, J., M., Keo H. H, Duval, S., Baumgartner, I., Oldenburg, N. C, Jaff, M., R., et
al. (2011). The incidence and health economic burden of ischemic amputation in
Minnesota, 2005–2008. Preventing Chronic Disease, 8, A141. Retrieved from:
http://www.ncbi.nlm.nih.gov/pubmed/22005634
Polisena, J., Tran, K., Cimon, K., Hutton, B., McGill, S., & Palmer, K. (2009). Home
telehealth for diabetes management: a systematic review and meta-analysis. Diabetes
Obesity and Metabolism Journal, 11(10), 913–30.
Reiber, G. E., Lipsky, B. A., & Gibbons, G. W. (1998). The burden of diabetic foot
ulcers. American Journal of Surgery, 176(suppl 2A): 5S-10S. Retrieved from :
http://www.ncbi.nlm.nih.gov/pubmed/9777967.
Ripsin, C. M., Kang, H., & Urban, R. J. (2009). "Management of blood glucose in type 2
diabetes mellitus" American Family Physician, 79(1), 29–36.
Risko, N., Calvello, E. J. B, de Ramirez, S. S., Narayan, M., & Hirshon, J. M. (2011).
Including emergency and acute care as a global health priority. International Journal
of Emergency Medicine, 12(4), 75. doi: 10.1186/1865-1380-4-75.
Roglic, G. (2016). WHO global report on diabetes. A summary review article, 1(1): 3-8.
Retrieved from: http://www.ijncd.org/article.asp?issn=WKMP-
0120;year=2016;volume=1;issue=1;spage=3;epage=8;aulast=Roglic

Turki Bafaraj “Economics of the diabetic foot: a cost-of-illness study in Saudi Arabia” ___________________________________________________________________________
74
Rothermich, E. A., & Pathak, D. S. (1999). Productivity-cost controversies in cost-
effectiveness analysis: review and research agenda. Clinical Therapeutics, 21, 255–
267.
Selvin, E., Steffes, M. W., Zhu, H., Matsushita, K., Wagenknecht, L., Pankow, J., et al.
(2010). Glycated hemoglobin, diabetes, and cardiovascular risk in nondiabetic
adults. New England Journal of Medicine, 362(9), 800–
11. doi:10.1056/NEJMoa0908359.PMC 2872990.
United Nations (UN). (2011). Resolution adopted by the general assembly. 66/2. political
declaration of the high-level meeting of the general assembly on the prevention and
control of noncommunicable diseases. Retrieved from:
http://www.who.int/nmh/events/un_ncd_summit2011/political_declaration_en.pdf
Saudi Arabia Population Clock. Retrieved from:
http://countrymeters.info/en/Saudi_Arabia
Schulman, A. P, del Genio, F., Sinha, N., & Rubino, F. (2009). Metabolic surgery for
treatment of type 2 diabetes mellitus. Endocrine Practice, 15(6): 624–31.
doi:10.4158/EP09170.RAR.
SharHashemi, S., Cheikh, I., & Dellon, A. L. (2013). Prevalence of upper and lower
extremity tinel signs in diabetics: cross-sectional study from a United States, urban
hospital-based population. Journal of Diabetes and Metabolism, 4, 2. Retrieved from:
http://www.omicsonline.org/prevalence-of-upper-and-lower-extremity-tinel-signs-in-
diabetics-crosssectional-study-from-a-united-states-urban-hospital-based-population-
2155-6156.1000245.php?aid=10898
Tashkandi, W. A., Badri, M. M., Badawood, S. M., Ghandoura, N. A., & Alzahrani, H. A.
(2011). Lower limb amputation among diabetics in three major hospitals in Jeddah,
Saudi Arabia. Saudi Medical Journal.18, 23–35.
Tawar, G. P., Hasnain, S. E., & Sarin, S. K. (Eds.). (2016). Textbook of biochemistry,
biotechnology, allied and nuclear medicine. (4th ed.). Delhi: PHI Learning Private
Limited. ISBN 9788120351257. p. 142.
Tennvall, R. G., & Apelqvist, J. (2004). Health-economic consequences of diabetic foot
lesions. Clinical Infectious Diseases, 39(Supplement 2), S132-S139.
doi: 10.1086/383275

Turki Bafaraj “Economics of the diabetic foot: a cost-of-illness study in Saudi Arabia” ___________________________________________________________________________
75
van den Hout, W. B. (1982). The value of productivity: human-capital versus friction-
cost method. Annals of Rheumatology Diseases, 69, i89-
i91 doi:10.1136/ard.2009.117150
Vos, T., Flaxman, A. D., Naghavi, M., Lozano, R., Michaud, C., Ezzati, M., et al. (2012).
"Years lived with disability (YLDs) for 1160 sequelae of 289 diseases and injuries
1990–2010: a systematic analysis for the global burden of disease study 2010." The
Lancet. 380(9859): 2163–96. doi:10.1016/S0140-6736(12)61729-2.
Waugh, N., Scotland, G., McNamee, P., Gillett, M., Brennan, A., Goyder, E., Williams,
R., & John, A. (2007). Screening for type 2 diabetes: literature review and economic
modeling.” Health Technology Assessment, 11(17). Retrieved from:
from: www.hta.ac.uk/execsumm/summ1117.htm.
Walston, S., Al-Harbi, Y., & Al-Omar, B. (2008). The changing face of healthcare in Saudi
Arabia. Annals of Saudi Medicine, 28, 243– 250.
Wild , S., Roglic, G., Green, A., Sicree, R., & King, H. (2004). Global prevalence of
diabetes: estimates for the year 2000 and projections for 2030. Diabetes Care, 27,
1047-53.
World health Organization (WHO). (1999). Definition, diagnosis and classification of
diabetes mellitus and its complications. Part 1: Diagnosis and classification of diabetes
mellitus (WHO/NCD/NCS/99.2). Geneva: WHO. Retrieved from:
http://apps.who.int/iris/bitstream/10665/66040/1/WHO_NCD_NCS_99.2.pdf
World Health Organization (WHO). (2006). Diabetes programme. Definition and
diagnosis of diabetes mellitus and intermediate hyperglycaemia. Report of a WHO/IDF
consultation. Retrieved from:
http://www.who.int/diabetes/publications/diagnosis_diabetes2006/en/
World Health organization (WHO). (2013a). Diabetes fact sheet N°312". WHO. October
2013. Retrieved from:
https://web.archive.org/web/20130826174444/http://www.who.int/mediacentre/factshe
ets/fs312/en/
World Health Organization (WHO). (2013b). Saudi Arabia. Country cooperation
strategy. Health and development. Retrieved from:
http://www.who.int/countryfocus/cooperation_strategy/ccsbrief_sau_en.pdf

Turki Bafaraj “Economics of the diabetic foot: a cost-of-illness study in Saudi Arabia” ___________________________________________________________________________
76
World Health Organization (WHO). (2014). Media Center. Diabetes. "The top 10 causes
of death Fact sheet. N°310". May 2014. Retrieved from:
http://www.who.int/mediacentre/factsheets/fs310/en/
World Health Organization (WHO). (2015). Classification and Diagnosis of Diabetes.
Diabetes Care, 38(Suppl. 1):S8–S16. doi: 10.2337/dc15-S005.
World Health Organization (WHO). (2016). Global report on diabetes. Retrieved from:
http://apps.who.int/iris/bitstream/10665/204871/1/9789241565257_eng.pdf
Young, M.J., Cavanagh, P.R., & Thomas, G. (1992) The effect of callous removal on
dynamic plantar foot pressure in diabetic patients. Diabetic Medicine. 9: 75 – 77.
Yuankai, S., & Hu, F. B. (2014). The global implications of diabetes and cancer. The
Lancet. 383(9933): 1947–8. doi: 10.1016/S0140-6736(14)60886-2
Zhang, X., Gregg, E. W., Williamson, D. F., Barker, L. E., Thomas, W., Bullard, K. M,,
et al. (2010). A1C level and future risk of diabetes: a systematic review. Diabetes Care,
33, 1665–1673.

Turki Bafaraj “Economics of the diabetic foot: a cost-of-illness study in Saudi Arabia” ___________________________________________________________________________
77
Declaration:
I hereby confirm that I am the author of the thesis presented. I have written the thesis as applied for previously unassisted by others; using only the sources and references stated in the text.
Turki Bafaraj
Date: 12.09.2016

Turki Bafaraj “Economics of the diabetic foot: a cost-of-illness study in Saudi Arabia” ___________________________________________________________________________
78
Appendix A
Study Population Dataset: Spreadsheet
#
COI
(SR) Sex
Age
(y) Treatment Gender Interven.
Age
<55-
>55
Cost
<75-
>75
Cost
<35-
>35
Saudi-
Non Conserv Debrid
Minor
Amp
Major
Amp
1 141386 M 57 MJAmp ˦ 1 3 2 2 2 1 0 0 0 1
2 107402 M 60 MJAmp 1 3 2 2 2 1 0 0 0 1
3 89913 M 58 MJAmp 1 3 2 2 2 1 0 0 0 1
4 79930 F 60 MJAmp 0 3 2 2 2 1 0 0 0 1
5 77133 F 60 MJAmp 0 3 2 2 2 1 0 0 0 1
6 70026 M 60 MJAmp 1 3 2 2 2 1 0 0 0 1
7 69710 F 59 MJAmp 0 3 2 2 2 1 0 0 0 1
8 69471 M 55 MJAmp 1 3 2 2 2 1 0 0 0 1
9 68324 M 57 MJAmp 1 3 2 2 2 1 0 0 0 1
10 48090 F 58 MNAmp† 0 2 2 1 2 1 0 0 1 0
11 47775 M 60 MNAmp 1 2 2 1 2 1 0 0 1 0
12 46033 M 59 MNAmp 1 2 2 1 2 1 0 0 1 0
13 41118 M 59 MNAmp 1 2 2 1 2 1 0 0 1 0
14 40551 M 57 MNAmp 1 2 2 1 2 1 0 0 1 0
15 39364 M 59 MNAmp 1 2 2 1 2 1 0 0 1 0
16 37572 M 58 MNAmp 1 2 2 1 2 1 0 0 1 0
17 36683 F 60 MNAmp 0 2 2 1 2 1 0 0 1 0
18 36302 M 60 MNAmp 1 2 2 1 2 1 0 0 1 0
19 36039 F 60 MNAmp 0 2 2 1 2 1 0 0 1 0
20 34828 M 59 MNAmp 1 2 2 1 1 1 0 0 1 0
21 34646 M 56 MNAmp 1 2 2 1 1 1 0 0 1 0
22 33633 M 59 MNAmp 1 2 2 1 1 1 0 0 1 0
23 32577 M 57 MNAmp 1 2 2 1 1 1 0 0 1 0
24 32116 M 60 MNAmp 1 2 2 1 1 1 0 0 1 0
25 30681 F 58 MNAmp 0 2 2 1 1 1 0 0 1 0
26 29786 F 60 MNAmp 0 2 2 1 1 1 0 0 1 0
27 29472 F 57 MNAmp 0 2 2 1 1 1 0 0 1 0
28 29123 M 56 MNAmp 1 2 2 1 1 1 0 0 1 0

Turki Bafaraj “Economics of the diabetic foot: a cost-of-illness study in Saudi Arabia” ___________________________________________________________________________
79
29 29061 M 58 MNAmp 1 2 2 1 1 2 0 0 1 0
30 28289 M 55 MNAmp 1 2 2 1 1 1 0 0 1 0
31 27346 M 57 Debrid 1 1 2 1 1 1 0 1 0 0
32 26382 M 58 Debrid 1 1 2 1 1 1 0 1 0 0
33 25798 M 59 Debrid 1 1 2 1 1 1 0 1 0 0
34 24649 M 56 Debrid 1 1 2 1 1 2 0 1 0 0
35 24477 F 58 Debrid 0 1 2 1 1 1 0 1 0 0
36 23493 F 59 Debrid 0 1 2 1 1 2 0 1 0 0
37 22861 F 57 Debrid 0 1 2 1 1 1 0 1 0 0
38 20528 M 60 Debrid 1 1 2 1 1 2 0 1 0 0
39 18670 M 55 Debrid 1 1 2 1 1 1 0 1 0 0
40 18253 F 57 Debrid 0 1 2 1 1 2 0 1 0 0
41 18216 M 56 Debrid 1 1 2 1 1 2 0 1 0 0
42 15688 M 49 Debrid 1 1 1 1 1 2 0 1 0 0
43 15522 M 58 Debrid 1 1 2 1 1 1 0 1 0 0
44 15125 F 58 Debrid 0 1 2 1 1 2 0 1 0 0
45 15047 F 57 Debrid 0 1 2 1 1 2 0 1 0 0
46 14428 M 58 Debrid 1 1 2 1 1 1 0 1 0 0
47 13456 M 54 Debrid 1 1 1 1 1 2 0 1 0 0
48 13266 M 55 Debrid 1 1 2 1 1 1 0 1 0 0
49 13252 M 56 Debrid 1 1 2 1 1 2 0 1 0 0
50 12576 M 53 Debrid 1 1 1 1 1 1 0 1 0 0
51 12373 M 57 Debrid 1 1 2 1 1 1 0 1 0 0
52 12057 M 58 Debrid 1 1 2 1 1 1 0 1 0 0
53 11793 F 56 Debrid 0 1 2 1 1 2 0 1 0 0
54 11714 M 47 Debrid** 1 1 1 1 1 1 0 1 0 0
55 11141 M 59 Debrid 1 1 2 1 1 1 0 1 0 0
56 11065 M 55 Debrid 1 1 2 1 1 1 0 1 0 0
57 10957 M 60 Conserv* 1 0 2 1 1 2 1 0 0 0
58 10258 M 51 Conserv 1 0 1 1 1 1 1 0 0 0
59 10041 M 59 Conserv 1 0 2 1 1 1 1 0 0 0
60 9859 F 54 Conserv 0 0 1 1 1 1 1 0 0 0
* Conservative treatment only ** Debridement † Minimal amputation ˦ Major amputation

Turki Bafaraj “Economics of the diabetic foot: a cost-of-illness study in Saudi Arabia” ___________________________________________________________________________
80
Appendix B
ICD-9_CM Coding Guidelines for DM and DFDs
Codes for amputation involving the lower extremity
Current amputations (ICD-9 procedure codes):84.11-17 Past amputations (ICD-9-CM codes): V49.71-77; V52.1 (CPT-4 codes): 27888, 28800, 28801, 28802, 27803, 28804, 28805, 27290, 27598, 27880, 27881, 27882, 27884, 27885, 27886, 27590, 27591, 27592, 27290, 27291, 27292, 27293, 27294, 27295, 27594, 27595, 27596, 26910, 28810, 28811, 28812, 28813, 28814, 28815, 28816, 28817, 28818, 28819, 28820, 28821, 28822, 28823, 28824, 28825 Final set of ICD-9-CM codes for foot infection Gangrene 040.0 Gas Gangrene 440.24 Atherosclerosis of the extremities with gangrene 785.4 Gangrene but only if any one of the following is also present: 250.7 Diabetes with peripheral circulatory disorders 440.2 Atherosclerosis of native arteries of the extremities Any condition classifiable to 440.21, 440.22, and 440.23 Osteomyelitis 730.07 Acute osteomyelitis of ankle and foot 730.17 Chronic osteomyelitis of ankle and foot 730.27 Unspecified osteomyelitis of ankle and foot 730.97 Unspecified infection of bone of ankle and foot Ulcer 440.23 Atherosclerosis of the extremities with ulceration 707.14 Ulcer of heel and mid foot 707.15 Ulcer of other part of foot 707.1 Ulcer of lower limbs Cellulitis or abscess of foot 680.7 Carbuncle and furuncle of foot, heel, toe 682.7 Cellulitis and abscess of foot, except toes Cellulitis or abscess of toe 681.1 Cellulitis and abscess of toe 681.10 Cellulitis, toe NOS

Turki Bafaraj “Economics of the diabetic foot: a cost-of-illness study in Saudi Arabia” ___________________________________________________________________________
81
Paronychia 681.11 Onychia and paronychia of toe ICD-9-CM codes for complications of diabetes Peripheral vascular disease: 250.7, 440, 443.8, 443.9, 785.4, 997.2 Peripheral neuropathy: 250.6, 357.2 Diabetic eye disease: 250.5, 362.0, 379.23 Cerebrovascular disease: 435 or [primary diagnosis = 430-432, 434, 436] OR [V57.xx (rehab) AND secondary diagnosis = 342 (hemiparesis), 430-438] OR [Primary diagnosis = 433, 435 AND secondary diagnosis = 342, 430-432, 434, 436] Myocardial infarction: 410, 411.0, 427.5 Renal disease: 585, 586, 996.73, 996.81, V42.0, V45.1 Benjamin G, Fincke, BG, Miller DR, Turpin R. (2010). A classification of diabetic foot infections using ICD-9-CM codes: application to a large computerized medical database. BMC Health Serv Res.; 10: 192. Published online 2010 Jul 6. doi: 10.1186/1472-6963-10-192. Retrieved from: http://www.ncbi.nlm.nih.gov/pmc/articles/PMC2914721/

Turki Bafaraj “Economics of the diabetic foot: a cost-of-illness study in Saudi Arabia” ___________________________________________________________________________
82
Appendix C
Insurer Schedule of Diagnostic Tests
List of industry standard investigations including pathology, medical specialty and imaging tests used to find or help to find the cause of symptoms of a disease, illness or injury that are eligible for funding by Bupa. Vascular system
https://bupa.secure.force.com/procedures?chapter=9
1. If a procedure is marked with an (i) Bupa’s policy on intensive therapy applies (see note 7 in the Essential Notes to the Schedule and Appendix A). 2. The surgeon’s benefit entitlement for complex vascular surgery includes fees for pre-operative/peri-operative/post-operative management including intensive therapy up to 72 hours. 3. The anaesthetist’s benefit entitlement for complex vascular surgery includes fees for pre-operative/peri-operative/post-operative management including intensive therapy/ventilation for up to 72 hours. 4. In circumstances where the intensive therapy exceeds 72 hours, further benefit may be considered on a case by case basis. 5. We will not pay additional benefits if a procedure is unbundled. To find out more about unbundling, please refer to note 6 of the Essential Notes to the Schedule. 6. No additional benefit is available for the harvesting of the vein graft as it is considered to be an integral part of the overall procedure and is reflected in the classification of the main procedure. 7. All varicose vein procedures include pre-operative marking of varicosities.

Turki Bafaraj “Economics of the diabetic foot: a cost-of-illness study in Saudi Arabia” ___________________________________________________________________________
83
Appendix D
SPSS Output
A- Descriptive Statistics Frequencies Statistics
Age_y SR N Valid 60 60 Missing 0 0 Mean 57.28 33622.08 Std. Error of Mean .342 3365.245 Median 58.00 27817.50 Mode 60 9859(a) Std. Deviation 2.650 26067.073 Variance 7.020 679492302.11
2 Skewness -1.725 1.986 Std. Error of Skewness .309 .309 Kurtosis 4.043 4.705 Std. Error of Kurtosis .608 .608 Range 13 131527 Minimum 47 9859 Maximum 60 141386 Sum 3437 2017325 Percentiles 25 56.00 14582.75 50 58.00 27817.50 75 59.00 38916.00
a Multiple modes exist. The smallest value is shown
Normality Distribution Testing: Age and COI (SR) NPar Tests
Descriptive Statistics
60 57.28 2.650 47 60 56.00 58.00 59.0060 33622.08 26067.073 9859 141386 14582.75 27817.50 38916.00
Age_ySR
N Mean Std. Deviation Minimum Maximum 25th 50th (Median) 75thPercentiles

Turki Bafaraj “Economics of the diabetic foot: a cost-of-illness study in Saudi Arabia” ___________________________________________________________________________
84
Comparative Descriptive COI Statistics: Alzahrani et al. (2013) vs. This Work
DFD category This thesis Alzahrani et al This thesis Alzahrani et al N 1 % 1 N2* % 2* Median-1 Median-2 Conservative only 4 15.0 10 11.4 SR10,149.5
($2707)** SD4,746.5
($12732)** Debridement 26 43.3 43 48.8 SR15,323.5
($4,086) SD12,207.0
($3255) Minor amputation 21 35.0 5 5.7 SR34,828.0
($9,288) SD15,337.0
($4,090) Major amputation 9 21.0 30 34.1 SR77,133.0
(20,569) SD17,884.5
($4,769) N 1* %1* N2* %2* Mean-1* Mean-2* Conservative only 4 15.0 10 11.4 SR10,278.75
SD2,666.1
Debridement 26 43.3 43 48.8 SR17,276.00
SD3,443.2
Minor amputation 21 35.0 5 5.7 SR35,892.33
SD2,629.8
Major amputation 9 21.0 30 34.1 SR85,921.67
SD3,753.9
* 2 Data retrieved from findings of Alzahrani et al, 2013). ** SR = $0.267; or $ = 3.75
One-Sample Kolmogorov-Smirnov Test
60 6057.28 33622.082.650 26067.073.174 .190.153 .190
-.174 -.1811.348 1.470.053 .027
NMeanStd. Deviation
Normal Parameters a,b
AbsolutePositiveNegative
Most ExtremeDifferences
Kolmogorov-Smirnov ZAsymp. Sig. (2-tailed)
Age_y SR
Test distribution is Normal.a. Calculated from data.b.

Turki Bafaraj “Economics of the diabetic foot: a cost-of-illness study in Saudi Arabia” ___________________________________________________________________________
85
B- Analytical Statistics Phase 1: The Relationship between Determinants & Intervention Types Correlations Age_y SR
Correlation Coefficient 1.000 .467(**)
Sig. (2-tailed) . 0.000 N 60 60
Correlation Coefficient .467(**) 1.000
Sig. (2-tailed) 0.000 . N 60 60
** Correlation is significant at the 0.01 level (2-tailed). Frequency Distribution: Sex
Frequency Distribution: Type of Intervention
Sex Nominal
17 28.3 28.3 28.343 71.7 71.7 100.060 100.0 100.0
fmTotal
ValidFrequency Percent Valid Percent
CumulativePercent
Intervention
4 6.7 6.7 6.726 43.3 43.3 50.09 15.0 15.0 65.0
21 35.0 35.0 100.060 100.0 100.0
Conservative onlydebridementmajor amputationminor amputationTotal
ValidFrequency Percent Valid Percent
CumulativePercent

Turki Bafaraj “Economics of the diabetic foot: a cost-of-illness study in Saudi Arabia” ___________________________________________________________________________
86
Cross Tabulation-1: Age vs. Intervention
Case Processing Summary
60 100.0% 0 .0% 60 100.0%Age_Cat * InterventionN Percent N Percent N Percent
Valid Missing TotalCases
Age_Cat * Intervention Crosstabulation
2 4 0 0 6.4 2.6 .9 2.1 6.0
33.3% 66.7% .0% .0% 100.0%50.0% 15.4% .0% .0% 10.0%3.3% 6.7% .0% .0% 10.0%
2 22 9 21 543.6 23.4 8.1 18.9 54.0
3.7% 40.7% 16.7% 38.9% 100.0%50.0% 84.6% 100.0% 100.0% 90.0%3.3% 36.7% 15.0% 35.0% 90.0%
4 26 9 21 604.0 26.0 9.0 21.0 60.0
6.7% 43.3% 15.0% 35.0% 100.0%100.0% 100.0% 100.0% 100.0% 100.0%
6.7% 43.3% 15.0% 35.0% 100.0%
CountExpected Count% within Age_Cat% within Intervention% of TotalCountExpected Count% within Age_Cat% within Intervention% of TotalCountExpected Count% within Age_Cat% within Intervention% of Total
1
2
Age_Cat
Total
Conservativeonly debridement
majoramputation
minoramputation
Intervention
Total
Chi-Square Tests
11.282a 3 .010 .01111.140 3 .011 .0108.568 .016
. . .b
60
Pearson Chi-SquareLikelihood RatioFisher's Exact TestMcNemar-Bowker TestN of Valid Cases
Value dfAsymp. Sig.(2-sided)
Exact Sig.(2-sided)
5 cells (62.5%) have expected count less than 5. The minimum expectedcount is .40.
a.
Computed only for a PxP table, where P must be greater than 1.b.

Turki Bafaraj “Economics of the diabetic foot: a cost-of-illness study in Saudi Arabia” ___________________________________________________________________________
87
Cross Tabulation-2: Sex vs. Intervention
Case Processing Summary
60 100.0% 0 .0% 60 100.0%Sex Nominal* Intervention
N Percent N Percent N PercentValid Missing Total
Cases
Sex Nominal * Intervention Crosstabulation
3 19 6 15 432.9 18.6 6.5 15.1 43.0
7.0% 44.2% 14.0% 34.9% 100.0%75.0% 73.1% 66.7% 71.4% 71.7%5.0% 31.7% 10.0% 25.0% 71.7%
1 7 3 6 171.1 7.4 2.6 6.0 17.0
5.9% 41.2% 17.6% 35.3% 100.0%25.0% 26.9% 33.3% 28.6% 28.3%1.7% 11.7% 5.0% 10.0% 28.3%
4 26 9 21 604.0 26.0 9.0 21.0 60.0
6.7% 43.3% 15.0% 35.0% 100.0%100.0% 100.0% 100.0% 100.0% 100.0%
6.7% 43.3% 15.0% 35.0% 100.0%
CountExpected Count% within Sex Nominal% within Intervention% of TotalCountExpected Count% within Sex Nominal% within Intervention% of TotalCountExpected Count% within Sex Nominal% within Intervention% of Total
m
f
Sex Nominal
Total
Conservativeonly debridement
majoramputation
minoramputation
Intervention
Total
Chi-Square Tests
.159a 3 .984 1.000
.156 3 .984 1.000
.427 .968. . .b
60
Pearson Chi-SquareLikelihood RatioFisher's Exact TestMcNemar-Bowker TestN of Valid Cases
Value dfAsymp. Sig.(2-sided)
Exact Sig.(2-sided)
3 cells (37.5%) have expected count less than 5. The minimum expectedcount is 1.13.
a.
Computed only for a PxP table, where P must be greater than 1.b.

Turki Bafaraj “Economics of the diabetic foot: a cost-of-illness study in Saudi Arabia” ___________________________________________________________________________
88
Cross Tabulation-3: Nationlity vs. Intervention Nationality * Intervention Cross-tabulation
Intervention Total
0 1 2 3 Nationality 2.00 Count 1 11 1 0 13
Expected Count .9 5.6 4.6 2.0 13.0 % within Nationality 7.7% 84.6% 7.7% .0% 100.0% % within Intervention 25.0% 42.3% 4.8% .0% 21.7% % of Total 1.7% 18.3% 1.7% .0% 21.7%
1.00 Count 3 15 20 9 47 Expected Count 3.1 20.4 16.5 7.1 47.0 % within Nationality 6.4% 31.9% 42.6% 19.1% 100.0% % within Intervention 75.0% 57.7% 95.2% 100.0% 78.3% % of Total 5.0% 25.0% 33.3% 15.0% 78.3%
Total Count 4 26 21 9 60 Expected Count 4.0 26.0 21.0 9.0 60.0 % within Nationality 6.7% 43.3% 35.0% 15.0% 100.0% % within Intervention 100.0% 100.0% 100.0% 100.0% 100.0% % of Total 6.7% 43.3% 35.0% 15.0% 100.0%
Chi-Square Tests
Value df Asymp. Sig.
(2-sided) Exact Sig. (2-sided)
Exact Sig. (1-sided)
Point Probability
Pearson Chi-Square 12.578(a) 3 .006 .006 Likelihood Ratio 14.754 3 .002 .003 Fisher's Exact Test 11.980 .004 Linear-by-Linear Association 8.210(b) 1 .004 .004 .003 .002
N of Valid Cases 60
a 4 cells (50.0%) have expected count less than 5. The minimum expected count is .87. b The standardized statistic is -2.865.

Turki Bafaraj “Economics of the diabetic foot: a cost-of-illness study in Saudi Arabia” ___________________________________________________________________________
89
Phase 2: The Relationship between Determinants & COI Age vs. COI: Correlation Analysis Correlations Age_y SR Spearman's rho
Age_y
Correlation Coefficient 1.000 .467(**)
Sig. (2-tailed) . .000 N 60 60
SR Correlation Coefficient .467(**) 1.000
Sig. (2-tailed) .000 . N 60 60
** Correlation is significant at the 0.01 level (2-tailed).
Nationality vs. COI: Mann-Whitney Test Ranks
Nationality N Mean Rank Sum of Ranks SR 1.00 47 33.87 1592.00
2.00 13 18.31 238.00 Total 60
Test Statistics(a) SR Mann-Whitney U 147.000 Wilcoxon W 238.000 Z -2.844 Asymp. Sig. (2-tailed) .004
a Grouping Variable: Nationality

Turki Bafaraj “Economics of the diabetic foot: a cost-of-illness study in Saudi Arabia” ___________________________________________________________________________
90
Difference in COI Means in DFDs Groups: One-Way ANOVA Test: 1- One way Descriptives SR
N Mean Std.
Deviation Std. Error 95% Confidence Interval
for Mean
Lower Bound
Upper Bound
0 4 10278.75 480.683 240.342 9513.88 11043.62
1 26 17276.00 5396.722 1058.384 15096.22 19455.78
2 21 35892.33 6109.515 1333.205 33111.32 38673.35
3 9 85921.67
24399.183 8133.061 67166.79 104676.54
Total 60 33622.08
26067.073 3365.245 26888.24 40355.92
Test of Homogeneity of Variances SR
Levene Statistic df1 df2 Sig.
12.204 3 56 .000 ANOVA SR
Sum of Squares df
Mean Square F Sig.
Between Groups
33852152781.167 3 112840509
27.056 101.301 .000
Within Groups 6237893043.417 56 111390947.
204
Total 40090045824.583 59

Turki Bafaraj “Economics of the diabetic foot: a cost-of-illness study in Saudi Arabia” ___________________________________________________________________________
91
Post Hoc Tests Multiple Comparisons Dependent Variable: SR LSD
(I)
Intervention
(J)
Intervention
Mean
Difference
(I-J) Std. Error Sig.
95% Confidence
Interval
Upper
Bound
Lower
Bound
0 1 -6997.250 5668.510 0.222 -18352.64 4358.14
2 -25613.583(*) 5757.783 0.000 -37147.81 -14079.36
3 -75642.917(*) 6342.279 0.000 -88348.03 -62937.80
1 0 6997.250 5668.510 0.222 -4358.14 18352.64
2 -18616.333(*) 3096.546 0.000 -24819.46 -12413.21
3 -68645.667(*) 4081.794 0.000 -76822.48 -60468.85
2 0 25613.583(*) 5757.783 0.000 14079.36 37147.81
1 18616.333(*) 3096.546 0.000 12413.21 24819.46
3 -50029.333(*) 4204.890 0.000 -58452.74 -41605.93
3 0 75642.917(*) 6342.279 0.000 62937.80 88348.03
1 68645.667(*) 4081.794 0.000 60468.85 76822.48
2 50029.333(*) 4204.890 0.000 41605.93 58452.74
* The mean difference is significant at the .05 level.

Turki Bafaraj “Economics of the diabetic foot: a cost-of-illness study in Saudi Arabia” ___________________________________________________________________________
92
2- Kruskal Wallis Test NPar Tests
Phrasing Test Result: Debridement level is significantly the most frequently encountered
intervention (26=43.3%), followed by minor amputation (21=35%), major amputation
9=15.5%, and least was conservative treatment alone (4=6.7%) [H(df=3) = 51.5, p<0.001].
Descriptive Statistics
60 33622.08 26067.073 9859 141386 14582.75 27817.50 38916.0060 1.58 .829 0 3 1.00 1.50 2.00
SRIntervention
N Mean Std. Deviation Minimum Maximum 25th 50th (Median) 75thPercentiles
Ranks
4 2.5026 17.5021 41.009 56.00
60
Intervention0123Total
SRN Mean Rank
Test Statisticsa,b
51.4673
.000
Chi-SquaredfAsymp. Sig.
SR
Kruskal Wallis Testa.
Grouping Variable: Interventionb.
Test Statisticsb
60
27817.50
60.000a
3
.000
N
Median
Chi-Square
df
Asymp. Sig.
SR
4 cells (50.0%) have expected frequencies less than5. The minimum expected cell frequency is 2.0.
a.
Grouping Variable: Interventionb.

Turki Bafaraj “Economics of the diabetic foot: a cost-of-illness study in Saudi Arabia” ___________________________________________________________________________
93
Multiple Logistic Regression Analysis: Cost <35000 and >35000
Block 0: Beginning Block
Case Processing Summary
60 100.00 .0
60 100.00 .0
60 100.0
Unweighted Cases a
Included in AnalysisMissing CasesTotal
Selected Cases
Unselected CasesTotal
N Percent
If weight is in effect, see classification table for the totalnumber of cases.
a.
Dependent Variable Encoding
01
Original Value1.002.00
Internal Value
Categorical Variables Codings
17 1.00043 .000
fm
Sex NominalFrequency (1)
Parametercoding
Classification Tablea,b
41 0 100.019 0 .0
68.3
Observed1.002.00
Cost Category
Overall Percentage
Step 01.00 2.00
Cost Category PercentageCorrect
Predicted
Constant is included in the model.a. The cut value is .500b.

Turki Bafaraj “Economics of the diabetic foot: a cost-of-illness study in Saudi Arabia” ___________________________________________________________________________
94
Block 1: Method = Enter
Variables in the Equation
-.769 .278 7.680 1 .006 .463ConstantStep 0B S.E. Wald df Sig. Exp(B)
Variables not in the Equation
.144 1 .7048.510 1 .0048.552 2 .014
Sex(1)Age
Variables
Overall Statistics
Step0
Score df Sig.
Omnibus Tests of Model Coefficients
12.511 2 .00212.511 2 .00212.511 2 .002
StepBlockModel
Step 1Chi-square df Sig.
Model Summary
62.408a .188 .264Step1
-2 Loglikelihood
Cox & SnellR Square
NagelkerkeR Square
Estimation terminated at iteration number 6 becauseparameter estimates changed by less than .001.
a.
Hosmer and Lemeshow Test
6.505 8 .591Step1
Chi-square df Sig.

Turki Bafaraj “Economics of the diabetic foot: a cost-of-illness study in Saudi Arabia” ___________________________________________________________________________
95
Contingency Table for Hosmer and Lemeshow Test
6 5.880 0 .120 65 5.491 1 .509 65 4.334 0 .666 54 3.220 0 .780 43 4.691 3 1.309 63 2.779 1 1.221 45 4.648 2 2.352 76 5.284 4 4.716 101 2.045 4 2.955 53 2.627 4 4.373 7
12345678910
Step1
Observed ExpectedCost Category = 1.00
Observed ExpectedCost Category = 2.00
Total
Classification Tablea
37 4 90.211 8 42.1
75.0
Observed1.002.00
Cost Category
Overall Percentage
Step 11.00 2.00
Cost Category PercentageCorrect
Predicted
The cut value is .500a.
Variables in the Equation
-.141 .667 .045 1 .832 .868 .235 3.209.596 .210 8.003 1 .005 1.814 1.201 2.740
-35.221 12.262 8.250 1 .004 .000
Sex(1)AgeConstant
Step1
a
B S.E. Wald df Sig. Exp(B) Lower Upper95.0% C.I.for EXP(B)
Variable(s) entered on step 1: Sex, Age.a.

Turki Bafaraj “Economics of the diabetic foot: a cost-of-illness study in Saudi Arabia” ___________________________________________________________________________
96
Appendix E
Diabetic Foot Ulcer
Cited: ICD-9 Code Diabetic Foot Care http://www.smilediabetic.com/icd-9-code-diabetic-foot-care

Turki Bafaraj “Economics of the diabetic foot: a cost-of-illness study in Saudi Arabia” ___________________________________________________________________________
97
Appendix F
Thesis Timeline
Week 1 2 3 4 5 6 7 8 9 10 11 12 13 14 15 16 17 18 19
Starting February March April May June July August September Oct.
1 15 1 22 1 15 1 15 1 15 1 15 1 16 30 1 11 22 1 Preparation for master thesis
TH
ESIS
EN
D
Writing the proposal of master thesis Application for master thesis
Data collection
Initial analysis
Literature review I
Methodology
Final analysis Literature review II
Discussion
Conclusion
Introduction
Abstract Revision and corrections
Final revision
Printing Submission of Master thesis