handbook of statistics on indian securities market … · 63 comparative valuations of indices 75....
TRANSCRIPT
HANDBOOK OF STATISTICS ON INDIAN SECURITIES MARKET 2011
HANDBOOK OF STATISTICS ON INDIAN SECURITIES MARKET 2014
HA
ND
BO
OK
OF STA
TISTICS O
N IN
DIA
N SEC
UR
ITIES MA
RK
ET 20
14
i
HANDBOOK OF STATISTICSON THE
INDIAN SECURITIES MARKET 2014
ii
Conventions used in this report:` : Indian Rupees
Lakh : One Hundred Thousand
Million : Ten Lakh
Crore : 10 Million
Billion : 1000 Million / 100 Crore
$ : US Dollar
NA : Not Available
Na : Not Applicable
● Difference in total may be due to rounding off and may not add up to exactly hundred percent.
● Data in a few tables have revised and hence may not match with previous issues.
Copies available at: Department of Economic and Policy Analysis Securities and Exchange Board of India Plot No. C4-A, “G”Block, Bandra Kurla Complex, Bandra(East), Mumbai – 400 051
iii
FOREWORD
We live in challenging and exciting times driven by fast pace of technology and the resultant creation
of huge amount of data. It is an intense challenge for the regulator and stakeholders to keep pace with
the rate, speed and quantum of data. Extracting information from data and using it to predict future
trends and behavior patterns can be extremely handy for informed decisions. In this context, availability
and accessibility of reliable, timely and accurate data can be termed as an asset which needs to be
disseminated as a public good.
Regulatory compliance can be enhanced and ensured by getting access and control of various
disintegrated and scattered data and integrating them into a centralized system, which can then be
used for meaningful policy making. SEBI has set up Data Warehouse which has the potential to meet its
surveillance, investigation and research requirements. While statistics on securities markets is needed
to make informed policy decisions for us, it is also a pre-requisite for the genuine empowerment of
stakeholders, researchers and investors. Thus it is the onus and obligation for SEBI to disseminate
data and ensure transparency within its regulatory purview.
The “Handbook of Statistics on Indian Securities Market” published by Securities and Exchange
Board of India has been the flagship publication anchoring SEBI’s data dissemination endeavor. This
began in 2004 with the objective of wider transmission of statistics on securities market in the public
domain. Over the years, the scope of Handbook has improved with expansion of market horizons and
reforms in the market microstructure. As every year, The Handbook 2014 presents the statistics of the
domestic market with annual series and monthly series extending till December 2014. A glimpse of
the dimensions of the international securities market is unveiled through the section on annual series
of International Securities Markets.
Apart from SEBI and RBI, the sources of the data for this edition of Handbook have been Exchanges,
Depositories, Credit Rating Agencies, and Custodians etc. The central source of information for the
international data has been World Federation of Exchanges.
It is laudable that every year, Division of Publication and Statistics of Department of Economic and Policy
Analysis with their untiring efforts publishes the editions on time. I do hope that the publication would
help and enrich the various stakeholders including academicians, researchers and policy makers. I also
hope that users provide suggestions and feedback to improve scope and coverage of the future editions.
U.K. Sinha Chairman

iv
v
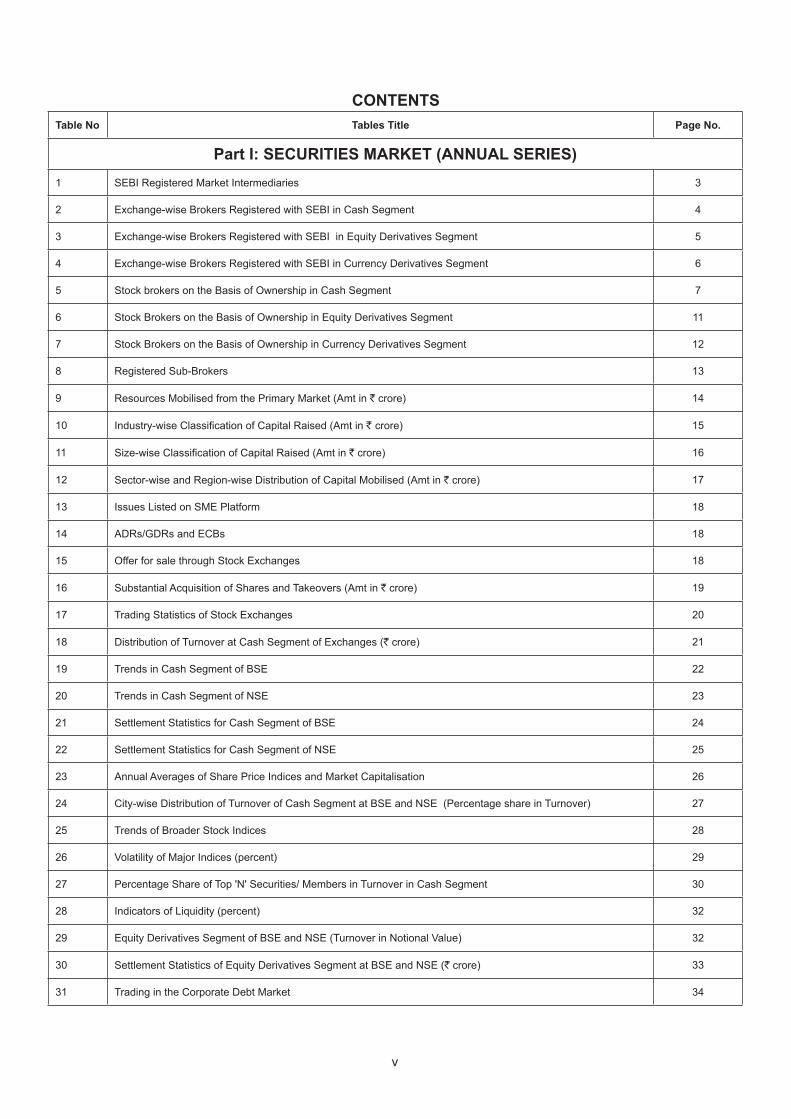
CONTENTSTable No Tables Title Page No.
Part I: SECURITIES MARKET (ANNUAL SERIES)1 SEBI Registered Market Intermediaries 3
2 Exchange-wise Brokers Registered with SEBI in Cash Segment 4
3 Exchange-wise Brokers Registered with SEBI in Equity Derivatives Segment 5
4 Exchange-wise Brokers Registered with SEBI in Currency Derivatives Segment 6
5 Stock brokers on the Basis of Ownership in Cash Segment 7
6 Stock Brokers on the Basis of Ownership in Equity Derivatives Segment 11
7 Stock Brokers on the Basis of Ownership in Currency Derivatives Segment 12
8 Registered Sub-Brokers 13
9 Resources Mobilised from the Primary Market (Amt in ` crore) 14
10 Industry-wise Classification of Capital Raised (Amt in ` crore) 15
11 Size-wise Classification of Capital Raised (Amt in ` crore) 16
12 Sector-wise and Region-wise Distribution of Capital Mobilised (Amt in ` crore) 17
13 Issues Listed on SME Platform 18
14 ADRs/GDRs and ECBs 18
15 Offer for sale through Stock Exchanges 18
16 Substantial Acquisition of Shares and Takeovers (Amt in ` crore) 19
17 Trading Statistics of Stock Exchanges 20
18 Distribution of Turnover at Cash Segment of Exchanges (` crore) 21
19 Trends in Cash Segment of BSE 22
20 Trends in Cash Segment of NSE 23
21 Settlement Statistics for Cash Segment of BSE 24
22 Settlement Statistics for Cash Segment of NSE 25
23 Annual Averages of Share Price Indices and Market Capitalisation 26
24 City-wise Distribution of Turnover of Cash Segment at BSE and NSE (Percentage share in Turnover) 27
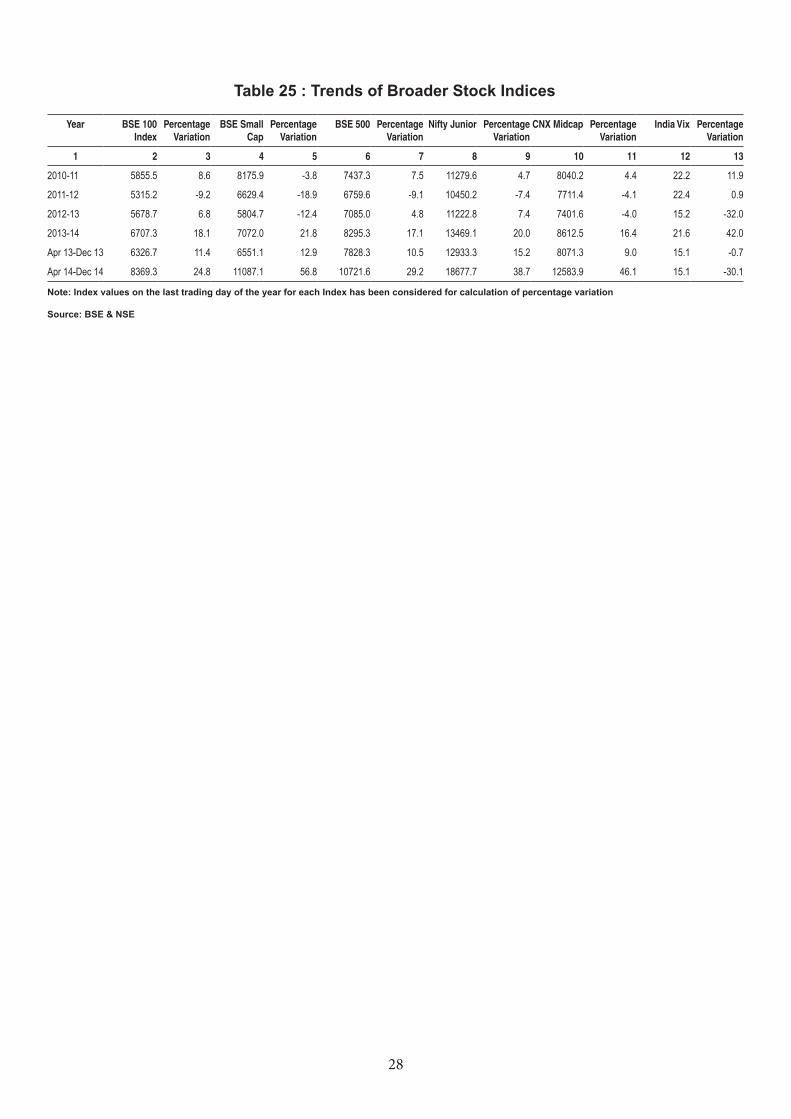
25 Trends of Broader Stock Indices 28
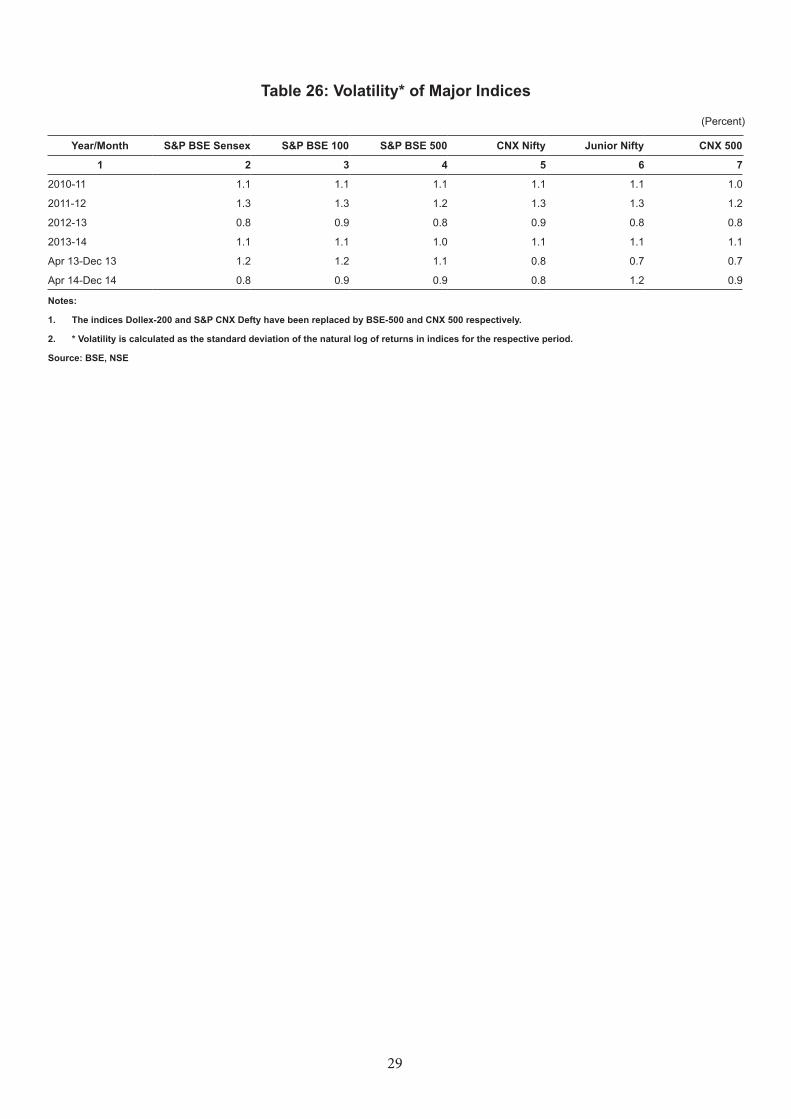
26 Volatility of Major Indices (percent) 29
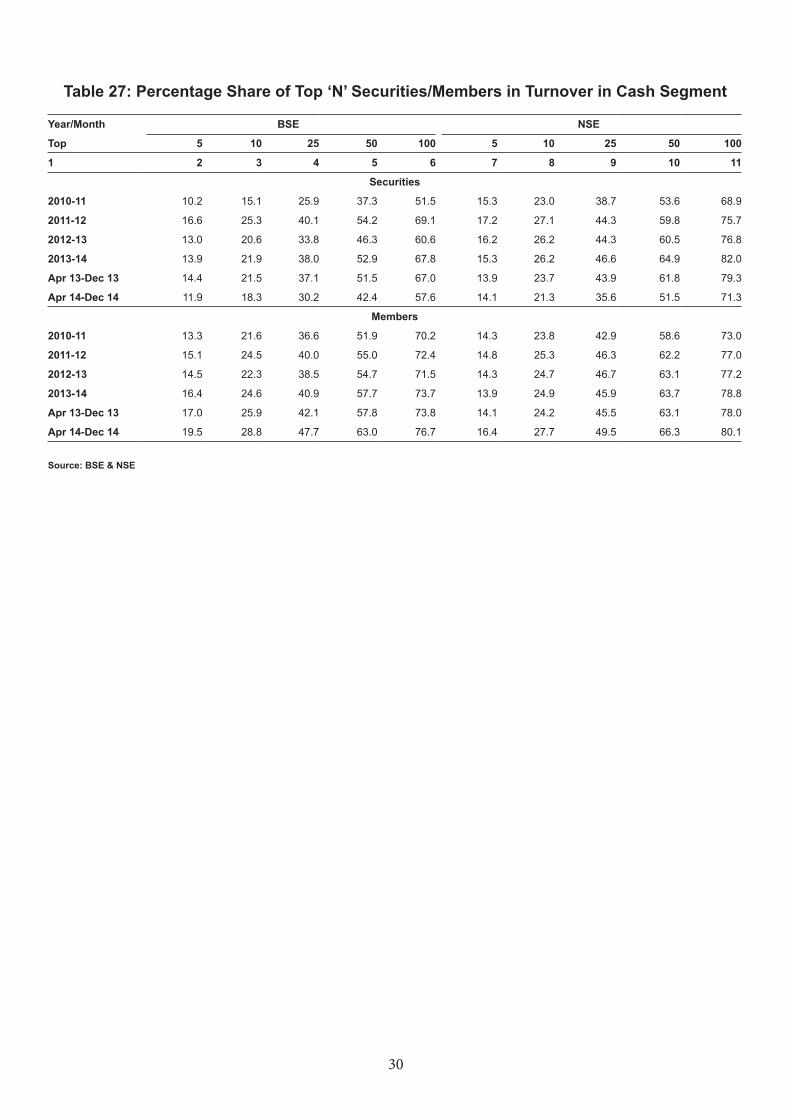
27 Percentage Share of Top 'N' Securities/ Members in Turnover in Cash Segment 30
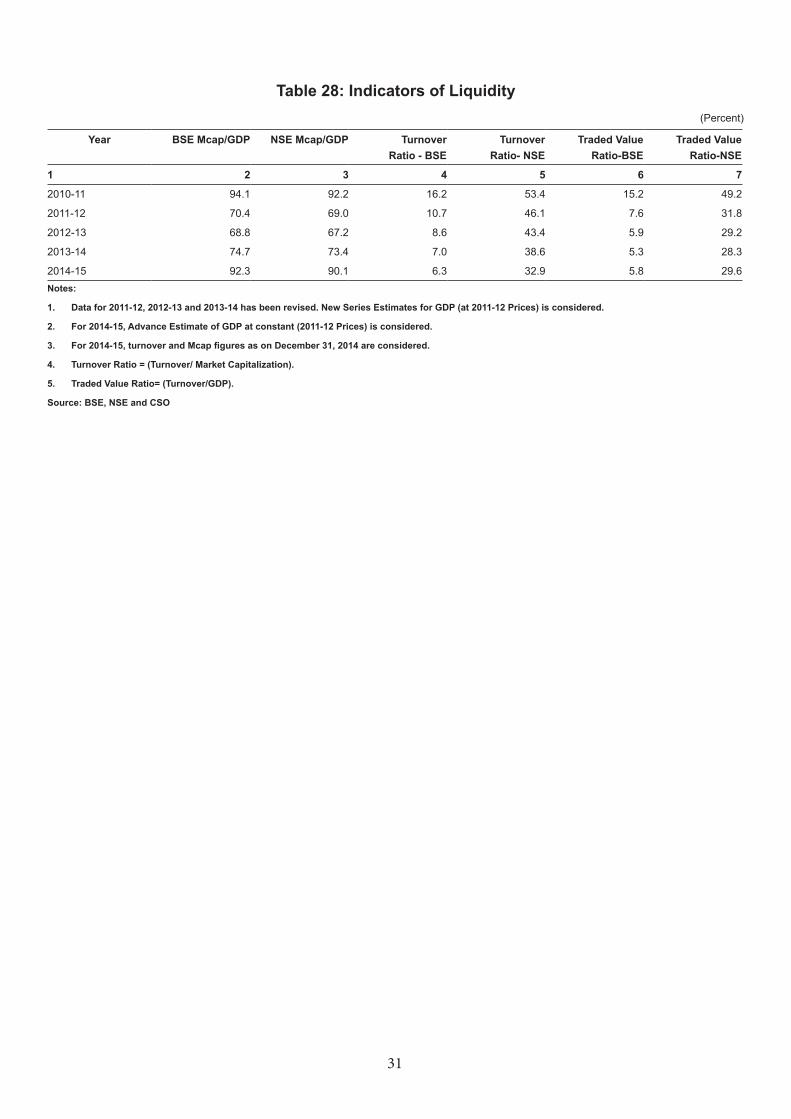
28 Indicators of Liquidity (percent) 32
29 Equity Derivatives Segment of BSE and NSE (Turnover in Notional Value) 32
30 Settlement Statistics of Equity Derivatives Segment at BSE and NSE (` crore) 33
31 Trading in the Corporate Debt Market 34
vi
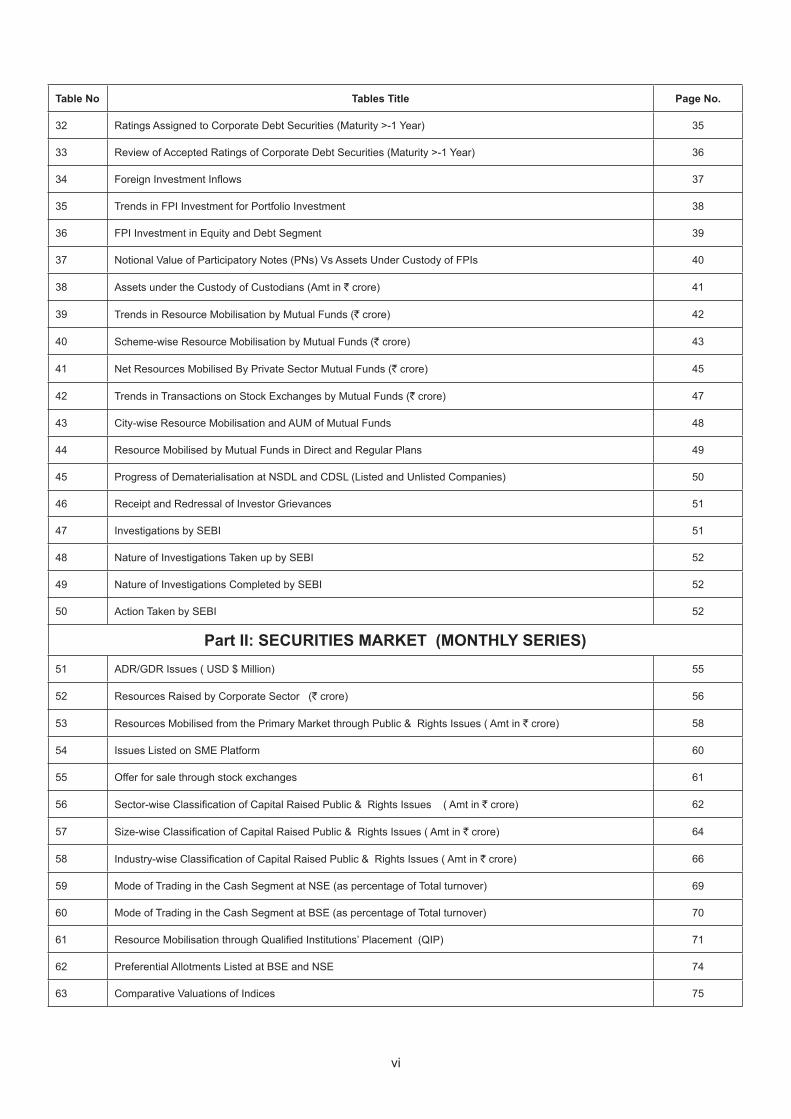
Table No Tables Title Page No.
32 Ratings Assigned to Corporate Debt Securities (Maturity >-1 Year) 35
33 Review of Accepted Ratings of Corporate Debt Securities (Maturity >-1 Year) 36
34 Foreign Investment Inflows 37
35 Trends in FPI Investment for Portfolio Investment 38
36 FPI Investment in Equity and Debt Segment 39
37 Notional Value of Participatory Notes (PNs) Vs Assets Under Custody of FPIs 40
38 Assets under the Custody of Custodians (Amt in ` crore) 41
39 Trends in Resource Mobilisation by Mutual Funds (` crore) 42
40 Scheme-wise Resource Mobilisation by Mutual Funds (` crore) 43
41 Net Resources Mobilised By Private Sector Mutual Funds (` crore) 45
42 Trends in Transactions on Stock Exchanges by Mutual Funds (` crore) 47
43 City-wise Resource Mobilisation and AUM of Mutual Funds 48
44 Resource Mobilised by Mutual Funds in Direct and Regular Plans 49
45 Progress of Dematerialisation at NSDL and CDSL (Listed and Unlisted Companies) 50
46 Receipt and Redressal of Investor Grievances 51
47 Investigations by SEBI 51
48 Nature of Investigations Taken up by SEBI 52
49 Nature of Investigations Completed by SEBI 52
50 Action Taken by SEBI 52
Part II: SECURITIES MARKET (MONTHLY SERIES)51 ADR/GDR Issues ( USD $ Million) 55
52 Resources Raised by Corporate Sector (` crore) 56
53 Resources Mobilised from the Primary Market through Public & Rights Issues ( Amt in ` crore) 58
54 Issues Listed on SME Platform 60
55 Offer for sale through stock exchanges 61
56 Sector-wise Classification of Capital Raised Public & Rights Issues ( Amt in ` crore) 62
57 Size-wise Classification of Capital Raised Public & Rights Issues ( Amt in ` crore) 64
58 Industry-wise Classification of Capital Raised Public & Rights Issues ( Amt in ` crore) 66
59 Mode of Trading in the Cash Segment at NSE (as percentage of Total turnover) 69
60 Mode of Trading in the Cash Segment at BSE (as percentage of Total turnover) 70
61 Resource Mobilisation through Qualified Institutions’ Placement (QIP) 71
62 Preferential Allotments Listed at BSE and NSE 74
63 Comparative Valuations of Indices 75
vii
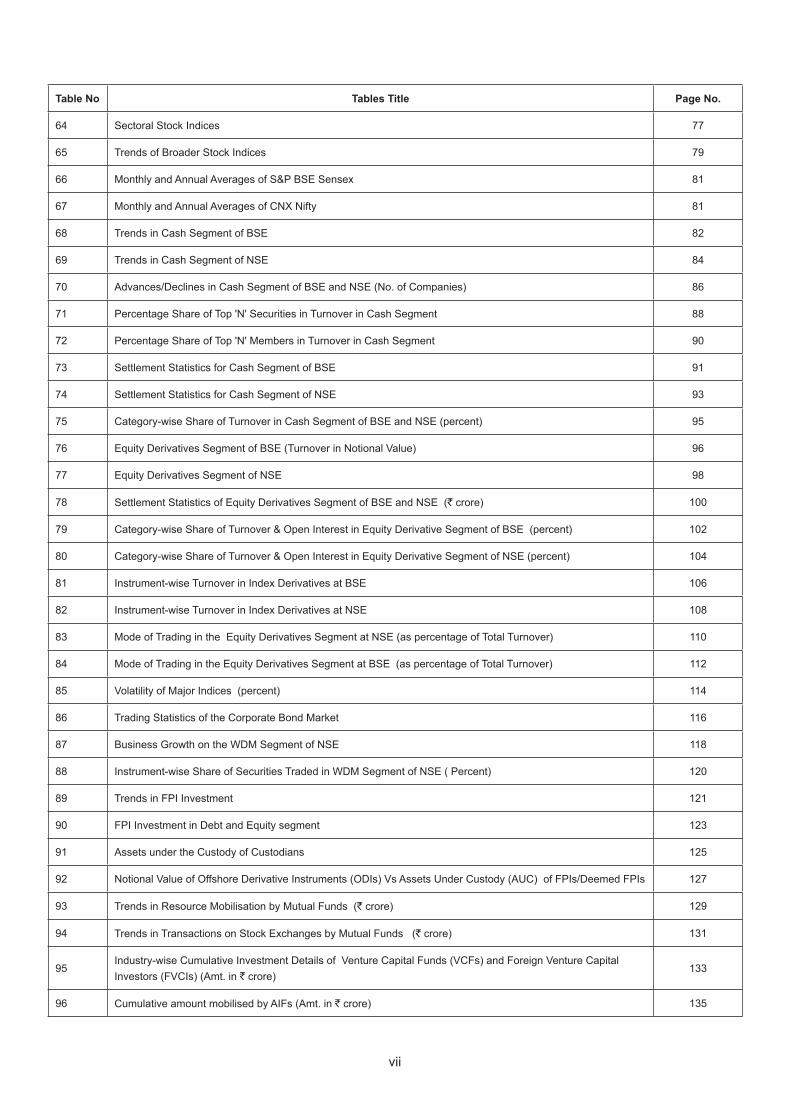
Table No Tables Title Page No.
64 Sectoral Stock Indices 77
65 Trends of Broader Stock Indices 79
66 Monthly and Annual Averages of S&P BSE Sensex 81
67 Monthly and Annual Averages of CNX Nifty 81
68 Trends in Cash Segment of BSE 82
69 Trends in Cash Segment of NSE 84
70 Advances/Declines in Cash Segment of BSE and NSE (No. of Companies) 86
71 Percentage Share of Top 'N' Securities in Turnover in Cash Segment 88
72 Percentage Share of Top 'N' Members in Turnover in Cash Segment 90
73 Settlement Statistics for Cash Segment of BSE 91
74 Settlement Statistics for Cash Segment of NSE 93
75 Category-wise Share of Turnover in Cash Segment of BSE and NSE (percent) 95
76 Equity Derivatives Segment of BSE (Turnover in Notional Value) 96
77 Equity Derivatives Segment of NSE 98
78 Settlement Statistics of Equity Derivatives Segment of BSE and NSE (` crore) 100
79 Category-wise Share of Turnover & Open Interest in Equity Derivative Segment of BSE (percent) 102
80 Category-wise Share of Turnover & Open Interest in Equity Derivative Segment of NSE (percent) 104
81 Instrument-wise Turnover in Index Derivatives at BSE 106
82 Instrument-wise Turnover in Index Derivatives at NSE 108
83 Mode of Trading in the Equity Derivatives Segment at NSE (as percentage of Total Turnover) 110
84 Mode of Trading in the Equity Derivatives Segment at BSE (as percentage of Total Turnover) 112
85 Volatility of Major Indices (percent) 114
86 Trading Statistics of the Corporate Bond Market 116
87 Business Growth on the WDM Segment of NSE 118
88 Instrument-wise Share of Securities Traded in WDM Segment of NSE ( Percent) 120
89 Trends in FPI Investment 121
90 FPI Investment in Debt and Equity segment 123
91 Assets under the Custody of Custodians 125
92 Notional Value of Offshore Derivative Instruments (ODIs) Vs Assets Under Custody (AUC) of FPIs/Deemed FPIs 127
93 Trends in Resource Mobilisation by Mutual Funds (` crore) 129
94 Trends in Transactions on Stock Exchanges by Mutual Funds (` crore) 131
95Industry-wise Cumulative Investment Details of Venture Capital Funds (VCFs) and Foreign Venture Capital Investors (FVCIs) (Amt. in ` crore)
133
96 Cumulative amount mobilised by AIFs (Amt. in ` crore) 135
viii
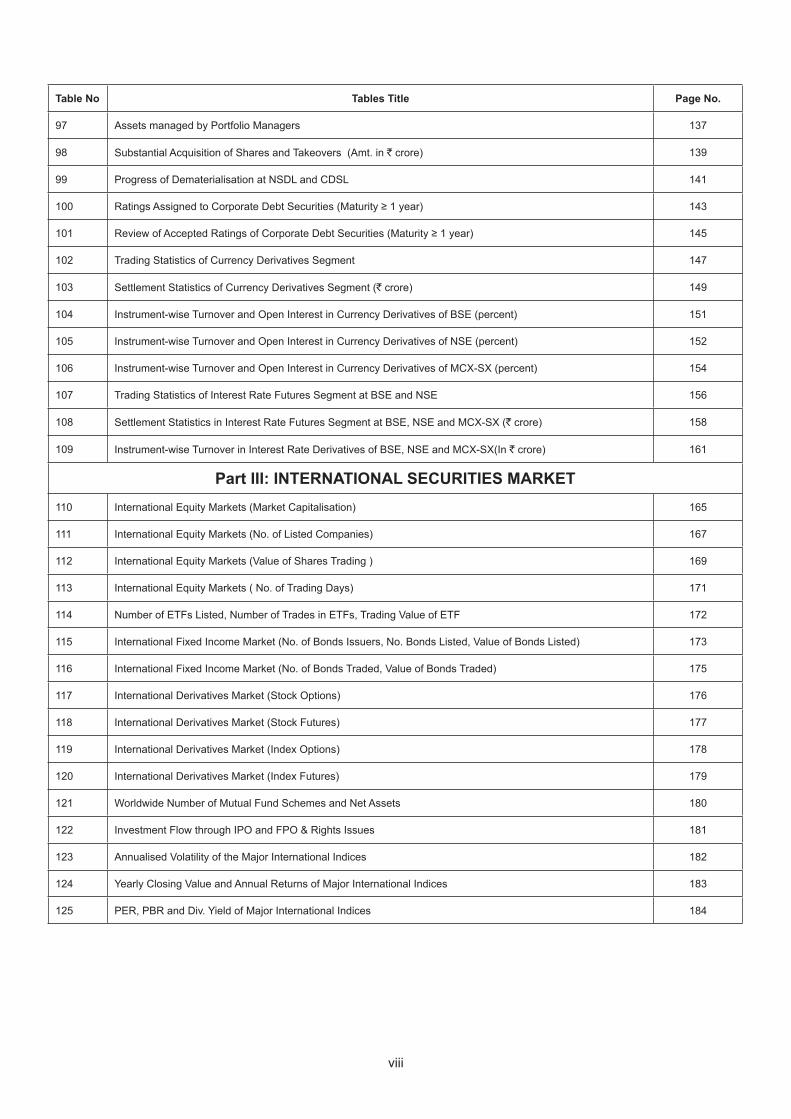
Table No Tables Title Page No.
97 Assets managed by Portfolio Managers 137
98 Substantial Acquisition of Shares and Takeovers (Amt. in ` crore) 139
99 Progress of Dematerialisation at NSDL and CDSL 141
100 Ratings Assigned to Corporate Debt Securities (Maturity ≥ 1 year) 143
101 Review of Accepted Ratings of Corporate Debt Securities (Maturity ≥ 1 year) 145
102 Trading Statistics of Currency Derivatives Segment 147
103 Settlement Statistics of Currency Derivatives Segment (` crore) 149
104 Instrument-wise Turnover and Open Interest in Currency Derivatives of BSE (percent) 151
105 Instrument-wise Turnover and Open Interest in Currency Derivatives of NSE (percent) 152
106 Instrument-wise Turnover and Open Interest in Currency Derivatives of MCX-SX (percent) 154
107 Trading Statistics of Interest Rate Futures Segment at BSE and NSE 156
108 Settlement Statistics in Interest Rate Futures Segment at BSE, NSE and MCX-SX (` crore) 158
109 Instrument-wise Turnover in Interest Rate Derivatives of BSE, NSE and MCX-SX(In ` crore) 161
Part III: INTERNATIONAL SECURITIES MARKET110 International Equity Markets (Market Capitalisation) 165
111 International Equity Markets (No. of Listed Companies) 167
112 International Equity Markets (Value of Shares Trading ) 169
113 International Equity Markets ( No. of Trading Days) 171
114 Number of ETFs Listed, Number of Trades in ETFs, Trading Value of ETF 172
115 International Fixed Income Market (No. of Bonds Issuers, No. Bonds Listed, Value of Bonds Listed) 173
116 International Fixed Income Market (No. of Bonds Traded, Value of Bonds Traded) 175
117 International Derivatives Market (Stock Options) 176
118 International Derivatives Market (Stock Futures) 177
119 International Derivatives Market (Index Options) 178
120 International Derivatives Market (Index Futures) 179
121 Worldwide Number of Mutual Fund Schemes and Net Assets 180
122 Investment Flow through IPO and FPO & Rights Issues 181
123 Annualised Volatility of the Major International Indices 182
124 Yearly Closing Value and Annual Returns of Major International Indices 183
125 PER, PBR and Div. Yield of Major International Indices 184

1
PART ISECURITIES MARKET (ANNUAL SERIES)

2
3
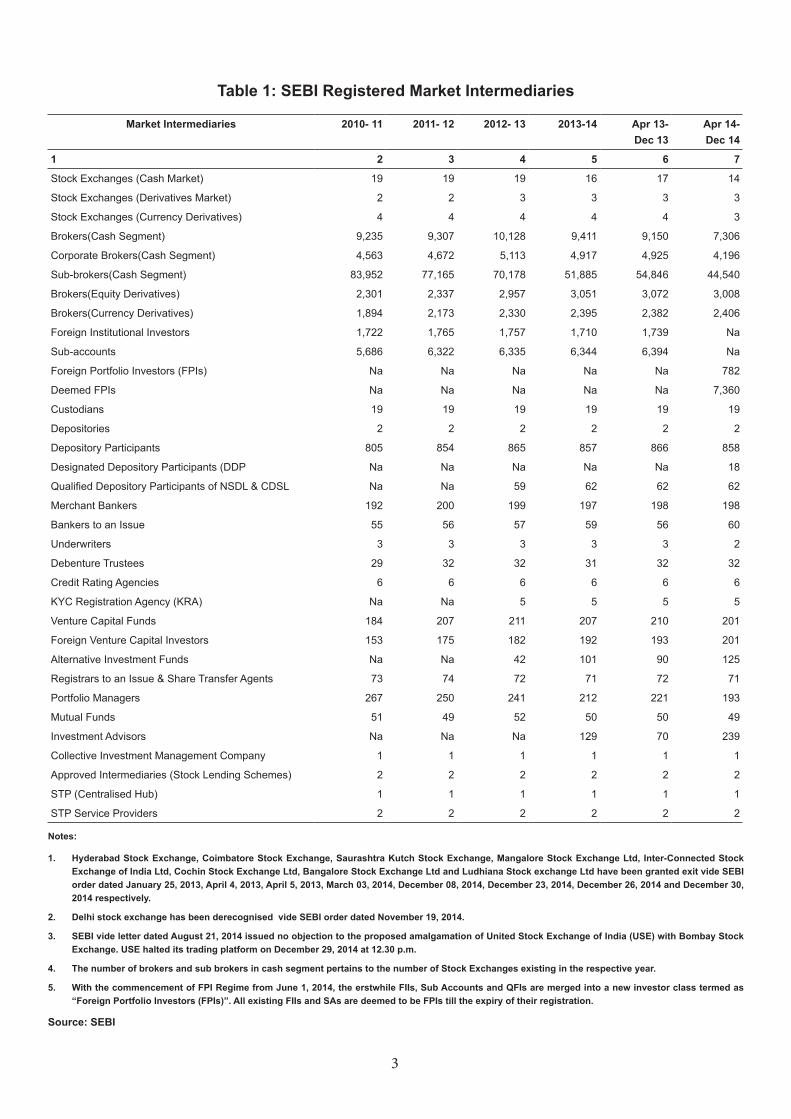
Table 1: SEBI Registered Market Intermediaries
Market Intermediaries 2010- 11 2011- 12 2012- 13 2013-14 Apr 13- Dec 13
Apr 14- Dec 14
1 2 3 4 5 6 7
Stock Exchanges (Cash Market) 19 19 19 16 17 14
Stock Exchanges (Derivatives Market) 2 2 3 3 3 3
Stock Exchanges (Currency Derivatives) 4 4 4 4 4 3
Brokers(Cash Segment) 9,235 9,307 10,128 9,411 9,150 7,306
Corporate Brokers(Cash Segment) 4,563 4,672 5,113 4,917 4,925 4,196
Sub-brokers(Cash Segment) 83,952 77,165 70,178 51,885 54,846 44,540
Brokers(Equity Derivatives) 2,301 2,337 2,957 3,051 3,072 3,008
Brokers(Currency Derivatives) 1,894 2,173 2,330 2,395 2,382 2,406
Foreign Institutional Investors 1,722 1,765 1,757 1,710 1,739 Na
Sub-accounts 5,686 6,322 6,335 6,344 6,394 Na
Foreign Portfolio Investors (FPIs) Na Na Na Na Na 782
Deemed FPIs Na Na Na Na Na 7,360
Custodians 19 19 19 19 19 19
Depositories 2 2 2 2 2 2
Depository Participants 805 854 865 857 866 858
Designated Depository Participants (DDP Na Na Na Na Na 18
Qualified Depository Participants of NSDL & CDSL Na Na 59 62 62 62
Merchant Bankers 192 200 199 197 198 198
Bankers to an Issue 55 56 57 59 56 60
Underwriters 3 3 3 3 3 2
Debenture Trustees 29 32 32 31 32 32
Credit Rating Agencies 6 6 6 6 6 6
KYC Registration Agency (KRA) Na Na 5 5 5 5
Venture Capital Funds 184 207 211 207 210 201
Foreign Venture Capital Investors 153 175 182 192 193 201
Alternative Investment Funds Na Na 42 101 90 125
Registrars to an Issue & Share Transfer Agents 73 74 72 71 72 71
Portfolio Managers 267 250 241 212 221 193
Mutual Funds 51 49 52 50 50 49
Investment Advisors Na Na Na 129 70 239
Collective Investment Management Company 1 1 1 1 1 1
Approved Intermediaries (Stock Lending Schemes) 2 2 2 2 2 2
STP (Centralised Hub) 1 1 1 1 1 1
STP Service Providers 2 2 2 2 2 2
Notes:
1. Hyderabad Stock Exchange, Coimbatore Stock Exchange, Saurashtra Kutch Stock Exchange, Mangalore Stock Exchange Ltd, Inter-Connected Stock Exchange of India Ltd, Cochin Stock Exchange Ltd, Bangalore Stock Exchange Ltd and Ludhiana Stock exchange Ltd have been granted exit vide SEBI order dated January 25, 2013, April 4, 2013, April 5, 2013, March 03, 2014, December 08, 2014, December 23, 2014, December 26, 2014 and December 30, 2014 respectively.
2. Delhi stock exchange has been derecognised vide SEBI order dated November 19, 2014.
3. SEBI vide letter dated August 21, 2014 issued no objection to the proposed amalgamation of United Stock Exchange of India (USE) with Bombay Stock Exchange. USE halted its trading platform on December 29, 2014 at 12.30 p.m.
4. The number of brokers and sub brokers in cash segment pertains to the number of Stock Exchanges existing in the respective year.
5. With the commencement of FPI Regime from June 1, 2014, the erstwhile FIIs, Sub Accounts and QFIs are merged into a new investor class termed as “Foreign Portfolio Investors (FPIs)”. All existing FIIs and SAs are deemed to be FPIs till the expiry of their registration.
Source: SEBI
4
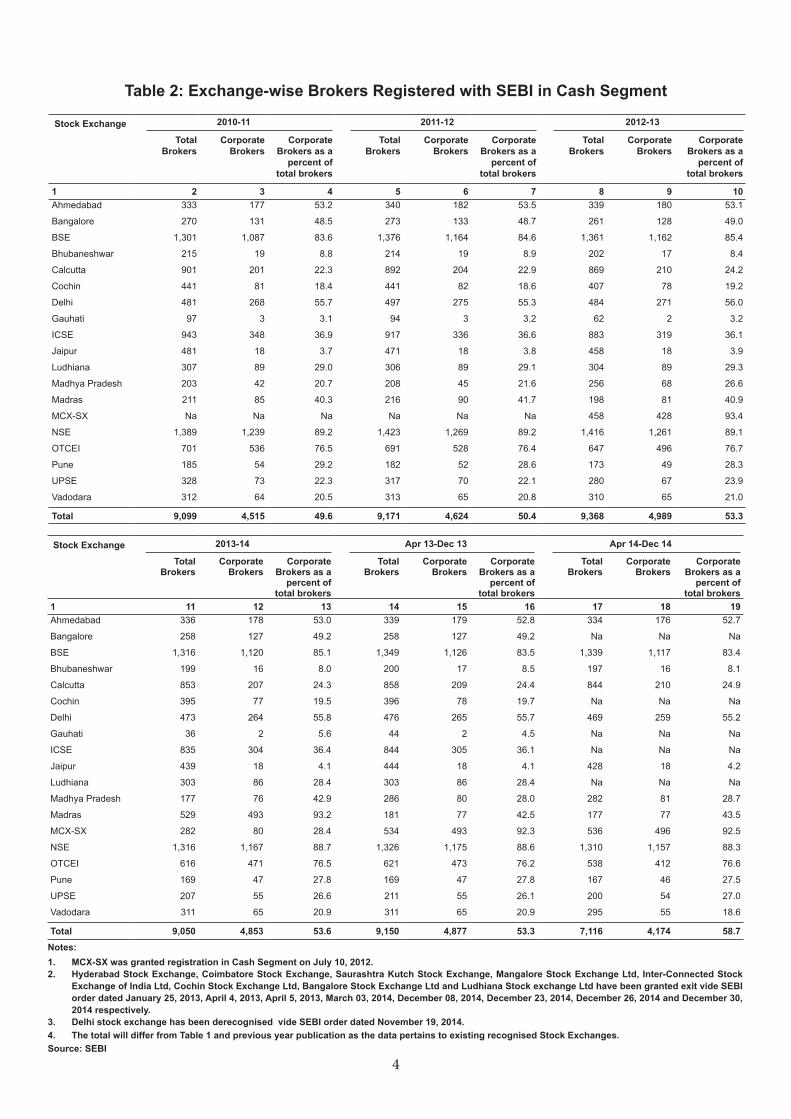
Table 2: Exchange-wise Brokers Registered with SEBI in Cash Segment
Stock Exchange 2010-11 2011-12 2012-13
Total Brokers
CorporateBrokers
Corporate Brokers as a
percent of total brokers
Total Brokers
CorporateBrokers
Corporate Brokers as a
percent of total brokers
Total Brokers
CorporateBrokers
Corporate Brokers as a
percent of total brokers
1 2 3 4 5 6 7 8 9 10Ahmedabad 333 177 53.2 340 182 53.5 339 180 53.1
Bangalore 270 131 48.5 273 133 48.7 261 128 49.0
BSE 1,301 1,087 83.6 1,376 1,164 84.6 1,361 1,162 85.4
Bhubaneshwar 215 19 8.8 214 19 8.9 202 17 8.4
Calcutta 901 201 22.3 892 204 22.9 869 210 24.2
Cochin 441 81 18.4 441 82 18.6 407 78 19.2
Delhi 481 268 55.7 497 275 55.3 484 271 56.0
Gauhati 97 3 3.1 94 3 3.2 62 2 3.2
ICSE 943 348 36.9 917 336 36.6 883 319 36.1
Jaipur 481 18 3.7 471 18 3.8 458 18 3.9
Ludhiana 307 89 29.0 306 89 29.1 304 89 29.3
Madhya Pradesh 203 42 20.7 208 45 21.6 256 68 26.6
Madras 211 85 40.3 216 90 41.7 198 81 40.9
MCX-SX Na Na Na Na Na Na 458 428 93.4
NSE 1,389 1,239 89.2 1,423 1,269 89.2 1,416 1,261 89.1
OTCEI 701 536 76.5 691 528 76.4 647 496 76.7
Pune 185 54 29.2 182 52 28.6 173 49 28.3
UPSE 328 73 22.3 317 70 22.1 280 67 23.9
Vadodara 312 64 20.5 313 65 20.8 310 65 21.0
Total 9,099 4,515 49.6 9,171 4,624 50.4 9,368 4,989 53.3
Stock Exchange 2013-14 Apr 13-Dec 13 Apr 14-Dec 14
Total Brokers
CorporateBrokers
Corporate Brokers as a
percent of total brokers
Total Brokers
CorporateBrokers
Corporate Brokers as a
percent of total brokers
Total Brokers
CorporateBrokers
Corporate Brokers as a
percent of total brokers
1 11 12 13 14 15 16 17 18 19Ahmedabad 336 178 53.0 339 179 52.8 334 176 52.7
Bangalore 258 127 49.2 258 127 49.2 Na Na Na
BSE 1,316 1,120 85.1 1,349 1,126 83.5 1,339 1,117 83.4
Bhubaneshwar 199 16 8.0 200 17 8.5 197 16 8.1
Calcutta 853 207 24.3 858 209 24.4 844 210 24.9
Cochin 395 77 19.5 396 78 19.7 Na Na Na
Delhi 473 264 55.8 476 265 55.7 469 259 55.2
Gauhati 36 2 5.6 44 2 4.5 Na Na Na
ICSE 835 304 36.4 844 305 36.1 Na Na Na
Jaipur 439 18 4.1 444 18 4.1 428 18 4.2
Ludhiana 303 86 28.4 303 86 28.4 Na Na Na
Madhya Pradesh 177 76 42.9 286 80 28.0 282 81 28.7
Madras 529 493 93.2 181 77 42.5 177 77 43.5
MCX-SX 282 80 28.4 534 493 92.3 536 496 92.5
NSE 1,316 1,167 88.7 1,326 1,175 88.6 1,310 1,157 88.3
OTCEI 616 471 76.5 621 473 76.2 538 412 76.6
Pune 169 47 27.8 169 47 27.8 167 46 27.5
UPSE 207 55 26.6 211 55 26.1 200 54 27.0
Vadodara 311 65 20.9 311 65 20.9 295 55 18.6
Total 9,050 4,853 53.6 9,150 4,877 53.3 7,116 4,174 58.7Notes: 1. MCX-SX was granted registration in Cash Segment on July 10, 2012. 2. Hyderabad Stock Exchange, Coimbatore Stock Exchange, Saurashtra Kutch Stock Exchange, Mangalore Stock Exchange Ltd, Inter-Connected Stock
Exchange of India Ltd, Cochin Stock Exchange Ltd, Bangalore Stock Exchange Ltd and Ludhiana Stock exchange Ltd have been granted exit vide SEBI order dated January 25, 2013, April 4, 2013, April 5, 2013, March 03, 2014, December 08, 2014, December 23, 2014, December 26, 2014 and December 30, 2014 respectively.
3. Delhi stock exchange has been derecognised vide SEBI order dated November 19, 2014. 4. The total will differ from Table 1 and previous year publication as the data pertains to existing recognised Stock Exchanges. Source: SEBI
5
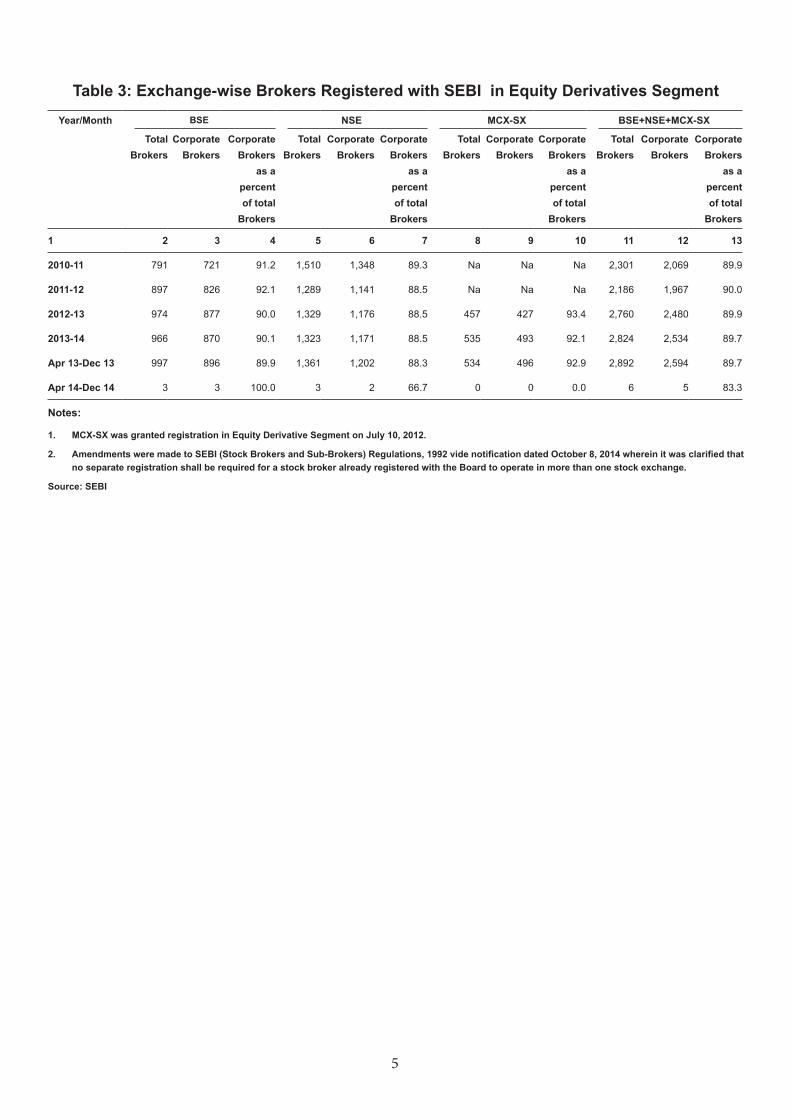
Table 3: Exchange-wise Brokers Registered with SEBI in Equity Derivatives SegmentYear/Month BSE NSE MCX-SX BSE+NSE+MCX-SX
Total Brokers
Corporate Brokers
Corporate Brokers
as a percent of total
Brokers
Total Brokers
Corporate Brokers
Corporate Brokers
as a percent of total
Brokers
Total Brokers
Corporate Brokers
Corporate Brokers
as a percent of total
Brokers
Total Brokers
Corporate Brokers
Corporate Brokers
as a percent of total
Brokers
1 2 3 4 5 6 7 8 9 10 11 12 13
2010-11 791 721 91.2 1,510 1,348 89.3 Na Na Na 2,301 2,069 89.9
2011-12 897 826 92.1 1,289 1,141 88.5 Na Na Na 2,186 1,967 90.0
2012-13 974 877 90.0 1,329 1,176 88.5 457 427 93.4 2,760 2,480 89.9
2013-14 966 870 90.1 1,323 1,171 88.5 535 493 92.1 2,824 2,534 89.7
Apr 13-Dec 13 997 896 89.9 1,361 1,202 88.3 534 496 92.9 2,892 2,594 89.7
Apr 14-Dec 14 3 3 100.0 3 2 66.7 0 0 0.0 6 5 83.3
Notes:
1. MCX-SX was granted registration in Equity Derivative Segment on July 10, 2012.
2. Amendments were made to SEBI (Stock Brokers and Sub-Brokers) Regulations, 1992 vide notification dated October 8, 2014 wherein it was clarified that no separate registration shall be required for a stock broker already registered with the Board to operate in more than one stock exchange.
Source: SEBI
6
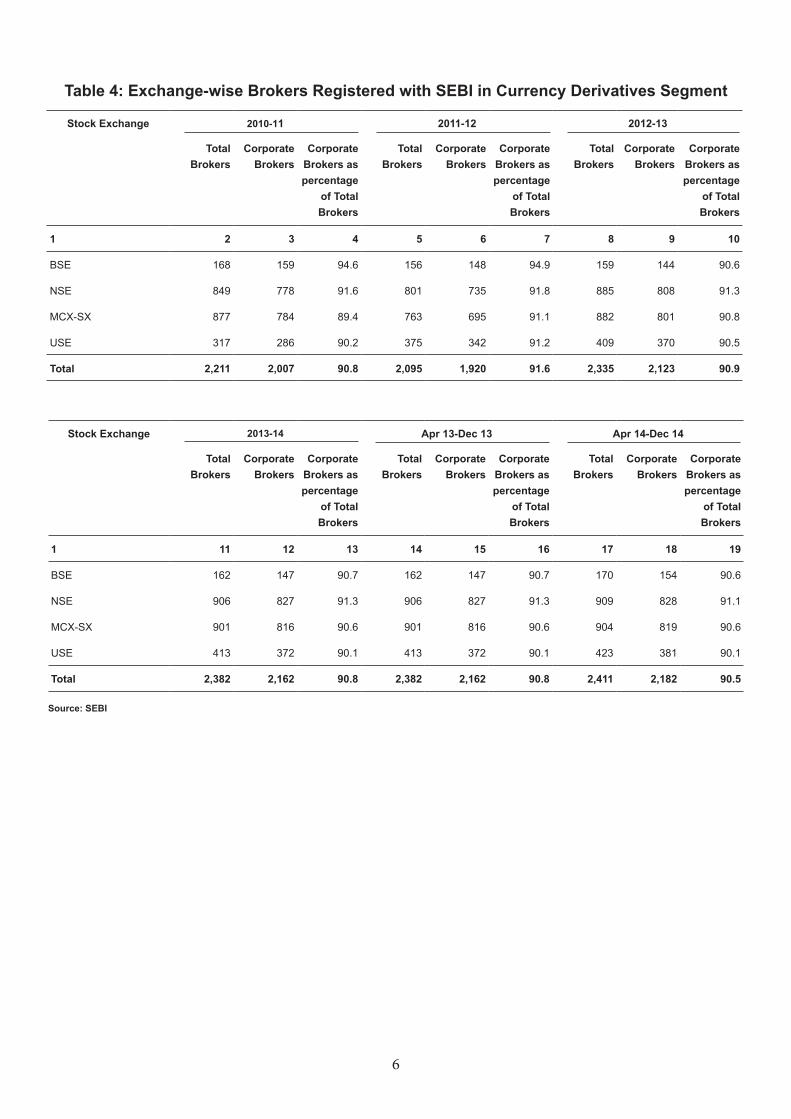
Table 4: Exchange-wise Brokers Registered with SEBI in Currency Derivatives Segment
Stock Exchange 2013-14 Apr 13-Dec 13 Apr 14-Dec 14
Total Brokers
Corporate Brokers
Corporate Brokers as percentage
of Total Brokers
Total Brokers
Corporate Brokers
Corporate Brokers as percentage
of Total Brokers
Total Brokers
Corporate Brokers
Corporate Brokers as percentage
of Total Brokers
1 11 12 13 14 15 16 17 18 19
BSE 162 147 90.7 162 147 90.7 170 154 90.6
NSE 906 827 91.3 906 827 91.3 909 828 91.1
MCX-SX 901 816 90.6 901 816 90.6 904 819 90.6
USE 413 372 90.1 413 372 90.1 423 381 90.1
Total 2,382 2,162 90.8 2,382 2,162 90.8 2,411 2,182 90.5
Source: SEBI
Stock Exchange 2010-11 2011-12 2012-13
Total Brokers
Corporate Brokers
Corporate Brokers as percentage
of Total Brokers
Total Brokers
Corporate Brokers
Corporate Brokers as percentage
of Total Brokers
Total Brokers
Corporate Brokers
Corporate Brokers as percentage
of Total Brokers
1 2 3 4 5 6 7 8 9 10
BSE 168 159 94.6 156 148 94.9 159 144 90.6
NSE 849 778 91.6 801 735 91.8 885 808 91.3
MCX-SX 877 784 89.4 763 695 91.1 882 801 90.8
USE 317 286 90.2 375 342 91.2 409 370 90.5
Total 2,211 2,007 90.8 2,095 1,920 91.6 2,335 2,123 90.9
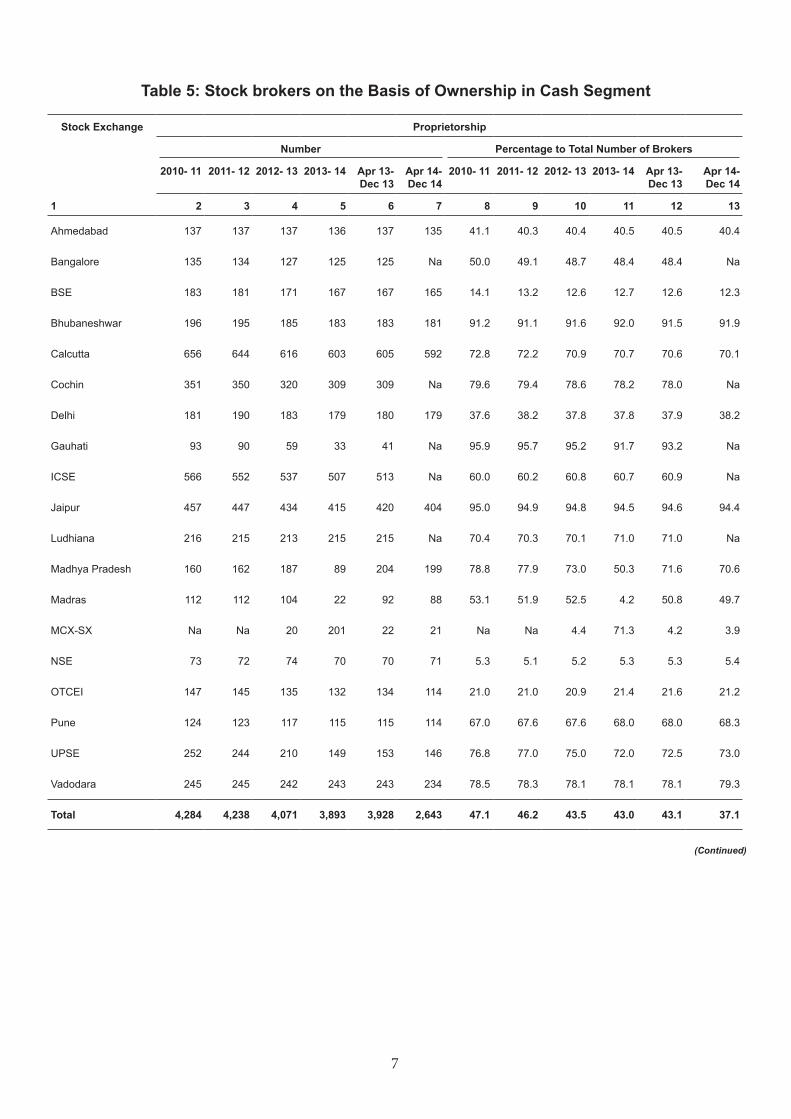
7
Stock Exchange Proprietorship
Number Percentage to Total Number of Brokers
2010- 11 2011- 12 2012- 13 2013- 14 Apr 13-Dec 13
Apr 14-Dec 14
2010- 11 2011- 12 2012- 13 2013- 14 Apr 13-Dec 13
Apr 14-Dec 14
1 2 3 4 5 6 7 8 9 10 11 12 13
Ahmedabad 137 137 137 136 137 135 41.1 40.3 40.4 40.5 40.5 40.4
Bangalore 135 134 127 125 125 Na 50.0 49.1 48.7 48.4 48.4 Na
BSE 183 181 171 167 167 165 14.1 13.2 12.6 12.7 12.6 12.3
Bhubaneshwar 196 195 185 183 183 181 91.2 91.1 91.6 92.0 91.5 91.9
Calcutta 656 644 616 603 605 592 72.8 72.2 70.9 70.7 70.6 70.1
Cochin 351 350 320 309 309 Na 79.6 79.4 78.6 78.2 78.0 Na
Delhi 181 190 183 179 180 179 37.6 38.2 37.8 37.8 37.9 38.2
Gauhati 93 90 59 33 41 Na 95.9 95.7 95.2 91.7 93.2 Na
ICSE 566 552 537 507 513 Na 60.0 60.2 60.8 60.7 60.9 Na
Jaipur 457 447 434 415 420 404 95.0 94.9 94.8 94.5 94.6 94.4
Ludhiana 216 215 213 215 215 Na 70.4 70.3 70.1 71.0 71.0 Na
Madhya Pradesh 160 162 187 89 204 199 78.8 77.9 73.0 50.3 71.6 70.6
Madras 112 112 104 22 92 88 53.1 51.9 52.5 4.2 50.8 49.7
MCX-SX Na Na 20 201 22 21 Na Na 4.4 71.3 4.2 3.9
NSE 73 72 74 70 70 71 5.3 5.1 5.2 5.3 5.3 5.4
OTCEI 147 145 135 132 134 114 21.0 21.0 20.9 21.4 21.6 21.2
Pune 124 123 117 115 115 114 67.0 67.6 67.6 68.0 68.0 68.3
UPSE 252 244 210 149 153 146 76.8 77.0 75.0 72.0 72.5 73.0
Vadodara 245 245 242 243 243 234 78.5 78.3 78.1 78.1 78.1 79.3
Total 4,284 4,238 4,071 3,893 3,928 2,643 47.1 46.2 43.5 43.0 43.1 37.1
Table 5: Stock brokers on the Basis of Ownership in Cash Segment
(Continued)
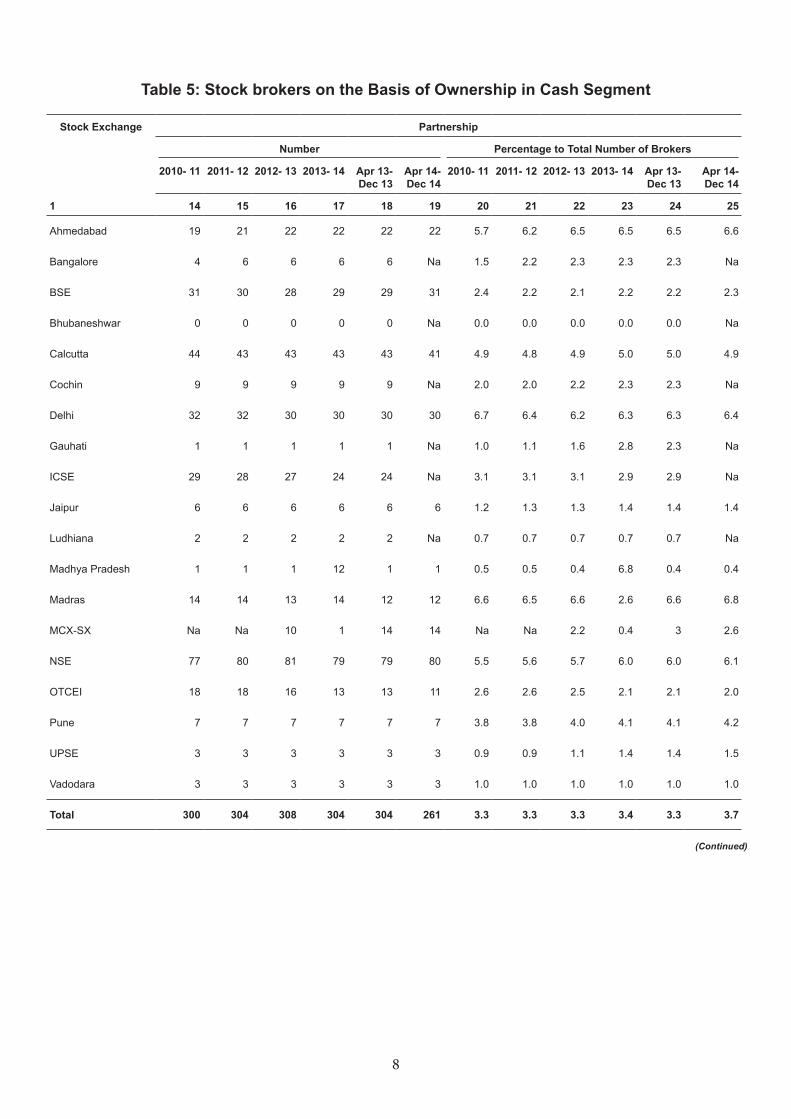
8
Stock Exchange Partnership
Number Percentage to Total Number of Brokers
2010- 11 2011- 12 2012- 13 2013- 14 Apr 13-Dec 13
Apr 14-Dec 14
2010- 11 2011- 12 2012- 13 2013- 14 Apr 13-Dec 13
Apr 14-Dec 14
1 14 15 16 17 18 19 20 21 22 23 24 25
Ahmedabad 19 21 22 22 22 22 5.7 6.2 6.5 6.5 6.5 6.6
Bangalore 4 6 6 6 6 Na 1.5 2.2 2.3 2.3 2.3 Na
BSE 31 30 28 29 29 31 2.4 2.2 2.1 2.2 2.2 2.3
Bhubaneshwar 0 0 0 0 0 Na 0.0 0.0 0.0 0.0 0.0 Na
Calcutta 44 43 43 43 43 41 4.9 4.8 4.9 5.0 5.0 4.9
Cochin 9 9 9 9 9 Na 2.0 2.0 2.2 2.3 2.3 Na
Delhi 32 32 30 30 30 30 6.7 6.4 6.2 6.3 6.3 6.4
Gauhati 1 1 1 1 1 Na 1.0 1.1 1.6 2.8 2.3 Na
ICSE 29 28 27 24 24 Na 3.1 3.1 3.1 2.9 2.9 Na
Jaipur 6 6 6 6 6 6 1.2 1.3 1.3 1.4 1.4 1.4
Ludhiana 2 2 2 2 2 Na 0.7 0.7 0.7 0.7 0.7 Na
Madhya Pradesh 1 1 1 12 1 1 0.5 0.5 0.4 6.8 0.4 0.4
Madras 14 14 13 14 12 12 6.6 6.5 6.6 2.6 6.6 6.8
MCX-SX Na Na 10 1 14 14 Na Na 2.2 0.4 3 2.6
NSE 77 80 81 79 79 80 5.5 5.6 5.7 6.0 6.0 6.1
OTCEI 18 18 16 13 13 11 2.6 2.6 2.5 2.1 2.1 2.0
Pune 7 7 7 7 7 7 3.8 3.8 4.0 4.1 4.1 4.2
UPSE 3 3 3 3 3 3 0.9 0.9 1.1 1.4 1.4 1.5
Vadodara 3 3 3 3 3 3 1.0 1.0 1.0 1.0 1.0 1.0
Total 300 304 308 304 304 261 3.3 3.3 3.3 3.4 3.3 3.7
Table 5: Stock brokers on the Basis of Ownership in Cash Segment
(Continued)
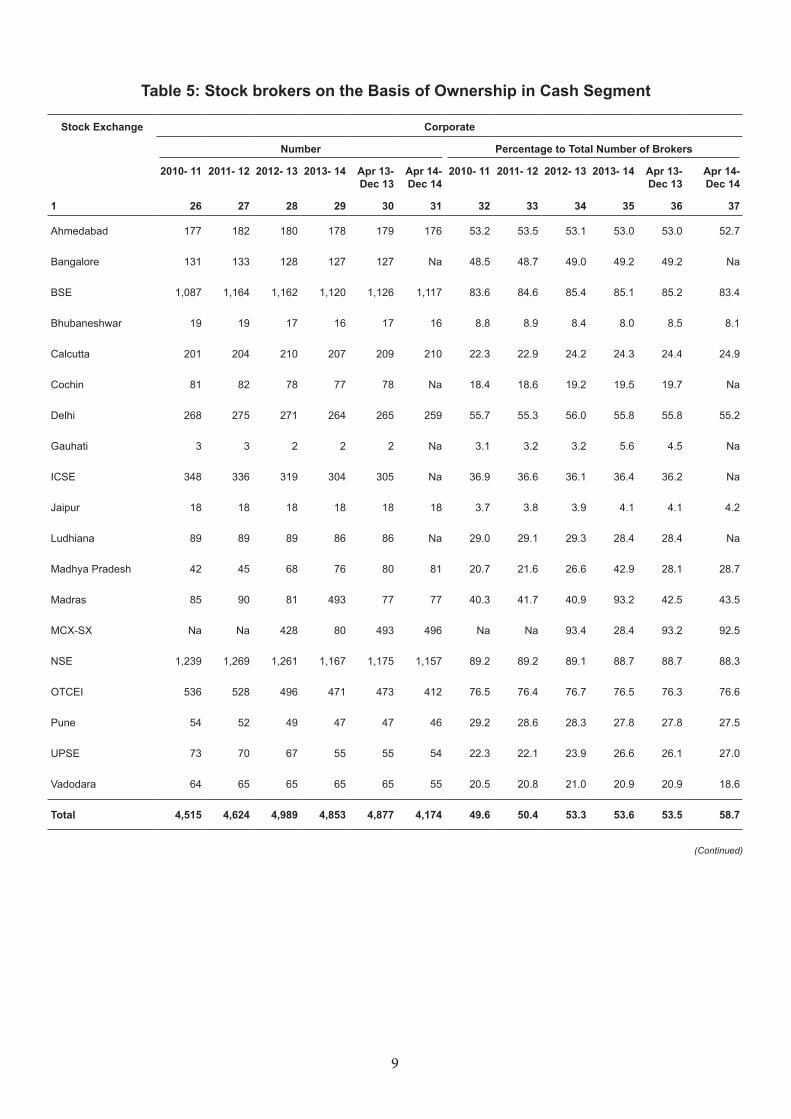
9
Stock Exchange Corporate
Number Percentage to Total Number of Brokers
2010- 11 2011- 12 2012- 13 2013- 14 Apr 13-Dec 13
Apr 14-Dec 14
2010- 11 2011- 12 2012- 13 2013- 14 Apr 13-Dec 13
Apr 14-Dec 14
1 26 27 28 29 30 31 32 33 34 35 36 37
Ahmedabad 177 182 180 178 179 176 53.2 53.5 53.1 53.0 53.0 52.7
Bangalore 131 133 128 127 127 Na 48.5 48.7 49.0 49.2 49.2 Na
BSE 1,087 1,164 1,162 1,120 1,126 1,117 83.6 84.6 85.4 85.1 85.2 83.4
Bhubaneshwar 19 19 17 16 17 16 8.8 8.9 8.4 8.0 8.5 8.1
Calcutta 201 204 210 207 209 210 22.3 22.9 24.2 24.3 24.4 24.9
Cochin 81 82 78 77 78 Na 18.4 18.6 19.2 19.5 19.7 Na
Delhi 268 275 271 264 265 259 55.7 55.3 56.0 55.8 55.8 55.2
Gauhati 3 3 2 2 2 Na 3.1 3.2 3.2 5.6 4.5 Na
ICSE 348 336 319 304 305 Na 36.9 36.6 36.1 36.4 36.2 Na
Jaipur 18 18 18 18 18 18 3.7 3.8 3.9 4.1 4.1 4.2
Ludhiana 89 89 89 86 86 Na 29.0 29.1 29.3 28.4 28.4 Na
Madhya Pradesh 42 45 68 76 80 81 20.7 21.6 26.6 42.9 28.1 28.7
Madras 85 90 81 493 77 77 40.3 41.7 40.9 93.2 42.5 43.5
MCX-SX Na Na 428 80 493 496 Na Na 93.4 28.4 93.2 92.5
NSE 1,239 1,269 1,261 1,167 1,175 1,157 89.2 89.2 89.1 88.7 88.7 88.3
OTCEI 536 528 496 471 473 412 76.5 76.4 76.7 76.5 76.3 76.6
Pune 54 52 49 47 47 46 29.2 28.6 28.3 27.8 27.8 27.5
UPSE 73 70 67 55 55 54 22.3 22.1 23.9 26.6 26.1 27.0
Vadodara 64 65 65 65 65 55 20.5 20.8 21.0 20.9 20.9 18.6
Total 4,515 4,624 4,989 4,853 4,877 4,174 49.6 50.4 53.3 53.6 53.5 58.7
Table 5: Stock brokers on the Basis of Ownership in Cash Segment
(Continued)
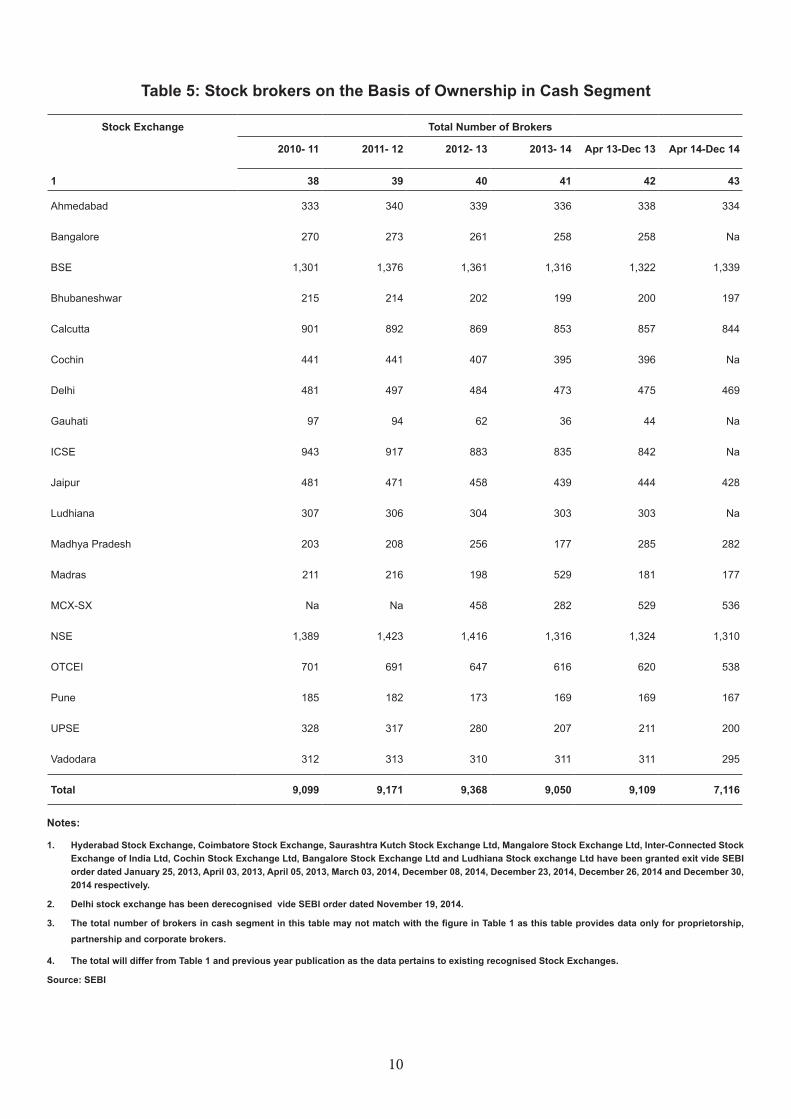
10
Stock Exchange Total Number of Brokers
2010- 11 2011- 12 2012- 13 2013- 14 Apr 13-Dec 13 Apr 14-Dec 14
1 38 39 40 41 42 43
Ahmedabad 333 340 339 336 338 334
Bangalore 270 273 261 258 258 Na
BSE 1,301 1,376 1,361 1,316 1,322 1,339
Bhubaneshwar 215 214 202 199 200 197
Calcutta 901 892 869 853 857 844
Cochin 441 441 407 395 396 Na
Delhi 481 497 484 473 475 469
Gauhati 97 94 62 36 44 Na
ICSE 943 917 883 835 842 Na
Jaipur 481 471 458 439 444 428
Ludhiana 307 306 304 303 303 Na
Madhya Pradesh 203 208 256 177 285 282
Madras 211 216 198 529 181 177
MCX-SX Na Na 458 282 529 536
NSE 1,389 1,423 1,416 1,316 1,324 1,310
OTCEI 701 691 647 616 620 538
Pune 185 182 173 169 169 167
UPSE 328 317 280 207 211 200
Vadodara 312 313 310 311 311 295
Total 9,099 9,171 9,368 9,050 9,109 7,116
Table 5: Stock brokers on the Basis of Ownership in Cash Segment
Notes:
1. Hyderabad Stock Exchange, Coimbatore Stock Exchange, Saurashtra Kutch Stock Exchange Ltd, Mangalore Stock Exchange Ltd, Inter-Connected Stock Exchange of India Ltd, Cochin Stock Exchange Ltd, Bangalore Stock Exchange Ltd and Ludhiana Stock exchange Ltd have been granted exit vide SEBI order dated January 25, 2013, April 03, 2013, April 05, 2013, March 03, 2014, December 08, 2014, December 23, 2014, December 26, 2014 and December 30, 2014 respectively.
2. Delhi stock exchange has been derecognised vide SEBI order dated November 19, 2014.
3. The total number of brokers in cash segment in this table may not match with the figure in Table 1 as this table provides data only for proprietorship, partnership and corporate brokers.
4. The total will differ from Table 1 and previous year publication as the data pertains to existing recognised Stock Exchanges.
Source: SEBI
11
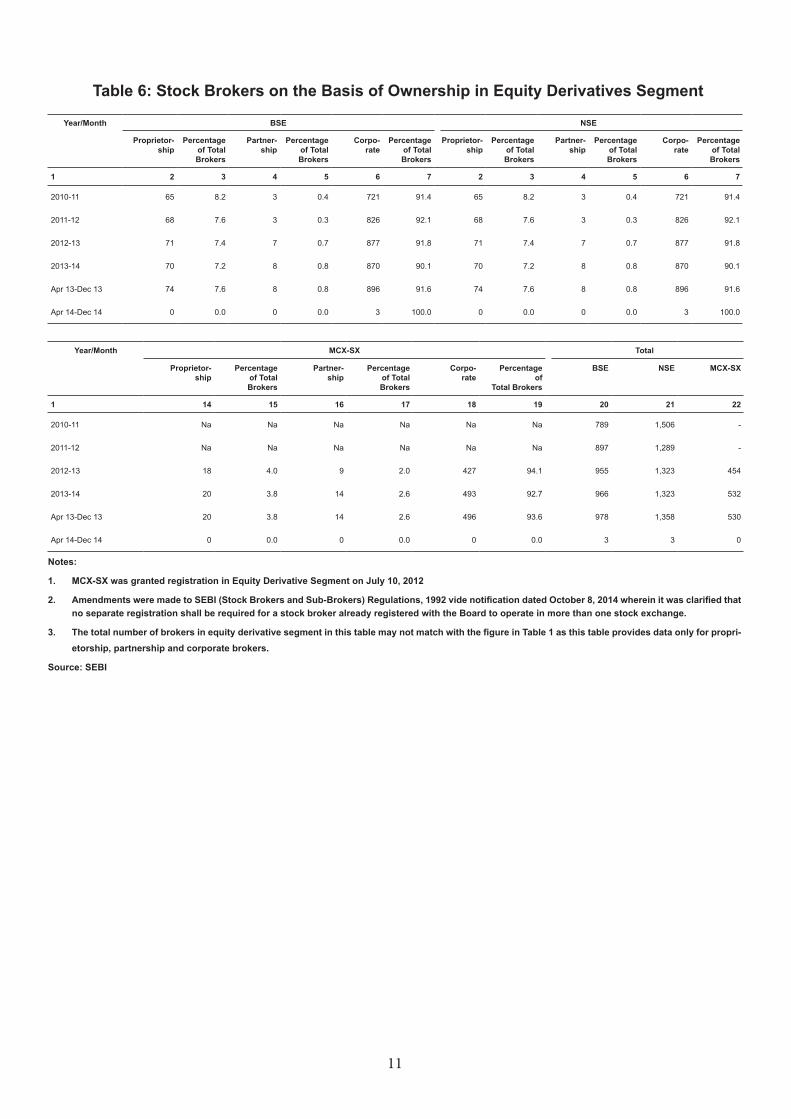
Table 6: Stock Brokers on the Basis of Ownership in Equity Derivatives Segment
Year/Month BSE NSE
Proprietor- ship
Percentage of Total Brokers
Partner- ship
Percentage of Total Brokers
Corpo- rate
Percentage of Total Brokers
Proprietor- ship
Percentage of Total Brokers
Partner- ship
Percentage of Total Brokers
Corpo- rate
Percentage of Total Brokers
1 2 3 4 5 6 7 2 3 4 5 6 7
2010-11 65 8.2 3 0.4 721 91.4 65 8.2 3 0.4 721 91.4
2011-12 68 7.6 3 0.3 826 92.1 68 7.6 3 0.3 826 92.1
2012-13 71 7.4 7 0.7 877 91.8 71 7.4 7 0.7 877 91.8
2013-14 70 7.2 8 0.8 870 90.1 70 7.2 8 0.8 870 90.1
Apr 13-Dec 13 74 7.6 8 0.8 896 91.6 74 7.6 8 0.8 896 91.6
Apr 14-Dec 14 0 0.0 0 0.0 3 100.0 0 0.0 0 0.0 3 100.0
Year/Month MCX-SX Total
Proprietor- ship
Percentage of Total Brokers
Partner- ship
Percentage of Total Brokers
Corpo- rate
Percentage of
Total Brokers
BSE NSE MCX-SX
1 14 15 16 17 18 19 20 21 22
2010-11 Na Na Na Na Na Na 789 1,506 -
2011-12 Na Na Na Na Na Na 897 1,289 -
2012-13 18 4.0 9 2.0 427 94.1 955 1,323 454
2013-14 20 3.8 14 2.6 493 92.7 966 1,323 532
Apr 13-Dec 13 20 3.8 14 2.6 496 93.6 978 1,358 530
Apr 14-Dec 14 0 0.0 0 0.0 0 0.0 3 3 0
Notes:
1. MCX-SX was granted registration in Equity Derivative Segment on July 10, 2012
2. Amendments were made to SEBI (Stock Brokers and Sub-Brokers) Regulations, 1992 vide notification dated October 8, 2014 wherein it was clarified that no separate registration shall be required for a stock broker already registered with the Board to operate in more than one stock exchange.
3. The total number of brokers in equity derivative segment in this table may not match with the figure in Table 1 as this table provides data only for propri-etorship, partnership and corporate brokers.
Source: SEBI
12
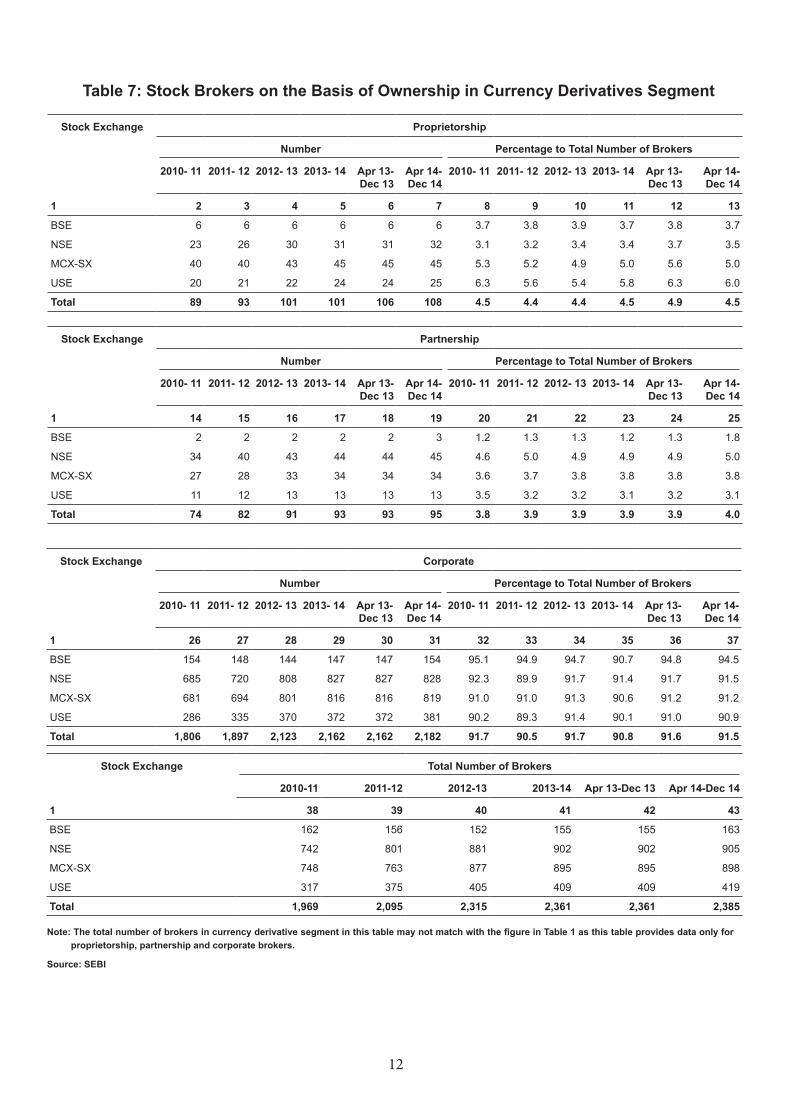
Table 7: Stock Brokers on the Basis of Ownership in Currency Derivatives Segment
Stock Exchange Proprietorship
Number Percentage to Total Number of Brokers
2010- 11 2011- 12 2012- 13 2013- 14 Apr 13-Dec 13
Apr 14-Dec 14
2010- 11 2011- 12 2012- 13 2013- 14 Apr 13-Dec 13
Apr 14-Dec 14
1 2 3 4 5 6 7 8 9 10 11 12 13
BSE 6 6 6 6 6 6 3.7 3.8 3.9 3.7 3.8 3.7
NSE 23 26 30 31 31 32 3.1 3.2 3.4 3.4 3.7 3.5
MCX-SX 40 40 43 45 45 45 5.3 5.2 4.9 5.0 5.6 5.0
USE 20 21 22 24 24 25 6.3 5.6 5.4 5.8 6.3 6.0
Total 89 93 101 101 106 108 4.5 4.4 4.4 4.5 4.9 4.5
Stock Exchange Partnership
Number Percentage to Total Number of Brokers
2010- 11 2011- 12 2012- 13 2013- 14 Apr 13-Dec 13
Apr 14-Dec 14
2010- 11 2011- 12 2012- 13 2013- 14 Apr 13-Dec 13
Apr 14-Dec 14
1 14 15 16 17 18 19 20 21 22 23 24 25
BSE 2 2 2 2 2 3 1.2 1.3 1.3 1.2 1.3 1.8
NSE 34 40 43 44 44 45 4.6 5.0 4.9 4.9 4.9 5.0
MCX-SX 27 28 33 34 34 34 3.6 3.7 3.8 3.8 3.8 3.8
USE 11 12 13 13 13 13 3.5 3.2 3.2 3.1 3.2 3.1
Total 74 82 91 93 93 95 3.8 3.9 3.9 3.9 3.9 4.0
Stock Exchange Corporate
Number Percentage to Total Number of Brokers
2010- 11 2011- 12 2012- 13 2013- 14 Apr 13-Dec 13
Apr 14-Dec 14
2010- 11 2011- 12 2012- 13 2013- 14 Apr 13-Dec 13
Apr 14-Dec 14
1 26 27 28 29 30 31 32 33 34 35 36 37
BSE 154 148 144 147 147 154 95.1 94.9 94.7 90.7 94.8 94.5
NSE 685 720 808 827 827 828 92.3 89.9 91.7 91.4 91.7 91.5
MCX-SX 681 694 801 816 816 819 91.0 91.0 91.3 90.6 91.2 91.2
USE 286 335 370 372 372 381 90.2 89.3 91.4 90.1 91.0 90.9
Total 1,806 1,897 2,123 2,162 2,162 2,182 91.7 90.5 91.7 90.8 91.6 91.5
Stock Exchange Total Number of Brokers
2010-11 2011-12 2012-13 2013-14 Apr 13-Dec 13 Apr 14-Dec 14
1 38 39 40 41 42 43
BSE 162 156 152 155 155 163
NSE 742 801 881 902 902 905
MCX-SX 748 763 877 895 895 898
USE 317 375 405 409 409 419
Total 1,969 2,095 2,315 2,361 2,361 2,385
Note: The total number of brokers in currency derivative segment in this table may not match with the figure in Table 1 as this table provides data only for proprietorship, partnership and corporate brokers.
Source: SEBI
13
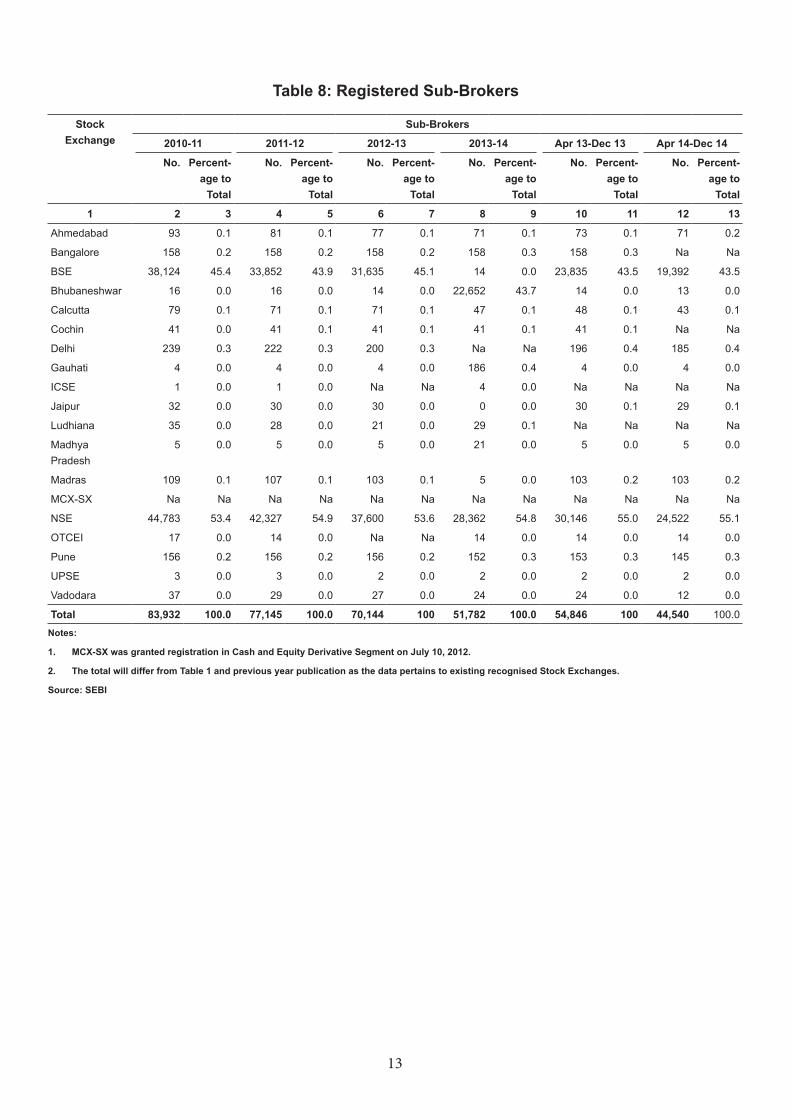
Table 8: Registered Sub-Brokers
Stock Exchange
Sub-Brokers
2010-11 2011-12 2012-13 2013-14 Apr 13-Dec 13 Apr 14-Dec 14
No. Percent-age to
Total
No. Percent-age to
Total
No. Percent-age to
Total
No. Percent-age to
Total
No. Percent-age to
Total
No. Percent-age to
Total
1 2 3 4 5 6 7 8 9 10 11 12 13
Ahmedabad 93 0.1 81 0.1 77 0.1 71 0.1 73 0.1 71 0.2
Bangalore 158 0.2 158 0.2 158 0.2 158 0.3 158 0.3 Na Na
BSE 38,124 45.4 33,852 43.9 31,635 45.1 14 0.0 23,835 43.5 19,392 43.5
Bhubaneshwar 16 0.0 16 0.0 14 0.0 22,652 43.7 14 0.0 13 0.0
Calcutta 79 0.1 71 0.1 71 0.1 47 0.1 48 0.1 43 0.1
Cochin 41 0.0 41 0.1 41 0.1 41 0.1 41 0.1 Na Na
Delhi 239 0.3 222 0.3 200 0.3 Na Na 196 0.4 185 0.4
Gauhati 4 0.0 4 0.0 4 0.0 186 0.4 4 0.0 4 0.0
ICSE 1 0.0 1 0.0 Na Na 4 0.0 Na Na Na Na
Jaipur 32 0.0 30 0.0 30 0.0 0 0.0 30 0.1 29 0.1
Ludhiana 35 0.0 28 0.0 21 0.0 29 0.1 Na Na Na Na
Madhya Pradesh
5 0.0 5 0.0 5 0.0 21 0.0 5 0.0 5 0.0
Madras 109 0.1 107 0.1 103 0.1 5 0.0 103 0.2 103 0.2
MCX-SX Na Na Na Na Na Na Na Na Na Na Na Na
NSE 44,783 53.4 42,327 54.9 37,600 53.6 28,362 54.8 30,146 55.0 24,522 55.1
OTCEI 17 0.0 14 0.0 Na Na 14 0.0 14 0.0 14 0.0
Pune 156 0.2 156 0.2 156 0.2 152 0.3 153 0.3 145 0.3
UPSE 3 0.0 3 0.0 2 0.0 2 0.0 2 0.0 2 0.0
Vadodara 37 0.0 29 0.0 27 0.0 24 0.0 24 0.0 12 0.0
Total 83,932 100.0 77,145 100.0 70,144 100 51,782 100.0 54,846 100 44,540 100.0
Notes:
1. MCX-SX was granted registration in Cash and Equity Derivative Segment on July 10, 2012.
2. The total will differ from Table 1 and previous year publication as the data pertains to existing recognised Stock Exchanges.
Source: SEBI
14
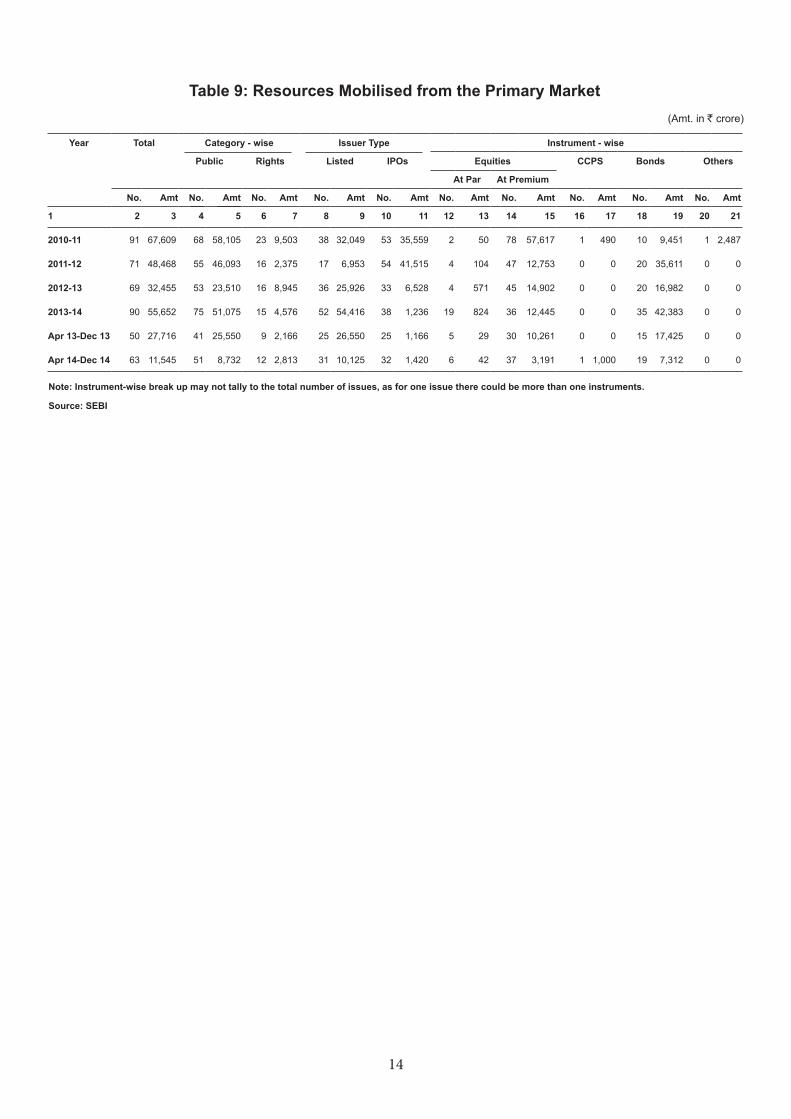
Table 9: Resources Mobilised from the Primary Market
Year Total Category - wise Issuer Type Instrument - wise
Public Rights Listed IPOs Equities CCPS Bonds Others
At Par At Premium
No. Amt No. Amt No. Amt No. Amt No. Amt No. Amt No. Amt No. Amt No. Amt No. Amt
1 2 3 4 5 6 7 8 9 10 11 12 13 14 15 16 17 18 19 20 21
2010-11 91 67,609 68 58,105 23 9,503 38 32,049 53 35,559 2 50 78 57,617 1 490 10 9,451 1 2,487
2011-12 71 48,468 55 46,093 16 2,375 17 6,953 54 41,515 4 104 47 12,753 0 0 20 35,611 0 0
2012-13 69 32,455 53 23,510 16 8,945 36 25,926 33 6,528 4 571 45 14,902 0 0 20 16,982 0 0
2013-14 90 55,652 75 51,075 15 4,576 52 54,416 38 1,236 19 824 36 12,445 0 0 35 42,383 0 0
Apr 13-Dec 13 50 27,716 41 25,550 9 2,166 25 26,550 25 1,166 5 29 30 10,261 0 0 15 17,425 0 0
Apr 14-Dec 14 63 11,545 51 8,732 12 2,813 31 10,125 32 1,420 6 42 37 3,191 1 1,000 19 7,312 0 0
Note: Instrument-wise break up may not tally to the total number of issues, as for one issue there could be more than one instruments.
Source: SEBI
(Amt. in ` crore)
15
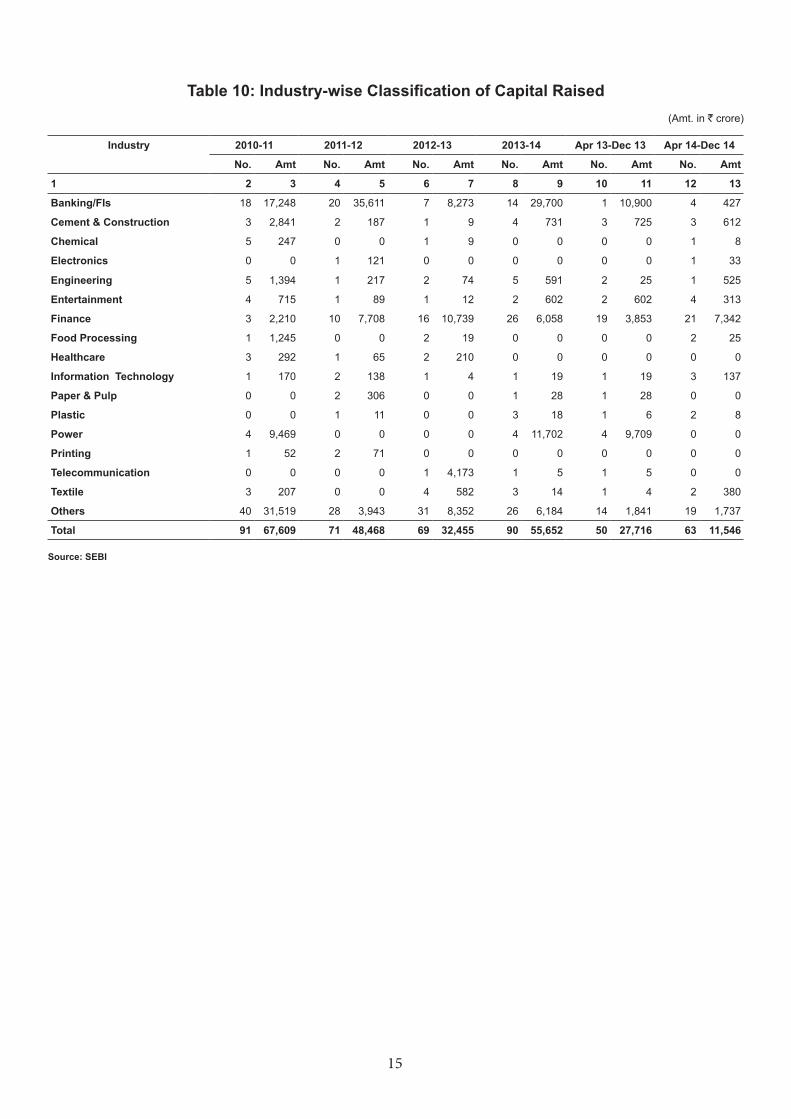
Table 10: Industry-wise Classification of Capital Raised
Industry 2010-11 2011-12 2012-13 2013-14 Apr 13-Dec 13 Apr 14-Dec 14
No. Amt No. Amt No. Amt No. Amt No. Amt No. Amt
1 2 3 4 5 6 7 8 9 10 11 12 13
Banking/FIs 18 17,248 20 35,611 7 8,273 14 29,700 1 10,900 4 427
Cement & Construction 3 2,841 2 187 1 9 4 731 3 725 3 612
Chemical 5 247 0 0 1 9 0 0 0 0 1 8
Electronics 0 0 1 121 0 0 0 0 0 0 1 33
Engineering 5 1,394 1 217 2 74 5 591 2 25 1 525
Entertainment 4 715 1 89 1 12 2 602 2 602 4 313
Finance 3 2,210 10 7,708 16 10,739 26 6,058 19 3,853 21 7,342
Food Processing 1 1,245 0 0 2 19 0 0 0 0 2 25
Healthcare 3 292 1 65 2 210 0 0 0 0 0 0
Information Technology 1 170 2 138 1 4 1 19 1 19 3 137
Paper & Pulp 0 0 2 306 0 0 1 28 1 28 0 0
Plastic 0 0 1 11 0 0 3 18 1 6 2 8
Power 4 9,469 0 0 0 0 4 11,702 4 9,709 0 0
Printing 1 52 2 71 0 0 0 0 0 0 0 0
Telecommunication 0 0 0 0 1 4,173 1 5 1 5 0 0
Textile 3 207 0 0 4 582 3 14 1 4 2 380
Others 40 31,519 28 3,943 31 8,352 26 6,184 14 1,841 19 1,737
Total 91 67,609 71 48,468 69 32,455 90 55,652 50 27,716 63 11,546
Source: SEBI
(Amt. in ` crore)
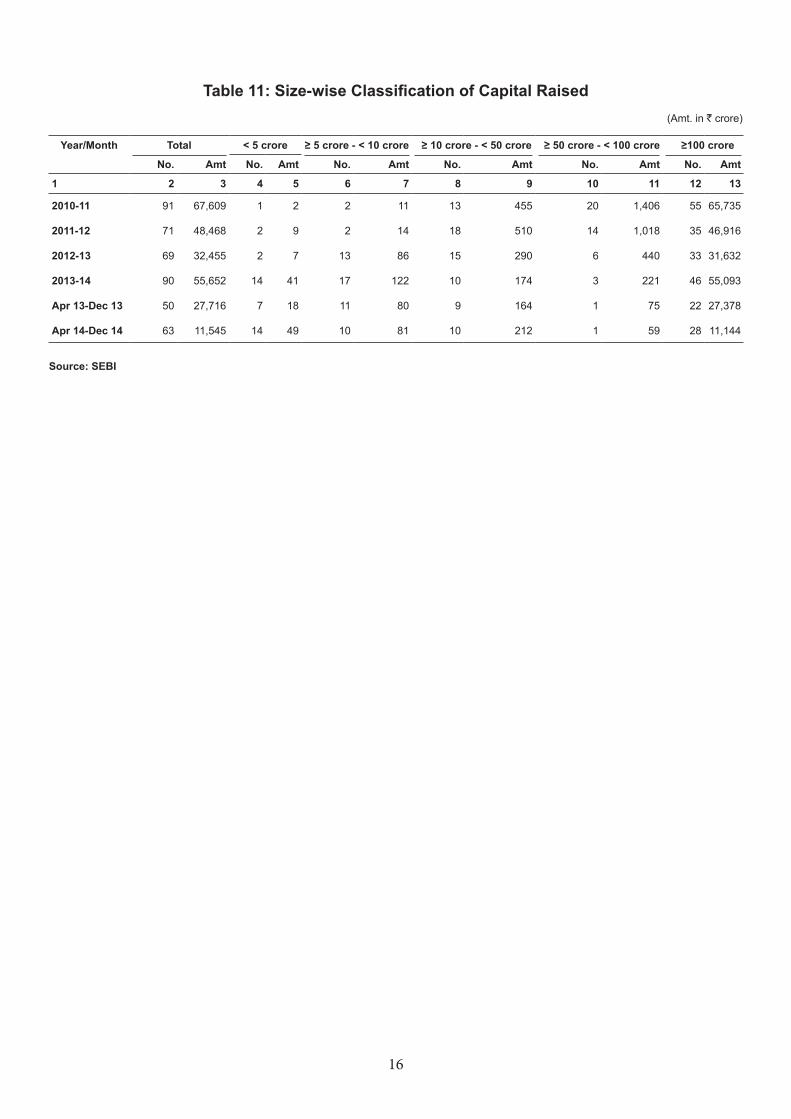
16
Table 11: Size-wise Classification of Capital Raised
Year/Month Total < 5 crore ≥ 5 crore - < 10 crore ≥ 10 crore - < 50 crore ≥ 50 crore - < 100 crore ≥100 crore
No. Amt No. Amt No. Amt No. Amt No. Amt No. Amt
1 2 3 4 5 6 7 8 9 10 11 12 13
2010-11 91 67,609 1 2 2 11 13 455 20 1,406 55 65,735
2011-12 71 48,468 2 9 2 14 18 510 14 1,018 35 46,916
2012-13 69 32,455 2 7 13 86 15 290 6 440 33 31,632
2013-14 90 55,652 14 41 17 122 10 174 3 221 46 55,093
Apr 13-Dec 13 50 27,716 7 18 11 80 9 164 1 75 22 27,378
Apr 14-Dec 14 63 11,545 14 49 10 81 10 212 1 59 28 11,144
Source: SEBI
(Amt. in ` crore)
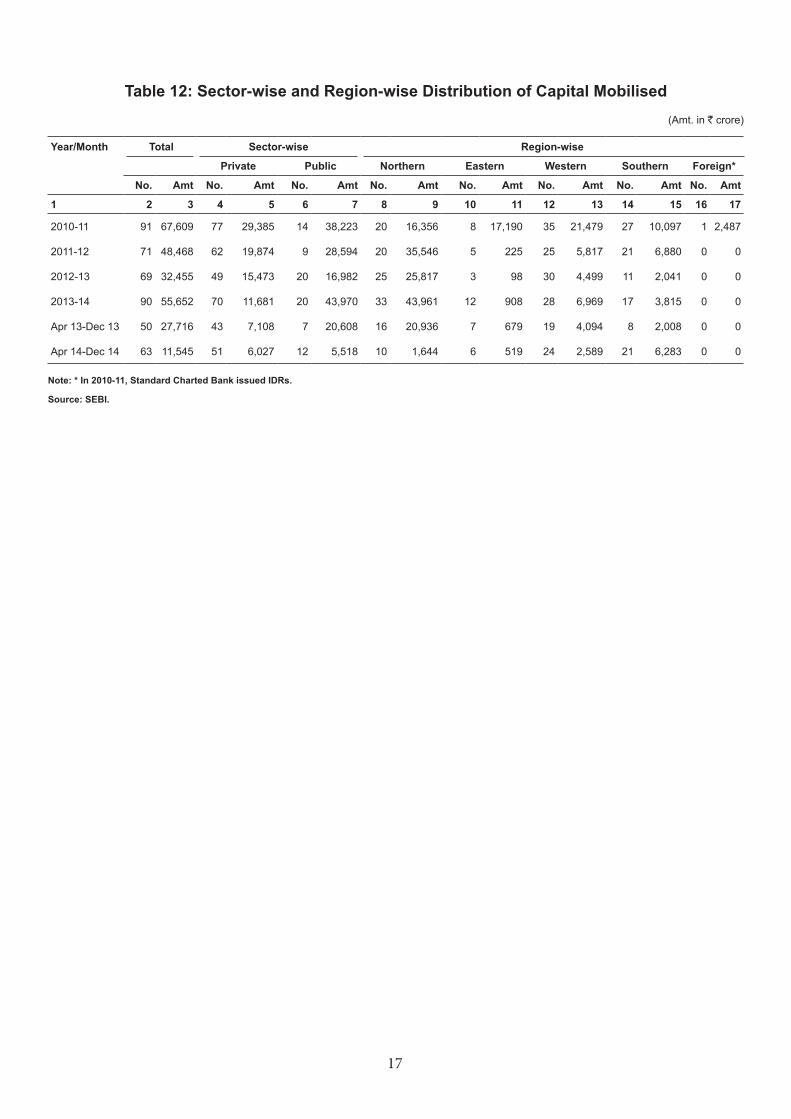
17
Table 12: Sector-wise and Region-wise Distribution of Capital Mobilised
Year/Month Total Sector-wise Region-wise
Private Public Northern Eastern Western Southern Foreign*
No. Amt No. Amt No. Amt No. Amt No. Amt No. Amt No. Amt No. Amt
1 2 3 4 5 6 7 8 9 10 11 12 13 14 15 16 17
2010-11 91 67,609 77 29,385 14 38,223 20 16,356 8 17,190 35 21,479 27 10,097 1 2,487
2011-12 71 48,468 62 19,874 9 28,594 20 35,546 5 225 25 5,817 21 6,880 0 0
2012-13 69 32,455 49 15,473 20 16,982 25 25,817 3 98 30 4,499 11 2,041 0 0
2013-14 90 55,652 70 11,681 20 43,970 33 43,961 12 908 28 6,969 17 3,815 0 0
Apr 13-Dec 13 50 27,716 43 7,108 7 20,608 16 20,936 7 679 19 4,094 8 2,008 0 0
Apr 14-Dec 14 63 11,545 51 6,027 12 5,518 10 1,644 6 519 24 2,589 21 6,283 0 0
Note: * In 2010-11, Standard Charted Bank issued IDRs.
Source: SEBI.
(Amt. in ` crore)
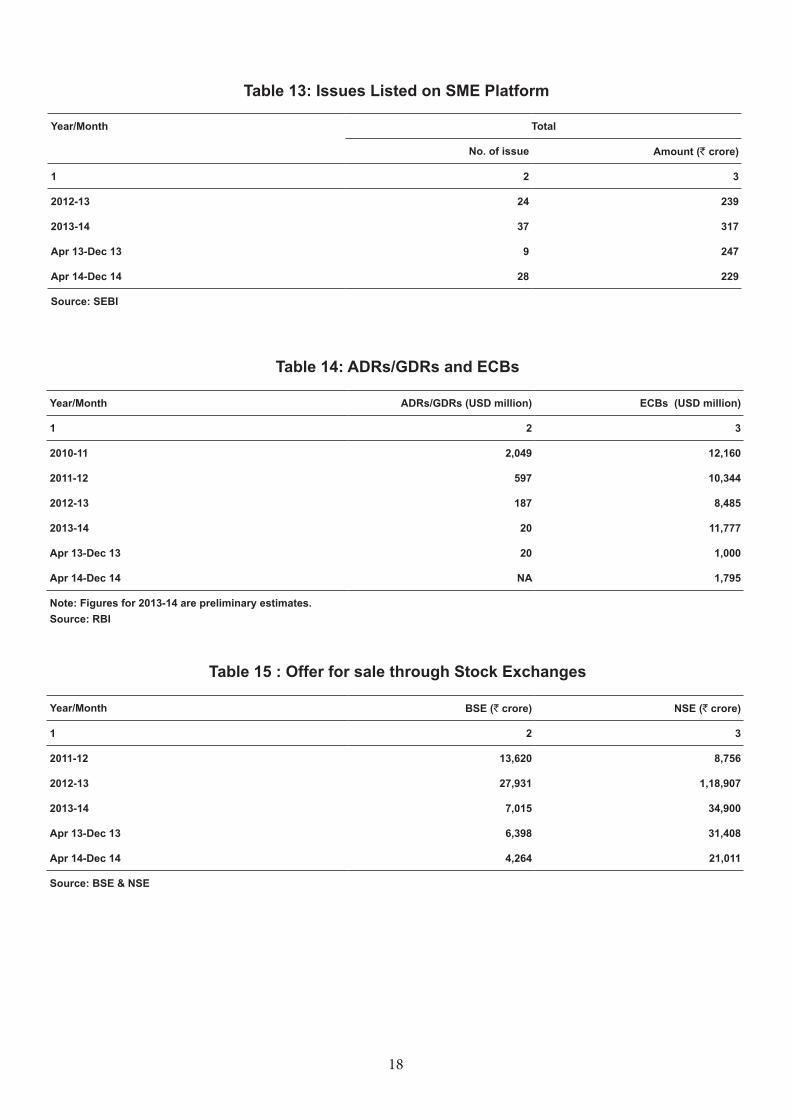
18
Table 13: Issues Listed on SME Platform
Year/Month Total
No. of issue Amount (` crore)
1 2 3
2012-13 24 239
2013-14 37 317
Apr 13-Dec 13 9 247
Apr 14-Dec 14 28 229
Source: SEBI
Year/Month ADRs/GDRs (USD million) ECBs (USD million)
1 2 3
2010-11 2,049 12,160
2011-12 597 10,344
2012-13 187 8,485
2013-14 20 11,777
Apr 13-Dec 13 20 1,000
Apr 14-Dec 14 NA 1,795
Note: Figures for 2013-14 are preliminary estimates. Source: RBI
Year/Month BSE (` crore) NSE (` crore)
1 2 3
2011-12 13,620 8,756
2012-13 27,931 1,18,907
2013-14 7,015 34,900
Apr 13-Dec 13 6,398 31,408
Apr 14-Dec 14 4,264 21,011
Source: BSE & NSE
Table 14: ADRs/GDRs and ECBs
Table 15 : Offer for sale through Stock Exchanges
19
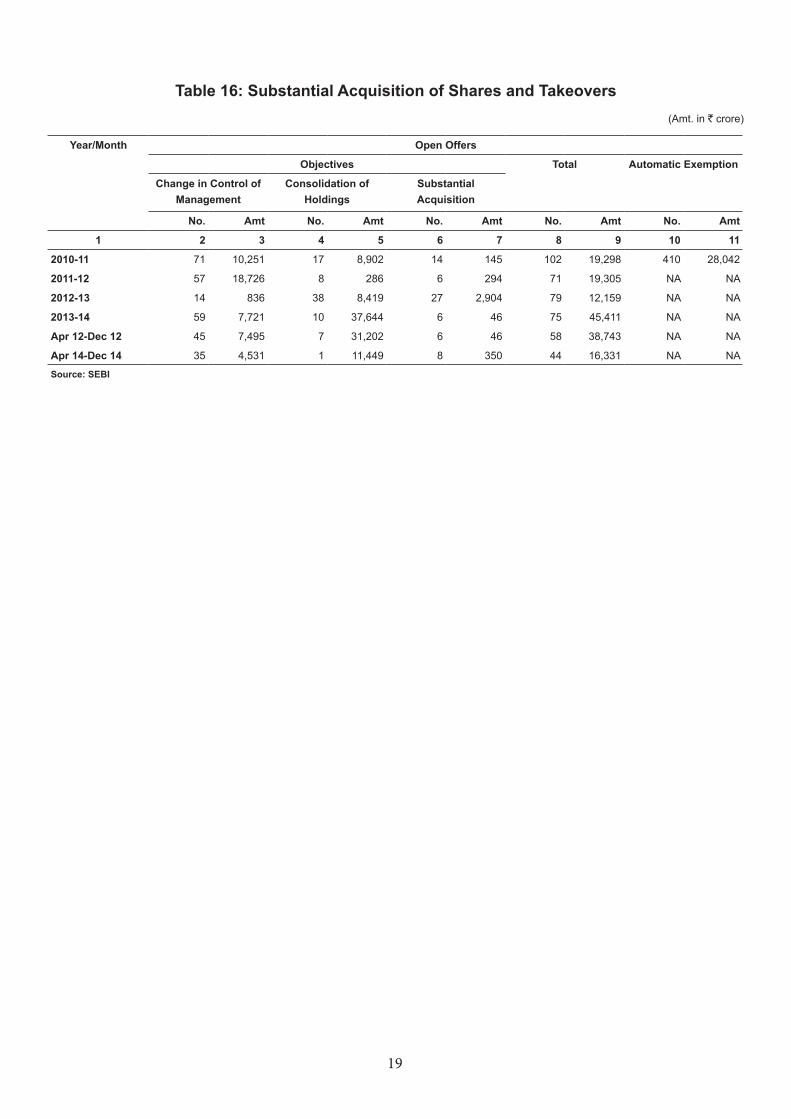
Table 16: Substantial Acquisition of Shares and Takeovers
Year/Month Open Offers
Objectives Total Automatic Exemption
Change in Control of Management
Consolidation of Holdings
Substantial Acquisition
No. Amt No. Amt No. Amt No. Amt No. Amt
1 2 3 4 5 6 7 8 9 10 11
2010-11 71 10,251 17 8,902 14 145 102 19,298 410 28,042
2011-12 57 18,726 8 286 6 294 71 19,305 NA NA
2012-13 14 836 38 8,419 27 2,904 79 12,159 NA NA
2013-14 59 7,721 10 37,644 6 46 75 45,411 NA NA
Apr 12-Dec 12 45 7,495 7 31,202 6 46 58 38,743 NA NA
Apr 14-Dec 14 35 4,531 1 11,449 8 350 44 16,331 NA NA
Source: SEBI
(Amt. in ` crore)
20
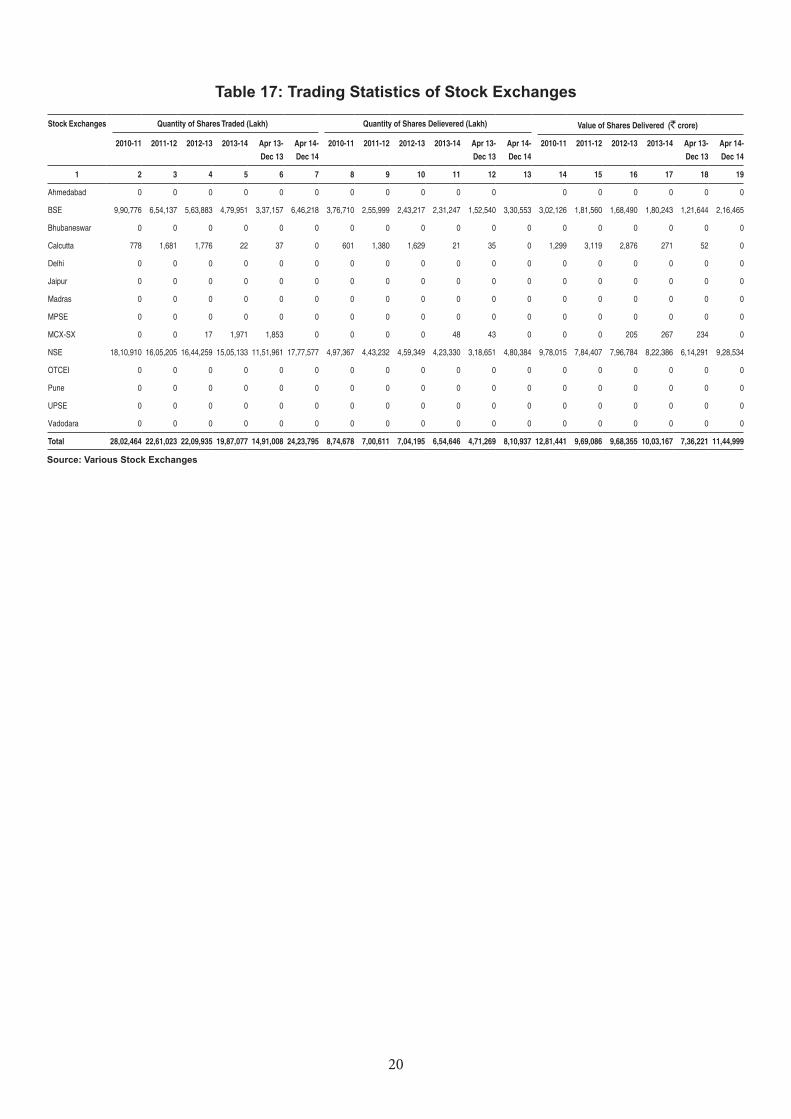
Table 17: Trading Statistics of Stock Exchanges
Stock Exchanges Quantity of Shares Traded (Lakh) Quantity of Shares Delievered (Lakh) Value of Shares Delivered (` crore)
2010-11 2011-12 2012-13 2013-14 Apr 13-
Dec 13
Apr 14-
Dec 14
2010-11 2011-12 2012-13 2013-14 Apr 13-
Dec 13
Apr 14-
Dec 14
2010-11 2011-12 2012-13 2013-14 Apr 13-
Dec 13
Apr 14-
Dec 14
1 2 3 4 5 6 7 8 9 10 11 12 13 14 15 16 17 18 19
Ahmedabad 0 0 0 0 0 0 0 0 0 0 0 0 0 0 0 0 0
BSE 9,90,776 6,54,137 5,63,883 4,79,951 3,37,157 6,46,218 3,76,710 2,55,999 2,43,217 2,31,247 1,52,540 3,30,553 3,02,126 1,81,560 1,68,490 1,80,243 1,21,644 2,16,465
Bhubaneswar 0 0 0 0 0 0 0 0 0 0 0 0 0 0 0 0 0 0
Calcutta 778 1,681 1,776 22 37 0 601 1,380 1,629 21 35 0 1,299 3,119 2,876 271 52 0
Delhi 0 0 0 0 0 0 0 0 0 0 0 0 0 0 0 0 0 0
Jaipur 0 0 0 0 0 0 0 0 0 0 0 0 0 0 0 0 0 0
Madras 0 0 0 0 0 0 0 0 0 0 0 0 0 0 0 0 0 0
MPSE 0 0 0 0 0 0 0 0 0 0 0 0 0 0 0 0 0 0
MCX-SX 0 0 17 1,971 1,853 0 0 0 0 48 43 0 0 0 205 267 234 0
NSE 18,10,910 16,05,205 16,44,259 15,05,133 11,51,961 17,77,577 4,97,367 4,43,232 4,59,349 4,23,330 3,18,651 4,80,384 9,78,015 7,84,407 7,96,784 8,22,386 6,14,291 9,28,534
OTCEI 0 0 0 0 0 0 0 0 0 0 0 0 0 0 0 0 0 0
Pune 0 0 0 0 0 0 0 0 0 0 0 0 0 0 0 0 0 0
UPSE 0 0 0 0 0 0 0 0 0 0 0 0 0 0 0 0 0 0
Vadodara 0 0 0 0 0 0 0 0 0 0 0 0 0 0 0 0 0 0
Total 28,02,464 22,61,023 22,09,935 19,87,077 14,91,008 24,23,795 8,74,678 7,00,611 7,04,195 6,54,646 4,71,269 8,10,937 12,81,441 9,69,086 9,68,355 10,03,167 7,36,221 11,44,999
Source: Various Stock Exchanges
21
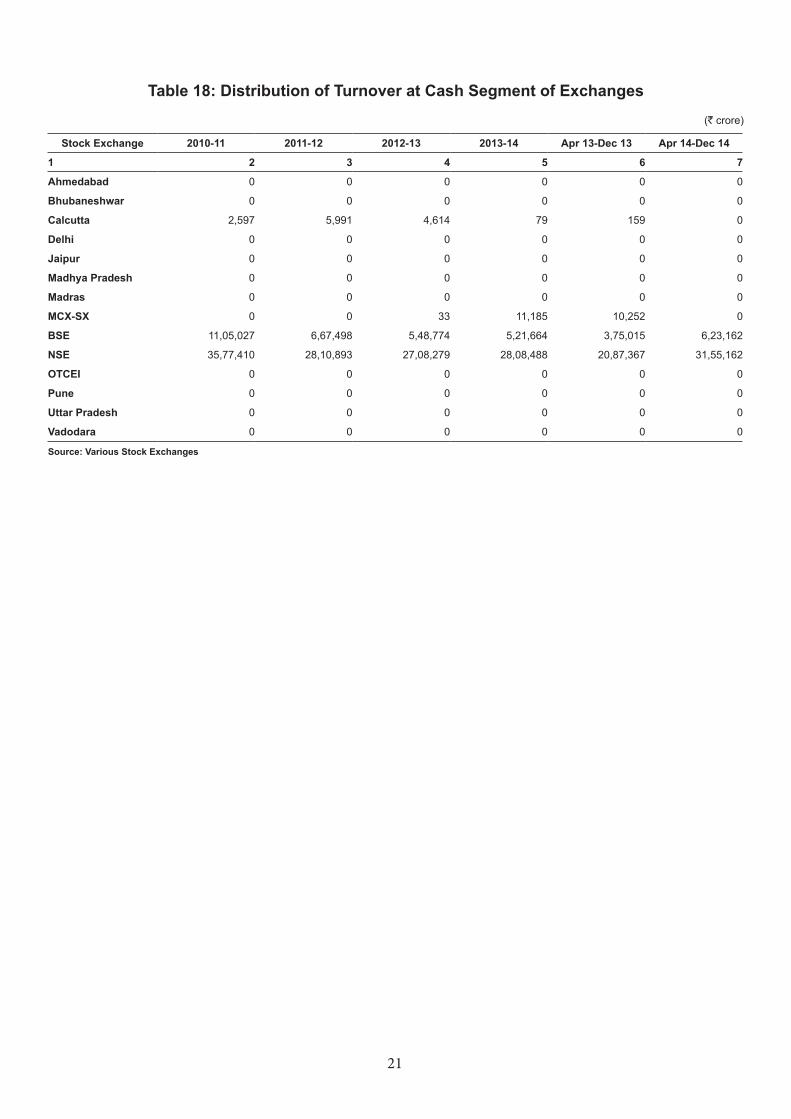
Table 18: Distribution of Turnover at Cash Segment of Exchanges
Stock Exchange 2010-11 2011-12 2012-13 2013-14 Apr 13-Dec 13 Apr 14-Dec 14
1 2 3 4 5 6 7
Ahmedabad 0 0 0 0 0 0
Bhubaneshwar 0 0 0 0 0 0
Calcutta 2,597 5,991 4,614 79 159 0
Delhi 0 0 0 0 0 0
Jaipur 0 0 0 0 0 0
Madhya Pradesh 0 0 0 0 0 0
Madras 0 0 0 0 0 0
MCX-SX 0 0 33 11,185 10,252 0
BSE 11,05,027 6,67,498 5,48,774 5,21,664 3,75,015 6,23,162
NSE 35,77,410 28,10,893 27,08,279 28,08,488 20,87,367 31,55,162
OTCEI 0 0 0 0 0 0
Pune 0 0 0 0 0 0
Uttar Pradesh 0 0 0 0 0 0
Vadodara 0 0 0 0 0 0
Source: Various Stock Exchanges
(` crore)
22
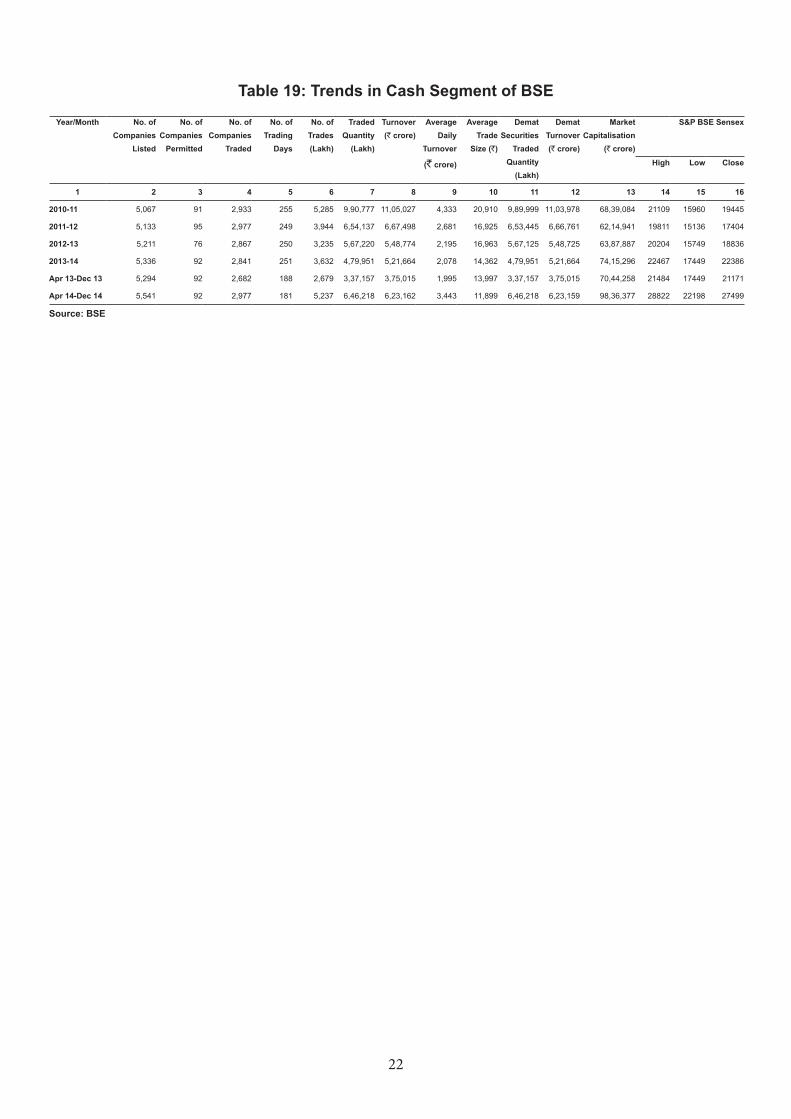
Table 19: Trends in Cash Segment of BSE
Year/Month No. of Companies
Listed
No. of Companies
Permitted
No. of Companies
Traded
No. of Trading
Days
No. of Trades (Lakh)
Traded Quantity
(Lakh)
Turnover (` crore)
Average Daily
Turnover
(` crore)
Average Trade
Size (`)
Demat Securities
Traded Quantity
(Lakh)
Demat Turnover (` crore)
Market Capitalisation
(` crore)
S&P BSE Sensex
High Low Close
1 2 3 4 5 6 7 8 9 10 11 12 13 14 15 16
2010-11 5,067 91 2,933 255 5,285 9,90,777 11,05,027 4,333 20,910 9,89,999 11,03,978 68,39,084 21109 15960 19445
2011-12 5,133 95 2,977 249 3,944 6,54,137 6,67,498 2,681 16,925 6,53,445 6,66,761 62,14,941 19811 15136 17404
2012-13 5,211 76 2,867 250 3,235 5,67,220 5,48,774 2,195 16,963 5,67,125 5,48,725 63,87,887 20204 15749 18836
2013-14 5,336 92 2,841 251 3,632 4,79,951 5,21,664 2,078 14,362 4,79,951 5,21,664 74,15,296 22467 17449 22386
Apr 13-Dec 13 5,294 92 2,682 188 2,679 3,37,157 3,75,015 1,995 13,997 3,37,157 3,75,015 70,44,258 21484 17449 21171
Apr 14-Dec 14 5,541 92 2,977 181 5,237 6,46,218 6,23,162 3,443 11,899 6,46,218 6,23,159 98,36,377 28822 22198 27499
Source: BSE
23
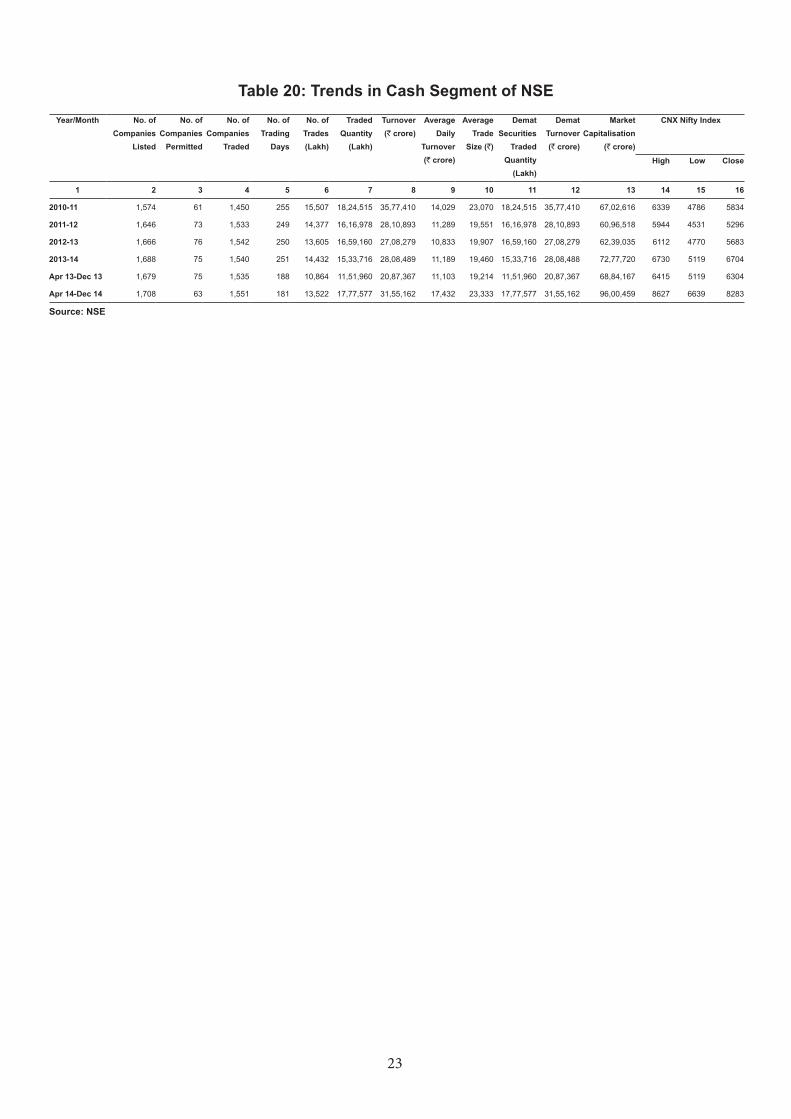
Table 20: Trends in Cash Segment of NSEYear/Month No. of
Companies Listed
No. of Companies
Permitted
No. of Companies
Traded
No. of Trading
Days
No. of Trades (Lakh)
Traded Quantity
(Lakh)
Turnover (` crore)
Average Daily
Turnover (` crore)
Average Trade
Size (`)
Demat Securities
Traded Quantity
(Lakh)
Demat Turnover (` crore)
Market Capitalisation
(` crore)
CNX Nifty Index
High Low Close
1 2 3 4 5 6 7 8 9 10 11 12 13 14 15 16
2010-11 1,574 61 1,450 255 15,507 18,24,515 35,77,410 14,029 23,070 18,24,515 35,77,410 67,02,616 6339 4786 5834
2011-12 1,646 73 1,533 249 14,377 16,16,978 28,10,893 11,289 19,551 16,16,978 28,10,893 60,96,518 5944 4531 5296
2012-13 1,666 76 1,542 250 13,605 16,59,160 27,08,279 10,833 19,907 16,59,160 27,08,279 62,39,035 6112 4770 5683
2013-14 1,688 75 1,540 251 14,432 15,33,716 28,08,489 11,189 19,460 15,33,716 28,08,488 72,77,720 6730 5119 6704
Apr 13-Dec 13 1,679 75 1,535 188 10,864 11,51,960 20,87,367 11,103 19,214 11,51,960 20,87,367 68,84,167 6415 5119 6304
Apr 14-Dec 14 1,708 63 1,551 181 13,522 17,77,577 31,55,162 17,432 23,333 17,77,577 31,55,162 96,00,459 8627 6639 8283
Source: NSE
24
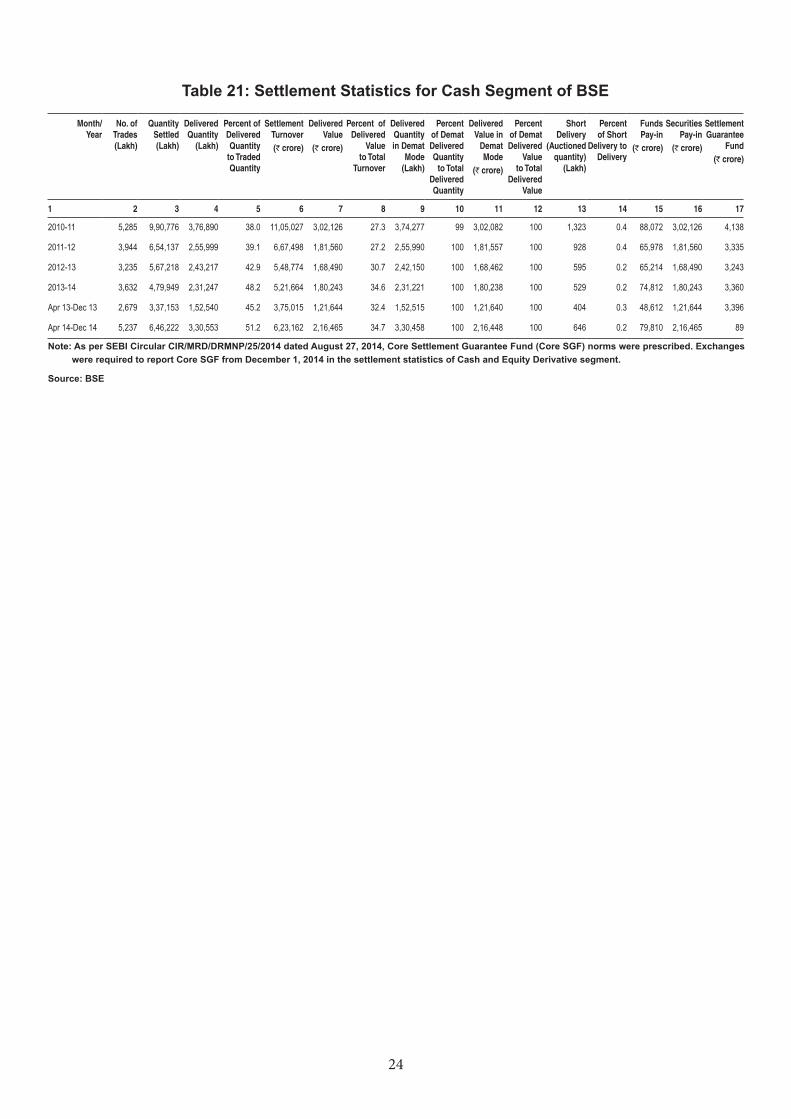
Table 21: Settlement Statistics for Cash Segment of BSE
Month/Year
No. of Trades (Lakh)
Quantity Settled (Lakh)
Delivered Quantity
(Lakh)
Percent of Delivered Quantity
to Traded Quantity
Settlement Turnover (` crore)
Delivered Value
(` crore)
Percent of Delivered
Value to Total
Turnover
Delivered Quantity in Demat
Mode (Lakh)
Percent of Demat Delivered Quantity
to Total Delivered Quantity
Delivered Value in
Demat Mode
(` crore)
Percent of Demat Delivered
Value to Total
Delivered Value
Short Delivery
(Auctioned quantity)
(Lakh)
Percent of Short
Delivery to Delivery
Funds Pay-in
(` crore)
Securities Pay-in
(` crore)
Settlement Guarantee
Fund (` crore)
1 2 3 4 5 6 7 8 9 10 11 12 13 14 15 16 17
2010-11 5,285 9,90,776 3,76,890 38.0 11,05,027 3,02,126 27.3 3,74,277 99 3,02,082 100 1,323 0.4 88,072 3,02,126 4,138
2011-12 3,944 6,54,137 2,55,999 39.1 6,67,498 1,81,560 27.2 2,55,990 100 1,81,557 100 928 0.4 65,978 1,81,560 3,335
2012-13 3,235 5,67,218 2,43,217 42.9 5,48,774 1,68,490 30.7 2,42,150 100 1,68,462 100 595 0.2 65,214 1,68,490 3,243
2013-14 3,632 4,79,949 2,31,247 48.2 5,21,664 1,80,243 34.6 2,31,221 100 1,80,238 100 529 0.2 74,812 1,80,243 3,360
Apr 13-Dec 13 2,679 3,37,153 1,52,540 45.2 3,75,015 1,21,644 32.4 1,52,515 100 1,21,640 100 404 0.3 48,612 1,21,644 3,396
Apr 14-Dec 14 5,237 6,46,222 3,30,553 51.2 6,23,162 2,16,465 34.7 3,30,458 100 2,16,448 100 646 0.2 79,810 2,16,465 89
Note: As per SEBI Circular CIR/MRD/DRMNP/25/2014 dated August 27, 2014, Core Settlement Guarantee Fund (Core SGF) norms were prescribed. Exchanges were required to report Core SGF from December 1, 2014 in the settlement statistics of Cash and Equity Derivative segment.
Source: BSE

25
Table 22: Settlement Statistics for Cash Segment of NSE
Year/Month No. of Trades (Lakh)
Quantity Settled (Lakh)
Delivered Quantity
(Lakh)
Percent of Delivered Quantity
to Traded Quantity
Settlement Turnover
(` crore)
Delivered Value
(`crore)
Percent of Delivered
Value to Total
Turnover
Delivered Quantity in Demat
Mode (Lakh)
Percent of Demat Delivered Quantity
to Total Delivered Quantity
Delivered Value in
Demat Mode
(`crore)
Percent of Demat Delivered
Value to Total
Delivered Value
Short Delivery
(Auctioned quantity)
(Lakh)
Percent of Short
Delivery to Delivery
Funds Pay-in
(`crore)
Securities Pay-in
(`crore)
Settlement Guarantee
Fund
(`crore)
1 2 3 4 5 6 7 8 9 10 11 12 13 14 17 18 19
2010-11 15,480 18,10,910 4,97,367 27.5 35,65,195 9,78,015 27.4 4,97,367 100 9,78,015 100 903 0.2 2,93,357 9,79,269 5,100
2011-12 14,372 16,05,205 4,43,232 27.6 28,03,889 7,84,407 28.0 4,43,232 100 7,84,407 100 702 0.2 2,51,754 7,85,268 4,821
2012-13 13,574 16,44,259 4,59,349 27.9 27,00,656 7,96,784 29.5 4,59,349 100 7,96,784 100 661 0.1 2,51,034 7,97,504 4,732
2013-14 14,257 15,05,133 4,23,417 28.1 27,71,238 8,22,446 29.7 4,25,953 101 8,22,386 100 600 0.1 2,71,841 8,23,042 5,041
Apr 13-Dec 13 10,880 11,43,461 3,18,651 27.9 20,86,131 6,14,291 29.4 3,18,651 100 6,14,291 100 464 0.1 2,04,249 6,14,788 4,302
Apr 14-Dec 14 13,572 17,50,198 4,80,384 27.4 31,61,650 9,28,534 29.4 4,79,451 100 9,25,825 100 627 0.1 2,67,548 9,28,534 95
Note: As per SEBI Circular CIR/MRD/DRMNP/25/2014 dated August 27, 2014, Core Settlement Guarantee Fund (Core SGF) norms were prescribed. Exchanges were required to report Core SGF from December 1, 2014 in the settlement statistics of Cash and Equity Derivative segment.
Source: NSE
26
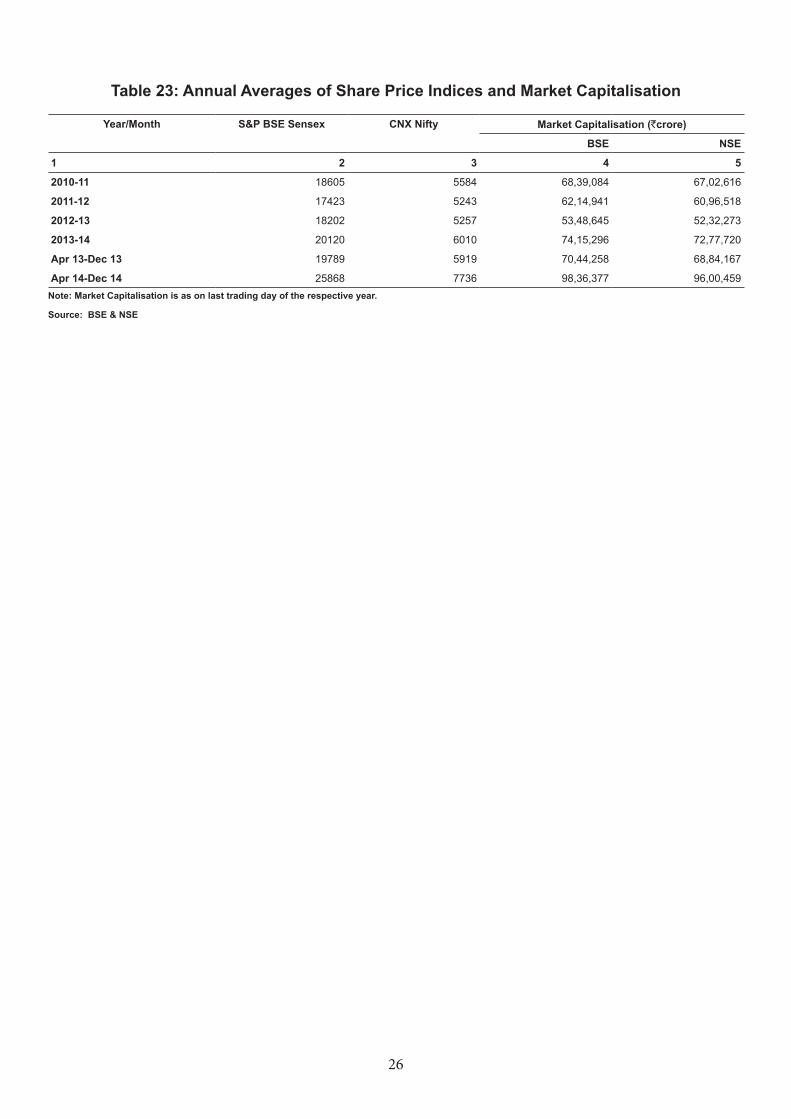
Table 23: Annual Averages of Share Price Indices and Market Capitalisation
Year/Month S&P BSE Sensex CNX Nifty Market Capitalisation (`crore)
BSE NSE
1 2 3 4 5
2010-11 18605 5584 68,39,084 67,02,616
2011-12 17423 5243 62,14,941 60,96,518
2012-13 18202 5257 53,48,645 52,32,273
2013-14 20120 6010 74,15,296 72,77,720
Apr 13-Dec 13 19789 5919 70,44,258 68,84,167
Apr 14-Dec 14 25868 7736 98,36,377 96,00,459Note: Market Capitalisation is as on last trading day of the respective year.
Source: BSE & NSE
27
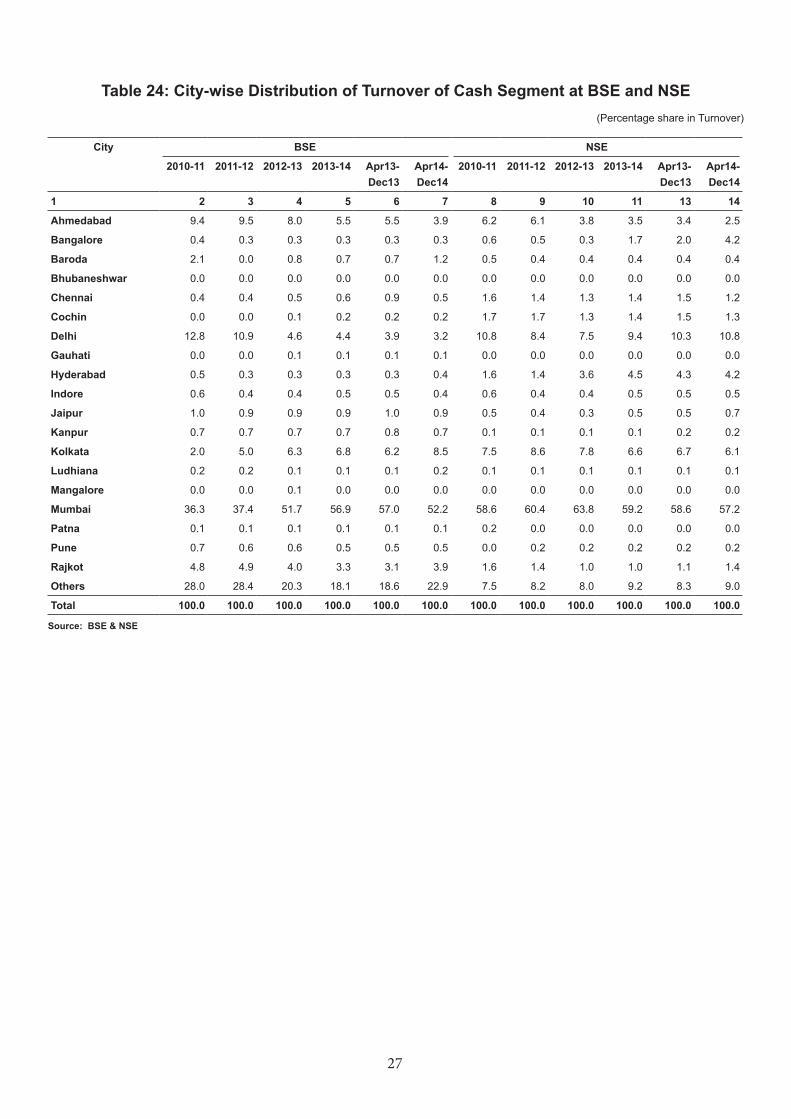
Table 24: City-wise Distribution of Turnover of Cash Segment at BSE and NSE (Percentage share in Turnover)
City BSE NSE
2010-11 2011-12 2012-13 2013-14 Apr13-Dec13
Apr14-Dec14
2010-11 2011-12 2012-13 2013-14 Apr13-Dec13
Apr14-Dec14
1 2 3 4 5 6 7 8 9 10 11 13 14
Ahmedabad 9.4 9.5 8.0 5.5 5.5 3.9 6.2 6.1 3.8 3.5 3.4 2.5
Bangalore 0.4 0.3 0.3 0.3 0.3 0.3 0.6 0.5 0.3 1.7 2.0 4.2
Baroda 2.1 0.0 0.8 0.7 0.7 1.2 0.5 0.4 0.4 0.4 0.4 0.4
Bhubaneshwar 0.0 0.0 0.0 0.0 0.0 0.0 0.0 0.0 0.0 0.0 0.0 0.0
Chennai 0.4 0.4 0.5 0.6 0.9 0.5 1.6 1.4 1.3 1.4 1.5 1.2
Cochin 0.0 0.0 0.1 0.2 0.2 0.2 1.7 1.7 1.3 1.4 1.5 1.3
Delhi 12.8 10.9 4.6 4.4 3.9 3.2 10.8 8.4 7.5 9.4 10.3 10.8
Gauhati 0.0 0.0 0.1 0.1 0.1 0.1 0.0 0.0 0.0 0.0 0.0 0.0
Hyderabad 0.5 0.3 0.3 0.3 0.3 0.4 1.6 1.4 3.6 4.5 4.3 4.2
Indore 0.6 0.4 0.4 0.5 0.5 0.4 0.6 0.4 0.4 0.5 0.5 0.5
Jaipur 1.0 0.9 0.9 0.9 1.0 0.9 0.5 0.4 0.3 0.5 0.5 0.7
Kanpur 0.7 0.7 0.7 0.7 0.8 0.7 0.1 0.1 0.1 0.1 0.2 0.2
Kolkata 2.0 5.0 6.3 6.8 6.2 8.5 7.5 8.6 7.8 6.6 6.7 6.1
Ludhiana 0.2 0.2 0.1 0.1 0.1 0.2 0.1 0.1 0.1 0.1 0.1 0.1
Mangalore 0.0 0.0 0.1 0.0 0.0 0.0 0.0 0.0 0.0 0.0 0.0 0.0
Mumbai 36.3 37.4 51.7 56.9 57.0 52.2 58.6 60.4 63.8 59.2 58.6 57.2
Patna 0.1 0.1 0.1 0.1 0.1 0.1 0.2 0.0 0.0 0.0 0.0 0.0
Pune 0.7 0.6 0.6 0.5 0.5 0.5 0.0 0.2 0.2 0.2 0.2 0.2
Rajkot 4.8 4.9 4.0 3.3 3.1 3.9 1.6 1.4 1.0 1.0 1.1 1.4
Others 28.0 28.4 20.3 18.1 18.6 22.9 7.5 8.2 8.0 9.2 8.3 9.0
Total 100.0 100.0 100.0 100.0 100.0 100.0 100.0 100.0 100.0 100.0 100.0 100.0
Source: BSE & NSE
28
Table 25 : Trends of Broader Stock Indices
Year BSE 100 Index
Percentage Variation
BSE Small Cap
Percentage Variation
BSE 500 Percentage Variation
Nifty Junior Percentage Variation
CNX Midcap Percentage Variation
India Vix Percentage Variation
1 2 3 4 5 6 7 8 9 10 11 12 13
2010-11 5855.5 8.6 8175.9 -3.8 7437.3 7.5 11279.6 4.7 8040.2 4.4 22.2 11.9
2011-12 5315.2 -9.2 6629.4 -18.9 6759.6 -9.1 10450.2 -7.4 7711.4 -4.1 22.4 0.9
2012-13 5678.7 6.8 5804.7 -12.4 7085.0 4.8 11222.8 7.4 7401.6 -4.0 15.2 -32.0
2013-14 6707.3 18.1 7072.0 21.8 8295.3 17.1 13469.1 20.0 8612.5 16.4 21.6 42.0
Apr 13-Dec 13 6326.7 11.4 6551.1 12.9 7828.3 10.5 12933.3 15.2 8071.3 9.0 15.1 -0.7
Apr 14-Dec 14 8369.3 24.8 11087.1 56.8 10721.6 29.2 18677.7 38.7 12583.9 46.1 15.1 -30.1
Note: Index values on the last trading day of the year for each Index has been considered for calculation of percentage variation
Source: BSE & NSE
29
Table 26: Volatility* of Major Indices
Year/Month S&P BSE Sensex S&P BSE 100 S&P BSE 500 CNX Nifty Junior Nifty CNX 500
1 2 3 4 5 6 7
2010-11 1.1 1.1 1.1 1.1 1.1 1.0
2011-12 1.3 1.3 1.2 1.3 1.3 1.2
2012-13 0.8 0.9 0.8 0.9 0.8 0.8
2013-14 1.1 1.1 1.0 1.1 1.1 1.1
Apr 13-Dec 13 1.2 1.2 1.1 0.8 0.7 0.7
Apr 14-Dec 14 0.8 0.9 0.9 0.8 1.2 0.9
Notes:
1. The indices Dollex-200 and S&P CNX Defty have been replaced by BSE-500 and CNX 500 respectively.
2. * Volatility is calculated as the standard deviation of the natural log of returns in indices for the respective period.
Source: BSE, NSE
(Percent)
30
Table 27: Percentage Share of Top ‘N’ Securities/Members in Turnover in Cash Segment
Year/Month BSE NSE
Top 5 10 25 50 100 5 10 25 50 100
1 2 3 4 5 6 7 8 9 10 11
Securities
2010-11 10.2 15.1 25.9 37.3 51.5 15.3 23.0 38.7 53.6 68.9
2011-12 16.6 25.3 40.1 54.2 69.1 17.2 27.1 44.3 59.8 75.7
2012-13 13.0 20.6 33.8 46.3 60.6 16.2 26.2 44.3 60.5 76.8
2013-14 13.9 21.9 38.0 52.9 67.8 15.3 26.2 46.6 64.9 82.0
Apr 13-Dec 13 14.4 21.5 37.1 51.5 67.0 13.9 23.7 43.9 61.8 79.3
Apr 14-Dec 14 11.9 18.3 30.2 42.4 57.6 14.1 21.3 35.6 51.5 71.3
Members
2010-11 13.3 21.6 36.6 51.9 70.2 14.3 23.8 42.9 58.6 73.0
2011-12 15.1 24.5 40.0 55.0 72.4 14.8 25.3 46.3 62.2 77.0
2012-13 14.5 22.3 38.5 54.7 71.5 14.3 24.7 46.7 63.1 77.2
2013-14 16.4 24.6 40.9 57.7 73.7 13.9 24.9 45.9 63.7 78.8
Apr 13-Dec 13 17.0 25.9 42.1 57.8 73.8 14.1 24.2 45.5 63.1 78.0
Apr 14-Dec 14 19.5 28.8 47.7 63.0 76.7 16.4 27.7 49.5 66.3 80.1
Source: BSE & NSE
31
Table 28: Indicators of Liquidity
Year BSE Mcap/GDP NSE Mcap/GDP Turnover Ratio - BSE
Turnover Ratio- NSE
Traded Value Ratio-BSE
Traded Value Ratio-NSE
1 2 3 4 5 6 7
2010-11 94.1 92.2 16.2 53.4 15.2 49.2
2011-12 70.4 69.0 10.7 46.1 7.6 31.8
2012-13 68.8 67.2 8.6 43.4 5.9 29.2
2013-14 74.7 73.4 7.0 38.6 5.3 28.3
2014-15 92.3 90.1 6.3 32.9 5.8 29.6Notes:
1. Data for 2011-12, 2012-13 and 2013-14 has been revised. New Series Estimates for GDP (at 2011-12 Prices) is considered.
2. For 2014-15, Advance Estimate of GDP at constant (2011-12 Prices) is considered.
3. For 2014-15, turnover and Mcap figures as on December 31, 2014 are considered.
4. Turnover Ratio = (Turnover/ Market Capitalization).
5. Traded Value Ratio= (Turnover/GDP).
Source: BSE, NSE and CSO
(Percent)
32
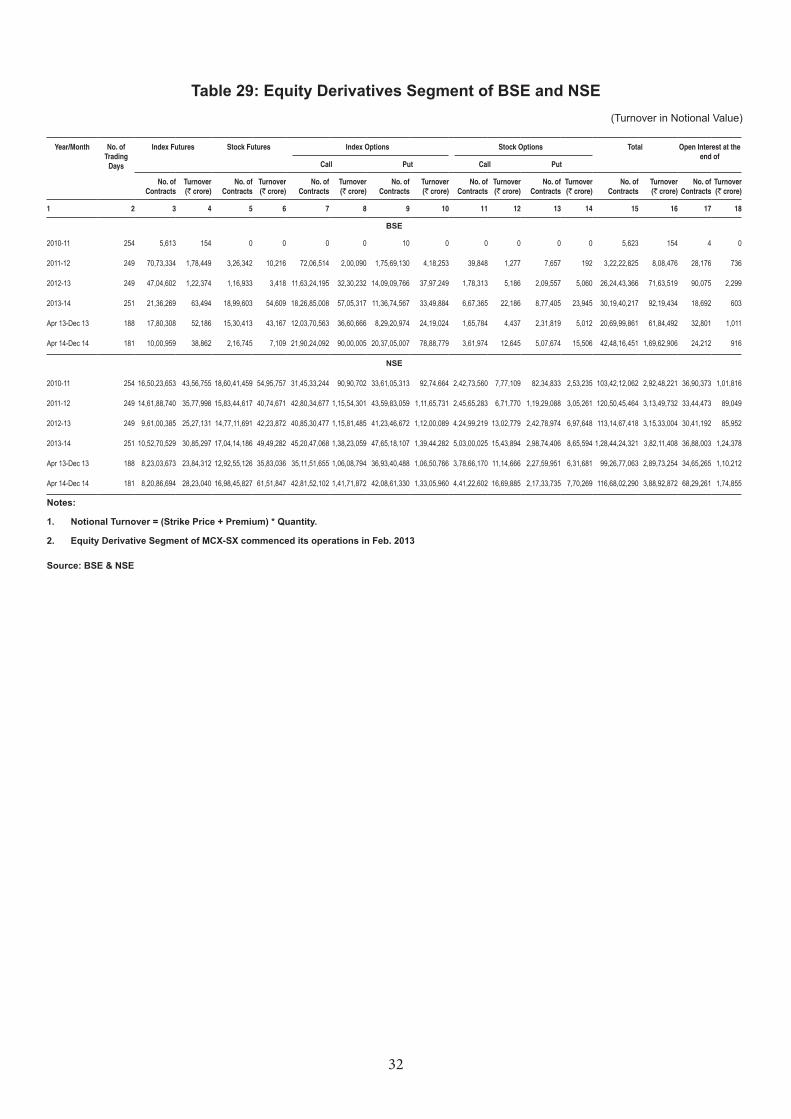
Table 29: Equity Derivatives Segment of BSE and NSE
Year/Month No. of Trading
Days
Index Futures Stock Futures Index Options Stock Options Total Open Interest at the end of
Call Put Call Put
No. of Contracts
Turnover (` crore)
No. of Contracts
Turnover (` crore)
No. of Contracts
Turnover (` crore)
No. of Contracts
Turnover (` crore)
No. of Contracts
Turnover (` crore)
No. of Contracts
Turnover (` crore)
No. of Contracts
Turnover (` crore)
No. of Contracts
Turnover (` crore)
1 2 3 4 5 6 7 8 9 10 11 12 13 14 15 16 17 18
BSE
2010-11 254 5,613 154 0 0 0 0 10 0 0 0 0 0 5,623 154 4 0
2011-12 249 70,73,334 1,78,449 3,26,342 10,216 72,06,514 2,00,090 1,75,69,130 4,18,253 39,848 1,277 7,657 192 3,22,22,825 8,08,476 28,176 736
2012-13 249 47,04,602 1,22,374 1,16,933 3,418 11,63,24,195 32,30,232 14,09,09,766 37,97,249 1,78,313 5,186 2,09,557 5,060 26,24,43,366 71,63,519 90,075 2,299
2013-14 251 21,36,269 63,494 18,99,603 54,609 18,26,85,008 57,05,317 11,36,74,567 33,49,884 6,67,365 22,186 8,77,405 23,945 30,19,40,217 92,19,434 18,692 603
Apr 13-Dec 13 188 17,80,308 52,186 15,30,413 43,167 12,03,70,563 36,60,666 8,29,20,974 24,19,024 1,65,784 4,437 2,31,819 5,012 20,69,99,861 61,84,492 32,801 1,011
Apr 14-Dec 14 181 10,00,959 38,862 2,16,745 7,109 21,90,24,092 90,00,005 20,37,05,007 78,88,779 3,61,974 12,645 5,07,674 15,506 42,48,16,451 1,69,62,906 24,212 916
NSE
2010-11 254 16,50,23,653 43,56,755 18,60,41,459 54,95,757 31,45,33,244 90,90,702 33,61,05,313 92,74,664 2,42,73,560 7,77,109 82,34,833 2,53,235 103,42,12,062 2,92,48,221 36,90,373 1,01,816
2011-12 249 14,61,88,740 35,77,998 15,83,44,617 40,74,671 42,80,34,677 1,15,54,301 43,59,83,059 1,11,65,731 2,45,65,283 6,71,770 1,19,29,088 3,05,261 120,50,45,464 3,13,49,732 33,44,473 89,049
2012-13 249 9,61,00,385 25,27,131 14,77,11,691 42,23,872 40,85,30,477 1,15,81,485 41,23,46,672 1,12,00,089 4,24,99,219 13,02,779 2,42,78,974 6,97,648 113,14,67,418 3,15,33,004 30,41,192 85,952
2013-14 251 10,52,70,529 30,85,297 17,04,14,186 49,49,282 45,20,47,068 1,38,23,059 47,65,18,107 1,39,44,282 5,03,00,025 15,43,894 2,98,74,406 8,65,594 1,28,44,24,321 3,82,11,408 36,88,003 1,24,378
Apr 13-Dec 13 188 8,23,03,673 23,84,312 12,92,55,126 35,83,036 35,11,51,655 1,06,08,794 36,93,40,488 1,06,50,766 3,78,66,170 11,14,666 2,27,59,951 6,31,681 99,26,77,063 2,89,73,254 34,65,265 1,10,212
Apr 14-Dec 14 181 8,20,86,694 28,23,040 16,98,45,827 61,51,847 42,81,52,102 1,41,71,872 42,08,61,330 1,33,05,960 4,41,22,602 16,69,885 2,17,33,735 7,70,269 116,68,02,290 3,88,92,872 68,29,261 1,74,855
Notes:
1. Notional Turnover = (Strike Price + Premium) * Quantity.
2. Equity Derivative Segment of MCX-SX commenced its operations in Feb. 2013
Source: BSE & NSE
(Turnover in Notional Value)
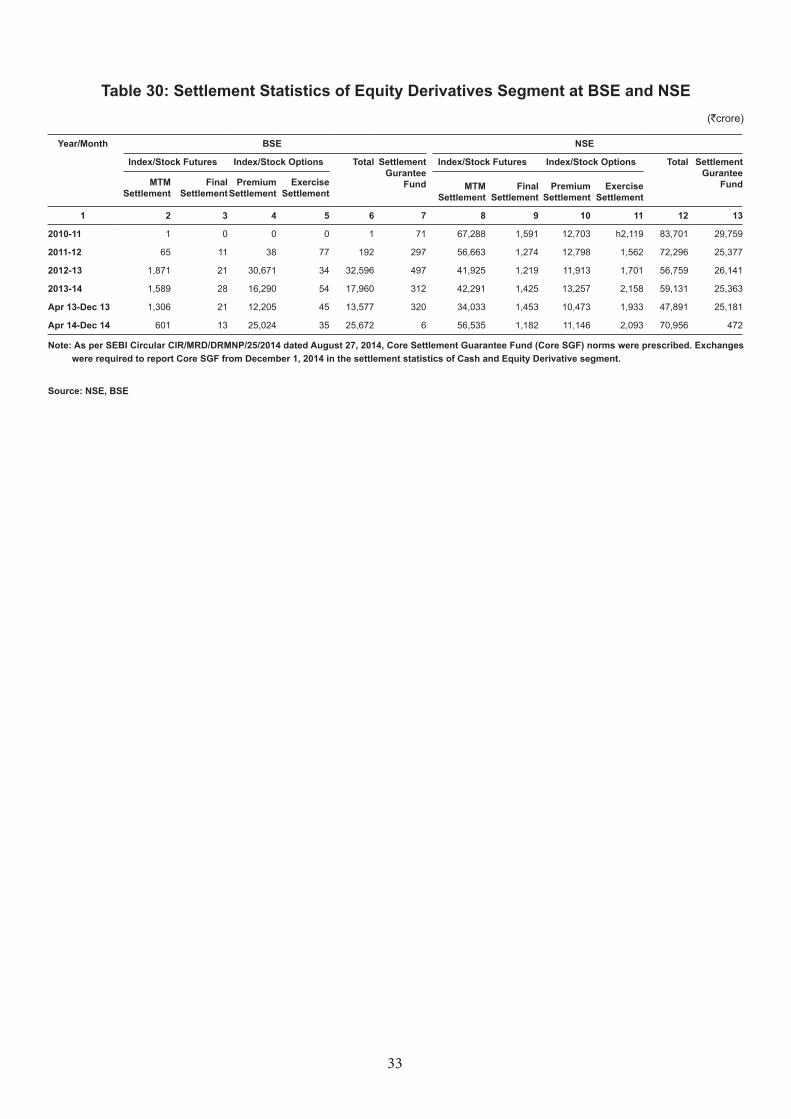
33
Table 30: Settlement Statistics of Equity Derivatives Segment at BSE and NSE
Year/Month BSE NSE
Index/Stock Futures Index/Stock Options Total Settlement Gurantee
Fund
Index/Stock Futures Index/Stock Options Total Settlement Gurantee
FundMTM Settlement
Final Settlement
Premium Settlement
Exercise Settlement
MTM Settlement
Final Settlement
Premium Settlement
Exercise Settlement
1 2 3 4 5 6 7 8 9 10 11 12 13
2010-11 1 0 0 0 1 71 67,288 1,591 12,703 h2,119 83,701 29,759
2011-12 65 11 38 77 192 297 56,663 1,274 12,798 1,562 72,296 25,377
2012-13 1,871 21 30,671 34 32,596 497 41,925 1,219 11,913 1,701 56,759 26,141
2013-14 1,589 28 16,290 54 17,960 312 42,291 1,425 13,257 2,158 59,131 25,363
Apr 13-Dec 13 1,306 21 12,205 45 13,577 320 34,033 1,453 10,473 1,933 47,891 25,181
Apr 14-Dec 14 601 13 25,024 35 25,672 6 56,535 1,182 11,146 2,093 70,956 472
Note: As per SEBI Circular CIR/MRD/DRMNP/25/2014 dated August 27, 2014, Core Settlement Guarantee Fund (Core SGF) norms were prescribed. Exchanges were required to report Core SGF from December 1, 2014 in the settlement statistics of Cash and Equity Derivative segment.
Source: NSE, BSE
(`crore)
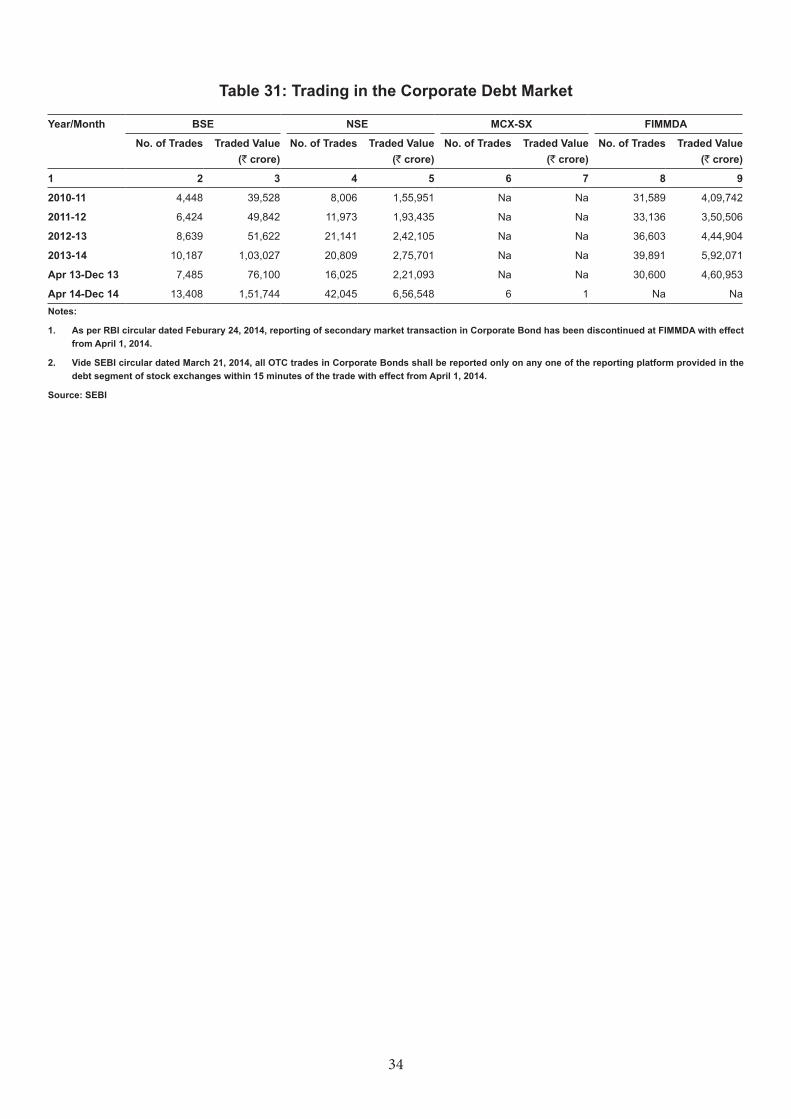
34
Table 31: Trading in the Corporate Debt Market
Year/Month BSE NSE MCX-SX FIMMDA
No. of Trades Traded Value (` crore)
No. of Trades Traded Value (` crore)
No. of Trades Traded Value (` crore)
No. of Trades Traded Value (` crore)
1 2 3 4 5 6 7 8 9
2010-11 4,448 39,528 8,006 1,55,951 Na Na 31,589 4,09,742
2011-12 6,424 49,842 11,973 1,93,435 Na Na 33,136 3,50,506
2012-13 8,639 51,622 21,141 2,42,105 Na Na 36,603 4,44,904
2013-14 10,187 1,03,027 20,809 2,75,701 Na Na 39,891 5,92,071
Apr 13-Dec 13 7,485 76,100 16,025 2,21,093 Na Na 30,600 4,60,953
Apr 14-Dec 14 13,408 1,51,744 42,045 6,56,548 6 1 Na NaNotes:
1. As per RBI circular dated Feburary 24, 2014, reporting of secondary market transaction in Corporate Bond has been discontinued at FIMMDA with effect from April 1, 2014.
2. Vide SEBI circular dated March 21, 2014, all OTC trades in Corporate Bonds shall be reported only on any one of the reporting platform provided in the debt segment of stock exchanges within 15 minutes of the trade with effect from April 1, 2014.
Source: SEBI
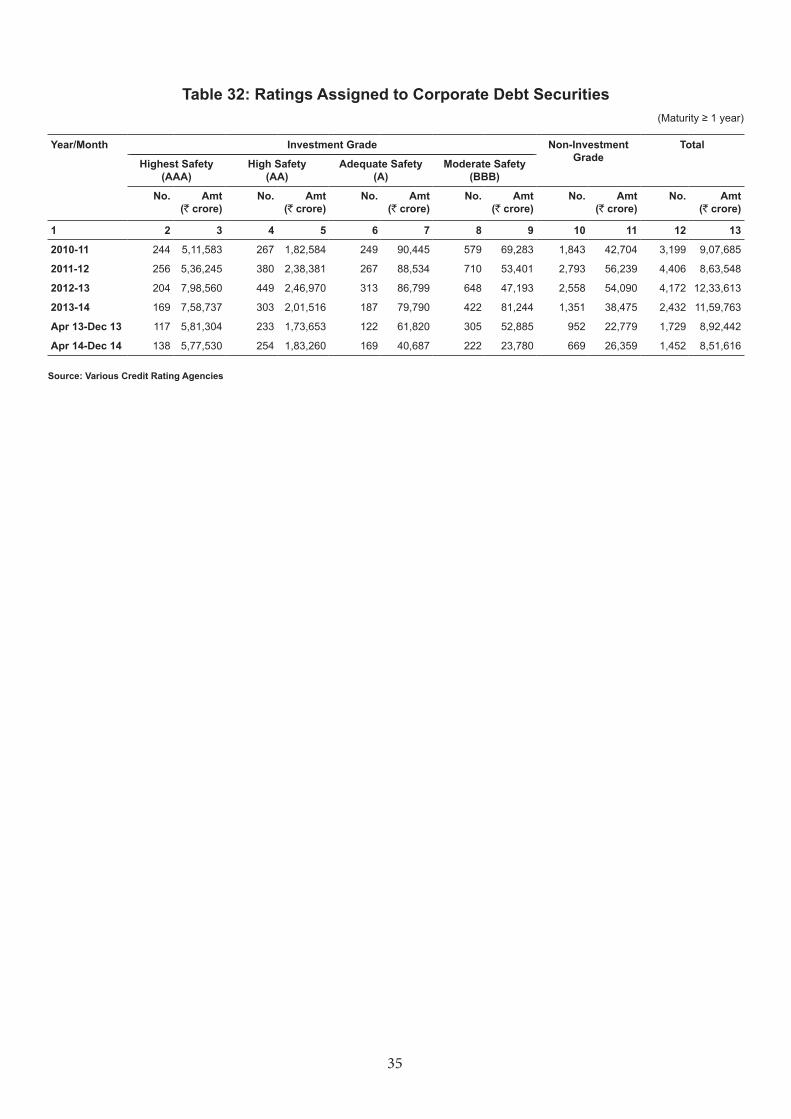
35
Table 32: Ratings Assigned to Corporate Debt Securities
Year/Month Investment Grade Non-Investment Grade
Total
Highest Safety (AAA)
High Safety (AA)
Adequate Safety (A)
Moderate Safety (BBB)
No. Amt (` crore)
No. Amt (` crore)
No. Amt (` crore)
No. Amt (` crore)
No. Amt (` crore)
No. Amt (` crore)
1 2 3 4 5 6 7 8 9 10 11 12 13
2010-11 244 5,11,583 267 1,82,584 249 90,445 579 69,283 1,843 42,704 3,199 9,07,685
2011-12 256 5,36,245 380 2,38,381 267 88,534 710 53,401 2,793 56,239 4,406 8,63,548
2012-13 204 7,98,560 449 2,46,970 313 86,799 648 47,193 2,558 54,090 4,172 12,33,613
2013-14 169 7,58,737 303 2,01,516 187 79,790 422 81,244 1,351 38,475 2,432 11,59,763
Apr 13-Dec 13 117 5,81,304 233 1,73,653 122 61,820 305 52,885 952 22,779 1,729 8,92,442
Apr 14-Dec 14 138 5,77,530 254 1,83,260 169 40,687 222 23,780 669 26,359 1,452 8,51,616
Source: Various Credit Rating Agencies
(Maturity ≥ 1 year)
36
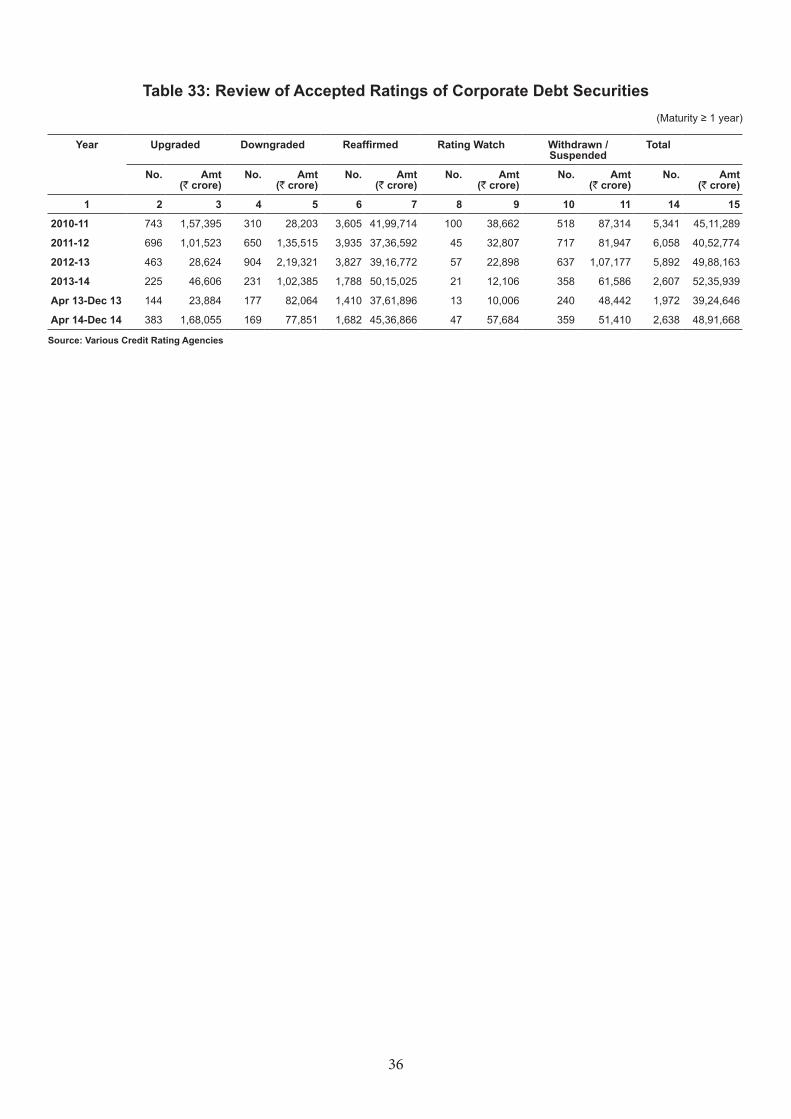
Table 33: Review of Accepted Ratings of Corporate Debt Securities
Year Upgraded Downgraded Reaffirmed Rating Watch Withdrawn / Suspended
Total
No. Amt (` crore)
No. Amt (` crore)
No. Amt (` crore)
No. Amt (` crore)
No. Amt (` crore)
No. Amt (` crore)
1 2 3 4 5 6 7 8 9 10 11 14 15
2010-11 743 1,57,395 310 28,203 3,605 41,99,714 100 38,662 518 87,314 5,341 45,11,289
2011-12 696 1,01,523 650 1,35,515 3,935 37,36,592 45 32,807 717 81,947 6,058 40,52,774
2012-13 463 28,624 904 2,19,321 3,827 39,16,772 57 22,898 637 1,07,177 5,892 49,88,163
2013-14 225 46,606 231 1,02,385 1,788 50,15,025 21 12,106 358 61,586 2,607 52,35,939
Apr 13-Dec 13 144 23,884 177 82,064 1,410 37,61,896 13 10,006 240 48,442 1,972 39,24,646
Apr 14-Dec 14 383 1,68,055 169 77,851 1,682 45,36,866 47 57,684 359 51,410 2,638 48,91,668
Source: Various Credit Rating Agencies
(Maturity ≥ 1 year)
37
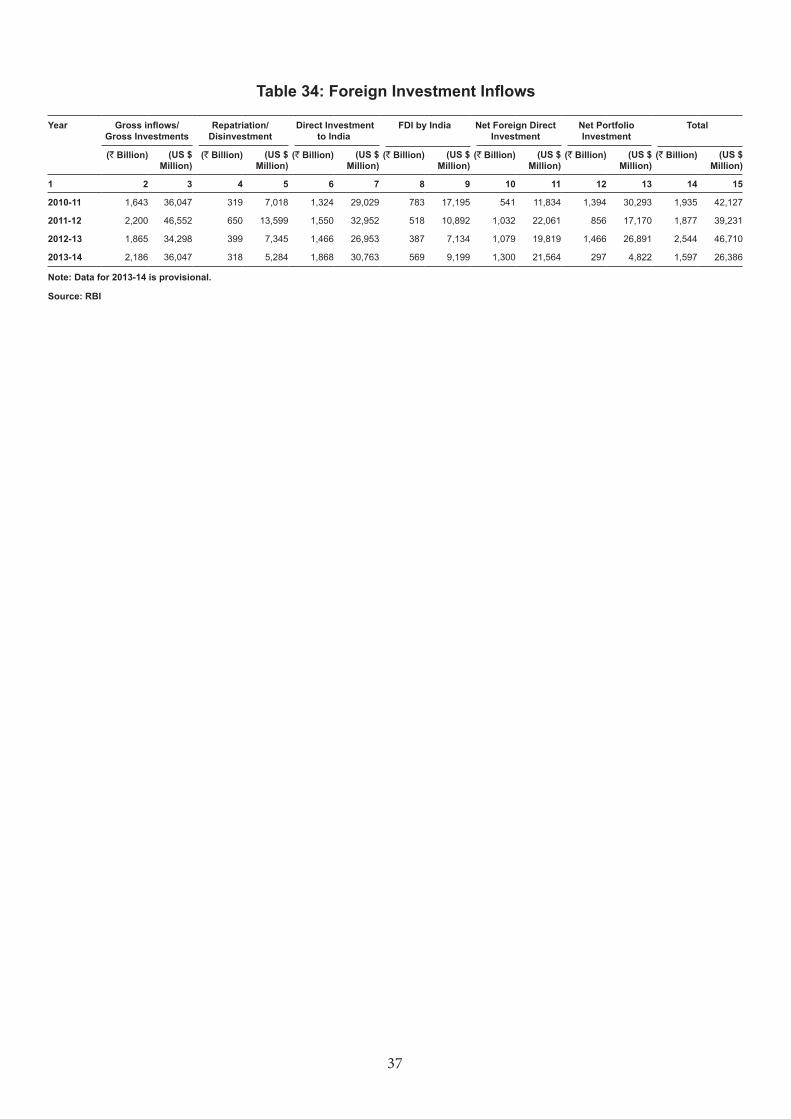
Table 34: Foreign Investment Inflows
Year Gross inflows/ Gross Investments
Repatriation/ Disinvestment
Direct Investment to India
FDI by India Net Foreign Direct Investment
Net Portfolio Investment
Total
(` Billion) (US $ Million)
(` Billion) (US $ Million)
(` Billion) (US $ Million)
(` Billion) (US $ Million)
(` Billion) (US $ Million)
(` Billion) (US $ Million)
(` Billion) (US $ Million)
1 2 3 4 5 6 7 8 9 10 11 12 13 14 15
2010-11 1,643 36,047 319 7,018 1,324 29,029 783 17,195 541 11,834 1,394 30,293 1,935 42,127
2011-12 2,200 46,552 650 13,599 1,550 32,952 518 10,892 1,032 22,061 856 17,170 1,877 39,231
2012-13 1,865 34,298 399 7,345 1,466 26,953 387 7,134 1,079 19,819 1,466 26,891 2,544 46,710
2013-14 2,186 36,047 318 5,284 1,868 30,763 569 9,199 1,300 21,564 297 4,822 1,597 26,386
Note: Data for 2013-14 is provisional.
Source: RBI
38
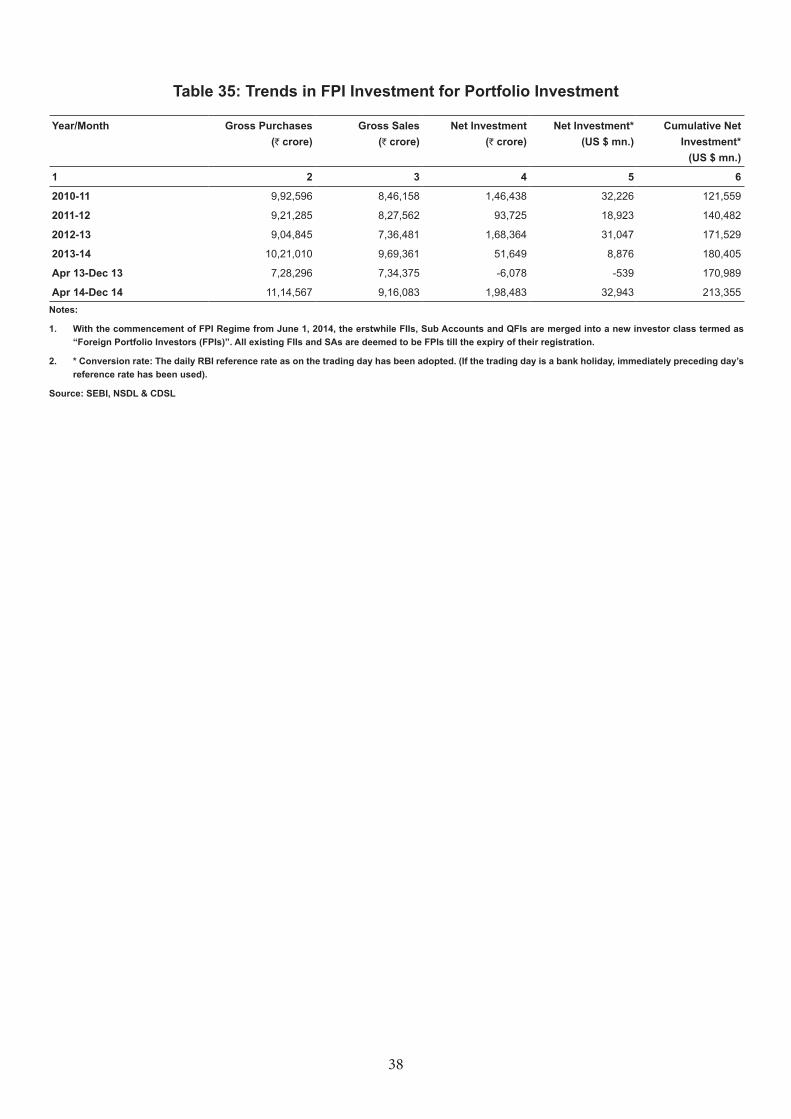
Table 35: Trends in FPI Investment for Portfolio Investment
Year/Month Gross Purchases (` crore)
Gross Sales (` crore)
Net Investment (` crore)
Net Investment* (US $ mn.)
Cumulative Net Investment*
(US $ mn.)
1 2 3 4 5 6
2010-11 9,92,596 8,46,158 1,46,438 32,226 121,559
2011-12 9,21,285 8,27,562 93,725 18,923 140,482
2012-13 9,04,845 7,36,481 1,68,364 31,047 171,529
2013-14 10,21,010 9,69,361 51,649 8,876 180,405
Apr 13-Dec 13 7,28,296 7,34,375 -6,078 -539 170,989
Apr 14-Dec 14 11,14,567 9,16,083 1,98,483 32,943 213,355Notes:
1. With the commencement of FPI Regime from June 1, 2014, the erstwhile FIIs, Sub Accounts and QFIs are merged into a new investor class termed as “Foreign Portfolio Investors (FPIs)”. All existing FIIs and SAs are deemed to be FPIs till the expiry of their registration.
2. * Conversion rate: The daily RBI reference rate as on the trading day has been adopted. (If the trading day is a bank holiday, immediately preceding day’s reference rate has been used).
Source: SEBI, NSDL & CDSL
39
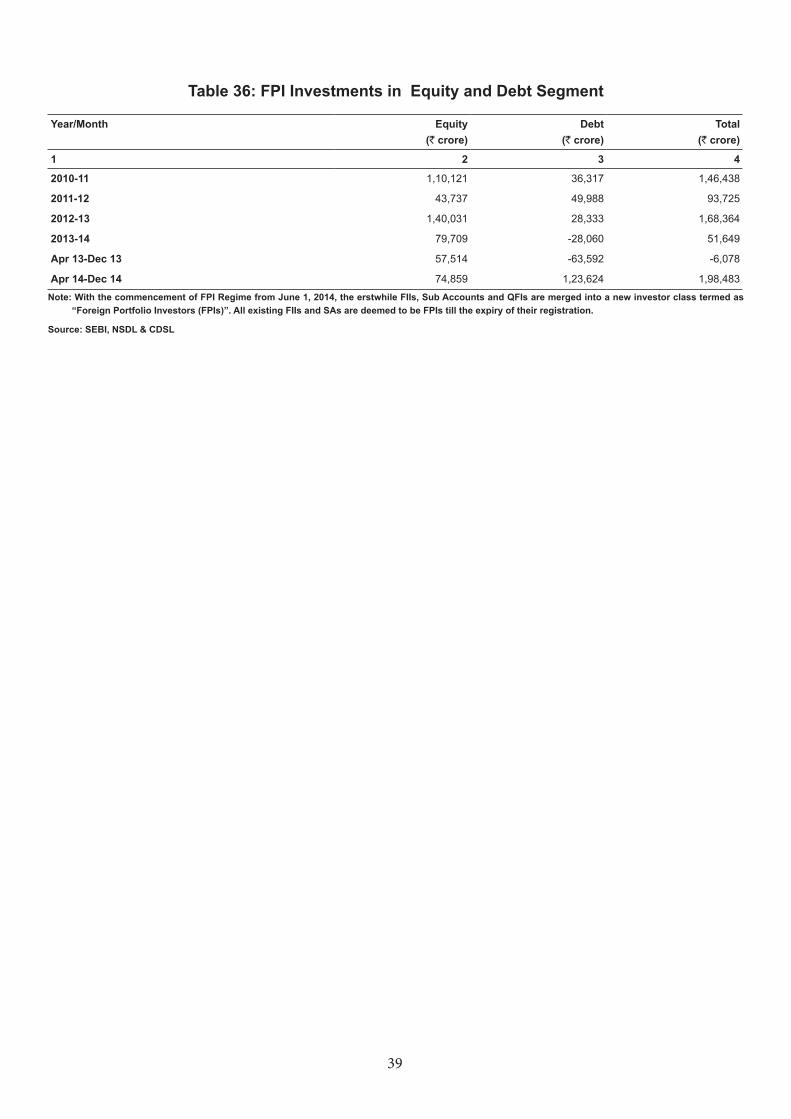
Table 36: FPI Investments in Equity and Debt Segment
Year/Month Equity (` crore)
Debt (` crore)
Total (` crore)
1 2 3 4
2010-11 1,10,121 36,317 1,46,438
2011-12 43,737 49,988 93,725
2012-13 1,40,031 28,333 1,68,364
2013-14 79,709 -28,060 51,649
Apr 13-Dec 13 57,514 -63,592 -6,078
Apr 14-Dec 14 74,859 1,23,624 1,98,483
Note: With the commencement of FPI Regime from June 1, 2014, the erstwhile FIIs, Sub Accounts and QFIs are merged into a new investor class termed as “Foreign Portfolio Investors (FPIs)”. All existing FIIs and SAs are deemed to be FPIs till the expiry of their registration.
Source: SEBI, NSDL & CDSL
40
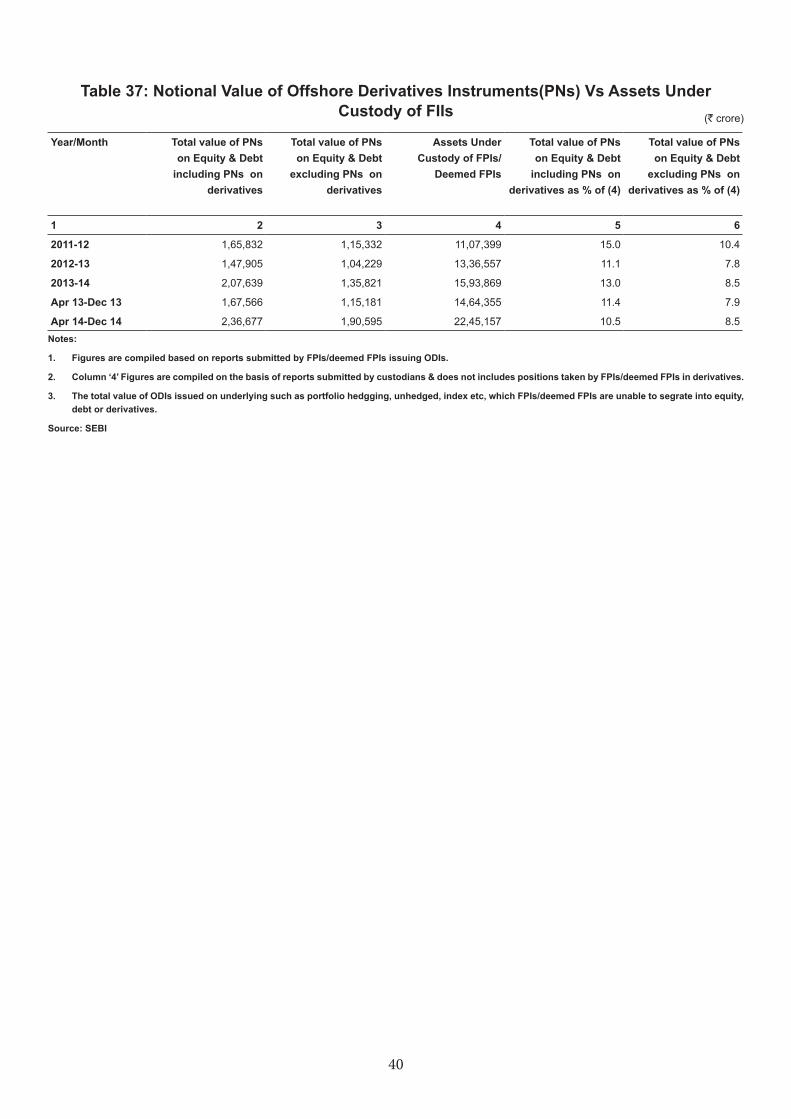
Table 37: Notional Value of Offshore Derivatives Instruments(PNs) Vs Assets Under Custody of FIIs (` crore)
Year/Month Total value of PNs on Equity & Debt
including PNs on derivatives
Total value of PNs on Equity & Debt
excluding PNs on derivatives
Assets Under Custody of FPIs/
Deemed FPIs
Total value of PNs on Equity & Debt
including PNs on derivatives as % of (4)
Total value of PNs on Equity & Debt
excluding PNs on derivatives as % of (4)
1 2 3 4 5 6
2011-12 1,65,832 1,15,332 11,07,399 15.0 10.4
2012-13 1,47,905 1,04,229 13,36,557 11.1 7.8
2013-14 2,07,639 1,35,821 15,93,869 13.0 8.5
Apr 13-Dec 13 1,67,566 1,15,181 14,64,355 11.4 7.9
Apr 14-Dec 14 2,36,677 1,90,595 22,45,157 10.5 8.5Notes:
1. Figures are compiled based on reports submitted by FPIs/deemed FPIs issuing ODIs.
2. Column ‘4’ Figures are compiled on the basis of reports submitted by custodians & does not includes positions taken by FPIs/deemed FPIs in derivatives.
3. The total value of ODIs issued on underlying such as portfolio hedgging, unhedged, index etc, which FPIs/deemed FPIs are unable to segrate into equity, debt or derivatives.
Source: SEBI
41
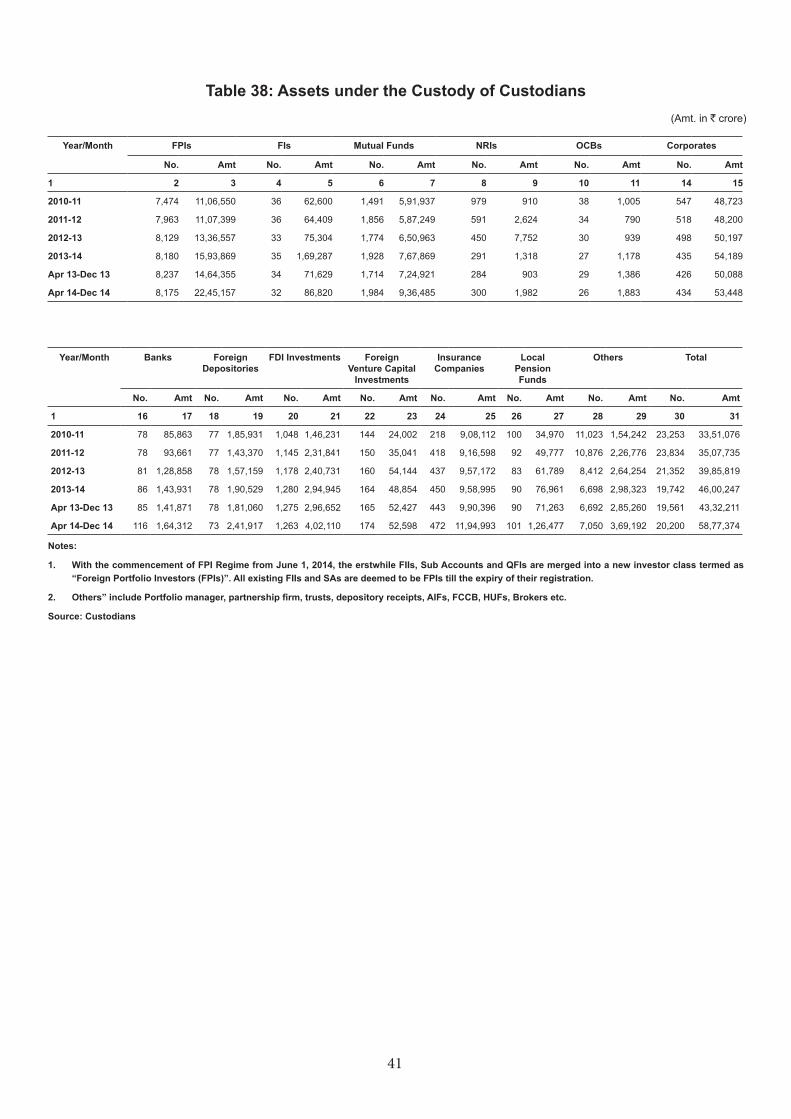
Table 38: Assets under the Custody of Custodians
Year/Month FPIs FIs Mutual Funds NRIs OCBs Corporates
No. Amt No. Amt No. Amt No. Amt No. Amt No. Amt
1 2 3 4 5 6 7 8 9 10 11 14 15
2010-11 7,474 11,06,550 36 62,600 1,491 5,91,937 979 910 38 1,005 547 48,723
2011-12 7,963 11,07,399 36 64,409 1,856 5,87,249 591 2,624 34 790 518 48,200
2012-13 8,129 13,36,557 33 75,304 1,774 6,50,963 450 7,752 30 939 498 50,197
2013-14 8,180 15,93,869 35 1,69,287 1,928 7,67,869 291 1,318 27 1,178 435 54,189
Apr 13-Dec 13 8,237 14,64,355 34 71,629 1,714 7,24,921 284 903 29 1,386 426 50,088
Apr 14-Dec 14 8,175 22,45,157 32 86,820 1,984 9,36,485 300 1,982 26 1,883 434 53,448
Year/Month Banks Foreign Depositories
FDI Investments Foreign Venture Capital
Investments
Insurance Companies
Local Pension Funds
Others Total
No. Amt No. Amt No. Amt No. Amt No. Amt No. Amt No. Amt No. Amt
1 16 17 18 19 20 21 22 23 24 25 26 27 28 29 30 31
2010-11 78 85,863 77 1,85,931 1,048 1,46,231 144 24,002 218 9,08,112 100 34,970 11,023 1,54,242 23,253 33,51,076
2011-12 78 93,661 77 1,43,370 1,145 2,31,841 150 35,041 418 9,16,598 92 49,777 10,876 2,26,776 23,834 35,07,735
2012-13 81 1,28,858 78 1,57,159 1,178 2,40,731 160 54,144 437 9,57,172 83 61,789 8,412 2,64,254 21,352 39,85,819
2013-14 86 1,43,931 78 1,90,529 1,280 2,94,945 164 48,854 450 9,58,995 90 76,961 6,698 2,98,323 19,742 46,00,247
Apr 13-Dec 13 85 1,41,871 78 1,81,060 1,275 2,96,652 165 52,427 443 9,90,396 90 71,263 6,692 2,85,260 19,561 43,32,211
Apr 14-Dec 14 116 1,64,312 73 2,41,917 1,263 4,02,110 174 52,598 472 11,94,993 101 1,26,477 7,050 3,69,192 20,200 58,77,374
Notes:
1. With the commencement of FPI Regime from June 1, 2014, the erstwhile FIIs, Sub Accounts and QFIs are merged into a new investor class termed as “Foreign Portfolio Investors (FPIs)”. All existing FIIs and SAs are deemed to be FPIs till the expiry of their registration.
2. Others” include Portfolio manager, partnership firm, trusts, depository receipts, AIFs, FCCB, HUFs, Brokers etc.
Source: Custodians
(Amt. in ` crore)
42
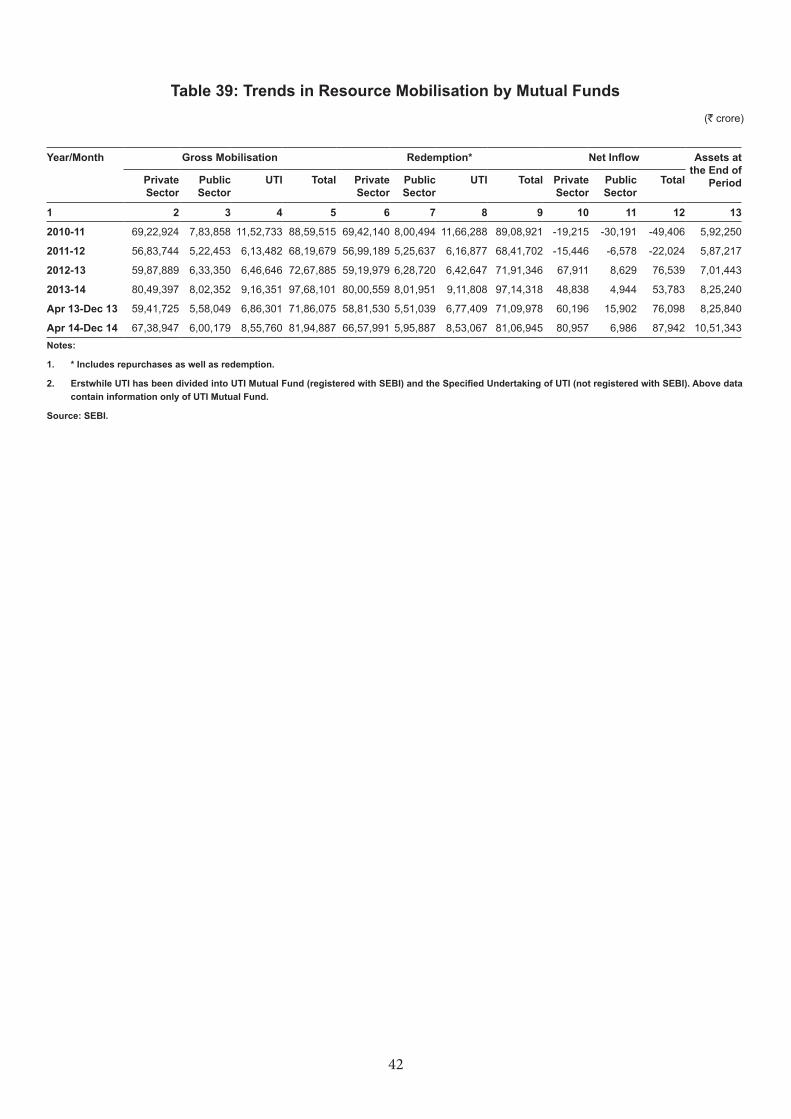
Table 39: Trends in Resource Mobilisation by Mutual Funds (` crore)
Year/Month Gross Mobilisation Redemption* Net Inflow Assets at the End of
PeriodPrivate Sector
Public Sector
UTI Total Private Sector
Public Sector
UTI Total Private Sector
Public Sector
Total
1 2 3 4 5 6 7 8 9 10 11 12 13
2010-11 69,22,924 7,83,858 11,52,733 88,59,515 69,42,140 8,00,494 11,66,288 89,08,921 -19,215 -30,191 -49,406 5,92,250
2011-12 56,83,744 5,22,453 6,13,482 68,19,679 56,99,189 5,25,637 6,16,877 68,41,702 -15,446 -6,578 -22,024 5,87,217
2012-13 59,87,889 6,33,350 6,46,646 72,67,885 59,19,979 6,28,720 6,42,647 71,91,346 67,911 8,629 76,539 7,01,443
2013-14 80,49,397 8,02,352 9,16,351 97,68,101 80,00,559 8,01,951 9,11,808 97,14,318 48,838 4,944 53,783 8,25,240
Apr 13-Dec 13 59,41,725 5,58,049 6,86,301 71,86,075 58,81,530 5,51,039 6,77,409 71,09,978 60,196 15,902 76,098 8,25,840
Apr 14-Dec 14 67,38,947 6,00,179 8,55,760 81,94,887 66,57,991 5,95,887 8,53,067 81,06,945 80,957 6,986 87,942 10,51,343Notes:
1. * Includes repurchases as well as redemption.
2. Erstwhile UTI has been divided into UTI Mutual Fund (registered with SEBI) and the Specified Undertaking of UTI (not registered with SEBI). Above data contain information only of UTI Mutual Fund.
Source: SEBI.
43
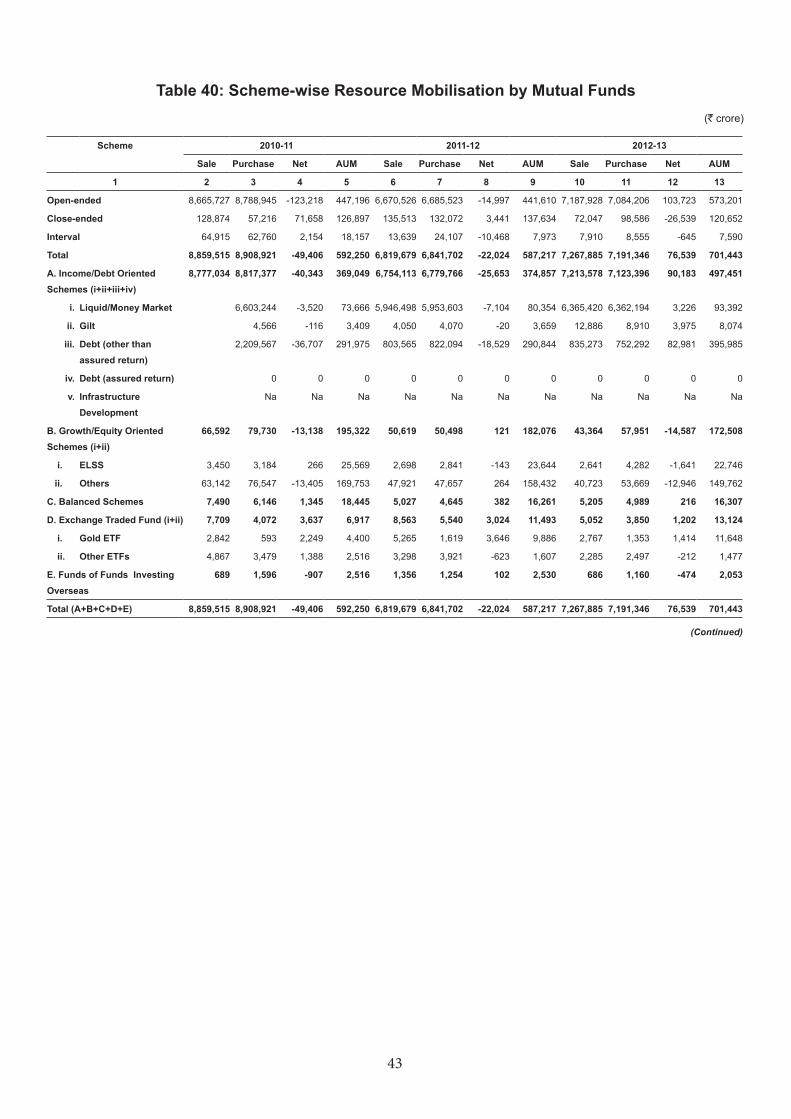
Table 40: Scheme-wise Resource Mobilisation by Mutual Funds
(Continued)
(` crore)
Scheme 2010-11 2011-12 2012-13
Sale Purchase Net AUM Sale Purchase Net AUM Sale Purchase Net AUM
1 2 3 4 5 6 7 8 9 10 11 12 13
Open-ended 8,665,727 8,788,945 -123,218 447,196 6,670,526 6,685,523 -14,997 441,610 7,187,928 7,084,206 103,723 573,201
Close-ended 128,874 57,216 71,658 126,897 135,513 132,072 3,441 137,634 72,047 98,586 -26,539 120,652
Interval 64,915 62,760 2,154 18,157 13,639 24,107 -10,468 7,973 7,910 8,555 -645 7,590
Total 8,859,515 8,908,921 -49,406 592,250 6,819,679 6,841,702 -22,024 587,217 7,267,885 7,191,346 76,539 701,443
A. Income/Debt Oriented Schemes (i+ii+iii+iv)
8,777,034 8,817,377 -40,343 369,049 6,754,113 6,779,766 -25,653 374,857 7,213,578 7,123,396 90,183 497,451
i. Liquid/Money Market 6,603,244 -3,520 73,666 5,946,498 5,953,603 -7,104 80,354 6,365,420 6,362,194 3,226 93,392
ii. Gilt 4,566 -116 3,409 4,050 4,070 -20 3,659 12,886 8,910 3,975 8,074
iii. Debt (other than assured return)
2,209,567 -36,707 291,975 803,565 822,094 -18,529 290,844 835,273 752,292 82,981 395,985
iv. Debt (assured return) 0 0 0 0 0 0 0 0 0 0 0
v. Infrastructure Development
Na Na Na Na Na Na Na Na Na Na Na
B. Growth/Equity Oriented Schemes (i+ii)
66,592 79,730 -13,138 195,322 50,619 50,498 121 182,076 43,364 57,951 -14,587 172,508
i. ELSS 3,450 3,184 266 25,569 2,698 2,841 -143 23,644 2,641 4,282 -1,641 22,746
ii. Others 63,142 76,547 -13,405 169,753 47,921 47,657 264 158,432 40,723 53,669 -12,946 149,762
C. Balanced Schemes 7,490 6,146 1,345 18,445 5,027 4,645 382 16,261 5,205 4,989 216 16,307
D. Exchange Traded Fund (i+ii) 7,709 4,072 3,637 6,917 8,563 5,540 3,024 11,493 5,052 3,850 1,202 13,124
i. Gold ETF 2,842 593 2,249 4,400 5,265 1,619 3,646 9,886 2,767 1,353 1,414 11,648
ii. Other ETFs 4,867 3,479 1,388 2,516 3,298 3,921 -623 1,607 2,285 2,497 -212 1,477
E. Funds of Funds Investing Overseas
689 1,596 -907 2,516 1,356 1,254 102 2,530 686 1,160 -474 2,053
Total (A+B+C+D+E) 8,859,515 8,908,921 -49,406 592,250 6,819,679 6,841,702 -22,024 587,217 7,267,885 7,191,346 76,539 701,443
44
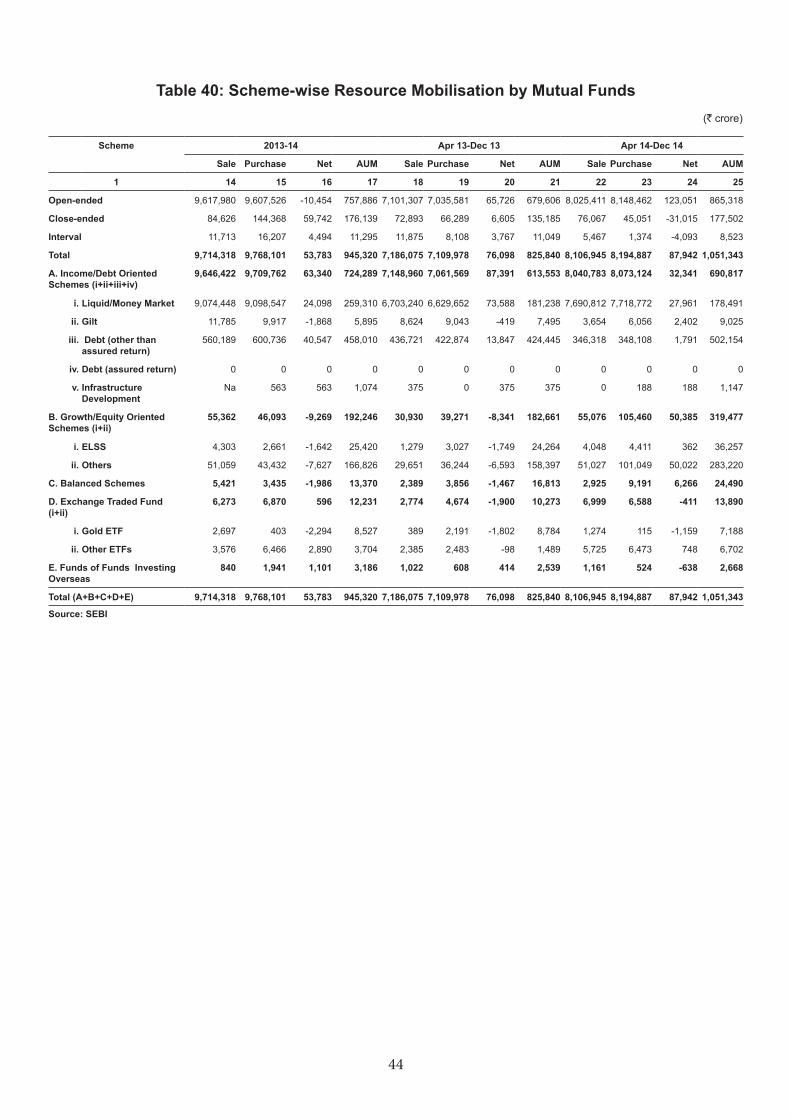
Table 40: Scheme-wise Resource Mobilisation by Mutual Funds(` crore)
Scheme 2013-14 Apr 13-Dec 13 Apr 14-Dec 14
Sale Purchase Net AUM Sale Purchase Net AUM Sale Purchase Net AUM
1 14 15 16 17 18 19 20 21 22 23 24 25
Open-ended 9,617,980 9,607,526 -10,454 757,886 7,101,307 7,035,581 65,726 679,606 8,025,411 8,148,462 123,051 865,318
Close-ended 84,626 144,368 59,742 176,139 72,893 66,289 6,605 135,185 76,067 45,051 -31,015 177,502
Interval 11,713 16,207 4,494 11,295 11,875 8,108 3,767 11,049 5,467 1,374 -4,093 8,523
Total 9,714,318 9,768,101 53,783 945,320 7,186,075 7,109,978 76,098 825,840 8,106,945 8,194,887 87,942 1,051,343
A. Income/Debt Oriented Schemes (i+ii+iii+iv)
9,646,422 9,709,762 63,340 724,289 7,148,960 7,061,569 87,391 613,553 8,040,783 8,073,124 32,341 690,817
i. Liquid/Money Market 9,074,448 9,098,547 24,098 259,310 6,703,240 6,629,652 73,588 181,238 7,690,812 7,718,772 27,961 178,491
ii. Gilt 11,785 9,917 -1,868 5,895 8,624 9,043 -419 7,495 3,654 6,056 2,402 9,025
iii. Debt (other than assured return)
560,189 600,736 40,547 458,010 436,721 422,874 13,847 424,445 346,318 348,108 1,791 502,154
iv. Debt (assured return) 0 0 0 0 0 0 0 0 0 0 0 0
v. Infrastructure Development
Na 563 563 1,074 375 0 375 375 0 188 188 1,147
B. Growth/Equity Oriented Schemes (i+ii)
55,362 46,093 -9,269 192,246 30,930 39,271 -8,341 182,661 55,076 105,460 50,385 319,477
i. ELSS 4,303 2,661 -1,642 25,420 1,279 3,027 -1,749 24,264 4,048 4,411 362 36,257
ii. Others 51,059 43,432 -7,627 166,826 29,651 36,244 -6,593 158,397 51,027 101,049 50,022 283,220
C. Balanced Schemes 5,421 3,435 -1,986 13,370 2,389 3,856 -1,467 16,813 2,925 9,191 6,266 24,490
D. Exchange Traded Fund (i+ii)
6,273 6,870 596 12,231 2,774 4,674 -1,900 10,273 6,999 6,588 -411 13,890
i. Gold ETF 2,697 403 -2,294 8,527 389 2,191 -1,802 8,784 1,274 115 -1,159 7,188
ii. Other ETFs 3,576 6,466 2,890 3,704 2,385 2,483 -98 1,489 5,725 6,473 748 6,702
E. Funds of Funds Investing Overseas
840 1,941 1,101 3,186 1,022 608 414 2,539 1,161 524 -638 2,668
Total (A+B+C+D+E) 9,714,318 9,768,101 53,783 945,320 7,186,075 7,109,978 76,098 825,840 8,106,945 8,194,887 87,942 1,051,343
Source: SEBI
45
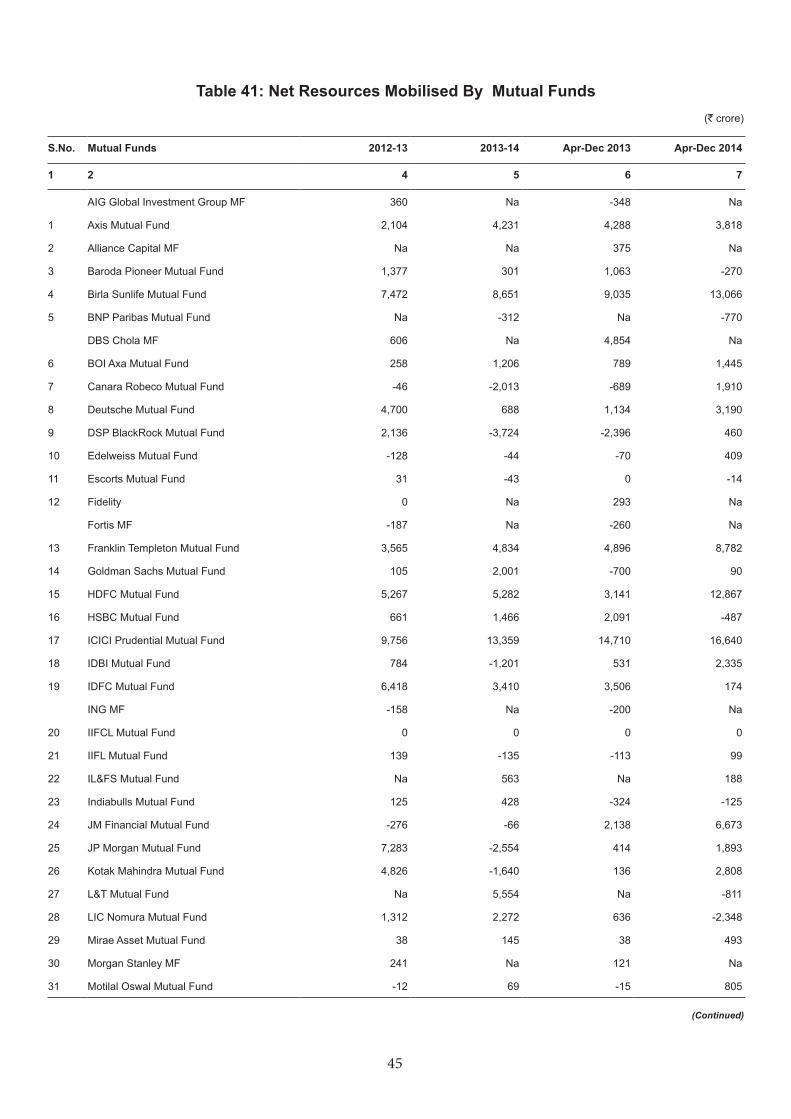
Table 41: Net Resources Mobilised By Mutual Funds
(Continued)
(` crore)
S.No. Mutual Funds 2012-13 2013-14 Apr-Dec 2013 Apr-Dec 2014
1 2 4 5 6 7
AIG Global Investment Group MF 360 Na -348 Na
1 Axis Mutual Fund 2,104 4,231 4,288 3,818
2 Alliance Capital MF Na Na 375 Na
3 Baroda Pioneer Mutual Fund 1,377 301 1,063 -270
4 Birla Sunlife Mutual Fund 7,472 8,651 9,035 13,066
5 BNP Paribas Mutual Fund Na -312 Na -770
DBS Chola MF 606 Na 4,854 Na
6 BOI Axa Mutual Fund 258 1,206 789 1,445
7 Canara Robeco Mutual Fund -46 -2,013 -689 1,910
8 Deutsche Mutual Fund 4,700 688 1,134 3,190
9 DSP BlackRock Mutual Fund 2,136 -3,724 -2,396 460
10 Edelweiss Mutual Fund -128 -44 -70 409
11 Escorts Mutual Fund 31 -43 0 -14
12 Fidelity 0 Na 293 Na
Fortis MF -187 Na -260 Na
13 Franklin Templeton Mutual Fund 3,565 4,834 4,896 8,782
14 Goldman Sachs Mutual Fund 105 2,001 -700 90
15 HDFC Mutual Fund 5,267 5,282 3,141 12,867
16 HSBC Mutual Fund 661 1,466 2,091 -487
17 ICICI Prudential Mutual Fund 9,756 13,359 14,710 16,640
18 IDBI Mutual Fund 784 -1,201 531 2,335
19 IDFC Mutual Fund 6,418 3,410 3,506 174
ING MF -158 Na -200 Na
20 IIFCL Mutual Fund 0 0 0 0
21 IIFL Mutual Fund 139 -135 -113 99
22 IL&FS Mutual Fund Na 563 Na 188
23 Indiabulls Mutual Fund 125 428 -324 -125
24 JM Financial Mutual Fund -276 -66 2,138 6,673
25 JP Morgan Mutual Fund 7,283 -2,554 414 1,893
26 Kotak Mahindra Mutual Fund 4,826 -1,640 136 2,808
27 L&T Mutual Fund Na 5,554 Na -811
28 LIC Nomura Mutual Fund 1,312 2,272 636 -2,348
29 Mirae Asset Mutual Fund 38 145 38 493
30 Morgan Stanley MF 241 Na 121 Na
31 Motilal Oswal Mutual Fund -12 69 -15 805
46
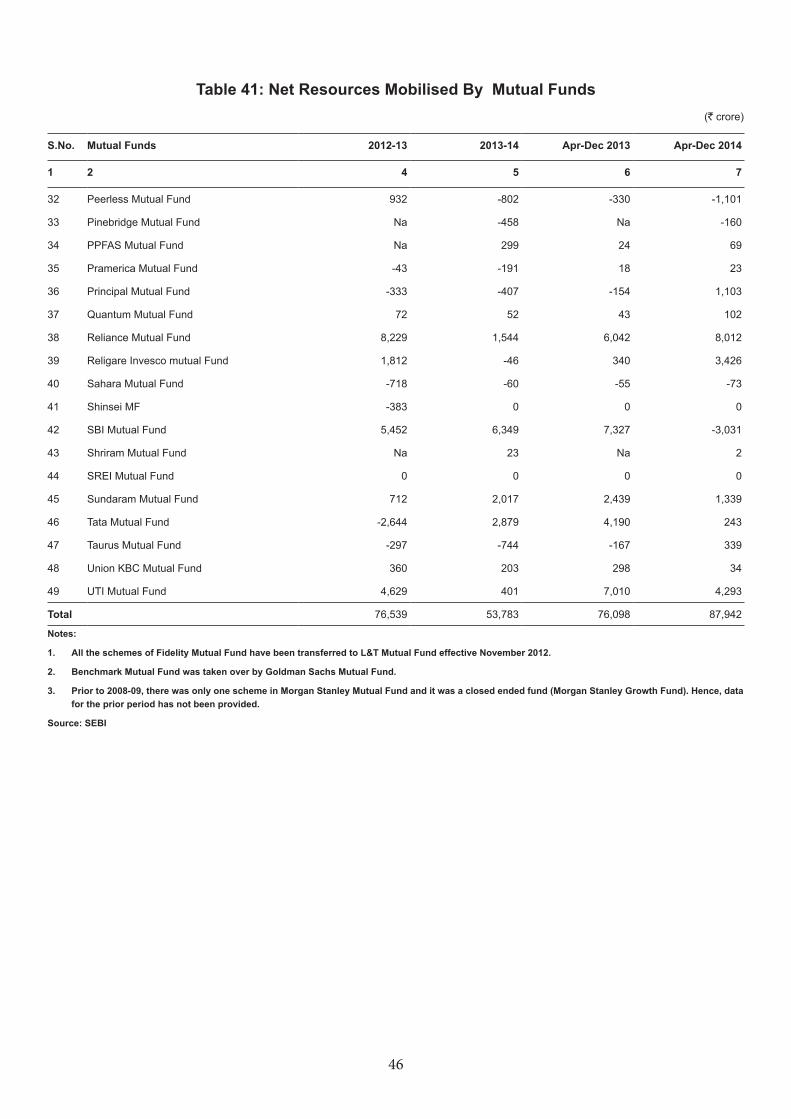
Table 41: Net Resources Mobilised By Mutual Funds (` crore)
S.No. Mutual Funds 2012-13 2013-14 Apr-Dec 2013 Apr-Dec 2014
1 2 4 5 6 7
32 Peerless Mutual Fund 932 -802 -330 -1,101
33 Pinebridge Mutual Fund Na -458 Na -160
34 PPFAS Mutual Fund Na 299 24 69
35 Pramerica Mutual Fund -43 -191 18 23
36 Principal Mutual Fund -333 -407 -154 1,103
37 Quantum Mutual Fund 72 52 43 102
38 Reliance Mutual Fund 8,229 1,544 6,042 8,012
39 Religare Invesco mutual Fund 1,812 -46 340 3,426
40 Sahara Mutual Fund -718 -60 -55 -73
41 Shinsei MF -383 0 0 0
42 SBI Mutual Fund 5,452 6,349 7,327 -3,031
43 Shriram Mutual Fund Na 23 Na 2
44 SREI Mutual Fund 0 0 0 0
45 Sundaram Mutual Fund 712 2,017 2,439 1,339
46 Tata Mutual Fund -2,644 2,879 4,190 243
47 Taurus Mutual Fund -297 -744 -167 339
48 Union KBC Mutual Fund 360 203 298 34
49 UTI Mutual Fund 4,629 401 7,010 4,293
Total 76,539 53,783 76,098 87,942
Notes:
1. All the schemes of Fidelity Mutual Fund have been transferred to L&T Mutual Fund effective November 2012.
2. Benchmark Mutual Fund was taken over by Goldman Sachs Mutual Fund.
3. Prior to 2008-09, there was only one scheme in Morgan Stanley Mutual Fund and it was a closed ended fund (Morgan Stanley Growth Fund). Hence, data for the prior period has not been provided.
Source: SEBI
47
Table 42: Trends in Transactions on Stock Exchanges by Mutual Funds
Year/Month Equity Debt Total
Gross Purchase
Gross Sales
Net Purchase/
Sales
Gross Purchase
Gross Sales
Net Purchase/
Sales
Gross Purchase
Gross Sales
Net Purchase/
Sales
1 2 3 4 5 6 7 8 9 10
2010-11 1,54,919 1,74,893 -19,975 7,64,142 5,15,290 2,48,854 9,19,060 6,90,183 2,28,879
2011-12 1,32,137 1,33,494 -1,358 11,16,760 7,81,940 3,34,820 12,48,897 9,15,434 3,33,463
2012-13 1,13,758 1,36,507 -22,749 15,23,393 10,49,934 4,73,460 16,37,150 11,86,440 4,50,711
2013-14 1,12,131 1,33,356 -21,224 15,38,087 9,94,842 5,43,247 16,50,219 11,28,197 5,22,023
Apr 13-Dec 13 82,012 95,486 -6,457 10,61,793 7,25,779 3,36,014 11,43,805 8,21,265 3,29,557
Apr 14-Dec 14 1,69,122 1,37,529 31,593 12,89,376 8,76,361 4,13,016 14,58,498 10,13,889 4,44,609
Source: SEBI
(` crore)
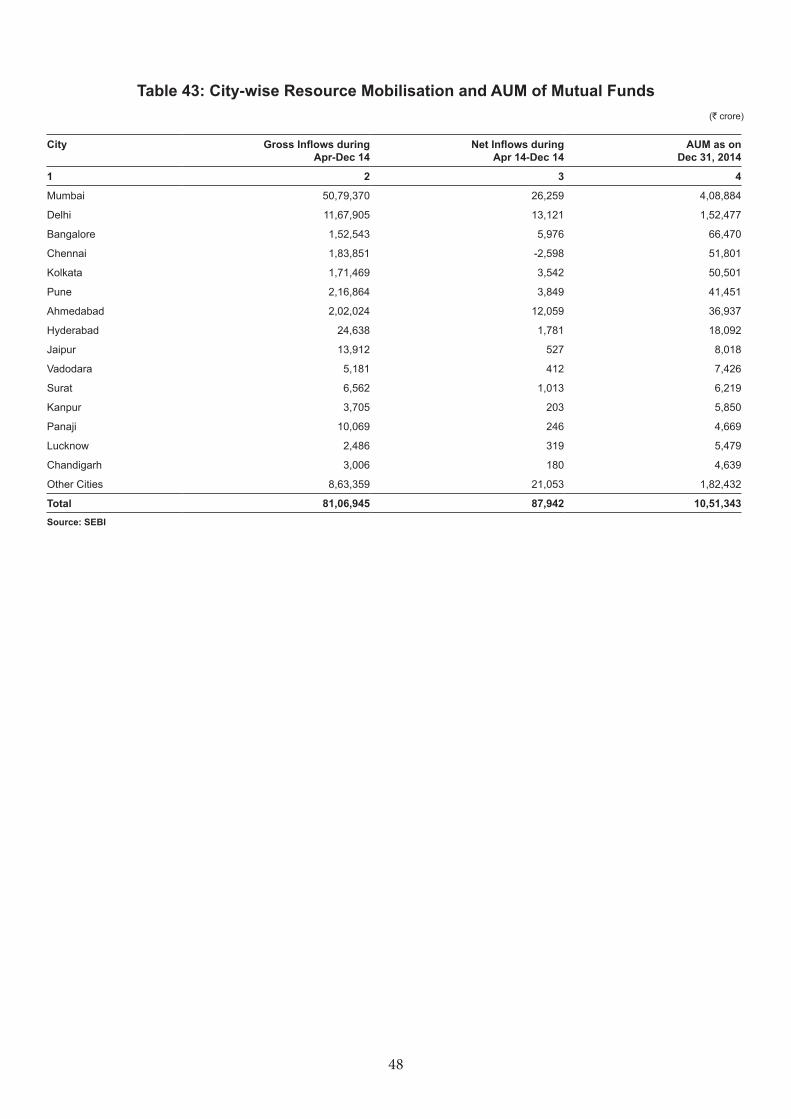
48
Table 43: City-wise Resource Mobilisation and AUM of Mutual Funds(` crore)
City Gross Inflows during Apr-Dec 14
Net Inflows during Apr 14-Dec 14
AUM as on Dec 31, 2014
1 2 3 4
Mumbai 50,79,370 26,259 4,08,884
Delhi 11,67,905 13,121 1,52,477
Bangalore 1,52,543 5,976 66,470
Chennai 1,83,851 -2,598 51,801
Kolkata 1,71,469 3,542 50,501
Pune 2,16,864 3,849 41,451
Ahmedabad 2,02,024 12,059 36,937
Hyderabad 24,638 1,781 18,092
Jaipur 13,912 527 8,018
Vadodara 5,181 412 7,426
Surat 6,562 1,013 6,219
Kanpur 3,705 203 5,850
Panaji 10,069 246 4,669
Lucknow 2,486 319 5,479
Chandigarh 3,006 180 4,639
Other Cities 8,63,359 21,053 1,82,432
Total 81,06,945 87,942 10,51,343Source: SEBI
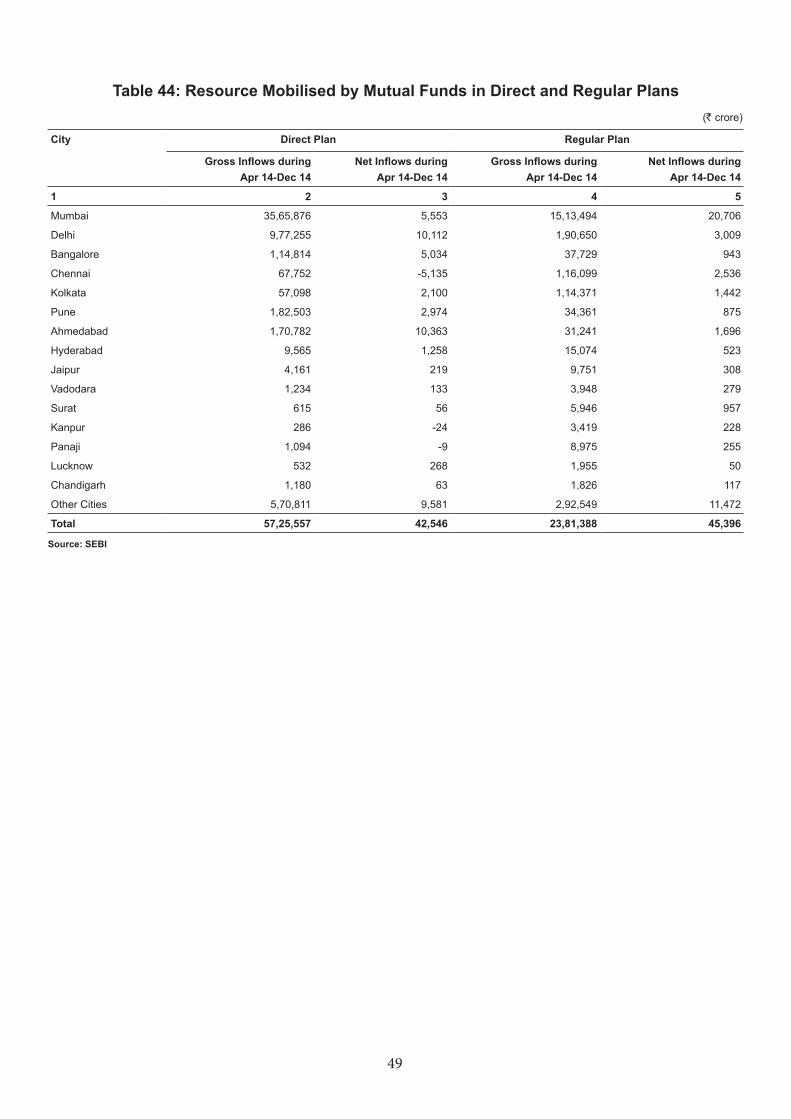
49
Table 44: Resource Mobilised by Mutual Funds in Direct and Regular Plans(` crore)
City Direct Plan Regular Plan
Gross Inflows during Apr 14-Dec 14
Net Inflows during Apr 14-Dec 14
Gross Inflows during Apr 14-Dec 14
Net Inflows during Apr 14-Dec 14
1 2 3 4 5
Mumbai 35,65,876 5,553 15,13,494 20,706
Delhi 9,77,255 10,112 1,90,650 3,009
Bangalore 1,14,814 5,034 37,729 943
Chennai 67,752 -5,135 1,16,099 2,536
Kolkata 57,098 2,100 1,14,371 1,442
Pune 1,82,503 2,974 34,361 875
Ahmedabad 1,70,782 10,363 31,241 1,696
Hyderabad 9,565 1,258 15,074 523
Jaipur 4,161 219 9,751 308
Vadodara 1,234 133 3,948 279
Surat 615 56 5,946 957
Kanpur 286 -24 3,419 228
Panaji 1,094 -9 8,975 255
Lucknow 532 268 1,955 50
Chandigarh 1,180 63 1,826 117
Other Cities 5,70,811 9,581 2,92,549 11,472
Total 57,25,557 42,546 23,81,388 45,396
Source: SEBI
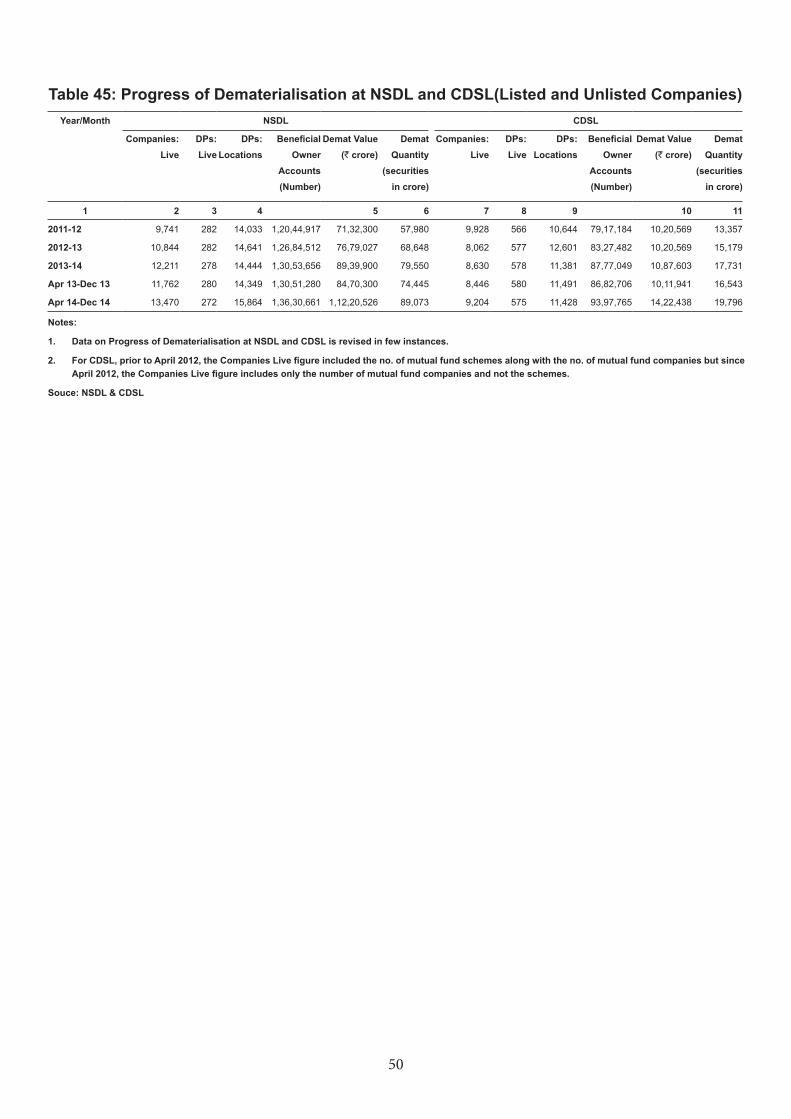
50
Table 45: Progress of Dematerialisation at NSDL and CDSL(Listed and Unlisted Companies)Year/Month NSDL CDSL
Companies: Live
DPs: Live
DPs: Locations
Beneficial Owner
Accounts (Number)
Demat Value (` crore)
Demat Quantity
(securities in crore)
Companies: Live
DPs: Live
DPs: Locations
Beneficial Owner
Accounts (Number)
Demat Value (` crore)
Demat Quantity
(securities in crore)
1 2 3 4 5 6 7 8 9 10 11
2011-12 9,741 282 14,033 1,20,44,917 71,32,300 57,980 9,928 566 10,644 79,17,184 10,20,569 13,357
2012-13 10,844 282 14,641 1,26,84,512 76,79,027 68,648 8,062 577 12,601 83,27,482 10,20,569 15,179
2013-14 12,211 278 14,444 1,30,53,656 89,39,900 79,550 8,630 578 11,381 87,77,049 10,87,603 17,731
Apr 13-Dec 13 11,762 280 14,349 1,30,51,280 84,70,300 74,445 8,446 580 11,491 86,82,706 10,11,941 16,543
Apr 14-Dec 14 13,470 272 15,864 1,36,30,661 1,12,20,526 89,073 9,204 575 11,428 93,97,765 14,22,438 19,796
Notes:
1. Data on Progress of Dematerialisation at NSDL and CDSL is revised in few instances.
2. For CDSL, prior to April 2012, the Companies Live figure included the no. of mutual fund schemes along with the no. of mutual fund companies but since April 2012, the Companies Live figure includes only the number of mutual fund companies and not the schemes.
Souce: NSDL & CDSL
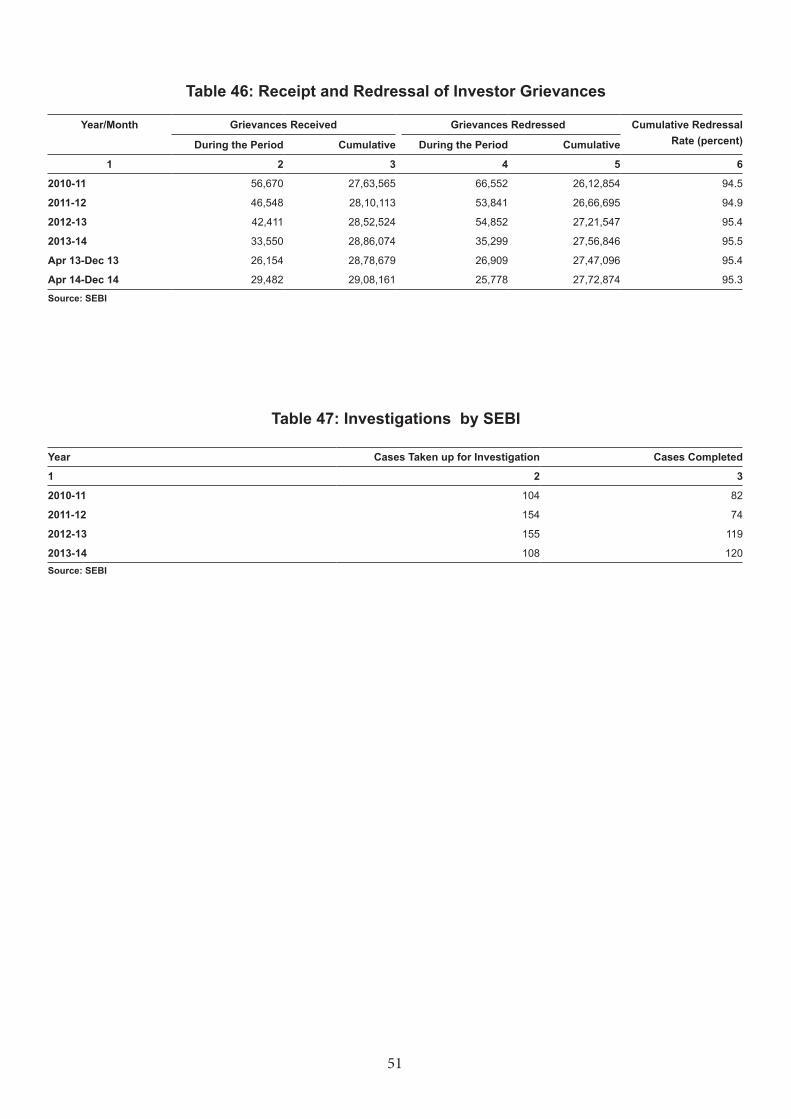
51
Table 46: Receipt and Redressal of Investor Grievances
Year/Month Grievances Received Grievances Redressed Cumulative Redressal Rate (percent)During the Period Cumulative During the Period Cumulative
1 2 3 4 5 6
2010-11 56,670 27,63,565 66,552 26,12,854 94.5
2011-12 46,548 28,10,113 53,841 26,66,695 94.9
2012-13 42,411 28,52,524 54,852 27,21,547 95.4
2013-14 33,550 28,86,074 35,299 27,56,846 95.5
Apr 13-Dec 13 26,154 28,78,679 26,909 27,47,096 95.4
Apr 14-Dec 14 29,482 29,08,161 25,778 27,72,874 95.3
Source: SEBI
Table 47: Investigations by SEBI
Year Cases Taken up for Investigation Cases Completed
1 2 3
2010-11 104 82
2011-12 154 74
2012-13 155 119
2013-14 108 120Source: SEBI
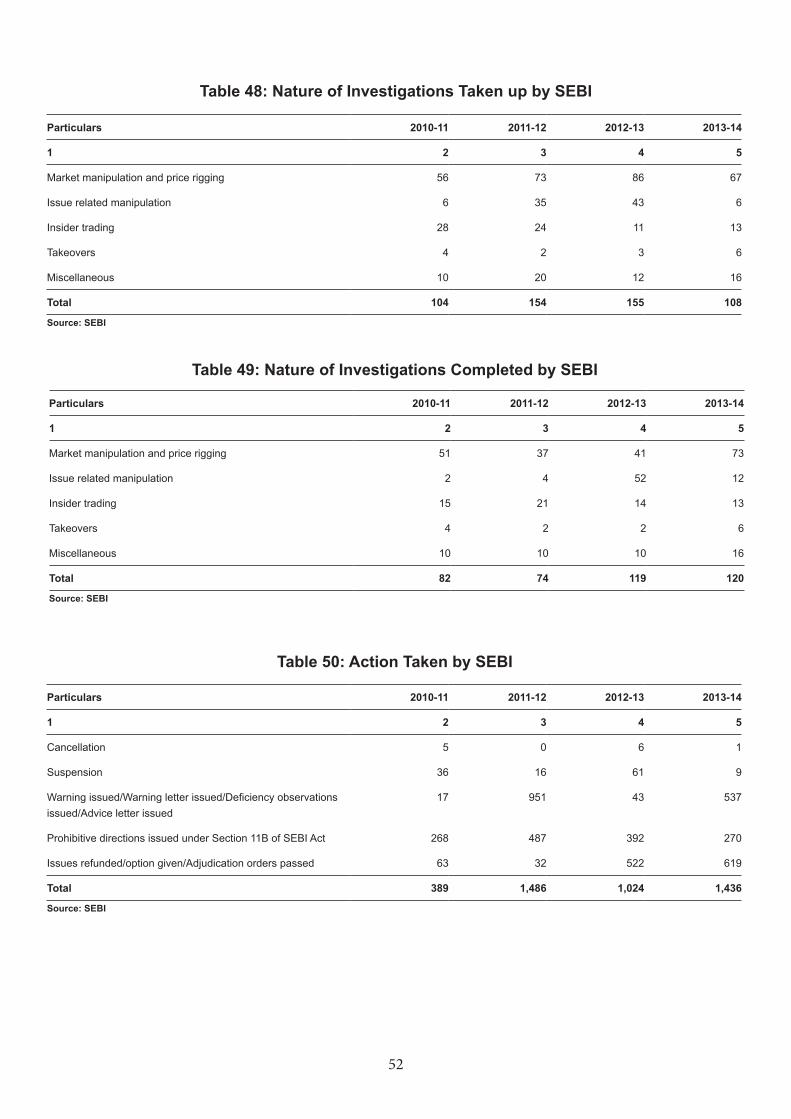
52
Table 48: Nature of Investigations Taken up by SEBI
Particulars 2010-11 2011-12 2012-13 2013-14
1 2 3 4 5
Market manipulation and price rigging 56 73 86 67
Issue related manipulation 6 35 43 6
Insider trading 28 24 11 13
Takeovers 4 2 3 6
Miscellaneous 10 20 12 16
Total 104 154 155 108
Source: SEBI
Particulars 2010-11 2011-12 2012-13 2013-14
1 2 3 4 5
Market manipulation and price rigging 51 37 41 73
Issue related manipulation 2 4 52 12
Insider trading 15 21 14 13
Takeovers 4 2 2 6
Miscellaneous 10 10 10 16
Total 82 74 119 120
Source: SEBI
Particulars 2010-11 2011-12 2012-13 2013-14
1 2 3 4 5
Cancellation 5 0 6 1
Suspension 36 16 61 9
Warning issued/Warning letter issued/Deficiency observations issued/Advice letter issued
17 951 43 537
Prohibitive directions issued under Section 11B of SEBI Act 268 487 392 270
Issues refunded/option given/Adjudication orders passed 63 32 522 619
Total 389 1,486 1,024 1,436
Source: SEBI
Table 49: Nature of Investigations Completed by SEBI
Table 50: Action Taken by SEBI

53
PART IISECURITIES MARKET (MONTHLY SERIES)

54
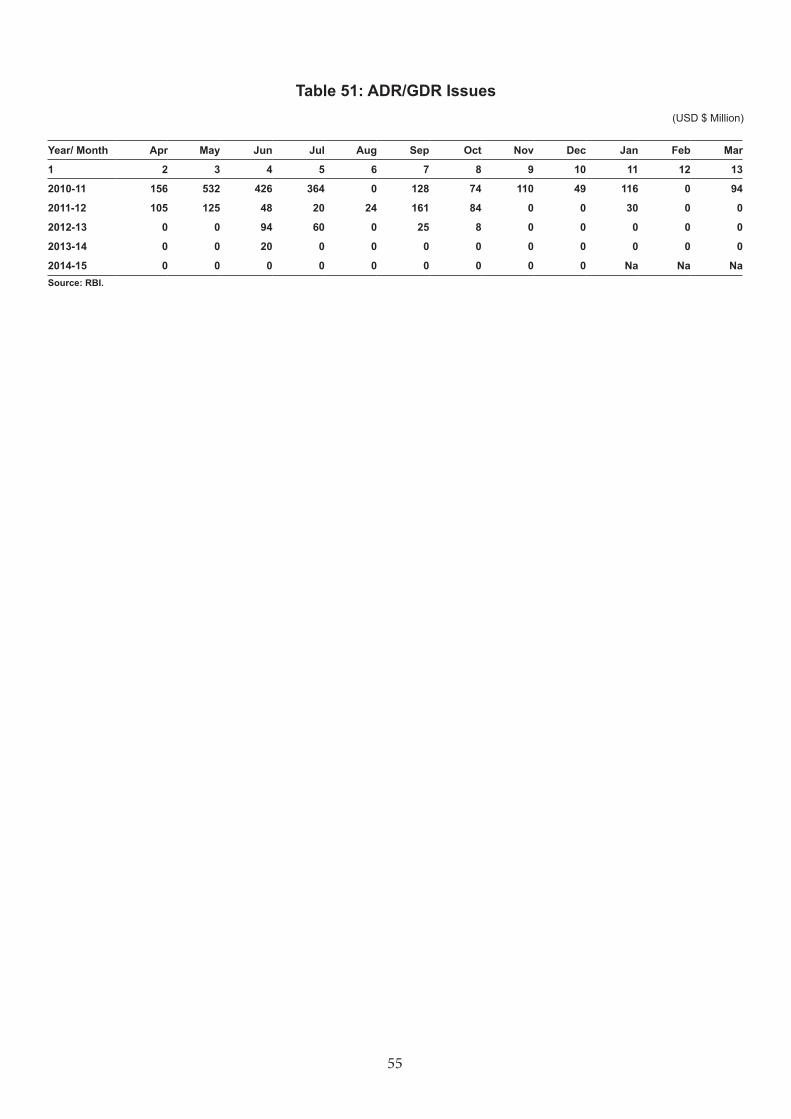
55
Table 51: ADR/GDR Issues
Year/ Month Apr May Jun Jul Aug Sep Oct Nov Dec Jan Feb Mar
1 2 3 4 5 6 7 8 9 10 11 12 13
2010-11 156 532 426 364 0 128 74 110 49 116 0 94
2011-12 105 125 48 20 24 161 84 0 0 30 0 0
2012-13 0 0 94 60 0 25 8 0 0 0 0 0
2013-14 0 0 20 0 0 0 0 0 0 0 0 0
2014-15 0 0 0 0 0 0 0 0 0 Na Na NaSource: RBI.
(USD $ Million)
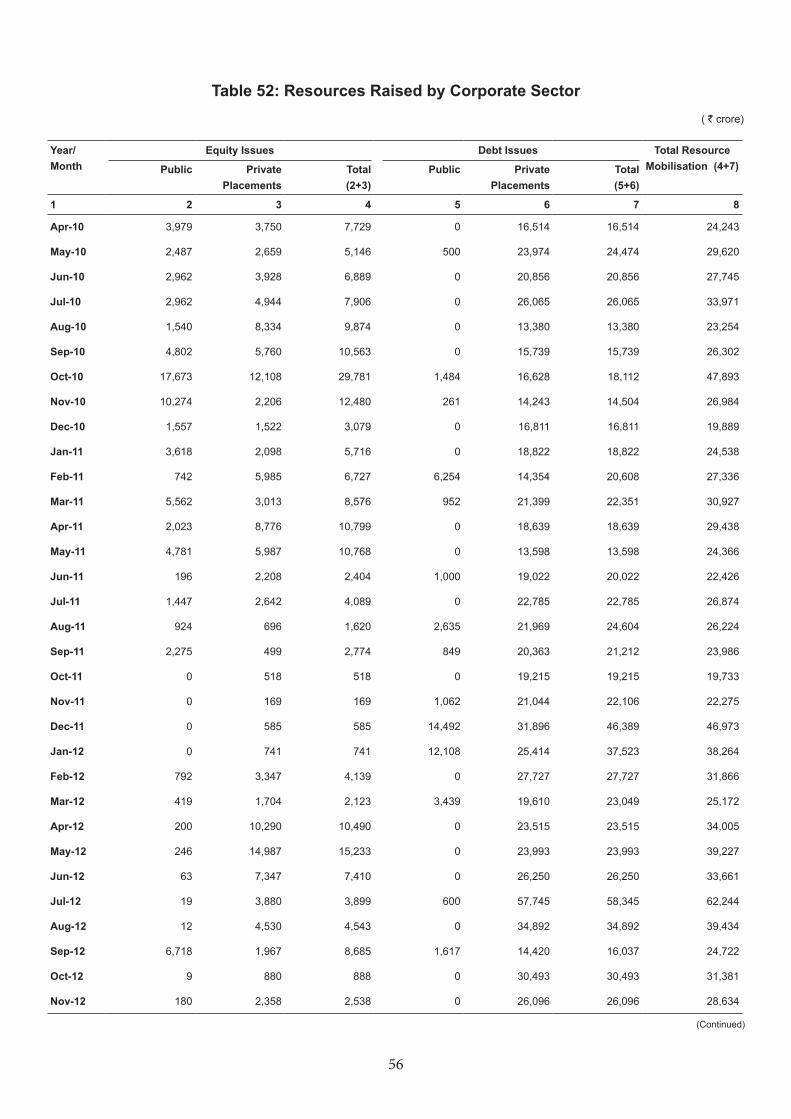
56
Table 52: Resources Raised by Corporate Sector
Year/ Month
Equity Issues Debt Issues Total Resource Mobilisation (4+7)Public Private
PlacementsTotal(2+3)
Public Private Placements
Total(5+6)
1 2 3 4 5 6 7 8
Apr-10 3,979 3,750 7,729 0 16,514 16,514 24,243
May-10 2,487 2,659 5,146 500 23,974 24,474 29,620
Jun-10 2,962 3,928 6,889 0 20,856 20,856 27,745
Jul-10 2,962 4,944 7,906 0 26,065 26,065 33,971
Aug-10 1,540 8,334 9,874 0 13,380 13,380 23,254
Sep-10 4,802 5,760 10,563 0 15,739 15,739 26,302
Oct-10 17,673 12,108 29,781 1,484 16,628 18,112 47,893
Nov-10 10,274 2,206 12,480 261 14,243 14,504 26,984
Dec-10 1,557 1,522 3,079 0 16,811 16,811 19,889
Jan-11 3,618 2,098 5,716 0 18,822 18,822 24,538
Feb-11 742 5,985 6,727 6,254 14,354 20,608 27,336
Mar-11 5,562 3,013 8,576 952 21,399 22,351 30,927
Apr-11 2,023 8,776 10,799 0 18,639 18,639 29,438
May-11 4,781 5,987 10,768 0 13,598 13,598 24,366
Jun-11 196 2,208 2,404 1,000 19,022 20,022 22,426
Jul-11 1,447 2,642 4,089 0 22,785 22,785 26,874
Aug-11 924 696 1,620 2,635 21,969 24,604 26,224
Sep-11 2,275 499 2,774 849 20,363 21,212 23,986
Oct-11 0 518 518 0 19,215 19,215 19,733
Nov-11 0 169 169 1,062 21,044 22,106 22,275
Dec-11 0 585 585 14,492 31,896 46,389 46,973
Jan-12 0 741 741 12,108 25,414 37,523 38,264
Feb-12 792 3,347 4,139 0 27,727 27,727 31,866
Mar-12 419 1,704 2,123 3,439 19,610 23,049 25,172
Apr-12 200 10,290 10,490 0 23,515 23,515 34,005
May-12 246 14,987 15,233 0 23,993 23,993 39,227
Jun-12 63 7,347 7,410 0 26,250 26,250 33,661
Jul-12 19 3,880 3,899 600 57,745 58,345 62,244
Aug-12 12 4,530 4,543 0 34,892 34,892 39,434
Sep-12 6,718 1,967 8,685 1,617 14,420 16,037 24,722
Oct-12 9 880 888 0 30,493 30,493 31,381
Nov-12 180 2,358 2,538 0 26,096 26,096 28,634
(Continued)
( ` crore)
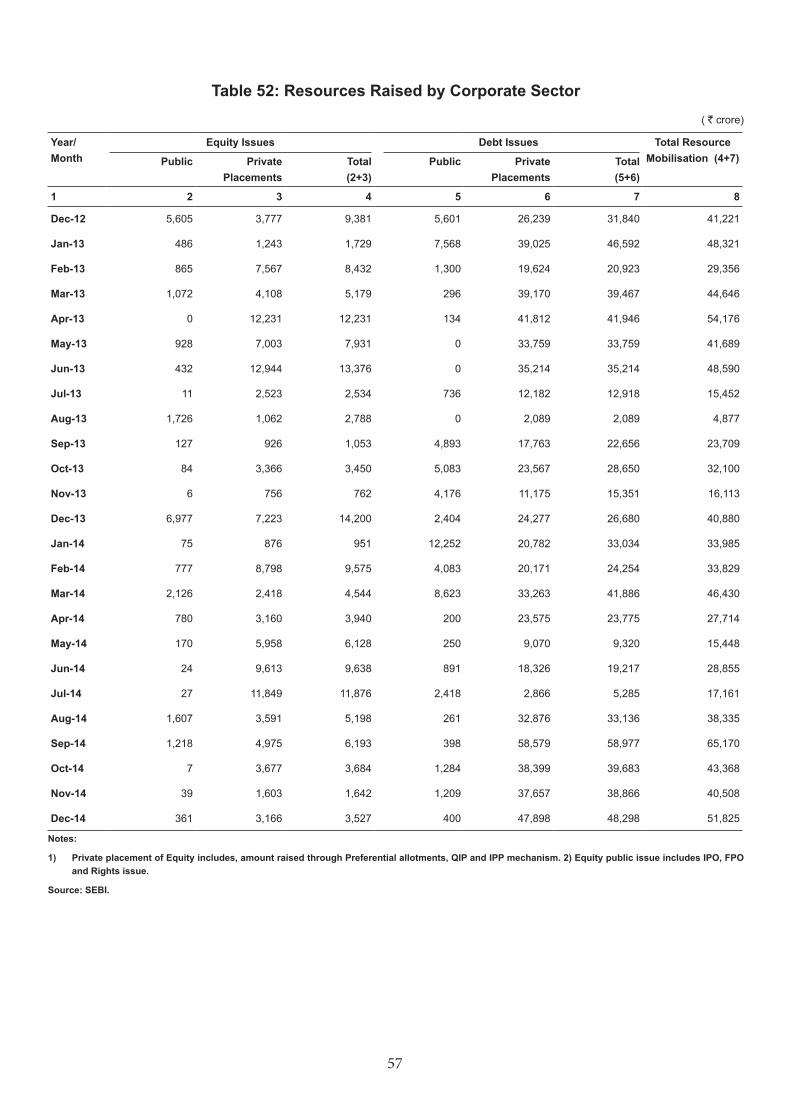
57
Table 52: Resources Raised by Corporate Sector
Year/ Month
Equity Issues Debt Issues Total Resource Mobilisation (4+7)Public Private
PlacementsTotal(2+3)
Public Private Placements
Total(5+6)
1 2 3 4 5 6 7 8
Dec-12 5,605 3,777 9,381 5,601 26,239 31,840 41,221
Jan-13 486 1,243 1,729 7,568 39,025 46,592 48,321
Feb-13 865 7,567 8,432 1,300 19,624 20,923 29,356
Mar-13 1,072 4,108 5,179 296 39,170 39,467 44,646
Apr-13 0 12,231 12,231 134 41,812 41,946 54,176
May-13 928 7,003 7,931 0 33,759 33,759 41,689
Jun-13 432 12,944 13,376 0 35,214 35,214 48,590
Jul-13 11 2,523 2,534 736 12,182 12,918 15,452
Aug-13 1,726 1,062 2,788 0 2,089 2,089 4,877
Sep-13 127 926 1,053 4,893 17,763 22,656 23,709
Oct-13 84 3,366 3,450 5,083 23,567 28,650 32,100
Nov-13 6 756 762 4,176 11,175 15,351 16,113
Dec-13 6,977 7,223 14,200 2,404 24,277 26,680 40,880
Jan-14 75 876 951 12,252 20,782 33,034 33,985
Feb-14 777 8,798 9,575 4,083 20,171 24,254 33,829
Mar-14 2,126 2,418 4,544 8,623 33,263 41,886 46,430
Apr-14 780 3,160 3,940 200 23,575 23,775 27,714
May-14 170 5,958 6,128 250 9,070 9,320 15,448
Jun-14 24 9,613 9,638 891 18,326 19,217 28,855
Jul-14 27 11,849 11,876 2,418 2,866 5,285 17,161
Aug-14 1,607 3,591 5,198 261 32,876 33,136 38,335
Sep-14 1,218 4,975 6,193 398 58,579 58,977 65,170
Oct-14 7 3,677 3,684 1,284 38,399 39,683 43,368
Nov-14 39 1,603 1,642 1,209 37,657 38,866 40,508
Dec-14 361 3,166 3,527 400 47,898 48,298 51,825
Notes:
1) Private placement of Equity includes, amount raised through Preferential allotments, QIP and IPP mechanism. 2) Equity public issue includes IPO, FPO and Rights issue.
Source: SEBI.
( ` crore)
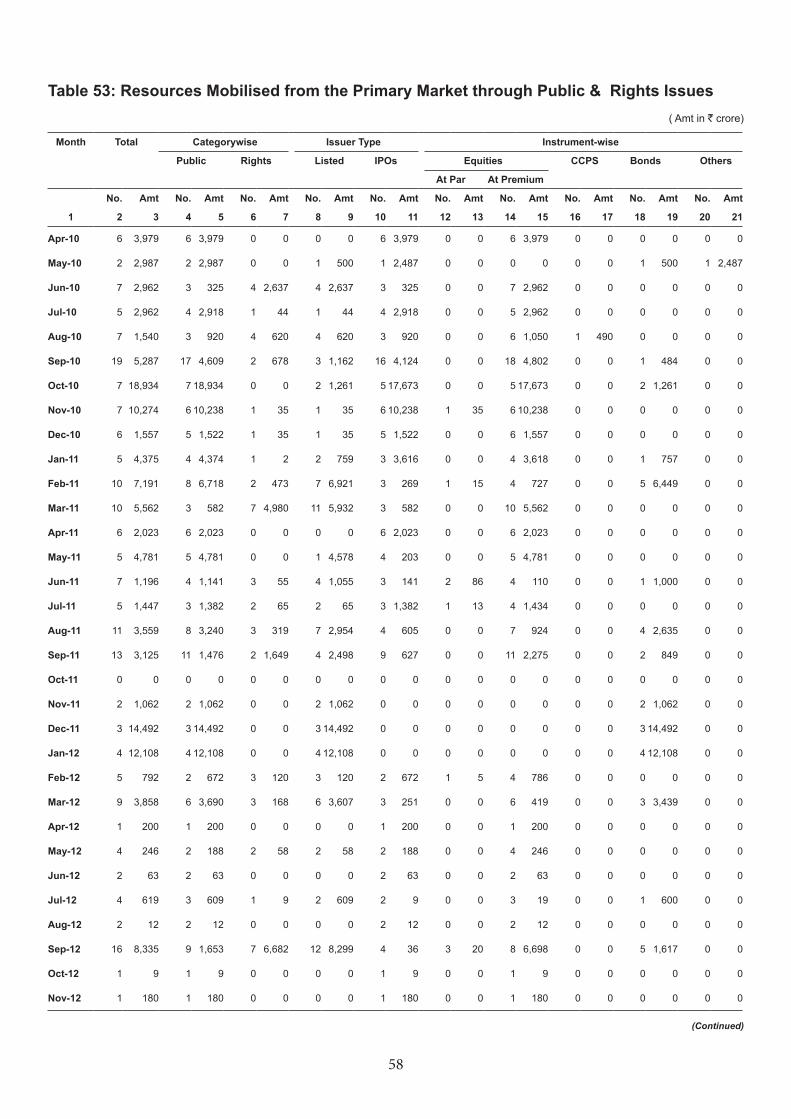
58
Table 53: Resources Mobilised from the Primary Market through Public & Rights Issues ( Amt in ` crore)
Month Total Categorywise Issuer Type Instrument-wise
Public Rights Listed IPOs Equities CCPS Bonds Others
At Par At Premium
No. Amt No. Amt No. Amt No. Amt No. Amt No. Amt No. Amt No. Amt No. Amt No. Amt
1 2 3 4 5 6 7 8 9 10 11 12 13 14 15 16 17 18 19 20 21
Apr-10 6 3,979 6 3,979 0 0 0 0 6 3,979 0 0 6 3,979 0 0 0 0 0 0
May-10 2 2,987 2 2,987 0 0 1 500 1 2,487 0 0 0 0 0 0 1 500 1 2,487
Jun-10 7 2,962 3 325 4 2,637 4 2,637 3 325 0 0 7 2,962 0 0 0 0 0 0
Jul-10 5 2,962 4 2,918 1 44 1 44 4 2,918 0 0 5 2,962 0 0 0 0 0 0
Aug-10 7 1,540 3 920 4 620 4 620 3 920 0 0 6 1,050 1 490 0 0 0 0
Sep-10 19 5,287 17 4,609 2 678 3 1,162 16 4,124 0 0 18 4,802 0 0 1 484 0 0
Oct-10 7 18,934 7 18,934 0 0 2 1,261 5 17,673 0 0 5 17,673 0 0 2 1,261 0 0
Nov-10 7 10,274 6 10,238 1 35 1 35 6 10,238 1 35 6 10,238 0 0 0 0 0 0
Dec-10 6 1,557 5 1,522 1 35 1 35 5 1,522 0 0 6 1,557 0 0 0 0 0 0
Jan-11 5 4,375 4 4,374 1 2 2 759 3 3,616 0 0 4 3,618 0 0 1 757 0 0
Feb-11 10 7,191 8 6,718 2 473 7 6,921 3 269 1 15 4 727 0 0 5 6,449 0 0
Mar-11 10 5,562 3 582 7 4,980 11 5,932 3 582 0 0 10 5,562 0 0 0 0 0 0
Apr-11 6 2,023 6 2,023 0 0 0 0 6 2,023 0 0 6 2,023 0 0 0 0 0 0
May-11 5 4,781 5 4,781 0 0 1 4,578 4 203 0 0 5 4,781 0 0 0 0 0 0
Jun-11 7 1,196 4 1,141 3 55 4 1,055 3 141 2 86 4 110 0 0 1 1,000 0 0
Jul-11 5 1,447 3 1,382 2 65 2 65 3 1,382 1 13 4 1,434 0 0 0 0 0 0
Aug-11 11 3,559 8 3,240 3 319 7 2,954 4 605 0 0 7 924 0 0 4 2,635 0 0
Sep-11 13 3,125 11 1,476 2 1,649 4 2,498 9 627 0 0 11 2,275 0 0 2 849 0 0
Oct-11 0 0 0 0 0 0 0 0 0 0 0 0 0 0 0 0 0 0 0 0
Nov-11 2 1,062 2 1,062 0 0 2 1,062 0 0 0 0 0 0 0 0 2 1,062 0 0
Dec-11 3 14,492 3 14,492 0 0 3 14,492 0 0 0 0 0 0 0 0 3 14,492 0 0
Jan-12 4 12,108 4 12,108 0 0 4 12,108 0 0 0 0 0 0 0 0 4 12,108 0 0
Feb-12 5 792 2 672 3 120 3 120 2 672 1 5 4 786 0 0 0 0 0 0
Mar-12 9 3,858 6 3,690 3 168 6 3,607 3 251 0 0 6 419 0 0 3 3,439 0 0
Apr-12 1 200 1 200 0 0 0 0 1 200 0 0 1 200 0 0 0 0 0 0
May-12 4 246 2 188 2 58 2 58 2 188 0 0 4 246 0 0 0 0 0 0
Jun-12 2 63 2 63 0 0 0 0 2 63 0 0 2 63 0 0 0 0 0 0
Jul-12 4 619 3 609 1 9 2 609 2 9 0 0 3 19 0 0 1 600 0 0
Aug-12 2 12 2 12 0 0 0 0 2 12 0 0 2 12 0 0 0 0 0 0
Sep-12 16 8,335 9 1,653 7 6,682 12 8,299 4 36 3 20 8 6,698 0 0 5 1,617 0 0
Oct-12 1 9 1 9 0 0 0 0 1 9 0 0 1 9 0 0 0 0 0 0
Nov-12 1 180 1 180 0 0 0 0 1 180 0 0 1 180 0 0 0 0 0 0
(Continued)
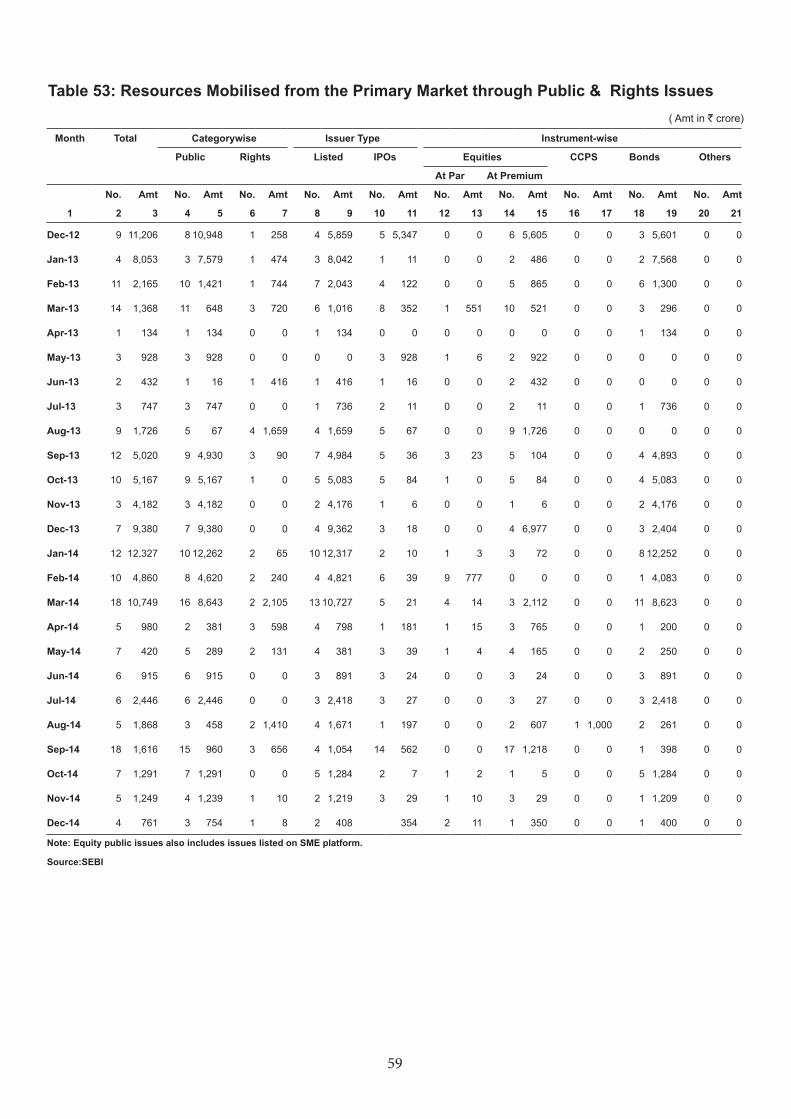
59
Table 53: Resources Mobilised from the Primary Market through Public & Rights Issues ( Amt in ` crore)
Month Total Categorywise Issuer Type Instrument-wise
Public Rights Listed IPOs Equities CCPS Bonds Others
At Par At Premium
No. Amt No. Amt No. Amt No. Amt No. Amt No. Amt No. Amt No. Amt No. Amt No. Amt
1 2 3 4 5 6 7 8 9 10 11 12 13 14 15 16 17 18 19 20 21
Dec-12 9 11,206 8 10,948 1 258 4 5,859 5 5,347 0 0 6 5,605 0 0 3 5,601 0 0
Jan-13 4 8,053 3 7,579 1 474 3 8,042 1 11 0 0 2 486 0 0 2 7,568 0 0
Feb-13 11 2,165 10 1,421 1 744 7 2,043 4 122 0 0 5 865 0 0 6 1,300 0 0
Mar-13 14 1,368 11 648 3 720 6 1,016 8 352 1 551 10 521 0 0 3 296 0 0
Apr-13 1 134 1 134 0 0 1 134 0 0 0 0 0 0 0 0 1 134 0 0
May-13 3 928 3 928 0 0 0 0 3 928 1 6 2 922 0 0 0 0 0 0
Jun-13 2 432 1 16 1 416 1 416 1 16 0 0 2 432 0 0 0 0 0 0
Jul-13 3 747 3 747 0 0 1 736 2 11 0 0 2 11 0 0 1 736 0 0
Aug-13 9 1,726 5 67 4 1,659 4 1,659 5 67 0 0 9 1,726 0 0 0 0 0 0
Sep-13 12 5,020 9 4,930 3 90 7 4,984 5 36 3 23 5 104 0 0 4 4,893 0 0
Oct-13 10 5,167 9 5,167 1 0 5 5,083 5 84 1 0 5 84 0 0 4 5,083 0 0
Nov-13 3 4,182 3 4,182 0 0 2 4,176 1 6 0 0 1 6 0 0 2 4,176 0 0
Dec-13 7 9,380 7 9,380 0 0 4 9,362 3 18 0 0 4 6,977 0 0 3 2,404 0 0
Jan-14 12 12,327 10 12,262 2 65 10 12,317 2 10 1 3 3 72 0 0 8 12,252 0 0
Feb-14 10 4,860 8 4,620 2 240 4 4,821 6 39 9 777 0 0 0 0 1 4,083 0 0
Mar-14 18 10,749 16 8,643 2 2,105 13 10,727 5 21 4 14 3 2,112 0 0 11 8,623 0 0
Apr-14 5 980 2 381 3 598 4 798 1 181 1 15 3 765 0 0 1 200 0 0
May-14 7 420 5 289 2 131 4 381 3 39 1 4 4 165 0 0 2 250 0 0
Jun-14 6 915 6 915 0 0 3 891 3 24 0 0 3 24 0 0 3 891 0 0
Jul-14 6 2,446 6 2,446 0 0 3 2,418 3 27 0 0 3 27 0 0 3 2,418 0 0
Aug-14 5 1,868 3 458 2 1,410 4 1,671 1 197 0 0 2 607 1 1,000 2 261 0 0
Sep-14 18 1,616 15 960 3 656 4 1,054 14 562 0 0 17 1,218 0 0 1 398 0 0
Oct-14 7 1,291 7 1,291 0 0 5 1,284 2 7 1 2 1 5 0 0 5 1,284 0 0
Nov-14 5 1,249 4 1,239 1 10 2 1,219 3 29 1 10 3 29 0 0 1 1,209 0 0
Dec-14 4 761 3 754 1 8 2 408 354 2 11 1 350 0 0 1 400 0 0
Note: Equity public issues also includes issues listed on SME platform.
Source:SEBI
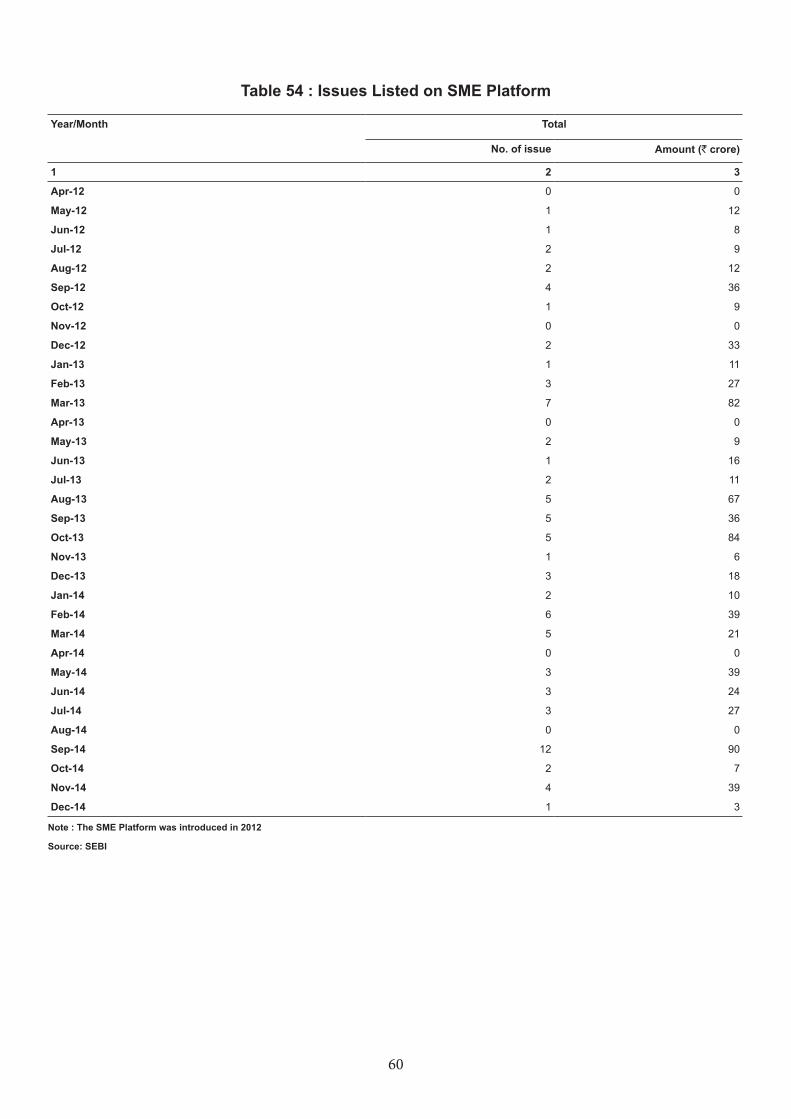
60
Table 54 : Issues Listed on SME Platform
Year/Month Total
No. of issue Amount (` crore)
1 2 3
Apr-12 0 0
May-12 1 12
Jun-12 1 8
Jul-12 2 9
Aug-12 2 12
Sep-12 4 36
Oct-12 1 9
Nov-12 0 0
Dec-12 2 33
Jan-13 1 11
Feb-13 3 27
Mar-13 7 82
Apr-13 0 0
May-13 2 9
Jun-13 1 16
Jul-13 2 11
Aug-13 5 67
Sep-13 5 36
Oct-13 5 84
Nov-13 1 6
Dec-13 3 18
Jan-14 2 10
Feb-14 6 39
Mar-14 5 21
Apr-14 0 0
May-14 3 39
Jun-14 3 24
Jul-14 3 27
Aug-14 0 0
Sep-14 12 90
Oct-14 2 7
Nov-14 4 39
Dec-14 1 3
Note : The SME Platform was introduced in 2012
Source: SEBI
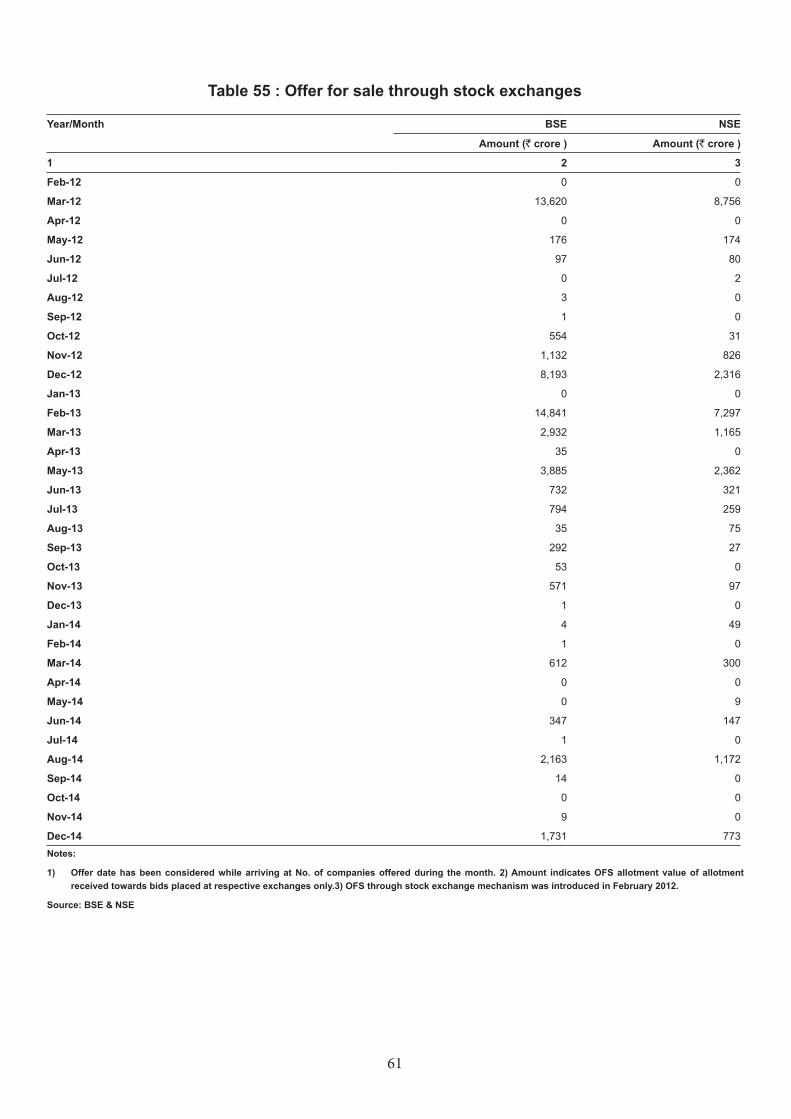
61
Table 55 : Offer for sale through stock exchanges
Year/Month BSE NSE
Amount (` crore ) Amount (` crore )
1 2 3
Feb-12 0 0
Mar-12 13,620 8,756
Apr-12 0 0
May-12 176 174
Jun-12 97 80
Jul-12 0 2
Aug-12 3 0
Sep-12 1 0
Oct-12 554 31
Nov-12 1,132 826
Dec-12 8,193 2,316
Jan-13 0 0
Feb-13 14,841 7,297
Mar-13 2,932 1,165
Apr-13 35 0
May-13 3,885 2,362
Jun-13 732 321
Jul-13 794 259
Aug-13 35 75
Sep-13 292 27
Oct-13 53 0
Nov-13 571 97
Dec-13 1 0
Jan-14 4 49
Feb-14 1 0
Mar-14 612 300
Apr-14 0 0
May-14 0 9
Jun-14 347 147
Jul-14 1 0
Aug-14 2,163 1,172
Sep-14 14 0
Oct-14 0 0
Nov-14 9 0
Dec-14 1,731 773Notes:
1) Offer date has been considered while arriving at No. of companies offered during the month. 2) Amount indicates OFS allotment value of allotment received towards bids placed at respective exchanges only.3) OFS through stock exchange mechanism was introduced in February 2012.
Source: BSE & NSE
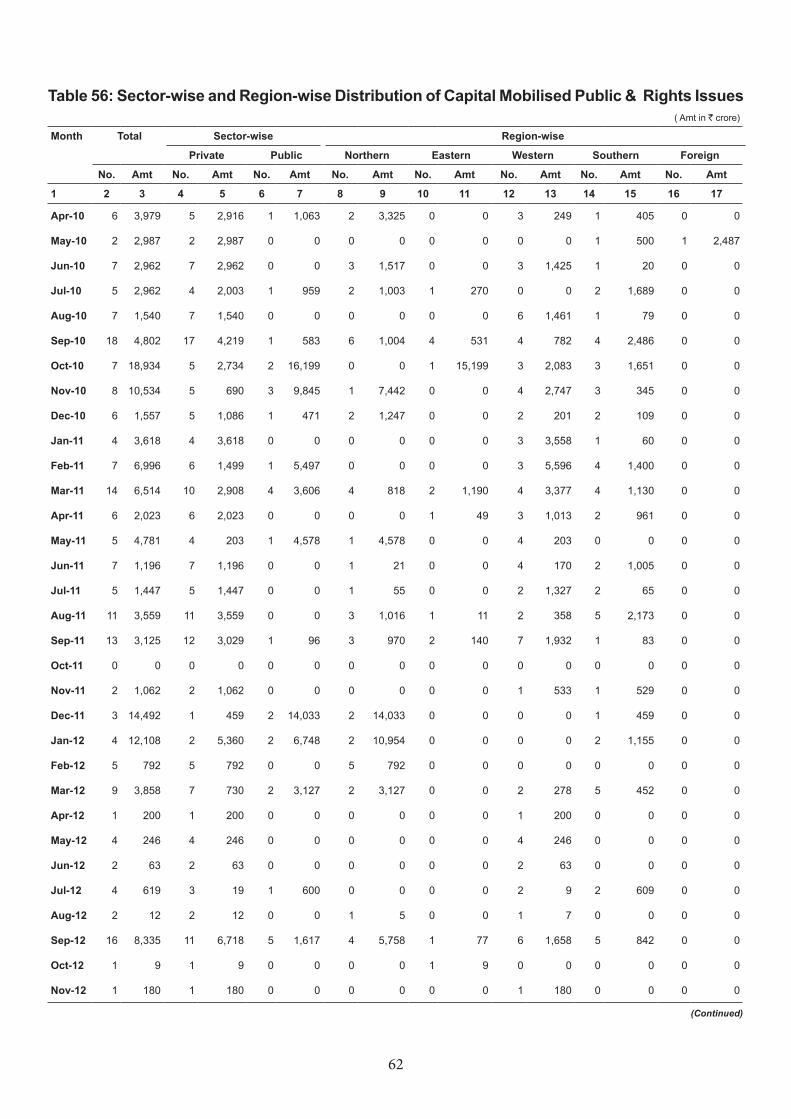
62
Table 56: Sector-wise and Region-wise Distribution of Capital Mobilised Public & Rights Issues ( Amt in ` crore)
Month Total Sector-wise Region-wise
Private Public Northern Eastern Western Southern Foreign
No. Amt No. Amt No. Amt No. Amt No. Amt No. Amt No. Amt No. Amt
1 2 3 4 5 6 7 8 9 10 11 12 13 14 15 16 17
Apr-10 6 3,979 5 2,916 1 1,063 2 3,325 0 0 3 249 1 405 0 0
May-10 2 2,987 2 2,987 0 0 0 0 0 0 0 0 1 500 1 2,487
Jun-10 7 2,962 7 2,962 0 0 3 1,517 0 0 3 1,425 1 20 0 0
Jul-10 5 2,962 4 2,003 1 959 2 1,003 1 270 0 0 2 1,689 0 0
Aug-10 7 1,540 7 1,540 0 0 0 0 0 0 6 1,461 1 79 0 0
Sep-10 18 4,802 17 4,219 1 583 6 1,004 4 531 4 782 4 2,486 0 0
Oct-10 7 18,934 5 2,734 2 16,199 0 0 1 15,199 3 2,083 3 1,651 0 0
Nov-10 8 10,534 5 690 3 9,845 1 7,442 0 0 4 2,747 3 345 0 0
Dec-10 6 1,557 5 1,086 1 471 2 1,247 0 0 2 201 2 109 0 0
Jan-11 4 3,618 4 3,618 0 0 0 0 0 0 3 3,558 1 60 0 0
Feb-11 7 6,996 6 1,499 1 5,497 0 0 0 0 3 5,596 4 1,400 0 0
Mar-11 14 6,514 10 2,908 4 3,606 4 818 2 1,190 4 3,377 4 1,130 0 0
Apr-11 6 2,023 6 2,023 0 0 0 0 1 49 3 1,013 2 961 0 0
May-11 5 4,781 4 203 1 4,578 1 4,578 0 0 4 203 0 0 0 0
Jun-11 7 1,196 7 1,196 0 0 1 21 0 0 4 170 2 1,005 0 0
Jul-11 5 1,447 5 1,447 0 0 1 55 0 0 2 1,327 2 65 0 0
Aug-11 11 3,559 11 3,559 0 0 3 1,016 1 11 2 358 5 2,173 0 0
Sep-11 13 3,125 12 3,029 1 96 3 970 2 140 7 1,932 1 83 0 0
Oct-11 0 0 0 0 0 0 0 0 0 0 0 0 0 0 0 0
Nov-11 2 1,062 2 1,062 0 0 0 0 0 0 1 533 1 529 0 0
Dec-11 3 14,492 1 459 2 14,033 2 14,033 0 0 0 0 1 459 0 0
Jan-12 4 12,108 2 5,360 2 6,748 2 10,954 0 0 0 0 2 1,155 0 0
Feb-12 5 792 5 792 0 0 5 792 0 0 0 0 0 0 0 0
Mar-12 9 3,858 7 730 2 3,127 2 3,127 0 0 2 278 5 452 0 0
Apr-12 1 200 1 200 0 0 0 0 0 0 1 200 0 0 0 0
May-12 4 246 4 246 0 0 0 0 0 0 4 246 0 0 0 0
Jun-12 2 63 2 63 0 0 0 0 0 0 2 63 0 0 0 0
Jul-12 4 619 3 19 1 600 0 0 0 0 2 9 2 609 0 0
Aug-12 2 12 2 12 0 0 1 5 0 0 1 7 0 0 0 0
Sep-12 16 8,335 11 6,718 5 1,617 4 5,758 1 77 6 1,658 5 842 0 0
Oct-12 1 9 1 9 0 0 0 0 1 9 0 0 0 0 0 0
Nov-12 1 180 1 180 0 0 0 0 0 0 1 180 0 0 0 0
(Continued)
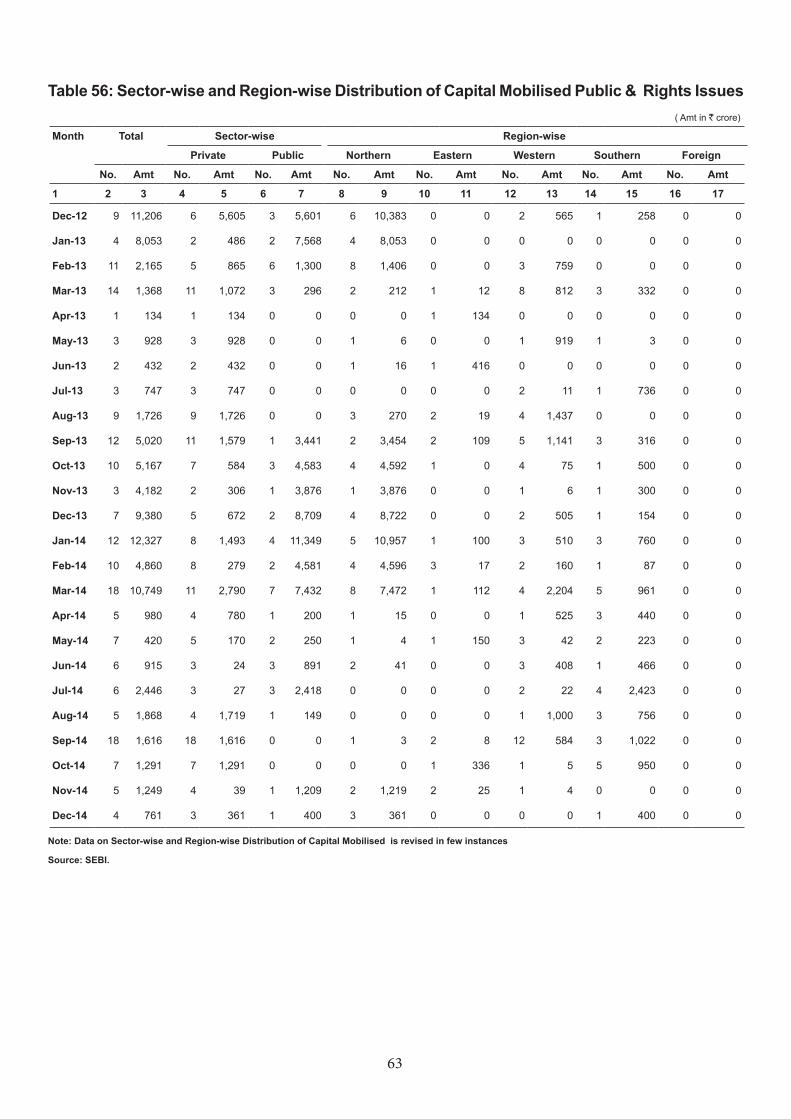
63
Table 56: Sector-wise and Region-wise Distribution of Capital Mobilised Public & Rights Issues ( Amt in ` crore)
Month Total Sector-wise Region-wise
Private Public Northern Eastern Western Southern Foreign
No. Amt No. Amt No. Amt No. Amt No. Amt No. Amt No. Amt No. Amt
1 2 3 4 5 6 7 8 9 10 11 12 13 14 15 16 17
Dec-12 9 11,206 6 5,605 3 5,601 6 10,383 0 0 2 565 1 258 0 0
Jan-13 4 8,053 2 486 2 7,568 4 8,053 0 0 0 0 0 0 0 0
Feb-13 11 2,165 5 865 6 1,300 8 1,406 0 0 3 759 0 0 0 0
Mar-13 14 1,368 11 1,072 3 296 2 212 1 12 8 812 3 332 0 0
Apr-13 1 134 1 134 0 0 0 0 1 134 0 0 0 0 0 0
May-13 3 928 3 928 0 0 1 6 0 0 1 919 1 3 0 0
Jun-13 2 432 2 432 0 0 1 16 1 416 0 0 0 0 0 0
Jul-13 3 747 3 747 0 0 0 0 0 0 2 11 1 736 0 0
Aug-13 9 1,726 9 1,726 0 0 3 270 2 19 4 1,437 0 0 0 0
Sep-13 12 5,020 11 1,579 1 3,441 2 3,454 2 109 5 1,141 3 316 0 0
Oct-13 10 5,167 7 584 3 4,583 4 4,592 1 0 4 75 1 500 0 0
Nov-13 3 4,182 2 306 1 3,876 1 3,876 0 0 1 6 1 300 0 0
Dec-13 7 9,380 5 672 2 8,709 4 8,722 0 0 2 505 1 154 0 0
Jan-14 12 12,327 8 1,493 4 11,349 5 10,957 1 100 3 510 3 760 0 0
Feb-14 10 4,860 8 279 2 4,581 4 4,596 3 17 2 160 1 87 0 0
Mar-14 18 10,749 11 2,790 7 7,432 8 7,472 1 112 4 2,204 5 961 0 0
Apr-14 5 980 4 780 1 200 1 15 0 0 1 525 3 440 0 0
May-14 7 420 5 170 2 250 1 4 1 150 3 42 2 223 0 0
Jun-14 6 915 3 24 3 891 2 41 0 0 3 408 1 466 0 0
Jul-14 6 2,446 3 27 3 2,418 0 0 0 0 2 22 4 2,423 0 0
Aug-14 5 1,868 4 1,719 1 149 0 0 0 0 1 1,000 3 756 0 0
Sep-14 18 1,616 18 1,616 0 0 1 3 2 8 12 584 3 1,022 0 0
Oct-14 7 1,291 7 1,291 0 0 0 0 1 336 1 5 5 950 0 0
Nov-14 5 1,249 4 39 1 1,209 2 1,219 2 25 1 4 0 0 0 0
Dec-14 4 761 3 361 1 400 3 361 0 0 0 0 1 400 0 0
Note: Data on Sector-wise and Region-wise Distribution of Capital Mobilised is revised in few instances
Source: SEBI.
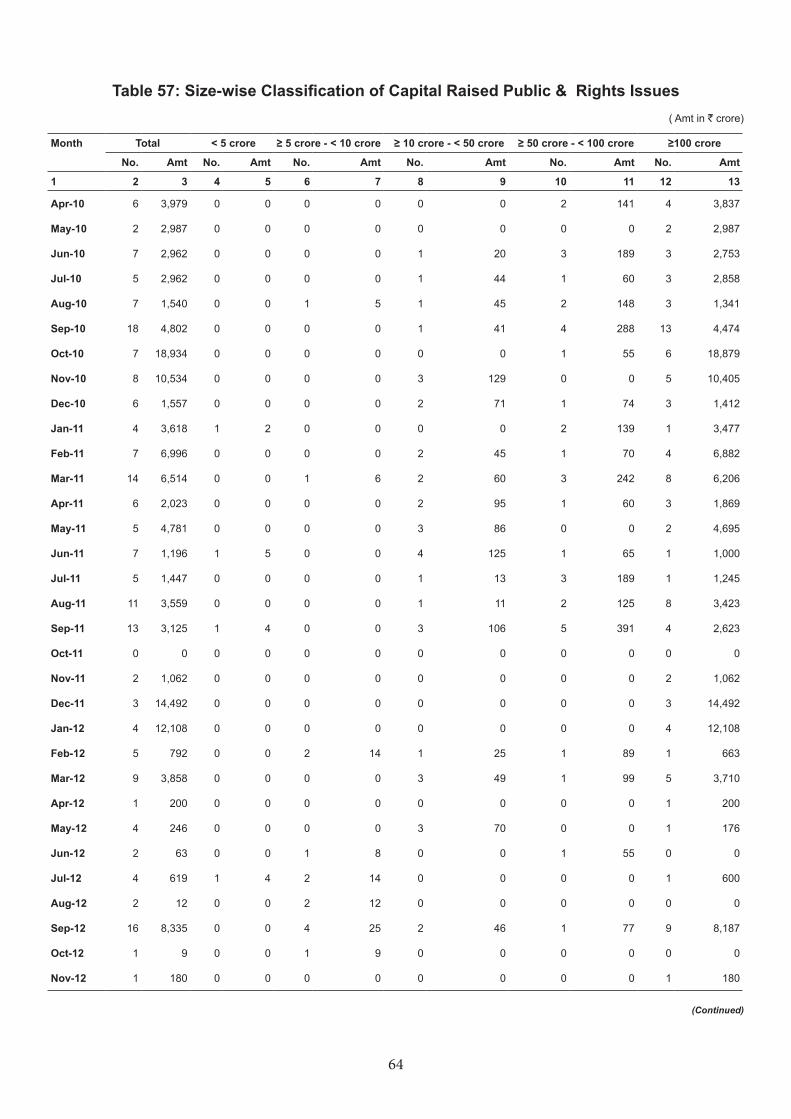
64
Table 57: Size-wise Classification of Capital Raised Public & Rights Issues ( Amt in ` crore)
Month Total < 5 crore ≥ 5 crore - < 10 crore ≥ 10 crore - < 50 crore ≥ 50 crore - < 100 crore ≥100 crore
No. Amt No. Amt No. Amt No. Amt No. Amt No. Amt
1 2 3 4 5 6 7 8 9 10 11 12 13
Apr-10 6 3,979 0 0 0 0 0 0 2 141 4 3,837
May-10 2 2,987 0 0 0 0 0 0 0 0 2 2,987
Jun-10 7 2,962 0 0 0 0 1 20 3 189 3 2,753
Jul-10 5 2,962 0 0 0 0 1 44 1 60 3 2,858
Aug-10 7 1,540 0 0 1 5 1 45 2 148 3 1,341
Sep-10 18 4,802 0 0 0 0 1 41 4 288 13 4,474
Oct-10 7 18,934 0 0 0 0 0 0 1 55 6 18,879
Nov-10 8 10,534 0 0 0 0 3 129 0 0 5 10,405
Dec-10 6 1,557 0 0 0 0 2 71 1 74 3 1,412
Jan-11 4 3,618 1 2 0 0 0 0 2 139 1 3,477
Feb-11 7 6,996 0 0 0 0 2 45 1 70 4 6,882
Mar-11 14 6,514 0 0 1 6 2 60 3 242 8 6,206
Apr-11 6 2,023 0 0 0 0 2 95 1 60 3 1,869
May-11 5 4,781 0 0 0 0 3 86 0 0 2 4,695
Jun-11 7 1,196 1 5 0 0 4 125 1 65 1 1,000
Jul-11 5 1,447 0 0 0 0 1 13 3 189 1 1,245
Aug-11 11 3,559 0 0 0 0 1 11 2 125 8 3,423
Sep-11 13 3,125 1 4 0 0 3 106 5 391 4 2,623
Oct-11 0 0 0 0 0 0 0 0 0 0 0 0
Nov-11 2 1,062 0 0 0 0 0 0 0 0 2 1,062
Dec-11 3 14,492 0 0 0 0 0 0 0 0 3 14,492
Jan-12 4 12,108 0 0 0 0 0 0 0 0 4 12,108
Feb-12 5 792 0 0 2 14 1 25 1 89 1 663
Mar-12 9 3,858 0 0 0 0 3 49 1 99 5 3,710
Apr-12 1 200 0 0 0 0 0 0 0 0 1 200
May-12 4 246 0 0 0 0 3 70 0 0 1 176
Jun-12 2 63 0 0 1 8 0 0 1 55 0 0
Jul-12 4 619 1 4 2 14 0 0 0 0 1 600
Aug-12 2 12 0 0 2 12 0 0 0 0 0 0
Sep-12 16 8,335 0 0 4 25 2 46 1 77 9 8,187
Oct-12 1 9 0 0 1 9 0 0 0 0 0 0
Nov-12 1 180 0 0 0 0 0 0 0 0 1 180
(Continued)
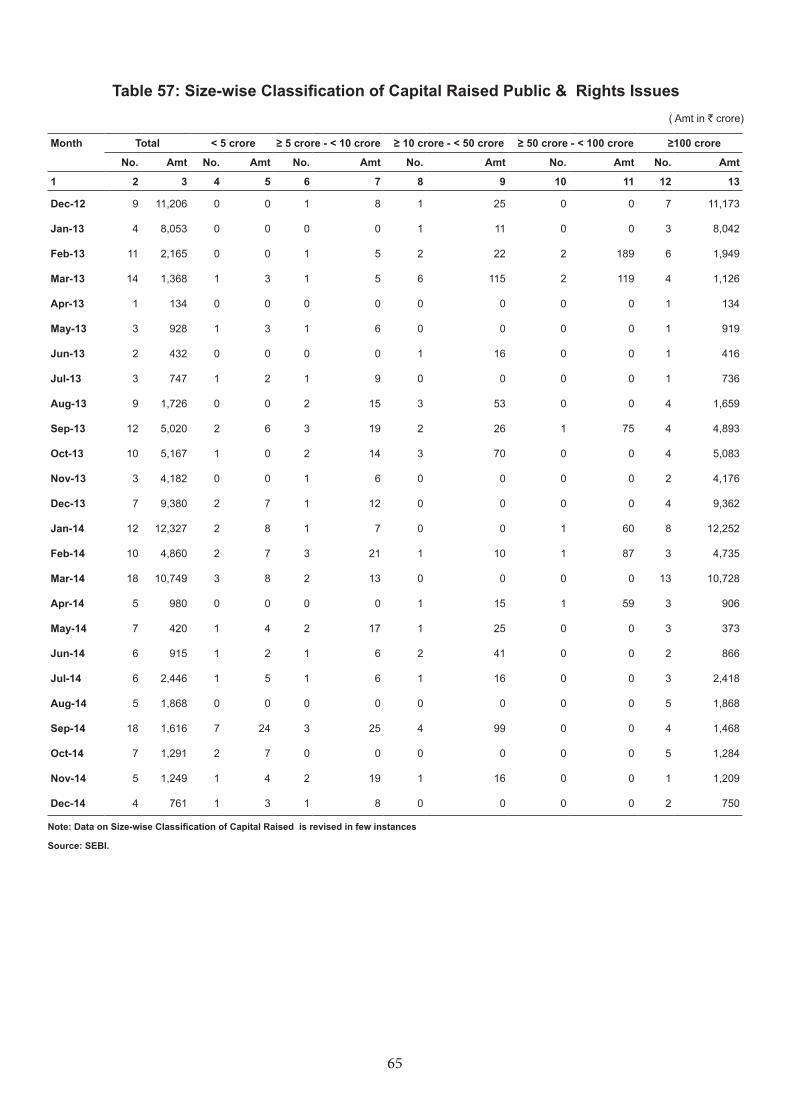
65
Month Total < 5 crore ≥ 5 crore - < 10 crore ≥ 10 crore - < 50 crore ≥ 50 crore - < 100 crore ≥100 crore
No. Amt No. Amt No. Amt No. Amt No. Amt No. Amt
1 2 3 4 5 6 7 8 9 10 11 12 13
Dec-12 9 11,206 0 0 1 8 1 25 0 0 7 11,173
Jan-13 4 8,053 0 0 0 0 1 11 0 0 3 8,042
Feb-13 11 2,165 0 0 1 5 2 22 2 189 6 1,949
Mar-13 14 1,368 1 3 1 5 6 115 2 119 4 1,126
Apr-13 1 134 0 0 0 0 0 0 0 0 1 134
May-13 3 928 1 3 1 6 0 0 0 0 1 919
Jun-13 2 432 0 0 0 0 1 16 0 0 1 416
Jul-13 3 747 1 2 1 9 0 0 0 0 1 736
Aug-13 9 1,726 0 0 2 15 3 53 0 0 4 1,659
Sep-13 12 5,020 2 6 3 19 2 26 1 75 4 4,893
Oct-13 10 5,167 1 0 2 14 3 70 0 0 4 5,083
Nov-13 3 4,182 0 0 1 6 0 0 0 0 2 4,176
Dec-13 7 9,380 2 7 1 12 0 0 0 0 4 9,362
Jan-14 12 12,327 2 8 1 7 0 0 1 60 8 12,252
Feb-14 10 4,860 2 7 3 21 1 10 1 87 3 4,735
Mar-14 18 10,749 3 8 2 13 0 0 0 0 13 10,728
Apr-14 5 980 0 0 0 0 1 15 1 59 3 906
May-14 7 420 1 4 2 17 1 25 0 0 3 373
Jun-14 6 915 1 2 1 6 2 41 0 0 2 866
Jul-14 6 2,446 1 5 1 6 1 16 0 0 3 2,418
Aug-14 5 1,868 0 0 0 0 0 0 0 0 5 1,868
Sep-14 18 1,616 7 24 3 25 4 99 0 0 4 1,468
Oct-14 7 1,291 2 7 0 0 0 0 0 0 5 1,284
Nov-14 5 1,249 1 4 2 19 1 16 0 0 1 1,209
Dec-14 4 761 1 3 1 8 0 0 0 0 2 750
Note: Data on Size-wise Classification of Capital Raised is revised in few instances
Source: SEBI.
Table 57: Size-wise Classification of Capital Raised Public & Rights Issues ( Amt in ` crore)
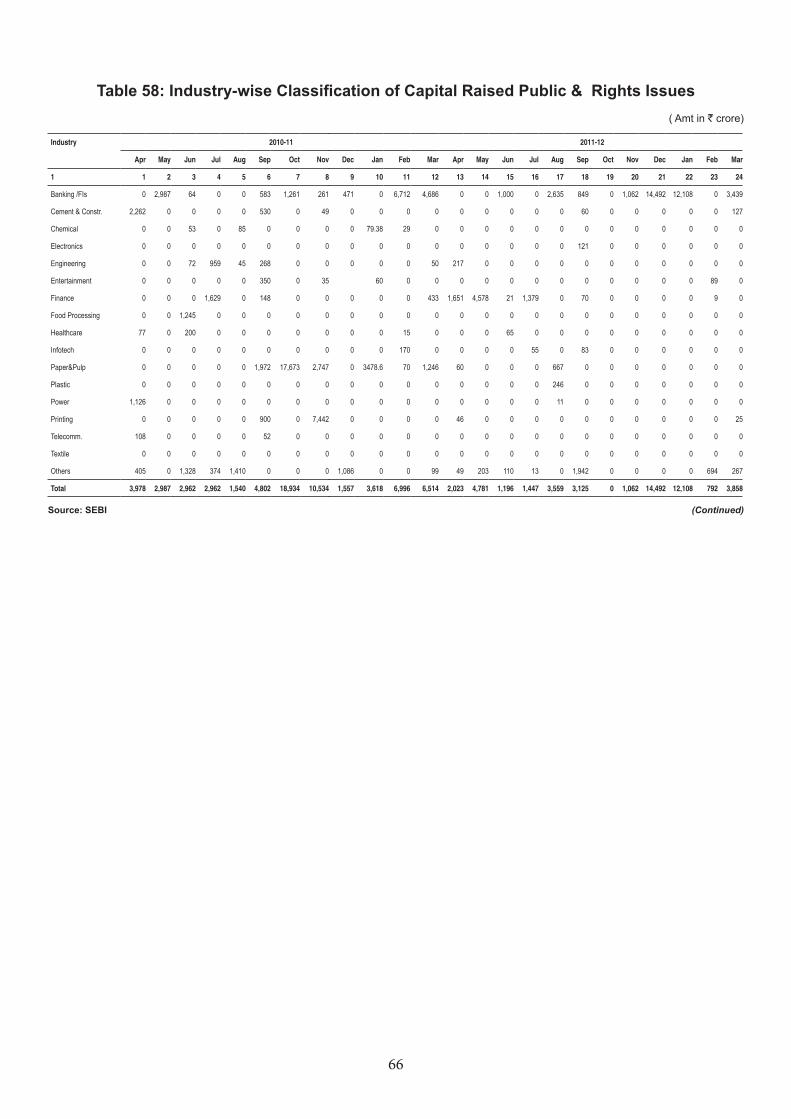
66
Industry 2010-11 2011-12
Apr May Jun Jul Aug Sep Oct Nov Dec Jan Feb Mar Apr May Jun Jul Aug Sep Oct Nov Dec Jan Feb Mar
1 1 2 3 4 5 6 7 8 9 10 11 12 13 14 15 16 17 18 19 20 21 22 23 24
Banking /FIs 0 2,987 64 0 0 583 1,261 261 471 0 6,712 4,686 0 0 1,000 0 2,635 849 0 1,062 14,492 12,108 0 3,439
Cement & Constr. 2,262 0 0 0 0 530 0 49 0 0 0 0 0 0 0 0 0 60 0 0 0 0 0 127
Chemical 0 0 53 0 85 0 0 0 0 79.38 29 0 0 0 0 0 0 0 0 0 0 0 0 0
Electronics 0 0 0 0 0 0 0 0 0 0 0 0 0 0 0 0 0 121 0 0 0 0 0 0
Engineering 0 0 72 959 45 268 0 0 0 0 0 50 217 0 0 0 0 0 0 0 0 0 0 0
Entertainment 0 0 0 0 0 350 0 35 60 0 0 0 0 0 0 0 0 0 0 0 0 89 0
Finance 0 0 0 1,629 0 148 0 0 0 0 0 433 1,651 4,578 21 1,379 0 70 0 0 0 0 9 0
Food Processing 0 0 1,245 0 0 0 0 0 0 0 0 0 0 0 0 0 0 0 0 0 0 0 0 0
Healthcare 77 0 200 0 0 0 0 0 0 0 15 0 0 0 65 0 0 0 0 0 0 0 0 0
Infotech 0 0 0 0 0 0 0 0 0 0 170 0 0 0 0 55 0 83 0 0 0 0 0 0
Paper&Pulp 0 0 0 0 0 1,972 17,673 2,747 0 3478.6 70 1,246 60 0 0 0 667 0 0 0 0 0 0 0
Plastic 0 0 0 0 0 0 0 0 0 0 0 0 0 0 0 0 246 0 0 0 0 0 0 0
Power 1,126 0 0 0 0 0 0 0 0 0 0 0 0 0 0 0 11 0 0 0 0 0 0 0
Printing 0 0 0 0 0 900 0 7,442 0 0 0 0 46 0 0 0 0 0 0 0 0 0 0 25
Telecomm. 108 0 0 0 0 52 0 0 0 0 0 0 0 0 0 0 0 0 0 0 0 0 0 0
Textile 0 0 0 0 0 0 0 0 0 0 0 0 0 0 0 0 0 0 0 0 0 0 0 0
Others 405 0 1,328 374 1,410 0 0 0 1,086 0 0 99 49 203 110 13 0 1,942 0 0 0 0 694 267
Total 3,978 2,987 2,962 2,962 1,540 4,802 18,934 10,534 1,557 3,618 6,996 6,514 2,023 4,781 1,196 1,447 3,559 3,125 0 1,062 14,492 12,108 792 3,858
Table 58: Industry-wise Classification of Capital Raised Public & Rights Issues ( Amt in ` crore)
(Continued)Source: SEBI
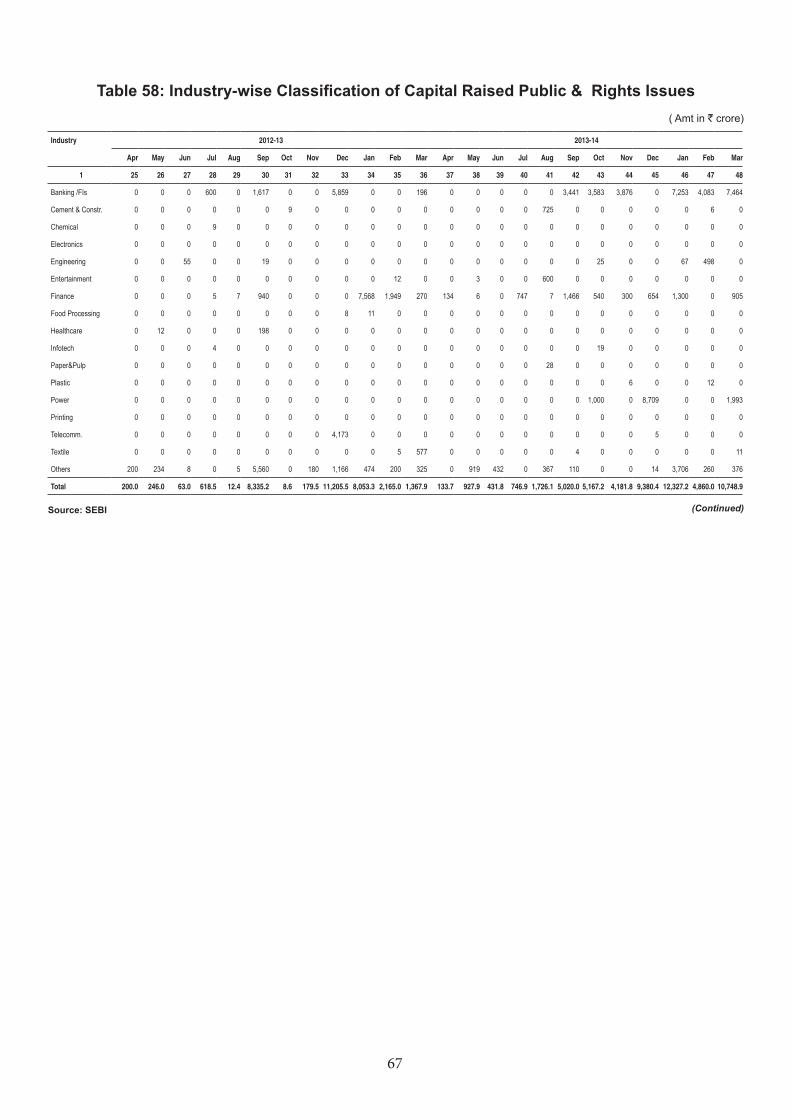
67
Industry 2012-13 2013-14
Apr May Jun Jul Aug Sep Oct Nov Dec Jan Feb Mar Apr May Jun Jul Aug Sep Oct Nov Dec Jan Feb Mar
1 25 26 27 28 29 30 31 32 33 34 35 36 37 38 39 40 41 42 43 44 45 46 47 48
Banking /FIs 0 0 0 600 0 1,617 0 0 5,859 0 0 196 0 0 0 0 0 3,441 3,583 3,876 0 7,253 4,083 7,464
Cement & Constr. 0 0 0 0 0 0 9 0 0 0 0 0 0 0 0 0 725 0 0 0 0 0 6 0
Chemical 0 0 0 9 0 0 0 0 0 0 0 0 0 0 0 0 0 0 0 0 0 0 0 0
Electronics 0 0 0 0 0 0 0 0 0 0 0 0 0 0 0 0 0 0 0 0 0 0 0 0
Engineering 0 0 55 0 0 19 0 0 0 0 0 0 0 0 0 0 0 0 25 0 0 67 498 0
Entertainment 0 0 0 0 0 0 0 0 0 0 12 0 0 3 0 0 600 0 0 0 0 0 0 0
Finance 0 0 0 5 7 940 0 0 0 7,568 1,949 270 134 6 0 747 7 1,466 540 300 654 1,300 0 905
Food Processing 0 0 0 0 0 0 0 0 8 11 0 0 0 0 0 0 0 0 0 0 0 0 0 0
Healthcare 0 12 0 0 0 198 0 0 0 0 0 0 0 0 0 0 0 0 0 0 0 0 0 0
Infotech 0 0 0 4 0 0 0 0 0 0 0 0 0 0 0 0 0 0 19 0 0 0 0 0
Paper&Pulp 0 0 0 0 0 0 0 0 0 0 0 0 0 0 0 0 28 0 0 0 0 0 0 0
Plastic 0 0 0 0 0 0 0 0 0 0 0 0 0 0 0 0 0 0 0 6 0 0 12 0
Power 0 0 0 0 0 0 0 0 0 0 0 0 0 0 0 0 0 0 1,000 0 8,709 0 0 1,993
Printing 0 0 0 0 0 0 0 0 0 0 0 0 0 0 0 0 0 0 0 0 0 0 0 0
Telecomm. 0 0 0 0 0 0 0 0 4,173 0 0 0 0 0 0 0 0 0 0 0 5 0 0 0
Textile 0 0 0 0 0 0 0 0 0 0 5 577 0 0 0 0 0 4 0 0 0 0 0 11
Others 200 234 8 0 5 5,560 0 180 1,166 474 200 325 0 919 432 0 367 110 0 0 14 3,706 260 376
Total 200.0 246.0 63.0 618.5 12.4 8,335.2 8.6 179.5 11,205.5 8,053.3 2,165.0 1,367.9 133.7 927.9 431.8 746.9 1,726.1 5,020.0 5,167.2 4,181.8 9,380.4 12,327.2 4,860.0 10,748.9
Table 58: Industry-wise Classification of Capital Raised Public & Rights Issues ( Amt in ` crore)
(Continued)Source: SEBI
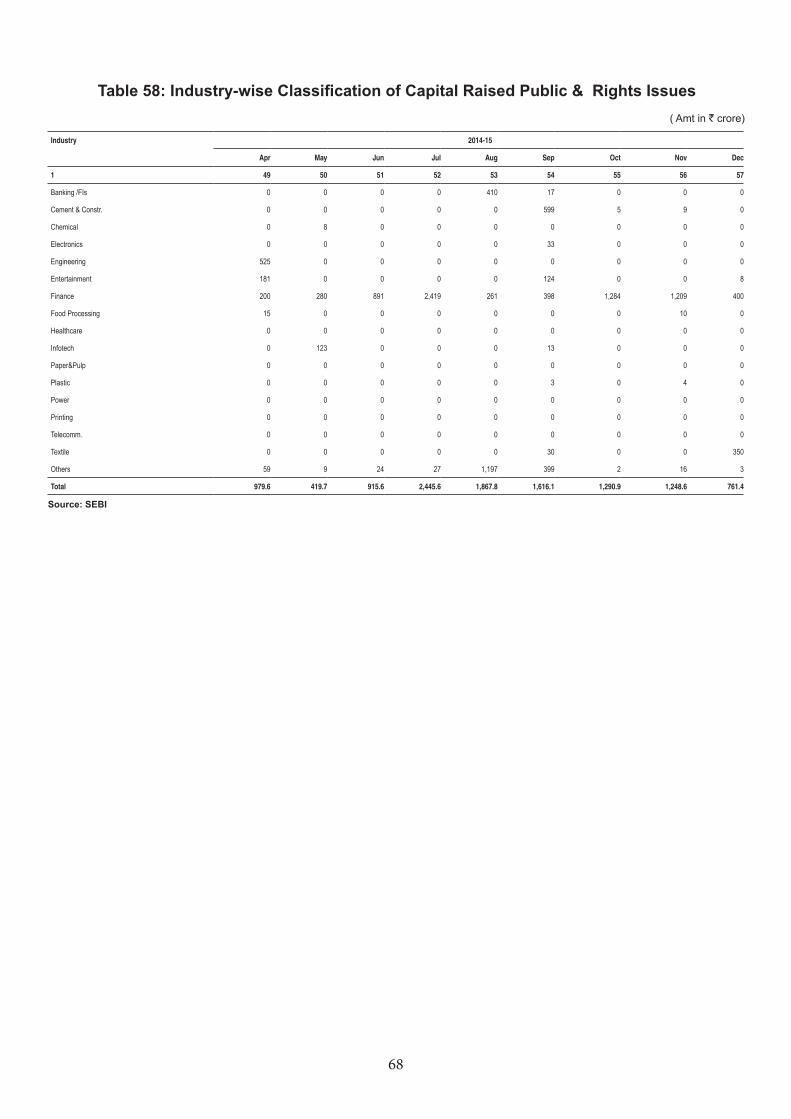
68
Table 58: Industry-wise Classification of Capital Raised Public & Rights Issues ( Amt in ` crore)
Industry 2014-15
Apr May Jun Jul Aug Sep Oct Nov Dec
1 49 50 51 52 53 54 55 56 57
Banking /FIs 0 0 0 0 410 17 0 0 0
Cement & Constr. 0 0 0 0 0 599 5 9 0
Chemical 0 8 0 0 0 0 0 0 0
Electronics 0 0 0 0 0 33 0 0 0
Engineering 525 0 0 0 0 0 0 0 0
Entertainment 181 0 0 0 0 124 0 0 8
Finance 200 280 891 2,419 261 398 1,284 1,209 400
Food Processing 15 0 0 0 0 0 0 10 0
Healthcare 0 0 0 0 0 0 0 0 0
Infotech 0 123 0 0 0 13 0 0 0
Paper&Pulp 0 0 0 0 0 0 0 0 0
Plastic 0 0 0 0 0 3 0 4 0
Power 0 0 0 0 0 0 0 0 0
Printing 0 0 0 0 0 0 0 0 0
Telecomm. 0 0 0 0 0 0 0 0 0
Textile 0 0 0 0 0 30 0 0 350
Others 59 9 24 27 1,197 399 2 16 3
Total 979.6 419.7 915.6 2,445.6 1,867.8 1,616.1 1,290.9 1,248.6 761.4
Source: SEBI
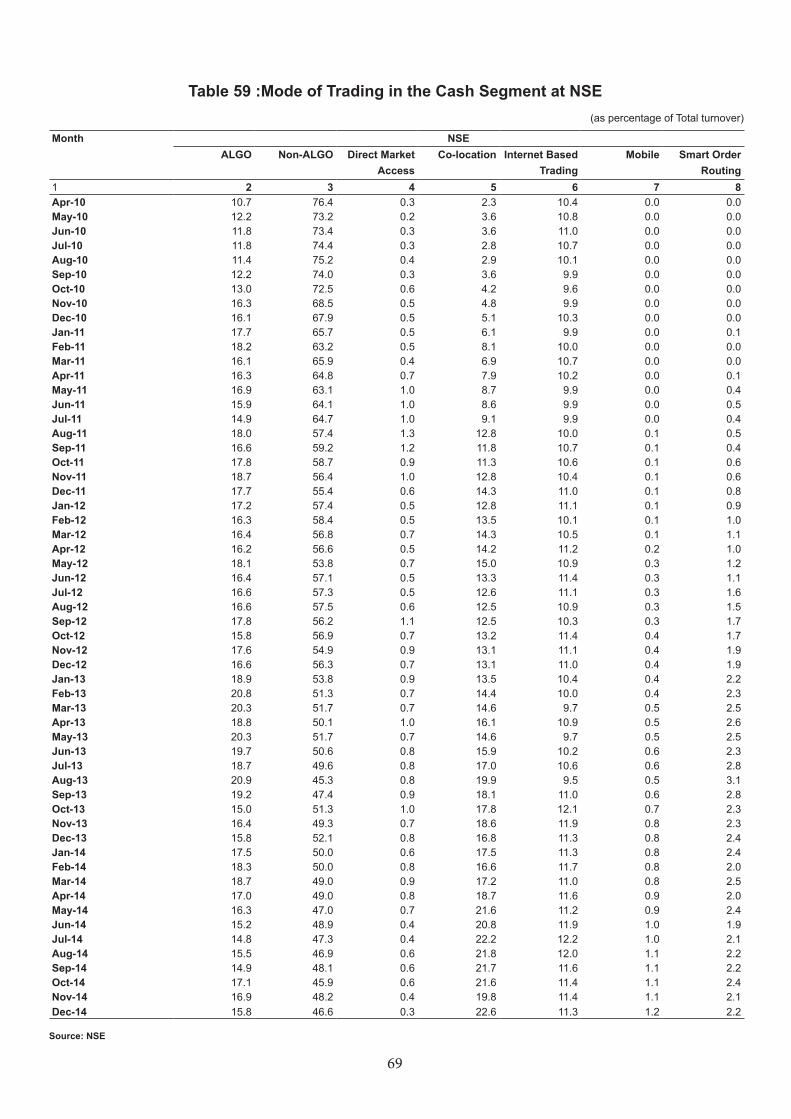
69
Table 59 :Mode of Trading in the Cash Segment at NSE
Month NSEALGO Non-ALGO Direct Market
Access Co-location Internet Based
TradingMobile Smart Order
Routing1 2 3 4 5 6 7 8Apr-10 10.7 76.4 0.3 2.3 10.4 0.0 0.0May-10 12.2 73.2 0.2 3.6 10.8 0.0 0.0Jun-10 11.8 73.4 0.3 3.6 11.0 0.0 0.0Jul-10 11.8 74.4 0.3 2.8 10.7 0.0 0.0Aug-10 11.4 75.2 0.4 2.9 10.1 0.0 0.0Sep-10 12.2 74.0 0.3 3.6 9.9 0.0 0.0Oct-10 13.0 72.5 0.6 4.2 9.6 0.0 0.0Nov-10 16.3 68.5 0.5 4.8 9.9 0.0 0.0Dec-10 16.1 67.9 0.5 5.1 10.3 0.0 0.0Jan-11 17.7 65.7 0.5 6.1 9.9 0.0 0.1Feb-11 18.2 63.2 0.5 8.1 10.0 0.0 0.0Mar-11 16.1 65.9 0.4 6.9 10.7 0.0 0.0Apr-11 16.3 64.8 0.7 7.9 10.2 0.0 0.1May-11 16.9 63.1 1.0 8.7 9.9 0.0 0.4Jun-11 15.9 64.1 1.0 8.6 9.9 0.0 0.5Jul-11 14.9 64.7 1.0 9.1 9.9 0.0 0.4Aug-11 18.0 57.4 1.3 12.8 10.0 0.1 0.5Sep-11 16.6 59.2 1.2 11.8 10.7 0.1 0.4Oct-11 17.8 58.7 0.9 11.3 10.6 0.1 0.6Nov-11 18.7 56.4 1.0 12.8 10.4 0.1 0.6Dec-11 17.7 55.4 0.6 14.3 11.0 0.1 0.8Jan-12 17.2 57.4 0.5 12.8 11.1 0.1 0.9Feb-12 16.3 58.4 0.5 13.5 10.1 0.1 1.0Mar-12 16.4 56.8 0.7 14.3 10.5 0.1 1.1Apr-12 16.2 56.6 0.5 14.2 11.2 0.2 1.0May-12 18.1 53.8 0.7 15.0 10.9 0.3 1.2Jun-12 16.4 57.1 0.5 13.3 11.4 0.3 1.1Jul-12 16.6 57.3 0.5 12.6 11.1 0.3 1.6Aug-12 16.6 57.5 0.6 12.5 10.9 0.3 1.5Sep-12 17.8 56.2 1.1 12.5 10.3 0.3 1.7Oct-12 15.8 56.9 0.7 13.2 11.4 0.4 1.7Nov-12 17.6 54.9 0.9 13.1 11.1 0.4 1.9Dec-12 16.6 56.3 0.7 13.1 11.0 0.4 1.9Jan-13 18.9 53.8 0.9 13.5 10.4 0.4 2.2Feb-13 20.8 51.3 0.7 14.4 10.0 0.4 2.3Mar-13 20.3 51.7 0.7 14.6 9.7 0.5 2.5Apr-13 18.8 50.1 1.0 16.1 10.9 0.5 2.6May-13 20.3 51.7 0.7 14.6 9.7 0.5 2.5Jun-13 19.7 50.6 0.8 15.9 10.2 0.6 2.3Jul-13 18.7 49.6 0.8 17.0 10.6 0.6 2.8Aug-13 20.9 45.3 0.8 19.9 9.5 0.5 3.1Sep-13 19.2 47.4 0.9 18.1 11.0 0.6 2.8Oct-13 15.0 51.3 1.0 17.8 12.1 0.7 2.3Nov-13 16.4 49.3 0.7 18.6 11.9 0.8 2.3Dec-13 15.8 52.1 0.8 16.8 11.3 0.8 2.4Jan-14 17.5 50.0 0.6 17.5 11.3 0.8 2.4Feb-14 18.3 50.0 0.8 16.6 11.7 0.8 2.0Mar-14 18.7 49.0 0.9 17.2 11.0 0.8 2.5Apr-14 17.0 49.0 0.8 18.7 11.6 0.9 2.0May-14 16.3 47.0 0.7 21.6 11.2 0.9 2.4Jun-14 15.2 48.9 0.4 20.8 11.9 1.0 1.9Jul-14 14.8 47.3 0.4 22.2 12.2 1.0 2.1Aug-14 15.5 46.9 0.6 21.8 12.0 1.1 2.2Sep-14 14.9 48.1 0.6 21.7 11.6 1.1 2.2Oct-14 17.1 45.9 0.6 21.6 11.4 1.1 2.4Nov-14 16.9 48.2 0.4 19.8 11.4 1.1 2.1Dec-14 15.8 46.6 0.3 22.6 11.3 1.2 2.2
Source: NSE
(as percentage of Total turnover)
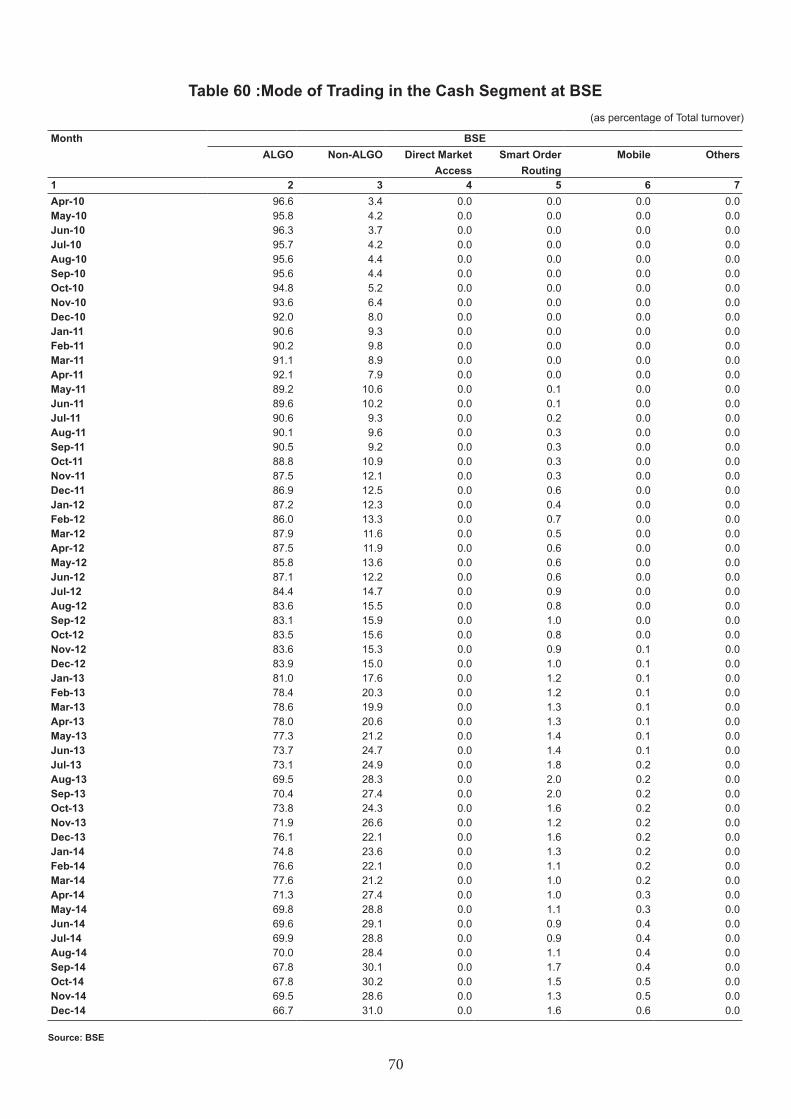
70
Table 60 :Mode of Trading in the Cash Segment at BSE(as percentage of Total turnover)
Month BSEALGO Non-ALGO Direct Market
Access Smart Order
RoutingMobile Others
1 2 3 4 5 6 7Apr-10 96.6 3.4 0.0 0.0 0.0 0.0May-10 95.8 4.2 0.0 0.0 0.0 0.0Jun-10 96.3 3.7 0.0 0.0 0.0 0.0Jul-10 95.7 4.2 0.0 0.0 0.0 0.0Aug-10 95.6 4.4 0.0 0.0 0.0 0.0Sep-10 95.6 4.4 0.0 0.0 0.0 0.0Oct-10 94.8 5.2 0.0 0.0 0.0 0.0Nov-10 93.6 6.4 0.0 0.0 0.0 0.0Dec-10 92.0 8.0 0.0 0.0 0.0 0.0Jan-11 90.6 9.3 0.0 0.0 0.0 0.0Feb-11 90.2 9.8 0.0 0.0 0.0 0.0Mar-11 91.1 8.9 0.0 0.0 0.0 0.0Apr-11 92.1 7.9 0.0 0.0 0.0 0.0May-11 89.2 10.6 0.0 0.1 0.0 0.0Jun-11 89.6 10.2 0.0 0.1 0.0 0.0Jul-11 90.6 9.3 0.0 0.2 0.0 0.0Aug-11 90.1 9.6 0.0 0.3 0.0 0.0Sep-11 90.5 9.2 0.0 0.3 0.0 0.0Oct-11 88.8 10.9 0.0 0.3 0.0 0.0Nov-11 87.5 12.1 0.0 0.3 0.0 0.0Dec-11 86.9 12.5 0.0 0.6 0.0 0.0Jan-12 87.2 12.3 0.0 0.4 0.0 0.0Feb-12 86.0 13.3 0.0 0.7 0.0 0.0Mar-12 87.9 11.6 0.0 0.5 0.0 0.0Apr-12 87.5 11.9 0.0 0.6 0.0 0.0May-12 85.8 13.6 0.0 0.6 0.0 0.0Jun-12 87.1 12.2 0.0 0.6 0.0 0.0Jul-12 84.4 14.7 0.0 0.9 0.0 0.0Aug-12 83.6 15.5 0.0 0.8 0.0 0.0Sep-12 83.1 15.9 0.0 1.0 0.0 0.0Oct-12 83.5 15.6 0.0 0.8 0.0 0.0Nov-12 83.6 15.3 0.0 0.9 0.1 0.0Dec-12 83.9 15.0 0.0 1.0 0.1 0.0Jan-13 81.0 17.6 0.0 1.2 0.1 0.0Feb-13 78.4 20.3 0.0 1.2 0.1 0.0Mar-13 78.6 19.9 0.0 1.3 0.1 0.0Apr-13 78.0 20.6 0.0 1.3 0.1 0.0May-13 77.3 21.2 0.0 1.4 0.1 0.0Jun-13 73.7 24.7 0.0 1.4 0.1 0.0Jul-13 73.1 24.9 0.0 1.8 0.2 0.0Aug-13 69.5 28.3 0.0 2.0 0.2 0.0Sep-13 70.4 27.4 0.0 2.0 0.2 0.0Oct-13 73.8 24.3 0.0 1.6 0.2 0.0Nov-13 71.9 26.6 0.0 1.2 0.2 0.0Dec-13 76.1 22.1 0.0 1.6 0.2 0.0Jan-14 74.8 23.6 0.0 1.3 0.2 0.0Feb-14 76.6 22.1 0.0 1.1 0.2 0.0Mar-14 77.6 21.2 0.0 1.0 0.2 0.0Apr-14 71.3 27.4 0.0 1.0 0.3 0.0May-14 69.8 28.8 0.0 1.1 0.3 0.0Jun-14 69.6 29.1 0.0 0.9 0.4 0.0Jul-14 69.9 28.8 0.0 0.9 0.4 0.0Aug-14 70.0 28.4 0.0 1.1 0.4 0.0Sep-14 67.8 30.1 0.0 1.7 0.4 0.0Oct-14 67.8 30.2 0.0 1.5 0.5 0.0Nov-14 69.5 28.6 0.0 1.3 0.5 0.0Dec-14 66.7 31.0 0.0 1.6 0.6 0.0
Source: BSE
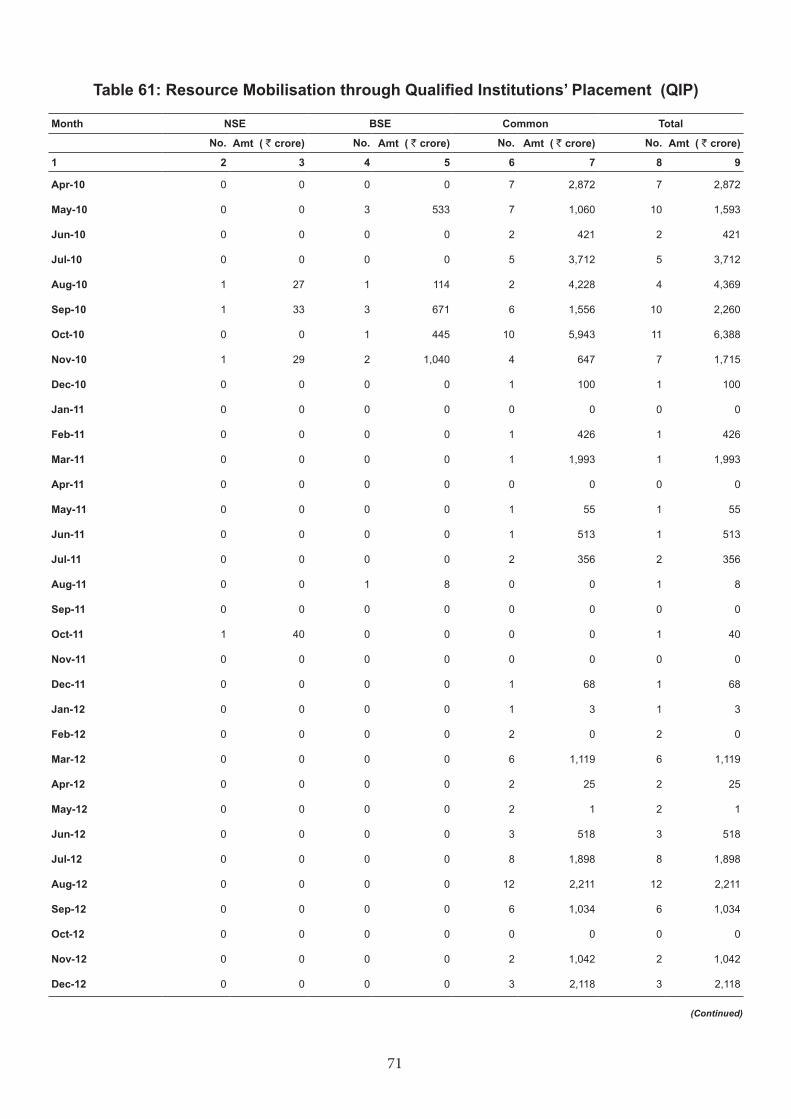
71
Table 61: Resource Mobilisation through Qualified Institutions’ Placement (QIP)
Month NSE BSE Common Total
No. Amt ( ` crore) No. Amt ( ` crore) No. Amt ( ` crore) No. Amt ( ` crore)
1 2 3 4 5 6 7 8 9
Apr-10 0 0 0 0 7 2,872 7 2,872
May-10 0 0 3 533 7 1,060 10 1,593
Jun-10 0 0 0 0 2 421 2 421
Jul-10 0 0 0 0 5 3,712 5 3,712
Aug-10 1 27 1 114 2 4,228 4 4,369
Sep-10 1 33 3 671 6 1,556 10 2,260
Oct-10 0 0 1 445 10 5,943 11 6,388
Nov-10 1 29 2 1,040 4 647 7 1,715
Dec-10 0 0 0 0 1 100 1 100
Jan-11 0 0 0 0 0 0 0 0
Feb-11 0 0 0 0 1 426 1 426
Mar-11 0 0 0 0 1 1,993 1 1,993
Apr-11 0 0 0 0 0 0 0 0
May-11 0 0 0 0 1 55 1 55
Jun-11 0 0 0 0 1 513 1 513
Jul-11 0 0 0 0 2 356 2 356
Aug-11 0 0 1 8 0 0 1 8
Sep-11 0 0 0 0 0 0 0 0
Oct-11 1 40 0 0 0 0 1 40
Nov-11 0 0 0 0 0 0 0 0
Dec-11 0 0 0 0 1 68 1 68
Jan-12 0 0 0 0 1 3 1 3
Feb-12 0 0 0 0 2 0 2 0
Mar-12 0 0 0 0 6 1,119 6 1,119
Apr-12 0 0 0 0 2 25 2 25
May-12 0 0 0 0 2 1 2 1
Jun-12 0 0 0 0 3 518 3 518
Jul-12 0 0 0 0 8 1,898 8 1,898
Aug-12 0 0 0 0 12 2,211 12 2,211
Sep-12 0 0 0 0 6 1,034 6 1,034
Oct-12 0 0 0 0 0 0 0 0
Nov-12 0 0 0 0 2 1,042 2 1,042
Dec-12 0 0 0 0 3 2,118 3 2,118
(Continued)
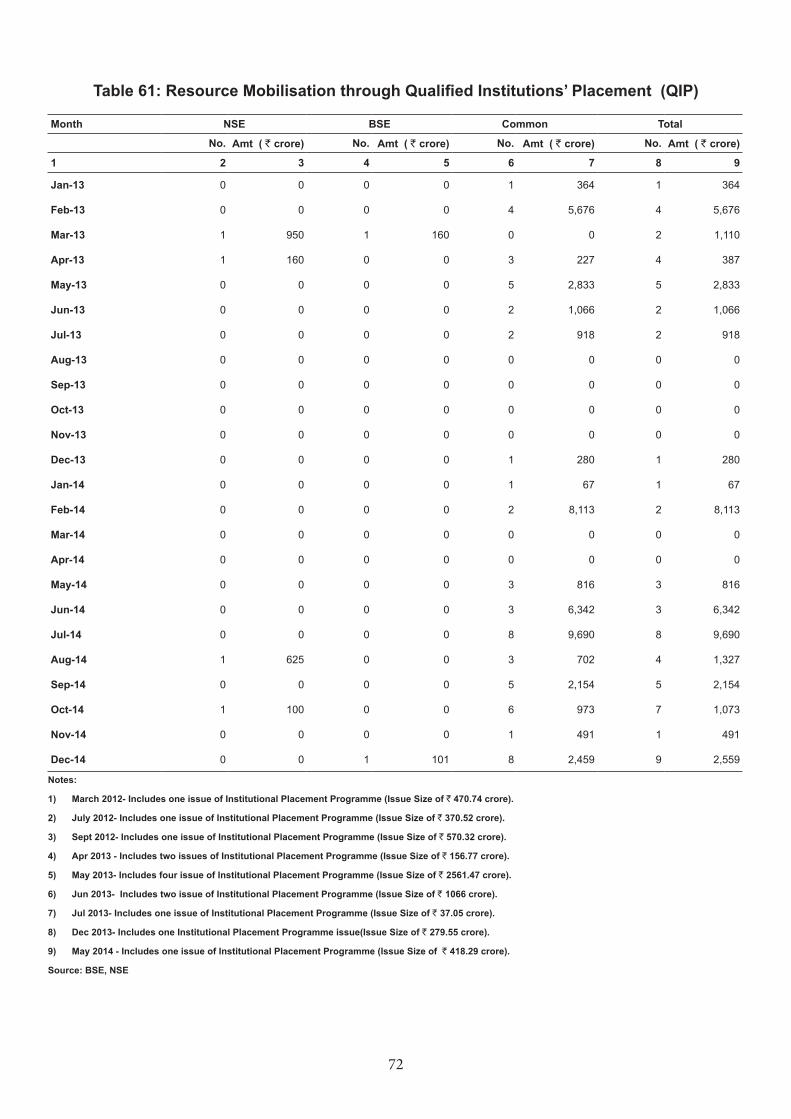
72
Month NSE BSE Common Total
No. Amt ( ` crore) No. Amt ( ` crore) No. Amt ( ` crore) No. Amt ( ` crore)
1 2 3 4 5 6 7 8 9
Jan-13 0 0 0 0 1 364 1 364
Feb-13 0 0 0 0 4 5,676 4 5,676
Mar-13 1 950 1 160 0 0 2 1,110
Apr-13 1 160 0 0 3 227 4 387
May-13 0 0 0 0 5 2,833 5 2,833
Jun-13 0 0 0 0 2 1,066 2 1,066
Jul-13 0 0 0 0 2 918 2 918
Aug-13 0 0 0 0 0 0 0 0
Sep-13 0 0 0 0 0 0 0 0
Oct-13 0 0 0 0 0 0 0 0
Nov-13 0 0 0 0 0 0 0 0
Dec-13 0 0 0 0 1 280 1 280
Jan-14 0 0 0 0 1 67 1 67
Feb-14 0 0 0 0 2 8,113 2 8,113
Mar-14 0 0 0 0 0 0 0 0
Apr-14 0 0 0 0 0 0 0 0
May-14 0 0 0 0 3 816 3 816
Jun-14 0 0 0 0 3 6,342 3 6,342
Jul-14 0 0 0 0 8 9,690 8 9,690
Aug-14 1 625 0 0 3 702 4 1,327
Sep-14 0 0 0 0 5 2,154 5 2,154
Oct-14 1 100 0 0 6 973 7 1,073
Nov-14 0 0 0 0 1 491 1 491
Dec-14 0 0 1 101 8 2,459 9 2,559
Notes:
1) March 2012- Includes one issue of Institutional Placement Programme (Issue Size of ` 470.74 crore).
2) July 2012- Includes one issue of Institutional Placement Programme (Issue Size of ` 370.52 crore).
3) Sept 2012- Includes one issue of Institutional Placement Programme (Issue Size of ` 570.32 crore).
4) Apr 2013 - Includes two issues of Institutional Placement Programme (Issue Size of ` 156.77 crore).
5) May 2013- Includes four issue of Institutional Placement Programme (Issue Size of ` 2561.47 crore).
6) Jun 2013- Includes two issue of Institutional Placement Programme (Issue Size of ` 1066 crore).
7) Jul 2013- Includes one issue of Institutional Placement Programme (Issue Size of ` 37.05 crore).
8) Dec 2013- Includes one Institutional Placement Programme issue(Issue Size of ` 279.55 crore).
9) May 2014 - Includes one issue of Institutional Placement Programme (Issue Size of ` 418.29 crore).
Source: BSE, NSE
Table 61: Resource Mobilisation through Qualified Institutions’ Placement (QIP)
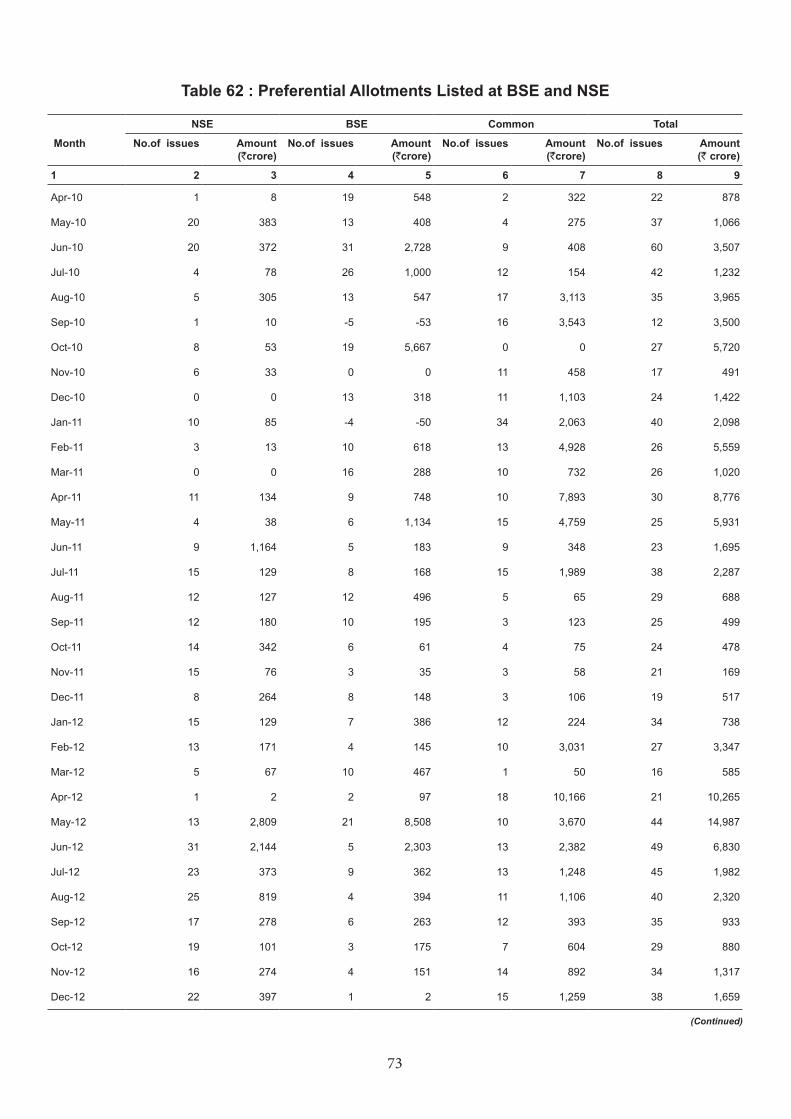
73
Table 62 : Preferential Allotments Listed at BSE and NSE
NSE BSE Common Total
Month No.of issues Amount (`crore)
No.of issues Amount (`crore)
No.of issues Amount (`crore)
No.of issues Amount (` crore)
1 2 3 4 5 6 7 8 9
Apr-10 1 8 19 548 2 322 22 878
May-10 20 383 13 408 4 275 37 1,066
Jun-10 20 372 31 2,728 9 408 60 3,507
Jul-10 4 78 26 1,000 12 154 42 1,232
Aug-10 5 305 13 547 17 3,113 35 3,965
Sep-10 1 10 -5 -53 16 3,543 12 3,500
Oct-10 8 53 19 5,667 0 0 27 5,720
Nov-10 6 33 0 0 11 458 17 491
Dec-10 0 0 13 318 11 1,103 24 1,422
Jan-11 10 85 -4 -50 34 2,063 40 2,098
Feb-11 3 13 10 618 13 4,928 26 5,559
Mar-11 0 0 16 288 10 732 26 1,020
Apr-11 11 134 9 748 10 7,893 30 8,776
May-11 4 38 6 1,134 15 4,759 25 5,931
Jun-11 9 1,164 5 183 9 348 23 1,695
Jul-11 15 129 8 168 15 1,989 38 2,287
Aug-11 12 127 12 496 5 65 29 688
Sep-11 12 180 10 195 3 123 25 499
Oct-11 14 342 6 61 4 75 24 478
Nov-11 15 76 3 35 3 58 21 169
Dec-11 8 264 8 148 3 106 19 517
Jan-12 15 129 7 386 12 224 34 738
Feb-12 13 171 4 145 10 3,031 27 3,347
Mar-12 5 67 10 467 1 50 16 585
Apr-12 1 2 2 97 18 10,166 21 10,265
May-12 13 2,809 21 8,508 10 3,670 44 14,987
Jun-12 31 2,144 5 2,303 13 2,382 49 6,830
Jul-12 23 373 9 362 13 1,248 45 1,982
Aug-12 25 819 4 394 11 1,106 40 2,320
Sep-12 17 278 6 263 12 393 35 933
Oct-12 19 101 3 175 7 604 29 880
Nov-12 16 274 4 151 14 892 34 1,317
Dec-12 22 397 1 2 15 1,259 38 1,659
(Continued)
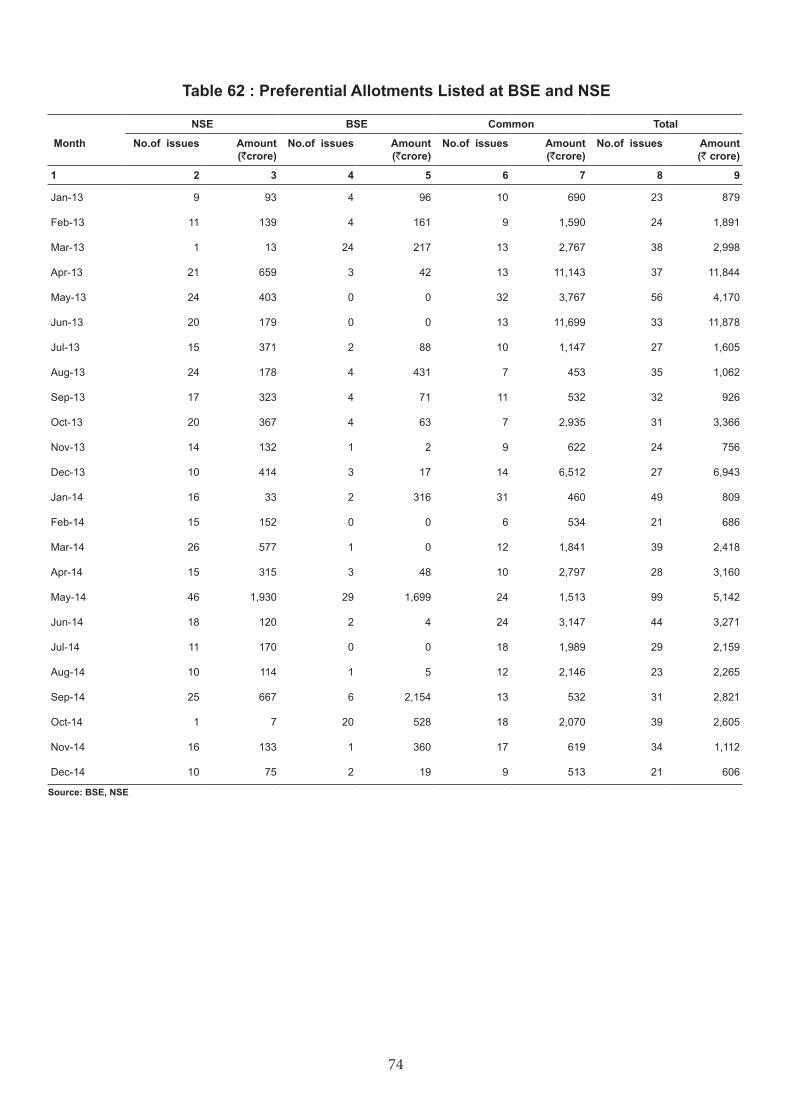
74
NSE BSE Common Total
Month No.of issues Amount (`crore)
No.of issues Amount (`crore)
No.of issues Amount (`crore)
No.of issues Amount (` crore)
1 2 3 4 5 6 7 8 9
Jan-13 9 93 4 96 10 690 23 879
Feb-13 11 139 4 161 9 1,590 24 1,891
Mar-13 1 13 24 217 13 2,767 38 2,998
Apr-13 21 659 3 42 13 11,143 37 11,844
May-13 24 403 0 0 32 3,767 56 4,170
Jun-13 20 179 0 0 13 11,699 33 11,878
Jul-13 15 371 2 88 10 1,147 27 1,605
Aug-13 24 178 4 431 7 453 35 1,062
Sep-13 17 323 4 71 11 532 32 926
Oct-13 20 367 4 63 7 2,935 31 3,366
Nov-13 14 132 1 2 9 622 24 756
Dec-13 10 414 3 17 14 6,512 27 6,943
Jan-14 16 33 2 316 31 460 49 809
Feb-14 15 152 0 0 6 534 21 686
Mar-14 26 577 1 0 12 1,841 39 2,418
Apr-14 15 315 3 48 10 2,797 28 3,160
May-14 46 1,930 29 1,699 24 1,513 99 5,142
Jun-14 18 120 2 4 24 3,147 44 3,271
Jul-14 11 170 0 0 18 1,989 29 2,159
Aug-14 10 114 1 5 12 2,146 23 2,265
Sep-14 25 667 6 2,154 13 532 31 2,821
Oct-14 1 7 20 528 18 2,070 39 2,605
Nov-14 16 133 1 360 17 619 34 1,112
Dec-14 10 75 2 19 9 513 21 606
Source: BSE, NSE
Table 62 : Preferential Allotments Listed at BSE and NSE
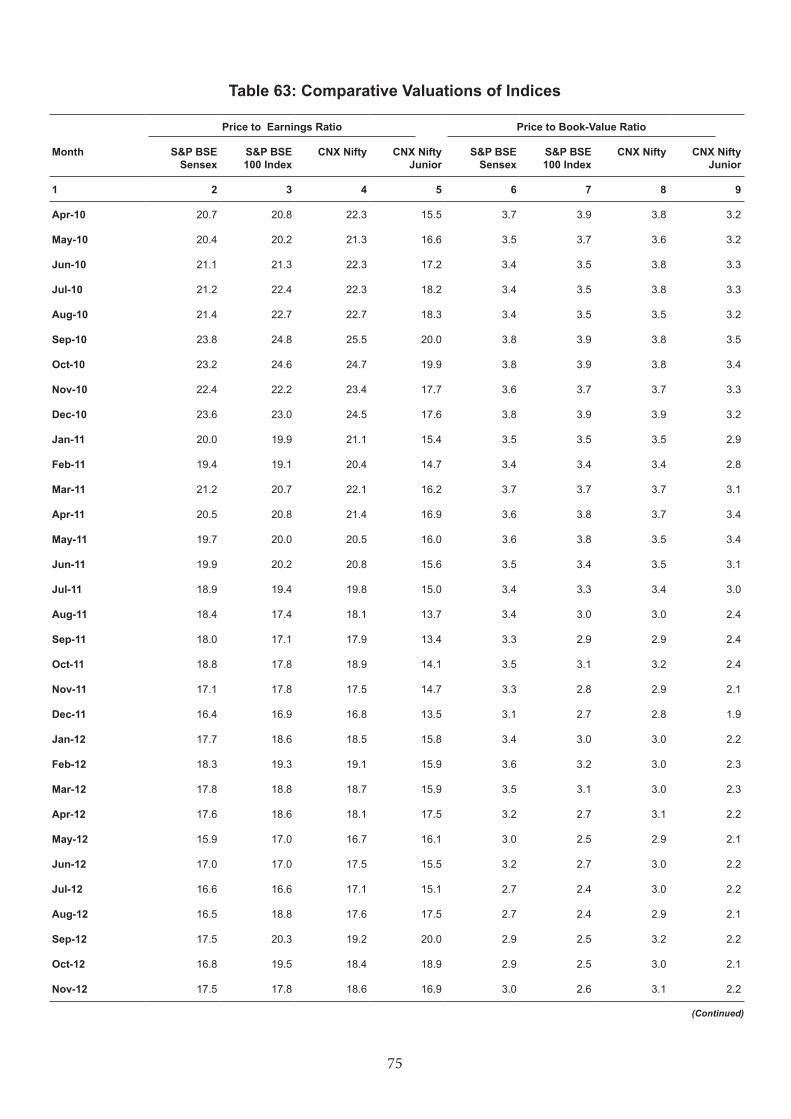
75
Table 63: Comparative Valuations of Indices
Price to Earnings Ratio Price to Book-Value Ratio
Month S&P BSE Sensex
S&P BSE 100 Index
CNX Nifty CNX Nifty Junior
S&P BSE Sensex
S&P BSE 100 Index
CNX Nifty CNX Nifty Junior
1 2 3 4 5 6 7 8 9
Apr-10 20.7 20.8 22.3 15.5 3.7 3.9 3.8 3.2
May-10 20.4 20.2 21.3 16.6 3.5 3.7 3.6 3.2
Jun-10 21.1 21.3 22.3 17.2 3.4 3.5 3.8 3.3
Jul-10 21.2 22.4 22.3 18.2 3.4 3.5 3.8 3.3
Aug-10 21.4 22.7 22.7 18.3 3.4 3.5 3.5 3.2
Sep-10 23.8 24.8 25.5 20.0 3.8 3.9 3.8 3.5
Oct-10 23.2 24.6 24.7 19.9 3.8 3.9 3.8 3.4
Nov-10 22.4 22.2 23.4 17.7 3.6 3.7 3.7 3.3
Dec-10 23.6 23.0 24.5 17.6 3.8 3.9 3.9 3.2
Jan-11 20.0 19.9 21.1 15.4 3.5 3.5 3.5 2.9
Feb-11 19.4 19.1 20.4 14.7 3.4 3.4 3.4 2.8
Mar-11 21.2 20.7 22.1 16.2 3.7 3.7 3.7 3.1
Apr-11 20.5 20.8 21.4 16.9 3.6 3.8 3.7 3.4
May-11 19.7 20.0 20.5 16.0 3.6 3.8 3.5 3.4
Jun-11 19.9 20.2 20.8 15.6 3.5 3.4 3.5 3.1
Jul-11 18.9 19.4 19.8 15.0 3.4 3.3 3.4 3.0
Aug-11 18.4 17.4 18.1 13.7 3.4 3.0 3.0 2.4
Sep-11 18.0 17.1 17.9 13.4 3.3 2.9 2.9 2.4
Oct-11 18.8 17.8 18.9 14.1 3.5 3.1 3.2 2.4
Nov-11 17.1 17.8 17.5 14.7 3.3 2.8 2.9 2.1
Dec-11 16.4 16.9 16.8 13.5 3.1 2.7 2.8 1.9
Jan-12 17.7 18.6 18.5 15.8 3.4 3.0 3.0 2.2
Feb-12 18.3 19.3 19.1 15.9 3.6 3.2 3.0 2.3
Mar-12 17.8 18.8 18.7 15.9 3.5 3.1 3.0 2.3
Apr-12 17.6 18.6 18.1 17.5 3.2 2.7 3.1 2.2
May-12 15.9 17.0 16.7 16.1 3.0 2.5 2.9 2.1
Jun-12 17.0 17.0 17.5 15.5 3.2 2.7 3.0 2.2
Jul-12 16.6 16.6 17.1 15.1 2.7 2.4 3.0 2.2
Aug-12 16.5 18.8 17.6 17.5 2.7 2.4 2.9 2.1
Sep-12 17.5 20.3 19.2 20.0 2.9 2.5 3.2 2.2
Oct-12 16.8 19.5 18.4 18.9 2.9 2.5 3.0 2.1
Nov-12 17.5 17.8 18.6 16.9 3.0 2.6 3.1 2.2
(Continued)
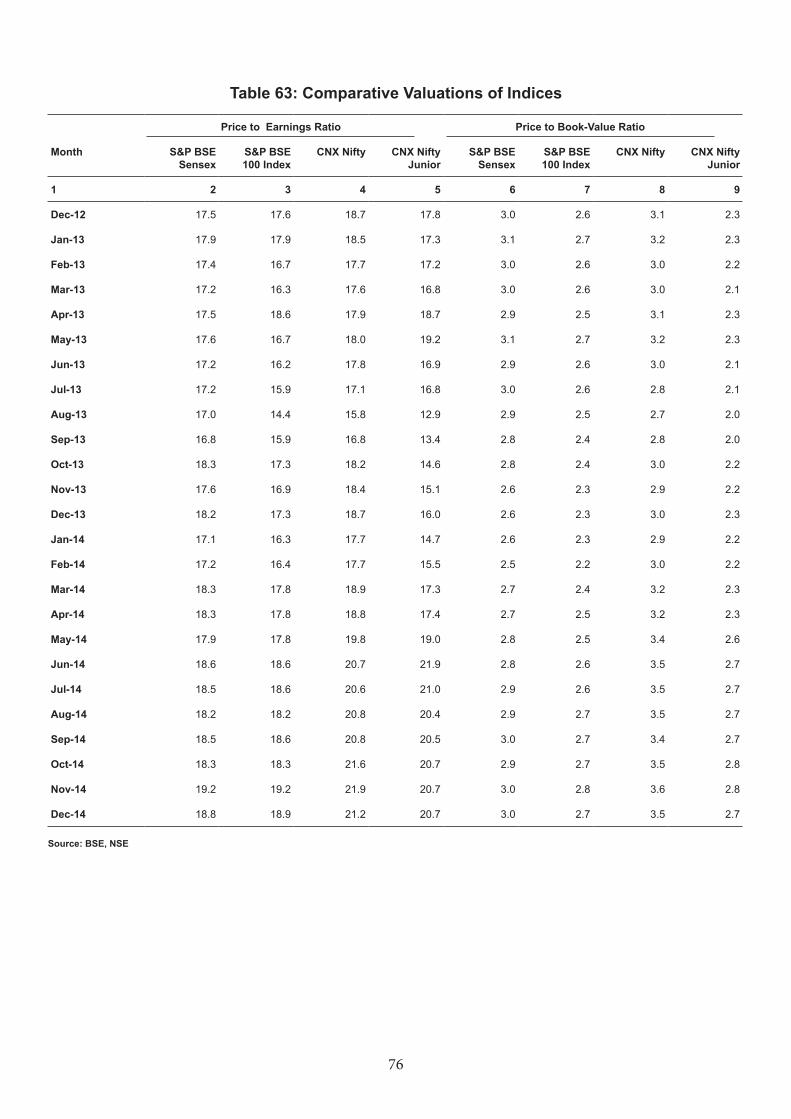
76
Price to Earnings Ratio Price to Book-Value Ratio
Month S&P BSE Sensex
S&P BSE 100 Index
CNX Nifty CNX Nifty Junior
S&P BSE Sensex
S&P BSE 100 Index
CNX Nifty CNX Nifty Junior
1 2 3 4 5 6 7 8 9
Dec-12 17.5 17.6 18.7 17.8 3.0 2.6 3.1 2.3
Jan-13 17.9 17.9 18.5 17.3 3.1 2.7 3.2 2.3
Feb-13 17.4 16.7 17.7 17.2 3.0 2.6 3.0 2.2
Mar-13 17.2 16.3 17.6 16.8 3.0 2.6 3.0 2.1
Apr-13 17.5 18.6 17.9 18.7 2.9 2.5 3.1 2.3
May-13 17.6 16.7 18.0 19.2 3.1 2.7 3.2 2.3
Jun-13 17.2 16.2 17.8 16.9 2.9 2.6 3.0 2.1
Jul-13 17.2 15.9 17.1 16.8 3.0 2.6 2.8 2.1
Aug-13 17.0 14.4 15.8 12.9 2.9 2.5 2.7 2.0
Sep-13 16.8 15.9 16.8 13.4 2.8 2.4 2.8 2.0
Oct-13 18.3 17.3 18.2 14.6 2.8 2.4 3.0 2.2
Nov-13 17.6 16.9 18.4 15.1 2.6 2.3 2.9 2.2
Dec-13 18.2 17.3 18.7 16.0 2.6 2.3 3.0 2.3
Jan-14 17.1 16.3 17.7 14.7 2.6 2.3 2.9 2.2
Feb-14 17.2 16.4 17.7 15.5 2.5 2.2 3.0 2.2
Mar-14 18.3 17.8 18.9 17.3 2.7 2.4 3.2 2.3
Apr-14 18.3 17.8 18.8 17.4 2.7 2.5 3.2 2.3
May-14 17.9 17.8 19.8 19.0 2.8 2.5 3.4 2.6
Jun-14 18.6 18.6 20.7 21.9 2.8 2.6 3.5 2.7
Jul-14 18.5 18.6 20.6 21.0 2.9 2.6 3.5 2.7
Aug-14 18.2 18.2 20.8 20.4 2.9 2.7 3.5 2.7
Sep-14 18.5 18.6 20.8 20.5 3.0 2.7 3.4 2.7
Oct-14 18.3 18.3 21.6 20.7 2.9 2.7 3.5 2.8
Nov-14 19.2 19.2 21.9 20.7 3.0 2.8 3.6 2.8
Dec-14 18.8 18.9 21.2 20.7 3.0 2.7 3.5 2.7
Source: BSE, NSE
Table 63: Comparative Valuations of Indices
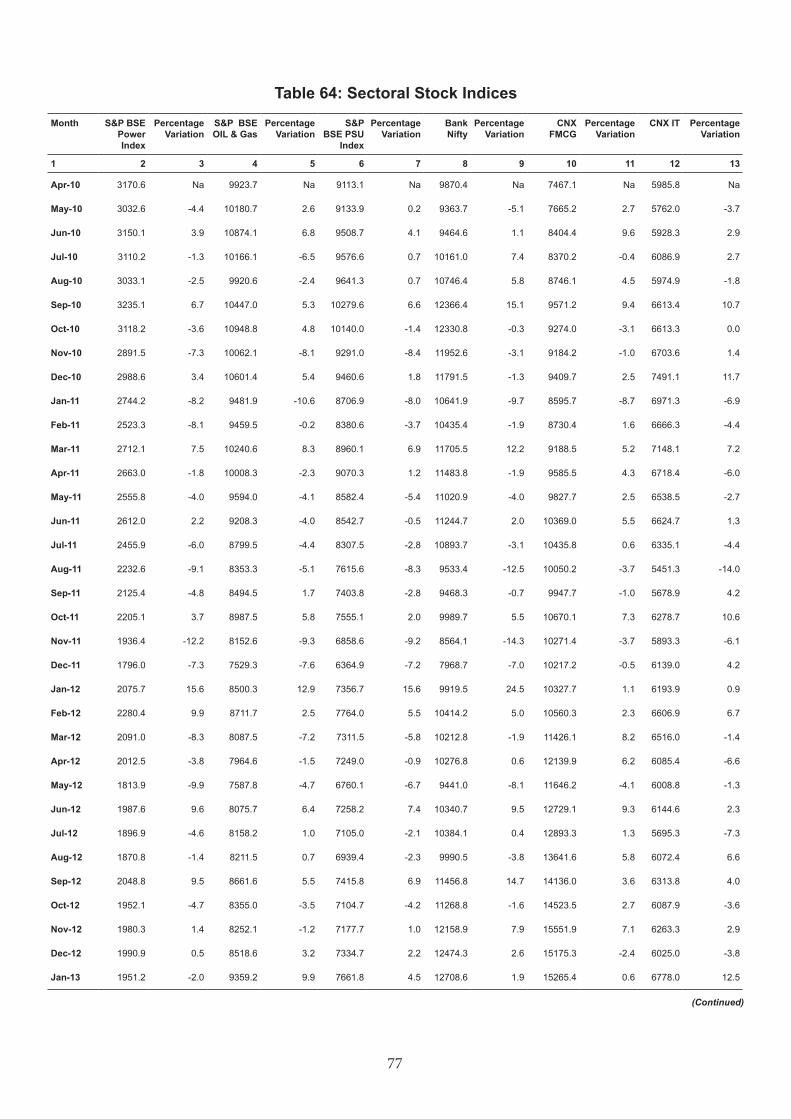
77
Table 64: Sectoral Stock Indices
Month S&P BSE Power Index
Percentage Variation
S&P BSE OIL & Gas
Percentage Variation
S&P BSE PSU
Index
Percentage Variation
Bank Nifty
Percentage Variation
CNX FMCG
Percentage Variation
CNX IT Percentage Variation
1 2 3 4 5 6 7 8 9 10 11 12 13
Apr-10 3170.6 Na 9923.7 Na 9113.1 Na 9870.4 Na 7467.1 Na 5985.8 Na
May-10 3032.6 -4.4 10180.7 2.6 9133.9 0.2 9363.7 -5.1 7665.2 2.7 5762.0 -3.7
Jun-10 3150.1 3.9 10874.1 6.8 9508.7 4.1 9464.6 1.1 8404.4 9.6 5928.3 2.9
Jul-10 3110.2 -1.3 10166.1 -6.5 9576.6 0.7 10161.0 7.4 8370.2 -0.4 6086.9 2.7
Aug-10 3033.1 -2.5 9920.6 -2.4 9641.3 0.7 10746.4 5.8 8746.1 4.5 5974.9 -1.8
Sep-10 3235.1 6.7 10447.0 5.3 10279.6 6.6 12366.4 15.1 9571.2 9.4 6613.4 10.7
Oct-10 3118.2 -3.6 10948.8 4.8 10140.0 -1.4 12330.8 -0.3 9274.0 -3.1 6613.3 0.0
Nov-10 2891.5 -7.3 10062.1 -8.1 9291.0 -8.4 11952.6 -3.1 9184.2 -1.0 6703.6 1.4
Dec-10 2988.6 3.4 10601.4 5.4 9460.6 1.8 11791.5 -1.3 9409.7 2.5 7491.1 11.7
Jan-11 2744.2 -8.2 9481.9 -10.6 8706.9 -8.0 10641.9 -9.7 8595.7 -8.7 6971.3 -6.9
Feb-11 2523.3 -8.1 9459.5 -0.2 8380.6 -3.7 10435.4 -1.9 8730.4 1.6 6666.3 -4.4
Mar-11 2712.1 7.5 10240.6 8.3 8960.1 6.9 11705.5 12.2 9188.5 5.2 7148.1 7.2
Apr-11 2663.0 -1.8 10008.3 -2.3 9070.3 1.2 11483.8 -1.9 9585.5 4.3 6718.4 -6.0
May-11 2555.8 -4.0 9594.0 -4.1 8582.4 -5.4 11020.9 -4.0 9827.7 2.5 6538.5 -2.7
Jun-11 2612.0 2.2 9208.3 -4.0 8542.7 -0.5 11244.7 2.0 10369.0 5.5 6624.7 1.3
Jul-11 2455.9 -6.0 8799.5 -4.4 8307.5 -2.8 10893.7 -3.1 10435.8 0.6 6335.1 -4.4
Aug-11 2232.6 -9.1 8353.3 -5.1 7615.6 -8.3 9533.4 -12.5 10050.2 -3.7 5451.3 -14.0
Sep-11 2125.4 -4.8 8494.5 1.7 7403.8 -2.8 9468.3 -0.7 9947.7 -1.0 5678.9 4.2
Oct-11 2205.1 3.7 8987.5 5.8 7555.1 2.0 9989.7 5.5 10670.1 7.3 6278.7 10.6
Nov-11 1936.4 -12.2 8152.6 -9.3 6858.6 -9.2 8564.1 -14.3 10271.4 -3.7 5893.3 -6.1
Dec-11 1796.0 -7.3 7529.3 -7.6 6364.9 -7.2 7968.7 -7.0 10217.2 -0.5 6139.0 4.2
Jan-12 2075.7 15.6 8500.3 12.9 7356.7 15.6 9919.5 24.5 10327.7 1.1 6193.9 0.9
Feb-12 2280.4 9.9 8711.7 2.5 7764.0 5.5 10414.2 5.0 10560.3 2.3 6606.9 6.7
Mar-12 2091.0 -8.3 8087.5 -7.2 7311.5 -5.8 10212.8 -1.9 11426.1 8.2 6516.0 -1.4
Apr-12 2012.5 -3.8 7964.6 -1.5 7249.0 -0.9 10276.8 0.6 12139.9 6.2 6085.4 -6.6
May-12 1813.9 -9.9 7587.8 -4.7 6760.1 -6.7 9441.0 -8.1 11646.2 -4.1 6008.8 -1.3
Jun-12 1987.6 9.6 8075.7 6.4 7258.2 7.4 10340.7 9.5 12729.1 9.3 6144.6 2.3
Jul-12 1896.9 -4.6 8158.2 1.0 7105.0 -2.1 10384.1 0.4 12893.3 1.3 5695.3 -7.3
Aug-12 1870.8 -1.4 8211.5 0.7 6939.4 -2.3 9990.5 -3.8 13641.6 5.8 6072.4 6.6
Sep-12 2048.8 9.5 8661.6 5.5 7415.8 6.9 11456.8 14.7 14136.0 3.6 6313.8 4.0
Oct-12 1952.1 -4.7 8355.0 -3.5 7104.7 -4.2 11268.8 -1.6 14523.5 2.7 6087.9 -3.6
Nov-12 1980.3 1.4 8252.1 -1.2 7177.7 1.0 12158.9 7.9 15551.9 7.1 6263.3 2.9
Dec-12 1990.9 0.5 8518.6 3.2 7334.7 2.2 12474.3 2.6 15175.3 -2.4 6025.0 -3.8
Jan-13 1951.2 -2.0 9359.2 9.9 7661.8 4.5 12708.6 1.9 15265.4 0.6 6778.0 12.5
(Continued)
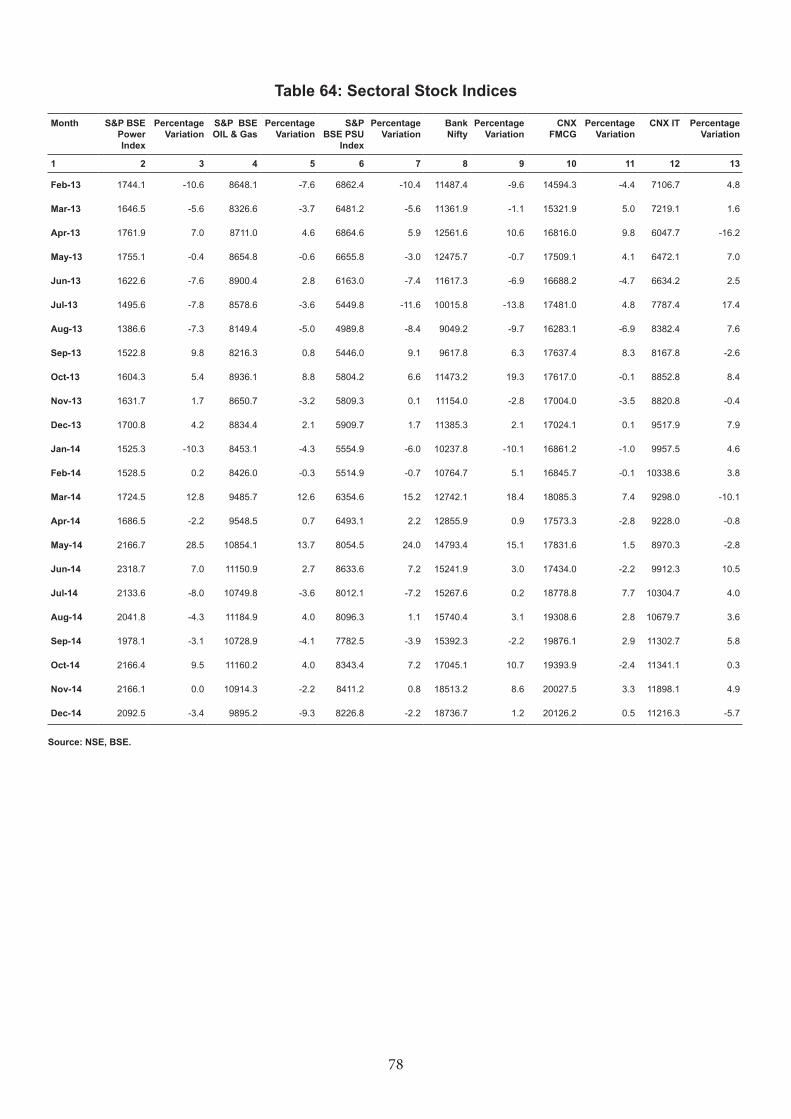
78
Month S&P BSE Power Index
Percentage Variation
S&P BSE OIL & Gas
Percentage Variation
S&P BSE PSU
Index
Percentage Variation
Bank Nifty
Percentage Variation
CNX FMCG
Percentage Variation
CNX IT Percentage Variation
1 2 3 4 5 6 7 8 9 10 11 12 13
Feb-13 1744.1 -10.6 8648.1 -7.6 6862.4 -10.4 11487.4 -9.6 14594.3 -4.4 7106.7 4.8
Mar-13 1646.5 -5.6 8326.6 -3.7 6481.2 -5.6 11361.9 -1.1 15321.9 5.0 7219.1 1.6
Apr-13 1761.9 7.0 8711.0 4.6 6864.6 5.9 12561.6 10.6 16816.0 9.8 6047.7 -16.2
May-13 1755.1 -0.4 8654.8 -0.6 6655.8 -3.0 12475.7 -0.7 17509.1 4.1 6472.1 7.0
Jun-13 1622.6 -7.6 8900.4 2.8 6163.0 -7.4 11617.3 -6.9 16688.2 -4.7 6634.2 2.5
Jul-13 1495.6 -7.8 8578.6 -3.6 5449.8 -11.6 10015.8 -13.8 17481.0 4.8 7787.4 17.4
Aug-13 1386.6 -7.3 8149.4 -5.0 4989.8 -8.4 9049.2 -9.7 16283.1 -6.9 8382.4 7.6
Sep-13 1522.8 9.8 8216.3 0.8 5446.0 9.1 9617.8 6.3 17637.4 8.3 8167.8 -2.6
Oct-13 1604.3 5.4 8936.1 8.8 5804.2 6.6 11473.2 19.3 17617.0 -0.1 8852.8 8.4
Nov-13 1631.7 1.7 8650.7 -3.2 5809.3 0.1 11154.0 -2.8 17004.0 -3.5 8820.8 -0.4
Dec-13 1700.8 4.2 8834.4 2.1 5909.7 1.7 11385.3 2.1 17024.1 0.1 9517.9 7.9
Jan-14 1525.3 -10.3 8453.1 -4.3 5554.9 -6.0 10237.8 -10.1 16861.2 -1.0 9957.5 4.6
Feb-14 1528.5 0.2 8426.0 -0.3 5514.9 -0.7 10764.7 5.1 16845.7 -0.1 10338.6 3.8
Mar-14 1724.5 12.8 9485.7 12.6 6354.6 15.2 12742.1 18.4 18085.3 7.4 9298.0 -10.1
Apr-14 1686.5 -2.2 9548.5 0.7 6493.1 2.2 12855.9 0.9 17573.3 -2.8 9228.0 -0.8
May-14 2166.7 28.5 10854.1 13.7 8054.5 24.0 14793.4 15.1 17831.6 1.5 8970.3 -2.8
Jun-14 2318.7 7.0 11150.9 2.7 8633.6 7.2 15241.9 3.0 17434.0 -2.2 9912.3 10.5
Jul-14 2133.6 -8.0 10749.8 -3.6 8012.1 -7.2 15267.6 0.2 18778.8 7.7 10304.7 4.0
Aug-14 2041.8 -4.3 11184.9 4.0 8096.3 1.1 15740.4 3.1 19308.6 2.8 10679.7 3.6
Sep-14 1978.1 -3.1 10728.9 -4.1 7782.5 -3.9 15392.3 -2.2 19876.1 2.9 11302.7 5.8
Oct-14 2166.4 9.5 11160.2 4.0 8343.4 7.2 17045.1 10.7 19393.9 -2.4 11341.1 0.3
Nov-14 2166.1 0.0 10914.3 -2.2 8411.2 0.8 18513.2 8.6 20027.5 3.3 11898.1 4.9
Dec-14 2092.5 -3.4 9895.2 -9.3 8226.8 -2.2 18736.7 1.2 20126.2 0.5 11216.3 -5.7
Source: NSE, BSE.
Table 64: Sectoral Stock Indices
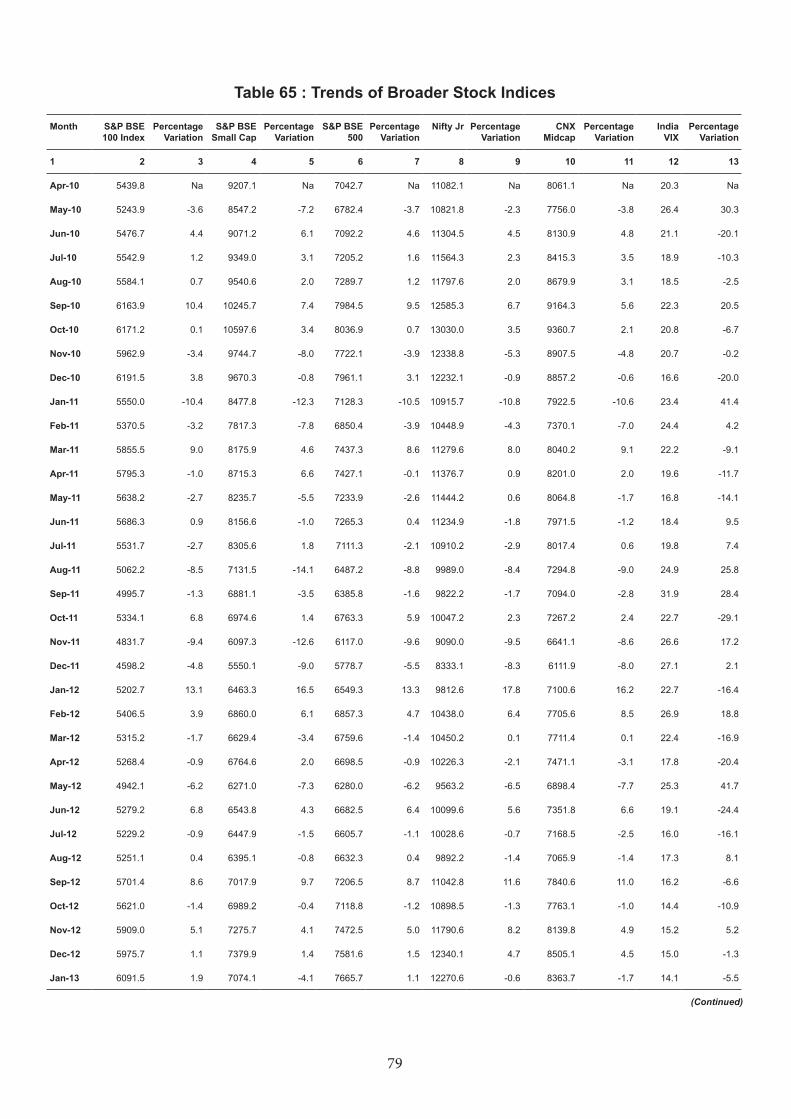
79
Table 65 : Trends of Broader Stock Indices
Month S&P BSE 100 Index
Percentage Variation
S&P BSE Small Cap
Percentage Variation
S&P BSE 500
Percentage Variation
Nifty Jr Percentage Variation
CNX Midcap
Percentage Variation
India VIX
Percentage Variation
1 2 3 4 5 6 7 8 9 10 11 12 13
Apr-10 5439.8 Na 9207.1 Na 7042.7 Na 11082.1 Na 8061.1 Na 20.3 Na
May-10 5243.9 -3.6 8547.2 -7.2 6782.4 -3.7 10821.8 -2.3 7756.0 -3.8 26.4 30.3
Jun-10 5476.7 4.4 9071.2 6.1 7092.2 4.6 11304.5 4.5 8130.9 4.8 21.1 -20.1
Jul-10 5542.9 1.2 9349.0 3.1 7205.2 1.6 11564.3 2.3 8415.3 3.5 18.9 -10.3
Aug-10 5584.1 0.7 9540.6 2.0 7289.7 1.2 11797.6 2.0 8679.9 3.1 18.5 -2.5
Sep-10 6163.9 10.4 10245.7 7.4 7984.5 9.5 12585.3 6.7 9164.3 5.6 22.3 20.5
Oct-10 6171.2 0.1 10597.6 3.4 8036.9 0.7 13030.0 3.5 9360.7 2.1 20.8 -6.7
Nov-10 5962.9 -3.4 9744.7 -8.0 7722.1 -3.9 12338.8 -5.3 8907.5 -4.8 20.7 -0.2
Dec-10 6191.5 3.8 9670.3 -0.8 7961.1 3.1 12232.1 -0.9 8857.2 -0.6 16.6 -20.0
Jan-11 5550.0 -10.4 8477.8 -12.3 7128.3 -10.5 10915.7 -10.8 7922.5 -10.6 23.4 41.4
Feb-11 5370.5 -3.2 7817.3 -7.8 6850.4 -3.9 10448.9 -4.3 7370.1 -7.0 24.4 4.2
Mar-11 5855.5 9.0 8175.9 4.6 7437.3 8.6 11279.6 8.0 8040.2 9.1 22.2 -9.1
Apr-11 5795.3 -1.0 8715.3 6.6 7427.1 -0.1 11376.7 0.9 8201.0 2.0 19.6 -11.7
May-11 5638.2 -2.7 8235.7 -5.5 7233.9 -2.6 11444.2 0.6 8064.8 -1.7 16.8 -14.1
Jun-11 5686.3 0.9 8156.6 -1.0 7265.3 0.4 11234.9 -1.8 7971.5 -1.2 18.4 9.5
Jul-11 5531.7 -2.7 8305.6 1.8 7111.3 -2.1 10910.2 -2.9 8017.4 0.6 19.8 7.4
Aug-11 5062.2 -8.5 7131.5 -14.1 6487.2 -8.8 9989.0 -8.4 7294.8 -9.0 24.9 25.8
Sep-11 4995.7 -1.3 6881.1 -3.5 6385.8 -1.6 9822.2 -1.7 7094.0 -2.8 31.9 28.4
Oct-11 5334.1 6.8 6974.6 1.4 6763.3 5.9 10047.2 2.3 7267.2 2.4 22.7 -29.1
Nov-11 4831.7 -9.4 6097.3 -12.6 6117.0 -9.6 9090.0 -9.5 6641.1 -8.6 26.6 17.2
Dec-11 4598.2 -4.8 5550.1 -9.0 5778.7 -5.5 8333.1 -8.3 6111.9 -8.0 27.1 2.1
Jan-12 5202.7 13.1 6463.3 16.5 6549.3 13.3 9812.6 17.8 7100.6 16.2 22.7 -16.4
Feb-12 5406.5 3.9 6860.0 6.1 6857.3 4.7 10438.0 6.4 7705.6 8.5 26.9 18.8
Mar-12 5315.2 -1.7 6629.4 -3.4 6759.6 -1.4 10450.2 0.1 7711.4 0.1 22.4 -16.9
Apr-12 5268.4 -0.9 6764.6 2.0 6698.5 -0.9 10226.3 -2.1 7471.1 -3.1 17.8 -20.4
May-12 4942.1 -6.2 6271.0 -7.3 6280.0 -6.2 9563.2 -6.5 6898.4 -7.7 25.3 41.7
Jun-12 5279.2 6.8 6543.8 4.3 6682.5 6.4 10099.6 5.6 7351.8 6.6 19.1 -24.4
Jul-12 5229.2 -0.9 6447.9 -1.5 6605.7 -1.1 10028.6 -0.7 7168.5 -2.5 16.0 -16.1
Aug-12 5251.1 0.4 6395.1 -0.8 6632.3 0.4 9892.2 -1.4 7065.9 -1.4 17.3 8.1
Sep-12 5701.4 8.6 7017.9 9.7 7206.5 8.7 11042.8 11.6 7840.6 11.0 16.2 -6.6
Oct-12 5621.0 -1.4 6989.2 -0.4 7118.8 -1.2 10898.5 -1.3 7763.1 -1.0 14.4 -10.9
Nov-12 5909.0 5.1 7275.7 4.1 7472.5 5.0 11790.6 8.2 8139.8 4.9 15.2 5.2
Dec-12 5975.7 1.1 7379.9 1.4 7581.6 1.5 12340.1 4.7 8505.1 4.5 15.0 -1.3
Jan-13 6091.5 1.9 7074.1 -4.1 7665.7 1.1 12270.6 -0.6 8363.7 -1.7 14.1 -5.5
(Continued)
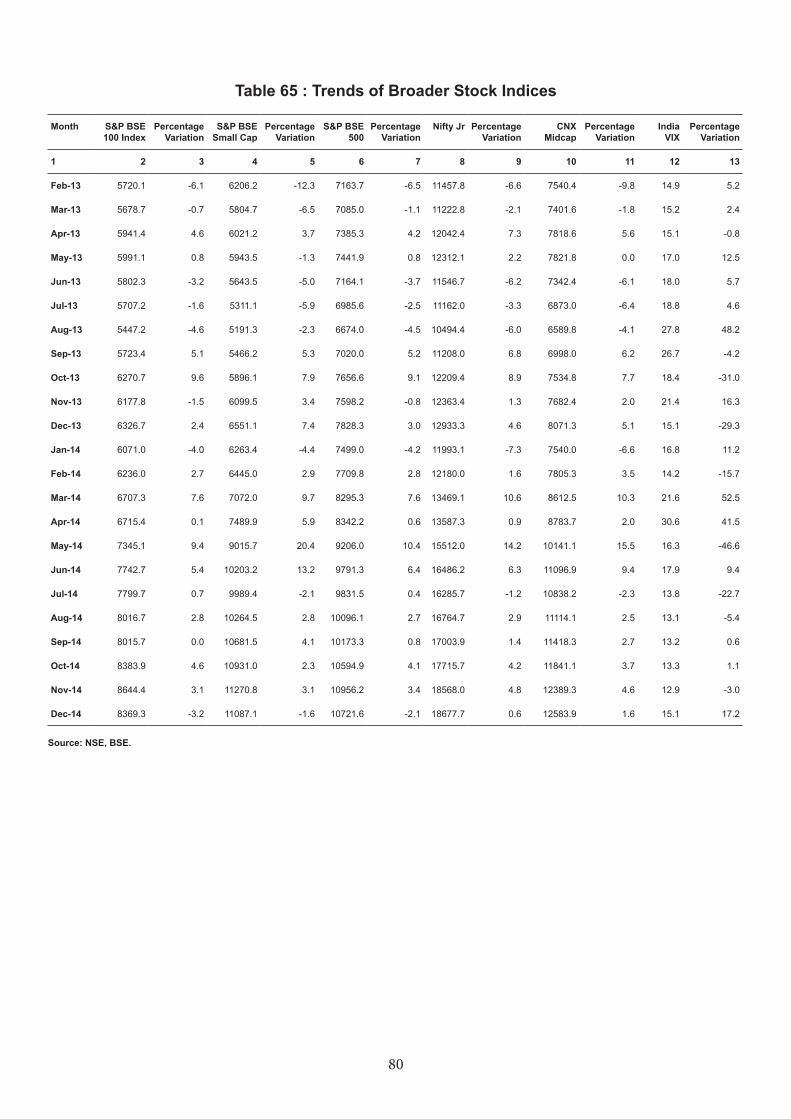
80
Month S&P BSE 100 Index
Percentage Variation
S&P BSE Small Cap
Percentage Variation
S&P BSE 500
Percentage Variation
Nifty Jr Percentage Variation
CNX Midcap
Percentage Variation
India VIX
Percentage Variation
1 2 3 4 5 6 7 8 9 10 11 12 13
Feb-13 5720.1 -6.1 6206.2 -12.3 7163.7 -6.5 11457.8 -6.6 7540.4 -9.8 14.9 5.2
Mar-13 5678.7 -0.7 5804.7 -6.5 7085.0 -1.1 11222.8 -2.1 7401.6 -1.8 15.2 2.4
Apr-13 5941.4 4.6 6021.2 3.7 7385.3 4.2 12042.4 7.3 7818.6 5.6 15.1 -0.8
May-13 5991.1 0.8 5943.5 -1.3 7441.9 0.8 12312.1 2.2 7821.8 0.0 17.0 12.5
Jun-13 5802.3 -3.2 5643.5 -5.0 7164.1 -3.7 11546.7 -6.2 7342.4 -6.1 18.0 5.7
Jul-13 5707.2 -1.6 5311.1 -5.9 6985.6 -2.5 11162.0 -3.3 6873.0 -6.4 18.8 4.6
Aug-13 5447.2 -4.6 5191.3 -2.3 6674.0 -4.5 10494.4 -6.0 6589.8 -4.1 27.8 48.2
Sep-13 5723.4 5.1 5466.2 5.3 7020.0 5.2 11208.0 6.8 6998.0 6.2 26.7 -4.2
Oct-13 6270.7 9.6 5896.1 7.9 7656.6 9.1 12209.4 8.9 7534.8 7.7 18.4 -31.0
Nov-13 6177.8 -1.5 6099.5 3.4 7598.2 -0.8 12363.4 1.3 7682.4 2.0 21.4 16.3
Dec-13 6326.7 2.4 6551.1 7.4 7828.3 3.0 12933.3 4.6 8071.3 5.1 15.1 -29.3
Jan-14 6071.0 -4.0 6263.4 -4.4 7499.0 -4.2 11993.1 -7.3 7540.0 -6.6 16.8 11.2
Feb-14 6236.0 2.7 6445.0 2.9 7709.8 2.8 12180.0 1.6 7805.3 3.5 14.2 -15.7
Mar-14 6707.3 7.6 7072.0 9.7 8295.3 7.6 13469.1 10.6 8612.5 10.3 21.6 52.5
Apr-14 6715.4 0.1 7489.9 5.9 8342.2 0.6 13587.3 0.9 8783.7 2.0 30.6 41.5
May-14 7345.1 9.4 9015.7 20.4 9206.0 10.4 15512.0 14.2 10141.1 15.5 16.3 -46.6
Jun-14 7742.7 5.4 10203.2 13.2 9791.3 6.4 16486.2 6.3 11096.9 9.4 17.9 9.4
Jul-14 7799.7 0.7 9989.4 -2.1 9831.5 0.4 16285.7 -1.2 10838.2 -2.3 13.8 -22.7
Aug-14 8016.7 2.8 10264.5 2.8 10096.1 2.7 16764.7 2.9 11114.1 2.5 13.1 -5.4
Sep-14 8015.7 0.0 10681.5 4.1 10173.3 0.8 17003.9 1.4 11418.3 2.7 13.2 0.6
Oct-14 8383.9 4.6 10931.0 2.3 10594.9 4.1 17715.7 4.2 11841.1 3.7 13.3 1.1
Nov-14 8644.4 3.1 11270.8 3.1 10956.2 3.4 18568.0 4.8 12389.3 4.6 12.9 -3.0
Dec-14 8369.3 -3.2 11087.1 -1.6 10721.6 -2.1 18677.7 0.6 12583.9 1.6 15.1 17.2
Source: NSE, BSE.
Table 65 : Trends of Broader Stock Indices
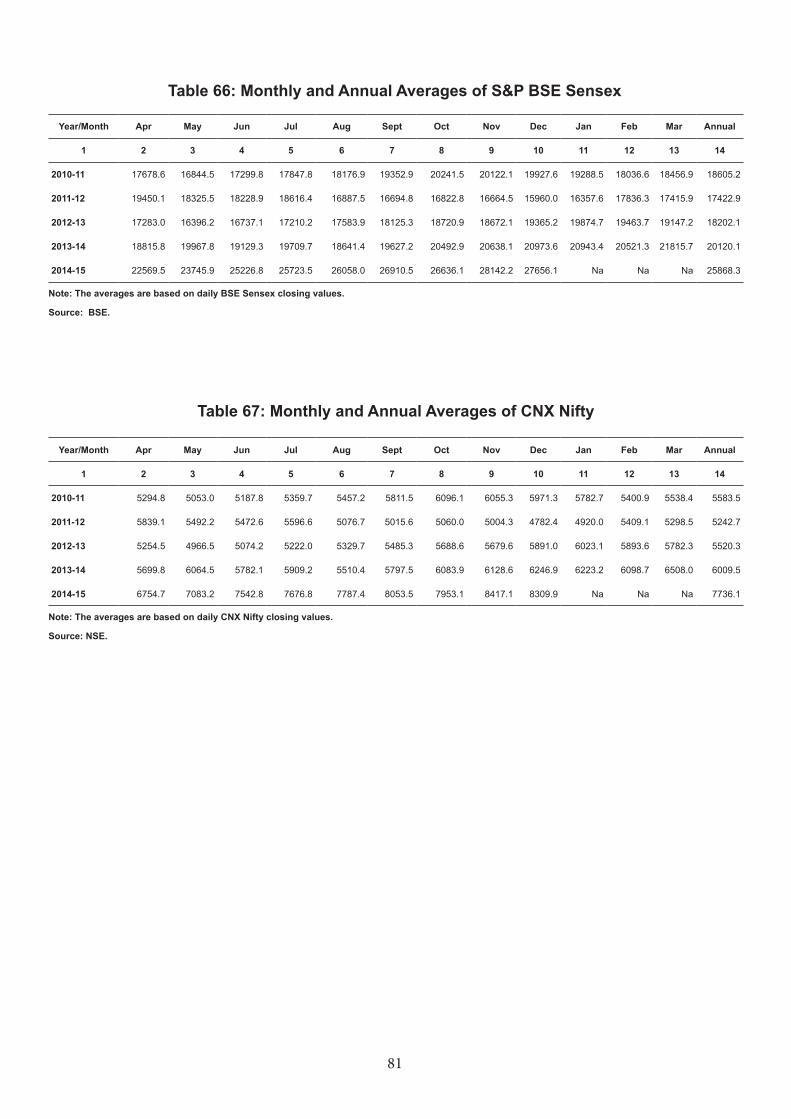
81
Table 66: Monthly and Annual Averages of S&P BSE Sensex
Year/Month Apr May Jun Jul Aug Sept Oct Nov Dec Jan Feb Mar Annual
1 2 3 4 5 6 7 8 9 10 11 12 13 14
2010-11 17678.6 16844.5 17299.8 17847.8 18176.9 19352.9 20241.5 20122.1 19927.6 19288.5 18036.6 18456.9 18605.2
2011-12 19450.1 18325.5 18228.9 18616.4 16887.5 16694.8 16822.8 16664.5 15960.0 16357.6 17836.3 17415.9 17422.9
2012-13 17283.0 16396.2 16737.1 17210.2 17583.9 18125.3 18720.9 18672.1 19365.2 19874.7 19463.7 19147.2 18202.1
2013-14 18815.8 19967.8 19129.3 19709.7 18641.4 19627.2 20492.9 20638.1 20973.6 20943.4 20521.3 21815.7 20120.1
2014-15 22569.5 23745.9 25226.8 25723.5 26058.0 26910.5 26636.1 28142.2 27656.1 Na Na Na 25868.3
Note: The averages are based on daily BSE Sensex closing values.
Source: BSE.
Year/Month Apr May Jun Jul Aug Sept Oct Nov Dec Jan Feb Mar Annual
1 2 3 4 5 6 7 8 9 10 11 12 13 14
2010-11 5294.8 5053.0 5187.8 5359.7 5457.2 5811.5 6096.1 6055.3 5971.3 5782.7 5400.9 5538.4 5583.5
2011-12 5839.1 5492.2 5472.6 5596.6 5076.7 5015.6 5060.0 5004.3 4782.4 4920.0 5409.1 5298.5 5242.7
2012-13 5254.5 4966.5 5074.2 5222.0 5329.7 5485.3 5688.6 5679.6 5891.0 6023.1 5893.6 5782.3 5520.3
2013-14 5699.8 6064.5 5782.1 5909.2 5510.4 5797.5 6083.9 6128.6 6246.9 6223.2 6098.7 6508.0 6009.5
2014-15 6754.7 7083.2 7542.8 7676.8 7787.4 8053.5 7953.1 8417.1 8309.9 Na Na Na 7736.1
Note: The averages are based on daily CNX Nifty closing values.
Source: NSE.
Table 67: Monthly and Annual Averages of CNX Nifty
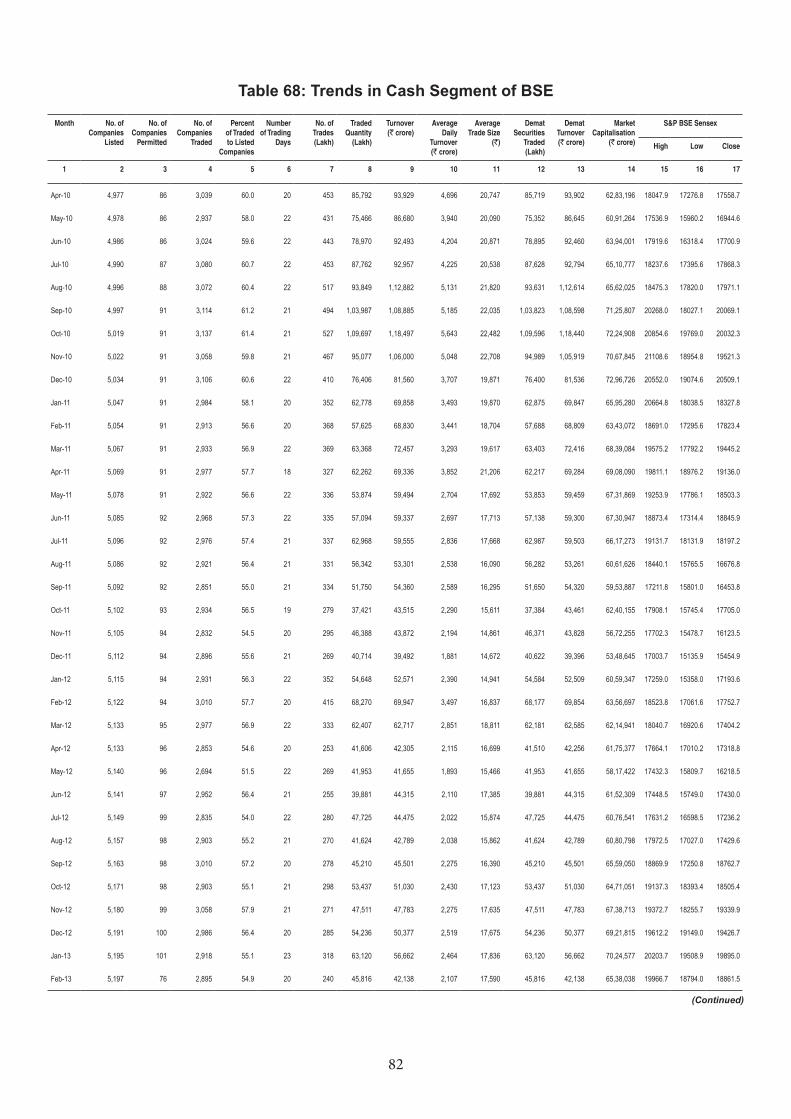
82
Table 68: Trends in Cash Segment of BSE
Month No. of Companies
Listed
No. of Companies
Permitted
No. of Companies
Traded
Percent of Traded to Listed
Companies
Number of Trading
Days
No. of Trades (Lakh)
Traded Quantity
(Lakh)
Turnover (` crore)
Average Daily
Turnover (` crore)
Average Trade Size
(`)
Demat Securities
Traded (Lakh)
Demat Turnover (` crore)
Market Capitalisation
(` crore)
S&P BSE Sensex
High Low Close
1 2 3 4 5 6 7 8 9 10 11 12 13 14 15 16 17
Apr-10 4,977 86 3,039 60.0 20 453 85,792 93,929 4,696 20,747 85,719 93,902 62,83,196 18047.9 17276.8 17558.7
May-10 4,978 86 2,937 58.0 22 431 75,466 86,680 3,940 20,090 75,352 86,645 60,91,264 17536.9 15960.2 16944.6
Jun-10 4,986 86 3,024 59.6 22 443 78,970 92,493 4,204 20,871 78,895 92,460 63,94,001 17919.6 16318.4 17700.9
Jul-10 4,990 87 3,080 60.7 22 453 87,762 92,957 4,225 20,538 87,628 92,794 65,10,777 18237.6 17395.6 17868.3
Aug-10 4,996 88 3,072 60.4 22 517 93,849 1,12,882 5,131 21,820 93,631 1,12,614 65,62,025 18475.3 17820.0 17971.1
Sep-10 4,997 91 3,114 61.2 21 494 1,03,987 1,08,885 5,185 22,035 1,03,823 1,08,598 71,25,807 20268.0 18027.1 20069.1
Oct-10 5,019 91 3,137 61.4 21 527 1,09,697 1,18,497 5,643 22,482 1,09,596 1,18,440 72,24,908 20854.6 19769.0 20032.3
Nov-10 5,022 91 3,058 59.8 21 467 95,077 1,06,000 5,048 22,708 94,989 1,05,919 70,67,845 21108.6 18954.8 19521.3
Dec-10 5,034 91 3,106 60.6 22 410 76,406 81,560 3,707 19,871 76,400 81,536 72,96,726 20552.0 19074.6 20509.1
Jan-11 5,047 91 2,984 58.1 20 352 62,778 69,858 3,493 19,870 62,875 69,847 65,95,280 20664.8 18038.5 18327.8
Feb-11 5,054 91 2,913 56.6 20 368 57,625 68,830 3,441 18,704 57,688 68,809 63,43,072 18691.0 17295.6 17823.4
Mar-11 5,067 91 2,933 56.9 22 369 63,368 72,457 3,293 19,617 63,403 72,416 68,39,084 19575.2 17792.2 19445.2
Apr-11 5,069 91 2,977 57.7 18 327 62,262 69,336 3,852 21,206 62,217 69,284 69,08,090 19811.1 18976.2 19136.0
May-11 5,078 91 2,922 56.6 22 336 53,874 59,494 2,704 17,692 53,853 59,459 67,31,869 19253.9 17786.1 18503.3
Jun-11 5,085 92 2,968 57.3 22 335 57,094 59,337 2,697 17,713 57,138 59,300 67,30,947 18873.4 17314.4 18845.9
Jul-11 5,096 92 2,976 57.4 21 337 62,968 59,555 2,836 17,668 62,987 59,503 66,17,273 19131.7 18131.9 18197.2
Aug-11 5,086 92 2,921 56.4 21 331 56,342 53,301 2,538 16,090 56,282 53,261 60,61,626 18440.1 15765.5 16676.8
Sep-11 5,092 92 2,851 55.0 21 334 51,750 54,360 2,589 16,295 51,650 54,320 59,53,887 17211.8 15801.0 16453.8
Oct-11 5,102 93 2,934 56.5 19 279 37,421 43,515 2,290 15,611 37,384 43,461 62,40,155 17908.1 15745.4 17705.0
Nov-11 5,105 94 2,832 54.5 20 295 46,388 43,872 2,194 14,861 46,371 43,828 56,72,255 17702.3 15478.7 16123.5
Dec-11 5,112 94 2,896 55.6 21 269 40,714 39,492 1,881 14,672 40,622 39,396 53,48,645 17003.7 15135.9 15454.9
Jan-12 5,115 94 2,931 56.3 22 352 54,648 52,571 2,390 14,941 54,584 52,509 60,59,347 17259.0 15358.0 17193.6
Feb-12 5,122 94 3,010 57.7 20 415 68,270 69,947 3,497 16,837 68,177 69,854 63,56,697 18523.8 17061.6 17752.7
Mar-12 5,133 95 2,977 56.9 22 333 62,407 62,717 2,851 18,811 62,181 62,585 62,14,941 18040.7 16920.6 17404.2
Apr-12 5,133 96 2,853 54.6 20 253 41,606 42,305 2,115 16,699 41,510 42,256 61,75,377 17664.1 17010.2 17318.8
May-12 5,140 96 2,694 51.5 22 269 41,953 41,655 1,893 15,466 41,953 41,655 58,17,422 17432.3 15809.7 16218.5
Jun-12 5,141 97 2,952 56.4 21 255 39,881 44,315 2,110 17,385 39,881 44,315 61,52,309 17448.5 15749.0 17430.0
Jul-12 5,149 99 2,835 54.0 22 280 47,725 44,475 2,022 15,874 47,725 44,475 60,76,541 17631.2 16598.5 17236.2
Aug-12 5,157 98 2,903 55.2 21 270 41,624 42,789 2,038 15,862 41,624 42,789 60,80,798 17972.5 17027.0 17429.6
Sep-12 5,163 98 3,010 57.2 20 278 45,210 45,501 2,275 16,390 45,210 45,501 65,59,050 18869.9 17250.8 18762.7
Oct-12 5,171 98 2,903 55.1 21 298 53,437 51,030 2,430 17,123 53,437 51,030 64,71,051 19137.3 18393.4 18505.4
Nov-12 5,180 99 3,058 57.9 21 271 47,511 47,783 2,275 17,635 47,511 47,783 67,38,713 19372.7 18255.7 19339.9
Dec-12 5,191 100 2,986 56.4 20 285 54,236 50,377 2,519 17,675 54,236 50,377 69,21,815 19612.2 19149.0 19426.7
Jan-13 5,195 101 2,918 55.1 23 318 63,120 56,662 2,464 17,836 63,120 56,662 70,24,577 20203.7 19508.9 19895.0
Feb-13 5,197 76 2,895 54.9 20 240 45,816 42,138 2,107 17,590 45,816 42,138 65,38,038 19966.7 18794.0 18861.5
(Continued)
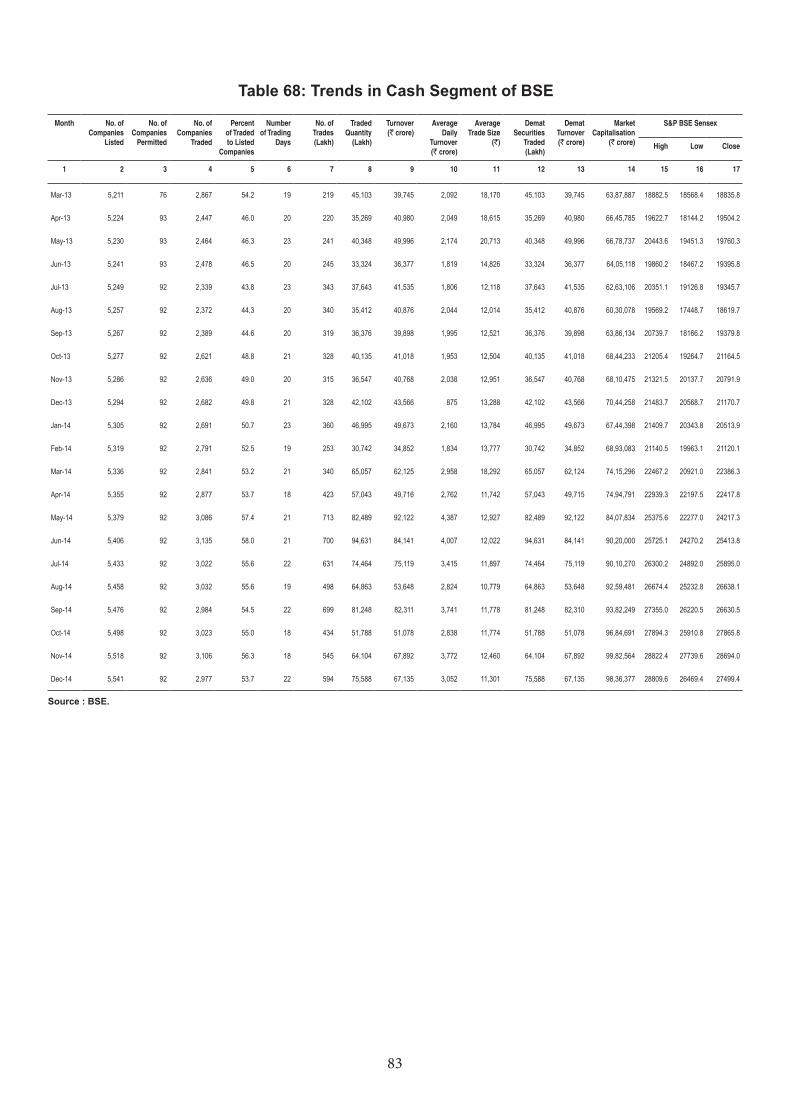
83
Table 68: Trends in Cash Segment of BSE
Month No. of Companies
Listed
No. of Companies
Permitted
No. of Companies
Traded
Percent of Traded to Listed
Companies
Number of Trading
Days
No. of Trades (Lakh)
Traded Quantity
(Lakh)
Turnover (` crore)
Average Daily
Turnover (` crore)
Average Trade Size
(`)
Demat Securities
Traded (Lakh)
Demat Turnover (` crore)
Market Capitalisation
(` crore)
S&P BSE Sensex
High Low Close
1 2 3 4 5 6 7 8 9 10 11 12 13 14 15 16 17
Mar-13 5,211 76 2,867 54.2 19 219 45,103 39,745 2,092 18,170 45,103 39,745 63,87,887 18882.5 18568.4 18835.8
Apr-13 5,224 93 2,447 46.0 20 220 35,269 40,980 2,049 18,615 35,269 40,980 66,45,785 19622.7 18144.2 19504.2
May-13 5,230 93 2,464 46.3 23 241 40,348 49,996 2,174 20,713 40,348 49,996 66,78,737 20443.6 19451.3 19760.3
Jun-13 5,241 93 2,478 46.5 20 245 33,324 36,377 1,819 14,826 33,324 36,377 64,05,118 19860.2 18467.2 19395.8
Jul-13 5,249 92 2,339 43.8 23 343 37,643 41,535 1,806 12,118 37,643 41,535 62,63,106 20351.1 19126.8 19345.7
Aug-13 5,257 92 2,372 44.3 20 340 35,412 40,876 2,044 12,014 35,412 40,876 60,30,078 19569.2 17448.7 18619.7
Sep-13 5,267 92 2,389 44.6 20 319 36,376 39,898 1,995 12,521 36,376 39,898 63,86,134 20739.7 18166.2 19379.8
Oct-13 5,277 92 2,621 48.8 21 328 40,135 41,018 1,953 12,504 40,135 41,018 68,44,233 21205.4 19264.7 21164.5
Nov-13 5,286 92 2,636 49.0 20 315 36,547 40,768 2,038 12,951 36,547 40,768 68,10,475 21321.5 20137.7 20791.9
Dec-13 5,294 92 2,682 49.8 21 328 42,102 43,566 875 13,288 42,102 43,566 70,44,258 21483.7 20568.7 21170.7
Jan-14 5,305 92 2,691 50.7 23 360 46,995 49,673 2,160 13,784 46,995 49,673 67,44,398 21409.7 20343.8 20513.9
Feb-14 5,319 92 2,791 52.5 19 253 30,742 34,852 1,834 13,777 30,742 34,852 68,93,083 21140.5 19963.1 21120.1
Mar-14 5,336 92 2,841 53.2 21 340 65,057 62,125 2,958 18,292 65,057 62,124 74,15,296 22467.2 20921.0 22386.3
Apr-14 5,355 92 2,877 53.7 18 423 57,043 49,716 2,762 11,742 57,043 49,715 74,94,791 22939.3 22197.5 22417.8
May-14 5,379 92 3,086 57.4 21 713 82,489 92,122 4,387 12,927 82,489 92,122 84,07,834 25375.6 22277.0 24217.3
Jun-14 5,406 92 3,135 58.0 21 700 94,631 84,141 4,007 12,022 94,631 84,141 90,20,000 25725.1 24270.2 25413.8
Jul-14 5,433 92 3,022 55.6 22 631 74,464 75,119 3,415 11,897 74,464 75,119 90,10,270 26300.2 24892.0 25895.0
Aug-14 5,458 92 3,032 55.6 19 498 64,863 53,648 2,824 10,779 64,863 53,648 92,59,481 26674.4 25232.8 26638.1
Sep-14 5,476 92 2,984 54.5 22 699 81,248 82,311 3,741 11,778 81,248 82,310 93,82,249 27355.0 26220.5 26630.5
Oct-14 5,498 92 3,023 55.0 18 434 51,788 51,078 2,838 11,774 51,788 51,078 96,84,691 27894.3 25910.8 27865.8
Nov-14 5,518 92 3,106 56.3 18 545 64,104 67,892 3,772 12,460 64,104 67,892 99,82,564 28822.4 27739.6 28694.0
Dec-14 5,541 92 2,977 53.7 22 594 75,588 67,135 3,052 11,301 75,588 67,135 98,36,377 28809.6 26469.4 27499.4
Source : BSE.
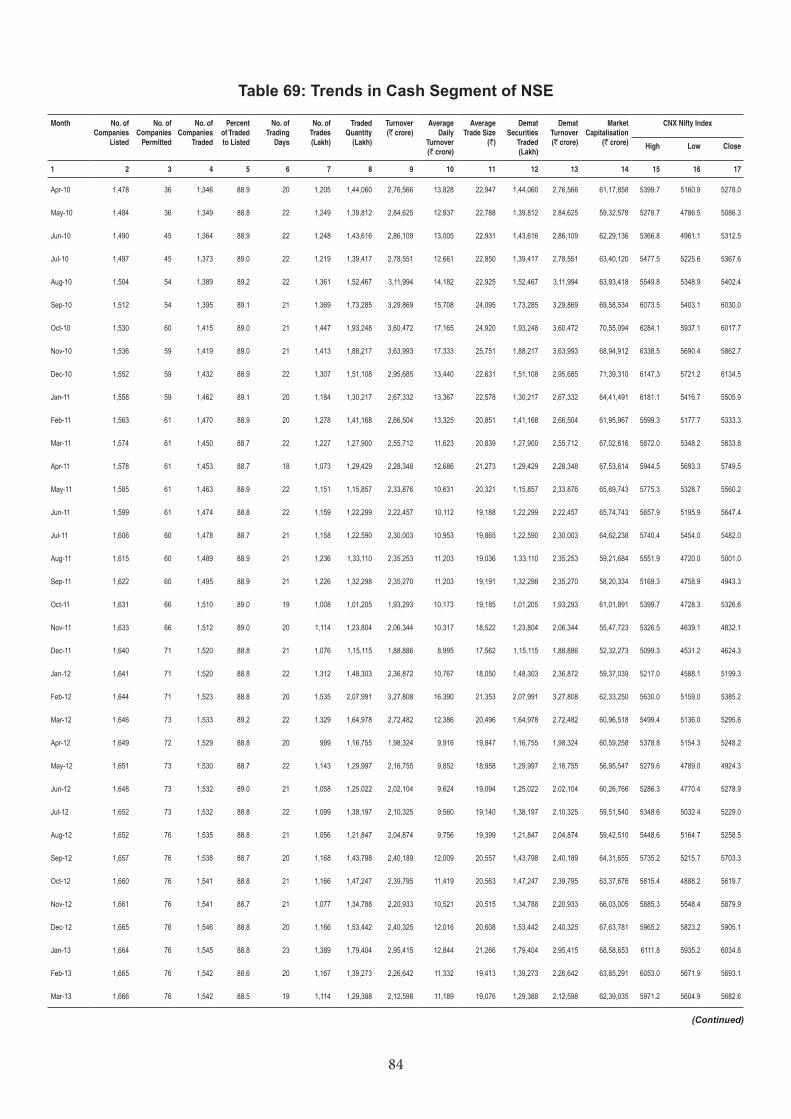
84
Table 69: Trends in Cash Segment of NSE
Month No. of Companies
Listed
No. of Companies
Permitted
No. of Companies
Traded
Percent of Traded to Listed
No. of Trading
Days
No. of Trades (Lakh)
Traded Quantity
(Lakh)
Turnover (` crore)
Average Daily
Turnover (` crore)
Average Trade Size
(`)
Demat Securities
Traded (Lakh)
Demat Turnover (` crore)
Market Capitalisation
(` crore)
CNX Nifty Index
High Low Close
1 2 3 4 5 6 7 8 9 10 11 12 13 14 15 16 17
Apr-10 1,478 36 1,346 88.9 20 1,205 1,44,060 2,76,566 13,828 22,947 1,44,060 2,76,566 61,17,858 5399.7 5160.9 5278.0
May-10 1,484 36 1,349 88.8 22 1,249 1,39,812 2,84,625 12,937 22,788 1,39,812 2,84,625 59,32,578 5278.7 4786.5 5086.3
Jun-10 1,490 45 1,364 88.9 22 1,248 1,43,616 2,86,109 13,005 22,931 1,43,616 2,86,109 62,29,136 5366.8 4961.1 5312.5
Jul-10 1,497 45 1,373 89.0 22 1,219 1,39,417 2,78,551 12,661 22,850 1,39,417 2,78,551 63,40,120 5477.5 5225.6 5367.6
Aug-10 1,504 54 1,389 89.2 22 1,361 1,52,467 3,11,994 14,182 22,925 1,52,467 3,11,994 63,93,418 5549.8 5348.9 5402.4
Sep-10 1,512 54 1,395 89.1 21 1,369 1,73,285 3,29,869 15,708 24,095 1,73,285 3,29,869 69,58,534 6073.5 5403.1 6030.0
Oct-10 1,530 60 1,415 89.0 21 1,447 1,93,248 3,60,472 17,165 24,920 1,93,248 3,60,472 70,55,094 6284.1 5937.1 6017.7
Nov-10 1,536 59 1,419 89.0 21 1,413 1,88,217 3,63,993 17,333 25,751 1,88,217 3,63,993 68,94,912 6338.5 5690.4 5862.7
Dec-10 1,552 59 1,432 88.9 22 1,307 1,51,108 2,95,685 13,440 22,631 1,51,108 2,95,685 71,39,310 6147.3 5721.2 6134.5
Jan-11 1,558 59 1,462 89.1 20 1,184 1,30,217 2,67,332 13,367 22,578 1,30,217 2,67,332 64,41,491 6181.1 5416.7 5505.9
Feb-11 1,563 61 1,470 88.9 20 1,278 1,41,168 2,66,504 13,325 20,851 1,41,168 2,66,504 61,95,967 5599.3 5177.7 5333.3
Mar-11 1,574 61 1,450 88.7 22 1,227 1,27,900 2,55,712 11,623 20,839 1,27,900 2,55,712 67,02,616 5872.0 5348.2 5833.8
Apr-11 1,578 61 1,453 88.7 18 1,073 1,29,429 2,28,348 12,686 21,273 1,29,429 2,28,348 67,53,614 5944.5 5693.3 5749.5
May-11 1,585 61 1,463 88.9 22 1,151 1,15,857 2,33,876 10,631 20,321 1,15,857 2,33,876 65,69,743 5775.3 5328.7 5560.2
Jun-11 1,599 61 1,474 88.8 22 1,159 1,22,299 2,22,457 10,112 19,188 1,22,299 2,22,457 65,74,743 5657.9 5195.9 5647.4
Jul-11 1,606 60 1,478 88.7 21 1,158 1,22,590 2,30,003 10,953 19,865 1,22,590 2,30,003 64,62,238 5740.4 5454.0 5482.0
Aug-11 1,615 60 1,489 88.9 21 1,236 1,33,110 2,35,253 11,203 19,036 1,33,110 2,35,253 59,21,684 5551.9 4720.0 5001.0
Sep-11 1,622 60 1,495 88.9 21 1,226 1,32,298 2,35,270 11,203 19,191 1,32,298 2,35,270 58,20,334 5169.3 4758.9 4943.3
Oct-11 1,631 66 1,510 89.0 19 1,008 1,01,205 1,93,293 10,173 19,185 1,01,205 1,93,293 61,01,891 5399.7 4728.3 5326.6
Nov-11 1,633 66 1,512 89.0 20 1,114 1,23,804 2,06,344 10,317 18,522 1,23,804 2,06,344 55,47,723 5326.5 4639.1 4832.1
Dec-11 1,640 71 1,520 88.8 21 1,076 1,15,115 1,88,886 8,995 17,562 1,15,115 1,88,886 52,32,273 5099.3 4531.2 4624.3
Jan-12 1,641 71 1,520 88.8 22 1,312 1,48,303 2,36,872 10,767 18,050 1,48,303 2,36,872 59,37,039 5217.0 4588.1 5199.3
Feb-12 1,644 71 1,523 88.8 20 1,535 2,07,991 3,27,808 16,390 21,353 2,07,991 3,27,808 62,33,250 5630.0 5159.0 5385.2
Mar-12 1,646 73 1,533 89.2 22 1,329 1,64,978 2,72,482 12,386 20,496 1,64,978 2,72,482 60,96,518 5499.4 5136.0 5295.6
Apr-12 1,649 72 1,529 88.8 20 999 1,16,755 1,98,324 9,916 19,847 1,16,755 1,98,324 60,59,258 5378.8 5154.3 5248.2
May-12 1,651 73 1,530 88.7 22 1,143 1,29,997 2,16,755 9,852 18,958 1,29,997 2,16,755 56,95,547 5279.6 4789.0 4924.3
Jun-12 1,648 73 1,532 89.0 21 1,058 1,25,022 2,02,104 9,624 19,094 1,25,022 2,02,104 60,26,766 5286.3 4770.4 5278.9
Jul-12 1,652 73 1,532 88.8 22 1,099 1,38,197 2,10,325 9,560 19,140 1,38,197 2,10,325 59,51,540 5348.6 5032.4 5229.0
Aug-12 1,652 76 1,535 88.8 21 1,056 1,21,847 2,04,874 9,756 19,399 1,21,847 2,04,874 59,42,510 5448.6 5164.7 5258.5
Sep-12 1,657 76 1,538 88.7 20 1,168 1,43,798 2,40,189 12,009 20,557 1,43,798 2,40,189 64,31,655 5735.2 5215.7 5703.3
Oct-12 1,660 76 1,541 88.8 21 1,166 1,47,247 2,39,795 11,419 20,563 1,47,247 2,39,795 63,37,676 5815.4 4888.2 5619.7
Nov-12 1,661 76 1,541 88.7 21 1,077 1,34,788 2,20,933 10,521 20,515 1,34,788 2,20,933 66,03,005 5885.3 5548.4 5879.9
Dec-12 1,665 76 1,546 88.8 20 1,166 1,53,442 2,40,325 12,016 20,608 1,53,442 2,40,325 67,63,781 5965.2 5823.2 5905.1
Jan-13 1,664 76 1,545 88.8 23 1,389 1,79,404 2,95,415 12,844 21,266 1,79,404 2,95,415 68,58,653 6111.8 5935.2 6034.8
Feb-13 1,665 76 1,542 88.6 20 1,167 1,39,273 2,26,642 11,332 19,413 1,39,273 2,26,642 63,85,291 6053.0 5671.9 5693.1
Mar-13 1,666 76 1,542 88.5 19 1,114 1,29,388 2,12,598 11,189 19,076 1,29,388 2,12,598 62,39,035 5971.2 5604.9 5682.6
(Continued)
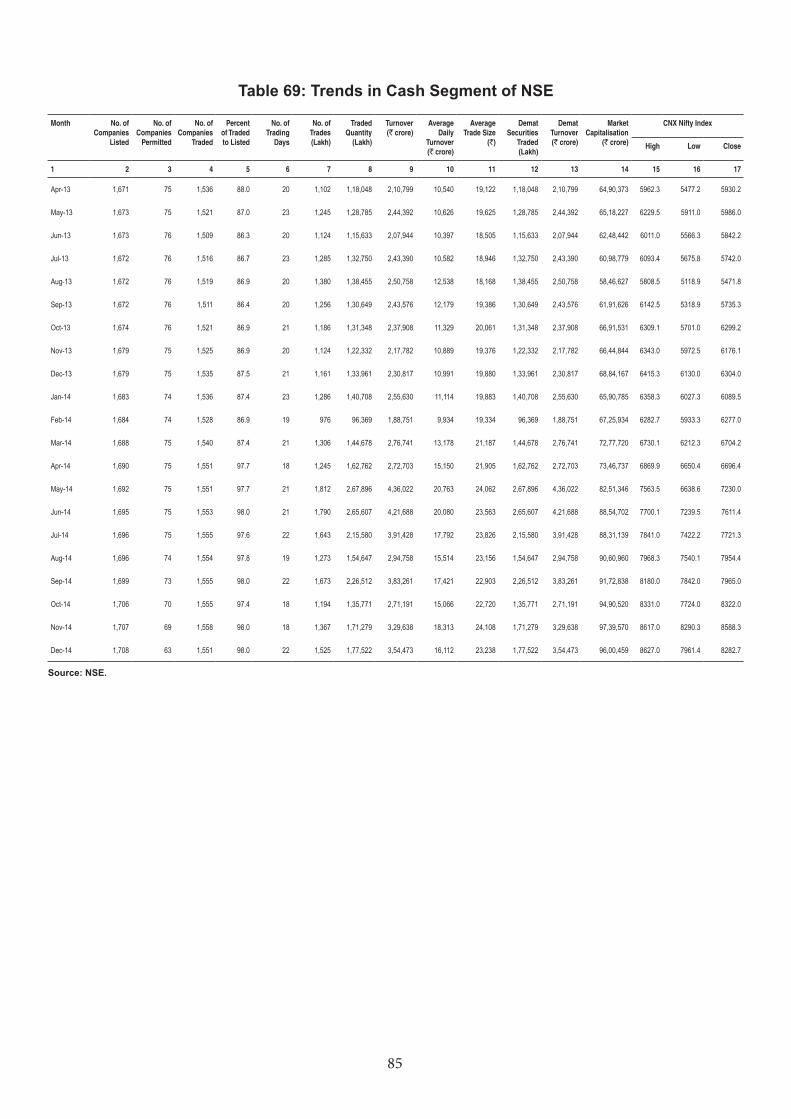
85
Table 69: Trends in Cash Segment of NSE
Month No. of Companies
Listed
No. of Companies
Permitted
No. of Companies
Traded
Percent of Traded to Listed
No. of Trading
Days
No. of Trades (Lakh)
Traded Quantity
(Lakh)
Turnover (` crore)
Average Daily
Turnover (` crore)
Average Trade Size
(`)
Demat Securities
Traded (Lakh)
Demat Turnover (` crore)
Market Capitalisation
(` crore)
CNX Nifty Index
High Low Close
1 2 3 4 5 6 7 8 9 10 11 12 13 14 15 16 17
Apr-13 1,671 75 1,536 88.0 20 1,102 1,18,048 2,10,799 10,540 19,122 1,18,048 2,10,799 64,90,373 5962.3 5477.2 5930.2
May-13 1,673 75 1,521 87.0 23 1,245 1,28,785 2,44,392 10,626 19,625 1,28,785 2,44,392 65,18,227 6229.5 5911.0 5986.0
Jun-13 1,673 76 1,509 86.3 20 1,124 1,15,633 2,07,944 10,397 18,505 1,15,633 2,07,944 62,48,442 6011.0 5566.3 5842.2
Jul-13 1,672 76 1,516 86.7 23 1,285 1,32,750 2,43,390 10,582 18,946 1,32,750 2,43,390 60,98,779 6093.4 5675.8 5742.0
Aug-13 1,672 76 1,519 86.9 20 1,380 1,38,455 2,50,758 12,538 18,168 1,38,455 2,50,758 58,46,627 5808.5 5118.9 5471.8
Sep-13 1,672 76 1,511 86.4 20 1,256 1,30,649 2,43,576 12,179 19,386 1,30,649 2,43,576 61,91,626 6142.5 5318.9 5735.3
Oct-13 1,674 76 1,521 86.9 21 1,186 1,31,348 2,37,908 11,329 20,061 1,31,348 2,37,908 66,91,531 6309.1 5701.0 6299.2
Nov-13 1,679 75 1,525 86.9 20 1,124 1,22,332 2,17,782 10,889 19,376 1,22,332 2,17,782 66,44,844 6343.0 5972.5 6176.1
Dec-13 1,679 75 1,535 87.5 21 1,161 1,33,961 2,30,817 10,991 19,880 1,33,961 2,30,817 68,84,167 6415.3 6130.0 6304.0
Jan-14 1,683 74 1,536 87.4 23 1,286 1,40,708 2,55,630 11,114 19,883 1,40,708 2,55,630 65,90,785 6358.3 6027.3 6089.5
Feb-14 1,684 74 1,528 86.9 19 976 96,369 1,88,751 9,934 19,334 96,369 1,88,751 67,25,934 6282.7 5933.3 6277.0
Mar-14 1,688 75 1,540 87.4 21 1,306 1,44,678 2,76,741 13,178 21,187 1,44,678 2,76,741 72,77,720 6730.1 6212.3 6704.2
Apr-14 1,690 75 1,551 97.7 18 1,245 1,62,762 2,72,703 15,150 21,905 1,62,762 2,72,703 73,46,737 6869.9 6650.4 6696.4
May-14 1,692 75 1,551 97.7 21 1,812 2,67,896 4,36,022 20,763 24,062 2,67,896 4,36,022 82,51,346 7563.5 6638.6 7230.0
Jun-14 1,695 75 1,553 98.0 21 1,790 2,65,607 4,21,688 20,080 23,563 2,65,607 4,21,688 88,54,702 7700.1 7239.5 7611.4
Jul-14 1,696 75 1,555 97.6 22 1,643 2,15,580 3,91,428 17,792 23,826 2,15,580 3,91,428 88,31,139 7841.0 7422.2 7721.3
Aug-14 1,696 74 1,554 97.8 19 1,273 1,54,647 2,94,758 15,514 23,156 1,54,647 2,94,758 90,60,960 7968.3 7540.1 7954.4
Sep-14 1,699 73 1,555 98.0 22 1,673 2,26,512 3,83,261 17,421 22,903 2,26,512 3,83,261 91,72,838 8180.0 7842.0 7965.0
Oct-14 1,706 70 1,555 97.4 18 1,194 1,35,771 2,71,191 15,066 22,720 1,35,771 2,71,191 94,90,520 8331.0 7724.0 8322.0
Nov-14 1,707 69 1,558 98.0 18 1,367 1,71,279 3,29,638 18,313 24,108 1,71,279 3,29,638 97,39,570 8617.0 8290.3 8588.3
Dec-14 1,708 63 1,551 98.0 22 1,525 1,77,522 3,54,473 16,112 23,238 1,77,522 3,54,473 96,00,459 8627.0 7961.4 8282.7
Source: NSE.
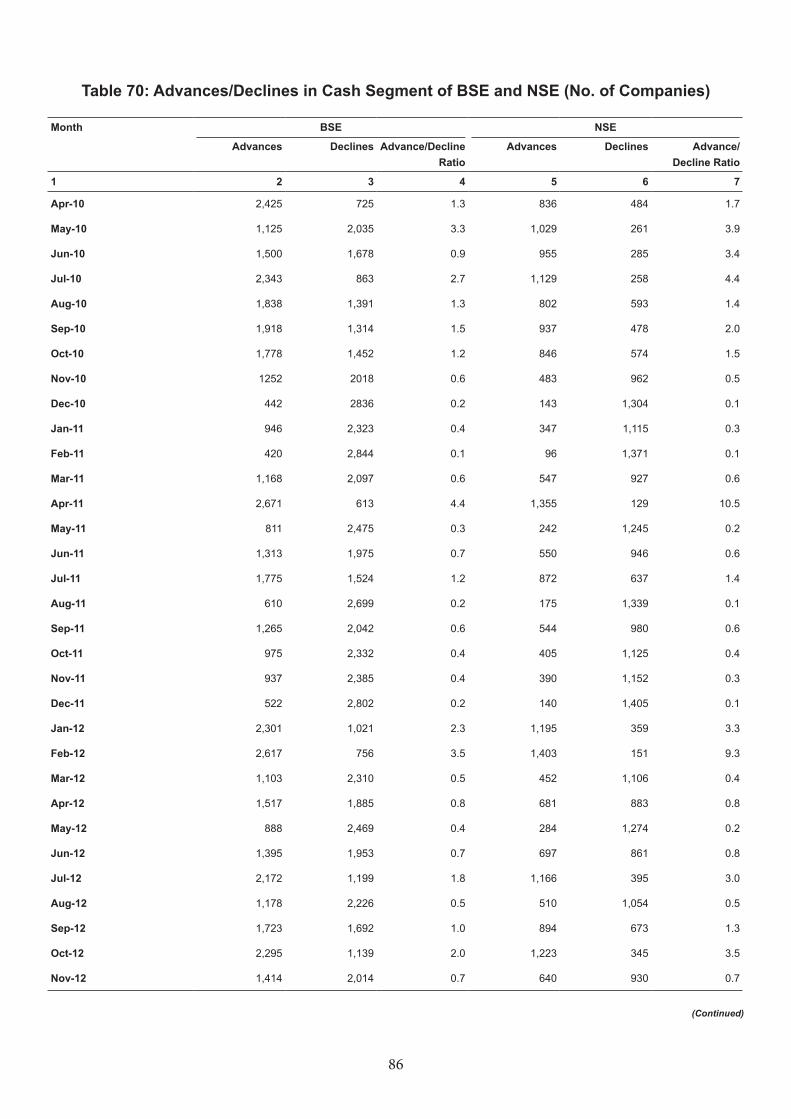
86
Table 70: Advances/Declines in Cash Segment of BSE and NSE (No. of Companies)
Month BSE NSE
Advances Declines Advance/Decline Ratio
Advances Declines Advance/ Decline Ratio
1 2 3 4 5 6 7
Apr-10 2,425 725 1.3 836 484 1.7
May-10 1,125 2,035 3.3 1,029 261 3.9
Jun-10 1,500 1,678 0.9 955 285 3.4
Jul-10 2,343 863 2.7 1,129 258 4.4
Aug-10 1,838 1,391 1.3 802 593 1.4
Sep-10 1,918 1,314 1.5 937 478 2.0
Oct-10 1,778 1,452 1.2 846 574 1.5
Nov-10 1252 2018 0.6 483 962 0.5
Dec-10 442 2836 0.2 143 1,304 0.1
Jan-11 946 2,323 0.4 347 1,115 0.3
Feb-11 420 2,844 0.1 96 1,371 0.1
Mar-11 1,168 2,097 0.6 547 927 0.6
Apr-11 2,671 613 4.4 1,355 129 10.5
May-11 811 2,475 0.3 242 1,245 0.2
Jun-11 1,313 1,975 0.7 550 946 0.6
Jul-11 1,775 1,524 1.2 872 637 1.4
Aug-11 610 2,699 0.2 175 1,339 0.1
Sep-11 1,265 2,042 0.6 544 980 0.6
Oct-11 975 2,332 0.4 405 1,125 0.4
Nov-11 937 2,385 0.4 390 1,152 0.3
Dec-11 522 2,802 0.2 140 1,405 0.1
Jan-12 2,301 1,021 2.3 1,195 359 3.3
Feb-12 2,617 756 3.5 1,403 151 9.3
Mar-12 1,103 2,310 0.5 452 1,106 0.4
Apr-12 1,517 1,885 0.8 681 883 0.8
May-12 888 2,469 0.4 284 1,274 0.2
Jun-12 1,395 1,953 0.7 697 861 0.8
Jul-12 2,172 1,199 1.8 1,166 395 3.0
Aug-12 1,178 2,226 0.5 510 1,054 0.5
Sep-12 1,723 1,692 1.0 894 673 1.3
Oct-12 2,295 1,139 2.0 1,223 345 3.5
Nov-12 1,414 2,014 0.7 640 930 0.7
(Continued)
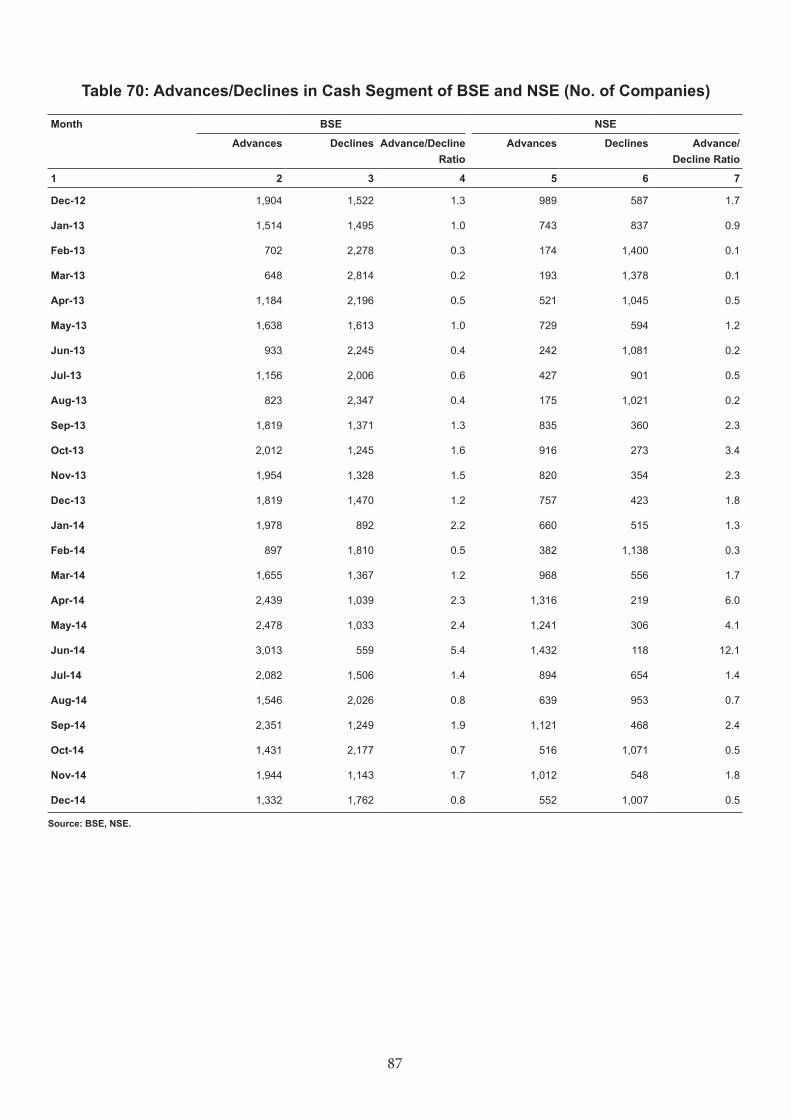
87
Table 70: Advances/Declines in Cash Segment of BSE and NSE (No. of Companies)
Month BSE NSE
Advances Declines Advance/Decline Ratio
Advances Declines Advance/ Decline Ratio
1 2 3 4 5 6 7
Dec-12 1,904 1,522 1.3 989 587 1.7
Jan-13 1,514 1,495 1.0 743 837 0.9
Feb-13 702 2,278 0.3 174 1,400 0.1
Mar-13 648 2,814 0.2 193 1,378 0.1
Apr-13 1,184 2,196 0.5 521 1,045 0.5
May-13 1,638 1,613 1.0 729 594 1.2
Jun-13 933 2,245 0.4 242 1,081 0.2
Jul-13 1,156 2,006 0.6 427 901 0.5
Aug-13 823 2,347 0.4 175 1,021 0.2
Sep-13 1,819 1,371 1.3 835 360 2.3
Oct-13 2,012 1,245 1.6 916 273 3.4
Nov-13 1,954 1,328 1.5 820 354 2.3
Dec-13 1,819 1,470 1.2 757 423 1.8
Jan-14 1,978 892 2.2 660 515 1.3
Feb-14 897 1,810 0.5 382 1,138 0.3
Mar-14 1,655 1,367 1.2 968 556 1.7
Apr-14 2,439 1,039 2.3 1,316 219 6.0
May-14 2,478 1,033 2.4 1,241 306 4.1
Jun-14 3,013 559 5.4 1,432 118 12.1
Jul-14 2,082 1,506 1.4 894 654 1.4
Aug-14 1,546 2,026 0.8 639 953 0.7
Sep-14 2,351 1,249 1.9 1,121 468 2.4
Oct-14 1,431 2,177 0.7 516 1,071 0.5
Nov-14 1,944 1,143 1.7 1,012 548 1.8
Dec-14 1,332 1,762 0.8 552 1,007 0.5
Source: BSE, NSE.
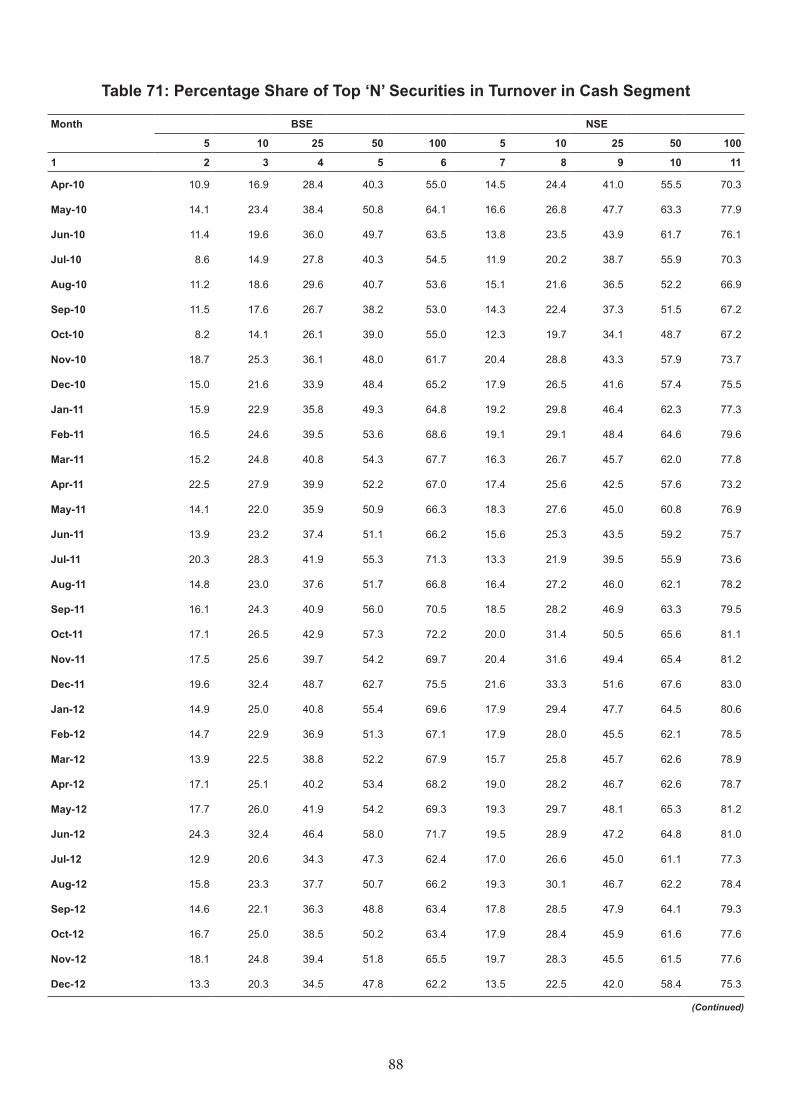
88
Table 71: Percentage Share of Top ‘N’ Securities in Turnover in Cash Segment
Month BSE NSE
5 10 25 50 100 5 10 25 50 100
1 2 3 4 5 6 7 8 9 10 11
Apr-10 10.9 16.9 28.4 40.3 55.0 14.5 24.4 41.0 55.5 70.3
May-10 14.1 23.4 38.4 50.8 64.1 16.6 26.8 47.7 63.3 77.9
Jun-10 11.4 19.6 36.0 49.7 63.5 13.8 23.5 43.9 61.7 76.1
Jul-10 8.6 14.9 27.8 40.3 54.5 11.9 20.2 38.7 55.9 70.3
Aug-10 11.2 18.6 29.6 40.7 53.6 15.1 21.6 36.5 52.2 66.9
Sep-10 11.5 17.6 26.7 38.2 53.0 14.3 22.4 37.3 51.5 67.2
Oct-10 8.2 14.1 26.1 39.0 55.0 12.3 19.7 34.1 48.7 67.2
Nov-10 18.7 25.3 36.1 48.0 61.7 20.4 28.8 43.3 57.9 73.7
Dec-10 15.0 21.6 33.9 48.4 65.2 17.9 26.5 41.6 57.4 75.5
Jan-11 15.9 22.9 35.8 49.3 64.8 19.2 29.8 46.4 62.3 77.3
Feb-11 16.5 24.6 39.5 53.6 68.6 19.1 29.1 48.4 64.6 79.6
Mar-11 15.2 24.8 40.8 54.3 67.7 16.3 26.7 45.7 62.0 77.8
Apr-11 22.5 27.9 39.9 52.2 67.0 17.4 25.6 42.5 57.6 73.2
May-11 14.1 22.0 35.9 50.9 66.3 18.3 27.6 45.0 60.8 76.9
Jun-11 13.9 23.2 37.4 51.1 66.2 15.6 25.3 43.5 59.2 75.7
Jul-11 20.3 28.3 41.9 55.3 71.3 13.3 21.9 39.5 55.9 73.6
Aug-11 14.8 23.0 37.6 51.7 66.8 16.4 27.2 46.0 62.1 78.2
Sep-11 16.1 24.3 40.9 56.0 70.5 18.5 28.2 46.9 63.3 79.5
Oct-11 17.1 26.5 42.9 57.3 72.2 20.0 31.4 50.5 65.6 81.1
Nov-11 17.5 25.6 39.7 54.2 69.7 20.4 31.6 49.4 65.4 81.2
Dec-11 19.6 32.4 48.7 62.7 75.5 21.6 33.3 51.6 67.6 83.0
Jan-12 14.9 25.0 40.8 55.4 69.6 17.9 29.4 47.7 64.5 80.6
Feb-12 14.7 22.9 36.9 51.3 67.1 17.9 28.0 45.5 62.1 78.5
Mar-12 13.9 22.5 38.8 52.2 67.9 15.7 25.8 45.7 62.6 78.9
Apr-12 17.1 25.1 40.2 53.4 68.2 19.0 28.2 46.7 62.6 78.7
May-12 17.7 26.0 41.9 54.2 69.3 19.3 29.7 48.1 65.3 81.2
Jun-12 24.3 32.4 46.4 58.0 71.7 19.5 28.9 47.2 64.8 81.0
Jul-12 12.9 20.6 34.3 47.3 62.4 17.0 26.6 45.0 61.1 77.3
Aug-12 15.8 23.3 37.7 50.7 66.2 19.3 30.1 46.7 62.2 78.4
Sep-12 14.6 22.1 36.3 48.8 63.4 17.8 28.5 47.9 64.1 79.3
Oct-12 16.7 25.0 38.5 50.2 63.4 17.9 28.4 45.9 61.6 77.6
Nov-12 18.1 24.8 39.4 51.8 65.5 19.7 28.3 45.5 61.5 77.6
Dec-12 13.3 20.3 34.5 47.8 62.2 13.5 22.5 42.0 58.4 75.3
(Continued)
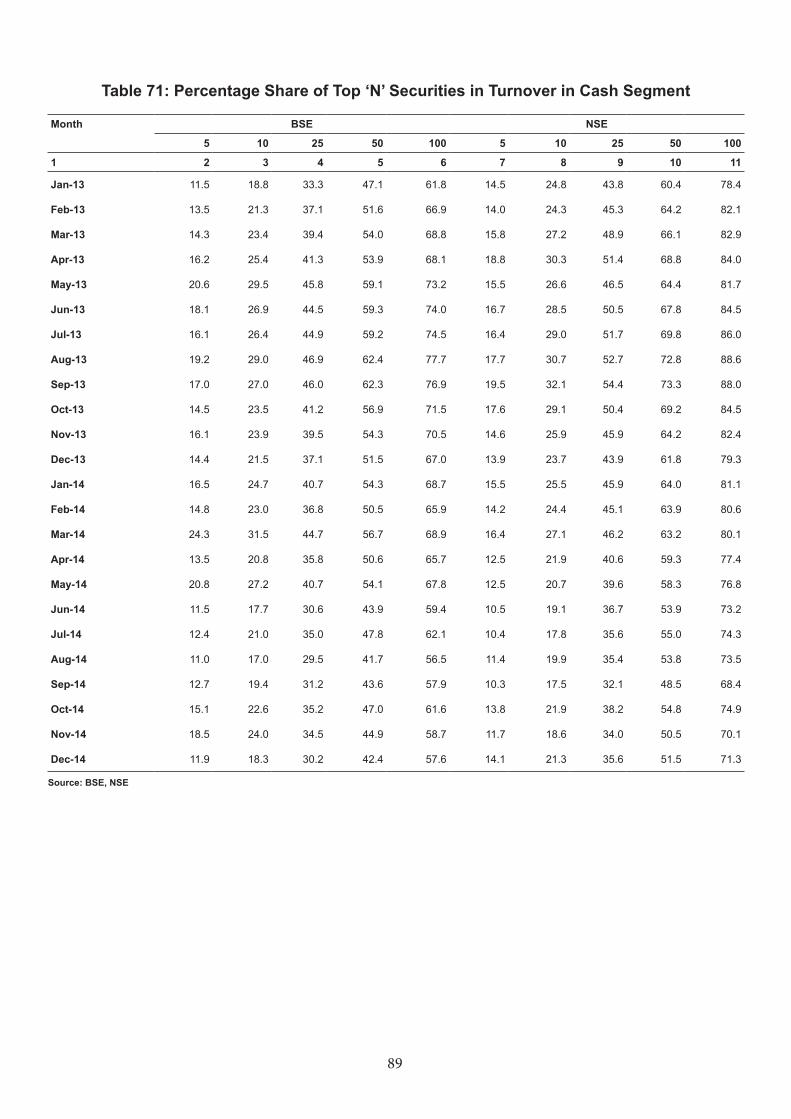
89
Table 71: Percentage Share of Top ‘N’ Securities in Turnover in Cash Segment
Month BSE NSE
5 10 25 50 100 5 10 25 50 100
1 2 3 4 5 6 7 8 9 10 11
Jan-13 11.5 18.8 33.3 47.1 61.8 14.5 24.8 43.8 60.4 78.4
Feb-13 13.5 21.3 37.1 51.6 66.9 14.0 24.3 45.3 64.2 82.1
Mar-13 14.3 23.4 39.4 54.0 68.8 15.8 27.2 48.9 66.1 82.9
Apr-13 16.2 25.4 41.3 53.9 68.1 18.8 30.3 51.4 68.8 84.0
May-13 20.6 29.5 45.8 59.1 73.2 15.5 26.6 46.5 64.4 81.7
Jun-13 18.1 26.9 44.5 59.3 74.0 16.7 28.5 50.5 67.8 84.5
Jul-13 16.1 26.4 44.9 59.2 74.5 16.4 29.0 51.7 69.8 86.0
Aug-13 19.2 29.0 46.9 62.4 77.7 17.7 30.7 52.7 72.8 88.6
Sep-13 17.0 27.0 46.0 62.3 76.9 19.5 32.1 54.4 73.3 88.0
Oct-13 14.5 23.5 41.2 56.9 71.5 17.6 29.1 50.4 69.2 84.5
Nov-13 16.1 23.9 39.5 54.3 70.5 14.6 25.9 45.9 64.2 82.4
Dec-13 14.4 21.5 37.1 51.5 67.0 13.9 23.7 43.9 61.8 79.3
Jan-14 16.5 24.7 40.7 54.3 68.7 15.5 25.5 45.9 64.0 81.1
Feb-14 14.8 23.0 36.8 50.5 65.9 14.2 24.4 45.1 63.9 80.6
Mar-14 24.3 31.5 44.7 56.7 68.9 16.4 27.1 46.2 63.2 80.1
Apr-14 13.5 20.8 35.8 50.6 65.7 12.5 21.9 40.6 59.3 77.4
May-14 20.8 27.2 40.7 54.1 67.8 12.5 20.7 39.6 58.3 76.8
Jun-14 11.5 17.7 30.6 43.9 59.4 10.5 19.1 36.7 53.9 73.2
Jul-14 12.4 21.0 35.0 47.8 62.1 10.4 17.8 35.6 55.0 74.3
Aug-14 11.0 17.0 29.5 41.7 56.5 11.4 19.9 35.4 53.8 73.5
Sep-14 12.7 19.4 31.2 43.6 57.9 10.3 17.5 32.1 48.5 68.4
Oct-14 15.1 22.6 35.2 47.0 61.6 13.8 21.9 38.2 54.8 74.9
Nov-14 18.5 24.0 34.5 44.9 58.7 11.7 18.6 34.0 50.5 70.1
Dec-14 11.9 18.3 30.2 42.4 57.6 14.1 21.3 35.6 51.5 71.3
Source: BSE, NSE
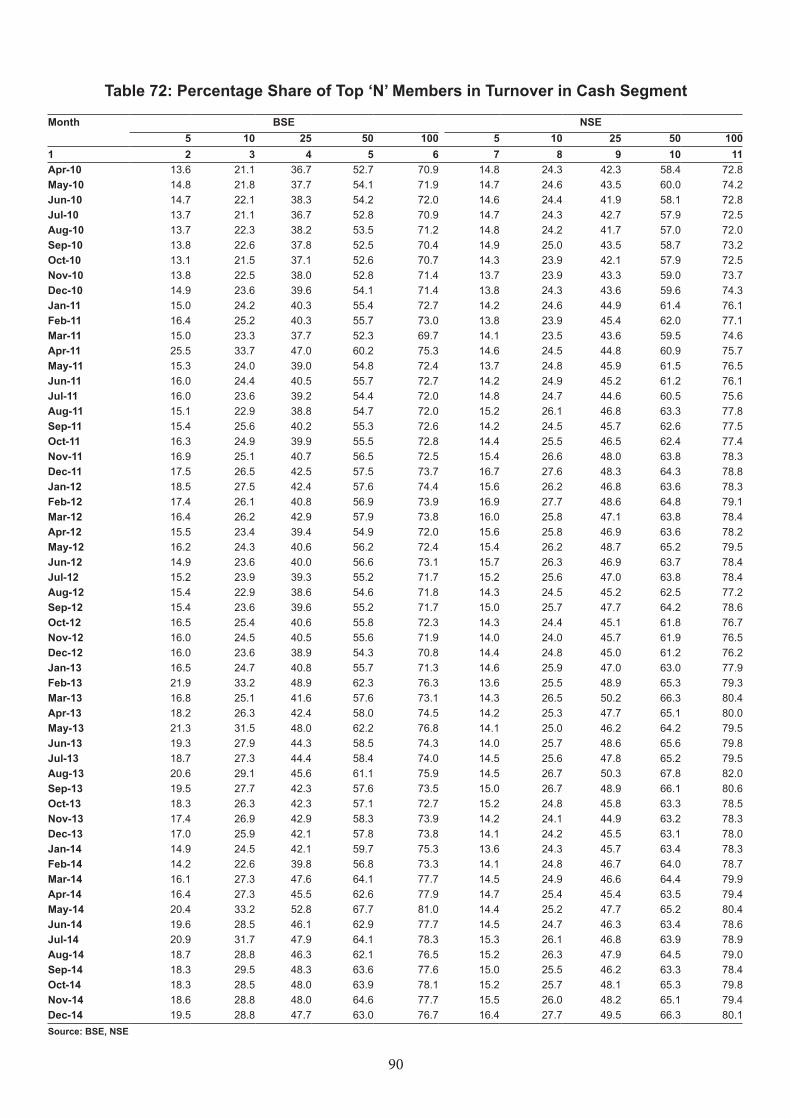
90
Table 72: Percentage Share of Top ‘N’ Members in Turnover in Cash Segment
Month BSE NSE5 10 25 50 100 5 10 25 50 100
1 2 3 4 5 6 7 8 9 10 11Apr-10 13.6 21.1 36.7 52.7 70.9 14.8 24.3 42.3 58.4 72.8May-10 14.8 21.8 37.7 54.1 71.9 14.7 24.6 43.5 60.0 74.2Jun-10 14.7 22.1 38.3 54.2 72.0 14.6 24.4 41.9 58.1 72.8Jul-10 13.7 21.1 36.7 52.8 70.9 14.7 24.3 42.7 57.9 72.5Aug-10 13.7 22.3 38.2 53.5 71.2 14.8 24.2 41.7 57.0 72.0Sep-10 13.8 22.6 37.8 52.5 70.4 14.9 25.0 43.5 58.7 73.2Oct-10 13.1 21.5 37.1 52.6 70.7 14.3 23.9 42.1 57.9 72.5Nov-10 13.8 22.5 38.0 52.8 71.4 13.7 23.9 43.3 59.0 73.7Dec-10 14.9 23.6 39.6 54.1 71.4 13.8 24.3 43.6 59.6 74.3Jan-11 15.0 24.2 40.3 55.4 72.7 14.2 24.6 44.9 61.4 76.1Feb-11 16.4 25.2 40.3 55.7 73.0 13.8 23.9 45.4 62.0 77.1Mar-11 15.0 23.3 37.7 52.3 69.7 14.1 23.5 43.6 59.5 74.6Apr-11 25.5 33.7 47.0 60.2 75.3 14.6 24.5 44.8 60.9 75.7May-11 15.3 24.0 39.0 54.8 72.4 13.7 24.8 45.9 61.5 76.5Jun-11 16.0 24.4 40.5 55.7 72.7 14.2 24.9 45.2 61.2 76.1Jul-11 16.0 23.6 39.2 54.4 72.0 14.8 24.7 44.6 60.5 75.6Aug-11 15.1 22.9 38.8 54.7 72.0 15.2 26.1 46.8 63.3 77.8Sep-11 15.4 25.6 40.2 55.3 72.6 14.2 24.5 45.7 62.6 77.5Oct-11 16.3 24.9 39.9 55.5 72.8 14.4 25.5 46.5 62.4 77.4Nov-11 16.9 25.1 40.7 56.5 72.5 15.4 26.6 48.0 63.8 78.3Dec-11 17.5 26.5 42.5 57.5 73.7 16.7 27.6 48.3 64.3 78.8Jan-12 18.5 27.5 42.4 57.6 74.4 15.6 26.2 46.8 63.6 78.3Feb-12 17.4 26.1 40.8 56.9 73.9 16.9 27.7 48.6 64.8 79.1Mar-12 16.4 26.2 42.9 57.9 73.8 16.0 25.8 47.1 63.8 78.4Apr-12 15.5 23.4 39.4 54.9 72.0 15.6 25.8 46.9 63.6 78.2May-12 16.2 24.3 40.6 56.2 72.4 15.4 26.2 48.7 65.2 79.5Jun-12 14.9 23.6 40.0 56.6 73.1 15.7 26.3 46.9 63.7 78.4Jul-12 15.2 23.9 39.3 55.2 71.7 15.2 25.6 47.0 63.8 78.4Aug-12 15.4 22.9 38.6 54.6 71.8 14.3 24.5 45.2 62.5 77.2Sep-12 15.4 23.6 39.6 55.2 71.7 15.0 25.7 47.7 64.2 78.6Oct-12 16.5 25.4 40.6 55.8 72.3 14.3 24.4 45.1 61.8 76.7Nov-12 16.0 24.5 40.5 55.6 71.9 14.0 24.0 45.7 61.9 76.5Dec-12 16.0 23.6 38.9 54.3 70.8 14.4 24.8 45.0 61.2 76.2Jan-13 16.5 24.7 40.8 55.7 71.3 14.6 25.9 47.0 63.0 77.9Feb-13 21.9 33.2 48.9 62.3 76.3 13.6 25.5 48.9 65.3 79.3Mar-13 16.8 25.1 41.6 57.6 73.1 14.3 26.5 50.2 66.3 80.4Apr-13 18.2 26.3 42.4 58.0 74.5 14.2 25.3 47.7 65.1 80.0May-13 21.3 31.5 48.0 62.2 76.8 14.1 25.0 46.2 64.2 79.5Jun-13 19.3 27.9 44.3 58.5 74.3 14.0 25.7 48.6 65.6 79.8Jul-13 18.7 27.3 44.4 58.4 74.0 14.5 25.6 47.8 65.2 79.5Aug-13 20.6 29.1 45.6 61.1 75.9 14.5 26.7 50.3 67.8 82.0Sep-13 19.5 27.7 42.3 57.6 73.5 15.0 26.7 48.9 66.1 80.6Oct-13 18.3 26.3 42.3 57.1 72.7 15.2 24.8 45.8 63.3 78.5Nov-13 17.4 26.9 42.9 58.3 73.9 14.2 24.1 44.9 63.2 78.3Dec-13 17.0 25.9 42.1 57.8 73.8 14.1 24.2 45.5 63.1 78.0Jan-14 14.9 24.5 42.1 59.7 75.3 13.6 24.3 45.7 63.4 78.3Feb-14 14.2 22.6 39.8 56.8 73.3 14.1 24.8 46.7 64.0 78.7Mar-14 16.1 27.3 47.6 64.1 77.7 14.5 24.9 46.6 64.4 79.9Apr-14 16.4 27.3 45.5 62.6 77.9 14.7 25.4 45.4 63.5 79.4May-14 20.4 33.2 52.8 67.7 81.0 14.4 25.2 47.7 65.2 80.4Jun-14 19.6 28.5 46.1 62.9 77.7 14.5 24.7 46.3 63.4 78.6Jul-14 20.9 31.7 47.9 64.1 78.3 15.3 26.1 46.8 63.9 78.9Aug-14 18.7 28.8 46.3 62.1 76.5 15.2 26.3 47.9 64.5 79.0Sep-14 18.3 29.5 48.3 63.6 77.6 15.0 25.5 46.2 63.3 78.4Oct-14 18.3 28.5 48.0 63.9 78.1 15.2 25.7 48.1 65.3 79.8Nov-14 18.6 28.8 48.0 64.6 77.7 15.5 26.0 48.2 65.1 79.4Dec-14 19.5 28.8 47.7 63.0 76.7 16.4 27.7 49.5 66.3 80.1Source: BSE, NSE
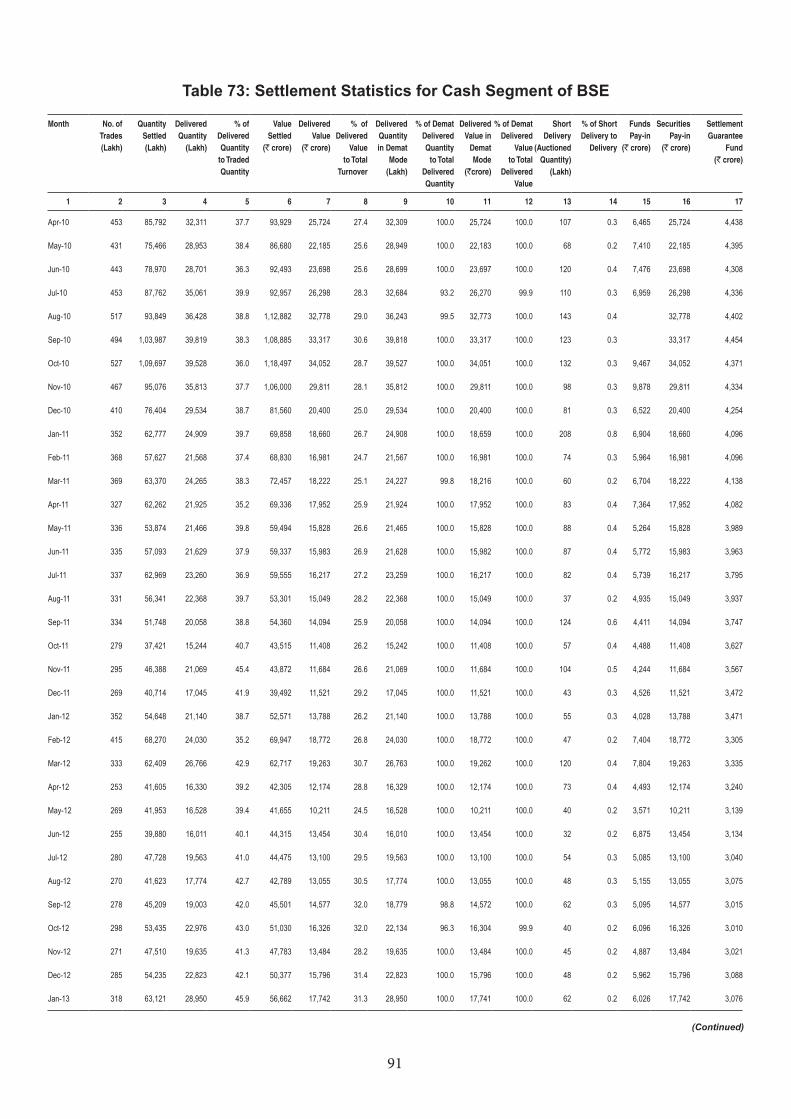
91
Table 73: Settlement Statistics for Cash Segment of BSE
Month No. of Trades (Lakh)
Quantity Settled (Lakh)
Delivered Quantity
(Lakh)
% of Delivered Quantity
to Traded Quantity
Value Settled
(` crore)
Delivered Value
(` crore)
% of Delivered
Value to Total
Turnover
Delivered Quantity in Demat
Mode (Lakh)
% of Demat Delivered Quantity
to Total Delivered Quantity
Delivered Value in
Demat Mode
(`crore)
% of Demat Delivered
Value to Total
Delivered Value
Short Delivery
(Auctioned Quantity)
(Lakh)
% of Short Delivery to
Delivery
Funds Pay-in
(` crore)
Securities Pay-in
(` crore)
Settlement Guarantee
Fund (` crore)
1 2 3 4 5 6 7 8 9 10 11 12 13 14 15 16 17
Apr-10 453 85,792 32,311 37.7 93,929 25,724 27.4 32,309 100.0 25,724 100.0 107 0.3 6,465 25,724 4,438
May-10 431 75,466 28,953 38.4 86,680 22,185 25.6 28,949 100.0 22,183 100.0 68 0.2 7,410 22,185 4,395
Jun-10 443 78,970 28,701 36.3 92,493 23,698 25.6 28,699 100.0 23,697 100.0 120 0.4 7,476 23,698 4,308
Jul-10 453 87,762 35,061 39.9 92,957 26,298 28.3 32,684 93.2 26,270 99.9 110 0.3 6,959 26,298 4,336
Aug-10 517 93,849 36,428 38.8 1,12,882 32,778 29.0 36,243 99.5 32,773 100.0 143 0.4 32,778 4,402
Sep-10 494 1,03,987 39,819 38.3 1,08,885 33,317 30.6 39,818 100.0 33,317 100.0 123 0.3 33,317 4,454
Oct-10 527 1,09,697 39,528 36.0 1,18,497 34,052 28.7 39,527 100.0 34,051 100.0 132 0.3 9,467 34,052 4,371
Nov-10 467 95,076 35,813 37.7 1,06,000 29,811 28.1 35,812 100.0 29,811 100.0 98 0.3 9,878 29,811 4,334
Dec-10 410 76,404 29,534 38.7 81,560 20,400 25.0 29,534 100.0 20,400 100.0 81 0.3 6,522 20,400 4,254
Jan-11 352 62,777 24,909 39.7 69,858 18,660 26.7 24,908 100.0 18,659 100.0 208 0.8 6,904 18,660 4,096
Feb-11 368 57,627 21,568 37.4 68,830 16,981 24.7 21,567 100.0 16,981 100.0 74 0.3 5,964 16,981 4,096
Mar-11 369 63,370 24,265 38.3 72,457 18,222 25.1 24,227 99.8 18,216 100.0 60 0.2 6,704 18,222 4,138
Apr-11 327 62,262 21,925 35.2 69,336 17,952 25.9 21,924 100.0 17,952 100.0 83 0.4 7,364 17,952 4,082
May-11 336 53,874 21,466 39.8 59,494 15,828 26.6 21,465 100.0 15,828 100.0 88 0.4 5,264 15,828 3,989
Jun-11 335 57,093 21,629 37.9 59,337 15,983 26.9 21,628 100.0 15,982 100.0 87 0.4 5,772 15,983 3,963
Jul-11 337 62,969 23,260 36.9 59,555 16,217 27.2 23,259 100.0 16,217 100.0 82 0.4 5,739 16,217 3,795
Aug-11 331 56,341 22,368 39.7 53,301 15,049 28.2 22,368 100.0 15,049 100.0 37 0.2 4,935 15,049 3,937
Sep-11 334 51,748 20,058 38.8 54,360 14,094 25.9 20,058 100.0 14,094 100.0 124 0.6 4,411 14,094 3,747
Oct-11 279 37,421 15,244 40.7 43,515 11,408 26.2 15,242 100.0 11,408 100.0 57 0.4 4,488 11,408 3,627
Nov-11 295 46,388 21,069 45.4 43,872 11,684 26.6 21,069 100.0 11,684 100.0 104 0.5 4,244 11,684 3,567
Dec-11 269 40,714 17,045 41.9 39,492 11,521 29.2 17,045 100.0 11,521 100.0 43 0.3 4,526 11,521 3,472
Jan-12 352 54,648 21,140 38.7 52,571 13,788 26.2 21,140 100.0 13,788 100.0 55 0.3 4,028 13,788 3,471
Feb-12 415 68,270 24,030 35.2 69,947 18,772 26.8 24,030 100.0 18,772 100.0 47 0.2 7,404 18,772 3,305
Mar-12 333 62,409 26,766 42.9 62,717 19,263 30.7 26,763 100.0 19,262 100.0 120 0.4 7,804 19,263 3,335
Apr-12 253 41,605 16,330 39.2 42,305 12,174 28.8 16,329 100.0 12,174 100.0 73 0.4 4,493 12,174 3,240
May-12 269 41,953 16,528 39.4 41,655 10,211 24.5 16,528 100.0 10,211 100.0 40 0.2 3,571 10,211 3,139
Jun-12 255 39,880 16,011 40.1 44,315 13,454 30.4 16,010 100.0 13,454 100.0 32 0.2 6,875 13,454 3,134
Jul-12 280 47,728 19,563 41.0 44,475 13,100 29.5 19,563 100.0 13,100 100.0 54 0.3 5,085 13,100 3,040
Aug-12 270 41,623 17,774 42.7 42,789 13,055 30.5 17,774 100.0 13,055 100.0 48 0.3 5,155 13,055 3,075
Sep-12 278 45,209 19,003 42.0 45,501 14,577 32.0 18,779 98.8 14,572 100.0 62 0.3 5,095 14,577 3,015
Oct-12 298 53,435 22,976 43.0 51,030 16,326 32.0 22,134 96.3 16,304 99.9 40 0.2 6,096 16,326 3,010
Nov-12 271 47,510 19,635 41.3 47,783 13,484 28.2 19,635 100.0 13,484 100.0 45 0.2 4,887 13,484 3,021
Dec-12 285 54,235 22,823 42.1 50,377 15,796 31.4 22,823 100.0 15,796 100.0 48 0.2 5,962 15,796 3,088
Jan-13 318 63,121 28,950 45.9 56,662 17,742 31.3 28,950 100.0 17,741 100.0 62 0.2 6,026 17,742 3,076
(Continued)
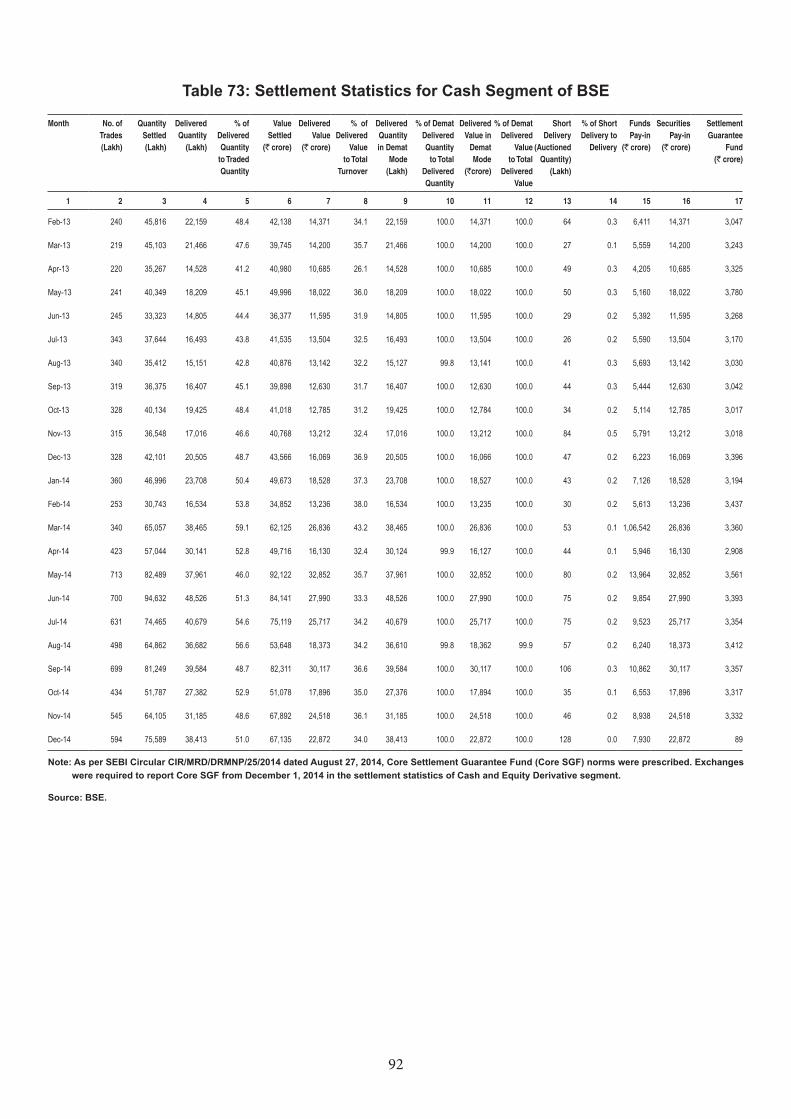
92
Month No. of Trades (Lakh)
Quantity Settled (Lakh)
Delivered Quantity
(Lakh)
% of Delivered Quantity
to Traded Quantity
Value Settled
(` crore)
Delivered Value
(` crore)
% of Delivered
Value to Total
Turnover
Delivered Quantity in Demat
Mode (Lakh)
% of Demat Delivered Quantity
to Total Delivered Quantity
Delivered Value in
Demat Mode
(`crore)
% of Demat Delivered
Value to Total
Delivered Value
Short Delivery
(Auctioned Quantity)
(Lakh)
% of Short Delivery to
Delivery
Funds Pay-in
(` crore)
Securities Pay-in
(` crore)
Settlement Guarantee
Fund (` crore)
1 2 3 4 5 6 7 8 9 10 11 12 13 14 15 16 17
Feb-13 240 45,816 22,159 48.4 42,138 14,371 34.1 22,159 100.0 14,371 100.0 64 0.3 6,411 14,371 3,047
Mar-13 219 45,103 21,466 47.6 39,745 14,200 35.7 21,466 100.0 14,200 100.0 27 0.1 5,559 14,200 3,243
Apr-13 220 35,267 14,528 41.2 40,980 10,685 26.1 14,528 100.0 10,685 100.0 49 0.3 4,205 10,685 3,325
May-13 241 40,349 18,209 45.1 49,996 18,022 36.0 18,209 100.0 18,022 100.0 50 0.3 5,160 18,022 3,780
Jun-13 245 33,323 14,805 44.4 36,377 11,595 31.9 14,805 100.0 11,595 100.0 29 0.2 5,392 11,595 3,268
Jul-13 343 37,644 16,493 43.8 41,535 13,504 32.5 16,493 100.0 13,504 100.0 26 0.2 5,590 13,504 3,170
Aug-13 340 35,412 15,151 42.8 40,876 13,142 32.2 15,127 99.8 13,141 100.0 41 0.3 5,693 13,142 3,030
Sep-13 319 36,375 16,407 45.1 39,898 12,630 31.7 16,407 100.0 12,630 100.0 44 0.3 5,444 12,630 3,042
Oct-13 328 40,134 19,425 48.4 41,018 12,785 31.2 19,425 100.0 12,784 100.0 34 0.2 5,114 12,785 3,017
Nov-13 315 36,548 17,016 46.6 40,768 13,212 32.4 17,016 100.0 13,212 100.0 84 0.5 5,791 13,212 3,018
Dec-13 328 42,101 20,505 48.7 43,566 16,069 36.9 20,505 100.0 16,066 100.0 47 0.2 6,223 16,069 3,396
Jan-14 360 46,996 23,708 50.4 49,673 18,528 37.3 23,708 100.0 18,527 100.0 43 0.2 7,126 18,528 3,194
Feb-14 253 30,743 16,534 53.8 34,852 13,236 38.0 16,534 100.0 13,235 100.0 30 0.2 5,613 13,236 3,437
Mar-14 340 65,057 38,465 59.1 62,125 26,836 43.2 38,465 100.0 26,836 100.0 53 0.1 1,06,542 26,836 3,360
Apr-14 423 57,044 30,141 52.8 49,716 16,130 32.4 30,124 99.9 16,127 100.0 44 0.1 5,946 16,130 2,908
May-14 713 82,489 37,961 46.0 92,122 32,852 35.7 37,961 100.0 32,852 100.0 80 0.2 13,964 32,852 3,561
Jun-14 700 94,632 48,526 51.3 84,141 27,990 33.3 48,526 100.0 27,990 100.0 75 0.2 9,854 27,990 3,393
Jul-14 631 74,465 40,679 54.6 75,119 25,717 34.2 40,679 100.0 25,717 100.0 75 0.2 9,523 25,717 3,354
Aug-14 498 64,862 36,682 56.6 53,648 18,373 34.2 36,610 99.8 18,362 99.9 57 0.2 6,240 18,373 3,412
Sep-14 699 81,249 39,584 48.7 82,311 30,117 36.6 39,584 100.0 30,117 100.0 106 0.3 10,862 30,117 3,357
Oct-14 434 51,787 27,382 52.9 51,078 17,896 35.0 27,376 100.0 17,894 100.0 35 0.1 6,553 17,896 3,317
Nov-14 545 64,105 31,185 48.6 67,892 24,518 36.1 31,185 100.0 24,518 100.0 46 0.2 8,938 24,518 3,332
Dec-14 594 75,589 38,413 51.0 67,135 22,872 34.0 38,413 100.0 22,872 100.0 128 0.0 7,930 22,872 89
Note: As per SEBI Circular CIR/MRD/DRMNP/25/2014 dated August 27, 2014, Core Settlement Guarantee Fund (Core SGF) norms were prescribed. Exchanges were required to report Core SGF from December 1, 2014 in the settlement statistics of Cash and Equity Derivative segment.
Source: BSE.
Table 73: Settlement Statistics for Cash Segment of BSE
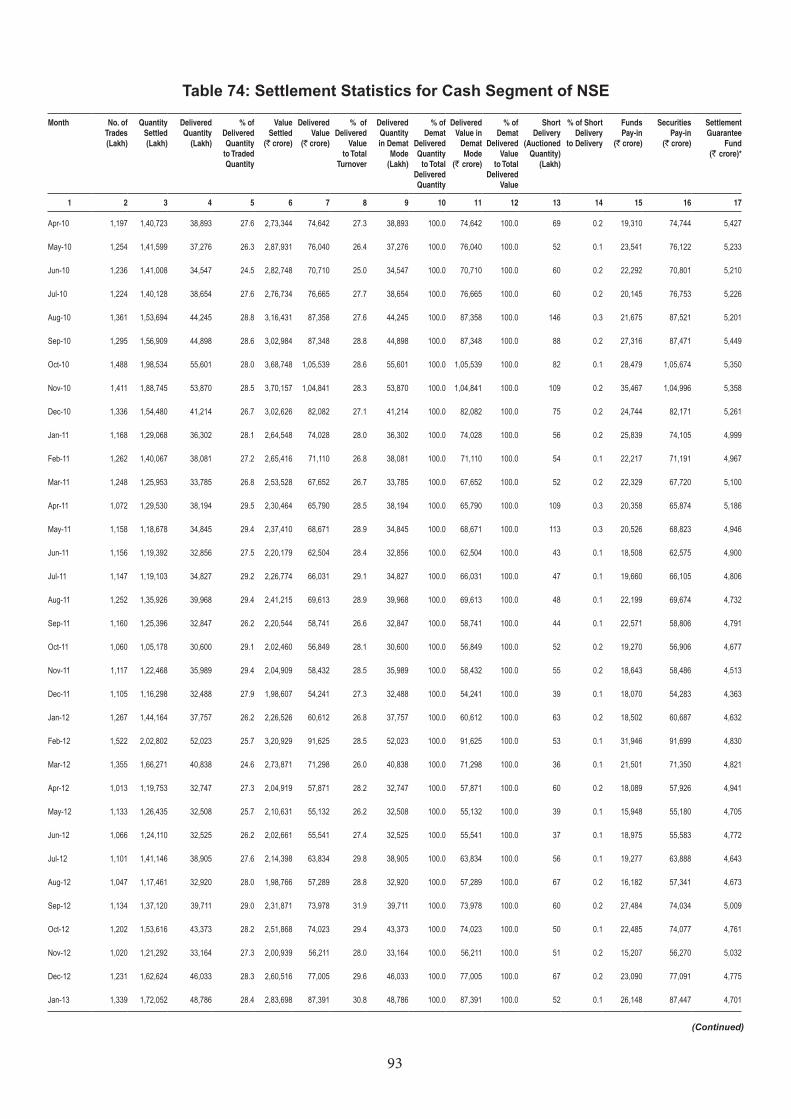
93
Table 74: Settlement Statistics for Cash Segment of NSE
Month No. of Trades (Lakh)
Quantity Settled (Lakh)
Delivered Quantity
(Lakh)
% of Delivered Quantity
to Traded Quantity
Value Settled
(` crore)
Delivered Value
(` crore)
% of Delivered
Value to Total
Turnover
Delivered Quantity in Demat
Mode (Lakh)
% of Demat
Delivered Quantity
to Total Delivered Quantity
Delivered Value in
Demat Mode
(` crore)
% of Demat
Delivered Value
to Total Delivered
Value
Short Delivery
(Auctioned Quantity)
(Lakh)
% of Short Delivery
to Delivery
Funds Pay-in
(` crore)
Securities Pay-in
(` crore)
Settlement Guarantee
Fund (` crore)*
1 2 3 4 5 6 7 8 9 10 11 12 13 14 15 16 17
Apr-10 1,197 1,40,723 38,893 27.6 2,73,344 74,642 27.3 38,893 100.0 74,642 100.0 69 0.2 19,310 74,744 5,427
May-10 1,254 1,41,599 37,276 26.3 2,87,931 76,040 26.4 37,276 100.0 76,040 100.0 52 0.1 23,541 76,122 5,233
Jun-10 1,236 1,41,008 34,547 24.5 2,82,748 70,710 25.0 34,547 100.0 70,710 100.0 60 0.2 22,292 70,801 5,210
Jul-10 1,224 1,40,128 38,654 27.6 2,76,734 76,665 27.7 38,654 100.0 76,665 100.0 60 0.2 20,145 76,753 5,226
Aug-10 1,361 1,53,694 44,245 28.8 3,16,431 87,358 27.6 44,245 100.0 87,358 100.0 146 0.3 21,675 87,521 5,201
Sep-10 1,295 1,56,909 44,898 28.6 3,02,984 87,348 28.8 44,898 100.0 87,348 100.0 88 0.2 27,316 87,471 5,449
Oct-10 1,488 1,98,534 55,601 28.0 3,68,748 1,05,539 28.6 55,601 100.0 1,05,539 100.0 82 0.1 28,479 1,05,674 5,350
Nov-10 1,411 1,88,745 53,870 28.5 3,70,157 1,04,841 28.3 53,870 100.0 1,04,841 100.0 109 0.2 35,467 1,04,996 5,358
Dec-10 1,336 1,54,480 41,214 26.7 3,02,626 82,082 27.1 41,214 100.0 82,082 100.0 75 0.2 24,744 82,171 5,261
Jan-11 1,168 1,29,068 36,302 28.1 2,64,548 74,028 28.0 36,302 100.0 74,028 100.0 56 0.2 25,839 74,105 4,999
Feb-11 1,262 1,40,067 38,081 27.2 2,65,416 71,110 26.8 38,081 100.0 71,110 100.0 54 0.1 22,217 71,191 4,967
Mar-11 1,248 1,25,953 33,785 26.8 2,53,528 67,652 26.7 33,785 100.0 67,652 100.0 52 0.2 22,329 67,720 5,100
Apr-11 1,072 1,29,530 38,194 29.5 2,30,464 65,790 28.5 38,194 100.0 65,790 100.0 109 0.3 20,358 65,874 5,186
May-11 1,158 1,18,678 34,845 29.4 2,37,410 68,671 28.9 34,845 100.0 68,671 100.0 113 0.3 20,526 68,823 4,946
Jun-11 1,156 1,19,392 32,856 27.5 2,20,179 62,504 28.4 32,856 100.0 62,504 100.0 43 0.1 18,508 62,575 4,900
Jul-11 1,147 1,19,103 34,827 29.2 2,26,774 66,031 29.1 34,827 100.0 66,031 100.0 47 0.1 19,660 66,105 4,806
Aug-11 1,252 1,35,926 39,968 29.4 2,41,215 69,613 28.9 39,968 100.0 69,613 100.0 48 0.1 22,199 69,674 4,732
Sep-11 1,160 1,25,396 32,847 26.2 2,20,544 58,741 26.6 32,847 100.0 58,741 100.0 44 0.1 22,571 58,806 4,791
Oct-11 1,060 1,05,178 30,600 29.1 2,02,460 56,849 28.1 30,600 100.0 56,849 100.0 52 0.2 19,270 56,906 4,677
Nov-11 1,117 1,22,468 35,989 29.4 2,04,909 58,432 28.5 35,989 100.0 58,432 100.0 55 0.2 18,643 58,486 4,513
Dec-11 1,105 1,16,298 32,488 27.9 1,98,607 54,241 27.3 32,488 100.0 54,241 100.0 39 0.1 18,070 54,283 4,363
Jan-12 1,267 1,44,164 37,757 26.2 2,26,526 60,612 26.8 37,757 100.0 60,612 100.0 63 0.2 18,502 60,687 4,632
Feb-12 1,522 2,02,802 52,023 25.7 3,20,929 91,625 28.5 52,023 100.0 91,625 100.0 53 0.1 31,946 91,699 4,830
Mar-12 1,355 1,66,271 40,838 24.6 2,73,871 71,298 26.0 40,838 100.0 71,298 100.0 36 0.1 21,501 71,350 4,821
Apr-12 1,013 1,19,753 32,747 27.3 2,04,919 57,871 28.2 32,747 100.0 57,871 100.0 60 0.2 18,089 57,926 4,941
May-12 1,133 1,26,435 32,508 25.7 2,10,631 55,132 26.2 32,508 100.0 55,132 100.0 39 0.1 15,948 55,180 4,705
Jun-12 1,066 1,24,110 32,525 26.2 2,02,661 55,541 27.4 32,525 100.0 55,541 100.0 37 0.1 18,975 55,583 4,772
Jul-12 1,101 1,41,146 38,905 27.6 2,14,398 63,834 29.8 38,905 100.0 63,834 100.0 56 0.1 19,277 63,888 4,643
Aug-12 1,047 1,17,461 32,920 28.0 1,98,766 57,289 28.8 32,920 100.0 57,289 100.0 67 0.2 16,182 57,341 4,673
Sep-12 1,134 1,37,120 39,711 29.0 2,31,871 73,978 31.9 39,711 100.0 73,978 100.0 60 0.2 27,484 74,034 5,009
Oct-12 1,202 1,53,616 43,373 28.2 2,51,868 74,023 29.4 43,373 100.0 74,023 100.0 50 0.1 22,485 74,077 4,761
Nov-12 1,020 1,21,292 33,164 27.3 2,00,939 56,211 28.0 33,164 100.0 56,211 100.0 51 0.2 15,207 56,270 5,032
Dec-12 1,231 1,62,624 46,033 28.3 2,60,516 77,005 29.6 46,033 100.0 77,005 100.0 67 0.2 23,090 77,091 4,775
Jan-13 1,339 1,72,052 48,786 28.4 2,83,698 87,391 30.8 48,786 100.0 87,391 100.0 52 0.1 26,148 87,447 4,701
(Continued)

94
Month No. of Trades (Lakh)
Quantity Settled (Lakh)
Delivered Quantity
(Lakh)
% of Delivered Quantity
to Traded Quantity
Value Settled
(` crore)
Delivered Value
(` crore)
% of Delivered
Value to Total
Turnover
Delivered Quantity in Demat
Mode (Lakh)
% of Demat
Delivered Quantity
to Total Delivered Quantity
Delivered Value in
Demat Mode
(` crore)
% of Demat
Delivered Value
to Total Delivered
Value
Short Delivery
(Auctioned Quantity)
(Lakh)
% of Short Delivery
to Delivery
Funds Pay-in
(` crore)
Securities Pay-in
(` crore)
Settlement Guarantee
Fund (` crore)*
1 2 3 4 5 6 7 8 9 10 11 12 13 14 15 16 17
Feb-13 1,139 1,32,717 38,778 29.2 2,20,163 71,022 32.3 38,778 100.0 71,022 100.0 58 0.2 24,577 71,118 4,875
Mar-13 1,149 1,35,933 39,899 29.4 2,20,227 67,487 30.6 39,899 100.0 67,487 100.0 64 0.2 23,573 67,550 4,732
Apr-13 1,106 1,19,111 32,248 27.1 2,11,212 61,217 29.0 32,248 100.0 61,217 100.0 55 0.2 19,866 61,273 4,676
May-13 1,227 1,25,261 34,576 27.6 2,36,531 68,183 28.8 34,576 100.0 68,183 100.0 67 0.2 21,577 68,263 4,847
Jun-13 1,119 1,14,499 32,021 28.0 2,05,907 64,118 31.1 32,021 100.0 64,118 100.0 48 0.2 23,232 64,167 4,699
Jul-13 1,287 1,32,615 37,286 28.1 2,47,125 75,586 30.6 37,286 100.0 75,586 100.0 55 0.2 23,748 75,638 4,551
Aug-13 1,360 1,34,615 35,919 26.7 2,42,937 71,130 29.3 35,919 100.0 71,130 100.0 47 0.1 24,085 71,175 4,115
Sep-13 1,300 1,35,780 38,665 28.5 2,56,409 74,608 29.1 38,665 100.0 74,608 100.0 47 0.1 25,825 74,675 4,195
Oct-13 1,167 1,25,304 33,501 26.7 2,28,521 62,759 27.5 33,501 100.0 62,759 100.0 48 0.1 19,384 62,810 4,149
Nov-13 1,139 1,21,209 34,084 28.1 2,22,304 63,808 28.7 34,084 100.0 63,808 100.0 45 0.1 21,504 63,857 4,295
Dec-13 1,176 1,35,068 40,351 29.9 2,35,184 72,883 31.0 40,351 100.0 72,883 100.0 50 0.1 25,028 72,930 4,302
Jan-14 1,260 1,36,321 37,727 27.7 2,46,434 73,732 29.9 40,351 100.0 73,732 100.0 50 0.1 23,256 73,787 4,293
Feb-14 965 95,427 27,854 29.2 1,85,579 57,634 31.1 27,818 100.0 57,634 100.0 36 0.1 18,034 57,678 4,186
Mar-14 1,152 1,29,924 39,184 30.2 2,53,094 76,788 30.3 39,134 100.0 76,728 100.0 50 0.1 26,302 76,788 5,041
Apr-14 1,311 1,68,622 48,028 28.5 2,90,004 85,343 29.4 48,028 100.0 85,281 100.0 70 0.1 25,538 85,343 4,752
May-14 1,771 2,57,402 68,657 26.7 4,14,178 1,17,080 28.3 68,562 100.0 1,16,983 100.0 95 0.1 33,487 1,17,080 6,379
Jun-14 1,819 2,63,188 67,132 25.5 4,35,703 1,23,987 28.5 67,058 100.0 1,23,900 100.0 74 0.1 36,170 1,23,987 5,900
Jul-14 1,613 2,05,813 52,935 25.7 3,80,588 1,04,665 27.5 52,871 100.0 1,04,582 100.0 65 0.1 28,834 1,04,665 5,504
Aug-14 1,286 1,54,198 42,408 27.5 2,99,956 88,794 29.6 42,353 100.0 88,732 100.0 55 0.1 25,208 88,794 5,366
Sep-14 1,680 2,20,299 62,814 28.5 3,86,176 1,15,933 30.0 62,717 100.0 1,13,836 100.0 97 0.0 30,129 1,15,933 5,745
Oct-14 1,161 1,30,001 36,309 27.9 2,57,852 75,254 29.2 35,814 100.0 75,188 100.0 47 0.1 21,623 75,254 5,685
Nov-14 1,385 1,72,186 49,987 29.0 3,28,682 1,00,887 30.7 49,935 100.0 1,00,819 100.0 52 0.1 28,687 1,00,887 5,531
Dec-14 1,547 1,78,489 52,114 29.2 3,68,511 1,16,592 31.6 52,114 100.0 1,16,503 100.0 73 0.1 37,872 1,16,592 95
Note: As per SEBI Circular CIR/MRD/DRMNP/25/2014 dated August 27, 2014, Core Settlement Guarantee Fund (Core SGF) norms were prescribed. Exchanges were required to report Core SGF from December 1, 2014 in the settlement statistics of Cash and Equity Derivative segment.
Source: NSE.
Table 74: Settlement Statistics for Cash Segment of NSE
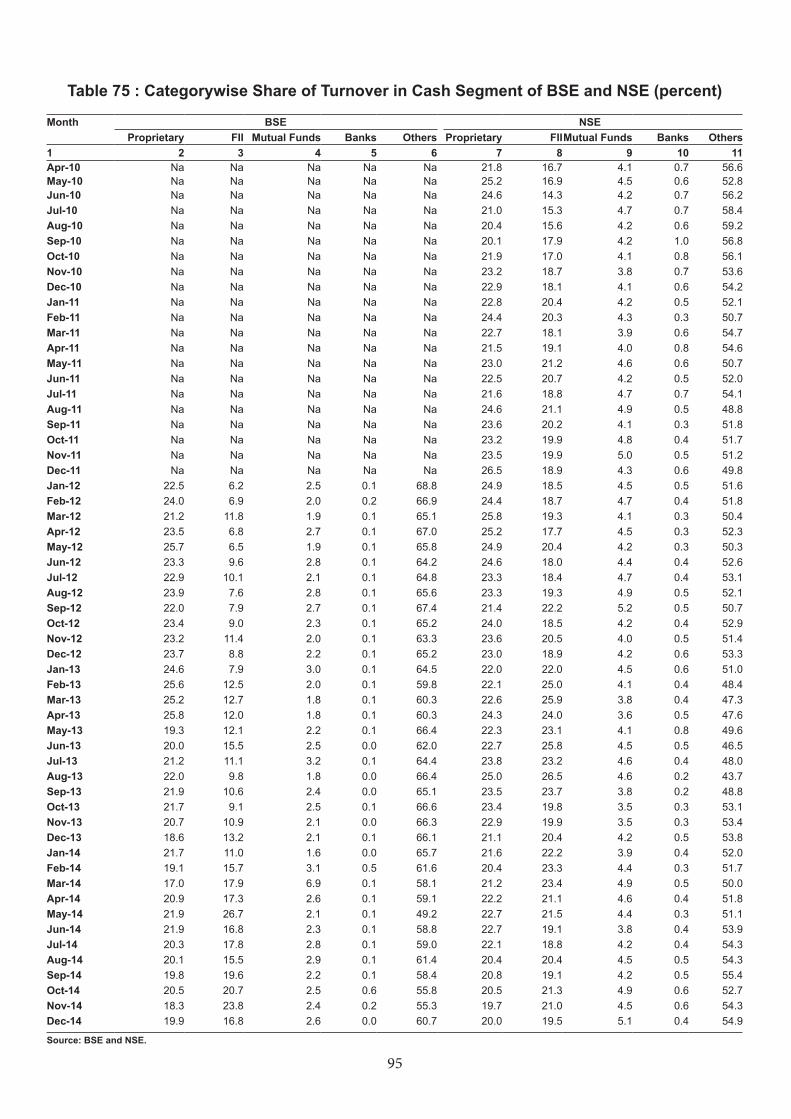
95
Table 75 : Categorywise Share of Turnover in Cash Segment of BSE and NSE (percent)
Month BSE NSEProprietary FII Mutual Funds Banks Others Proprietary FIIMutual Funds Banks Others
1 2 3 4 5 6 7 8 9 10 11Apr-10 Na Na Na Na Na 21.8 16.7 4.1 0.7 56.6May-10 Na Na Na Na Na 25.2 16.9 4.5 0.6 52.8Jun-10 Na Na Na Na Na 24.6 14.3 4.2 0.7 56.2Jul-10 Na Na Na Na Na 21.0 15.3 4.7 0.7 58.4Aug-10 Na Na Na Na Na 20.4 15.6 4.2 0.6 59.2Sep-10 Na Na Na Na Na 20.1 17.9 4.2 1.0 56.8Oct-10 Na Na Na Na Na 21.9 17.0 4.1 0.8 56.1Nov-10 Na Na Na Na Na 23.2 18.7 3.8 0.7 53.6Dec-10 Na Na Na Na Na 22.9 18.1 4.1 0.6 54.2Jan-11 Na Na Na Na Na 22.8 20.4 4.2 0.5 52.1Feb-11 Na Na Na Na Na 24.4 20.3 4.3 0.3 50.7Mar-11 Na Na Na Na Na 22.7 18.1 3.9 0.6 54.7Apr-11 Na Na Na Na Na 21.5 19.1 4.0 0.8 54.6May-11 Na Na Na Na Na 23.0 21.2 4.6 0.6 50.7Jun-11 Na Na Na Na Na 22.5 20.7 4.2 0.5 52.0Jul-11 Na Na Na Na Na 21.6 18.8 4.7 0.7 54.1Aug-11 Na Na Na Na Na 24.6 21.1 4.9 0.5 48.8Sep-11 Na Na Na Na Na 23.6 20.2 4.1 0.3 51.8Oct-11 Na Na Na Na Na 23.2 19.9 4.8 0.4 51.7Nov-11 Na Na Na Na Na 23.5 19.9 5.0 0.5 51.2Dec-11 Na Na Na Na Na 26.5 18.9 4.3 0.6 49.8Jan-12 22.5 6.2 2.5 0.1 68.8 24.9 18.5 4.5 0.5 51.6Feb-12 24.0 6.9 2.0 0.2 66.9 24.4 18.7 4.7 0.4 51.8Mar-12 21.2 11.8 1.9 0.1 65.1 25.8 19.3 4.1 0.3 50.4Apr-12 23.5 6.8 2.7 0.1 67.0 25.2 17.7 4.5 0.3 52.3May-12 25.7 6.5 1.9 0.1 65.8 24.9 20.4 4.2 0.3 50.3Jun-12 23.3 9.6 2.8 0.1 64.2 24.6 18.0 4.4 0.4 52.6Jul-12 22.9 10.1 2.1 0.1 64.8 23.3 18.4 4.7 0.4 53.1Aug-12 23.9 7.6 2.8 0.1 65.6 23.3 19.3 4.9 0.5 52.1Sep-12 22.0 7.9 2.7 0.1 67.4 21.4 22.2 5.2 0.5 50.7Oct-12 23.4 9.0 2.3 0.1 65.2 24.0 18.5 4.2 0.4 52.9Nov-12 23.2 11.4 2.0 0.1 63.3 23.6 20.5 4.0 0.5 51.4Dec-12 23.7 8.8 2.2 0.1 65.2 23.0 18.9 4.2 0.6 53.3Jan-13 24.6 7.9 3.0 0.1 64.5 22.0 22.0 4.5 0.6 51.0Feb-13 25.6 12.5 2.0 0.1 59.8 22.1 25.0 4.1 0.4 48.4Mar-13 25.2 12.7 1.8 0.1 60.3 22.6 25.9 3.8 0.4 47.3Apr-13 25.8 12.0 1.8 0.1 60.3 24.3 24.0 3.6 0.5 47.6May-13 19.3 12.1 2.2 0.1 66.4 22.3 23.1 4.1 0.8 49.6Jun-13 20.0 15.5 2.5 0.0 62.0 22.7 25.8 4.5 0.5 46.5Jul-13 21.2 11.1 3.2 0.1 64.4 23.8 23.2 4.6 0.4 48.0Aug-13 22.0 9.8 1.8 0.0 66.4 25.0 26.5 4.6 0.2 43.7Sep-13 21.9 10.6 2.4 0.0 65.1 23.5 23.7 3.8 0.2 48.8Oct-13 21.7 9.1 2.5 0.1 66.6 23.4 19.8 3.5 0.3 53.1Nov-13 20.7 10.9 2.1 0.0 66.3 22.9 19.9 3.5 0.3 53.4Dec-13 18.6 13.2 2.1 0.1 66.1 21.1 20.4 4.2 0.5 53.8Jan-14 21.7 11.0 1.6 0.0 65.7 21.6 22.2 3.9 0.4 52.0Feb-14 19.1 15.7 3.1 0.5 61.6 20.4 23.3 4.4 0.3 51.7Mar-14 17.0 17.9 6.9 0.1 58.1 21.2 23.4 4.9 0.5 50.0Apr-14 20.9 17.3 2.6 0.1 59.1 22.2 21.1 4.6 0.4 51.8May-14 21.9 26.7 2.1 0.1 49.2 22.7 21.5 4.4 0.3 51.1Jun-14 21.9 16.8 2.3 0.1 58.8 22.7 19.1 3.8 0.4 53.9Jul-14 20.3 17.8 2.8 0.1 59.0 22.1 18.8 4.2 0.4 54.3Aug-14 20.1 15.5 2.9 0.1 61.4 20.4 20.4 4.5 0.5 54.3Sep-14 19.8 19.6 2.2 0.1 58.4 20.8 19.1 4.2 0.5 55.4Oct-14 20.5 20.7 2.5 0.6 55.8 20.5 21.3 4.9 0.6 52.7Nov-14 18.3 23.8 2.4 0.2 55.3 19.7 21.0 4.5 0.6 54.3Dec-14 19.9 16.8 2.6 0.0 60.7 20.0 19.5 5.1 0.4 54.9
Source: BSE and NSE.
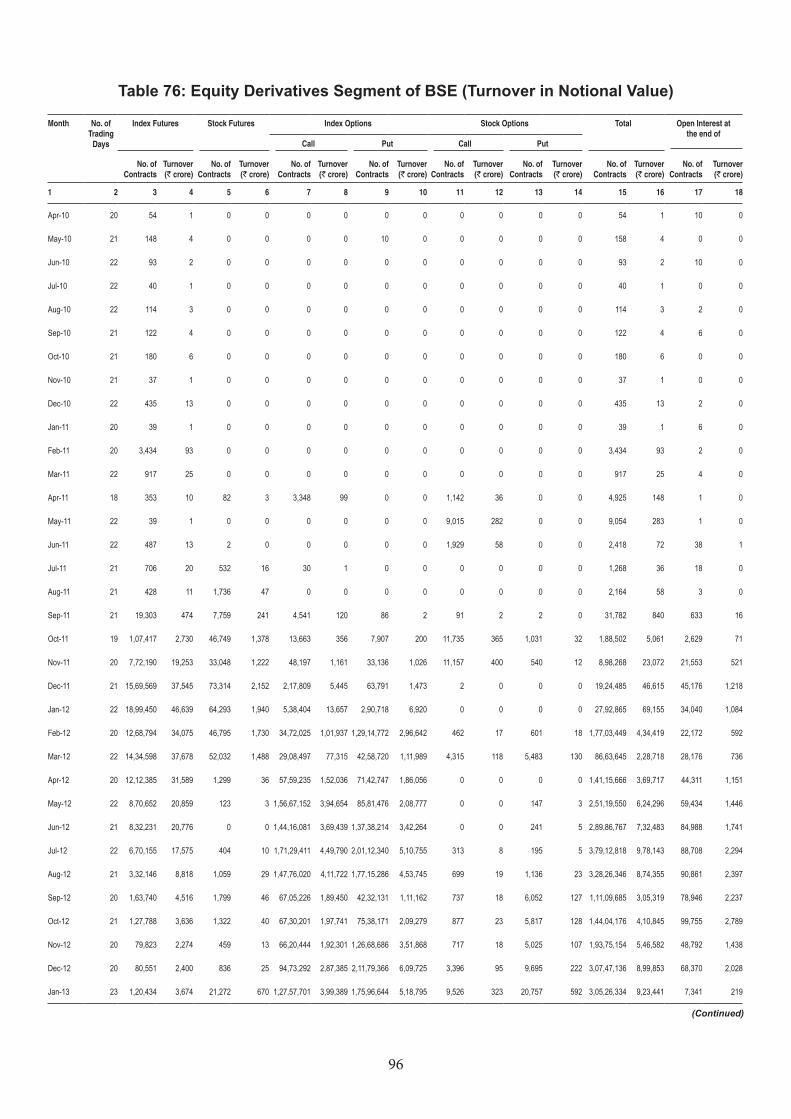
96
Table 76: Equity Derivatives Segment of BSE (Turnover in Notional Value)
Month No. of Trading
Days
Index Futures Stock Futures Index Options Stock Options Total Open Interest at the end of
Call Put Call Put
No. of Contracts
Turnover (` crore)
No. of Contracts
Turnover (` crore)
No. of Contracts
Turnover (` crore)
No. of Contracts
Turnover (` crore)
No. of Contracts
Turnover (` crore)
No. of Contracts
Turnover (` crore)
No. of Contracts
Turnover (` crore)
No. of Contracts
Turnover (` crore)
1 2 3 4 5 6 7 8 9 10 11 12 13 14 15 16 17 18
Apr-10 20 54 1 0 0 0 0 0 0 0 0 0 0 54 1 10 0
May-10 21 148 4 0 0 0 0 10 0 0 0 0 0 158 4 0 0
Jun-10 22 93 2 0 0 0 0 0 0 0 0 0 0 93 2 10 0
Jul-10 22 40 1 0 0 0 0 0 0 0 0 0 0 40 1 0 0
Aug-10 22 114 3 0 0 0 0 0 0 0 0 0 0 114 3 2 0
Sep-10 21 122 4 0 0 0 0 0 0 0 0 0 0 122 4 6 0
Oct-10 21 180 6 0 0 0 0 0 0 0 0 0 0 180 6 0 0
Nov-10 21 37 1 0 0 0 0 0 0 0 0 0 0 37 1 0 0
Dec-10 22 435 13 0 0 0 0 0 0 0 0 0 0 435 13 2 0
Jan-11 20 39 1 0 0 0 0 0 0 0 0 0 0 39 1 6 0
Feb-11 20 3,434 93 0 0 0 0 0 0 0 0 0 0 3,434 93 2 0
Mar-11 22 917 25 0 0 0 0 0 0 0 0 0 0 917 25 4 0
Apr-11 18 353 10 82 3 3,348 99 0 0 1,142 36 0 0 4,925 148 1 0
May-11 22 39 1 0 0 0 0 0 0 9,015 282 0 0 9,054 283 1 0
Jun-11 22 487 13 2 0 0 0 0 0 1,929 58 0 0 2,418 72 38 1
Jul-11 21 706 20 532 16 30 1 0 0 0 0 0 0 1,268 36 18 0
Aug-11 21 428 11 1,736 47 0 0 0 0 0 0 0 0 2,164 58 3 0
Sep-11 21 19,303 474 7,759 241 4,541 120 86 2 91 2 2 0 31,782 840 633 16
Oct-11 19 1,07,417 2,730 46,749 1,378 13,663 356 7,907 200 11,735 365 1,031 32 1,88,502 5,061 2,629 71
Nov-11 20 7,72,190 19,253 33,048 1,222 48,197 1,161 33,136 1,026 11,157 400 540 12 8,98,268 23,072 21,553 521
Dec-11 21 15,69,569 37,545 73,314 2,152 2,17,809 5,445 63,791 1,473 2 0 0 0 19,24,485 46,615 45,176 1,218
Jan-12 22 18,99,450 46,639 64,293 1,940 5,38,404 13,657 2,90,718 6,920 0 0 0 0 27,92,865 69,155 34,040 1,084
Feb-12 20 12,68,794 34,075 46,795 1,730 34,72,025 1,01,937 1,29,14,772 2,96,642 462 17 601 18 1,77,03,449 4,34,419 22,172 592
Mar-12 22 14,34,598 37,678 52,032 1,488 29,08,497 77,315 42,58,720 1,11,989 4,315 118 5,483 130 86,63,645 2,28,718 28,176 736
Apr-12 20 12,12,385 31,589 1,299 36 57,59,235 1,52,036 71,42,747 1,86,056 0 0 0 0 1,41,15,666 3,69,717 44,311 1,151
May-12 22 8,70,652 20,859 123 3 1,56,67,152 3,94,654 85,81,476 2,08,777 0 0 147 3 2,51,19,550 6,24,296 59,434 1,446
Jun-12 21 8,32,231 20,776 0 0 1,44,16,081 3,69,439 1,37,38,214 3,42,264 0 0 241 5 2,89,86,767 7,32,483 84,988 1,741
Jul-12 22 6,70,155 17,575 404 10 1,71,29,411 4,49,790 2,01,12,340 5,10,755 313 8 195 5 3,79,12,818 9,78,143 88,708 2,294
Aug-12 21 3,32,146 8,818 1,059 29 1,47,76,020 4,11,722 1,77,15,286 4,53,745 699 19 1,136 23 3,28,26,346 8,74,355 90,861 2,397
Sep-12 20 1,63,740 4,516 1,799 46 67,05,226 1,89,450 42,32,131 1,11,162 737 18 6,052 127 1,11,09,685 3,05,319 78,946 2,237
Oct-12 21 1,27,788 3,636 1,322 40 67,30,201 1,97,741 75,38,171 2,09,279 877 23 5,817 128 1,44,04,176 4,10,845 99,755 2,789
Nov-12 20 79,823 2,274 459 13 66,20,444 1,92,301 1,26,68,686 3,51,868 717 18 5,025 107 1,93,75,154 5,46,582 48,792 1,438
Dec-12 20 80,551 2,400 836 25 94,73,292 2,87,385 2,11,79,366 6,09,725 3,396 95 9,695 222 3,07,47,136 8,99,853 68,370 2,028
Jan-13 23 1,20,434 3,674 21,272 670 1,27,57,701 3,99,389 1,75,96,644 5,18,795 9,526 323 20,757 592 3,05,26,334 9,23,441 7,341 219
(Continued)
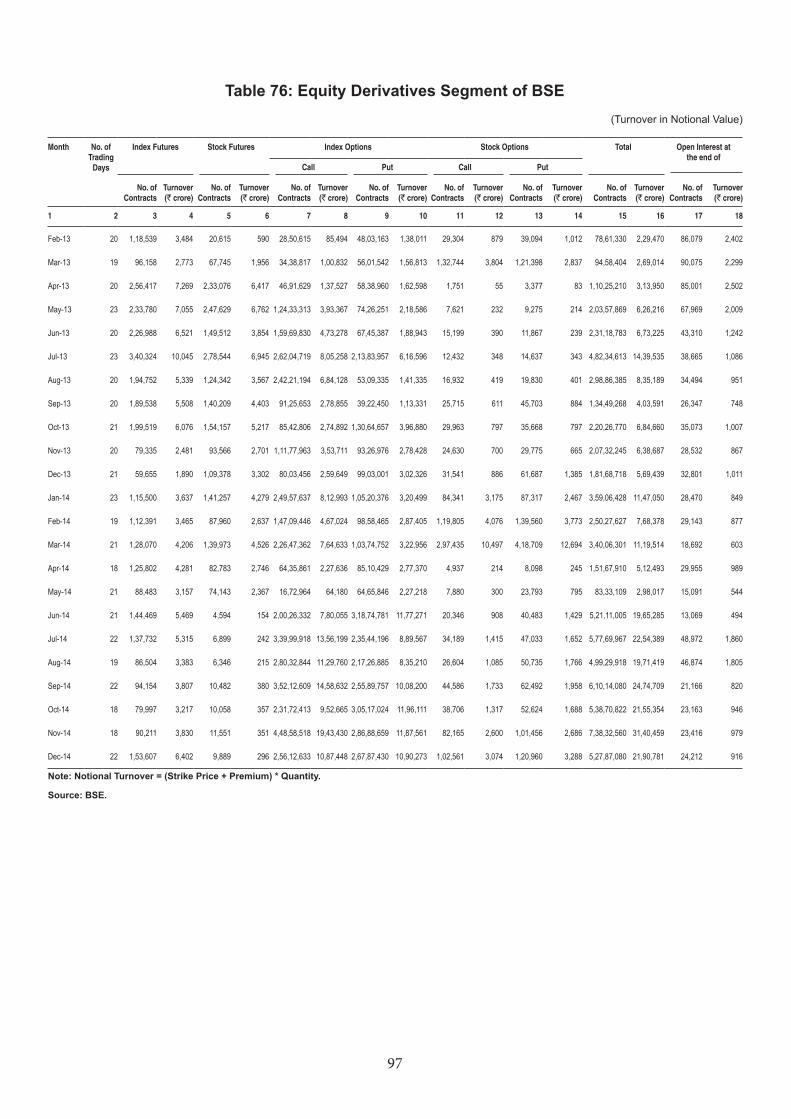
97
Table 76: Equity Derivatives Segment of BSE
Month No. of Trading
Days
Index Futures Stock Futures Index Options Stock Options Total Open Interest at the end of
Call Put Call Put
No. of Contracts
Turnover (` crore)
No. of Contracts
Turnover (` crore)
No. of Contracts
Turnover (` crore)
No. of Contracts
Turnover (` crore)
No. of Contracts
Turnover (` crore)
No. of Contracts
Turnover (` crore)
No. of Contracts
Turnover (` crore)
No. of Contracts
Turnover (` crore)
1 2 3 4 5 6 7 8 9 10 11 12 13 14 15 16 17 18
Feb-13 20 1,18,539 3,484 20,615 590 28,50,615 85,494 48,03,163 1,38,011 29,304 879 39,094 1,012 78,61,330 2,29,470 86,079 2,402
Mar-13 19 96,158 2,773 67,745 1,956 34,38,817 1,00,832 56,01,542 1,56,813 1,32,744 3,804 1,21,398 2,837 94,58,404 2,69,014 90,075 2,299
Apr-13 20 2,56,417 7,269 2,33,076 6,417 46,91,629 1,37,527 58,38,960 1,62,598 1,751 55 3,377 83 1,10,25,210 3,13,950 85,001 2,502
May-13 23 2,33,780 7,055 2,47,629 6,762 1,24,33,313 3,93,367 74,26,251 2,18,586 7,621 232 9,275 214 2,03,57,869 6,26,216 67,969 2,009
Jun-13 20 2,26,988 6,521 1,49,512 3,854 1,59,69,830 4,73,278 67,45,387 1,88,943 15,199 390 11,867 239 2,31,18,783 6,73,225 43,310 1,242
Jul-13 23 3,40,324 10,045 2,78,544 6,945 2,62,04,719 8,05,258 2,13,83,957 6,16,596 12,432 348 14,637 343 4,82,34,613 14,39,535 38,665 1,086
Aug-13 20 1,94,752 5,339 1,24,342 3,567 2,42,21,194 6,84,128 53,09,335 1,41,335 16,932 419 19,830 401 2,98,86,385 8,35,189 34,494 951
Sep-13 20 1,89,538 5,508 1,40,209 4,403 91,25,653 2,78,855 39,22,450 1,13,331 25,715 611 45,703 884 1,34,49,268 4,03,591 26,347 748
Oct-13 21 1,99,519 6,076 1,54,157 5,217 85,42,806 2,74,892 1,30,64,657 3,96,880 29,963 797 35,668 797 2,20,26,770 6,84,660 35,073 1,007
Nov-13 20 79,335 2,481 93,566 2,701 1,11,77,963 3,53,711 93,26,976 2,78,428 24,630 700 29,775 665 2,07,32,245 6,38,687 28,532 867
Dec-13 21 59,655 1,890 1,09,378 3,302 80,03,456 2,59,649 99,03,001 3,02,326 31,541 886 61,687 1,385 1,81,68,718 5,69,439 32,801 1,011
Jan-14 23 1,15,500 3,637 1,41,257 4,279 2,49,57,637 8,12,993 1,05,20,376 3,20,499 84,341 3,175 87,317 2,467 3,59,06,428 11,47,050 28,470 849
Feb-14 19 1,12,391 3,465 87,960 2,637 1,47,09,446 4,67,024 98,58,465 2,87,405 1,19,805 4,076 1,39,560 3,773 2,50,27,627 7,68,378 29,143 877
Mar-14 21 1,28,070 4,206 1,39,973 4,526 2,26,47,362 7,64,633 1,03,74,752 3,22,956 2,97,435 10,497 4,18,709 12,694 3,40,06,301 11,19,514 18,692 603
Apr-14 18 1,25,802 4,281 82,783 2,746 64,35,861 2,27,636 85,10,429 2,77,370 4,937 214 8,098 245 1,51,67,910 5,12,493 29,955 989
May-14 21 88,483 3,157 74,143 2,367 16,72,964 64,180 64,65,846 2,27,218 7,880 300 23,793 795 83,33,109 2,98,017 15,091 544
Jun-14 21 1,44,469 5,469 4,594 154 2,00,26,332 7,80,055 3,18,74,781 11,77,271 20,346 908 40,483 1,429 5,21,11,005 19,65,285 13,069 494
Jul-14 22 1,37,732 5,315 6,899 242 3,39,99,918 13,56,199 2,35,44,196 8,89,567 34,189 1,415 47,033 1,652 5,77,69,967 22,54,389 48,972 1,860
Aug-14 19 86,504 3,383 6,346 215 2,80,32,844 11,29,760 2,17,26,885 8,35,210 26,604 1,085 50,735 1,766 4,99,29,918 19,71,419 46,874 1,805
Sep-14 22 94,154 3,807 10,482 380 3,52,12,609 14,58,632 2,55,89,757 10,08,200 44,586 1,733 62,492 1,958 6,10,14,080 24,74,709 21,166 820
Oct-14 18 79,997 3,217 10,058 357 2,31,72,413 9,52,665 3,05,17,024 11,96,111 38,706 1,317 52,624 1,688 5,38,70,822 21,55,354 23,163 946
Nov-14 18 90,211 3,830 11,551 351 4,48,58,518 19,43,430 2,86,88,659 11,87,561 82,165 2,600 1,01,456 2,686 7,38,32,560 31,40,459 23,416 979
Dec-14 22 1,53,607 6,402 9,889 296 2,56,12,633 10,87,448 2,67,87,430 10,90,273 1,02,561 3,074 1,20,960 3,288 5,27,87,080 21,90,781 24,212 916
Note: Notional Turnover = (Strike Price + Premium) * Quantity.
Source: BSE.
(Turnover in Notional Value)
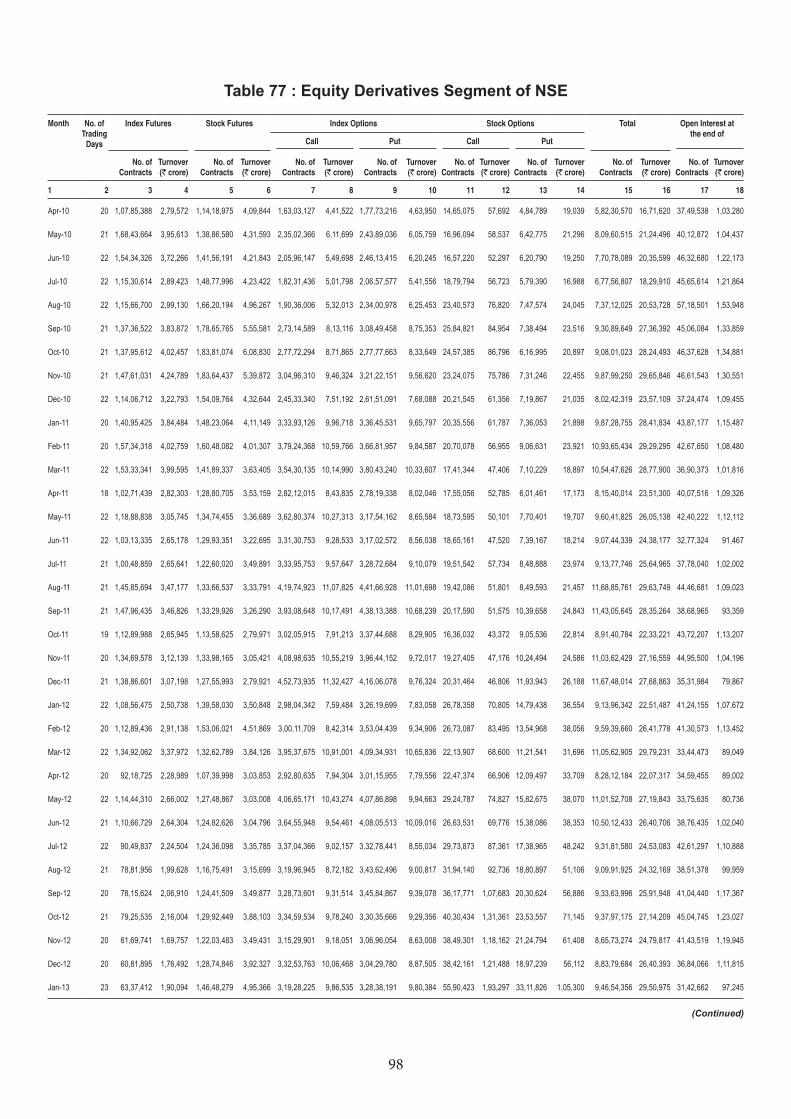
98
Table 77 : Equity Derivatives Segment of NSE
Month No. of Trading
Days
Index Futures Stock Futures Index Options Stock Options Total Open Interest at the end of
Call Put Call Put
No. of Contracts
Turnover (` crore)
No. of Contracts
Turnover (` crore)
No. of Contracts
Turnover (` crore)
No. of Contracts
Turnover (` crore)
No. of Contracts
Turnover (` crore)
No. of Contracts
Turnover (` crore)
No. of Contracts
Turnover (` crore)
No. of Contracts
Turnover (` crore)
1 2 3 4 5 6 7 8 9 10 11 12 13 14 15 16 17 18
Apr-10 20 1,07,85,388 2,79,572 1,14,18,975 4,09,844 1,63,03,127 4,41,522 1,77,73,216 4,63,950 14,65,075 57,692 4,84,789 19,039 5,82,30,570 16,71,620 37,49,538 1,03,280
May-10 21 1,68,43,664 3,95,613 1,38,86,580 4,31,593 2,35,02,366 6,11,699 2,43,89,036 6,05,759 16,96,094 58,537 6,42,775 21,296 8,09,60,515 21,24,496 40,12,872 1,04,437
Jun-10 22 1,54,34,326 3,72,266 1,41,56,191 4,21,843 2,05,96,147 5,49,698 2,46,13,415 6,20,245 16,57,220 52,297 6,20,790 19,250 7,70,78,089 20,35,599 46,32,680 1,22,173
Jul-10 22 1,15,30,614 2,89,423 1,48,77,996 4,23,422 1,82,31,436 5,01,798 2,06,57,577 5,41,556 18,79,794 56,723 5,79,390 16,988 6,77,56,807 18,29,910 45,65,614 1,21,864
Aug-10 22 1,15,66,700 2,99,130 1,66,20,194 4,96,267 1,90,36,006 5,32,013 2,34,00,978 6,25,453 23,40,573 76,820 7,47,574 24,045 7,37,12,025 20,53,728 57,18,501 1,53,948
Sep-10 21 1,37,36,522 3,83,872 1,78,65,765 5,55,581 2,73,14,589 8,13,116 3,08,49,458 8,75,353 25,84,821 84,954 7,38,494 23,516 9,30,89,649 27,36,392 45,06,084 1,33,859
Oct-10 21 1,37,95,612 4,02,457 1,83,81,074 6,08,830 2,77,72,294 8,71,865 2,77,77,663 8,33,649 24,57,385 86,796 6,16,995 20,897 9,08,01,023 28,24,493 46,37,628 1,34,881
Nov-10 21 1,47,61,031 4,24,789 1,83,64,437 5,39,872 3,04,96,310 9,46,324 3,21,22,151 9,56,620 23,24,075 75,786 7,31,246 22,455 9,87,99,250 29,65,846 46,61,543 1,30,551
Dec-10 22 1,14,06,712 3,22,793 1,54,09,764 4,32,644 2,45,33,340 7,51,192 2,61,51,091 7,68,088 20,21,545 61,356 7,19,867 21,035 8,02,42,319 23,57,109 37,24,474 1,09,455
Jan-11 20 1,40,95,425 3,84,484 1,48,23,064 4,11,149 3,33,93,126 9,96,718 3,36,45,531 9,65,797 20,35,556 61,787 7,36,053 21,898 9,87,28,755 28,41,834 43,87,177 1,15,487
Feb-11 20 1,57,34,318 4,02,759 1,60,48,082 4,01,307 3,79,24,368 10,59,766 3,66,81,957 9,84,587 20,70,078 56,955 9,06,631 23,921 10,93,65,434 29,29,295 42,67,650 1,08,480
Mar-11 22 1,53,33,341 3,99,595 1,41,89,337 3,63,405 3,54,30,135 10,14,990 3,80,43,240 10,33,607 17,41,344 47,406 7,10,229 18,897 10,54,47,626 28,77,900 36,90,373 1,01,816
Apr-11 18 1,02,71,439 2,82,303 1,28,80,705 3,53,159 2,82,12,015 8,43,835 2,78,19,338 8,02,046 17,55,056 52,785 6,01,461 17,173 8,15,40,014 23,51,300 40,07,516 1,09,326
May-11 22 1,18,88,838 3,05,745 1,34,74,455 3,36,689 3,62,80,374 10,27,313 3,17,54,162 8,65,584 18,73,595 50,101 7,70,401 19,707 9,60,41,825 26,05,138 42,40,222 1,12,112
Jun-11 22 1,03,13,335 2,65,178 1,29,93,351 3,22,695 3,31,30,753 9,28,533 3,17,02,572 8,56,038 18,65,161 47,520 7,39,167 18,214 9,07,44,339 24,38,177 32,77,324 91,467
Jul-11 21 1,00,48,859 2,65,641 1,22,60,020 3,49,891 3,33,95,753 9,57,647 3,28,72,684 9,10,079 19,51,542 57,734 8,48,888 23,974 9,13,77,746 25,64,965 37,78,040 1,02,002
Aug-11 21 1,45,85,694 3,47,177 1,33,66,537 3,33,791 4,19,74,923 11,07,825 4,41,66,928 11,01,698 19,42,086 51,801 8,49,593 21,457 11,68,85,761 29,63,749 44,46,681 1,09,023
Sep-11 21 1,47,96,435 3,46,826 1,33,29,926 3,26,290 3,93,08,648 10,17,491 4,38,13,388 10,68,239 20,17,590 51,575 10,39,658 24,843 11,43,05,645 28,35,264 38,68,965 93,359
Oct-11 19 1,12,89,988 2,65,945 1,13,58,625 2,79,971 3,02,05,915 7,91,213 3,37,44,688 8,29,905 16,36,032 43,372 9,05,536 22,814 8,91,40,784 22,33,221 43,72,207 1,13,207
Nov-11 20 1,34,69,578 3,12,139 1,33,98,165 3,05,421 4,08,98,635 10,55,219 3,96,44,152 9,72,017 19,27,405 47,176 10,24,494 24,586 11,03,62,429 27,16,559 44,95,500 1,04,196
Dec-11 21 1,38,86,601 3,07,198 1,27,55,993 2,79,921 4,52,73,935 11,32,427 4,16,06,078 9,76,324 20,31,464 46,806 11,93,943 26,188 11,67,48,014 27,68,863 35,31,984 79,867
Jan-12 22 1,08,56,475 2,50,738 1,39,58,030 3,50,848 2,98,04,342 7,59,484 3,26,19,699 7,83,058 26,78,358 70,805 14,79,438 36,554 9,13,96,342 22,51,487 41,24,155 1,07,672
Feb-12 20 1,12,89,436 2,91,138 1,53,06,021 4,51,869 3,00,11,709 8,42,314 3,53,04,439 9,34,906 26,73,087 83,495 13,54,968 38,056 9,59,39,660 26,41,778 41,30,573 1,13,452
Mar-12 22 1,34,92,062 3,37,972 1,32,62,789 3,84,126 3,95,37,675 10,91,001 4,09,34,931 10,65,836 22,13,907 68,600 11,21,541 31,696 11,05,62,905 29,79,231 33,44,473 89,049
Apr-12 20 92,18,725 2,28,989 1,07,39,998 3,03,853 2,92,80,635 7,94,304 3,01,15,955 7,79,556 22,47,374 66,906 12,09,497 33,709 8,28,12,184 22,07,317 34,59,455 89,002
May-12 22 1,14,44,310 2,66,002 1,27,48,867 3,03,008 4,06,65,171 10,43,274 4,07,86,898 9,94,663 29,24,787 74,827 15,82,675 38,070 11,01,52,708 27,19,843 33,75,635 80,736
Jun-12 21 1,10,66,729 2,64,304 1,24,82,626 3,04,796 3,64,55,948 9,54,461 4,08,05,513 10,09,016 26,63,531 69,776 15,38,086 38,353 10,50,12,433 26,40,706 38,76,435 1,02,040
Jul-12 22 90,49,837 2,24,504 1,24,36,098 3,35,785 3,37,04,366 9,02,157 3,32,78,441 8,55,034 29,73,873 87,361 17,38,965 48,242 9,31,81,580 24,53,083 42,61,297 1,10,888
Aug-12 21 78,81,956 1,99,628 1,16,75,491 3,15,699 3,19,96,945 8,72,182 3,43,62,496 9,00,817 31,94,140 92,736 18,80,897 51,106 9,09,91,925 24,32,169 38,51,378 99,959
Sep-12 20 78,15,624 2,06,910 1,24,41,509 3,49,877 3,28,73,601 9,31,514 3,45,84,867 9,39,078 36,17,771 1,07,683 20,30,624 56,886 9,33,63,996 25,91,948 41,04,440 1,17,367
Oct-12 21 79,25,535 2,16,004 1,29,92,449 3,88,103 3,34,59,534 9,78,240 3,30,35,666 9,29,356 40,30,434 1,31,361 23,53,557 71,145 9,37,97,175 27,14,209 45,04,745 1,23,027
Nov-12 20 61,69,741 1,69,757 1,22,03,483 3,49,431 3,15,29,901 9,18,051 3,06,96,054 8,63,008 38,49,301 1,18,162 21,24,794 61,408 8,65,73,274 24,79,817 41,43,519 1,19,945
Dec-12 20 60,81,895 1,76,492 1,28,74,846 3,92,327 3,32,53,763 10,06,468 3,04,29,780 8,87,505 38,42,161 1,21,488 18,97,239 56,112 8,83,79,684 26,40,393 36,84,066 1,11,815
Jan-13 23 63,37,412 1,90,094 1,46,48,279 4,95,366 3,19,28,225 9,86,535 3,28,38,191 9,80,384 55,90,423 1,93,297 33,11,826 1,05,300 9,46,54,356 29,50,975 31,42,662 97,245
(Continued)
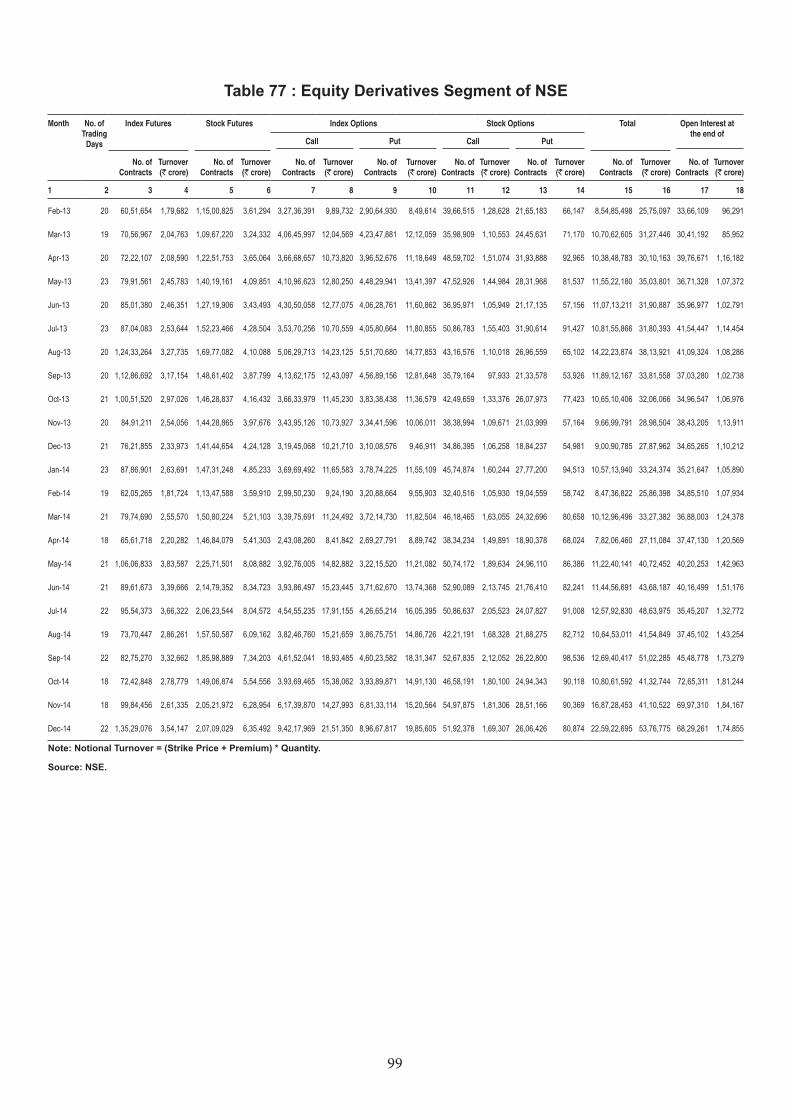
99
Table 77 : Equity Derivatives Segment of NSE
Month No. of Trading
Days
Index Futures Stock Futures Index Options Stock Options Total Open Interest at the end of
Call Put Call Put
No. of Contracts
Turnover (` crore)
No. of Contracts
Turnover (` crore)
No. of Contracts
Turnover (` crore)
No. of Contracts
Turnover (` crore)
No. of Contracts
Turnover (` crore)
No. of Contracts
Turnover (` crore)
No. of Contracts
Turnover (` crore)
No. of Contracts
Turnover (` crore)
1 2 3 4 5 6 7 8 9 10 11 12 13 14 15 16 17 18
Feb-13 20 60,51,654 1,79,682 1,15,00,825 3,61,294 3,27,36,391 9,89,732 2,90,64,930 8,49,614 39,66,515 1,28,628 21,65,183 66,147 8,54,85,498 25,75,097 33,66,109 96,291
Mar-13 19 70,56,967 2,04,763 1,09,67,220 3,24,332 4,06,45,997 12,04,569 4,23,47,881 12,12,059 35,98,909 1,10,553 24,45,631 71,170 10,70,62,605 31,27,446 30,41,192 85,952
Apr-13 20 72,22,107 2,08,590 1,22,51,753 3,65,064 3,66,68,657 10,73,820 3,96,52,676 11,18,649 48,59,702 1,51,074 31,93,888 92,965 10,38,48,783 30,10,163 39,76,671 1,16,182
May-13 23 79,91,561 2,45,783 1,40,19,161 4,09,851 4,10,96,623 12,80,250 4,48,29,941 13,41,397 47,52,926 1,44,984 28,31,968 81,537 11,55,22,180 35,03,801 36,71,328 1,07,372
Jun-13 20 85,01,380 2,46,351 1,27,19,906 3,43,493 4,30,50,058 12,77,075 4,06,28,761 11,60,862 36,95,971 1,05,949 21,17,135 57,156 11,07,13,211 31,90,887 35,96,977 1,02,791
Jul-13 23 87,04,083 2,53,644 1,52,23,466 4,28,504 3,53,70,256 10,70,559 4,05,80,664 11,80,855 50,86,783 1,55,403 31,90,614 91,427 10,81,55,866 31,80,393 41,54,447 1,14,454
Aug-13 20 1,24,33,264 3,27,735 1,69,77,082 4,10,088 5,06,29,713 14,23,125 5,51,70,680 14,77,853 43,16,576 1,10,018 26,96,559 65,102 14,22,23,874 38,13,921 41,09,324 1,08,286
Sep-13 20 1,12,86,692 3,17,154 1,48,61,402 3,87,799 4,13,62,175 12,43,097 4,56,89,156 12,81,648 35,79,164 97,933 21,33,578 53,926 11,89,12,167 33,81,558 37,03,280 1,02,738
Oct-13 21 1,00,51,520 2,97,026 1,46,28,837 4,16,432 3,66,33,979 11,45,230 3,83,38,438 11,36,579 42,49,659 1,33,376 26,07,973 77,423 10,65,10,406 32,06,066 34,96,547 1,06,976
Nov-13 20 84,91,211 2,54,056 1,44,28,865 3,97,676 3,43,95,126 10,73,927 3,34,41,596 10,06,011 38,38,994 1,09,671 21,03,999 57,164 9,66,99,791 28,98,504 38,43,205 1,13,911
Dec-13 21 76,21,855 2,33,973 1,41,44,654 4,24,128 3,19,45,068 10,21,710 3,10,08,576 9,46,911 34,86,395 1,06,258 18,84,237 54,981 9,00,90,785 27,87,962 34,65,265 1,10,212
Jan-14 23 87,86,901 2,63,691 1,47,31,248 4,85,233 3,69,69,492 11,65,583 3,78,74,225 11,55,109 45,74,874 1,60,244 27,77,200 94,513 10,57,13,940 33,24,374 35,21,647 1,05,890
Feb-14 19 62,05,265 1,81,724 1,13,47,588 3,59,910 2,99,50,230 9,24,190 3,20,88,664 9,55,903 32,40,516 1,05,930 19,04,559 58,742 8,47,36,822 25,86,398 34,85,510 1,07,934
Mar-14 21 79,74,690 2,55,570 1,50,80,224 5,21,103 3,39,75,691 11,24,492 3,72,14,730 11,82,504 46,18,465 1,63,055 24,32,696 80,658 10,12,96,496 33,27,382 36,88,003 1,24,378
Apr-14 18 65,61,718 2,20,282 1,46,84,079 5,41,303 2,43,08,260 8,41,842 2,69,27,791 8,89,742 38,34,234 1,49,891 18,90,378 68,024 7,82,06,460 27,11,084 37,47,130 1,20,569
May-14 21 1,06,06,833 3,83,587 2,25,71,501 8,08,882 3,92,76,005 14,82,882 3,22,15,520 11,21,082 50,74,172 1,89,634 24,96,110 86,386 11,22,40,141 40,72,452 40,20,253 1,42,963
Jun-14 21 89,61,673 3,39,666 2,14,79,352 8,34,723 3,93,86,497 15,23,445 3,71,62,670 13,74,368 52,90,089 2,13,745 21,76,410 82,241 11,44,56,691 43,68,187 40,16,499 1,51,176
Jul-14 22 95,54,373 3,66,322 2,06,23,544 8,04,572 4,54,55,235 17,91,155 4,26,65,214 16,05,395 50,86,637 2,05,523 24,07,827 91,008 12,57,92,830 48,63,975 35,45,207 1,32,772
Aug-14 19 73,70,447 2,86,261 1,57,50,587 6,09,162 3,82,46,760 15,21,659 3,86,75,751 14,86,726 42,21,191 1,68,328 21,88,275 82,712 10,64,53,011 41,54,849 37,45,102 1,43,254
Sep-14 22 82,75,270 3,32,662 1,85,98,889 7,34,203 4,61,52,041 18,93,485 4,60,23,582 18,31,347 52,67,835 2,12,052 26,22,800 98,536 12,69,40,417 51,02,285 45,48,778 1,73,279
Oct-14 18 72,42,848 2,78,779 1,49,06,874 5,54,556 3,93,69,465 15,38,062 3,93,89,871 14,91,130 46,58,191 1,80,100 24,94,343 90,118 10,80,61,592 41,32,744 72,65,311 1,81,244
Nov-14 18 99,84,456 2,61,335 2,05,21,972 6,28,954 6,17,39,870 14,27,993 6,81,33,114 15,20,564 54,97,875 1,81,306 28,51,166 90,369 16,87,28,453 41,10,522 69,97,310 1,84,167
Dec-14 22 1,35,29,076 3,54,147 2,07,09,029 6,35,492 9,42,17,969 21,51,350 8,96,67,817 19,85,605 51,92,378 1,69,307 26,06,426 80,874 22,59,22,695 53,76,775 68,29,261 1,74,855
Note: Notional Turnover = (Strike Price + Premium) * Quantity.
Source: NSE.
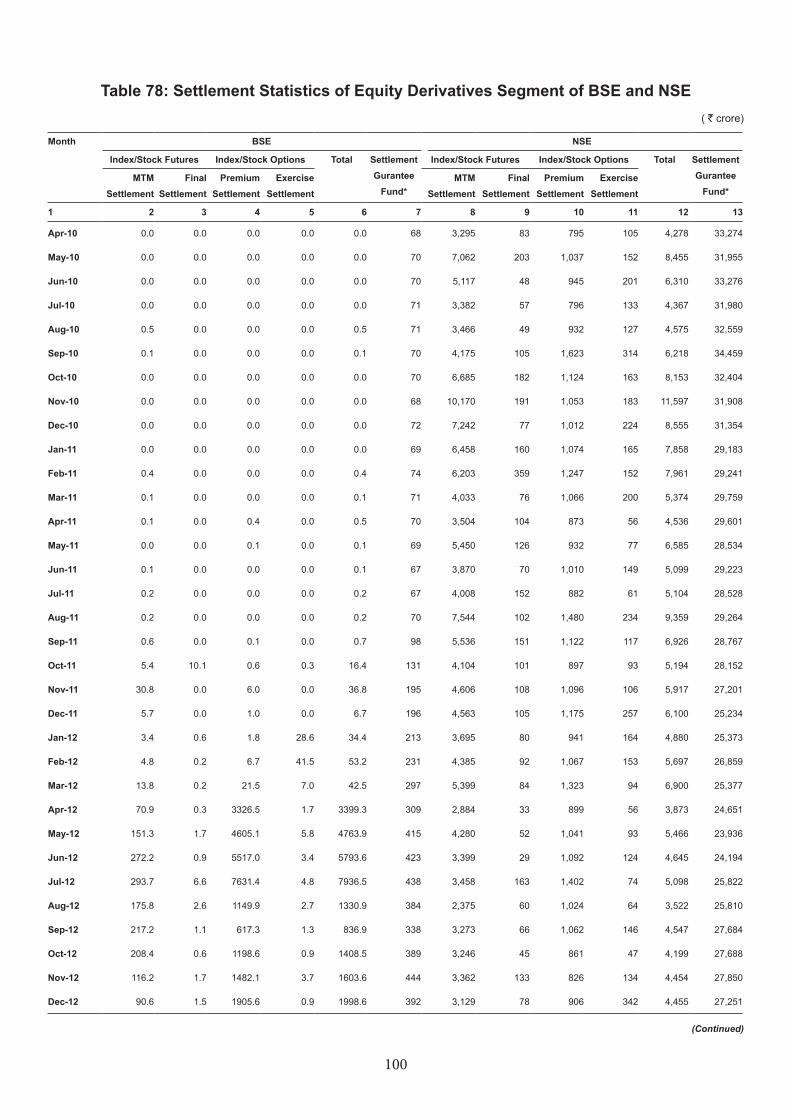
100
Table 78: Settlement Statistics of Equity Derivatives Segment of BSE and NSE
Month BSE NSE
Index/Stock Futures Index/Stock Options Total Settlement Gurantee
Fund*
Index/Stock Futures Index/Stock Options Total Settlement Gurantee
Fund*MTM
SettlementFinal
SettlementPremium
SettlementExercise
SettlementMTM
SettlementFinal
SettlementPremium
SettlementExercise
Settlement
1 2 3 4 5 6 7 8 9 10 11 12 13
Apr-10 0.0 0.0 0.0 0.0 0.0 68 3,295 83 795 105 4,278 33,274
May-10 0.0 0.0 0.0 0.0 0.0 70 7,062 203 1,037 152 8,455 31,955
Jun-10 0.0 0.0 0.0 0.0 0.0 70 5,117 48 945 201 6,310 33,276
Jul-10 0.0 0.0 0.0 0.0 0.0 71 3,382 57 796 133 4,367 31,980
Aug-10 0.5 0.0 0.0 0.0 0.5 71 3,466 49 932 127 4,575 32,559
Sep-10 0.1 0.0 0.0 0.0 0.1 70 4,175 105 1,623 314 6,218 34,459
Oct-10 0.0 0.0 0.0 0.0 0.0 70 6,685 182 1,124 163 8,153 32,404
Nov-10 0.0 0.0 0.0 0.0 0.0 68 10,170 191 1,053 183 11,597 31,908
Dec-10 0.0 0.0 0.0 0.0 0.0 72 7,242 77 1,012 224 8,555 31,354
Jan-11 0.0 0.0 0.0 0.0 0.0 69 6,458 160 1,074 165 7,858 29,183
Feb-11 0.4 0.0 0.0 0.0 0.4 74 6,203 359 1,247 152 7,961 29,241
Mar-11 0.1 0.0 0.0 0.0 0.1 71 4,033 76 1,066 200 5,374 29,759
Apr-11 0.1 0.0 0.4 0.0 0.5 70 3,504 104 873 56 4,536 29,601
May-11 0.0 0.0 0.1 0.0 0.1 69 5,450 126 932 77 6,585 28,534
Jun-11 0.1 0.0 0.0 0.0 0.1 67 3,870 70 1,010 149 5,099 29,223
Jul-11 0.2 0.0 0.0 0.0 0.2 67 4,008 152 882 61 5,104 28,528
Aug-11 0.2 0.0 0.0 0.0 0.2 70 7,544 102 1,480 234 9,359 29,264
Sep-11 0.6 0.0 0.1 0.0 0.7 98 5,536 151 1,122 117 6,926 28,767
Oct-11 5.4 10.1 0.6 0.3 16.4 131 4,104 101 897 93 5,194 28,152
Nov-11 30.8 0.0 6.0 0.0 36.8 195 4,606 108 1,096 106 5,917 27,201
Dec-11 5.7 0.0 1.0 0.0 6.7 196 4,563 105 1,175 257 6,100 25,234
Jan-12 3.4 0.6 1.8 28.6 34.4 213 3,695 80 941 164 4,880 25,373
Feb-12 4.8 0.2 6.7 41.5 53.2 231 4,385 92 1,067 153 5,697 26,859
Mar-12 13.8 0.2 21.5 7.0 42.5 297 5,399 84 1,323 94 6,900 25,377
Apr-12 70.9 0.3 3326.5 1.7 3399.3 309 2,884 33 899 56 3,873 24,651
May-12 151.3 1.7 4605.1 5.8 4763.9 415 4,280 52 1,041 93 5,466 23,936
Jun-12 272.2 0.9 5517.0 3.4 5793.6 423 3,399 29 1,092 124 4,645 24,194
Jul-12 293.7 6.6 7631.4 4.8 7936.5 438 3,458 163 1,402 74 5,098 25,822
Aug-12 175.8 2.6 1149.9 2.7 1330.9 384 2,375 60 1,024 64 3,522 25,810
Sep-12 217.2 1.1 617.3 1.3 836.9 338 3,273 66 1,062 146 4,547 27,684
Oct-12 208.4 0.6 1198.6 0.9 1408.5 389 3,246 45 861 47 4,199 27,688
Nov-12 116.2 1.7 1482.1 3.7 1603.6 444 3,362 133 826 134 4,454 27,850
Dec-12 90.6 1.5 1905.6 0.9 1998.6 392 3,129 78 906 342 4,455 27,251
( ` crore)
(Continued)
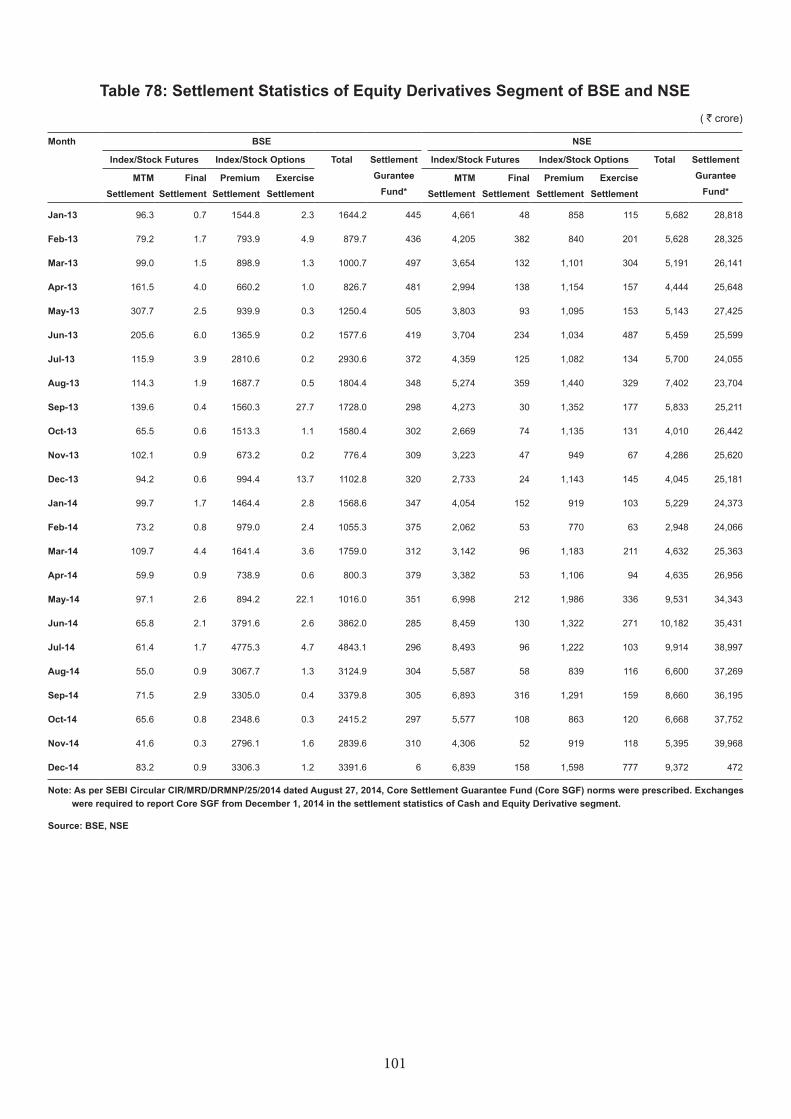
101
Table 78: Settlement Statistics of Equity Derivatives Segment of BSE and NSE
Month BSE NSE
Index/Stock Futures Index/Stock Options Total Settlement Gurantee
Fund*
Index/Stock Futures Index/Stock Options Total Settlement Gurantee
Fund*MTM
SettlementFinal
SettlementPremium
SettlementExercise
SettlementMTM
SettlementFinal
SettlementPremium
SettlementExercise
Settlement
Jan-13 96.3 0.7 1544.8 2.3 1644.2 445 4,661 48 858 115 5,682 28,818
Feb-13 79.2 1.7 793.9 4.9 879.7 436 4,205 382 840 201 5,628 28,325
Mar-13 99.0 1.5 898.9 1.3 1000.7 497 3,654 132 1,101 304 5,191 26,141
Apr-13 161.5 4.0 660.2 1.0 826.7 481 2,994 138 1,154 157 4,444 25,648
May-13 307.7 2.5 939.9 0.3 1250.4 505 3,803 93 1,095 153 5,143 27,425
Jun-13 205.6 6.0 1365.9 0.2 1577.6 419 3,704 234 1,034 487 5,459 25,599
Jul-13 115.9 3.9 2810.6 0.2 2930.6 372 4,359 125 1,082 134 5,700 24,055
Aug-13 114.3 1.9 1687.7 0.5 1804.4 348 5,274 359 1,440 329 7,402 23,704
Sep-13 139.6 0.4 1560.3 27.7 1728.0 298 4,273 30 1,352 177 5,833 25,211
Oct-13 65.5 0.6 1513.3 1.1 1580.4 302 2,669 74 1,135 131 4,010 26,442
Nov-13 102.1 0.9 673.2 0.2 776.4 309 3,223 47 949 67 4,286 25,620
Dec-13 94.2 0.6 994.4 13.7 1102.8 320 2,733 24 1,143 145 4,045 25,181
Jan-14 99.7 1.7 1464.4 2.8 1568.6 347 4,054 152 919 103 5,229 24,373
Feb-14 73.2 0.8 979.0 2.4 1055.3 375 2,062 53 770 63 2,948 24,066
Mar-14 109.7 4.4 1641.4 3.6 1759.0 312 3,142 96 1,183 211 4,632 25,363
Apr-14 59.9 0.9 738.9 0.6 800.3 379 3,382 53 1,106 94 4,635 26,956
May-14 97.1 2.6 894.2 22.1 1016.0 351 6,998 212 1,986 336 9,531 34,343
Jun-14 65.8 2.1 3791.6 2.6 3862.0 285 8,459 130 1,322 271 10,182 35,431
Jul-14 61.4 1.7 4775.3 4.7 4843.1 296 8,493 96 1,222 103 9,914 38,997
Aug-14 55.0 0.9 3067.7 1.3 3124.9 304 5,587 58 839 116 6,600 37,269
Sep-14 71.5 2.9 3305.0 0.4 3379.8 305 6,893 316 1,291 159 8,660 36,195
Oct-14 65.6 0.8 2348.6 0.3 2415.2 297 5,577 108 863 120 6,668 37,752
Nov-14 41.6 0.3 2796.1 1.6 2839.6 310 4,306 52 919 118 5,395 39,968
Dec-14 83.2 0.9 3306.3 1.2 3391.6 6 6,839 158 1,598 777 9,372 472
Note: As per SEBI Circular CIR/MRD/DRMNP/25/2014 dated August 27, 2014, Core Settlement Guarantee Fund (Core SGF) norms were prescribed. Exchanges were required to report Core SGF from December 1, 2014 in the settlement statistics of Cash and Equity Derivative segment.
Source: BSE, NSE
( ` crore)
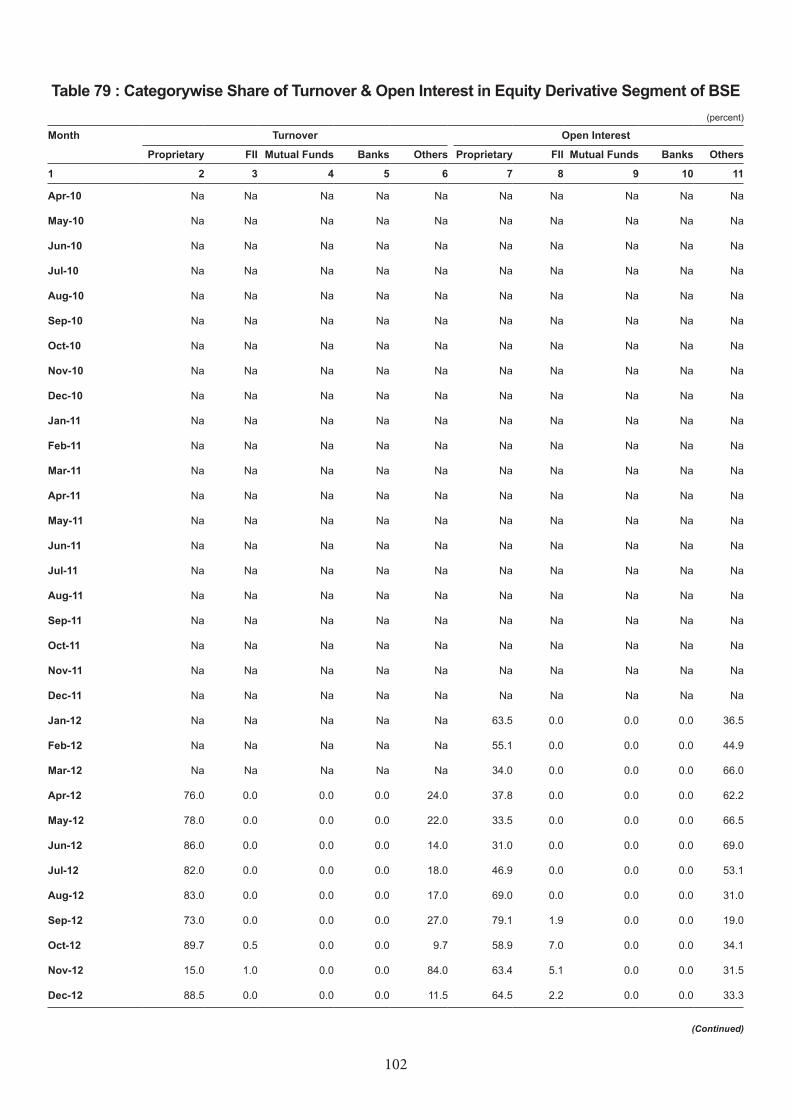
102
Table 79 : Categorywise Share of Turnover & Open Interest in Equity Derivative Segment of BSE (percent)
Month Turnover Open Interest
Proprietary FII Mutual Funds Banks Others Proprietary FII Mutual Funds Banks Others
1 2 3 4 5 6 7 8 9 10 11
Apr-10 Na Na Na Na Na Na Na Na Na Na
May-10 Na Na Na Na Na Na Na Na Na Na
Jun-10 Na Na Na Na Na Na Na Na Na Na
Jul-10 Na Na Na Na Na Na Na Na Na Na
Aug-10 Na Na Na Na Na Na Na Na Na Na
Sep-10 Na Na Na Na Na Na Na Na Na Na
Oct-10 Na Na Na Na Na Na Na Na Na Na
Nov-10 Na Na Na Na Na Na Na Na Na Na
Dec-10 Na Na Na Na Na Na Na Na Na Na
Jan-11 Na Na Na Na Na Na Na Na Na Na
Feb-11 Na Na Na Na Na Na Na Na Na Na
Mar-11 Na Na Na Na Na Na Na Na Na Na
Apr-11 Na Na Na Na Na Na Na Na Na Na
May-11 Na Na Na Na Na Na Na Na Na Na
Jun-11 Na Na Na Na Na Na Na Na Na Na
Jul-11 Na Na Na Na Na Na Na Na Na Na
Aug-11 Na Na Na Na Na Na Na Na Na Na
Sep-11 Na Na Na Na Na Na Na Na Na Na
Oct-11 Na Na Na Na Na Na Na Na Na Na
Nov-11 Na Na Na Na Na Na Na Na Na Na
Dec-11 Na Na Na Na Na Na Na Na Na Na
Jan-12 Na Na Na Na Na 63.5 0.0 0.0 0.0 36.5
Feb-12 Na Na Na Na Na 55.1 0.0 0.0 0.0 44.9
Mar-12 Na Na Na Na Na 34.0 0.0 0.0 0.0 66.0
Apr-12 76.0 0.0 0.0 0.0 24.0 37.8 0.0 0.0 0.0 62.2
May-12 78.0 0.0 0.0 0.0 22.0 33.5 0.0 0.0 0.0 66.5
Jun-12 86.0 0.0 0.0 0.0 14.0 31.0 0.0 0.0 0.0 69.0
Jul-12 82.0 0.0 0.0 0.0 18.0 46.9 0.0 0.0 0.0 53.1
Aug-12 83.0 0.0 0.0 0.0 17.0 69.0 0.0 0.0 0.0 31.0
Sep-12 73.0 0.0 0.0 0.0 27.0 79.1 1.9 0.0 0.0 19.0
Oct-12 89.7 0.5 0.0 0.0 9.7 58.9 7.0 0.0 0.0 34.1
Nov-12 15.0 1.0 0.0 0.0 84.0 63.4 5.1 0.0 0.0 31.5
Dec-12 88.5 0.0 0.0 0.0 11.5 64.5 2.2 0.0 0.0 33.3
(Continued)
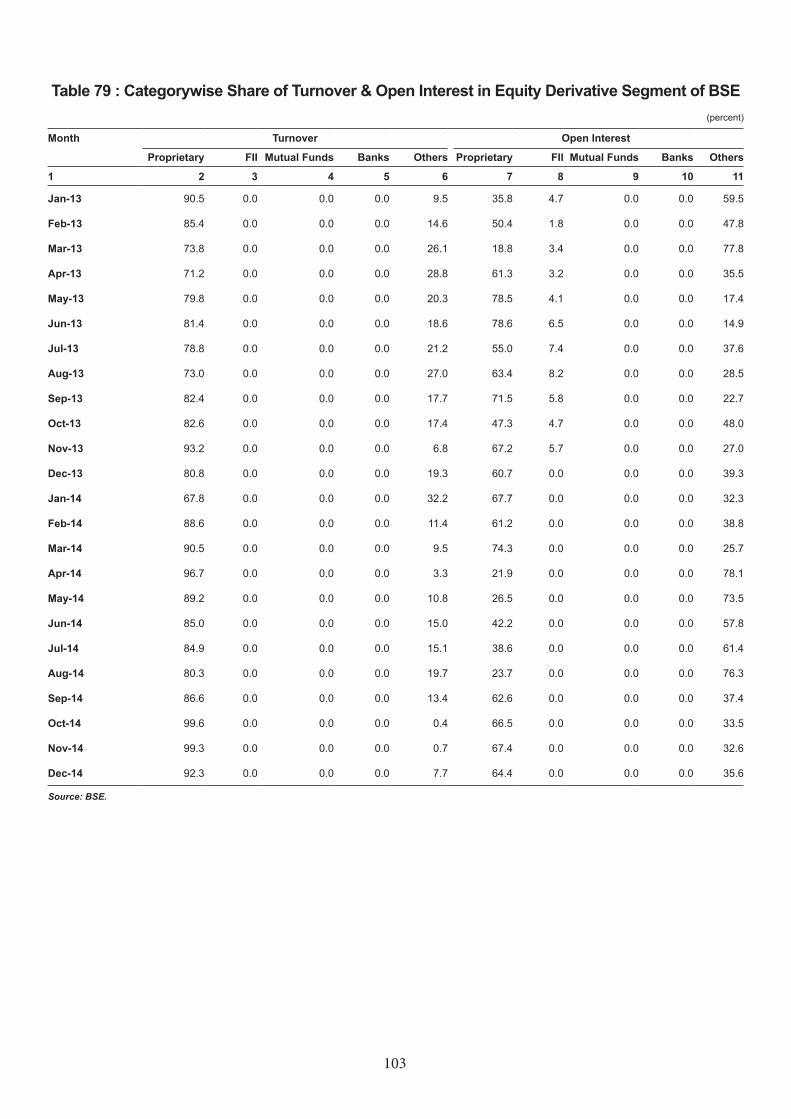
103
Table 79 : Categorywise Share of Turnover & Open Interest in Equity Derivative Segment of BSE (percent)
Month Turnover Open Interest
Proprietary FII Mutual Funds Banks Others Proprietary FII Mutual Funds Banks Others
1 2 3 4 5 6 7 8 9 10 11
Jan-13 90.5 0.0 0.0 0.0 9.5 35.8 4.7 0.0 0.0 59.5
Feb-13 85.4 0.0 0.0 0.0 14.6 50.4 1.8 0.0 0.0 47.8
Mar-13 73.8 0.0 0.0 0.0 26.1 18.8 3.4 0.0 0.0 77.8
Apr-13 71.2 0.0 0.0 0.0 28.8 61.3 3.2 0.0 0.0 35.5
May-13 79.8 0.0 0.0 0.0 20.3 78.5 4.1 0.0 0.0 17.4
Jun-13 81.4 0.0 0.0 0.0 18.6 78.6 6.5 0.0 0.0 14.9
Jul-13 78.8 0.0 0.0 0.0 21.2 55.0 7.4 0.0 0.0 37.6
Aug-13 73.0 0.0 0.0 0.0 27.0 63.4 8.2 0.0 0.0 28.5
Sep-13 82.4 0.0 0.0 0.0 17.7 71.5 5.8 0.0 0.0 22.7
Oct-13 82.6 0.0 0.0 0.0 17.4 47.3 4.7 0.0 0.0 48.0
Nov-13 93.2 0.0 0.0 0.0 6.8 67.2 5.7 0.0 0.0 27.0
Dec-13 80.8 0.0 0.0 0.0 19.3 60.7 0.0 0.0 0.0 39.3
Jan-14 67.8 0.0 0.0 0.0 32.2 67.7 0.0 0.0 0.0 32.3
Feb-14 88.6 0.0 0.0 0.0 11.4 61.2 0.0 0.0 0.0 38.8
Mar-14 90.5 0.0 0.0 0.0 9.5 74.3 0.0 0.0 0.0 25.7
Apr-14 96.7 0.0 0.0 0.0 3.3 21.9 0.0 0.0 0.0 78.1
May-14 89.2 0.0 0.0 0.0 10.8 26.5 0.0 0.0 0.0 73.5
Jun-14 85.0 0.0 0.0 0.0 15.0 42.2 0.0 0.0 0.0 57.8
Jul-14 84.9 0.0 0.0 0.0 15.1 38.6 0.0 0.0 0.0 61.4
Aug-14 80.3 0.0 0.0 0.0 19.7 23.7 0.0 0.0 0.0 76.3
Sep-14 86.6 0.0 0.0 0.0 13.4 62.6 0.0 0.0 0.0 37.4
Oct-14 99.6 0.0 0.0 0.0 0.4 66.5 0.0 0.0 0.0 33.5
Nov-14 99.3 0.0 0.0 0.0 0.7 67.4 0.0 0.0 0.0 32.6
Dec-14 92.3 0.0 0.0 0.0 7.7 64.4 0.0 0.0 0.0 35.6
Source: BSE.
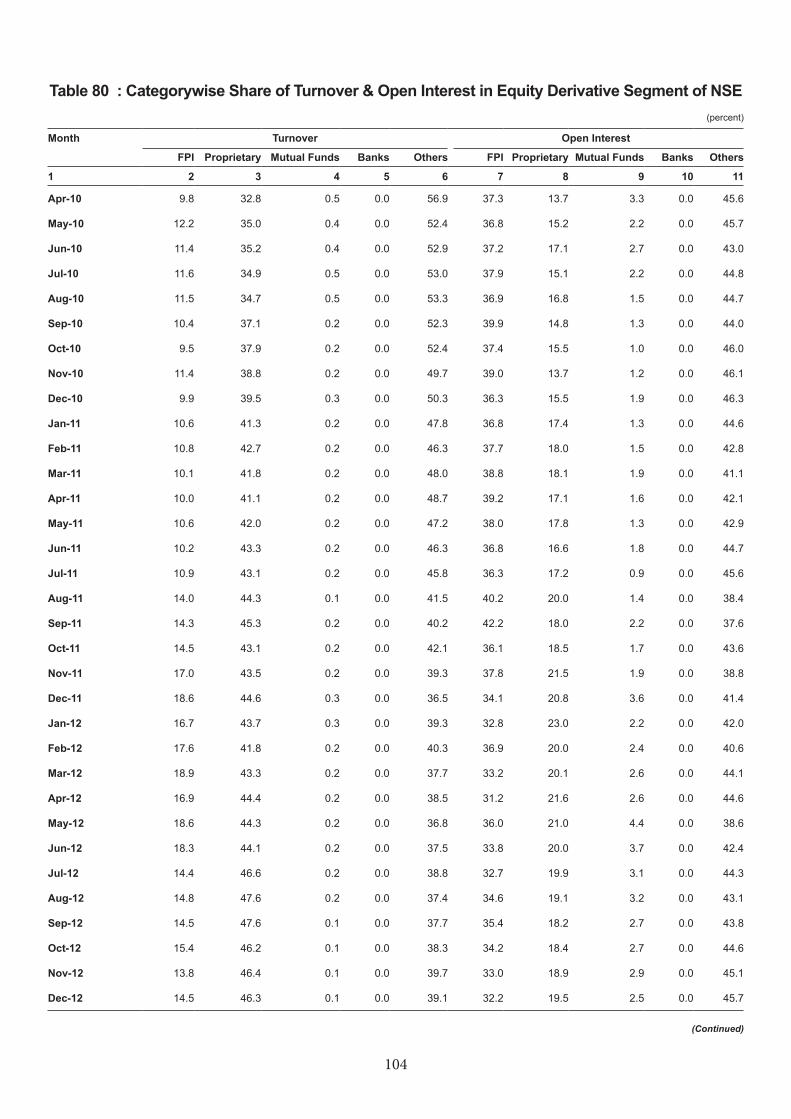
104
Month Turnover Open Interest
FPI Proprietary Mutual Funds Banks Others FPI Proprietary Mutual Funds Banks Others
1 2 3 4 5 6 7 8 9 10 11
Apr-10 9.8 32.8 0.5 0.0 56.9 37.3 13.7 3.3 0.0 45.6
May-10 12.2 35.0 0.4 0.0 52.4 36.8 15.2 2.2 0.0 45.7
Jun-10 11.4 35.2 0.4 0.0 52.9 37.2 17.1 2.7 0.0 43.0
Jul-10 11.6 34.9 0.5 0.0 53.0 37.9 15.1 2.2 0.0 44.8
Aug-10 11.5 34.7 0.5 0.0 53.3 36.9 16.8 1.5 0.0 44.7
Sep-10 10.4 37.1 0.2 0.0 52.3 39.9 14.8 1.3 0.0 44.0
Oct-10 9.5 37.9 0.2 0.0 52.4 37.4 15.5 1.0 0.0 46.0
Nov-10 11.4 38.8 0.2 0.0 49.7 39.0 13.7 1.2 0.0 46.1
Dec-10 9.9 39.5 0.3 0.0 50.3 36.3 15.5 1.9 0.0 46.3
Jan-11 10.6 41.3 0.2 0.0 47.8 36.8 17.4 1.3 0.0 44.6
Feb-11 10.8 42.7 0.2 0.0 46.3 37.7 18.0 1.5 0.0 42.8
Mar-11 10.1 41.8 0.2 0.0 48.0 38.8 18.1 1.9 0.0 41.1
Apr-11 10.0 41.1 0.2 0.0 48.7 39.2 17.1 1.6 0.0 42.1
May-11 10.6 42.0 0.2 0.0 47.2 38.0 17.8 1.3 0.0 42.9
Jun-11 10.2 43.3 0.2 0.0 46.3 36.8 16.6 1.8 0.0 44.7
Jul-11 10.9 43.1 0.2 0.0 45.8 36.3 17.2 0.9 0.0 45.6
Aug-11 14.0 44.3 0.1 0.0 41.5 40.2 20.0 1.4 0.0 38.4
Sep-11 14.3 45.3 0.2 0.0 40.2 42.2 18.0 2.2 0.0 37.6
Oct-11 14.5 43.1 0.2 0.0 42.1 36.1 18.5 1.7 0.0 43.6
Nov-11 17.0 43.5 0.2 0.0 39.3 37.8 21.5 1.9 0.0 38.8
Dec-11 18.6 44.6 0.3 0.0 36.5 34.1 20.8 3.6 0.0 41.4
Jan-12 16.7 43.7 0.3 0.0 39.3 32.8 23.0 2.2 0.0 42.0
Feb-12 17.6 41.8 0.2 0.0 40.3 36.9 20.0 2.4 0.0 40.6
Mar-12 18.9 43.3 0.2 0.0 37.7 33.2 20.1 2.6 0.0 44.1
Apr-12 16.9 44.4 0.2 0.0 38.5 31.2 21.6 2.6 0.0 44.6
May-12 18.6 44.3 0.2 0.0 36.8 36.0 21.0 4.4 0.0 38.6
Jun-12 18.3 44.1 0.2 0.0 37.5 33.8 20.0 3.7 0.0 42.4
Jul-12 14.4 46.6 0.2 0.0 38.8 32.7 19.9 3.1 0.0 44.3
Aug-12 14.8 47.6 0.2 0.0 37.4 34.6 19.1 3.2 0.0 43.1
Sep-12 14.5 47.6 0.1 0.0 37.7 35.4 18.2 2.7 0.0 43.8
Oct-12 15.4 46.2 0.1 0.0 38.3 34.2 18.4 2.7 0.0 44.6
Nov-12 13.8 46.4 0.1 0.0 39.7 33.0 18.9 2.9 0.0 45.1
Dec-12 14.5 46.3 0.1 0.0 39.1 32.2 19.5 2.5 0.0 45.7
(Continued)
Table 80 : Categorywise Share of Turnover & Open Interest in Equity Derivative Segment of NSE (percent)
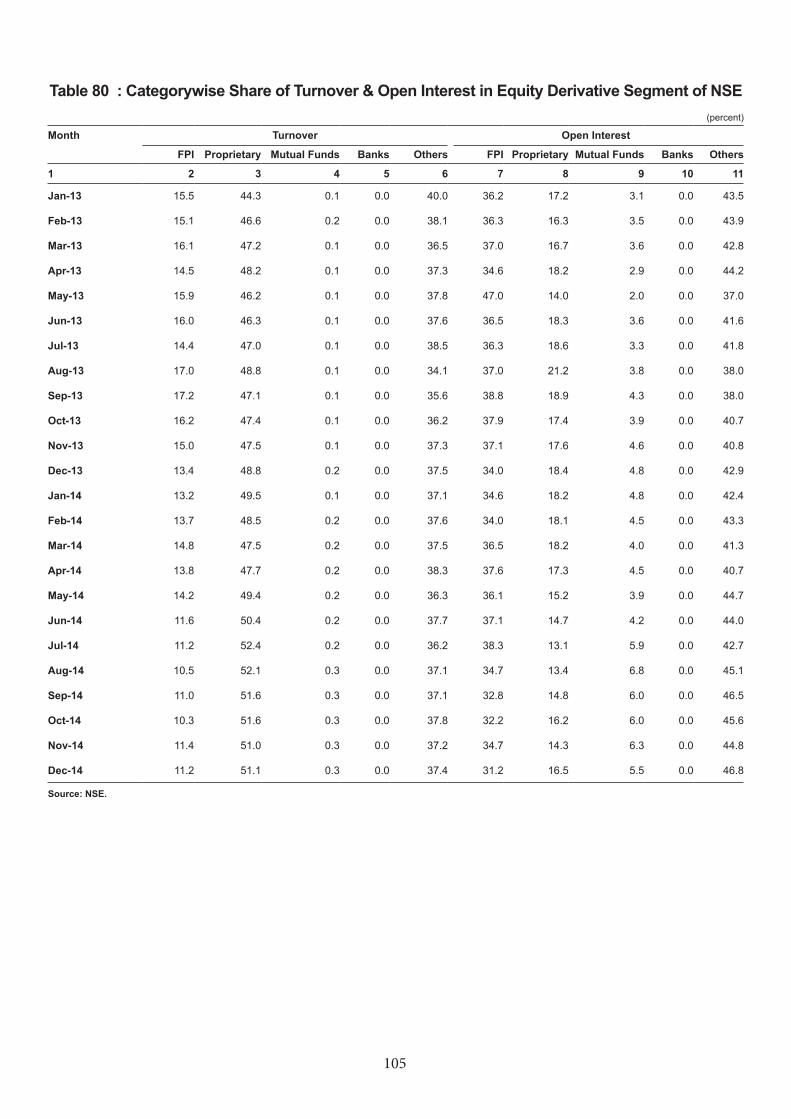
105
Month Turnover Open Interest
FPI Proprietary Mutual Funds Banks Others FPI Proprietary Mutual Funds Banks Others
1 2 3 4 5 6 7 8 9 10 11
Jan-13 15.5 44.3 0.1 0.0 40.0 36.2 17.2 3.1 0.0 43.5
Feb-13 15.1 46.6 0.2 0.0 38.1 36.3 16.3 3.5 0.0 43.9
Mar-13 16.1 47.2 0.1 0.0 36.5 37.0 16.7 3.6 0.0 42.8
Apr-13 14.5 48.2 0.1 0.0 37.3 34.6 18.2 2.9 0.0 44.2
May-13 15.9 46.2 0.1 0.0 37.8 47.0 14.0 2.0 0.0 37.0
Jun-13 16.0 46.3 0.1 0.0 37.6 36.5 18.3 3.6 0.0 41.6
Jul-13 14.4 47.0 0.1 0.0 38.5 36.3 18.6 3.3 0.0 41.8
Aug-13 17.0 48.8 0.1 0.0 34.1 37.0 21.2 3.8 0.0 38.0
Sep-13 17.2 47.1 0.1 0.0 35.6 38.8 18.9 4.3 0.0 38.0
Oct-13 16.2 47.4 0.1 0.0 36.2 37.9 17.4 3.9 0.0 40.7
Nov-13 15.0 47.5 0.1 0.0 37.3 37.1 17.6 4.6 0.0 40.8
Dec-13 13.4 48.8 0.2 0.0 37.5 34.0 18.4 4.8 0.0 42.9
Jan-14 13.2 49.5 0.1 0.0 37.1 34.6 18.2 4.8 0.0 42.4
Feb-14 13.7 48.5 0.2 0.0 37.6 34.0 18.1 4.5 0.0 43.3
Mar-14 14.8 47.5 0.2 0.0 37.5 36.5 18.2 4.0 0.0 41.3
Apr-14 13.8 47.7 0.2 0.0 38.3 37.6 17.3 4.5 0.0 40.7
May-14 14.2 49.4 0.2 0.0 36.3 36.1 15.2 3.9 0.0 44.7
Jun-14 11.6 50.4 0.2 0.0 37.7 37.1 14.7 4.2 0.0 44.0
Jul-14 11.2 52.4 0.2 0.0 36.2 38.3 13.1 5.9 0.0 42.7
Aug-14 10.5 52.1 0.3 0.0 37.1 34.7 13.4 6.8 0.0 45.1
Sep-14 11.0 51.6 0.3 0.0 37.1 32.8 14.8 6.0 0.0 46.5
Oct-14 10.3 51.6 0.3 0.0 37.8 32.2 16.2 6.0 0.0 45.6
Nov-14 11.4 51.0 0.3 0.0 37.2 34.7 14.3 6.3 0.0 44.8
Dec-14 11.2 51.1 0.3 0.0 37.4 31.2 16.5 5.5 0.0 46.8
Source: NSE.
Table 80 : Categorywise Share of Turnover & Open Interest in Equity Derivative Segment of NSE (percent)
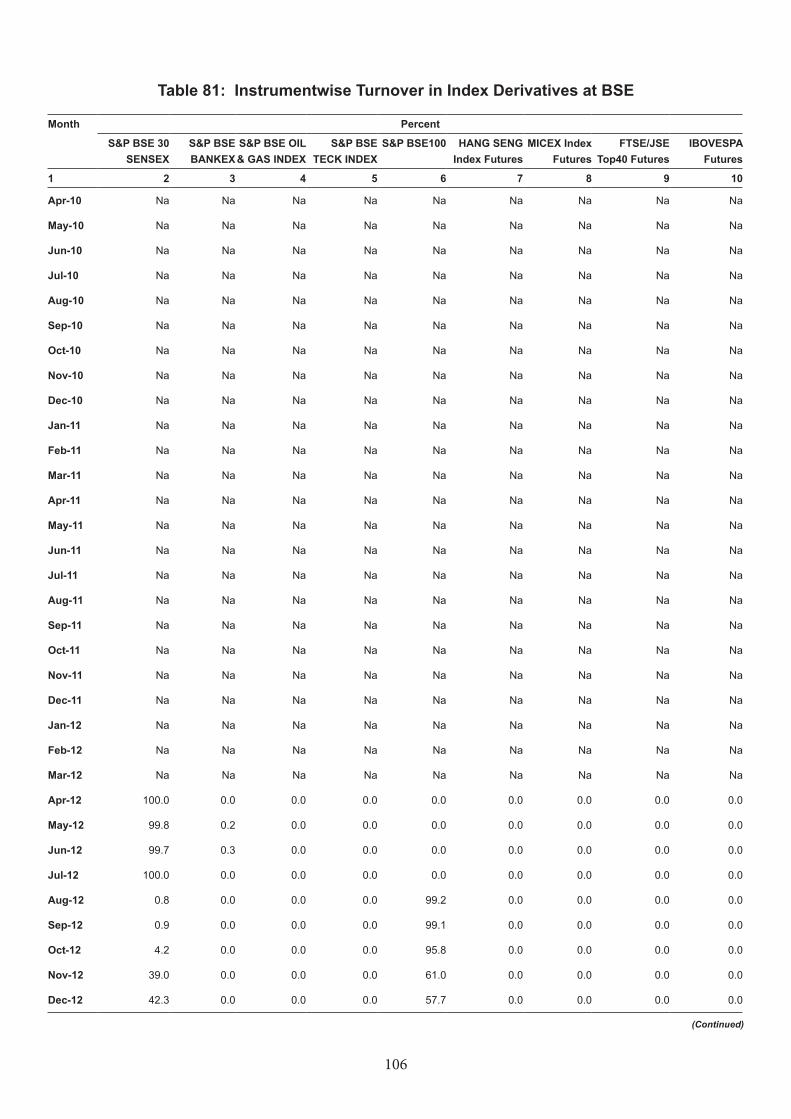
106
Table 81: Instrumentwise Turnover in Index Derivatives at BSE
Month Percent
S&P BSE 30 SENSEX
S&P BSE BANKEX
S&P BSE OIL & GAS INDEX
S&P BSE TECK INDEX
S&P BSE100 HANG SENG Index Futures
MICEX Index Futures
FTSE/JSE Top40 Futures
IBOVESPA Futures
1 2 3 4 5 6 7 8 9 10
Apr-10 Na Na Na Na Na Na Na Na Na
May-10 Na Na Na Na Na Na Na Na Na
Jun-10 Na Na Na Na Na Na Na Na Na
Jul-10 Na Na Na Na Na Na Na Na Na
Aug-10 Na Na Na Na Na Na Na Na Na
Sep-10 Na Na Na Na Na Na Na Na Na
Oct-10 Na Na Na Na Na Na Na Na Na
Nov-10 Na Na Na Na Na Na Na Na Na
Dec-10 Na Na Na Na Na Na Na Na Na
Jan-11 Na Na Na Na Na Na Na Na Na
Feb-11 Na Na Na Na Na Na Na Na Na
Mar-11 Na Na Na Na Na Na Na Na Na
Apr-11 Na Na Na Na Na Na Na Na Na
May-11 Na Na Na Na Na Na Na Na Na
Jun-11 Na Na Na Na Na Na Na Na Na
Jul-11 Na Na Na Na Na Na Na Na Na
Aug-11 Na Na Na Na Na Na Na Na Na
Sep-11 Na Na Na Na Na Na Na Na Na
Oct-11 Na Na Na Na Na Na Na Na Na
Nov-11 Na Na Na Na Na Na Na Na Na
Dec-11 Na Na Na Na Na Na Na Na Na
Jan-12 Na Na Na Na Na Na Na Na Na
Feb-12 Na Na Na Na Na Na Na Na Na
Mar-12 Na Na Na Na Na Na Na Na Na
Apr-12 100.0 0.0 0.0 0.0 0.0 0.0 0.0 0.0 0.0
May-12 99.8 0.2 0.0 0.0 0.0 0.0 0.0 0.0 0.0
Jun-12 99.7 0.3 0.0 0.0 0.0 0.0 0.0 0.0 0.0
Jul-12 100.0 0.0 0.0 0.0 0.0 0.0 0.0 0.0 0.0
Aug-12 0.8 0.0 0.0 0.0 99.2 0.0 0.0 0.0 0.0
Sep-12 0.9 0.0 0.0 0.0 99.1 0.0 0.0 0.0 0.0
Oct-12 4.2 0.0 0.0 0.0 95.8 0.0 0.0 0.0 0.0
Nov-12 39.0 0.0 0.0 0.0 61.0 0.0 0.0 0.0 0.0
Dec-12 42.3 0.0 0.0 0.0 57.7 0.0 0.0 0.0 0.0
(Continued)
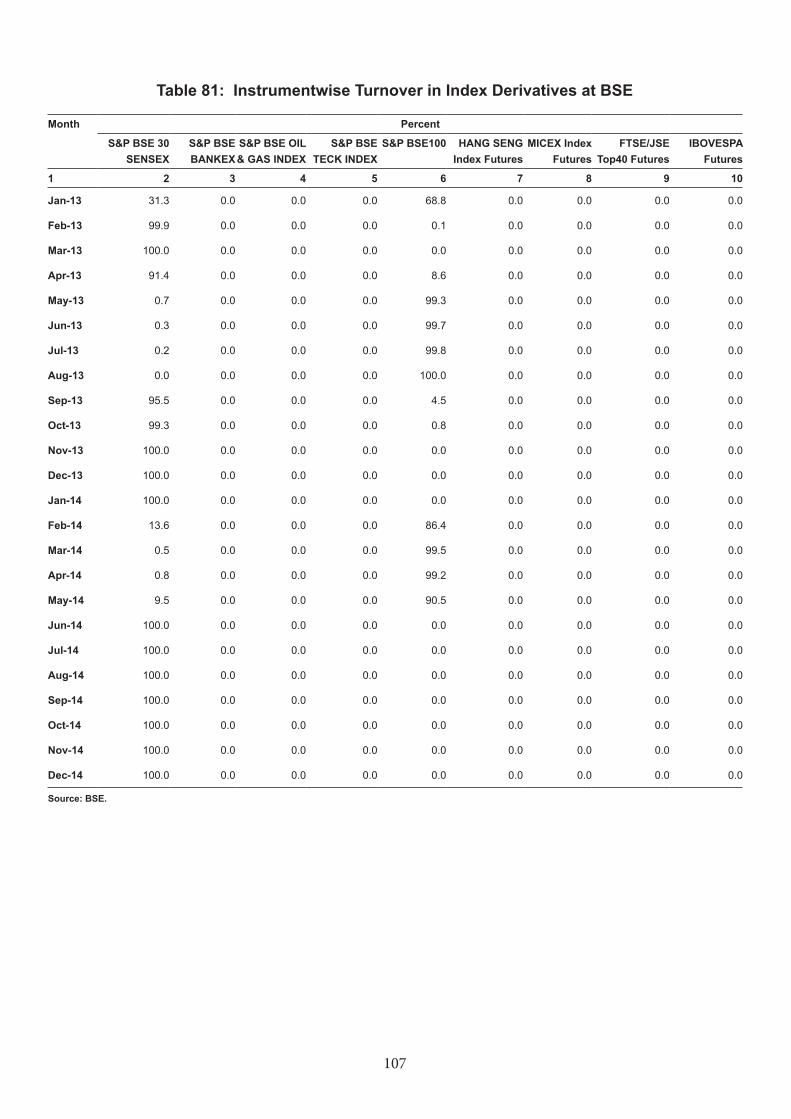
107
Table 81: Instrumentwise Turnover in Index Derivatives at BSE
Month Percent
S&P BSE 30 SENSEX
S&P BSE BANKEX
S&P BSE OIL & GAS INDEX
S&P BSE TECK INDEX
S&P BSE100 HANG SENG Index Futures
MICEX Index Futures
FTSE/JSE Top40 Futures
IBOVESPA Futures
1 2 3 4 5 6 7 8 9 10
Jan-13 31.3 0.0 0.0 0.0 68.8 0.0 0.0 0.0 0.0
Feb-13 99.9 0.0 0.0 0.0 0.1 0.0 0.0 0.0 0.0
Mar-13 100.0 0.0 0.0 0.0 0.0 0.0 0.0 0.0 0.0
Apr-13 91.4 0.0 0.0 0.0 8.6 0.0 0.0 0.0 0.0
May-13 0.7 0.0 0.0 0.0 99.3 0.0 0.0 0.0 0.0
Jun-13 0.3 0.0 0.0 0.0 99.7 0.0 0.0 0.0 0.0
Jul-13 0.2 0.0 0.0 0.0 99.8 0.0 0.0 0.0 0.0
Aug-13 0.0 0.0 0.0 0.0 100.0 0.0 0.0 0.0 0.0
Sep-13 95.5 0.0 0.0 0.0 4.5 0.0 0.0 0.0 0.0
Oct-13 99.3 0.0 0.0 0.0 0.8 0.0 0.0 0.0 0.0
Nov-13 100.0 0.0 0.0 0.0 0.0 0.0 0.0 0.0 0.0
Dec-13 100.0 0.0 0.0 0.0 0.0 0.0 0.0 0.0 0.0
Jan-14 100.0 0.0 0.0 0.0 0.0 0.0 0.0 0.0 0.0
Feb-14 13.6 0.0 0.0 0.0 86.4 0.0 0.0 0.0 0.0
Mar-14 0.5 0.0 0.0 0.0 99.5 0.0 0.0 0.0 0.0
Apr-14 0.8 0.0 0.0 0.0 99.2 0.0 0.0 0.0 0.0
May-14 9.5 0.0 0.0 0.0 90.5 0.0 0.0 0.0 0.0
Jun-14 100.0 0.0 0.0 0.0 0.0 0.0 0.0 0.0 0.0
Jul-14 100.0 0.0 0.0 0.0 0.0 0.0 0.0 0.0 0.0
Aug-14 100.0 0.0 0.0 0.0 0.0 0.0 0.0 0.0 0.0
Sep-14 100.0 0.0 0.0 0.0 0.0 0.0 0.0 0.0 0.0
Oct-14 100.0 0.0 0.0 0.0 0.0 0.0 0.0 0.0 0.0
Nov-14 100.0 0.0 0.0 0.0 0.0 0.0 0.0 0.0 0.0
Dec-14 100.0 0.0 0.0 0.0 0.0 0.0 0.0 0.0 0.0
Source: BSE.
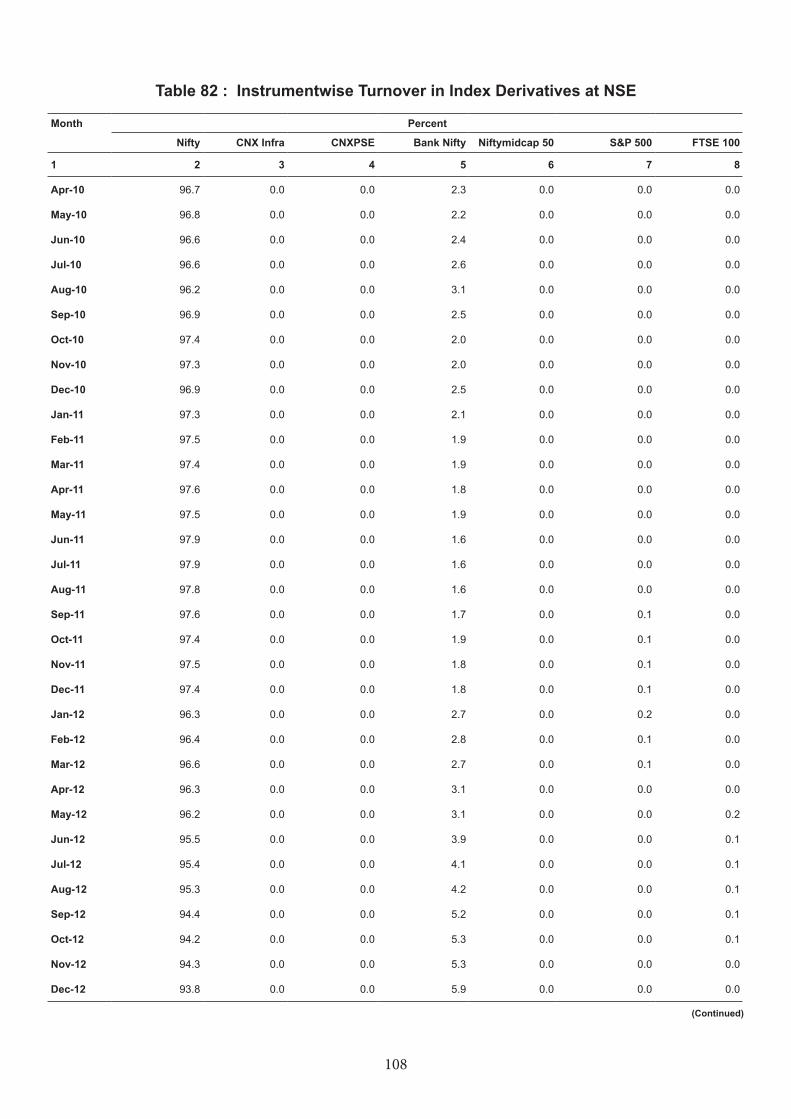
108
Table 82 : Instrumentwise Turnover in Index Derivatives at NSE
Month Percent
Nifty CNX Infra CNXPSE Bank Nifty Niftymidcap 50 S&P 500 FTSE 100
1 2 3 4 5 6 7 8
Apr-10 96.7 0.0 0.0 2.3 0.0 0.0 0.0
May-10 96.8 0.0 0.0 2.2 0.0 0.0 0.0
Jun-10 96.6 0.0 0.0 2.4 0.0 0.0 0.0
Jul-10 96.6 0.0 0.0 2.6 0.0 0.0 0.0
Aug-10 96.2 0.0 0.0 3.1 0.0 0.0 0.0
Sep-10 96.9 0.0 0.0 2.5 0.0 0.0 0.0
Oct-10 97.4 0.0 0.0 2.0 0.0 0.0 0.0
Nov-10 97.3 0.0 0.0 2.0 0.0 0.0 0.0
Dec-10 96.9 0.0 0.0 2.5 0.0 0.0 0.0
Jan-11 97.3 0.0 0.0 2.1 0.0 0.0 0.0
Feb-11 97.5 0.0 0.0 1.9 0.0 0.0 0.0
Mar-11 97.4 0.0 0.0 1.9 0.0 0.0 0.0
Apr-11 97.6 0.0 0.0 1.8 0.0 0.0 0.0
May-11 97.5 0.0 0.0 1.9 0.0 0.0 0.0
Jun-11 97.9 0.0 0.0 1.6 0.0 0.0 0.0
Jul-11 97.9 0.0 0.0 1.6 0.0 0.0 0.0
Aug-11 97.8 0.0 0.0 1.6 0.0 0.0 0.0
Sep-11 97.6 0.0 0.0 1.7 0.0 0.1 0.0
Oct-11 97.4 0.0 0.0 1.9 0.0 0.1 0.0
Nov-11 97.5 0.0 0.0 1.8 0.0 0.1 0.0
Dec-11 97.4 0.0 0.0 1.8 0.0 0.1 0.0
Jan-12 96.3 0.0 0.0 2.7 0.0 0.2 0.0
Feb-12 96.4 0.0 0.0 2.8 0.0 0.1 0.0
Mar-12 96.6 0.0 0.0 2.7 0.0 0.1 0.0
Apr-12 96.3 0.0 0.0 3.1 0.0 0.0 0.0
May-12 96.2 0.0 0.0 3.1 0.0 0.0 0.2
Jun-12 95.5 0.0 0.0 3.9 0.0 0.0 0.1
Jul-12 95.4 0.0 0.0 4.1 0.0 0.0 0.1
Aug-12 95.3 0.0 0.0 4.2 0.0 0.0 0.1
Sep-12 94.4 0.0 0.0 5.2 0.0 0.0 0.1
Oct-12 94.2 0.0 0.0 5.3 0.0 0.0 0.1
Nov-12 94.3 0.0 0.0 5.3 0.0 0.0 0.0
Dec-12 93.8 0.0 0.0 5.9 0.0 0.0 0.0
(Continued)
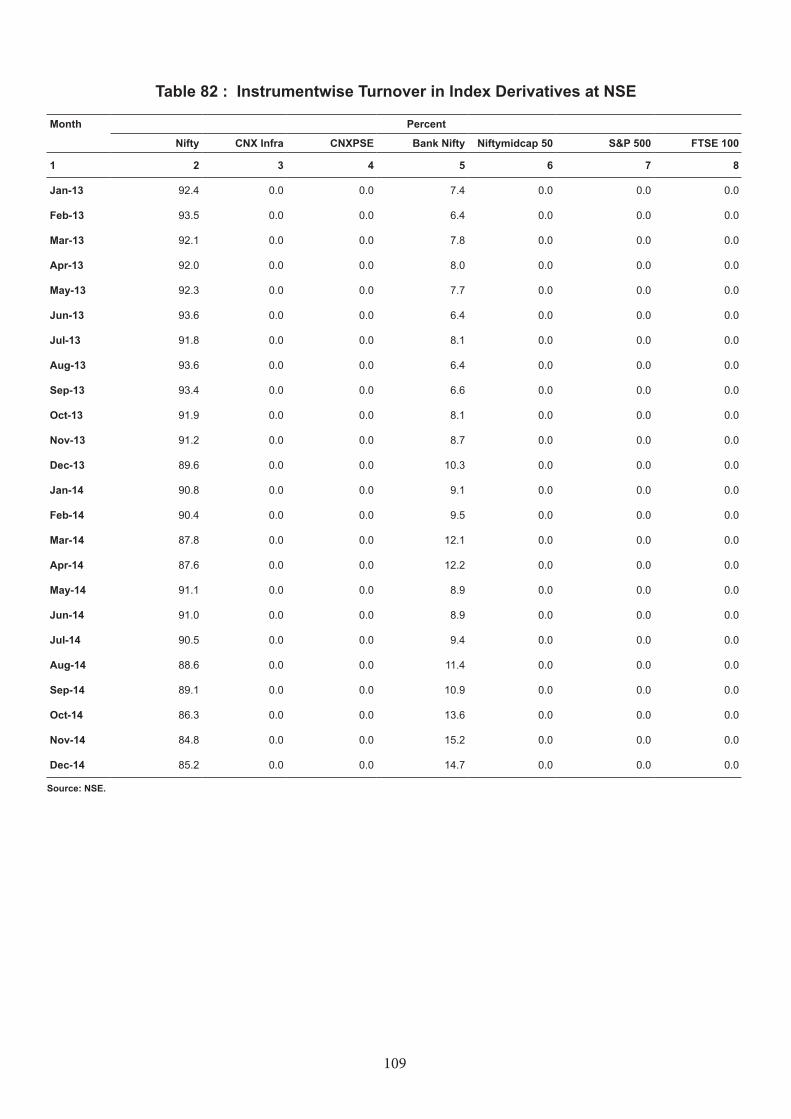
109
Table 82 : Instrumentwise Turnover in Index Derivatives at NSE
Month Percent
Nifty CNX Infra CNXPSE Bank Nifty Niftymidcap 50 S&P 500 FTSE 100
1 2 3 4 5 6 7 8
Jan-13 92.4 0.0 0.0 7.4 0.0 0.0 0.0
Feb-13 93.5 0.0 0.0 6.4 0.0 0.0 0.0
Mar-13 92.1 0.0 0.0 7.8 0.0 0.0 0.0
Apr-13 92.0 0.0 0.0 8.0 0.0 0.0 0.0
May-13 92.3 0.0 0.0 7.7 0.0 0.0 0.0
Jun-13 93.6 0.0 0.0 6.4 0.0 0.0 0.0
Jul-13 91.8 0.0 0.0 8.1 0.0 0.0 0.0
Aug-13 93.6 0.0 0.0 6.4 0.0 0.0 0.0
Sep-13 93.4 0.0 0.0 6.6 0.0 0.0 0.0
Oct-13 91.9 0.0 0.0 8.1 0.0 0.0 0.0
Nov-13 91.2 0.0 0.0 8.7 0.0 0.0 0.0
Dec-13 89.6 0.0 0.0 10.3 0.0 0.0 0.0
Jan-14 90.8 0.0 0.0 9.1 0.0 0.0 0.0
Feb-14 90.4 0.0 0.0 9.5 0.0 0.0 0.0
Mar-14 87.8 0.0 0.0 12.1 0.0 0.0 0.0
Apr-14 87.6 0.0 0.0 12.2 0.0 0.0 0.0
May-14 91.1 0.0 0.0 8.9 0.0 0.0 0.0
Jun-14 91.0 0.0 0.0 8.9 0.0 0.0 0.0
Jul-14 90.5 0.0 0.0 9.4 0.0 0.0 0.0
Aug-14 88.6 0.0 0.0 11.4 0.0 0.0 0.0
Sep-14 89.1 0.0 0.0 10.9 0.0 0.0 0.0
Oct-14 86.3 0.0 0.0 13.6 0.0 0.0 0.0
Nov-14 84.8 0.0 0.0 15.2 0.0 0.0 0.0
Dec-14 85.2 0.0 0.0 14.7 0.0 0.0 0.0
Source: NSE.
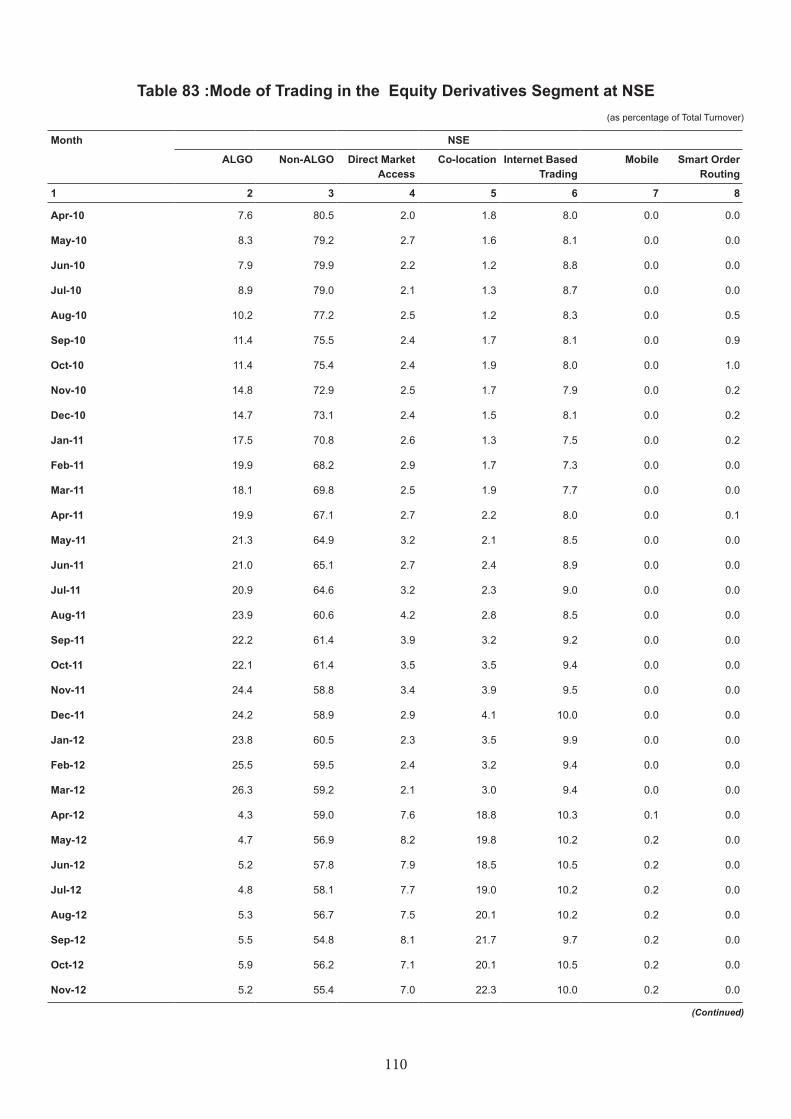
110
Table 83 :Mode of Trading in the Equity Derivatives Segment at NSE (as percentage of Total Turnover)
Month NSE
ALGO Non-ALGO Direct Market Access
Co-location Internet Based Trading
Mobile Smart Order Routing
1 2 3 4 5 6 7 8
Apr-10 7.6 80.5 2.0 1.8 8.0 0.0 0.0
May-10 8.3 79.2 2.7 1.6 8.1 0.0 0.0
Jun-10 7.9 79.9 2.2 1.2 8.8 0.0 0.0
Jul-10 8.9 79.0 2.1 1.3 8.7 0.0 0.0
Aug-10 10.2 77.2 2.5 1.2 8.3 0.0 0.5
Sep-10 11.4 75.5 2.4 1.7 8.1 0.0 0.9
Oct-10 11.4 75.4 2.4 1.9 8.0 0.0 1.0
Nov-10 14.8 72.9 2.5 1.7 7.9 0.0 0.2
Dec-10 14.7 73.1 2.4 1.5 8.1 0.0 0.2
Jan-11 17.5 70.8 2.6 1.3 7.5 0.0 0.2
Feb-11 19.9 68.2 2.9 1.7 7.3 0.0 0.0
Mar-11 18.1 69.8 2.5 1.9 7.7 0.0 0.0
Apr-11 19.9 67.1 2.7 2.2 8.0 0.0 0.1
May-11 21.3 64.9 3.2 2.1 8.5 0.0 0.0
Jun-11 21.0 65.1 2.7 2.4 8.9 0.0 0.0
Jul-11 20.9 64.6 3.2 2.3 9.0 0.0 0.0
Aug-11 23.9 60.6 4.2 2.8 8.5 0.0 0.0
Sep-11 22.2 61.4 3.9 3.2 9.2 0.0 0.0
Oct-11 22.1 61.4 3.5 3.5 9.4 0.0 0.0
Nov-11 24.4 58.8 3.4 3.9 9.5 0.0 0.0
Dec-11 24.2 58.9 2.9 4.1 10.0 0.0 0.0
Jan-12 23.8 60.5 2.3 3.5 9.9 0.0 0.0
Feb-12 25.5 59.5 2.4 3.2 9.4 0.0 0.0
Mar-12 26.3 59.2 2.1 3.0 9.4 0.0 0.0
Apr-12 4.3 59.0 7.6 18.8 10.3 0.1 0.0
May-12 4.7 56.9 8.2 19.8 10.2 0.2 0.0
Jun-12 5.2 57.8 7.9 18.5 10.5 0.2 0.0
Jul-12 4.8 58.1 7.7 19.0 10.2 0.2 0.0
Aug-12 5.3 56.7 7.5 20.1 10.2 0.2 0.0
Sep-12 5.5 54.8 8.1 21.7 9.7 0.2 0.0
Oct-12 5.9 56.2 7.1 20.1 10.5 0.2 0.0
Nov-12 5.2 55.4 7.0 22.3 10.0 0.2 0.0
(Continued)
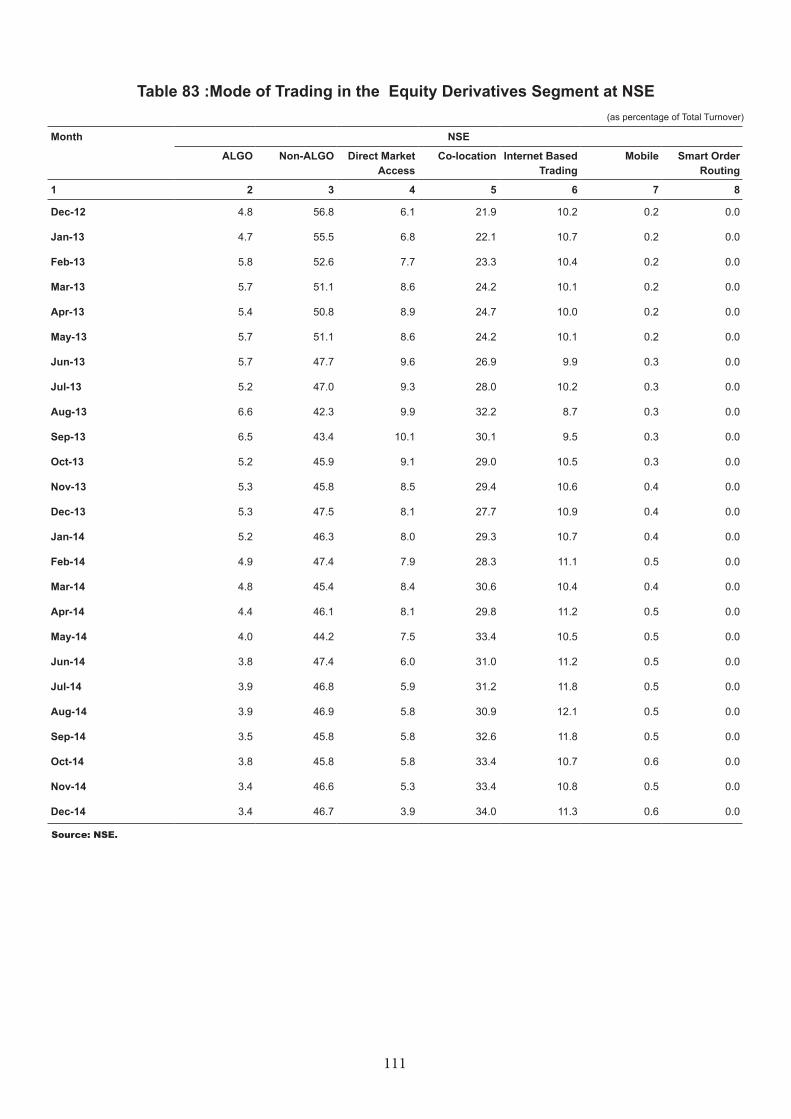
111
Table 83 :Mode of Trading in the Equity Derivatives Segment at NSE (as percentage of Total Turnover)
Month NSE
ALGO Non-ALGO Direct Market Access
Co-location Internet Based Trading
Mobile Smart Order Routing
1 2 3 4 5 6 7 8
Dec-12 4.8 56.8 6.1 21.9 10.2 0.2 0.0
Jan-13 4.7 55.5 6.8 22.1 10.7 0.2 0.0
Feb-13 5.8 52.6 7.7 23.3 10.4 0.2 0.0
Mar-13 5.7 51.1 8.6 24.2 10.1 0.2 0.0
Apr-13 5.4 50.8 8.9 24.7 10.0 0.2 0.0
May-13 5.7 51.1 8.6 24.2 10.1 0.2 0.0
Jun-13 5.7 47.7 9.6 26.9 9.9 0.3 0.0
Jul-13 5.2 47.0 9.3 28.0 10.2 0.3 0.0
Aug-13 6.6 42.3 9.9 32.2 8.7 0.3 0.0
Sep-13 6.5 43.4 10.1 30.1 9.5 0.3 0.0
Oct-13 5.2 45.9 9.1 29.0 10.5 0.3 0.0
Nov-13 5.3 45.8 8.5 29.4 10.6 0.4 0.0
Dec-13 5.3 47.5 8.1 27.7 10.9 0.4 0.0
Jan-14 5.2 46.3 8.0 29.3 10.7 0.4 0.0
Feb-14 4.9 47.4 7.9 28.3 11.1 0.5 0.0
Mar-14 4.8 45.4 8.4 30.6 10.4 0.4 0.0
Apr-14 4.4 46.1 8.1 29.8 11.2 0.5 0.0
May-14 4.0 44.2 7.5 33.4 10.5 0.5 0.0
Jun-14 3.8 47.4 6.0 31.0 11.2 0.5 0.0
Jul-14 3.9 46.8 5.9 31.2 11.8 0.5 0.0
Aug-14 3.9 46.9 5.8 30.9 12.1 0.5 0.0
Sep-14 3.5 45.8 5.8 32.6 11.8 0.5 0.0
Oct-14 3.8 45.8 5.8 33.4 10.7 0.6 0.0
Nov-14 3.4 46.6 5.3 33.4 10.8 0.5 0.0
Dec-14 3.4 46.7 3.9 34.0 11.3 0.6 0.0
Source: NSE.
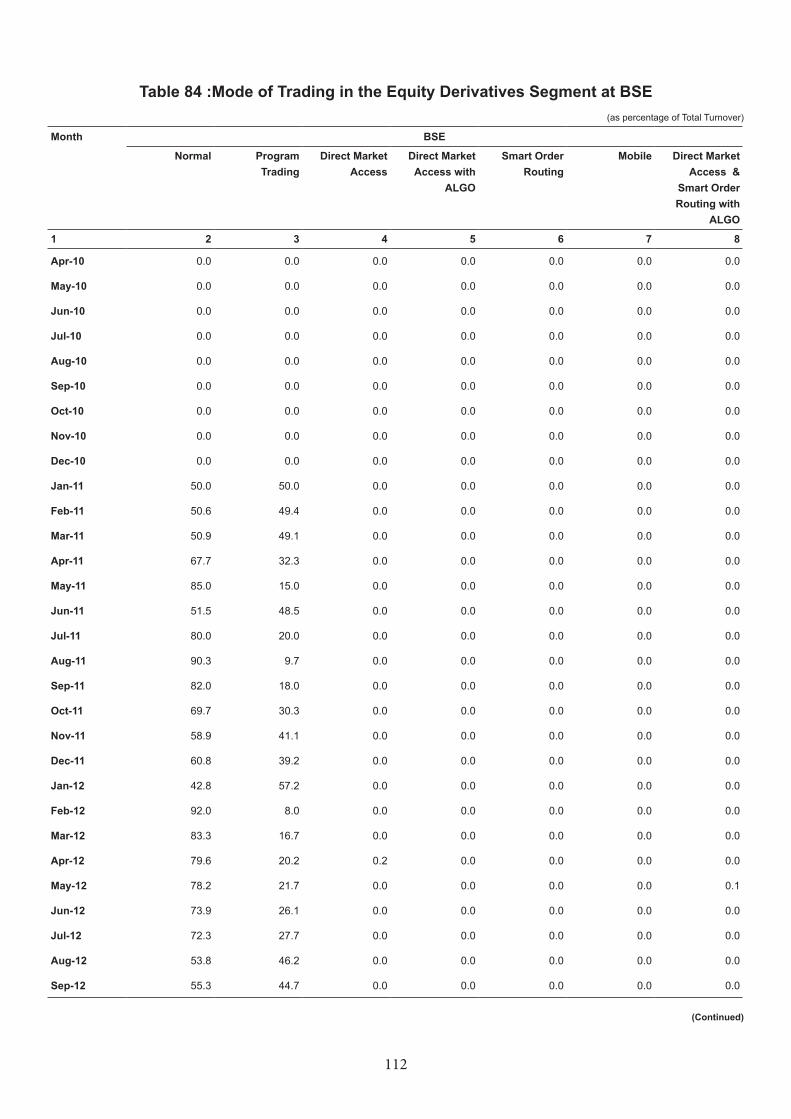
112
Table 84 :Mode of Trading in the Equity Derivatives Segment at BSE (as percentage of Total Turnover)
Month BSE
Normal Program Trading
Direct Market Access
Direct Market Access with
ALGO
Smart Order Routing
Mobile Direct Market Access &
Smart Order Routing with
ALGO
1 2 3 4 5 6 7 8
Apr-10 0.0 0.0 0.0 0.0 0.0 0.0 0.0
May-10 0.0 0.0 0.0 0.0 0.0 0.0 0.0
Jun-10 0.0 0.0 0.0 0.0 0.0 0.0 0.0
Jul-10 0.0 0.0 0.0 0.0 0.0 0.0 0.0
Aug-10 0.0 0.0 0.0 0.0 0.0 0.0 0.0
Sep-10 0.0 0.0 0.0 0.0 0.0 0.0 0.0
Oct-10 0.0 0.0 0.0 0.0 0.0 0.0 0.0
Nov-10 0.0 0.0 0.0 0.0 0.0 0.0 0.0
Dec-10 0.0 0.0 0.0 0.0 0.0 0.0 0.0
Jan-11 50.0 50.0 0.0 0.0 0.0 0.0 0.0
Feb-11 50.6 49.4 0.0 0.0 0.0 0.0 0.0
Mar-11 50.9 49.1 0.0 0.0 0.0 0.0 0.0
Apr-11 67.7 32.3 0.0 0.0 0.0 0.0 0.0
May-11 85.0 15.0 0.0 0.0 0.0 0.0 0.0
Jun-11 51.5 48.5 0.0 0.0 0.0 0.0 0.0
Jul-11 80.0 20.0 0.0 0.0 0.0 0.0 0.0
Aug-11 90.3 9.7 0.0 0.0 0.0 0.0 0.0
Sep-11 82.0 18.0 0.0 0.0 0.0 0.0 0.0
Oct-11 69.7 30.3 0.0 0.0 0.0 0.0 0.0
Nov-11 58.9 41.1 0.0 0.0 0.0 0.0 0.0
Dec-11 60.8 39.2 0.0 0.0 0.0 0.0 0.0
Jan-12 42.8 57.2 0.0 0.0 0.0 0.0 0.0
Feb-12 92.0 8.0 0.0 0.0 0.0 0.0 0.0
Mar-12 83.3 16.7 0.0 0.0 0.0 0.0 0.0
Apr-12 79.6 20.2 0.2 0.0 0.0 0.0 0.0
May-12 78.2 21.7 0.0 0.0 0.0 0.0 0.1
Jun-12 73.9 26.1 0.0 0.0 0.0 0.0 0.0
Jul-12 72.3 27.7 0.0 0.0 0.0 0.0 0.0
Aug-12 53.8 46.2 0.0 0.0 0.0 0.0 0.0
Sep-12 55.3 44.7 0.0 0.0 0.0 0.0 0.0
(Continued)
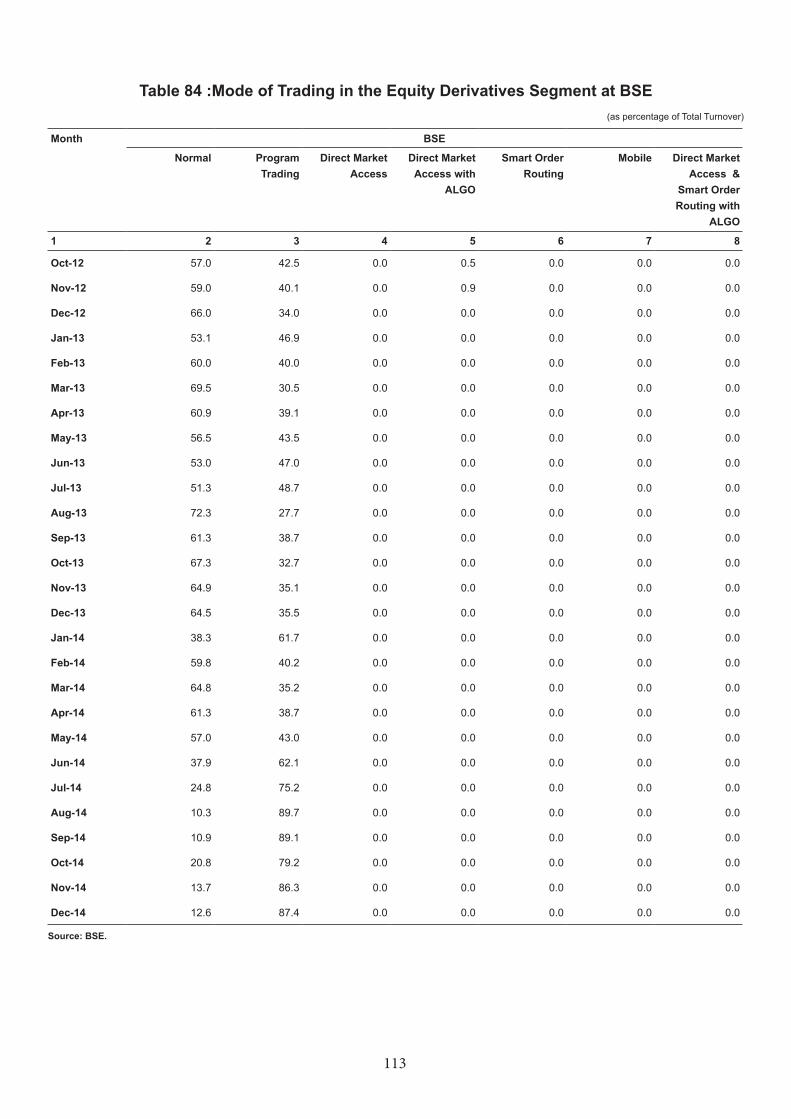
113
Month BSE
Normal Program Trading
Direct Market Access
Direct Market Access with
ALGO
Smart Order Routing
Mobile Direct Market Access &
Smart Order Routing with
ALGO
1 2 3 4 5 6 7 8
Oct-12 57.0 42.5 0.0 0.5 0.0 0.0 0.0
Nov-12 59.0 40.1 0.0 0.9 0.0 0.0 0.0
Dec-12 66.0 34.0 0.0 0.0 0.0 0.0 0.0
Jan-13 53.1 46.9 0.0 0.0 0.0 0.0 0.0
Feb-13 60.0 40.0 0.0 0.0 0.0 0.0 0.0
Mar-13 69.5 30.5 0.0 0.0 0.0 0.0 0.0
Apr-13 60.9 39.1 0.0 0.0 0.0 0.0 0.0
May-13 56.5 43.5 0.0 0.0 0.0 0.0 0.0
Jun-13 53.0 47.0 0.0 0.0 0.0 0.0 0.0
Jul-13 51.3 48.7 0.0 0.0 0.0 0.0 0.0
Aug-13 72.3 27.7 0.0 0.0 0.0 0.0 0.0
Sep-13 61.3 38.7 0.0 0.0 0.0 0.0 0.0
Oct-13 67.3 32.7 0.0 0.0 0.0 0.0 0.0
Nov-13 64.9 35.1 0.0 0.0 0.0 0.0 0.0
Dec-13 64.5 35.5 0.0 0.0 0.0 0.0 0.0
Jan-14 38.3 61.7 0.0 0.0 0.0 0.0 0.0
Feb-14 59.8 40.2 0.0 0.0 0.0 0.0 0.0
Mar-14 64.8 35.2 0.0 0.0 0.0 0.0 0.0
Apr-14 61.3 38.7 0.0 0.0 0.0 0.0 0.0
May-14 57.0 43.0 0.0 0.0 0.0 0.0 0.0
Jun-14 37.9 62.1 0.0 0.0 0.0 0.0 0.0
Jul-14 24.8 75.2 0.0 0.0 0.0 0.0 0.0
Aug-14 10.3 89.7 0.0 0.0 0.0 0.0 0.0
Sep-14 10.9 89.1 0.0 0.0 0.0 0.0 0.0
Oct-14 20.8 79.2 0.0 0.0 0.0 0.0 0.0
Nov-14 13.7 86.3 0.0 0.0 0.0 0.0 0.0
Dec-14 12.6 87.4 0.0 0.0 0.0 0.0 0.0
Source: BSE.
Table 84 :Mode of Trading in the Equity Derivatives Segment at BSE (as percentage of Total Turnover)
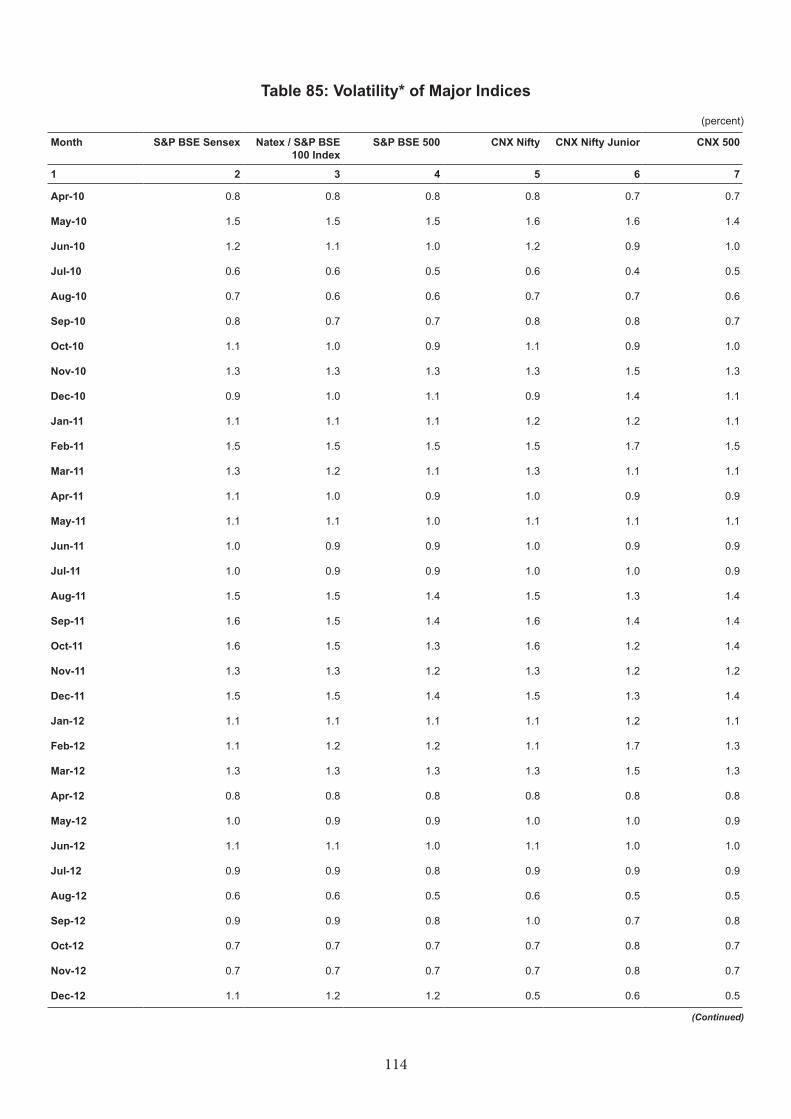
114
Table 85: Volatility* of Major Indices
(percent)
Month S&P BSE Sensex Natex / S&P BSE 100 Index
S&P BSE 500 CNX Nifty CNX Nifty Junior CNX 500
1 2 3 4 5 6 7
Apr-10 0.8 0.8 0.8 0.8 0.7 0.7
May-10 1.5 1.5 1.5 1.6 1.6 1.4
Jun-10 1.2 1.1 1.0 1.2 0.9 1.0
Jul-10 0.6 0.6 0.5 0.6 0.4 0.5
Aug-10 0.7 0.6 0.6 0.7 0.7 0.6
Sep-10 0.8 0.7 0.7 0.8 0.8 0.7
Oct-10 1.1 1.0 0.9 1.1 0.9 1.0
Nov-10 1.3 1.3 1.3 1.3 1.5 1.3
Dec-10 0.9 1.0 1.1 0.9 1.4 1.1
Jan-11 1.1 1.1 1.1 1.2 1.2 1.1
Feb-11 1.5 1.5 1.5 1.5 1.7 1.5
Mar-11 1.3 1.2 1.1 1.3 1.1 1.1
Apr-11 1.1 1.0 0.9 1.0 0.9 0.9
May-11 1.1 1.1 1.0 1.1 1.1 1.1
Jun-11 1.0 0.9 0.9 1.0 0.9 0.9
Jul-11 1.0 0.9 0.9 1.0 1.0 0.9
Aug-11 1.5 1.5 1.4 1.5 1.3 1.4
Sep-11 1.6 1.5 1.4 1.6 1.4 1.4
Oct-11 1.6 1.5 1.3 1.6 1.2 1.4
Nov-11 1.3 1.3 1.2 1.3 1.2 1.2
Dec-11 1.5 1.5 1.4 1.5 1.3 1.4
Jan-12 1.1 1.1 1.1 1.1 1.2 1.1
Feb-12 1.1 1.2 1.2 1.1 1.7 1.3
Mar-12 1.3 1.3 1.3 1.3 1.5 1.3
Apr-12 0.8 0.8 0.8 0.8 0.8 0.8
May-12 1.0 0.9 0.9 1.0 1.0 0.9
Jun-12 1.1 1.1 1.0 1.1 1.0 1.0
Jul-12 0.9 0.9 0.8 0.9 0.9 0.9
Aug-12 0.6 0.6 0.5 0.6 0.5 0.5
Sep-12 0.9 0.9 0.8 1.0 0.7 0.8
Oct-12 0.7 0.7 0.7 0.7 0.8 0.7
Nov-12 0.7 0.7 0.7 0.7 0.8 0.7
Dec-12 1.1 1.2 1.2 0.5 0.6 0.5
(Continued)

115
Table 85: Volatility* of Major Indices
(percent)
Month S&P BSE Sensex Natex / S&P BSE 100 Index
S&P BSE 500 CNX Nifty CNX Nifty Junior CNX 500
1 2 3 4 5 6 7
Jan-13 0.5 0.6 0.6 0.5 0.8 0.6
Feb-13 0.7 0.7 0.7 0.7 0.9 0.7
Mar-13 0.8 0.9 0.9 1.1 0.8 0.9
Apr-13 1.0 1.0 0.9 1.0 0.9 0.9
May-13 1.1 1.1 1.0 1.2 0.9 1.1
Jun-13 1.2 1.2 1.2 1.2 1.2 1.2
Jul-13 1.0 1.1 1.0 1.0 1.2 1.0
Aug-13 1.7 1.8 1.6 1.7 1.8 1.6
Sep-13 1.8 1.8 1.6 1.9 1.5 1.7
Oct-13 0.8 0.9 0.8 0.9 0.9 0.8
Nov-13 1.1 1.1 1.0 1.1 1.0 1.0
Dec-13 0.8 0.8 0.7 1.2 1.2 1.2
Jan-14 0.8 0.8 0.8 0.8 1.1 0.8
Feb-14 0.7 0.7 0.6 0.7 0.6 0.6
Mar-14 0.7 0.7 0.6 0.7 0.7 0.6
Apr-14 0.7 0.7 0.7 0.7 0.9 0.7
May-14 0.9 0.9 0.9 1.0 1.4 1.0
Jun-14 0.9 0.9 0.9 0.9 1.2 0.9
Jul-14 0.8 0.9 0.9 0.8 1.4 0.9
Aug-14 0.8 0.8 0.8 0.6 0.9 0.7
Sep-14 0.8 0.9 0.9 0.8 1.1 0.9
Oct-14 0.9 1.0 1.0 0.9 1.2 0.9
Nov-14 0.4 0.5 0.5 0.4 0.7 0.5
Dec-14 0.9 0.9 0.9 0.8 1.2 0.9
Note: * Volatility is calculated as the standard deviation of the natural log of returns in indices for the respective period.
Source: BSE, NSE.
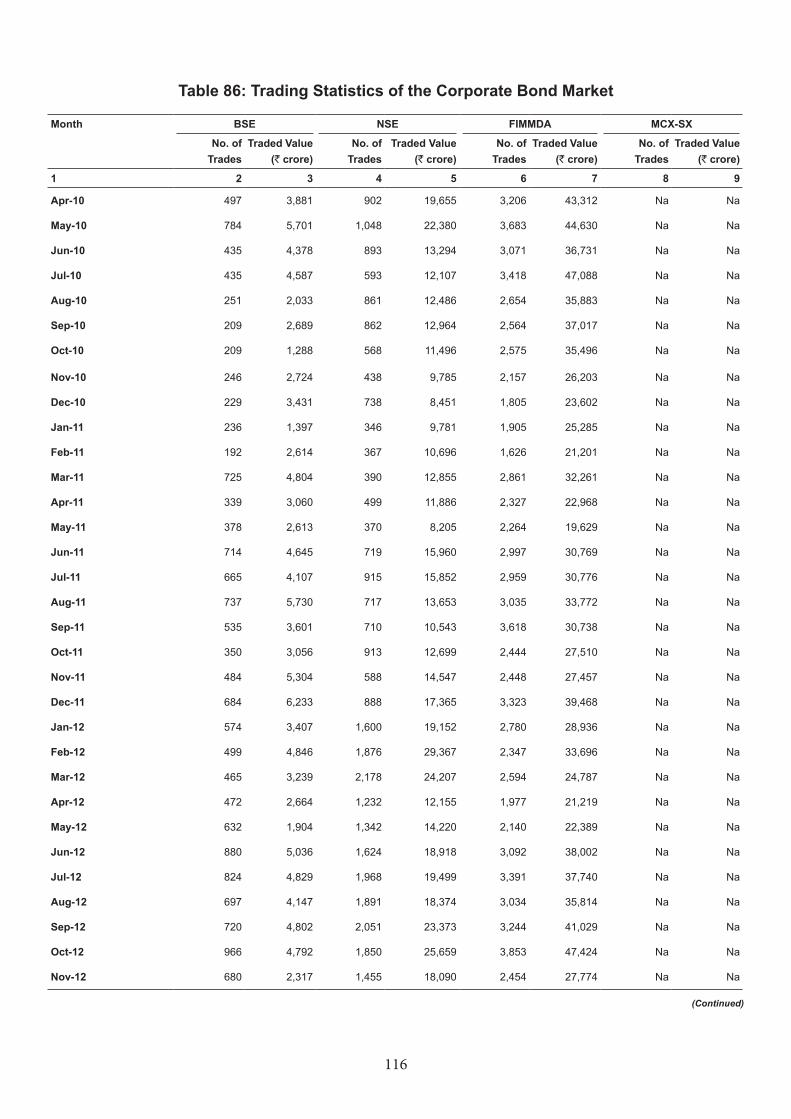
116
Table 86: Trading Statistics of the Corporate Bond Market
Month BSE NSE FIMMDA MCX-SX
No. of Trades
Traded Value (` crore)
No. of Trades
Traded Value (` crore)
No. of Trades
Traded Value (` crore)
No. of Trades
Traded Value (` crore)
1 2 3 4 5 6 7 8 9
Apr-10 497 3,881 902 19,655 3,206 43,312 Na Na
May-10 784 5,701 1,048 22,380 3,683 44,630 Na Na
Jun-10 435 4,378 893 13,294 3,071 36,731 Na Na
Jul-10 435 4,587 593 12,107 3,418 47,088 Na Na
Aug-10 251 2,033 861 12,486 2,654 35,883 Na Na
Sep-10 209 2,689 862 12,964 2,564 37,017 Na Na
Oct-10 209 1,288 568 11,496 2,575 35,496 Na Na
Nov-10 246 2,724 438 9,785 2,157 26,203 Na Na
Dec-10 229 3,431 738 8,451 1,805 23,602 Na Na
Jan-11 236 1,397 346 9,781 1,905 25,285 Na Na
Feb-11 192 2,614 367 10,696 1,626 21,201 Na Na
Mar-11 725 4,804 390 12,855 2,861 32,261 Na Na
Apr-11 339 3,060 499 11,886 2,327 22,968 Na Na
May-11 378 2,613 370 8,205 2,264 19,629 Na Na
Jun-11 714 4,645 719 15,960 2,997 30,769 Na Na
Jul-11 665 4,107 915 15,852 2,959 30,776 Na Na
Aug-11 737 5,730 717 13,653 3,035 33,772 Na Na
Sep-11 535 3,601 710 10,543 3,618 30,738 Na Na
Oct-11 350 3,056 913 12,699 2,444 27,510 Na Na
Nov-11 484 5,304 588 14,547 2,448 27,457 Na Na
Dec-11 684 6,233 888 17,365 3,323 39,468 Na Na
Jan-12 574 3,407 1,600 19,152 2,780 28,936 Na Na
Feb-12 499 4,846 1,876 29,367 2,347 33,696 Na Na
Mar-12 465 3,239 2,178 24,207 2,594 24,787 Na Na
Apr-12 472 2,664 1,232 12,155 1,977 21,219 Na Na
May-12 632 1,904 1,342 14,220 2,140 22,389 Na Na
Jun-12 880 5,036 1,624 18,918 3,092 38,002 Na Na
Jul-12 824 4,829 1,968 19,499 3,391 37,740 Na Na
Aug-12 697 4,147 1,891 18,374 3,034 35,814 Na Na
Sep-12 720 4,802 2,051 23,373 3,244 41,029 Na Na
Oct-12 966 4,792 1,850 25,659 3,853 47,424 Na Na
Nov-12 680 2,317 1,455 18,090 2,454 27,774 Na Na
(Continued)
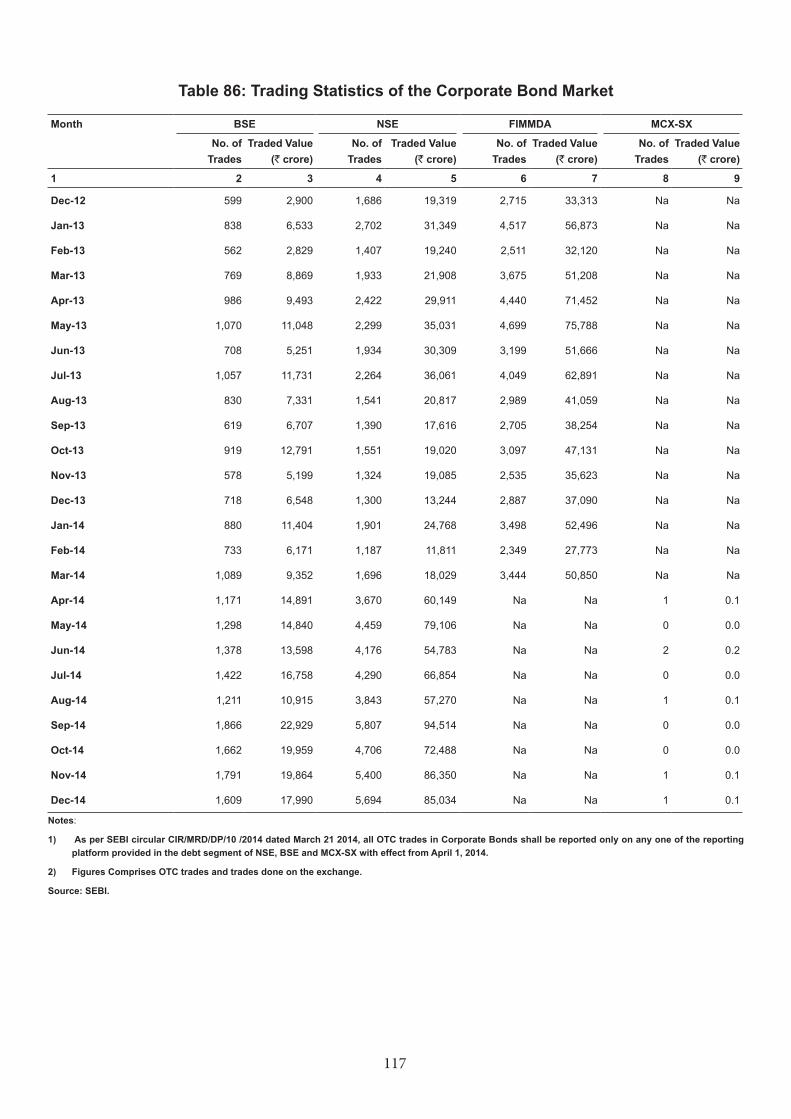
117
Table 86: Trading Statistics of the Corporate Bond Market
Month BSE NSE FIMMDA MCX-SX
No. of Trades
Traded Value (` crore)
No. of Trades
Traded Value (` crore)
No. of Trades
Traded Value (` crore)
No. of Trades
Traded Value (` crore)
1 2 3 4 5 6 7 8 9
Dec-12 599 2,900 1,686 19,319 2,715 33,313 Na Na
Jan-13 838 6,533 2,702 31,349 4,517 56,873 Na Na
Feb-13 562 2,829 1,407 19,240 2,511 32,120 Na Na
Mar-13 769 8,869 1,933 21,908 3,675 51,208 Na Na
Apr-13 986 9,493 2,422 29,911 4,440 71,452 Na Na
May-13 1,070 11,048 2,299 35,031 4,699 75,788 Na Na
Jun-13 708 5,251 1,934 30,309 3,199 51,666 Na Na
Jul-13 1,057 11,731 2,264 36,061 4,049 62,891 Na Na
Aug-13 830 7,331 1,541 20,817 2,989 41,059 Na Na
Sep-13 619 6,707 1,390 17,616 2,705 38,254 Na Na
Oct-13 919 12,791 1,551 19,020 3,097 47,131 Na Na
Nov-13 578 5,199 1,324 19,085 2,535 35,623 Na Na
Dec-13 718 6,548 1,300 13,244 2,887 37,090 Na Na
Jan-14 880 11,404 1,901 24,768 3,498 52,496 Na Na
Feb-14 733 6,171 1,187 11,811 2,349 27,773 Na Na
Mar-14 1,089 9,352 1,696 18,029 3,444 50,850 Na Na
Apr-14 1,171 14,891 3,670 60,149 Na Na 1 0.1
May-14 1,298 14,840 4,459 79,106 Na Na 0 0.0
Jun-14 1,378 13,598 4,176 54,783 Na Na 2 0.2
Jul-14 1,422 16,758 4,290 66,854 Na Na 0 0.0
Aug-14 1,211 10,915 3,843 57,270 Na Na 1 0.1
Sep-14 1,866 22,929 5,807 94,514 Na Na 0 0.0
Oct-14 1,662 19,959 4,706 72,488 Na Na 0 0.0
Nov-14 1,791 19,864 5,400 86,350 Na Na 1 0.1
Dec-14 1,609 17,990 5,694 85,034 Na Na 1 0.1
Notes:
1) As per SEBI circular CIR/MRD/DP/10 /2014 dated March 21 2014, all OTC trades in Corporate Bonds shall be reported only on any one of the reporting platform provided in the debt segment of NSE, BSE and MCX-SX with effect from April 1, 2014.
2) Figures Comprises OTC trades and trades done on the exchange.
Source: SEBI.
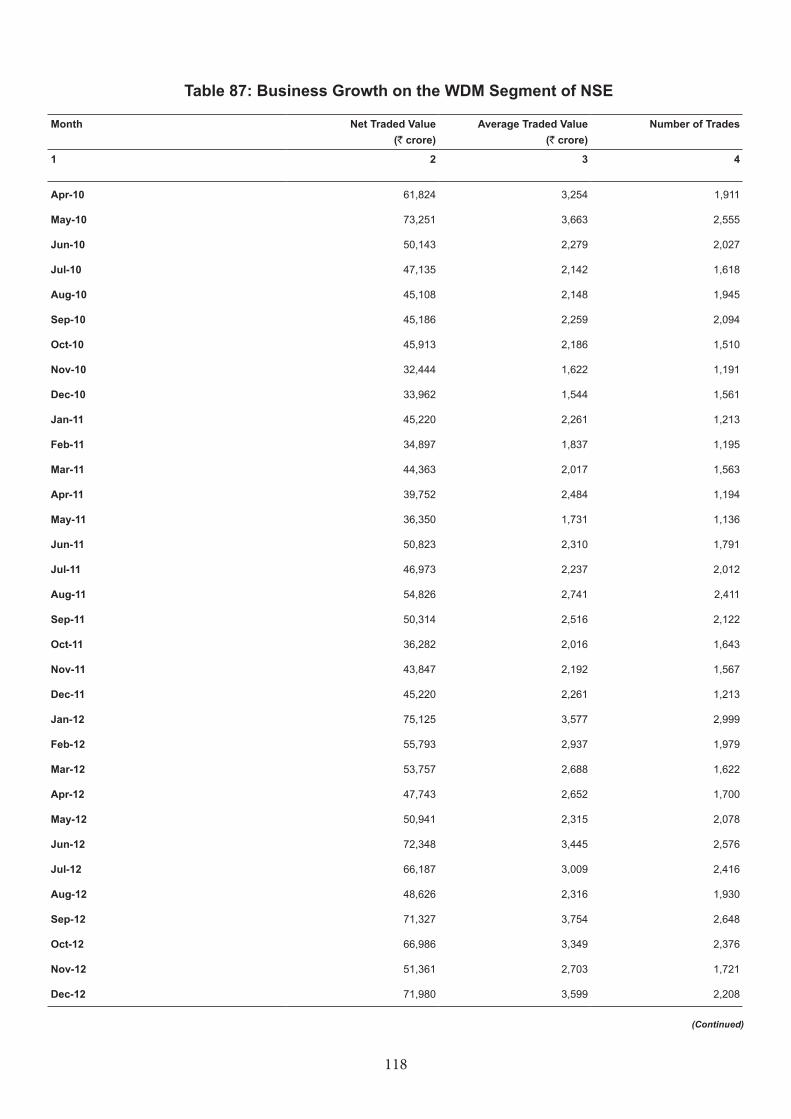
118
Table 87: Business Growth on the WDM Segment of NSE
Month Net Traded Value (` crore)
Average Traded Value (` crore)
Number of Trades
1 2 3 4
Apr-10 61,824 3,254 1,911
May-10 73,251 3,663 2,555
Jun-10 50,143 2,279 2,027
Jul-10 47,135 2,142 1,618
Aug-10 45,108 2,148 1,945
Sep-10 45,186 2,259 2,094
Oct-10 45,913 2,186 1,510
Nov-10 32,444 1,622 1,191
Dec-10 33,962 1,544 1,561
Jan-11 45,220 2,261 1,213
Feb-11 34,897 1,837 1,195
Mar-11 44,363 2,017 1,563
Apr-11 39,752 2,484 1,194
May-11 36,350 1,731 1,136
Jun-11 50,823 2,310 1,791
Jul-11 46,973 2,237 2,012
Aug-11 54,826 2,741 2,411
Sep-11 50,314 2,516 2,122
Oct-11 36,282 2,016 1,643
Nov-11 43,847 2,192 1,567
Dec-11 45,220 2,261 1,213
Jan-12 75,125 3,577 2,999
Feb-12 55,793 2,937 1,979
Mar-12 53,757 2,688 1,622
Apr-12 47,743 2,652 1,700
May-12 50,941 2,315 2,078
Jun-12 72,348 3,445 2,576
Jul-12 66,187 3,009 2,416
Aug-12 48,626 2,316 1,930
Sep-12 71,327 3,754 2,648
Oct-12 66,986 3,349 2,376
Nov-12 51,361 2,703 1,721
Dec-12 71,980 3,599 2,208
(Continued)
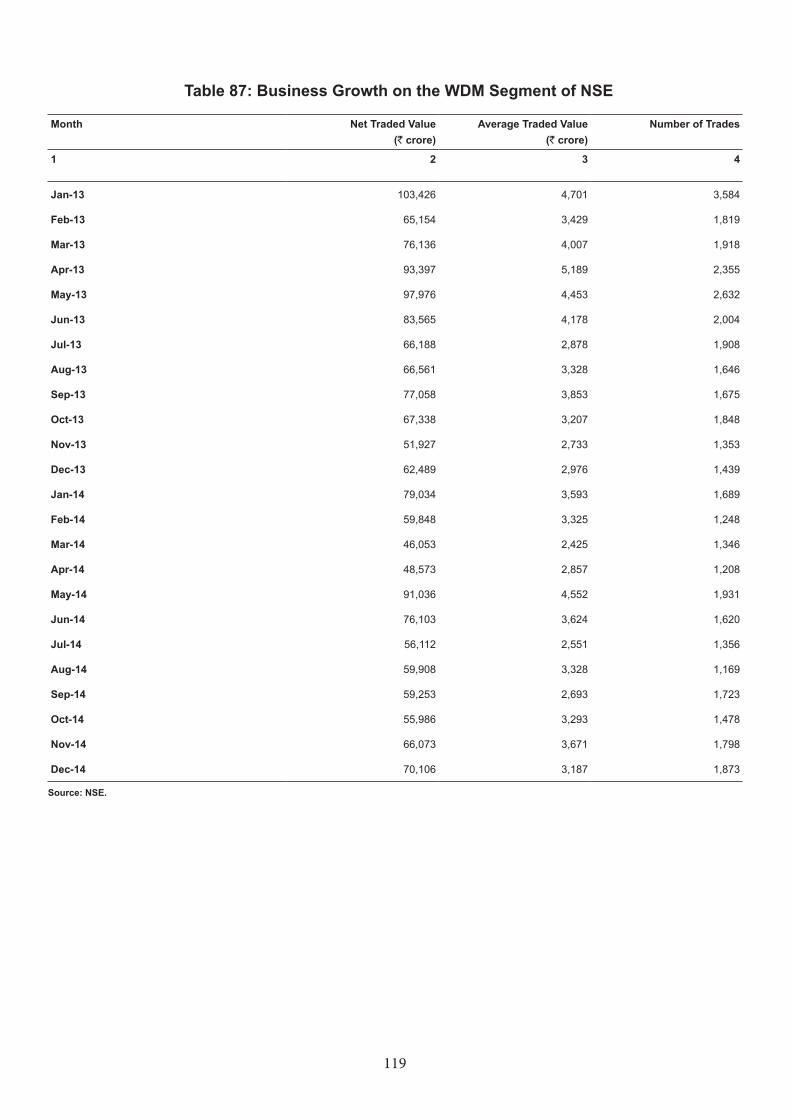
119
Table 87: Business Growth on the WDM Segment of NSE
Month Net Traded Value (` crore)
Average Traded Value (` crore)
Number of Trades
1 2 3 4
Jan-13 103,426 4,701 3,584
Feb-13 65,154 3,429 1,819
Mar-13 76,136 4,007 1,918
Apr-13 93,397 5,189 2,355
May-13 97,976 4,453 2,632
Jun-13 83,565 4,178 2,004
Jul-13 66,188 2,878 1,908
Aug-13 66,561 3,328 1,646
Sep-13 77,058 3,853 1,675
Oct-13 67,338 3,207 1,848
Nov-13 51,927 2,733 1,353
Dec-13 62,489 2,976 1,439
Jan-14 79,034 3,593 1,689
Feb-14 59,848 3,325 1,248
Mar-14 46,053 2,425 1,346
Apr-14 48,573 2,857 1,208
May-14 91,036 4,552 1,931
Jun-14 76,103 3,624 1,620
Jul-14 56,112 2,551 1,356
Aug-14 59,908 3,328 1,169
Sep-14 59,253 2,693 1,723
Oct-14 55,986 3,293 1,478
Nov-14 66,073 3,671 1,798
Dec-14 70,106 3,187 1,873
Source: NSE.
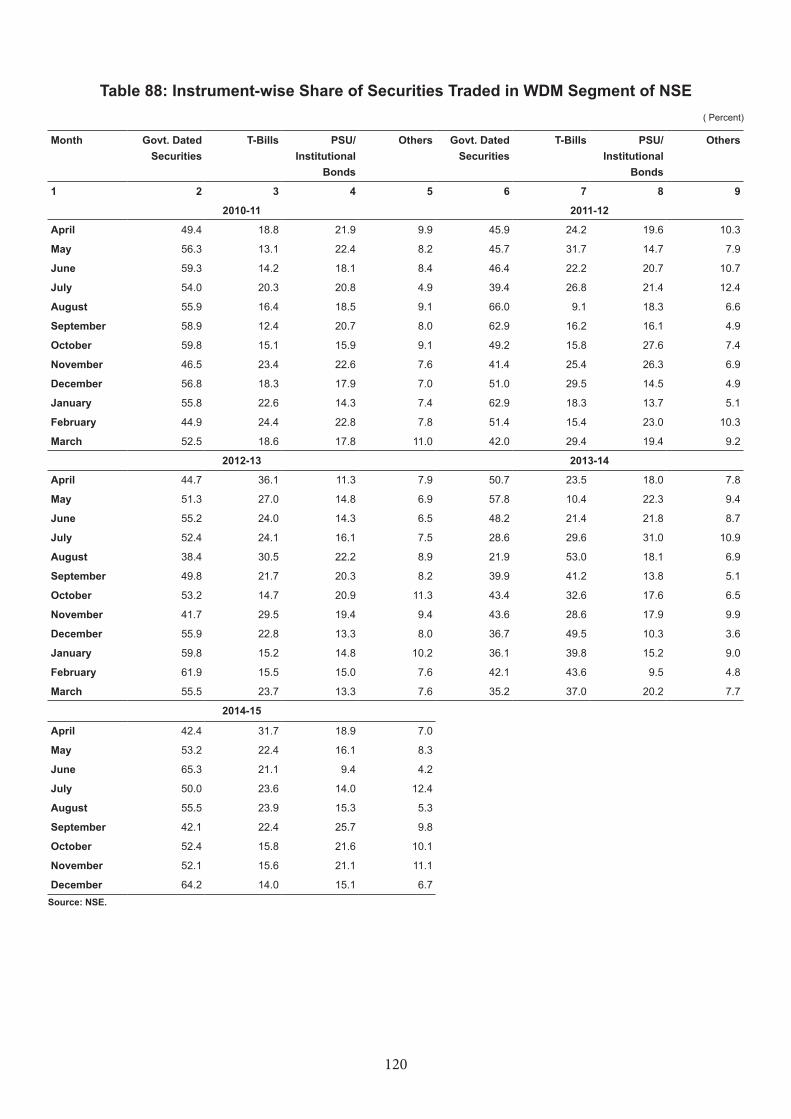
120
Table 88: Instrument-wise Share of Securities Traded in WDM Segment of NSE( Percent)
Month Govt. Dated Securities
T-Bills PSU/ Institutional
Bonds
Others Govt. Dated Securities
T-Bills PSU/ Institutional
Bonds
Others
1 2 3 4 5 6 7 8 9
2010-11 2011-12
April 49.4 18.8 21.9 9.9 45.9 24.2 19.6 10.3
May 56.3 13.1 22.4 8.2 45.7 31.7 14.7 7.9
June 59.3 14.2 18.1 8.4 46.4 22.2 20.7 10.7
July 54.0 20.3 20.8 4.9 39.4 26.8 21.4 12.4
August 55.9 16.4 18.5 9.1 66.0 9.1 18.3 6.6
September 58.9 12.4 20.7 8.0 62.9 16.2 16.1 4.9
October 59.8 15.1 15.9 9.1 49.2 15.8 27.6 7.4
November 46.5 23.4 22.6 7.6 41.4 25.4 26.3 6.9
December 56.8 18.3 17.9 7.0 51.0 29.5 14.5 4.9
January 55.8 22.6 14.3 7.4 62.9 18.3 13.7 5.1
February 44.9 24.4 22.8 7.8 51.4 15.4 23.0 10.3
March 52.5 18.6 17.8 11.0 42.0 29.4 19.4 9.2
2012-13 2013-14
April 44.7 36.1 11.3 7.9 50.7 23.5 18.0 7.8
May 51.3 27.0 14.8 6.9 57.8 10.4 22.3 9.4
June 55.2 24.0 14.3 6.5 48.2 21.4 21.8 8.7
July 52.4 24.1 16.1 7.5 28.6 29.6 31.0 10.9
August 38.4 30.5 22.2 8.9 21.9 53.0 18.1 6.9
September 49.8 21.7 20.3 8.2 39.9 41.2 13.8 5.1
October 53.2 14.7 20.9 11.3 43.4 32.6 17.6 6.5
November 41.7 29.5 19.4 9.4 43.6 28.6 17.9 9.9
December 55.9 22.8 13.3 8.0 36.7 49.5 10.3 3.6
January 59.8 15.2 14.8 10.2 36.1 39.8 15.2 9.0
February 61.9 15.5 15.0 7.6 42.1 43.6 9.5 4.8
March 55.5 23.7 13.3 7.6 35.2 37.0 20.2 7.7
2014-15
April 42.4 31.7 18.9 7.0
May 53.2 22.4 16.1 8.3
June 65.3 21.1 9.4 4.2
July 50.0 23.6 14.0 12.4
August 55.5 23.9 15.3 5.3
September 42.1 22.4 25.7 9.8
October 52.4 15.8 21.6 10.1
November 52.1 15.6 21.1 11.1
December 64.2 14.0 15.1 6.7Source: NSE.
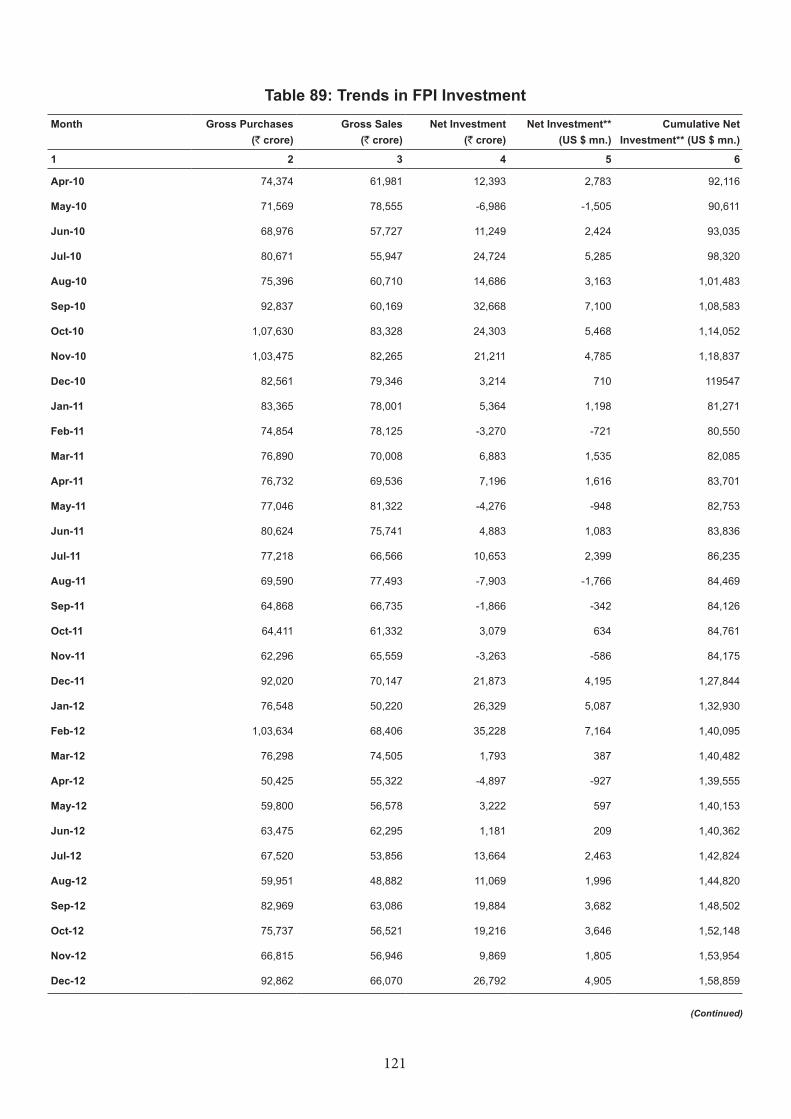
121
Table 89: Trends in FPI InvestmentMonth Gross Purchases
(` crore) Gross Sales
(` crore) Net Investment
(` crore)Net Investment**
(US $ mn.)Cumulative Net
Investment** (US $ mn.)
1 2 3 4 5 6
Apr-10 74,374 61,981 12,393 2,783 92,116
May-10 71,569 78,555 -6,986 -1,505 90,611
Jun-10 68,976 57,727 11,249 2,424 93,035
Jul-10 80,671 55,947 24,724 5,285 98,320
Aug-10 75,396 60,710 14,686 3,163 1,01,483
Sep-10 92,837 60,169 32,668 7,100 1,08,583
Oct-10 1,07,630 83,328 24,303 5,468 1,14,052
Nov-10 1,03,475 82,265 21,211 4,785 1,18,837
Dec-10 82,561 79,346 3,214 710 119547
Jan-11 83,365 78,001 5,364 1,198 81,271
Feb-11 74,854 78,125 -3,270 -721 80,550
Mar-11 76,890 70,008 6,883 1,535 82,085
Apr-11 76,732 69,536 7,196 1,616 83,701
May-11 77,046 81,322 -4,276 -948 82,753
Jun-11 80,624 75,741 4,883 1,083 83,836
Jul-11 77,218 66,566 10,653 2,399 86,235
Aug-11 69,590 77,493 -7,903 -1,766 84,469
Sep-11 64,868 66,735 -1,866 -342 84,126
Oct-11 64,411 61,332 3,079 634 84,761
Nov-11 62,296 65,559 -3,263 -586 84,175
Dec-11 92,020 70,147 21,873 4,195 1,27,844
Jan-12 76,548 50,220 26,329 5,087 1,32,930
Feb-12 1,03,634 68,406 35,228 7,164 1,40,095
Mar-12 76,298 74,505 1,793 387 1,40,482
Apr-12 50,425 55,322 -4,897 -927 1,39,555
May-12 59,800 56,578 3,222 597 1,40,153
Jun-12 63,475 62,295 1,181 209 1,40,362
Jul-12 67,520 53,856 13,664 2,463 1,42,824
Aug-12 59,951 48,882 11,069 1,996 1,44,820
Sep-12 82,969 63,086 19,884 3,682 1,48,502
Oct-12 75,737 56,521 19,216 3,646 1,52,148
Nov-12 66,815 56,946 9,869 1,805 1,53,954
Dec-12 92,862 66,070 26,792 4,905 1,58,859
(Continued)
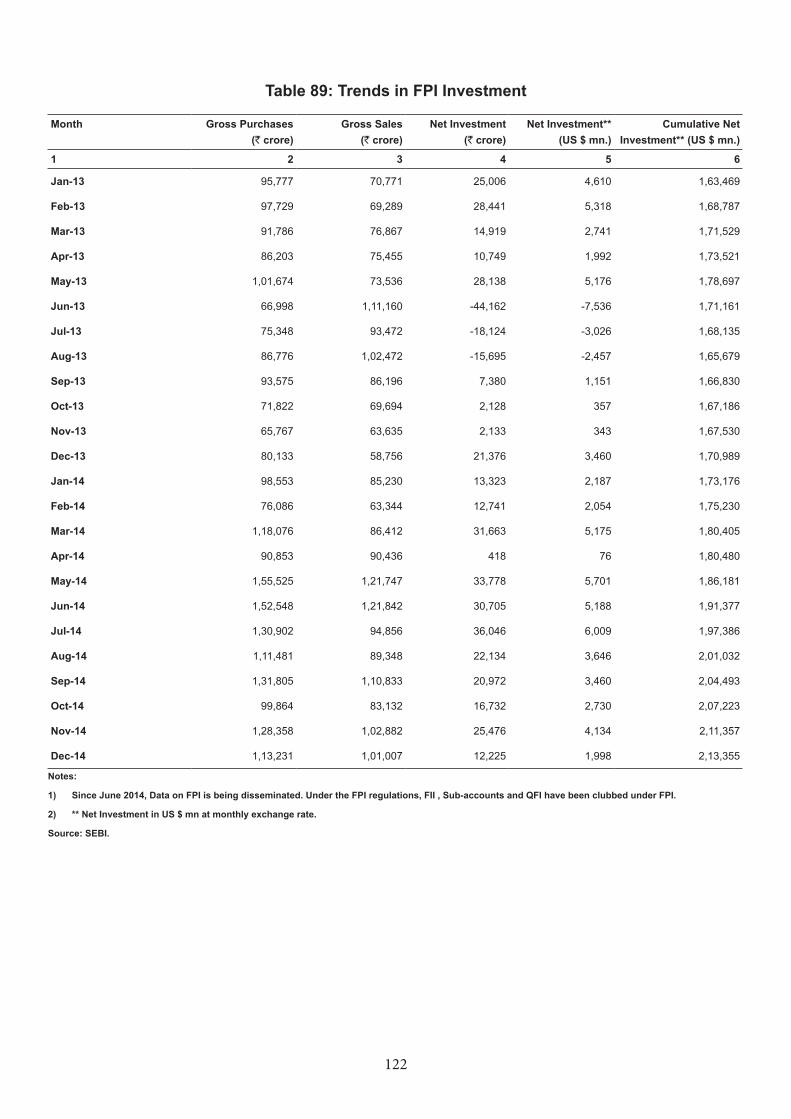
122
Month Gross Purchases (` crore)
Gross Sales (` crore)
Net Investment (` crore)
Net Investment** (US $ mn.)
Cumulative Net Investment** (US $ mn.)
1 2 3 4 5 6
Jan-13 95,777 70,771 25,006 4,610 1,63,469
Feb-13 97,729 69,289 28,441 5,318 1,68,787
Mar-13 91,786 76,867 14,919 2,741 1,71,529
Apr-13 86,203 75,455 10,749 1,992 1,73,521
May-13 1,01,674 73,536 28,138 5,176 1,78,697
Jun-13 66,998 1,11,160 -44,162 -7,536 1,71,161
Jul-13 75,348 93,472 -18,124 -3,026 1,68,135
Aug-13 86,776 1,02,472 -15,695 -2,457 1,65,679
Sep-13 93,575 86,196 7,380 1,151 1,66,830
Oct-13 71,822 69,694 2,128 357 1,67,186
Nov-13 65,767 63,635 2,133 343 1,67,530
Dec-13 80,133 58,756 21,376 3,460 1,70,989
Jan-14 98,553 85,230 13,323 2,187 1,73,176
Feb-14 76,086 63,344 12,741 2,054 1,75,230
Mar-14 1,18,076 86,412 31,663 5,175 1,80,405
Apr-14 90,853 90,436 418 76 1,80,480
May-14 1,55,525 1,21,747 33,778 5,701 1,86,181
Jun-14 1,52,548 1,21,842 30,705 5,188 1,91,377
Jul-14 1,30,902 94,856 36,046 6,009 1,97,386
Aug-14 1,11,481 89,348 22,134 3,646 2,01,032
Sep-14 1,31,805 1,10,833 20,972 3,460 2,04,493
Oct-14 99,864 83,132 16,732 2,730 2,07,223
Nov-14 1,28,358 1,02,882 25,476 4,134 2,11,357
Dec-14 1,13,231 1,01,007 12,225 1,998 2,13,355
Notes:
1) Since June 2014, Data on FPI is being disseminated. Under the FPI regulations, FII , Sub-accounts and QFI have been clubbed under FPI.
2) ** Net Investment in US $ mn at monthly exchange rate.
Source: SEBI.
Table 89: Trends in FPI Investment
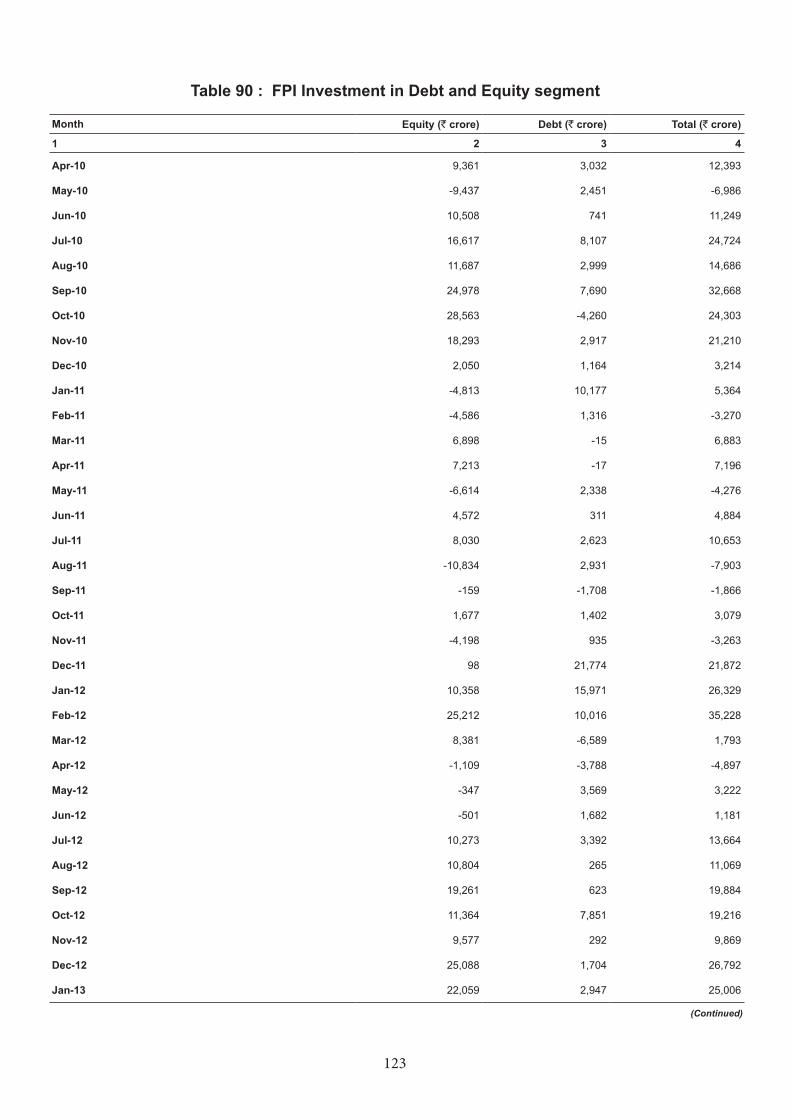
123
Table 90 : FPI Investment in Debt and Equity segment
Month Equity (` crore) Debt (` crore) Total (` crore)
1 2 3 4
Apr-10 9,361 3,032 12,393
May-10 -9,437 2,451 -6,986
Jun-10 10,508 741 11,249
Jul-10 16,617 8,107 24,724
Aug-10 11,687 2,999 14,686
Sep-10 24,978 7,690 32,668
Oct-10 28,563 -4,260 24,303
Nov-10 18,293 2,917 21,210
Dec-10 2,050 1,164 3,214
Jan-11 -4,813 10,177 5,364
Feb-11 -4,586 1,316 -3,270
Mar-11 6,898 -15 6,883
Apr-11 7,213 -17 7,196
May-11 -6,614 2,338 -4,276
Jun-11 4,572 311 4,884
Jul-11 8,030 2,623 10,653
Aug-11 -10,834 2,931 -7,903
Sep-11 -159 -1,708 -1,866
Oct-11 1,677 1,402 3,079
Nov-11 -4,198 935 -3,263
Dec-11 98 21,774 21,872
Jan-12 10,358 15,971 26,329
Feb-12 25,212 10,016 35,228
Mar-12 8,381 -6,589 1,793
Apr-12 -1,109 -3,788 -4,897
May-12 -347 3,569 3,222
Jun-12 -501 1,682 1,181
Jul-12 10,273 3,392 13,664
Aug-12 10,804 265 11,069
Sep-12 19,261 623 19,884
Oct-12 11,364 7,851 19,216
Nov-12 9,577 292 9,869
Dec-12 25,088 1,704 26,792
Jan-13 22,059 2,947 25,006
(Continued)
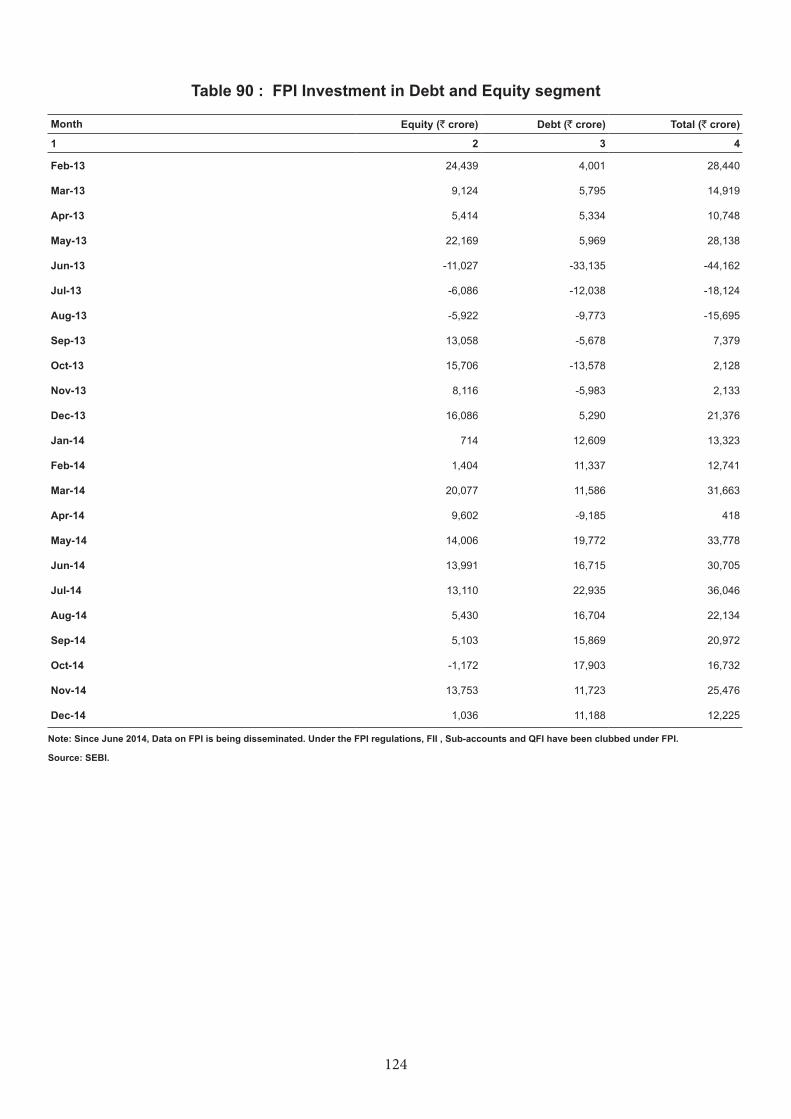
124
Month Equity (` crore) Debt (` crore) Total (` crore)
1 2 3 4
Feb-13 24,439 4,001 28,440
Mar-13 9,124 5,795 14,919
Apr-13 5,414 5,334 10,748
May-13 22,169 5,969 28,138
Jun-13 -11,027 -33,135 -44,162
Jul-13 -6,086 -12,038 -18,124
Aug-13 -5,922 -9,773 -15,695
Sep-13 13,058 -5,678 7,379
Oct-13 15,706 -13,578 2,128
Nov-13 8,116 -5,983 2,133
Dec-13 16,086 5,290 21,376
Jan-14 714 12,609 13,323
Feb-14 1,404 11,337 12,741
Mar-14 20,077 11,586 31,663
Apr-14 9,602 -9,185 418
May-14 14,006 19,772 33,778
Jun-14 13,991 16,715 30,705
Jul-14 13,110 22,935 36,046
Aug-14 5,430 16,704 22,134
Sep-14 5,103 15,869 20,972
Oct-14 -1,172 17,903 16,732
Nov-14 13,753 11,723 25,476
Dec-14 1,036 11,188 12,225
Note: Since June 2014, Data on FPI is being disseminated. Under the FPI regulations, FII , Sub-accounts and QFI have been clubbed under FPI.
Source: SEBI.
Table 90 : FPI Investment in Debt and Equity segment
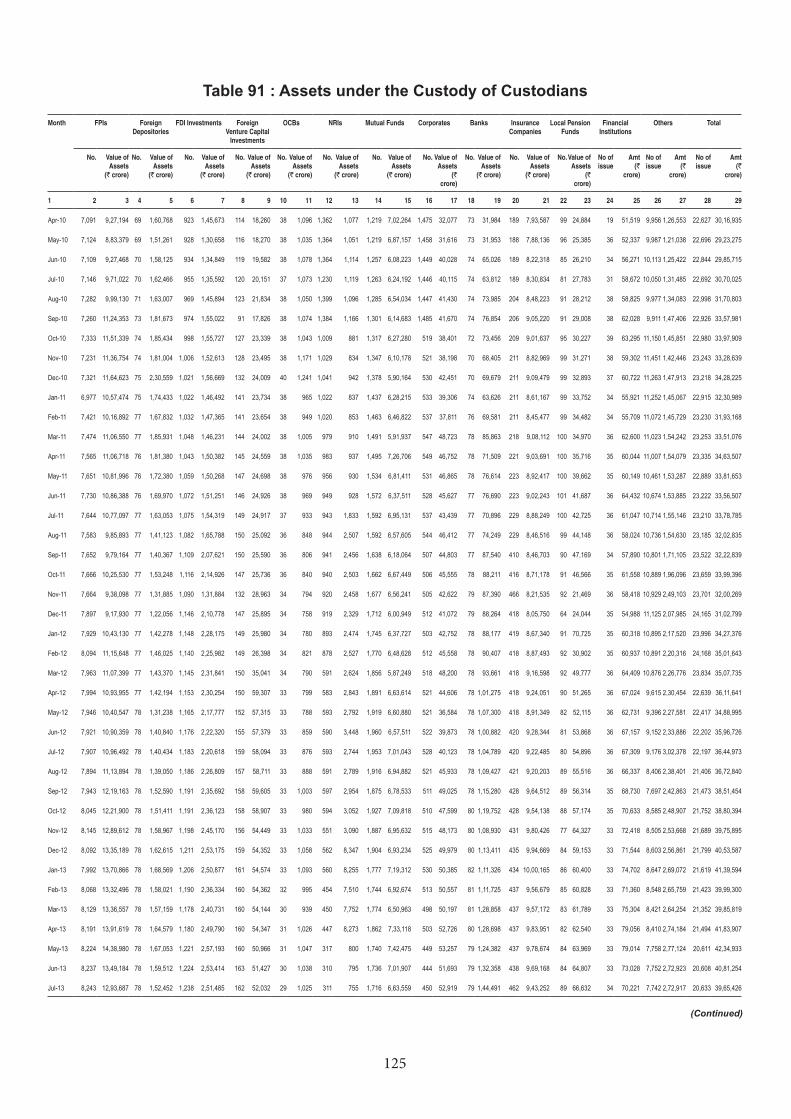
125
Table 91 : Assets under the Custody of Custodians
Month FPIs Foreign Depositories
FDI Investments Foreign Venture Capital
Investments
OCBs NRIs Mutual Funds Corporates Banks Insurance Companies
Local Pension Funds
Financial Institutions
Others Total
No. Value of Assets
(` crore)
No. Value of Assets
(` crore)
No. Value of Assets
(` crore)
No. Value of Assets
(` crore)
No. Value of Assets
(` crore)
No. Value of Assets
(` crore)
No. Value of Assets
(` crore)
No. Value of Assets
(` crore)
No. Value of Assets
(` crore)
No. Value of Assets
(` crore)
No. Value of Assets
(` crore)
No of issue
Amt (`
crore)
No of issue
Amt (`
crore)
No of issue
Amt (`
crore)
1 2 3 4 5 6 7 8 9 10 11 12 13 14 15 16 17 18 19 20 21 22 23 24 25 26 27 28 29
Apr-10 7,091 9,27,194 69 1,60,768 923 1,45,673 114 18,260 38 1,096 1,362 1,077 1,219 7,02,264 1,475 32,077 73 31,984 189 7,93,587 99 24,884 19 51,519 9,956 1,26,553 22,627 30,16,935
May-10 7,124 8,83,379 69 1,51,261 928 1,30,658 116 18,270 38 1,035 1,364 1,051 1,219 6,87,157 1,458 31,616 73 31,953 188 7,88,136 96 25,385 36 52,337 9,987 1,21,038 22,696 29,23,275
Jun-10 7,109 9,27,468 70 1,58,125 934 1,34,849 119 19,582 38 1,078 1,364 1,114 1,257 6,08,223 1,449 40,028 74 65,026 189 8,22,318 85 26,210 34 56,271 10,113 1,25,422 22,844 29,85,715
Jul-10 7,146 9,71,022 70 1,62,466 955 1,35,592 120 20,151 37 1,073 1,230 1,119 1,263 6,24,192 1,446 40,115 74 63,812 189 8,30,834 81 27,783 31 58,672 10,050 1,31,485 22,692 30,70,025
Aug-10 7,282 9,99,130 71 1,63,007 969 1,45,894 123 21,834 38 1,050 1,399 1,096 1,285 6,54,034 1,447 41,430 74 73,985 204 8,48,223 91 28,212 38 58,825 9,977 1,34,083 22,998 31,70,803
Sep-10 7,260 11,24,353 73 1,81,673 974 1,55,022 91 17,826 38 1,074 1,384 1,166 1,301 6,14,683 1,485 41,670 74 76,854 206 9,05,220 91 29,008 38 62,028 9,911 1,47,406 22,926 33,57,981
Oct-10 7,333 11,51,339 74 1,85,434 998 1,55,727 127 23,339 38 1,043 1,009 881 1,317 6,27,280 519 38,401 72 73,456 209 9,01,637 95 30,227 39 63,295 11,150 1,45,851 22,980 33,97,909
Nov-10 7,231 11,36,754 74 1,81,004 1,006 1,52,613 128 23,495 38 1,171 1,029 834 1,347 6,10,178 521 38,198 70 68,405 211 8,82,969 99 31,271 38 59,302 11,451 1,42,446 23,243 33,28,639
Dec-10 7,321 11,64,623 75 2,30,559 1,021 1,56,669 132 24,009 40 1,241 1,041 942 1,378 5,90,164 530 42,451 70 69,679 211 9,09,479 99 32,893 37 60,722 11,263 1,47,913 23,218 34,28,225
Jan-11 6,977 10,57,474 75 1,74,433 1,022 1,46,492 141 23,734 38 965 1,022 837 1,437 6,28,215 533 39,306 74 63,626 211 8,61,167 99 33,752 34 55,921 11,252 1,45,067 22,915 32,30,989
Feb-11 7,421 10,16,892 77 1,67,832 1,032 1,47,365 141 23,654 38 949 1,020 853 1,463 6,46,822 537 37,811 76 69,581 211 8,45,477 99 34,482 34 55,709 11,072 1,45,729 23,230 31,93,168
Mar-11 7,474 11,06,550 77 1,85,931 1,048 1,46,231 144 24,002 38 1,005 979 910 1,491 5,91,937 547 48,723 78 85,863 218 9,08,112 100 34,970 36 62,600 11,023 1,54,242 23,253 33,51,076
Apr-11 7,565 11,06,718 76 1,81,380 1,043 1,50,382 145 24,559 38 1,035 983 937 1,495 7,26,706 549 46,752 78 71,509 221 9,03,691 100 35,716 35 60,044 11,007 1,54,079 23,335 34,63,507
May-11 7,651 10,81,996 76 1,72,380 1,059 1,50,268 147 24,698 38 976 956 930 1,534 6,81,411 531 46,865 78 76,614 223 8,92,417 100 39,662 35 60,149 10,461 1,53,287 22,889 33,81,653
Jun-11 7,730 10,86,388 76 1,69,970 1,072 1,51,251 146 24,926 38 969 949 928 1,572 6,37,511 528 45,627 77 76,690 223 9,02,243 101 41,687 36 64,432 10,674 1,53,885 23,222 33,56,507
Jul-11 7,644 10,77,097 77 1,63,053 1,075 1,54,319 149 24,917 37 933 943 1,833 1,592 6,95,131 537 43,439 77 70,896 229 8,88,249 100 42,725 36 61,047 10,714 1,55,146 23,210 33,78,785
Aug-11 7,583 9,85,893 77 1,41,123 1,082 1,65,788 150 25,092 36 848 944 2,507 1,592 6,57,605 544 46,412 77 74,249 229 8,46,516 99 44,148 36 58,024 10,736 1,54,630 23,185 32,02,835
Sep-11 7,652 9,79,164 77 1,40,367 1,109 2,07,621 150 25,590 36 806 941 2,456 1,638 6,18,064 507 44,803 77 87,540 410 8,46,703 90 47,169 34 57,890 10,801 1,71,105 23,522 32,22,839
Oct-11 7,666 10,25,530 77 1,53,248 1,116 2,14,926 147 25,736 36 840 940 2,503 1,662 6,67,449 506 45,555 78 88,211 416 8,71,178 91 46,566 35 61,558 10,889 1,96,096 23,659 33,99,396
Nov-11 7,664 9,38,098 77 1,31,885 1,090 1,31,884 132 28,963 34 794 920 2,458 1,677 6,56,241 505 42,622 79 87,390 466 8,21,535 92 21,469 36 58,418 10,929 2,49,103 23,701 32,00,269
Dec-11 7,897 9,17,930 77 1,22,056 1,146 2,10,778 147 25,895 34 758 919 2,329 1,712 6,00,949 512 41,072 79 88,264 418 8,05,750 64 24,044 35 54,988 11,125 2,07,985 24,165 31,02,799
Jan-12 7,929 10,43,130 77 1,42,278 1,148 2,28,175 149 25,980 34 780 893 2,474 1,745 6,37,727 503 42,752 78 88,177 419 8,67,340 91 70,725 35 60,318 10,895 2,17,520 23,996 34,27,376
Feb-12 8,094 11,15,648 77 1,46,025 1,140 2,25,982 149 26,398 34 821 878 2,527 1,770 6,48,628 512 45,558 78 90,407 418 8,87,493 92 30,902 35 60,937 10,891 2,20,316 24,168 35,01,643
Mar-12 7,963 11,07,399 77 1,43,370 1,145 2,31,841 150 35,041 34 790 591 2,624 1,856 5,87,249 518 48,200 78 93,661 418 9,16,598 92 49,777 36 64,409 10,876 2,26,776 23,834 35,07,735
Apr-12 7,994 10,93,955 77 1,42,194 1,153 2,30,254 150 59,307 33 799 583 2,843 1,891 6,63,614 521 44,606 78 1,01,275 418 9,24,051 90 51,265 36 67,024 9,615 2,30,454 22,639 36,11,641
May-12 7,946 10,40,547 78 1,31,238 1,165 2,17,777 152 57,315 33 788 593 2,792 1,919 6,60,880 521 36,584 78 1,07,300 418 8,91,349 82 52,115 36 62,731 9,396 2,27,581 22,417 34,88,995
Jun-12 7,921 10,90,359 78 1,40,840 1,176 2,22,320 155 57,379 33 859 590 3,448 1,960 6,57,511 522 39,873 78 1,00,882 420 9,28,344 81 53,868 36 67,157 9,152 2,33,886 22,202 35,96,726
Jul-12 7,907 10,96,492 78 1,40,434 1,183 2,20,618 159 58,094 33 876 593 2,744 1,953 7,01,043 528 40,123 78 1,04,789 420 9,22,485 80 54,896 36 67,309 9,176 3,02,378 22,197 36,44,973
Aug-12 7,894 11,13,894 78 1,39,050 1,186 2,26,809 157 58,711 33 888 591 2,789 1,916 6,94,882 521 45,933 78 1,09,427 421 9,20,203 89 55,516 36 66,337 8,406 2,38,401 21,406 36,72,840
Sep-12 7,943 12,19,163 78 1,52,590 1,191 2,35,692 158 59,605 33 1,003 597 2,954 1,875 6,78,533 511 49,025 78 1,15,280 428 9,64,512 89 56,314 35 68,730 7,697 2,42,863 21,473 38,51,454
Oct-12 8,045 12,21,900 78 1,51,411 1,191 2,36,123 158 58,907 33 980 594 3,052 1,927 7,09,818 510 47,599 80 1,19,752 428 9,54,138 88 57,174 35 70,633 8,585 2,48,907 21,752 38,80,394
Nov-12 8,145 12,89,612 78 1,58,967 1,198 2,45,170 156 54,449 33 1,033 551 3,090 1,887 6,95,632 515 48,173 80 1,08,930 431 9,80,426 77 64,327 33 72,418 8,505 2,53,668 21,689 39,75,895
Dec-12 8,092 13,35,189 78 1,62,615 1,211 2,53,175 159 54,352 33 1,058 562 8,347 1,904 6,93,234 525 49,979 80 1,13,411 435 9,94,669 84 59,153 33 71,544 8,603 2,56,861 21,799 40,53,587
Jan-13 7,992 13,70,866 78 1,68,569 1,206 2,50,877 161 54,574 33 1,093 560 8,255 1,777 7,19,312 530 50,385 82 1,11,326 434 10,00,165 86 60,400 33 74,702 8,647 2,69,072 21,619 41,39,594
Feb-13 8,068 13,32,496 78 1,58,021 1,190 2,36,334 160 54,362 32 995 454 7,510 1,744 6,92,674 513 50,557 81 1,11,725 437 9,56,679 85 60,828 33 71,360 8,548 2,65,759 21,423 39,99,300
Mar-13 8,129 13,36,557 78 1,57,159 1,178 2,40,731 160 54,144 30 939 450 7,752 1,774 6,50,963 498 50,197 81 1,28,858 437 9,57,172 83 61,789 33 75,304 8,421 2,64,254 21,352 39,85,819
Apr-13 8,191 13,91,619 78 1,64,579 1,180 2,49,790 160 54,347 31 1,026 447 8,273 1,862 7,33,118 503 52,726 80 1,28,698 437 9,83,951 82 62,540 33 79,056 8,410 2,74,184 21,494 41,83,907
May-13 8,224 14,38,980 78 1,67,053 1,221 2,57,193 160 50,966 31 1,047 317 800 1,740 7,42,475 449 53,257 79 1,24,382 437 9,78,674 84 63,969 33 79,014 7,758 2,77,124 20,611 42,34,933
Jun-13 8,237 13,49,184 78 1,59,512 1,224 2,53,414 163 51,427 30 1,038 310 795 1,736 7,01,907 444 51,693 79 1,32,358 438 9,69,168 84 64,807 33 73,028 7,752 2,72,923 20,608 40,81,254
Jul-13 8,243 12,93,687 78 1,52,452 1,238 2,51,485 162 52,032 29 1,025 311 755 1,716 6,63,559 450 52,919 79 1,44,491 462 9,43,252 89 66,632 34 70,221 7,742 2,72,917 20,633 39,65,426
(Continued)
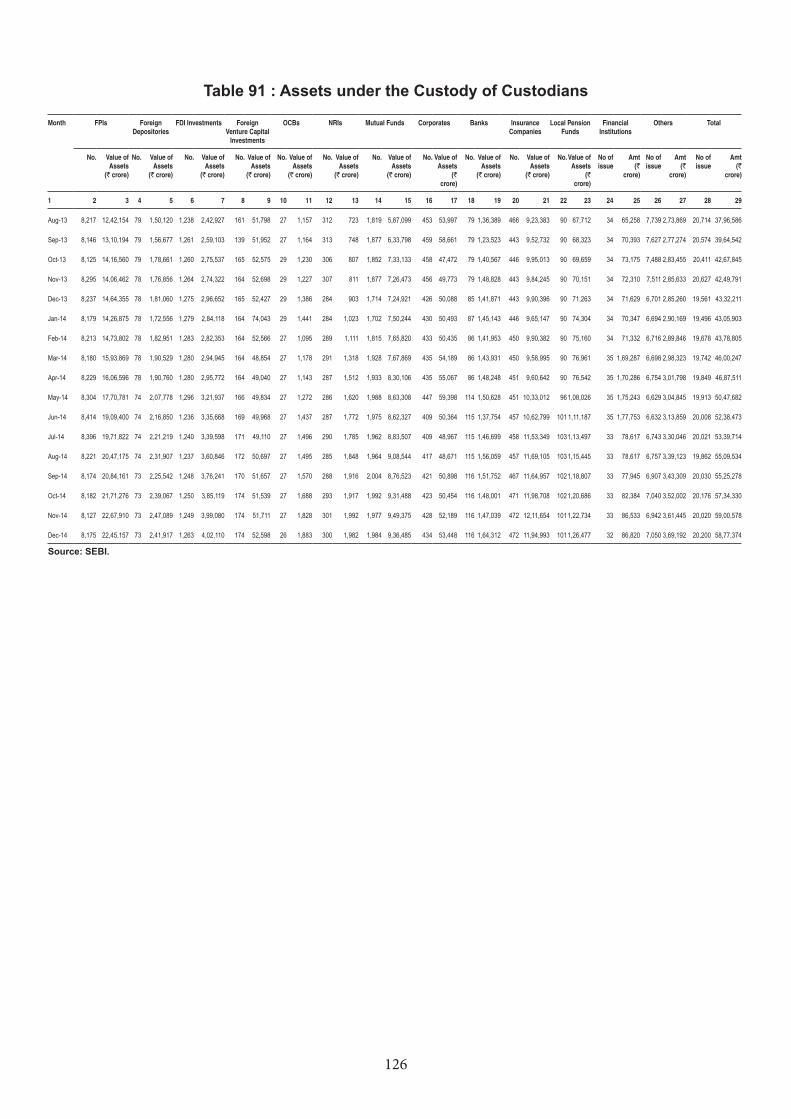
126
Month FPIs Foreign Depositories
FDI Investments Foreign Venture Capital
Investments
OCBs NRIs Mutual Funds Corporates Banks Insurance Companies
Local Pension Funds
Financial Institutions
Others Total
No. Value of Assets
(` crore)
No. Value of Assets
(` crore)
No. Value of Assets
(` crore)
No. Value of Assets
(` crore)
No. Value of Assets
(` crore)
No. Value of Assets
(` crore)
No. Value of Assets
(` crore)
No. Value of Assets
(` crore)
No. Value of Assets
(` crore)
No. Value of Assets
(` crore)
No. Value of Assets
(` crore)
No of issue
Amt (`
crore)
No of issue
Amt (`
crore)
No of issue
Amt (`
crore)
1 2 3 4 5 6 7 8 9 10 11 12 13 14 15 16 17 18 19 20 21 22 23 24 25 26 27 28 29
Aug-13 8,217 12,42,154 79 1,50,120 1,238 2,42,927 161 51,798 27 1,157 312 723 1,819 5,87,099 453 53,997 79 1,36,389 466 9,23,383 90 67,712 34 65,258 7,739 2,73,869 20,714 37,96,586
Sep-13 8,146 13,10,194 79 1,56,677 1,261 2,59,103 139 51,952 27 1,164 313 748 1,877 6,33,798 459 58,661 79 1,23,523 443 9,52,732 90 68,323 34 70,393 7,627 2,77,274 20,574 39,64,542
Oct-13 8,125 14,16,560 79 1,78,661 1,260 2,75,537 165 52,575 29 1,230 306 807 1,852 7,33,133 458 47,472 79 1,40,567 446 9,95,013 90 69,659 34 73,175 7,488 2,83,455 20,411 42,67,845
Nov-13 8,295 14,06,462 78 1,76,856 1,264 2,74,322 164 52,698 29 1,227 307 811 1,877 7,26,473 456 49,773 79 1,48,828 443 9,84,245 90 70,151 34 72,310 7,511 2,85,633 20,627 42,49,791
Dec-13 8,237 14,64,355 78 1,81,060 1,275 2,96,652 165 52,427 29 1,386 284 903 1,714 7,24,921 426 50,088 85 1,41,871 443 9,90,396 90 71,263 34 71,629 6,701 2,85,260 19,561 43,32,211
Jan-14 8,179 14,26,875 78 1,72,556 1,279 2,84,118 164 74,043 29 1,441 284 1,023 1,702 7,50,244 430 50,493 87 1,45,143 446 9,65,147 90 74,304 34 70,347 6,694 2,90,169 19,496 43,05,903
Feb-14 8,213 14,73,802 78 1,82,951 1,283 2,82,353 164 52,566 27 1,095 289 1,111 1,815 7,65,820 433 50,435 86 1,41,953 450 9,90,382 90 75,160 34 71,332 6,716 2,89,846 19,678 43,78,805
Mar-14 8,180 15,93,869 78 1,90,529 1,280 2,94,945 164 48,854 27 1,178 291 1,318 1,928 7,67,869 435 54,189 86 1,43,931 450 9,58,995 90 76,961 35 1,69,287 6,698 2,98,323 19,742 46,00,247
Apr-14 8,229 16,06,596 78 1,90,760 1,280 2,95,772 164 49,040 27 1,143 287 1,512 1,933 8,30,106 435 55,067 86 1,48,248 451 9,60,642 90 76,542 35 1,70,286 6,754 3,01,798 19,849 46,87,511
May-14 8,304 17,70,781 74 2,07,778 1,296 3,21,937 166 49,834 27 1,272 286 1,620 1,988 8,63,308 447 59,398 114 1,50,628 451 10,33,012 961,08,026 35 1,75,243 6,629 3,04,845 19,913 50,47,682
Jun-14 8,414 19,09,400 74 2,16,850 1,236 3,35,668 169 49,968 27 1,437 287 1,772 1,975 8,62,327 409 50,364 115 1,37,754 457 10,62,799 101 1,11,187 35 1,77,753 6,632 3,13,859 20,008 52,38,473
Jul-14 8,396 19,71,822 74 2,21,219 1,240 3,39,598 171 49,110 27 1,496 290 1,785 1,962 8,83,507 409 48,967 115 1,46,699 458 11,53,349 1031,13,497 33 78,617 6,743 3,30,046 20,021 53,39,714
Aug-14 8,221 20,47,175 74 2,31,907 1,237 3,60,846 172 50,697 27 1,495 285 1,848 1,964 9,08,544 417 48,671 115 1,56,059 457 11,69,105 1031,15,445 33 78,617 6,757 3,39,123 19,862 55,09,534
Sep-14 8,174 20,84,161 73 2,25,542 1,248 3,76,241 170 51,657 27 1,570 288 1,916 2,004 8,76,523 421 50,898 116 1,51,752 467 11,64,957 1021,18,807 33 77,945 6,907 3,43,309 20,030 55,25,278
Oct-14 8,182 21,71,276 73 2,39,067 1,250 3,85,119 174 51,539 27 1,688 293 1,917 1,992 9,31,488 423 50,454 116 1,48,001 471 11,98,708 1021,20,686 33 82,384 7,040 3,52,002 20,176 57,34,330
Nov-14 8,127 22,67,910 73 2,47,089 1,249 3,99,080 174 51,711 27 1,828 301 1,992 1,977 9,49,375 428 52,189 116 1,47,039 472 12,11,654 1011,22,734 33 86,533 6,942 3,61,445 20,020 59,00,578
Dec-14 8,175 22,45,157 73 2,41,917 1,263 4,02,110 174 52,598 26 1,883 300 1,982 1,984 9,36,485 434 53,448 116 1,64,312 472 11,94,993 1011,26,477 32 86,820 7,050 3,69,192 20,200 58,77,374
Source: SEBI.
Table 91 : Assets under the Custody of Custodians

127
Table 92: Notional Value of Offshore Derivative Instruments (ODIs) Vs Assets Under Custody (AUC) of FPIs/Deemed FPIs
Month Total value of PNs on Equity & Debt
including PNs on derivatives
Total value of PNs on Equity & Debt
excluding PNs on derivatives
Assets Under Custody of FIIs
Total value of PNs on Equity & Debt
including PNs on derivatives as % of (4)
Total value of PNs on Equity & Debt
excluding PNs on derivatives as % of (4)
1 2 3 4 5 6
Apr-10 1,54,340 NA 9,27,194 15.0 NA
May-10 1,59,927 NA 8,83,379 15.0 NA
Jun-10 1,68,016 NA 9,27,468 15.0 NA
Jul-10 1,65,749 NA 9,71,022 15.0 NA
Aug-10 1,63,657 NA 9,99,130 15.0 NA
Sep-10 2,00,927 NA 11,24,352 13.0 NA
Oct-10 NA NA NA NA NA
Nov-10 NA NA NA NA NA
Dec-10 NA NA NA NA NA
Jan-11 1,74,485 1,34,838 10,57,474 16.5 12.8
Feb-11 1,71,601 1,26,329 10,16,892 16.9 12.4
Mar-11 1,75,097 1,33,098 11,06,550 15.8 12.0
Apr-11 1,66,444 1,18,230 11,06,718 15.0 11.0
May-11 2,11,199 1,61,210 10,81,996 20.0 15.0
Jun-11 1,53,291 1,07,640 10,86,388 14.0 10.0
Jul-11 1,50,414 1,02,954 10,77,096 14.0 10.0
Aug-11 1,52,288 1,00,454 9,85,893 15.0 10.0
Sep-11 1,75,291 1,15,311 9,79,164 18.0 12.0
Oct-11 1,80,002 1,16,475 10,25,530 18.0 11.0
Nov-11 1,79,035 1,17,532 9,38,098 19.0 13.0
Dec-11 1,38,711 93,563 9,17,930 15.1 10.2
Jan-12 1,57,697 1,14,092 10,43,130 15.1 10.9
Feb-12 1,83,151 1,28,606 11,15,648 16.4 11.5
Mar-12 1,65,832 1,15,332 11,07,399 15.0 10.4
Apr-12 1,30,012 86,785 10,93,955 11.9 7.9
May-12 1,28,895 65,472 10,40,547 12.4 6.3
Jun-12 1,29,851 69,523 10,90,359 11.9 6.4
Jul-12 1,29,586 68,677 10,96,492 11.8 6.3
Aug-12 1,41,710 68,450 11,13,894 12.7 6.1
Sep-12 1,46,600 82,379 12,19,163 12.0 6.8
Oct-12 1,75,829 95,536 12,21,900 14.4 7.8
(Continued)
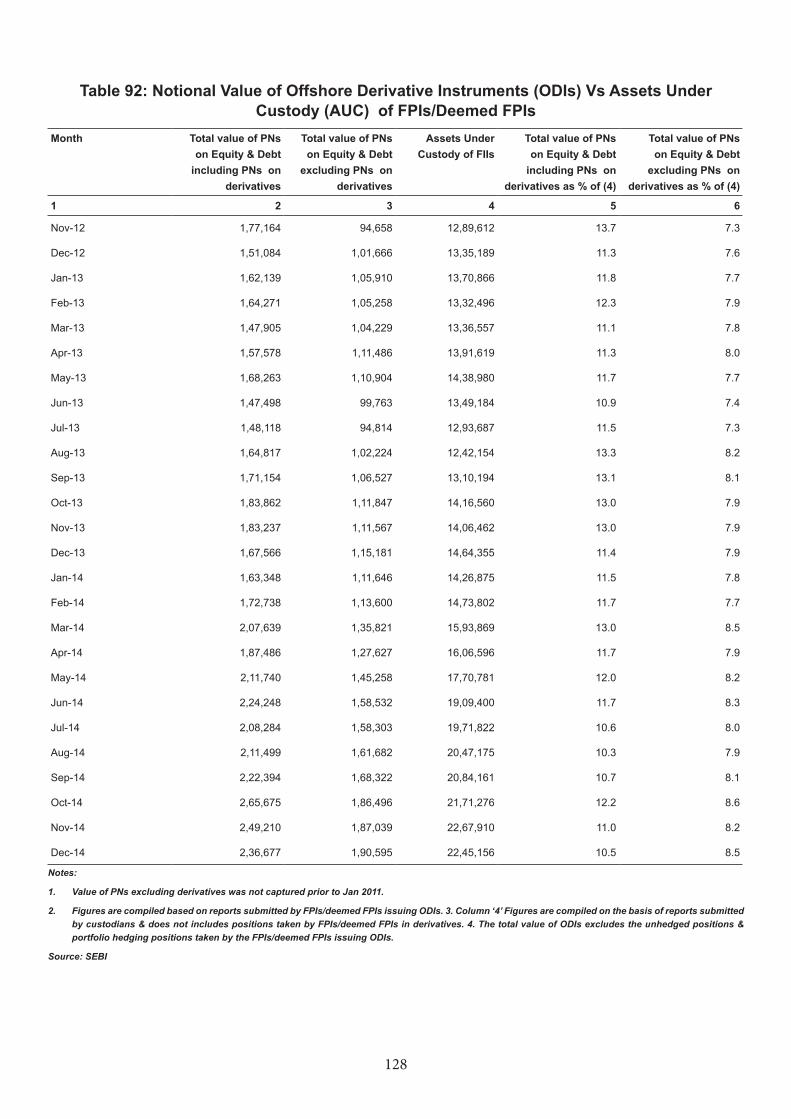
128
Month Total value of PNs on Equity & Debt
including PNs on derivatives
Total value of PNs on Equity & Debt
excluding PNs on derivatives
Assets Under Custody of FIIs
Total value of PNs on Equity & Debt
including PNs on derivatives as % of (4)
Total value of PNs on Equity & Debt
excluding PNs on derivatives as % of (4)
1 2 3 4 5 6
Nov-12 1,77,164 94,658 12,89,612 13.7 7.3
Dec-12 1,51,084 1,01,666 13,35,189 11.3 7.6
Jan-13 1,62,139 1,05,910 13,70,866 11.8 7.7
Feb-13 1,64,271 1,05,258 13,32,496 12.3 7.9
Mar-13 1,47,905 1,04,229 13,36,557 11.1 7.8
Apr-13 1,57,578 1,11,486 13,91,619 11.3 8.0
May-13 1,68,263 1,10,904 14,38,980 11.7 7.7
Jun-13 1,47,498 99,763 13,49,184 10.9 7.4
Jul-13 1,48,118 94,814 12,93,687 11.5 7.3
Aug-13 1,64,817 1,02,224 12,42,154 13.3 8.2
Sep-13 1,71,154 1,06,527 13,10,194 13.1 8.1
Oct-13 1,83,862 1,11,847 14,16,560 13.0 7.9
Nov-13 1,83,237 1,11,567 14,06,462 13.0 7.9
Dec-13 1,67,566 1,15,181 14,64,355 11.4 7.9
Jan-14 1,63,348 1,11,646 14,26,875 11.5 7.8
Feb-14 1,72,738 1,13,600 14,73,802 11.7 7.7
Mar-14 2,07,639 1,35,821 15,93,869 13.0 8.5
Apr-14 1,87,486 1,27,627 16,06,596 11.7 7.9
May-14 2,11,740 1,45,258 17,70,781 12.0 8.2
Jun-14 2,24,248 1,58,532 19,09,400 11.7 8.3
Jul-14 2,08,284 1,58,303 19,71,822 10.6 8.0
Aug-14 2,11,499 1,61,682 20,47,175 10.3 7.9
Sep-14 2,22,394 1,68,322 20,84,161 10.7 8.1
Oct-14 2,65,675 1,86,496 21,71,276 12.2 8.6
Nov-14 2,49,210 1,87,039 22,67,910 11.0 8.2
Dec-14 2,36,677 1,90,595 22,45,156 10.5 8.5
Notes:
1. Value of PNs excluding derivatives was not captured prior to Jan 2011.
2. Figures are compiled based on reports submitted by FPIs/deemed FPIs issuing ODIs. 3. Column ‘4’ Figures are compiled on the basis of reports submitted by custodians & does not includes positions taken by FPIs/deemed FPIs in derivatives. 4. The total value of ODIs excludes the unhedged positions & portfolio hedging positions taken by the FPIs/deemed FPIs issuing ODIs.
Source: SEBI
Table 92: Notional Value of Offshore Derivative Instruments (ODIs) Vs Assets Under Custody (AUC) of FPIs/Deemed FPIs
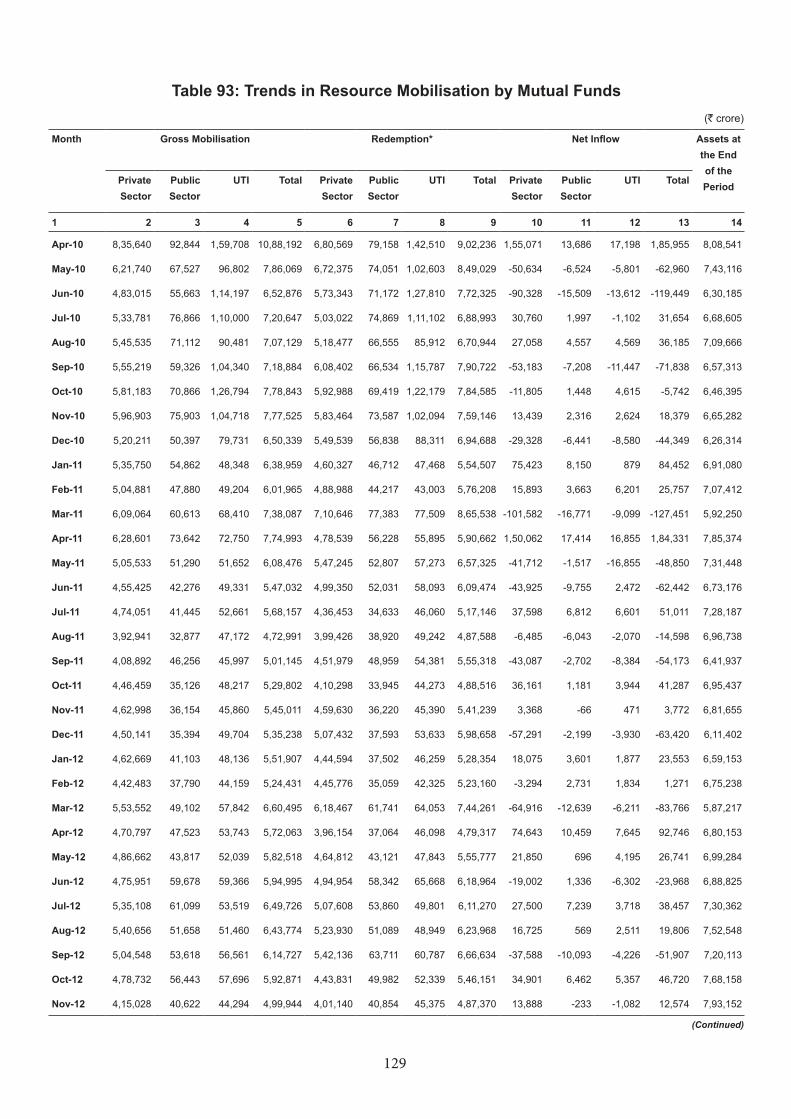
129
Table 93: Trends in Resource Mobilisation by Mutual Funds
Month Gross Mobilisation Redemption* Net Inflow Assets at the End of the PeriodPrivate
SectorPublic Sector
UTI Total Private Sector
Public Sector
UTI Total Private Sector
Public Sector
UTI Total
1 2 3 4 5 6 7 8 9 10 11 12 13 14
Apr-10 8,35,640 92,844 1,59,708 10,88,192 6,80,569 79,158 1,42,510 9,02,236 1,55,071 13,686 17,198 1,85,955 8,08,541
May-10 6,21,740 67,527 96,802 7,86,069 6,72,375 74,051 1,02,603 8,49,029 -50,634 -6,524 -5,801 -62,960 7,43,116
Jun-10 4,83,015 55,663 1,14,197 6,52,876 5,73,343 71,172 1,27,810 7,72,325 -90,328 -15,509 -13,612 -119,449 6,30,185
Jul-10 5,33,781 76,866 1,10,000 7,20,647 5,03,022 74,869 1,11,102 6,88,993 30,760 1,997 -1,102 31,654 6,68,605
Aug-10 5,45,535 71,112 90,481 7,07,129 5,18,477 66,555 85,912 6,70,944 27,058 4,557 4,569 36,185 7,09,666
Sep-10 5,55,219 59,326 1,04,340 7,18,884 6,08,402 66,534 1,15,787 7,90,722 -53,183 -7,208 -11,447 -71,838 6,57,313
Oct-10 5,81,183 70,866 1,26,794 7,78,843 5,92,988 69,419 1,22,179 7,84,585 -11,805 1,448 4,615 -5,742 6,46,395
Nov-10 5,96,903 75,903 1,04,718 7,77,525 5,83,464 73,587 1,02,094 7,59,146 13,439 2,316 2,624 18,379 6,65,282
Dec-10 5,20,211 50,397 79,731 6,50,339 5,49,539 56,838 88,311 6,94,688 -29,328 -6,441 -8,580 -44,349 6,26,314
Jan-11 5,35,750 54,862 48,348 6,38,959 4,60,327 46,712 47,468 5,54,507 75,423 8,150 879 84,452 6,91,080
Feb-11 5,04,881 47,880 49,204 6,01,965 4,88,988 44,217 43,003 5,76,208 15,893 3,663 6,201 25,757 7,07,412
Mar-11 6,09,064 60,613 68,410 7,38,087 7,10,646 77,383 77,509 8,65,538 -101,582 -16,771 -9,099 -127,451 5,92,250
Apr-11 6,28,601 73,642 72,750 7,74,993 4,78,539 56,228 55,895 5,90,662 1,50,062 17,414 16,855 1,84,331 7,85,374
May-11 5,05,533 51,290 51,652 6,08,476 5,47,245 52,807 57,273 6,57,325 -41,712 -1,517 -16,855 -48,850 7,31,448
Jun-11 4,55,425 42,276 49,331 5,47,032 4,99,350 52,031 58,093 6,09,474 -43,925 -9,755 2,472 -62,442 6,73,176
Jul-11 4,74,051 41,445 52,661 5,68,157 4,36,453 34,633 46,060 5,17,146 37,598 6,812 6,601 51,011 7,28,187
Aug-11 3,92,941 32,877 47,172 4,72,991 3,99,426 38,920 49,242 4,87,588 -6,485 -6,043 -2,070 -14,598 6,96,738
Sep-11 4,08,892 46,256 45,997 5,01,145 4,51,979 48,959 54,381 5,55,318 -43,087 -2,702 -8,384 -54,173 6,41,937
Oct-11 4,46,459 35,126 48,217 5,29,802 4,10,298 33,945 44,273 4,88,516 36,161 1,181 3,944 41,287 6,95,437
Nov-11 4,62,998 36,154 45,860 5,45,011 4,59,630 36,220 45,390 5,41,239 3,368 -66 471 3,772 6,81,655
Dec-11 4,50,141 35,394 49,704 5,35,238 5,07,432 37,593 53,633 5,98,658 -57,291 -2,199 -3,930 -63,420 6,11,402
Jan-12 4,62,669 41,103 48,136 5,51,907 4,44,594 37,502 46,259 5,28,354 18,075 3,601 1,877 23,553 6,59,153
Feb-12 4,42,483 37,790 44,159 5,24,431 4,45,776 35,059 42,325 5,23,160 -3,294 2,731 1,834 1,271 6,75,238
Mar-12 5,53,552 49,102 57,842 6,60,495 6,18,467 61,741 64,053 7,44,261 -64,916 -12,639 -6,211 -83,766 5,87,217
Apr-12 4,70,797 47,523 53,743 5,72,063 3,96,154 37,064 46,098 4,79,317 74,643 10,459 7,645 92,746 6,80,153
May-12 4,86,662 43,817 52,039 5,82,518 4,64,812 43,121 47,843 5,55,777 21,850 696 4,195 26,741 6,99,284
Jun-12 4,75,951 59,678 59,366 5,94,995 4,94,954 58,342 65,668 6,18,964 -19,002 1,336 -6,302 -23,968 6,88,825
Jul-12 5,35,108 61,099 53,519 6,49,726 5,07,608 53,860 49,801 6,11,270 27,500 7,239 3,718 38,457 7,30,362
Aug-12 5,40,656 51,658 51,460 6,43,774 5,23,930 51,089 48,949 6,23,968 16,725 569 2,511 19,806 7,52,548
Sep-12 5,04,548 53,618 56,561 6,14,727 5,42,136 63,711 60,787 6,66,634 -37,588 -10,093 -4,226 -51,907 7,20,113
Oct-12 4,78,732 56,443 57,696 5,92,871 4,43,831 49,982 52,339 5,46,151 34,901 6,462 5,357 46,720 7,68,158
Nov-12 4,15,028 40,622 44,294 4,99,944 4,01,140 40,854 45,375 4,87,370 13,888 -233 -1,082 12,574 7,93,152
(Continued)
(` crore)
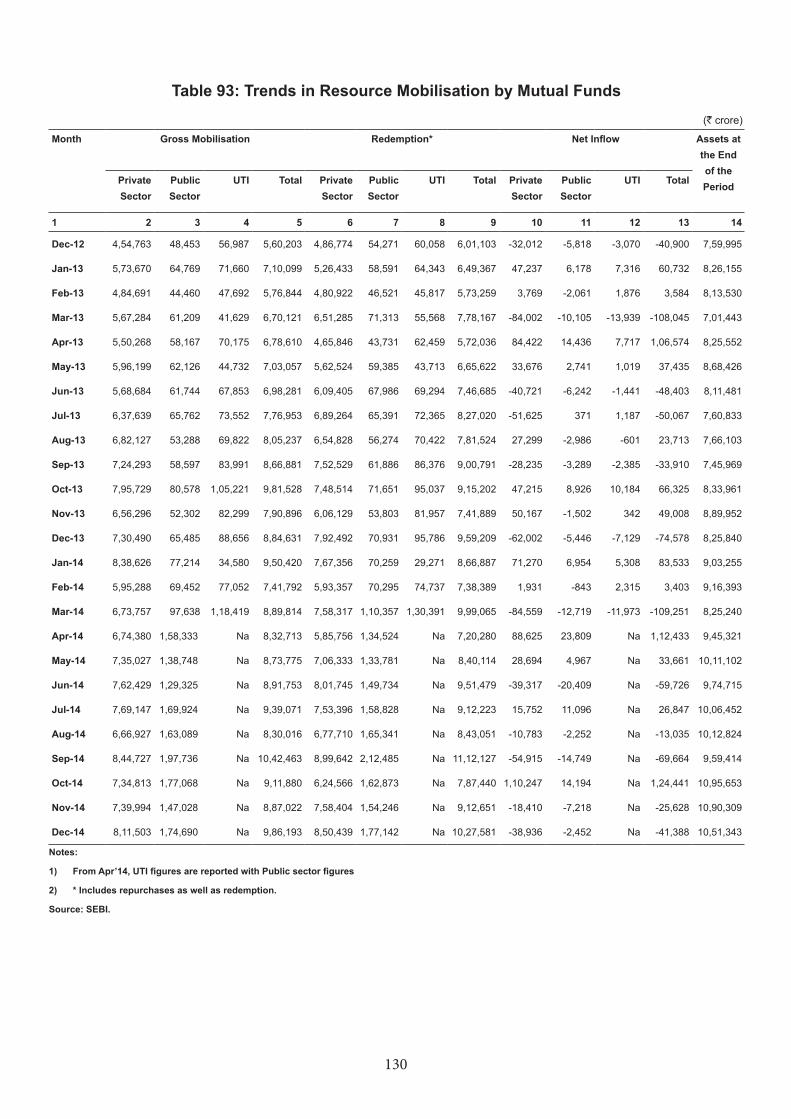
130
Month Gross Mobilisation Redemption* Net Inflow Assets at the End of the PeriodPrivate
SectorPublic Sector
UTI Total Private Sector
Public Sector
UTI Total Private Sector
Public Sector
UTI Total
1 2 3 4 5 6 7 8 9 10 11 12 13 14
Dec-12 4,54,763 48,453 56,987 5,60,203 4,86,774 54,271 60,058 6,01,103 -32,012 -5,818 -3,070 -40,900 7,59,995
Jan-13 5,73,670 64,769 71,660 7,10,099 5,26,433 58,591 64,343 6,49,367 47,237 6,178 7,316 60,732 8,26,155
Feb-13 4,84,691 44,460 47,692 5,76,844 4,80,922 46,521 45,817 5,73,259 3,769 -2,061 1,876 3,584 8,13,530
Mar-13 5,67,284 61,209 41,629 6,70,121 6,51,285 71,313 55,568 7,78,167 -84,002 -10,105 -13,939 -108,045 7,01,443
Apr-13 5,50,268 58,167 70,175 6,78,610 4,65,846 43,731 62,459 5,72,036 84,422 14,436 7,717 1,06,574 8,25,552
May-13 5,96,199 62,126 44,732 7,03,057 5,62,524 59,385 43,713 6,65,622 33,676 2,741 1,019 37,435 8,68,426
Jun-13 5,68,684 61,744 67,853 6,98,281 6,09,405 67,986 69,294 7,46,685 -40,721 -6,242 -1,441 -48,403 8,11,481
Jul-13 6,37,639 65,762 73,552 7,76,953 6,89,264 65,391 72,365 8,27,020 -51,625 371 1,187 -50,067 7,60,833
Aug-13 6,82,127 53,288 69,822 8,05,237 6,54,828 56,274 70,422 7,81,524 27,299 -2,986 -601 23,713 7,66,103
Sep-13 7,24,293 58,597 83,991 8,66,881 7,52,529 61,886 86,376 9,00,791 -28,235 -3,289 -2,385 -33,910 7,45,969
Oct-13 7,95,729 80,578 1,05,221 9,81,528 7,48,514 71,651 95,037 9,15,202 47,215 8,926 10,184 66,325 8,33,961
Nov-13 6,56,296 52,302 82,299 7,90,896 6,06,129 53,803 81,957 7,41,889 50,167 -1,502 342 49,008 8,89,952
Dec-13 7,30,490 65,485 88,656 8,84,631 7,92,492 70,931 95,786 9,59,209 -62,002 -5,446 -7,129 -74,578 8,25,840
Jan-14 8,38,626 77,214 34,580 9,50,420 7,67,356 70,259 29,271 8,66,887 71,270 6,954 5,308 83,533 9,03,255
Feb-14 5,95,288 69,452 77,052 7,41,792 5,93,357 70,295 74,737 7,38,389 1,931 -843 2,315 3,403 9,16,393
Mar-14 6,73,757 97,638 1,18,419 8,89,814 7,58,317 1,10,357 1,30,391 9,99,065 -84,559 -12,719 -11,973 -109,251 8,25,240
Apr-14 6,74,380 1,58,333 Na 8,32,713 5,85,756 1,34,524 Na 7,20,280 88,625 23,809 Na 1,12,433 9,45,321
May-14 7,35,027 1,38,748 Na 8,73,775 7,06,333 1,33,781 Na 8,40,114 28,694 4,967 Na 33,661 10,11,102
Jun-14 7,62,429 1,29,325 Na 8,91,753 8,01,745 1,49,734 Na 9,51,479 -39,317 -20,409 Na -59,726 9,74,715
Jul-14 7,69,147 1,69,924 Na 9,39,071 7,53,396 1,58,828 Na 9,12,223 15,752 11,096 Na 26,847 10,06,452
Aug-14 6,66,927 1,63,089 Na 8,30,016 6,77,710 1,65,341 Na 8,43,051 -10,783 -2,252 Na -13,035 10,12,824
Sep-14 8,44,727 1,97,736 Na 10,42,463 8,99,642 2,12,485 Na 11,12,127 -54,915 -14,749 Na -69,664 9,59,414
Oct-14 7,34,813 1,77,068 Na 9,11,880 6,24,566 1,62,873 Na 7,87,440 1,10,247 14,194 Na 1,24,441 10,95,653
Nov-14 7,39,994 1,47,028 Na 8,87,022 7,58,404 1,54,246 Na 9,12,651 -18,410 -7,218 Na -25,628 10,90,309
Dec-14 8,11,503 1,74,690 Na 9,86,193 8,50,439 1,77,142 Na 10,27,581 -38,936 -2,452 Na -41,388 10,51,343
Notes:
1) From Apr’14, UTI figures are reported with Public sector figures
2) * Includes repurchases as well as redemption.
Source: SEBI.
Table 93: Trends in Resource Mobilisation by Mutual Funds
(` crore)
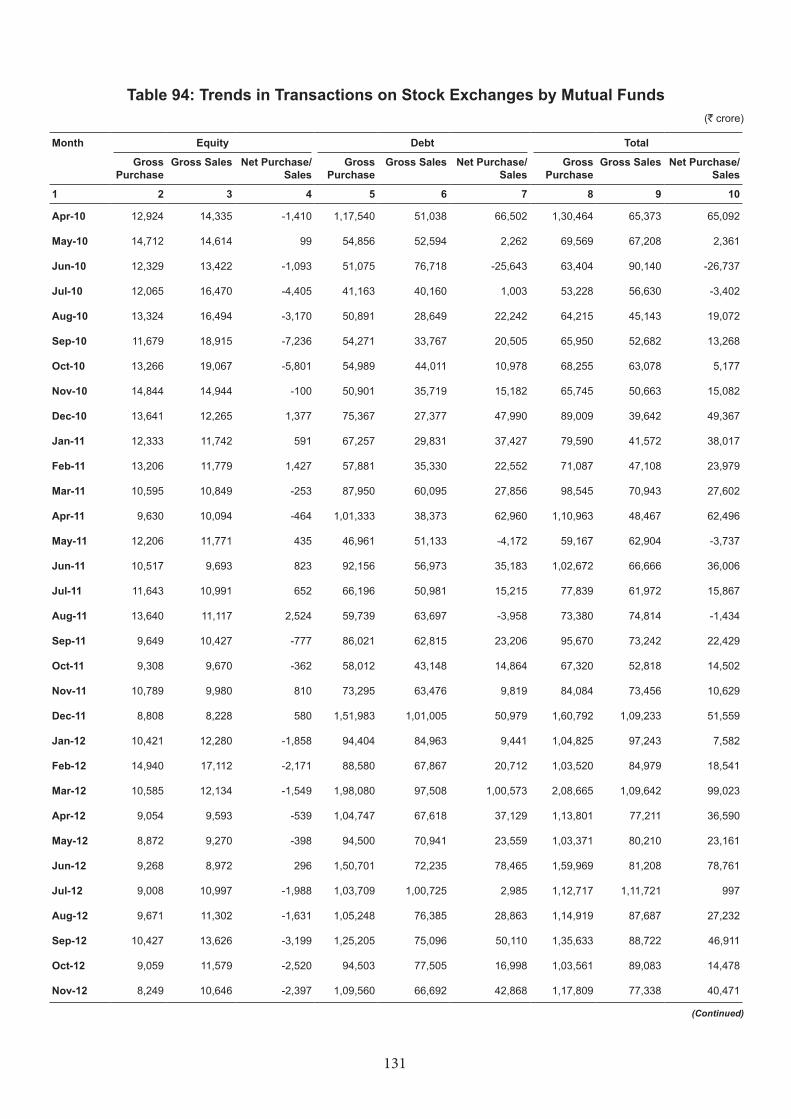
131
Table 94: Trends in Transactions on Stock Exchanges by Mutual Funds
Month Equity Debt Total
Gross Purchase
Gross Sales Net Purchase/Sales
Gross Purchase
Gross Sales Net Purchase/Sales
Gross Purchase
Gross Sales Net Purchase/Sales
1 2 3 4 5 6 7 8 9 10
Apr-10 12,924 14,335 -1,410 1,17,540 51,038 66,502 1,30,464 65,373 65,092
May-10 14,712 14,614 99 54,856 52,594 2,262 69,569 67,208 2,361
Jun-10 12,329 13,422 -1,093 51,075 76,718 -25,643 63,404 90,140 -26,737
Jul-10 12,065 16,470 -4,405 41,163 40,160 1,003 53,228 56,630 -3,402
Aug-10 13,324 16,494 -3,170 50,891 28,649 22,242 64,215 45,143 19,072
Sep-10 11,679 18,915 -7,236 54,271 33,767 20,505 65,950 52,682 13,268
Oct-10 13,266 19,067 -5,801 54,989 44,011 10,978 68,255 63,078 5,177
Nov-10 14,844 14,944 -100 50,901 35,719 15,182 65,745 50,663 15,082
Dec-10 13,641 12,265 1,377 75,367 27,377 47,990 89,009 39,642 49,367
Jan-11 12,333 11,742 591 67,257 29,831 37,427 79,590 41,572 38,017
Feb-11 13,206 11,779 1,427 57,881 35,330 22,552 71,087 47,108 23,979
Mar-11 10,595 10,849 -253 87,950 60,095 27,856 98,545 70,943 27,602
Apr-11 9,630 10,094 -464 1,01,333 38,373 62,960 1,10,963 48,467 62,496
May-11 12,206 11,771 435 46,961 51,133 -4,172 59,167 62,904 -3,737
Jun-11 10,517 9,693 823 92,156 56,973 35,183 1,02,672 66,666 36,006
Jul-11 11,643 10,991 652 66,196 50,981 15,215 77,839 61,972 15,867
Aug-11 13,640 11,117 2,524 59,739 63,697 -3,958 73,380 74,814 -1,434
Sep-11 9,649 10,427 -777 86,021 62,815 23,206 95,670 73,242 22,429
Oct-11 9,308 9,670 -362 58,012 43,148 14,864 67,320 52,818 14,502
Nov-11 10,789 9,980 810 73,295 63,476 9,819 84,084 73,456 10,629
Dec-11 8,808 8,228 580 1,51,983 1,01,005 50,979 1,60,792 1,09,233 51,559
Jan-12 10,421 12,280 -1,858 94,404 84,963 9,441 1,04,825 97,243 7,582
Feb-12 14,940 17,112 -2,171 88,580 67,867 20,712 1,03,520 84,979 18,541
Mar-12 10,585 12,134 -1,549 1,98,080 97,508 1,00,573 2,08,665 1,09,642 99,023
Apr-12 9,054 9,593 -539 1,04,747 67,618 37,129 1,13,801 77,211 36,590
May-12 8,872 9,270 -398 94,500 70,941 23,559 1,03,371 80,210 23,161
Jun-12 9,268 8,972 296 1,50,701 72,235 78,465 1,59,969 81,208 78,761
Jul-12 9,008 10,997 -1,988 1,03,709 1,00,725 2,985 1,12,717 1,11,721 997
Aug-12 9,671 11,302 -1,631 1,05,248 76,385 28,863 1,14,919 87,687 27,232
Sep-12 10,427 13,626 -3,199 1,25,205 75,096 50,110 1,35,633 88,722 46,911
Oct-12 9,059 11,579 -2,520 94,503 77,505 16,998 1,03,561 89,083 14,478
Nov-12 8,249 10,646 -2,397 1,09,560 66,692 42,868 1,17,809 77,338 40,471
(Continued)
(` crore)
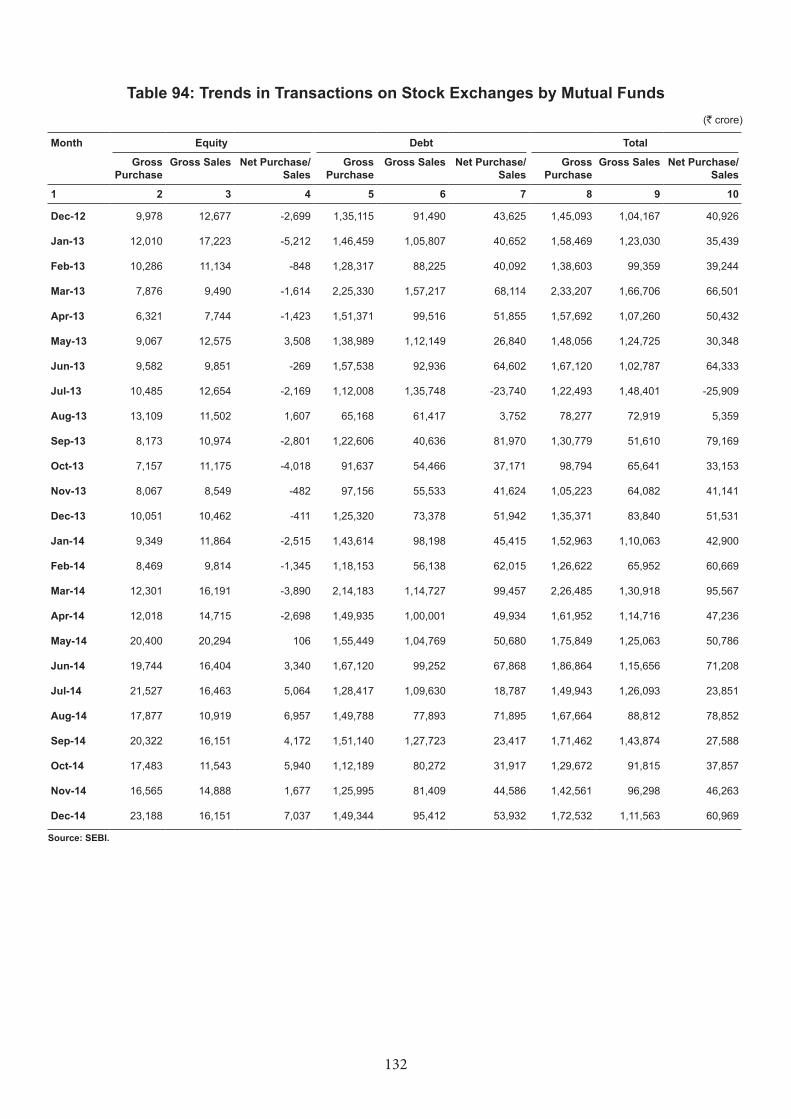
132
Month Equity Debt Total
Gross Purchase
Gross Sales Net Purchase/Sales
Gross Purchase
Gross Sales Net Purchase/Sales
Gross Purchase
Gross Sales Net Purchase/Sales
1 2 3 4 5 6 7 8 9 10
Dec-12 9,978 12,677 -2,699 1,35,115 91,490 43,625 1,45,093 1,04,167 40,926
Jan-13 12,010 17,223 -5,212 1,46,459 1,05,807 40,652 1,58,469 1,23,030 35,439
Feb-13 10,286 11,134 -848 1,28,317 88,225 40,092 1,38,603 99,359 39,244
Mar-13 7,876 9,490 -1,614 2,25,330 1,57,217 68,114 2,33,207 1,66,706 66,501
Apr-13 6,321 7,744 -1,423 1,51,371 99,516 51,855 1,57,692 1,07,260 50,432
May-13 9,067 12,575 3,508 1,38,989 1,12,149 26,840 1,48,056 1,24,725 30,348
Jun-13 9,582 9,851 -269 1,57,538 92,936 64,602 1,67,120 1,02,787 64,333
Jul-13 10,485 12,654 -2,169 1,12,008 1,35,748 -23,740 1,22,493 1,48,401 -25,909
Aug-13 13,109 11,502 1,607 65,168 61,417 3,752 78,277 72,919 5,359
Sep-13 8,173 10,974 -2,801 1,22,606 40,636 81,970 1,30,779 51,610 79,169
Oct-13 7,157 11,175 -4,018 91,637 54,466 37,171 98,794 65,641 33,153
Nov-13 8,067 8,549 -482 97,156 55,533 41,624 1,05,223 64,082 41,141
Dec-13 10,051 10,462 -411 1,25,320 73,378 51,942 1,35,371 83,840 51,531
Jan-14 9,349 11,864 -2,515 1,43,614 98,198 45,415 1,52,963 1,10,063 42,900
Feb-14 8,469 9,814 -1,345 1,18,153 56,138 62,015 1,26,622 65,952 60,669
Mar-14 12,301 16,191 -3,890 2,14,183 1,14,727 99,457 2,26,485 1,30,918 95,567
Apr-14 12,018 14,715 -2,698 1,49,935 1,00,001 49,934 1,61,952 1,14,716 47,236
May-14 20,400 20,294 106 1,55,449 1,04,769 50,680 1,75,849 1,25,063 50,786
Jun-14 19,744 16,404 3,340 1,67,120 99,252 67,868 1,86,864 1,15,656 71,208
Jul-14 21,527 16,463 5,064 1,28,417 1,09,630 18,787 1,49,943 1,26,093 23,851
Aug-14 17,877 10,919 6,957 1,49,788 77,893 71,895 1,67,664 88,812 78,852
Sep-14 20,322 16,151 4,172 1,51,140 1,27,723 23,417 1,71,462 1,43,874 27,588
Oct-14 17,483 11,543 5,940 1,12,189 80,272 31,917 1,29,672 91,815 37,857
Nov-14 16,565 14,888 1,677 1,25,995 81,409 44,586 1,42,561 96,298 46,263
Dec-14 23,188 16,151 7,037 1,49,344 95,412 53,932 1,72,532 1,11,563 60,969
Source: SEBI.
Table 94: Trends in Transactions on Stock Exchanges by Mutual Funds(` crore)
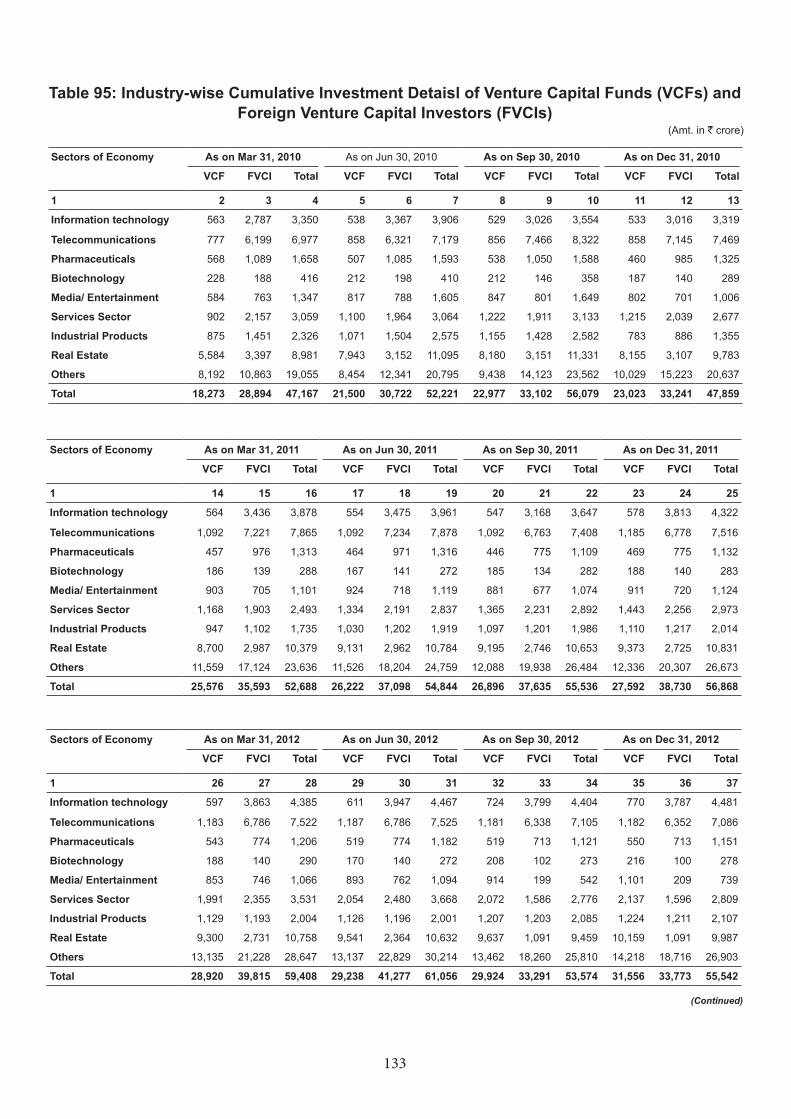
133
Table 95: Industry-wise Cumulative Investment Detaisl of Venture Capital Funds (VCFs) and Foreign Venture Capital Investors (FVCIs)
(Amt. in ` crore)
Sectors of Economy As on Mar 31, 2010 As on Jun 30, 2010 As on Sep 30, 2010 As on Dec 31, 2010
VCF FVCI Total VCF FVCI Total VCF FVCI Total VCF FVCI Total
1 2 3 4 5 6 7 8 9 10 11 12 13
Information technology 563 2,787 3,350 538 3,367 3,906 529 3,026 3,554 533 3,016 3,319
Telecommunications 777 6,199 6,977 858 6,321 7,179 856 7,466 8,322 858 7,145 7,469
Pharmaceuticals 568 1,089 1,658 507 1,085 1,593 538 1,050 1,588 460 985 1,325
Biotechnology 228 188 416 212 198 410 212 146 358 187 140 289
Media/ Entertainment 584 763 1,347 817 788 1,605 847 801 1,649 802 701 1,006
Services Sector 902 2,157 3,059 1,100 1,964 3,064 1,222 1,911 3,133 1,215 2,039 2,677
Industrial Products 875 1,451 2,326 1,071 1,504 2,575 1,155 1,428 2,582 783 886 1,355
Real Estate 5,584 3,397 8,981 7,943 3,152 11,095 8,180 3,151 11,331 8,155 3,107 9,783
Others 8,192 10,863 19,055 8,454 12,341 20,795 9,438 14,123 23,562 10,029 15,223 20,637
Total 18,273 28,894 47,167 21,500 30,722 52,221 22,977 33,102 56,079 23,023 33,241 47,859
Sectors of Economy As on Mar 31, 2011 As on Jun 30, 2011 As on Sep 30, 2011 As on Dec 31, 2011
VCF FVCI Total VCF FVCI Total VCF FVCI Total VCF FVCI Total
1 14 15 16 17 18 19 20 21 22 23 24 25
Information technology 564 3,436 3,878 554 3,475 3,961 547 3,168 3,647 578 3,813 4,322
Telecommunications 1,092 7,221 7,865 1,092 7,234 7,878 1,092 6,763 7,408 1,185 6,778 7,516
Pharmaceuticals 457 976 1,313 464 971 1,316 446 775 1,109 469 775 1,132
Biotechnology 186 139 288 167 141 272 185 134 282 188 140 283
Media/ Entertainment 903 705 1,101 924 718 1,119 881 677 1,074 911 720 1,124
Services Sector 1,168 1,903 2,493 1,334 2,191 2,837 1,365 2,231 2,892 1,443 2,256 2,973
Industrial Products 947 1,102 1,735 1,030 1,202 1,919 1,097 1,201 1,986 1,110 1,217 2,014
Real Estate 8,700 2,987 10,379 9,131 2,962 10,784 9,195 2,746 10,653 9,373 2,725 10,831
Others 11,559 17,124 23,636 11,526 18,204 24,759 12,088 19,938 26,484 12,336 20,307 26,673
Total 25,576 35,593 52,688 26,222 37,098 54,844 26,896 37,635 55,536 27,592 38,730 56,868
Sectors of Economy As on Mar 31, 2012 As on Jun 30, 2012 As on Sep 30, 2012 As on Dec 31, 2012
VCF FVCI Total VCF FVCI Total VCF FVCI Total VCF FVCI Total
1 26 27 28 29 30 31 32 33 34 35 36 37
Information technology 597 3,863 4,385 611 3,947 4,467 724 3,799 4,404 770 3,787 4,481
Telecommunications 1,183 6,786 7,522 1,187 6,786 7,525 1,181 6,338 7,105 1,182 6,352 7,086
Pharmaceuticals 543 774 1,206 519 774 1,182 519 713 1,121 550 713 1,151
Biotechnology 188 140 290 170 140 272 208 102 273 216 100 278
Media/ Entertainment 853 746 1,066 893 762 1,094 914 199 542 1,101 209 739
Services Sector 1,991 2,355 3,531 2,054 2,480 3,668 2,072 1,586 2,776 2,137 1,596 2,809
Industrial Products 1,129 1,193 2,004 1,126 1,196 2,001 1,207 1,203 2,085 1,224 1,211 2,107
Real Estate 9,300 2,731 10,758 9,541 2,364 10,632 9,637 1,091 9,459 10,159 1,091 9,987
Others 13,135 21,228 28,647 13,137 22,829 30,214 13,462 18,260 25,810 14,218 18,716 26,903
Total 28,920 39,815 59,408 29,238 41,277 61,056 29,924 33,291 53,574 31,556 33,773 55,542
(Continued)
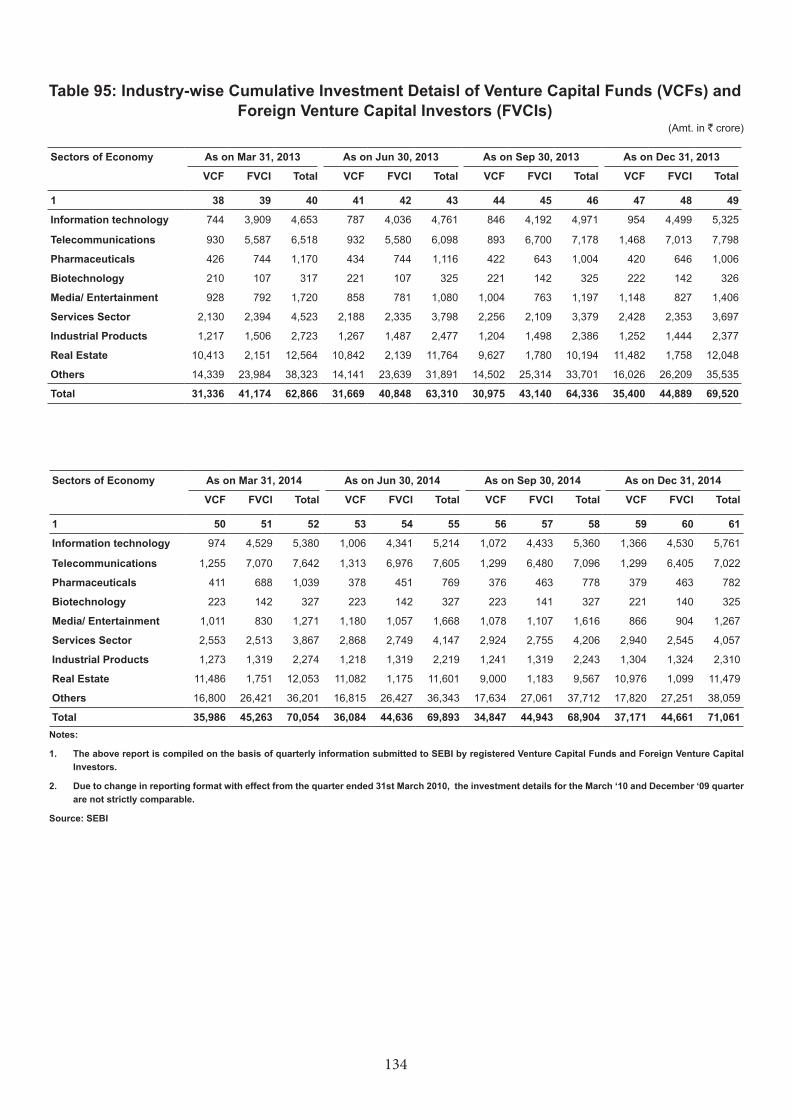
134
Table 95: Industry-wise Cumulative Investment Detaisl of Venture Capital Funds (VCFs) and Foreign Venture Capital Investors (FVCIs)
(Amt. in ` crore)
Sectors of Economy As on Mar 31, 2013 As on Jun 30, 2013 As on Sep 30, 2013 As on Dec 31, 2013
VCF FVCI Total VCF FVCI Total VCF FVCI Total VCF FVCI Total
1 38 39 40 41 42 43 44 45 46 47 48 49
Information technology 744 3,909 4,653 787 4,036 4,761 846 4,192 4,971 954 4,499 5,325
Telecommunications 930 5,587 6,518 932 5,580 6,098 893 6,700 7,178 1,468 7,013 7,798
Pharmaceuticals 426 744 1,170 434 744 1,116 422 643 1,004 420 646 1,006
Biotechnology 210 107 317 221 107 325 221 142 325 222 142 326
Media/ Entertainment 928 792 1,720 858 781 1,080 1,004 763 1,197 1,148 827 1,406
Services Sector 2,130 2,394 4,523 2,188 2,335 3,798 2,256 2,109 3,379 2,428 2,353 3,697
Industrial Products 1,217 1,506 2,723 1,267 1,487 2,477 1,204 1,498 2,386 1,252 1,444 2,377
Real Estate 10,413 2,151 12,564 10,842 2,139 11,764 9,627 1,780 10,194 11,482 1,758 12,048
Others 14,339 23,984 38,323 14,141 23,639 31,891 14,502 25,314 33,701 16,026 26,209 35,535
Total 31,336 41,174 62,866 31,669 40,848 63,310 30,975 43,140 64,336 35,400 44,889 69,520
Sectors of Economy As on Mar 31, 2014 As on Jun 30, 2014 As on Sep 30, 2014 As on Dec 31, 2014
VCF FVCI Total VCF FVCI Total VCF FVCI Total VCF FVCI Total
1 50 51 52 53 54 55 56 57 58 59 60 61
Information technology 974 4,529 5,380 1,006 4,341 5,214 1,072 4,433 5,360 1,366 4,530 5,761
Telecommunications 1,255 7,070 7,642 1,313 6,976 7,605 1,299 6,480 7,096 1,299 6,405 7,022
Pharmaceuticals 411 688 1,039 378 451 769 376 463 778 379 463 782
Biotechnology 223 142 327 223 142 327 223 141 327 221 140 325
Media/ Entertainment 1,011 830 1,271 1,180 1,057 1,668 1,078 1,107 1,616 866 904 1,267
Services Sector 2,553 2,513 3,867 2,868 2,749 4,147 2,924 2,755 4,206 2,940 2,545 4,057
Industrial Products 1,273 1,319 2,274 1,218 1,319 2,219 1,241 1,319 2,243 1,304 1,324 2,310
Real Estate 11,486 1,751 12,053 11,082 1,175 11,601 9,000 1,183 9,567 10,976 1,099 11,479
Others 16,800 26,421 36,201 16,815 26,427 36,343 17,634 27,061 37,712 17,820 27,251 38,059
Total 35,986 45,263 70,054 36,084 44,636 69,893 34,847 44,943 68,904 37,171 44,661 71,061Notes:
1. The above report is compiled on the basis of quarterly information submitted to SEBI by registered Venture Capital Funds and Foreign Venture Capital Investors.
2. Due to change in reporting format with effect from the quarter ended 31st March 2010, the investment details for the March ‘10 and December ‘09 quarter are not strictly comparable.
Source: SEBI
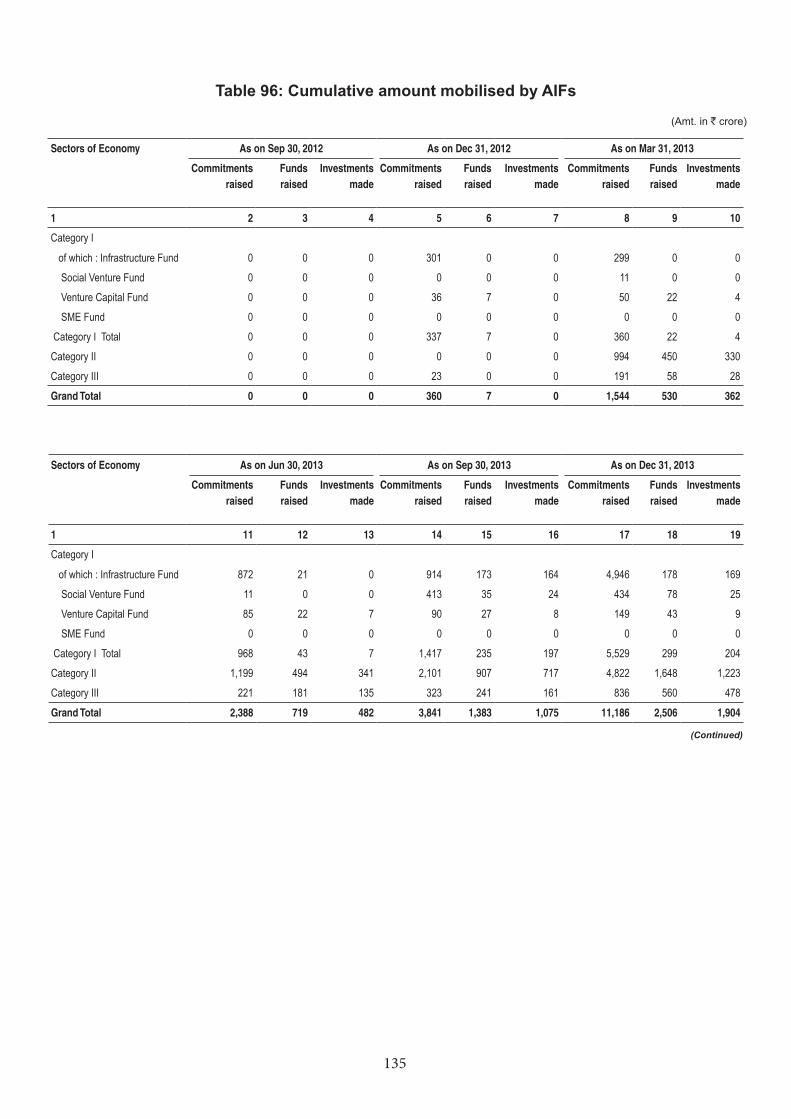
135
Table 96: Cumulative amount mobilised by AIFs
(Amt. in ` crore)
Sectors of Economy As on Sep 30, 2012 As on Dec 31, 2012 As on Mar 31, 2013
Commitments raised
Funds raised
Investments made
Commitments raised
Funds raised
Investments made
Commitments raised
Funds raised
Investments made
1 2 3 4 5 6 7 8 9 10
Category I
of which : Infrastructure Fund 0 0 0 301 0 0 299 0 0
Social Venture Fund 0 0 0 0 0 0 11 0 0
Venture Capital Fund 0 0 0 36 7 0 50 22 4
SME Fund 0 0 0 0 0 0 0 0 0
Category I Total 0 0 0 337 7 0 360 22 4
Category II 0 0 0 0 0 0 994 450 330
Category III 0 0 0 23 0 0 191 58 28
Grand Total 0 0 0 360 7 0 1,544 530 362
Sectors of Economy As on Jun 30, 2013 As on Sep 30, 2013 As on Dec 31, 2013
Commitments raised
Funds raised
Investments made
Commitments raised
Funds raised
Investments made
Commitments raised
Funds raised
Investments made
1 11 12 13 14 15 16 17 18 19
Category I
of which : Infrastructure Fund 872 21 0 914 173 164 4,946 178 169
Social Venture Fund 11 0 0 413 35 24 434 78 25
Venture Capital Fund 85 22 7 90 27 8 149 43 9
SME Fund 0 0 0 0 0 0 0 0 0
Category I Total 968 43 7 1,417 235 197 5,529 299 204
Category II 1,199 494 341 2,101 907 717 4,822 1,648 1,223
Category III 221 181 135 323 241 161 836 560 478
Grand Total 2,388 719 482 3,841 1,383 1,075 11,186 2,506 1,904
(Continued)
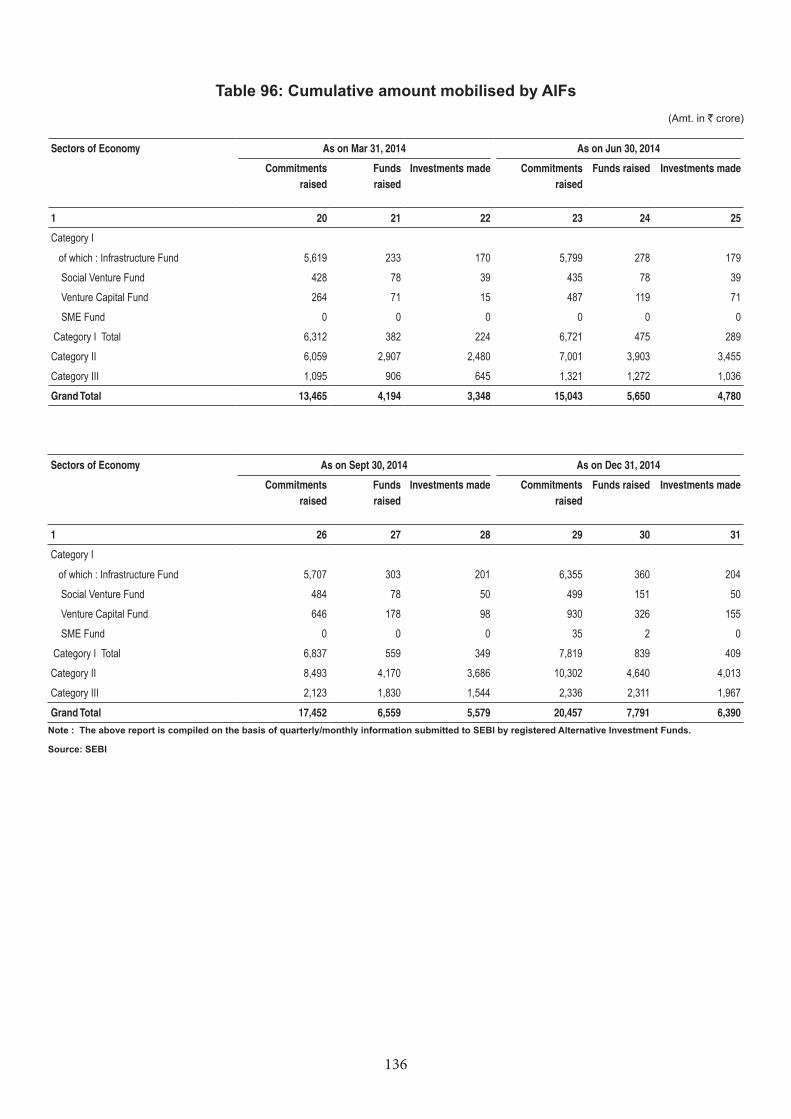
136
Sectors of Economy As on Sept 30, 2014 As on Dec 31, 2014
Commitments raised
Funds raised
Investments made Commitments raised
Funds raised Investments made
1 26 27 28 29 30 31
Category I
of which : Infrastructure Fund 5,707 303 201 6,355 360 204
Social Venture Fund 484 78 50 499 151 50
Venture Capital Fund 646 178 98 930 326 155
SME Fund 0 0 0 35 2 0
Category I Total 6,837 559 349 7,819 839 409
Category II 8,493 4,170 3,686 10,302 4,640 4,013
Category III 2,123 1,830 1,544 2,336 2,311 1,967
Grand Total 17,452 6,559 5,579 20,457 7,791 6,390
Note : The above report is compiled on the basis of quarterly/monthly information submitted to SEBI by registered Alternative Investment Funds.
Source: SEBI
Sectors of Economy As on Mar 31, 2014 As on Jun 30, 2014
Commitments raised
Funds raised
Investments made Commitments raised
Funds raised Investments made
1 20 21 22 23 24 25
Category I
of which : Infrastructure Fund 5,619 233 170 5,799 278 179
Social Venture Fund 428 78 39 435 78 39
Venture Capital Fund 264 71 15 487 119 71
SME Fund 0 0 0 0 0 0
Category I Total 6,312 382 224 6,721 475 289
Category II 6,059 2,907 2,480 7,001 3,903 3,455
Category III 1,095 906 645 1,321 1,272 1,036
Grand Total 13,465 4,194 3,348 15,043 5,650 4,780
Table 96: Cumulative amount mobilised by AIFs(Amt. in ` crore)
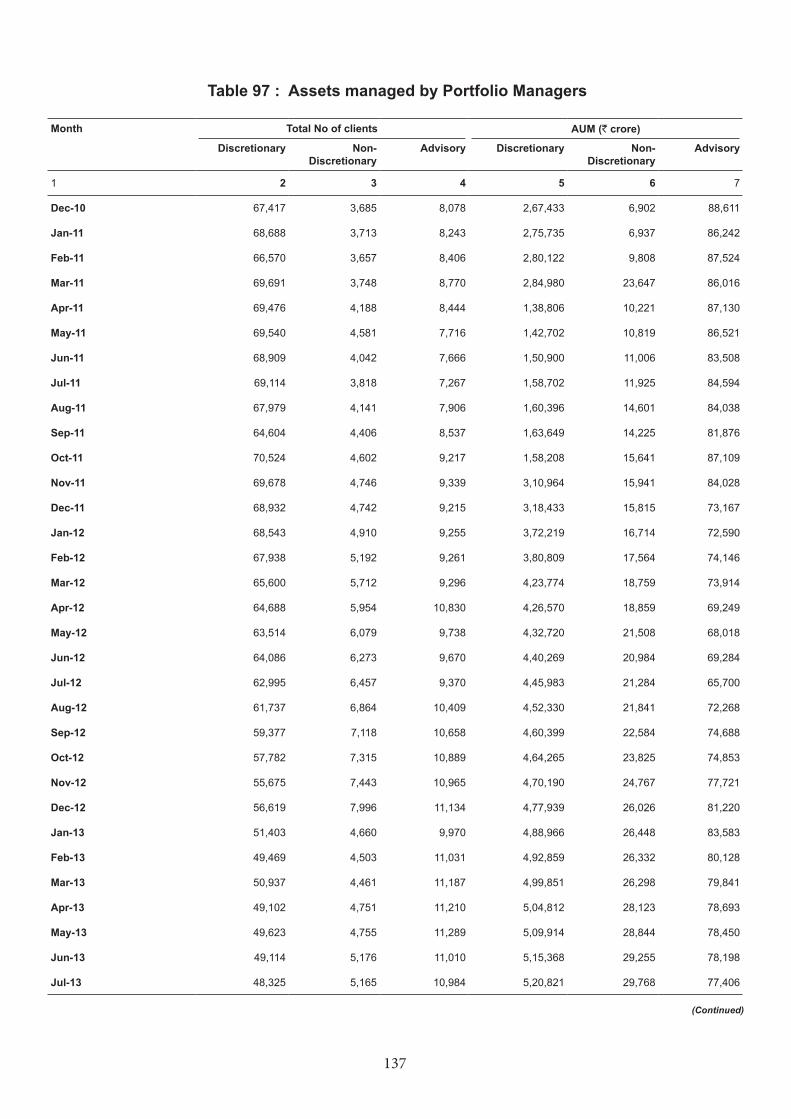
137
Table 97 : Assets managed by Portfolio Managers
Month Total No of clients AUM (` crore)
Discretionary Non-Discretionary
Advisory Discretionary Non-Discretionary
Advisory
1 2 3 4 5 6 7
Dec-10 67,417 3,685 8,078 2,67,433 6,902 88,611
Jan-11 68,688 3,713 8,243 2,75,735 6,937 86,242
Feb-11 66,570 3,657 8,406 2,80,122 9,808 87,524
Mar-11 69,691 3,748 8,770 2,84,980 23,647 86,016
Apr-11 69,476 4,188 8,444 1,38,806 10,221 87,130
May-11 69,540 4,581 7,716 1,42,702 10,819 86,521
Jun-11 68,909 4,042 7,666 1,50,900 11,006 83,508
Jul-11 69,114 3,818 7,267 1,58,702 11,925 84,594
Aug-11 67,979 4,141 7,906 1,60,396 14,601 84,038
Sep-11 64,604 4,406 8,537 1,63,649 14,225 81,876
Oct-11 70,524 4,602 9,217 1,58,208 15,641 87,109
Nov-11 69,678 4,746 9,339 3,10,964 15,941 84,028
Dec-11 68,932 4,742 9,215 3,18,433 15,815 73,167
Jan-12 68,543 4,910 9,255 3,72,219 16,714 72,590
Feb-12 67,938 5,192 9,261 3,80,809 17,564 74,146
Mar-12 65,600 5,712 9,296 4,23,774 18,759 73,914
Apr-12 64,688 5,954 10,830 4,26,570 18,859 69,249
May-12 63,514 6,079 9,738 4,32,720 21,508 68,018
Jun-12 64,086 6,273 9,670 4,40,269 20,984 69,284
Jul-12 62,995 6,457 9,370 4,45,983 21,284 65,700
Aug-12 61,737 6,864 10,409 4,52,330 21,841 72,268
Sep-12 59,377 7,118 10,658 4,60,399 22,584 74,688
Oct-12 57,782 7,315 10,889 4,64,265 23,825 74,853
Nov-12 55,675 7,443 10,965 4,70,190 24,767 77,721
Dec-12 56,619 7,996 11,134 4,77,939 26,026 81,220
Jan-13 51,403 4,660 9,970 4,88,966 26,448 83,583
Feb-13 49,469 4,503 11,031 4,92,859 26,332 80,128
Mar-13 50,937 4,461 11,187 4,99,851 26,298 79,841
Apr-13 49,102 4,751 11,210 5,04,812 28,123 78,693
May-13 49,623 4,755 11,289 5,09,914 28,844 78,450
Jun-13 49,114 5,176 11,010 5,15,368 29,255 78,198
Jul-13 48,325 5,165 10,984 5,20,821 29,768 77,406
(Continued)
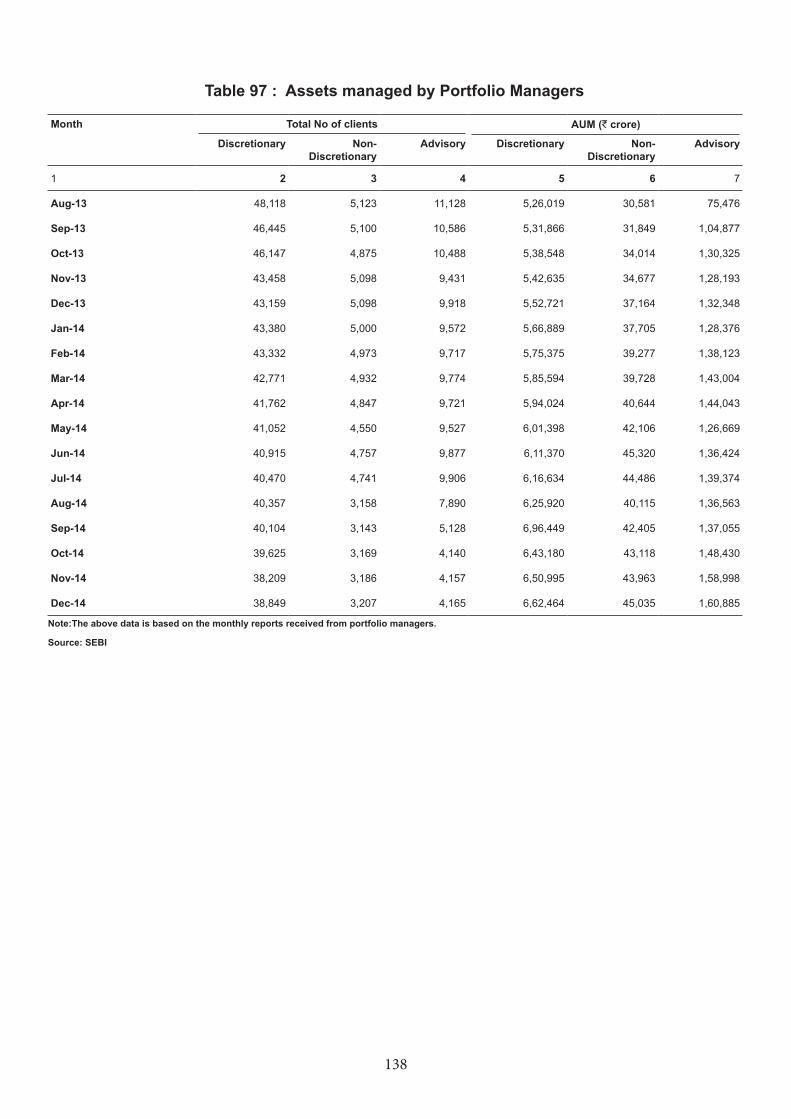
138
Month Total No of clients AUM (` crore)
Discretionary Non-Discretionary
Advisory Discretionary Non-Discretionary
Advisory
1 2 3 4 5 6 7
Aug-13 48,118 5,123 11,128 5,26,019 30,581 75,476
Sep-13 46,445 5,100 10,586 5,31,866 31,849 1,04,877
Oct-13 46,147 4,875 10,488 5,38,548 34,014 1,30,325
Nov-13 43,458 5,098 9,431 5,42,635 34,677 1,28,193
Dec-13 43,159 5,098 9,918 5,52,721 37,164 1,32,348
Jan-14 43,380 5,000 9,572 5,66,889 37,705 1,28,376
Feb-14 43,332 4,973 9,717 5,75,375 39,277 1,38,123
Mar-14 42,771 4,932 9,774 5,85,594 39,728 1,43,004
Apr-14 41,762 4,847 9,721 5,94,024 40,644 1,44,043
May-14 41,052 4,550 9,527 6,01,398 42,106 1,26,669
Jun-14 40,915 4,757 9,877 6,11,370 45,320 1,36,424
Jul-14 40,470 4,741 9,906 6,16,634 44,486 1,39,374
Aug-14 40,357 3,158 7,890 6,25,920 40,115 1,36,563
Sep-14 40,104 3,143 5,128 6,96,449 42,405 1,37,055
Oct-14 39,625 3,169 4,140 6,43,180 43,118 1,48,430
Nov-14 38,209 3,186 4,157 6,50,995 43,963 1,58,998
Dec-14 38,849 3,207 4,165 6,62,464 45,035 1,60,885
Note:The above data is based on the monthly reports received from portfolio managers.
Source: SEBI
Table 97 : Assets managed by Portfolio Managers
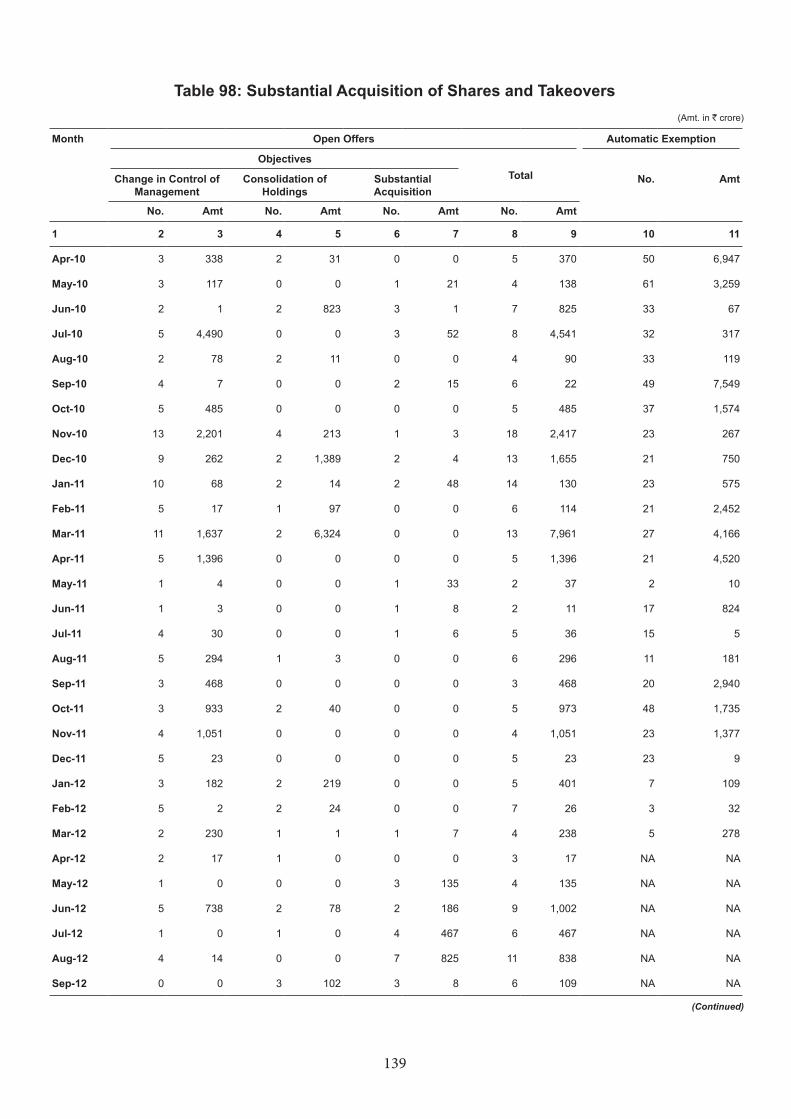
139
Table 98: Substantial Acquisition of Shares and Takeovers(Amt. in ` crore)
Month Open Offers Automatic Exemption
ObjectivesTotalChange in Control of
ManagementConsolidation of
HoldingsSubstantial Acquisition
No. Amt
No. Amt No. Amt No. Amt No. Amt
1 2 3 4 5 6 7 8 9 10 11
Apr-10 3 338 2 31 0 0 5 370 50 6,947
May-10 3 117 0 0 1 21 4 138 61 3,259
Jun-10 2 1 2 823 3 1 7 825 33 67
Jul-10 5 4,490 0 0 3 52 8 4,541 32 317
Aug-10 2 78 2 11 0 0 4 90 33 119
Sep-10 4 7 0 0 2 15 6 22 49 7,549
Oct-10 5 485 0 0 0 0 5 485 37 1,574
Nov-10 13 2,201 4 213 1 3 18 2,417 23 267
Dec-10 9 262 2 1,389 2 4 13 1,655 21 750
Jan-11 10 68 2 14 2 48 14 130 23 575
Feb-11 5 17 1 97 0 0 6 114 21 2,452
Mar-11 11 1,637 2 6,324 0 0 13 7,961 27 4,166
Apr-11 5 1,396 0 0 0 0 5 1,396 21 4,520
May-11 1 4 0 0 1 33 2 37 2 10
Jun-11 1 3 0 0 1 8 2 11 17 824
Jul-11 4 30 0 0 1 6 5 36 15 5
Aug-11 5 294 1 3 0 0 6 296 11 181
Sep-11 3 468 0 0 0 0 3 468 20 2,940
Oct-11 3 933 2 40 0 0 5 973 48 1,735
Nov-11 4 1,051 0 0 0 0 4 1,051 23 1,377
Dec-11 5 23 0 0 0 0 5 23 23 9
Jan-12 3 182 2 219 0 0 5 401 7 109
Feb-12 5 2 2 24 0 0 7 26 3 32
Mar-12 2 230 1 1 1 7 4 238 5 278
Apr-12 2 17 1 0 0 0 3 17 NA NA
May-12 1 0 0 0 3 135 4 135 NA NA
Jun-12 5 738 2 78 2 186 9 1,002 NA NA
Jul-12 1 0 1 0 4 467 6 467 NA NA
Aug-12 4 14 0 0 7 825 11 838 NA NA
Sep-12 0 0 3 102 3 8 6 109 NA NA
(Continued)
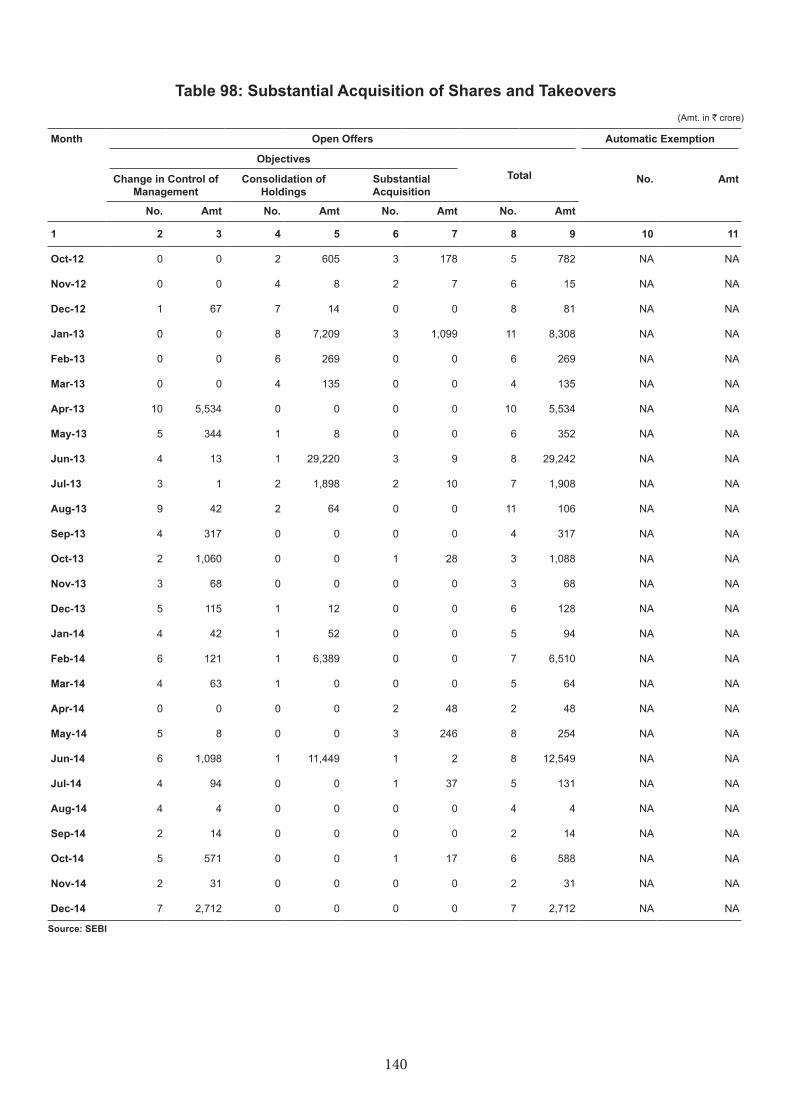
140
Month Open Offers Automatic Exemption
ObjectivesTotalChange in Control of
ManagementConsolidation of
HoldingsSubstantial Acquisition
No. Amt
No. Amt No. Amt No. Amt No. Amt
1 2 3 4 5 6 7 8 9 10 11
Oct-12 0 0 2 605 3 178 5 782 NA NA
Nov-12 0 0 4 8 2 7 6 15 NA NA
Dec-12 1 67 7 14 0 0 8 81 NA NA
Jan-13 0 0 8 7,209 3 1,099 11 8,308 NA NA
Feb-13 0 0 6 269 0 0 6 269 NA NA
Mar-13 0 0 4 135 0 0 4 135 NA NA
Apr-13 10 5,534 0 0 0 0 10 5,534 NA NA
May-13 5 344 1 8 0 0 6 352 NA NA
Jun-13 4 13 1 29,220 3 9 8 29,242 NA NA
Jul-13 3 1 2 1,898 2 10 7 1,908 NA NA
Aug-13 9 42 2 64 0 0 11 106 NA NA
Sep-13 4 317 0 0 0 0 4 317 NA NA
Oct-13 2 1,060 0 0 1 28 3 1,088 NA NA
Nov-13 3 68 0 0 0 0 3 68 NA NA
Dec-13 5 115 1 12 0 0 6 128 NA NA
Jan-14 4 42 1 52 0 0 5 94 NA NA
Feb-14 6 121 1 6,389 0 0 7 6,510 NA NA
Mar-14 4 63 1 0 0 0 5 64 NA NA
Apr-14 0 0 0 0 2 48 2 48 NA NA
May-14 5 8 0 0 3 246 8 254 NA NA
Jun-14 6 1,098 1 11,449 1 2 8 12,549 NA NA
Jul-14 4 94 0 0 1 37 5 131 NA NA
Aug-14 4 4 0 0 0 0 4 4 NA NA
Sep-14 2 14 0 0 0 0 2 14 NA NA
Oct-14 5 571 0 0 1 17 6 588 NA NA
Nov-14 2 31 0 0 0 0 2 31 NA NA
Dec-14 7 2,712 0 0 0 0 7 2,712 NA NA
Source: SEBI
Table 98: Substantial Acquisition of Shares and Takeovers(Amt. in ` crore)
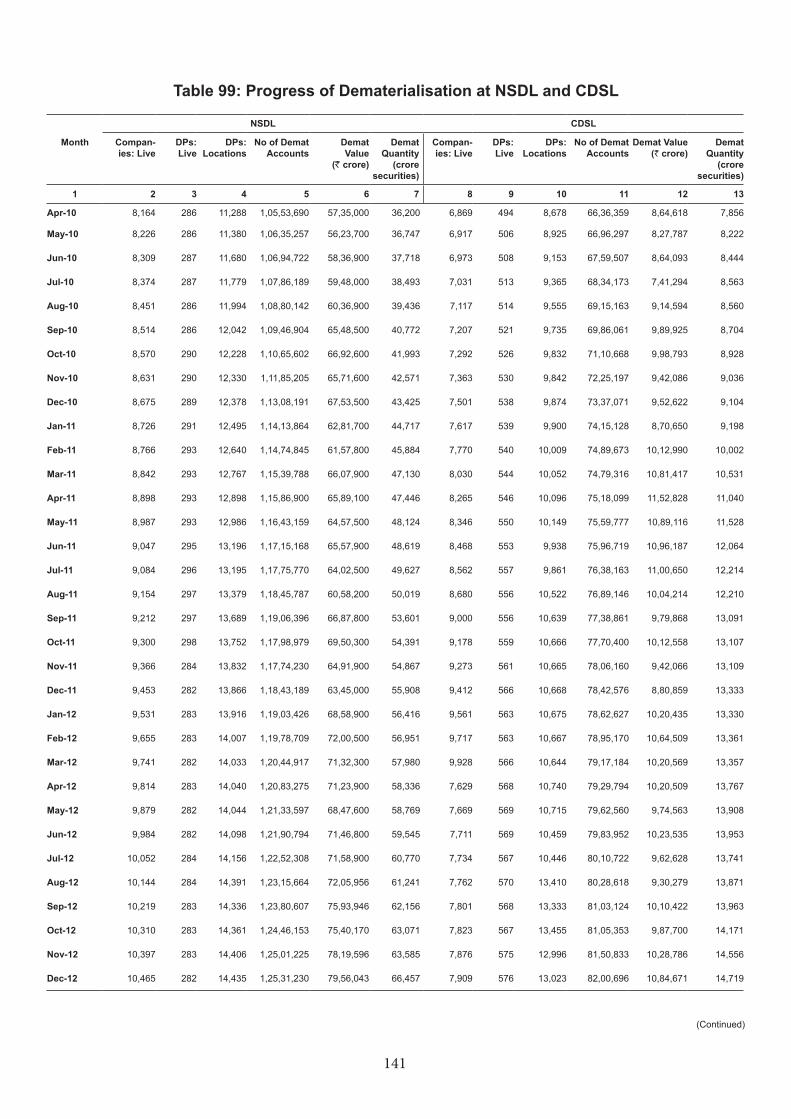
141
Table 99: Progress of Dematerialisation at NSDL and CDSL
NSDL CDSL
Month Compan- ies: Live
DPs: Live
DPs: Locations
No of Demat Accounts
Demat Value
(` crore)
Demat Quantity
(crore securities)
Compan- ies: Live
DPs: Live
DPs: Locations
No of Demat Accounts
Demat Value (` crore)
Demat Quantity
(crore securities)
1 2 3 4 5 6 7 8 9 10 11 12 13
Apr-10 8,164 286 11,288 1,05,53,690 57,35,000 36,200 6,869 494 8,678 66,36,359 8,64,618 7,856
May-10 8,226 286 11,380 1,06,35,257 56,23,700 36,747 6,917 506 8,925 66,96,297 8,27,787 8,222
Jun-10 8,309 287 11,680 1,06,94,722 58,36,900 37,718 6,973 508 9,153 67,59,507 8,64,093 8,444
Jul-10 8,374 287 11,779 1,07,86,189 59,48,000 38,493 7,031 513 9,365 68,34,173 7,41,294 8,563
Aug-10 8,451 286 11,994 1,08,80,142 60,36,900 39,436 7,117 514 9,555 69,15,163 9,14,594 8,560
Sep-10 8,514 286 12,042 1,09,46,904 65,48,500 40,772 7,207 521 9,735 69,86,061 9,89,925 8,704
Oct-10 8,570 290 12,228 1,10,65,602 66,92,600 41,993 7,292 526 9,832 71,10,668 9,98,793 8,928
Nov-10 8,631 290 12,330 1,11,85,205 65,71,600 42,571 7,363 530 9,842 72,25,197 9,42,086 9,036
Dec-10 8,675 289 12,378 1,13,08,191 67,53,500 43,425 7,501 538 9,874 73,37,071 9,52,622 9,104
Jan-11 8,726 291 12,495 1,14,13,864 62,81,700 44,717 7,617 539 9,900 74,15,128 8,70,650 9,198
Feb-11 8,766 293 12,640 1,14,74,845 61,57,800 45,884 7,770 540 10,009 74,89,673 10,12,990 10,002
Mar-11 8,842 293 12,767 1,15,39,788 66,07,900 47,130 8,030 544 10,052 74,79,316 10,81,417 10,531
Apr-11 8,898 293 12,898 1,15,86,900 65,89,100 47,446 8,265 546 10,096 75,18,099 11,52,828 11,040
May-11 8,987 293 12,986 1,16,43,159 64,57,500 48,124 8,346 550 10,149 75,59,777 10,89,116 11,528
Jun-11 9,047 295 13,196 1,17,15,168 65,57,900 48,619 8,468 553 9,938 75,96,719 10,96,187 12,064
Jul-11 9,084 296 13,195 1,17,75,770 64,02,500 49,627 8,562 557 9,861 76,38,163 11,00,650 12,214
Aug-11 9,154 297 13,379 1,18,45,787 60,58,200 50,019 8,680 556 10,522 76,89,146 10,04,214 12,210
Sep-11 9,212 297 13,689 1,19,06,396 66,87,800 53,601 9,000 556 10,639 77,38,861 9,79,868 13,091
Oct-11 9,300 298 13,752 1,17,98,979 69,50,300 54,391 9,178 559 10,666 77,70,400 10,12,558 13,107
Nov-11 9,366 284 13,832 1,17,74,230 64,91,900 54,867 9,273 561 10,665 78,06,160 9,42,066 13,109
Dec-11 9,453 282 13,866 1,18,43,189 63,45,000 55,908 9,412 566 10,668 78,42,576 8,80,859 13,333
Jan-12 9,531 283 13,916 1,19,03,426 68,58,900 56,416 9,561 563 10,675 78,62,627 10,20,435 13,330
Feb-12 9,655 283 14,007 1,19,78,709 72,00,500 56,951 9,717 563 10,667 78,95,170 10,64,509 13,361
Mar-12 9,741 282 14,033 1,20,44,917 71,32,300 57,980 9,928 566 10,644 79,17,184 10,20,569 13,357
Apr-12 9,814 283 14,040 1,20,83,275 71,23,900 58,336 7,629 568 10,740 79,29,794 10,20,509 13,767
May-12 9,879 282 14,044 1,21,33,597 68,47,600 58,769 7,669 569 10,715 79,62,560 9,74,563 13,908
Jun-12 9,984 282 14,098 1,21,90,794 71,46,800 59,545 7,711 569 10,459 79,83,952 10,23,535 13,953
Jul-12 10,052 284 14,156 1,22,52,308 71,58,900 60,770 7,734 567 10,446 80,10,722 9,62,628 13,741
Aug-12 10,144 284 14,391 1,23,15,664 72,05,956 61,241 7,762 570 13,410 80,28,618 9,30,279 13,871
Sep-12 10,219 283 14,336 1,23,80,607 75,93,946 62,156 7,801 568 13,333 81,03,124 10,10,422 13,963
Oct-12 10,310 283 14,361 1,24,46,153 75,40,170 63,071 7,823 567 13,455 81,05,353 9,87,700 14,171
Nov-12 10,397 283 14,406 1,25,01,225 78,19,596 63,585 7,876 575 12,996 81,50,833 10,28,786 14,556
Dec-12 10,465 282 14,435 1,25,31,230 79,56,043 66,457 7,909 576 13,023 82,00,696 10,84,671 14,719
(Continued)
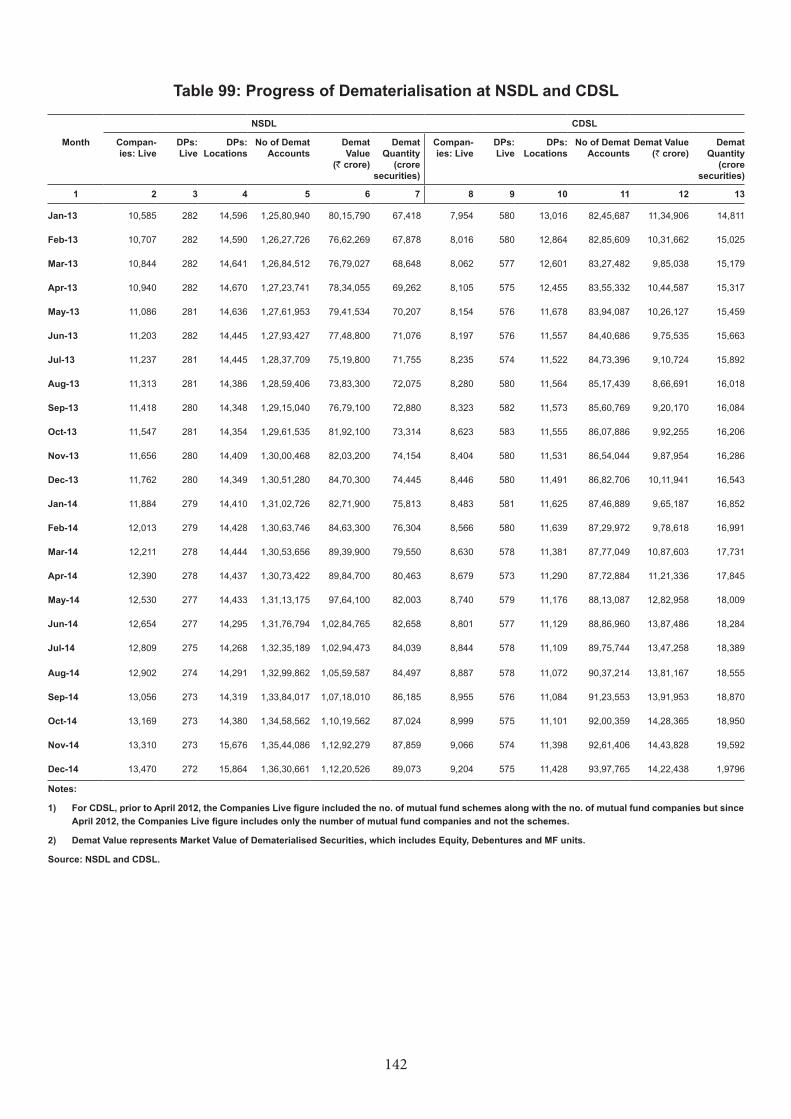
142
NSDL CDSL
Month Compan- ies: Live
DPs: Live
DPs: Locations
No of Demat Accounts
Demat Value
(` crore)
Demat Quantity
(crore securities)
Compan- ies: Live
DPs: Live
DPs: Locations
No of Demat Accounts
Demat Value (` crore)
Demat Quantity
(crore securities)
1 2 3 4 5 6 7 8 9 10 11 12 13
Jan-13 10,585 282 14,596 1,25,80,940 80,15,790 67,418 7,954 580 13,016 82,45,687 11,34,906 14,811
Feb-13 10,707 282 14,590 1,26,27,726 76,62,269 67,878 8,016 580 12,864 82,85,609 10,31,662 15,025
Mar-13 10,844 282 14,641 1,26,84,512 76,79,027 68,648 8,062 577 12,601 83,27,482 9,85,038 15,179
Apr-13 10,940 282 14,670 1,27,23,741 78,34,055 69,262 8,105 575 12,455 83,55,332 10,44,587 15,317
May-13 11,086 281 14,636 1,27,61,953 79,41,534 70,207 8,154 576 11,678 83,94,087 10,26,127 15,459
Jun-13 11,203 282 14,445 1,27,93,427 77,48,800 71,076 8,197 576 11,557 84,40,686 9,75,535 15,663
Jul-13 11,237 281 14,445 1,28,37,709 75,19,800 71,755 8,235 574 11,522 84,73,396 9,10,724 15,892
Aug-13 11,313 281 14,386 1,28,59,406 73,83,300 72,075 8,280 580 11,564 85,17,439 8,66,691 16,018
Sep-13 11,418 280 14,348 1,29,15,040 76,79,100 72,880 8,323 582 11,573 85,60,769 9,20,170 16,084
Oct-13 11,547 281 14,354 1,29,61,535 81,92,100 73,314 8,623 583 11,555 86,07,886 9,92,255 16,206
Nov-13 11,656 280 14,409 1,30,00,468 82,03,200 74,154 8,404 580 11,531 86,54,044 9,87,954 16,286
Dec-13 11,762 280 14,349 1,30,51,280 84,70,300 74,445 8,446 580 11,491 86,82,706 10,11,941 16,543
Jan-14 11,884 279 14,410 1,31,02,726 82,71,900 75,813 8,483 581 11,625 87,46,889 9,65,187 16,852
Feb-14 12,013 279 14,428 1,30,63,746 84,63,300 76,304 8,566 580 11,639 87,29,972 9,78,618 16,991
Mar-14 12,211 278 14,444 1,30,53,656 89,39,900 79,550 8,630 578 11,381 87,77,049 10,87,603 17,731
Apr-14 12,390 278 14,437 1,30,73,422 89,84,700 80,463 8,679 573 11,290 87,72,884 11,21,336 17,845
May-14 12,530 277 14,433 1,31,13,175 97,64,100 82,003 8,740 579 11,176 88,13,087 12,82,958 18,009
Jun-14 12,654 277 14,295 1,31,76,794 1,02,84,765 82,658 8,801 577 11,129 88,86,960 13,87,486 18,284
Jul-14 12,809 275 14,268 1,32,35,189 1,02,94,473 84,039 8,844 578 11,109 89,75,744 13,47,258 18,389
Aug-14 12,902 274 14,291 1,32,99,862 1,05,59,587 84,497 8,887 578 11,072 90,37,214 13,81,167 18,555
Sep-14 13,056 273 14,319 1,33,84,017 1,07,18,010 86,185 8,955 576 11,084 91,23,553 13,91,953 18,870
Oct-14 13,169 273 14,380 1,34,58,562 1,10,19,562 87,024 8,999 575 11,101 92,00,359 14,28,365 18,950
Nov-14 13,310 273 15,676 1,35,44,086 1,12,92,279 87,859 9,066 574 11,398 92,61,406 14,43,828 19,592
Dec-14 13,470 272 15,864 1,36,30,661 1,12,20,526 89,073 9,204 575 11,428 93,97,765 14,22,438 1,9796
Notes:
1) For CDSL, prior to April 2012, the Companies Live figure included the no. of mutual fund schemes along with the no. of mutual fund companies but since April 2012, the Companies Live figure includes only the number of mutual fund companies and not the schemes.
2) Demat Value represents Market Value of Dematerialised Securities, which includes Equity, Debentures and MF units.
Source: NSDL and CDSL.
Table 99: Progress of Dematerialisation at NSDL and CDSL
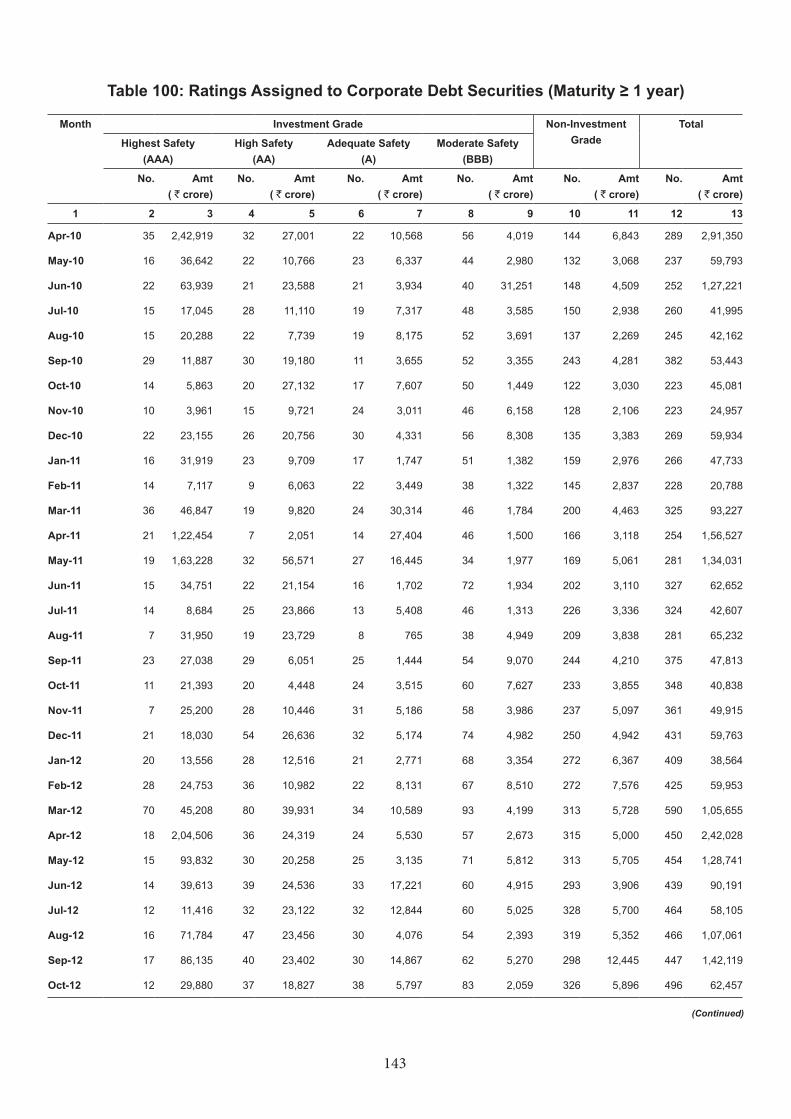
143
Table 100: Ratings Assigned to Corporate Debt Securities (Maturity ≥ 1 year)
Month Investment Grade Non-Investment Grade
Total
Highest Safety (AAA)
High Safety (AA)
Adequate Safety (A)
Moderate Safety (BBB)
No. Amt ( ` crore)
No. Amt ( ` crore)
No. Amt ( ` crore)
No. Amt ( ` crore)
No. Amt ( ` crore)
No. Amt ( ` crore)
1 2 3 4 5 6 7 8 9 10 11 12 13
Apr-10 35 2,42,919 32 27,001 22 10,568 56 4,019 144 6,843 289 2,91,350
May-10 16 36,642 22 10,766 23 6,337 44 2,980 132 3,068 237 59,793
Jun-10 22 63,939 21 23,588 21 3,934 40 31,251 148 4,509 252 1,27,221
Jul-10 15 17,045 28 11,110 19 7,317 48 3,585 150 2,938 260 41,995
Aug-10 15 20,288 22 7,739 19 8,175 52 3,691 137 2,269 245 42,162
Sep-10 29 11,887 30 19,180 11 3,655 52 3,355 243 4,281 382 53,443
Oct-10 14 5,863 20 27,132 17 7,607 50 1,449 122 3,030 223 45,081
Nov-10 10 3,961 15 9,721 24 3,011 46 6,158 128 2,106 223 24,957
Dec-10 22 23,155 26 20,756 30 4,331 56 8,308 135 3,383 269 59,934
Jan-11 16 31,919 23 9,709 17 1,747 51 1,382 159 2,976 266 47,733
Feb-11 14 7,117 9 6,063 22 3,449 38 1,322 145 2,837 228 20,788
Mar-11 36 46,847 19 9,820 24 30,314 46 1,784 200 4,463 325 93,227
Apr-11 21 1,22,454 7 2,051 14 27,404 46 1,500 166 3,118 254 1,56,527
May-11 19 1,63,228 32 56,571 27 16,445 34 1,977 169 5,061 281 1,34,031
Jun-11 15 34,751 22 21,154 16 1,702 72 1,934 202 3,110 327 62,652
Jul-11 14 8,684 25 23,866 13 5,408 46 1,313 226 3,336 324 42,607
Aug-11 7 31,950 19 23,729 8 765 38 4,949 209 3,838 281 65,232
Sep-11 23 27,038 29 6,051 25 1,444 54 9,070 244 4,210 375 47,813
Oct-11 11 21,393 20 4,448 24 3,515 60 7,627 233 3,855 348 40,838
Nov-11 7 25,200 28 10,446 31 5,186 58 3,986 237 5,097 361 49,915
Dec-11 21 18,030 54 26,636 32 5,174 74 4,982 250 4,942 431 59,763
Jan-12 20 13,556 28 12,516 21 2,771 68 3,354 272 6,367 409 38,564
Feb-12 28 24,753 36 10,982 22 8,131 67 8,510 272 7,576 425 59,953
Mar-12 70 45,208 80 39,931 34 10,589 93 4,199 313 5,728 590 1,05,655
Apr-12 18 2,04,506 36 24,319 24 5,530 57 2,673 315 5,000 450 2,42,028
May-12 15 93,832 30 20,258 25 3,135 71 5,812 313 5,705 454 1,28,741
Jun-12 14 39,613 39 24,536 33 17,221 60 4,915 293 3,906 439 90,191
Jul-12 12 11,416 32 23,122 32 12,844 60 5,025 328 5,700 464 58,105
Aug-12 16 71,784 47 23,456 30 4,076 54 2,393 319 5,352 466 1,07,061
Sep-12 17 86,135 40 23,402 30 14,867 62 5,270 298 12,445 447 1,42,119
Oct-12 12 29,880 37 18,827 38 5,797 83 2,059 326 5,896 496 62,457
(Continued)
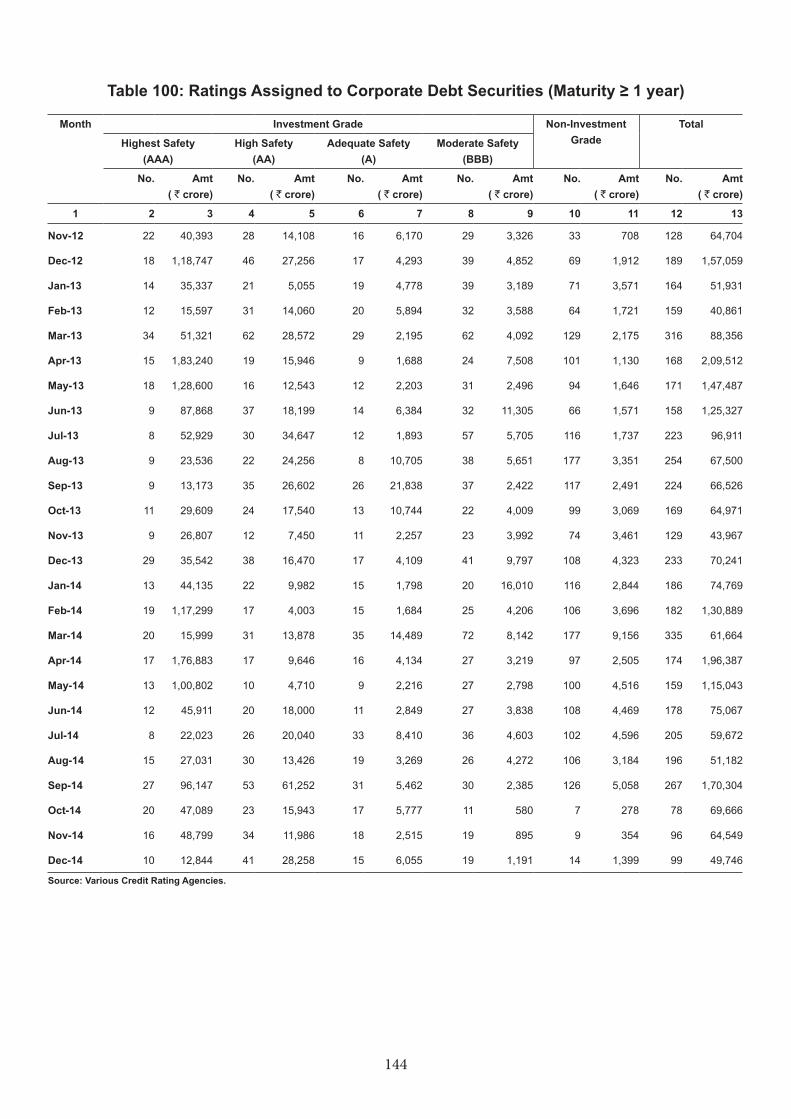
144
Month Investment Grade Non-Investment Grade
Total
Highest Safety (AAA)
High Safety (AA)
Adequate Safety (A)
Moderate Safety (BBB)
No. Amt ( ` crore)
No. Amt ( ` crore)
No. Amt ( ` crore)
No. Amt ( ` crore)
No. Amt ( ` crore)
No. Amt ( ` crore)
1 2 3 4 5 6 7 8 9 10 11 12 13
Nov-12 22 40,393 28 14,108 16 6,170 29 3,326 33 708 128 64,704
Dec-12 18 1,18,747 46 27,256 17 4,293 39 4,852 69 1,912 189 1,57,059
Jan-13 14 35,337 21 5,055 19 4,778 39 3,189 71 3,571 164 51,931
Feb-13 12 15,597 31 14,060 20 5,894 32 3,588 64 1,721 159 40,861
Mar-13 34 51,321 62 28,572 29 2,195 62 4,092 129 2,175 316 88,356
Apr-13 15 1,83,240 19 15,946 9 1,688 24 7,508 101 1,130 168 2,09,512
May-13 18 1,28,600 16 12,543 12 2,203 31 2,496 94 1,646 171 1,47,487
Jun-13 9 87,868 37 18,199 14 6,384 32 11,305 66 1,571 158 1,25,327
Jul-13 8 52,929 30 34,647 12 1,893 57 5,705 116 1,737 223 96,911
Aug-13 9 23,536 22 24,256 8 10,705 38 5,651 177 3,351 254 67,500
Sep-13 9 13,173 35 26,602 26 21,838 37 2,422 117 2,491 224 66,526
Oct-13 11 29,609 24 17,540 13 10,744 22 4,009 99 3,069 169 64,971
Nov-13 9 26,807 12 7,450 11 2,257 23 3,992 74 3,461 129 43,967
Dec-13 29 35,542 38 16,470 17 4,109 41 9,797 108 4,323 233 70,241
Jan-14 13 44,135 22 9,982 15 1,798 20 16,010 116 2,844 186 74,769
Feb-14 19 1,17,299 17 4,003 15 1,684 25 4,206 106 3,696 182 1,30,889
Mar-14 20 15,999 31 13,878 35 14,489 72 8,142 177 9,156 335 61,664
Apr-14 17 1,76,883 17 9,646 16 4,134 27 3,219 97 2,505 174 1,96,387
May-14 13 1,00,802 10 4,710 9 2,216 27 2,798 100 4,516 159 1,15,043
Jun-14 12 45,911 20 18,000 11 2,849 27 3,838 108 4,469 178 75,067
Jul-14 8 22,023 26 20,040 33 8,410 36 4,603 102 4,596 205 59,672
Aug-14 15 27,031 30 13,426 19 3,269 26 4,272 106 3,184 196 51,182
Sep-14 27 96,147 53 61,252 31 5,462 30 2,385 126 5,058 267 1,70,304
Oct-14 20 47,089 23 15,943 17 5,777 11 580 7 278 78 69,666
Nov-14 16 48,799 34 11,986 18 2,515 19 895 9 354 96 64,549
Dec-14 10 12,844 41 28,258 15 6,055 19 1,191 14 1,399 99 49,746
Source: Various Credit Rating Agencies.
Table 100: Ratings Assigned to Corporate Debt Securities (Maturity ≥ 1 year)
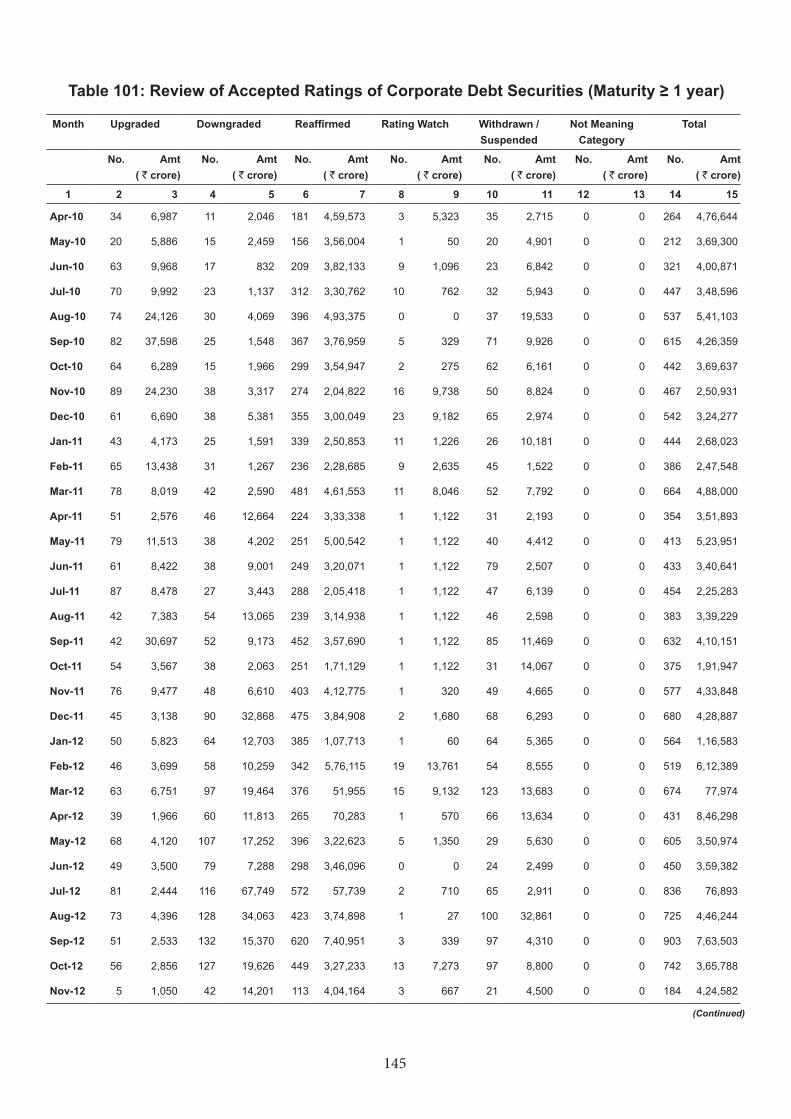
145
Table 101: Review of Accepted Ratings of Corporate Debt Securities (Maturity ≥ 1 year)
Month Upgraded Downgraded Reaffirmed Rating Watch Withdrawn / Suspended
Not Meaning Category
Total
No. Amt ( ` crore)
No. Amt ( ` crore)
No. Amt ( ` crore)
No. Amt ( ` crore)
No. Amt ( ` crore)
No. Amt ( ` crore)
No. Amt ( ` crore)
1 2 3 4 5 6 7 8 9 10 11 12 13 14 15
Apr-10 34 6,987 11 2,046 181 4,59,573 3 5,323 35 2,715 0 0 264 4,76,644
May-10 20 5,886 15 2,459 156 3,56,004 1 50 20 4,901 0 0 212 3,69,300
Jun-10 63 9,968 17 832 209 3,82,133 9 1,096 23 6,842 0 0 321 4,00,871
Jul-10 70 9,992 23 1,137 312 3,30,762 10 762 32 5,943 0 0 447 3,48,596
Aug-10 74 24,126 30 4,069 396 4,93,375 0 0 37 19,533 0 0 537 5,41,103
Sep-10 82 37,598 25 1,548 367 3,76,959 5 329 71 9,926 0 0 615 4,26,359
Oct-10 64 6,289 15 1,966 299 3,54,947 2 275 62 6,161 0 0 442 3,69,637
Nov-10 89 24,230 38 3,317 274 2,04,822 16 9,738 50 8,824 0 0 467 2,50,931
Dec-10 61 6,690 38 5,381 355 3,00,049 23 9,182 65 2,974 0 0 542 3,24,277
Jan-11 43 4,173 25 1,591 339 2,50,853 11 1,226 26 10,181 0 0 444 2,68,023
Feb-11 65 13,438 31 1,267 236 2,28,685 9 2,635 45 1,522 0 0 386 2,47,548
Mar-11 78 8,019 42 2,590 481 4,61,553 11 8,046 52 7,792 0 0 664 4,88,000
Apr-11 51 2,576 46 12,664 224 3,33,338 1 1,122 31 2,193 0 0 354 3,51,893
May-11 79 11,513 38 4,202 251 5,00,542 1 1,122 40 4,412 0 0 413 5,23,951
Jun-11 61 8,422 38 9,001 249 3,20,071 1 1,122 79 2,507 0 0 433 3,40,641
Jul-11 87 8,478 27 3,443 288 2,05,418 1 1,122 47 6,139 0 0 454 2,25,283
Aug-11 42 7,383 54 13,065 239 3,14,938 1 1,122 46 2,598 0 0 383 3,39,229
Sep-11 42 30,697 52 9,173 452 3,57,690 1 1,122 85 11,469 0 0 632 4,10,151
Oct-11 54 3,567 38 2,063 251 1,71,129 1 1,122 31 14,067 0 0 375 1,91,947
Nov-11 76 9,477 48 6,610 403 4,12,775 1 320 49 4,665 0 0 577 4,33,848
Dec-11 45 3,138 90 32,868 475 3,84,908 2 1,680 68 6,293 0 0 680 4,28,887
Jan-12 50 5,823 64 12,703 385 1,07,713 1 60 64 5,365 0 0 564 1,16,583
Feb-12 46 3,699 58 10,259 342 5,76,115 19 13,761 54 8,555 0 0 519 6,12,389
Mar-12 63 6,751 97 19,464 376 51,955 15 9,132 123 13,683 0 0 674 77,974
Apr-12 39 1,966 60 11,813 265 70,283 1 570 66 13,634 0 0 431 8,46,298
May-12 68 4,120 107 17,252 396 3,22,623 5 1,350 29 5,630 0 0 605 3,50,974
Jun-12 49 3,500 79 7,288 298 3,46,096 0 0 24 2,499 0 0 450 3,59,382
Jul-12 81 2,444 116 67,749 572 57,739 2 710 65 2,911 0 0 836 76,893
Aug-12 73 4,396 128 34,063 423 3,74,898 1 27 100 32,861 0 0 725 4,46,244
Sep-12 51 2,533 132 15,370 620 7,40,951 3 339 97 4,310 0 0 903 7,63,503
Oct-12 56 2,856 127 19,626 449 3,27,233 13 7,273 97 8,800 0 0 742 3,65,788
Nov-12 5 1,050 42 14,201 113 4,04,164 3 667 21 4,500 0 0 184 4,24,582
(Continued)
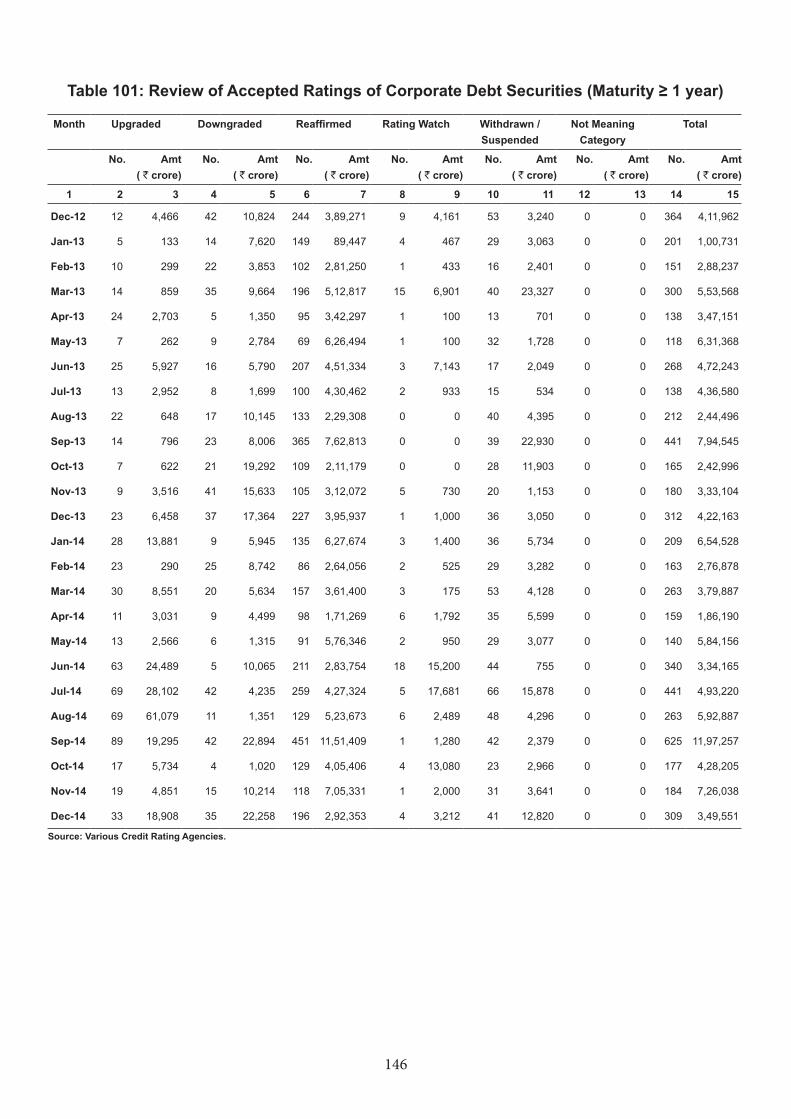
146
Month Upgraded Downgraded Reaffirmed Rating Watch Withdrawn / Suspended
Not Meaning Category
Total
No. Amt ( ` crore)
No. Amt ( ` crore)
No. Amt ( ` crore)
No. Amt ( ` crore)
No. Amt ( ` crore)
No. Amt ( ` crore)
No. Amt ( ` crore)
1 2 3 4 5 6 7 8 9 10 11 12 13 14 15
Dec-12 12 4,466 42 10,824 244 3,89,271 9 4,161 53 3,240 0 0 364 4,11,962
Jan-13 5 133 14 7,620 149 89,447 4 467 29 3,063 0 0 201 1,00,731
Feb-13 10 299 22 3,853 102 2,81,250 1 433 16 2,401 0 0 151 2,88,237
Mar-13 14 859 35 9,664 196 5,12,817 15 6,901 40 23,327 0 0 300 5,53,568
Apr-13 24 2,703 5 1,350 95 3,42,297 1 100 13 701 0 0 138 3,47,151
May-13 7 262 9 2,784 69 6,26,494 1 100 32 1,728 0 0 118 6,31,368
Jun-13 25 5,927 16 5,790 207 4,51,334 3 7,143 17 2,049 0 0 268 4,72,243
Jul-13 13 2,952 8 1,699 100 4,30,462 2 933 15 534 0 0 138 4,36,580
Aug-13 22 648 17 10,145 133 2,29,308 0 0 40 4,395 0 0 212 2,44,496
Sep-13 14 796 23 8,006 365 7,62,813 0 0 39 22,930 0 0 441 7,94,545
Oct-13 7 622 21 19,292 109 2,11,179 0 0 28 11,903 0 0 165 2,42,996
Nov-13 9 3,516 41 15,633 105 3,12,072 5 730 20 1,153 0 0 180 3,33,104
Dec-13 23 6,458 37 17,364 227 3,95,937 1 1,000 36 3,050 0 0 312 4,22,163
Jan-14 28 13,881 9 5,945 135 6,27,674 3 1,400 36 5,734 0 0 209 6,54,528
Feb-14 23 290 25 8,742 86 2,64,056 2 525 29 3,282 0 0 163 2,76,878
Mar-14 30 8,551 20 5,634 157 3,61,400 3 175 53 4,128 0 0 263 3,79,887
Apr-14 11 3,031 9 4,499 98 1,71,269 6 1,792 35 5,599 0 0 159 1,86,190
May-14 13 2,566 6 1,315 91 5,76,346 2 950 29 3,077 0 0 140 5,84,156
Jun-14 63 24,489 5 10,065 211 2,83,754 18 15,200 44 755 0 0 340 3,34,165
Jul-14 69 28,102 42 4,235 259 4,27,324 5 17,681 66 15,878 0 0 441 4,93,220
Aug-14 69 61,079 11 1,351 129 5,23,673 6 2,489 48 4,296 0 0 263 5,92,887
Sep-14 89 19,295 42 22,894 451 11,51,409 1 1,280 42 2,379 0 0 625 11,97,257
Oct-14 17 5,734 4 1,020 129 4,05,406 4 13,080 23 2,966 0 0 177 4,28,205
Nov-14 19 4,851 15 10,214 118 7,05,331 1 2,000 31 3,641 0 0 184 7,26,038
Dec-14 33 18,908 35 22,258 196 2,92,353 4 3,212 41 12,820 0 0 309 3,49,551
Source: Various Credit Rating Agencies.
Table 101: Review of Accepted Ratings of Corporate Debt Securities (Maturity ≥ 1 year)
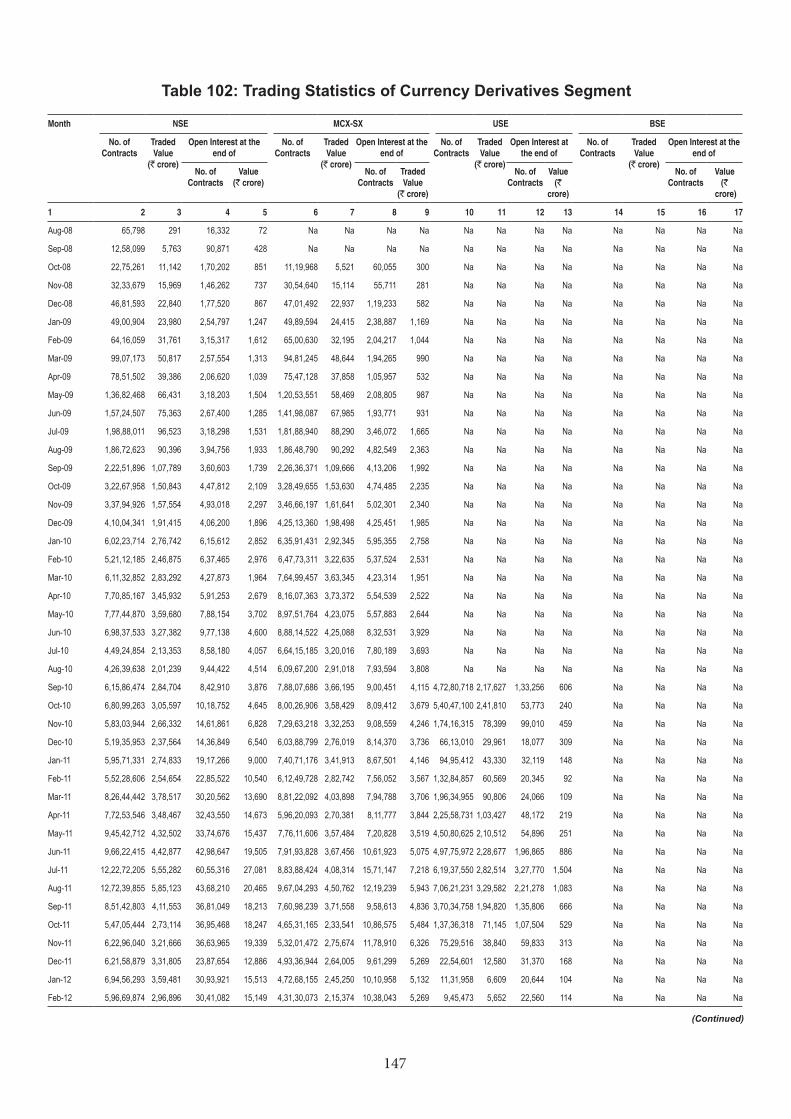
147
Table 102: Trading Statistics of Currency Derivatives Segment
Month NSE MCX-SX USE BSE
No. of Contracts
Traded Value
(` crore)
Open Interest at the end of
No. of Contracts
Traded Value
(` crore)
Open Interest at the end of
No. of Contracts
Traded Value
(` crore)
Open Interest at the end of
No. of Contracts
Traded Value
(` crore)
Open Interest at the end of
No. of Contracts
Value(` crore)
No. of Contracts
Traded Value
(` crore)
No. of Contracts
Value (`
crore)
No. of Contracts
Value(`
crore)
1 2 3 4 5 6 7 8 9 10 11 12 13 14 15 16 17
Aug-08 65,798 291 16,332 72 Na Na Na Na Na Na Na Na Na Na Na Na
Sep-08 12,58,099 5,763 90,871 428 Na Na Na Na Na Na Na Na Na Na Na Na
Oct-08 22,75,261 11,142 1,70,202 851 11,19,968 5,521 60,055 300 Na Na Na Na Na Na Na Na
Nov-08 32,33,679 15,969 1,46,262 737 30,54,640 15,114 55,711 281 Na Na Na Na Na Na Na Na
Dec-08 46,81,593 22,840 1,77,520 867 47,01,492 22,937 1,19,233 582 Na Na Na Na Na Na Na Na
Jan-09 49,00,904 23,980 2,54,797 1,247 49,89,594 24,415 2,38,887 1,169 Na Na Na Na Na Na Na Na
Feb-09 64,16,059 31,761 3,15,317 1,612 65,00,630 32,195 2,04,217 1,044 Na Na Na Na Na Na Na Na
Mar-09 99,07,173 50,817 2,57,554 1,313 94,81,245 48,644 1,94,265 990 Na Na Na Na Na Na Na Na
Apr-09 78,51,502 39,386 2,06,620 1,039 75,47,128 37,858 1,05,957 532 Na Na Na Na Na Na Na Na
May-09 1,36,82,468 66,431 3,18,203 1,504 1,20,53,551 58,469 2,08,805 987 Na Na Na Na Na Na Na Na
Jun-09 1,57,24,507 75,363 2,67,400 1,285 1,41,98,087 67,985 1,93,771 931 Na Na Na Na Na Na Na Na
Jul-09 1,98,88,011 96,523 3,18,298 1,531 1,81,88,940 88,290 3,46,072 1,665 Na Na Na Na Na Na Na Na
Aug-09 1,86,72,623 90,396 3,94,756 1,933 1,86,48,790 90,292 4,82,549 2,363 Na Na Na Na Na Na Na Na
Sep-09 2,22,51,896 1,07,789 3,60,603 1,739 2,26,36,371 1,09,666 4,13,206 1,992 Na Na Na Na Na Na Na Na
Oct-09 3,22,67,958 1,50,843 4,47,812 2,109 3,28,49,655 1,53,630 4,74,485 2,235 Na Na Na Na Na Na Na Na
Nov-09 3,37,94,926 1,57,554 4,93,018 2,297 3,46,66,197 1,61,641 5,02,301 2,340 Na Na Na Na Na Na Na Na
Dec-09 4,10,04,341 1,91,415 4,06,200 1,896 4,25,13,360 1,98,498 4,25,451 1,985 Na Na Na Na Na Na Na Na
Jan-10 6,02,23,714 2,76,742 6,15,612 2,852 6,35,91,431 2,92,345 5,95,355 2,758 Na Na Na Na Na Na Na Na
Feb-10 5,21,12,185 2,46,875 6,37,465 2,976 6,47,73,311 3,22,635 5,37,524 2,531 Na Na Na Na Na Na Na Na
Mar-10 6,11,32,852 2,83,292 4,27,873 1,964 7,64,99,457 3,63,345 4,23,314 1,951 Na Na Na Na Na Na Na Na
Apr-10 7,70,85,167 3,45,932 5,91,253 2,679 8,16,07,363 3,73,372 5,54,539 2,522 Na Na Na Na Na Na Na Na
May-10 7,77,44,870 3,59,680 7,88,154 3,702 8,97,51,764 4,23,075 5,57,883 2,644 Na Na Na Na Na Na Na Na
Jun-10 6,98,37,533 3,27,382 9,77,138 4,600 8,88,14,522 4,25,088 8,32,531 3,929 Na Na Na Na Na Na Na Na
Jul-10 4,49,24,854 2,13,353 8,58,180 4,057 6,64,15,185 3,20,016 7,80,189 3,693 Na Na Na Na Na Na Na Na
Aug-10 4,26,39,638 2,01,239 9,44,422 4,514 6,09,67,200 2,91,018 7,93,594 3,808 Na Na Na Na Na Na Na Na
Sep-10 6,15,86,474 2,84,704 8,42,910 3,876 7,88,07,686 3,66,195 9,00,451 4,115 4,72,80,718 2,17,627 1,33,256 606 Na Na Na Na
Oct-10 6,80,99,263 3,05,597 10,18,752 4,645 8,00,26,906 3,58,429 8,09,412 3,679 5,40,47,100 2,41,810 53,773 240 Na Na Na Na
Nov-10 5,83,03,944 2,66,332 14,61,861 6,828 7,29,63,218 3,32,253 9,08,559 4,246 1,74,16,315 78,399 99,010 459 Na Na Na Na
Dec-10 5,19,35,953 2,37,564 14,36,849 6,540 6,03,88,799 2,76,019 8,14,370 3,736 66,13,010 29,961 18,077 309 Na Na Na Na
Jan-11 5,95,71,331 2,74,833 19,17,266 9,000 7,40,71,176 3,41,913 8,67,501 4,146 94,95,412 43,330 32,119 148 Na Na Na Na
Feb-11 5,52,28,606 2,54,654 22,85,522 10,540 6,12,49,728 2,82,742 7,56,052 3,567 1,32,84,857 60,569 20,345 92 Na Na Na Na
Mar-11 8,26,44,442 3,78,517 30,20,562 13,690 8,81,22,092 4,03,898 7,94,788 3,706 1,96,34,955 90,806 24,066 109 Na Na Na Na
Apr-11 7,72,53,546 3,48,467 32,43,550 14,673 5,96,20,093 2,70,381 8,11,777 3,844 2,25,58,731 1,03,427 48,172 219 Na Na Na Na
May-11 9,45,42,712 4,32,502 33,74,676 15,437 7,76,11,606 3,57,484 7,20,828 3,519 4,50,80,625 2,10,512 54,896 251 Na Na Na Na
Jun-11 9,66,22,415 4,42,877 42,98,647 19,505 7,91,93,828 3,67,456 10,61,923 5,075 4,97,75,972 2,28,677 1,96,865 886 Na Na Na Na
Jul-11 12,22,72,205 5,55,282 60,55,316 27,081 8,83,88,424 4,08,314 15,71,147 7,218 6,19,37,550 2,82,514 3,27,770 1,504 Na Na Na Na
Aug-11 12,72,39,855 5,85,123 43,68,210 20,465 9,67,04,293 4,50,762 12,19,239 5,943 7,06,21,231 3,29,582 2,21,278 1,083 Na Na Na Na
Sep-11 8,51,42,803 4,11,553 36,81,049 18,213 7,60,98,239 3,71,558 9,58,613 4,836 3,70,34,758 1,94,820 1,35,806 666 Na Na Na Na
Oct-11 5,47,05,444 2,73,114 36,95,468 18,247 4,65,31,165 2,33,541 10,86,575 5,484 1,37,36,318 71,145 1,07,504 529 Na Na Na Na
Nov-11 6,22,96,040 3,21,666 36,63,965 19,339 5,32,01,472 2,75,674 11,78,910 6,326 75,29,516 38,840 59,833 313 Na Na Na Na
Dec-11 6,21,58,879 3,31,805 23,87,654 12,886 4,93,36,944 2,64,005 9,61,299 5,269 22,54,601 12,580 31,370 168 Na Na Na Na
Jan-12 6,94,56,293 3,59,481 30,93,921 15,513 4,72,68,155 2,45,250 10,10,958 5,132 11,31,958 6,609 20,644 104 Na Na Na Na
Feb-12 5,96,69,874 2,96,896 30,41,082 15,149 4,31,30,073 2,15,374 10,38,043 5,269 9,45,473 5,652 22,560 114 Na Na Na Na
(Continued)
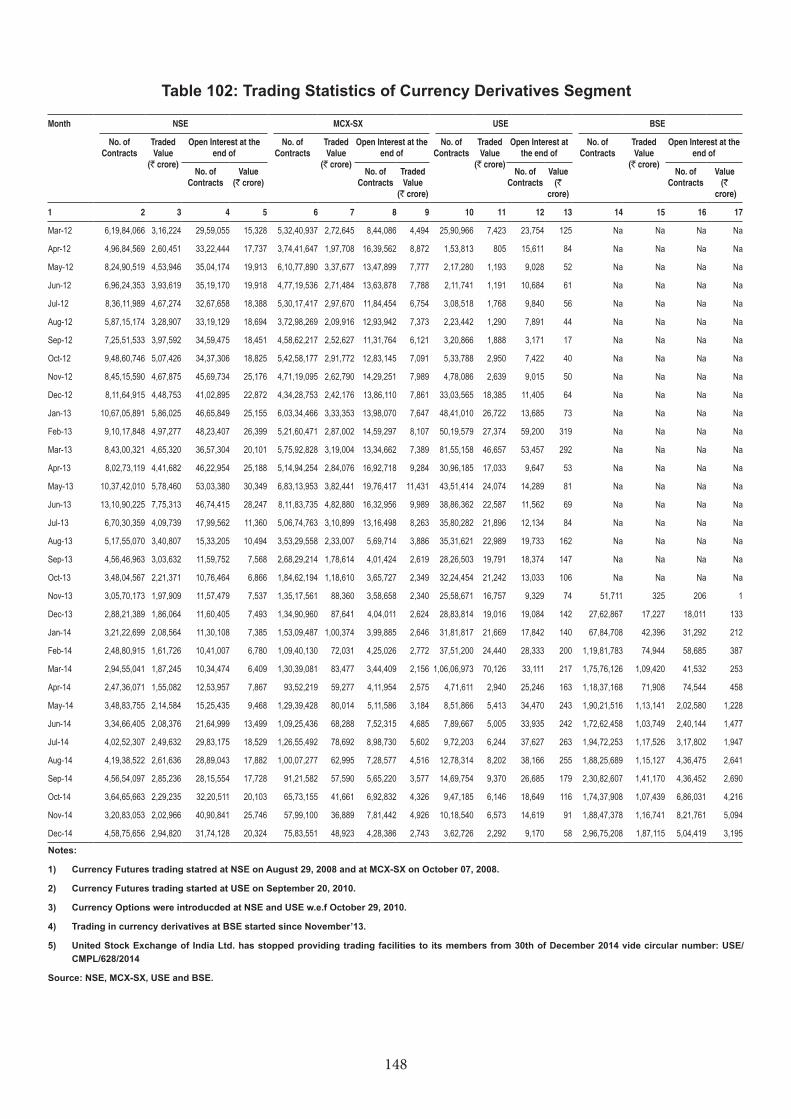
148
Month NSE MCX-SX USE BSE
No. of Contracts
Traded Value
(` crore)
Open Interest at the end of
No. of Contracts
Traded Value
(` crore)
Open Interest at the end of
No. of Contracts
Traded Value
(` crore)
Open Interest at the end of
No. of Contracts
Traded Value
(` crore)
Open Interest at the end of
No. of Contracts
Value(` crore)
No. of Contracts
Traded Value
(` crore)
No. of Contracts
Value (`
crore)
No. of Contracts
Value(`
crore)
1 2 3 4 5 6 7 8 9 10 11 12 13 14 15 16 17
Mar-12 6,19,84,066 3,16,224 29,59,055 15,328 5,32,40,937 2,72,645 8,44,086 4,494 25,90,966 7,423 23,754 125 Na Na Na Na
Apr-12 4,96,84,569 2,60,451 33,22,444 17,737 3,74,41,647 1,97,708 16,39,562 8,872 1,53,813 805 15,611 84 Na Na Na Na
May-12 8,24,90,519 4,53,946 35,04,174 19,913 6,10,77,890 3,37,677 13,47,899 7,777 2,17,280 1,193 9,028 52 Na Na Na Na
Jun-12 6,96,24,353 3,93,619 35,19,170 19,918 4,77,19,536 2,71,484 13,63,878 7,788 2,11,741 1,191 10,684 61 Na Na Na Na
Jul-12 8,36,11,989 4,67,274 32,67,658 18,388 5,30,17,417 2,97,670 11,84,454 6,754 3,08,518 1,768 9,840 56 Na Na Na Na
Aug-12 5,87,15,174 3,28,907 33,19,129 18,694 3,72,98,269 2,09,916 12,93,942 7,373 2,23,442 1,290 7,891 44 Na Na Na Na
Sep-12 7,25,51,533 3,97,592 34,59,475 18,451 4,58,62,217 2,52,627 11,31,764 6,121 3,20,866 1,888 3,171 17 Na Na Na Na
Oct-12 9,48,60,746 5,07,426 34,37,306 18,825 5,42,58,177 2,91,772 12,83,145 7,091 5,33,788 2,950 7,422 40 Na Na Na Na
Nov-12 8,45,15,590 4,67,875 45,69,734 25,176 4,71,19,095 2,62,790 14,29,251 7,989 4,78,086 2,639 9,015 50 Na Na Na Na
Dec-12 8,11,64,915 4,48,753 41,02,895 22,872 4,34,28,753 2,42,176 13,86,110 7,861 33,03,565 18,385 11,405 64 Na Na Na Na
Jan-13 10,67,05,891 5,86,025 46,65,849 25,155 6,03,34,466 3,33,353 13,98,070 7,647 48,41,010 26,722 13,685 73 Na Na Na Na
Feb-13 9,10,17,848 4,97,277 48,23,407 26,399 5,21,60,471 2,87,002 14,59,297 8,107 50,19,579 27,374 59,200 319 Na Na Na Na
Mar-13 8,43,00,321 4,65,320 36,57,304 20,101 5,75,92,828 3,19,004 13,34,662 7,389 81,55,158 46,657 53,457 292 Na Na Na Na
Apr-13 8,02,73,119 4,41,682 46,22,954 25,188 5,14,94,254 2,84,076 16,92,718 9,284 30,96,185 17,033 9,647 53 Na Na Na Na
May-13 10,37,42,010 5,78,460 53,03,380 30,349 6,83,13,953 3,82,441 19,76,417 11,431 43,51,414 24,074 14,289 81 Na Na Na Na
Jun-13 13,10,90,225 7,75,313 46,74,415 28,247 8,11,83,735 4,82,880 16,32,956 9,989 38,86,362 22,587 11,562 69 Na Na Na Na
Jul-13 6,70,30,359 4,09,739 17,99,562 11,360 5,06,74,763 3,10,899 13,16,498 8,263 35,80,282 21,896 12,134 84 Na Na Na Na
Aug-13 5,17,55,070 3,40,807 15,33,205 10,494 3,53,29,558 2,33,007 5,69,714 3,886 35,31,621 22,989 19,733 162 Na Na Na Na
Sep-13 4,56,46,963 3,03,632 11,59,752 7,568 2,68,29,214 1,78,614 4,01,424 2,619 28,26,503 19,791 18,374 147 Na Na Na Na
Oct-13 3,48,04,567 2,21,371 10,76,464 6,866 1,84,62,194 1,18,610 3,65,727 2,349 32,24,454 21,242 13,033 106 Na Na Na Na
Nov-13 3,05,70,173 1,97,909 11,57,479 7,537 1,35,17,561 88,360 3,58,658 2,340 25,58,671 16,757 9,329 74 51,711 325 206 1
Dec-13 2,88,21,389 1,86,064 11,60,405 7,493 1,34,90,960 87,641 4,04,011 2,624 28,83,814 19,016 19,084 142 27,62,867 17,227 18,011 133
Jan-14 3,21,22,699 2,08,564 11,30,108 7,385 1,53,09,487 1,00,374 3,99,885 2,646 31,81,817 21,669 17,842 140 67,84,708 42,396 31,292 212
Feb-14 2,48,80,915 1,61,726 10,41,007 6,780 1,09,40,130 72,031 4,25,026 2,772 37,51,200 24,440 28,333 200 1,19,81,783 74,944 58,685 387
Mar-14 2,94,55,041 1,87,245 10,34,474 6,409 1,30,39,081 83,477 3,44,409 2,156 1,06,06,973 70,126 33,111 217 1,75,76,126 1,09,420 41,532 253
Apr-14 2,47,36,071 1,55,082 12,53,957 7,867 93,52,219 59,277 4,11,954 2,575 4,71,611 2,940 25,246 163 1,18,37,168 71,908 74,544 458
May-14 3,48,83,755 2,14,584 15,25,435 9,468 1,29,39,428 80,014 5,11,586 3,184 8,51,866 5,413 34,470 243 1,90,21,516 1,13,141 2,02,580 1,228
Jun-14 3,34,66,405 2,08,376 21,64,999 13,499 1,09,25,436 68,288 7,52,315 4,685 7,89,667 5,005 33,935 242 1,72,62,458 1,03,749 2,40,144 1,477
Jul-14 4,02,52,307 2,49,632 29,83,175 18,529 1,26,55,492 78,692 8,98,730 5,602 9,72,203 6,244 37,627 263 1,94,72,253 1,17,526 3,17,802 1,947
Aug-14 4,19,38,522 2,61,636 28,89,043 17,882 1,00,07,277 62,995 7,28,577 4,516 12,78,314 8,202 38,166 255 1,88,25,689 1,15,127 4,36,475 2,641
Sep-14 4,56,54,097 2,85,236 28,15,554 17,728 91,21,582 57,590 5,65,220 3,577 14,69,754 9,370 26,685 179 2,30,82,607 1,41,170 4,36,452 2,690
Oct-14 3,64,65,663 2,29,235 32,20,511 20,103 65,73,155 41,661 6,92,832 4,326 9,47,185 6,146 18,649 116 1,74,37,908 1,07,439 6,86,031 4,216
Nov-14 3,20,83,053 2,02,966 40,90,841 25,746 57,99,100 36,889 7,81,442 4,926 10,18,540 6,573 14,619 91 1,88,47,378 1,16,741 8,21,761 5,094
Dec-14 4,58,75,656 2,94,820 31,74,128 20,324 75,83,551 48,923 4,28,386 2,743 3,62,726 2,292 9,170 58 2,96,75,208 1,87,115 5,04,419 3,195
Notes:
1) Currency Futures trading statred at NSE on August 29, 2008 and at MCX-SX on October 07, 2008.
2) Currency Futures trading started at USE on September 20, 2010.
3) Currency Options were introducded at NSE and USE w.e.f October 29, 2010.
4) Trading in currency derivatives at BSE started since November’13.
5) United Stock Exchange of India Ltd. has stopped providing trading facilities to its members from 30th of December 2014 vide circular number: USE/CMPL/628/2014
Source: NSE, MCX-SX, USE and BSE.
Table 102: Trading Statistics of Currency Derivatives Segment
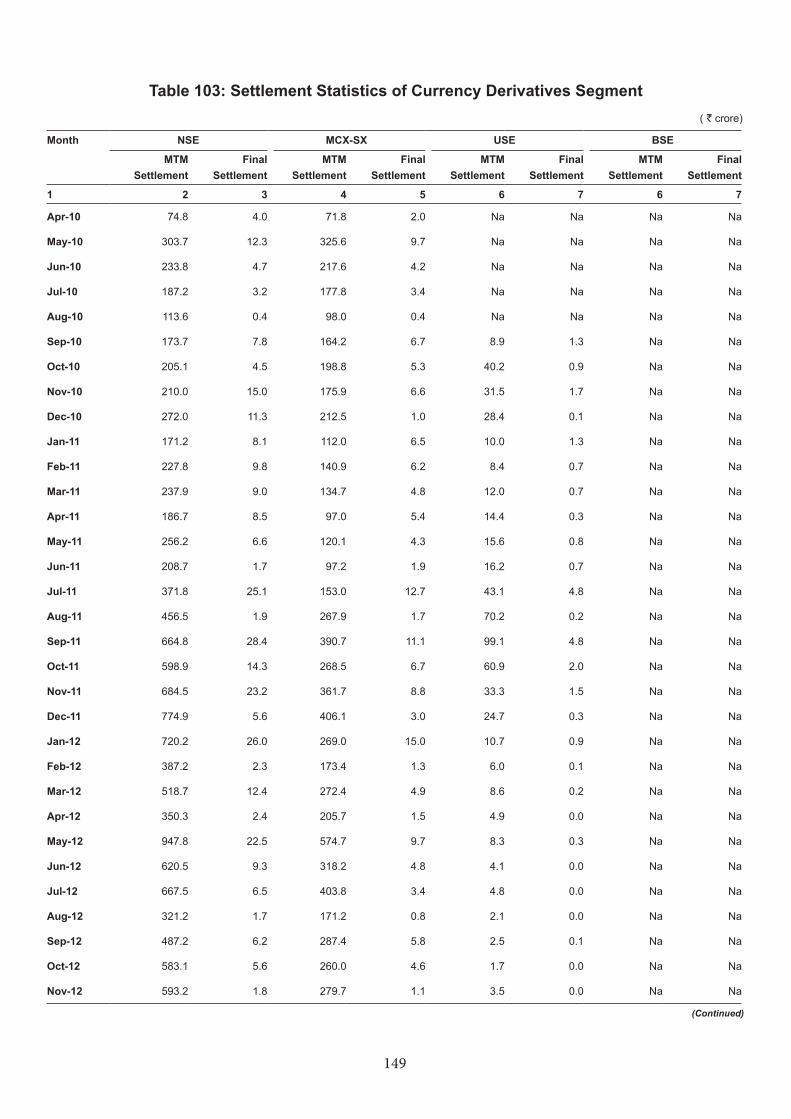
149
Table 103: Settlement Statistics of Currency Derivatives Segment ( ` crore)
Month NSE MCX-SX USE BSE
MTM Settlement
Final Settlement
MTM Settlement
Final Settlement
MTM Settlement
Final Settlement
MTM Settlement
Final Settlement
1 2 3 4 5 6 7 6 7
Apr-10 74.8 4.0 71.8 2.0 Na Na Na Na
May-10 303.7 12.3 325.6 9.7 Na Na Na Na
Jun-10 233.8 4.7 217.6 4.2 Na Na Na Na
Jul-10 187.2 3.2 177.8 3.4 Na Na Na Na
Aug-10 113.6 0.4 98.0 0.4 Na Na Na Na
Sep-10 173.7 7.8 164.2 6.7 8.9 1.3 Na Na
Oct-10 205.1 4.5 198.8 5.3 40.2 0.9 Na Na
Nov-10 210.0 15.0 175.9 6.6 31.5 1.7 Na Na
Dec-10 272.0 11.3 212.5 1.0 28.4 0.1 Na Na
Jan-11 171.2 8.1 112.0 6.5 10.0 1.3 Na Na
Feb-11 227.8 9.8 140.9 6.2 8.4 0.7 Na Na
Mar-11 237.9 9.0 134.7 4.8 12.0 0.7 Na Na
Apr-11 186.7 8.5 97.0 5.4 14.4 0.3 Na Na
May-11 256.2 6.6 120.1 4.3 15.6 0.8 Na Na
Jun-11 208.7 1.7 97.2 1.9 16.2 0.7 Na Na
Jul-11 371.8 25.1 153.0 12.7 43.1 4.8 Na Na
Aug-11 456.5 1.9 267.9 1.7 70.2 0.2 Na Na
Sep-11 664.8 28.4 390.7 11.1 99.1 4.8 Na Na
Oct-11 598.9 14.3 268.5 6.7 60.9 2.0 Na Na
Nov-11 684.5 23.2 361.7 8.8 33.3 1.5 Na Na
Dec-11 774.9 5.6 406.1 3.0 24.7 0.3 Na Na
Jan-12 720.2 26.0 269.0 15.0 10.7 0.9 Na Na
Feb-12 387.2 2.3 173.4 1.3 6.0 0.1 Na Na
Mar-12 518.7 12.4 272.4 4.9 8.6 0.2 Na Na
Apr-12 350.3 2.4 205.7 1.5 4.9 0.0 Na Na
May-12 947.8 22.5 574.7 9.7 8.3 0.3 Na Na
Jun-12 620.5 9.3 318.2 4.8 4.1 0.0 Na Na
Jul-12 667.5 6.5 403.8 3.4 4.8 0.0 Na Na
Aug-12 321.2 1.7 171.2 0.8 2.1 0.0 Na Na
Sep-12 487.2 6.2 287.4 5.8 2.5 0.1 Na Na
Oct-12 583.1 5.6 260.0 4.6 1.7 0.0 Na Na
Nov-12 593.2 1.8 279.7 1.1 3.5 0.0 Na Na
(Continued)
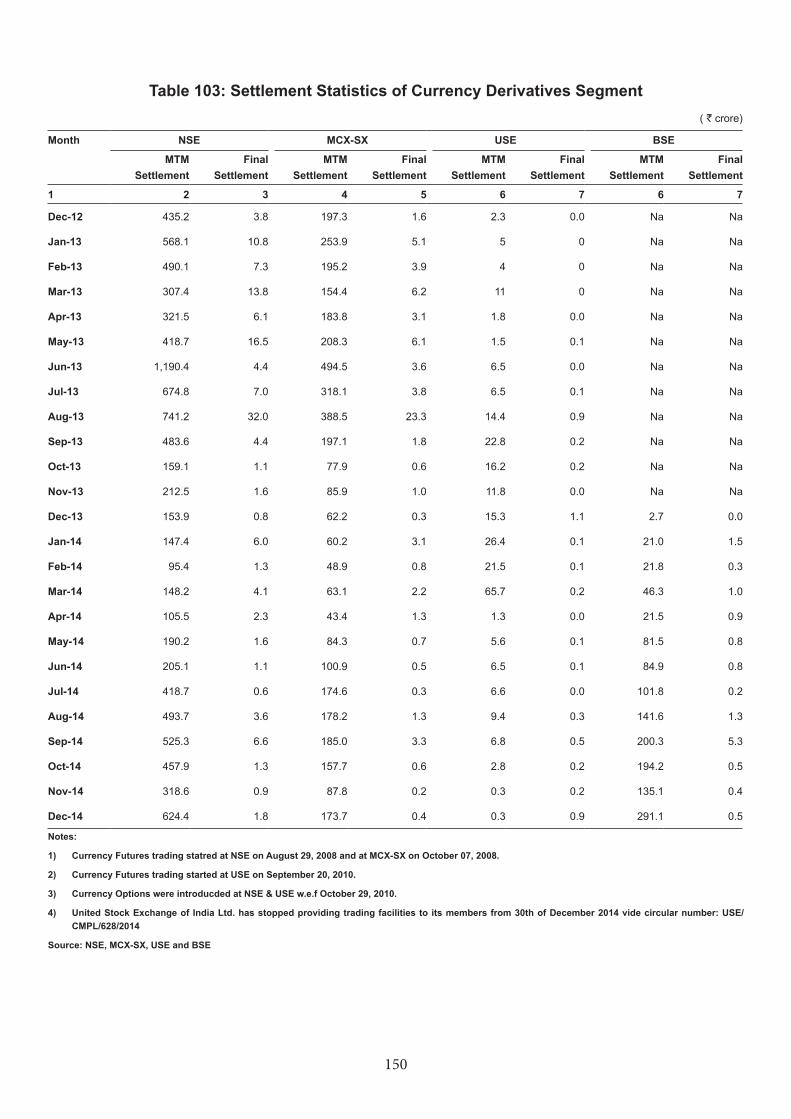
150
Month NSE MCX-SX USE BSE
MTM Settlement
Final Settlement
MTM Settlement
Final Settlement
MTM Settlement
Final Settlement
MTM Settlement
Final Settlement
1 2 3 4 5 6 7 6 7
Dec-12 435.2 3.8 197.3 1.6 2.3 0.0 Na Na
Jan-13 568.1 10.8 253.9 5.1 5 0 Na Na
Feb-13 490.1 7.3 195.2 3.9 4 0 Na Na
Mar-13 307.4 13.8 154.4 6.2 11 0 Na Na
Apr-13 321.5 6.1 183.8 3.1 1.8 0.0 Na Na
May-13 418.7 16.5 208.3 6.1 1.5 0.1 Na Na
Jun-13 1,190.4 4.4 494.5 3.6 6.5 0.0 Na Na
Jul-13 674.8 7.0 318.1 3.8 6.5 0.1 Na Na
Aug-13 741.2 32.0 388.5 23.3 14.4 0.9 Na Na
Sep-13 483.6 4.4 197.1 1.8 22.8 0.2 Na Na
Oct-13 159.1 1.1 77.9 0.6 16.2 0.2 Na Na
Nov-13 212.5 1.6 85.9 1.0 11.8 0.0 Na Na
Dec-13 153.9 0.8 62.2 0.3 15.3 1.1 2.7 0.0
Jan-14 147.4 6.0 60.2 3.1 26.4 0.1 21.0 1.5
Feb-14 95.4 1.3 48.9 0.8 21.5 0.1 21.8 0.3
Mar-14 148.2 4.1 63.1 2.2 65.7 0.2 46.3 1.0
Apr-14 105.5 2.3 43.4 1.3 1.3 0.0 21.5 0.9
May-14 190.2 1.6 84.3 0.7 5.6 0.1 81.5 0.8
Jun-14 205.1 1.1 100.9 0.5 6.5 0.1 84.9 0.8
Jul-14 418.7 0.6 174.6 0.3 6.6 0.0 101.8 0.2
Aug-14 493.7 3.6 178.2 1.3 9.4 0.3 141.6 1.3
Sep-14 525.3 6.6 185.0 3.3 6.8 0.5 200.3 5.3
Oct-14 457.9 1.3 157.7 0.6 2.8 0.2 194.2 0.5
Nov-14 318.6 0.9 87.8 0.2 0.3 0.2 135.1 0.4
Dec-14 624.4 1.8 173.7 0.4 0.3 0.9 291.1 0.5
Notes:
1) Currency Futures trading statred at NSE on August 29, 2008 and at MCX-SX on October 07, 2008.
2) Currency Futures trading started at USE on September 20, 2010.
3) Currency Options were introducded at NSE & USE w.e.f October 29, 2010.
4) United Stock Exchange of India Ltd. has stopped providing trading facilities to its members from 30th of December 2014 vide circular number: USE/CMPL/628/2014
Source: NSE, MCX-SX, USE and BSE
Table 103: Settlement Statistics of Currency Derivatives Segment ( ` crore)
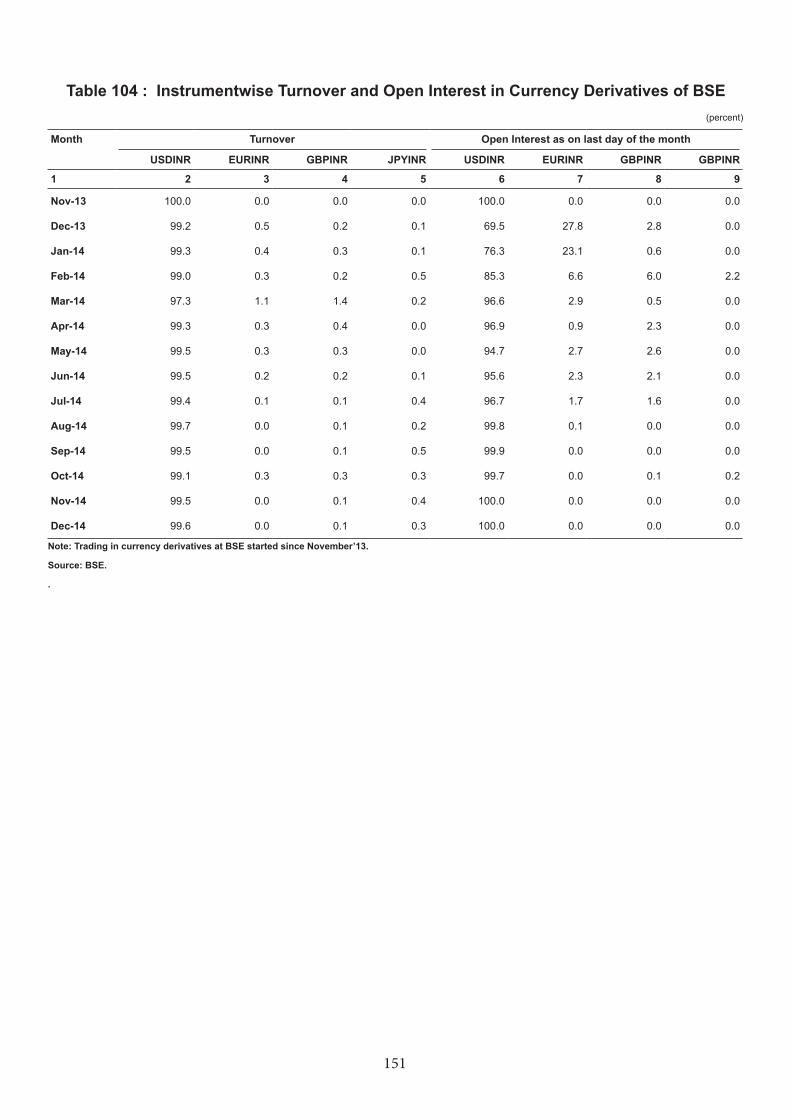
151
Table 104 : Instrumentwise Turnover and Open Interest in Currency Derivatives of BSE(percent)
Month Turnover Open Interest as on last day of the month
USDINR EURINR GBPINR JPYINR USDINR EURINR GBPINR GBPINR
1 2 3 4 5 6 7 8 9
Nov-13 100.0 0.0 0.0 0.0 100.0 0.0 0.0 0.0
Dec-13 99.2 0.5 0.2 0.1 69.5 27.8 2.8 0.0
Jan-14 99.3 0.4 0.3 0.1 76.3 23.1 0.6 0.0
Feb-14 99.0 0.3 0.2 0.5 85.3 6.6 6.0 2.2
Mar-14 97.3 1.1 1.4 0.2 96.6 2.9 0.5 0.0
Apr-14 99.3 0.3 0.4 0.0 96.9 0.9 2.3 0.0
May-14 99.5 0.3 0.3 0.0 94.7 2.7 2.6 0.0
Jun-14 99.5 0.2 0.2 0.1 95.6 2.3 2.1 0.0
Jul-14 99.4 0.1 0.1 0.4 96.7 1.7 1.6 0.0
Aug-14 99.7 0.0 0.1 0.2 99.8 0.1 0.0 0.0
Sep-14 99.5 0.0 0.1 0.5 99.9 0.0 0.0 0.0
Oct-14 99.1 0.3 0.3 0.3 99.7 0.0 0.1 0.2
Nov-14 99.5 0.0 0.1 0.4 100.0 0.0 0.0 0.0
Dec-14 99.6 0.0 0.1 0.3 100.0 0.0 0.0 0.0
Note: Trading in currency derivatives at BSE started since November’13.
Source: BSE.
.
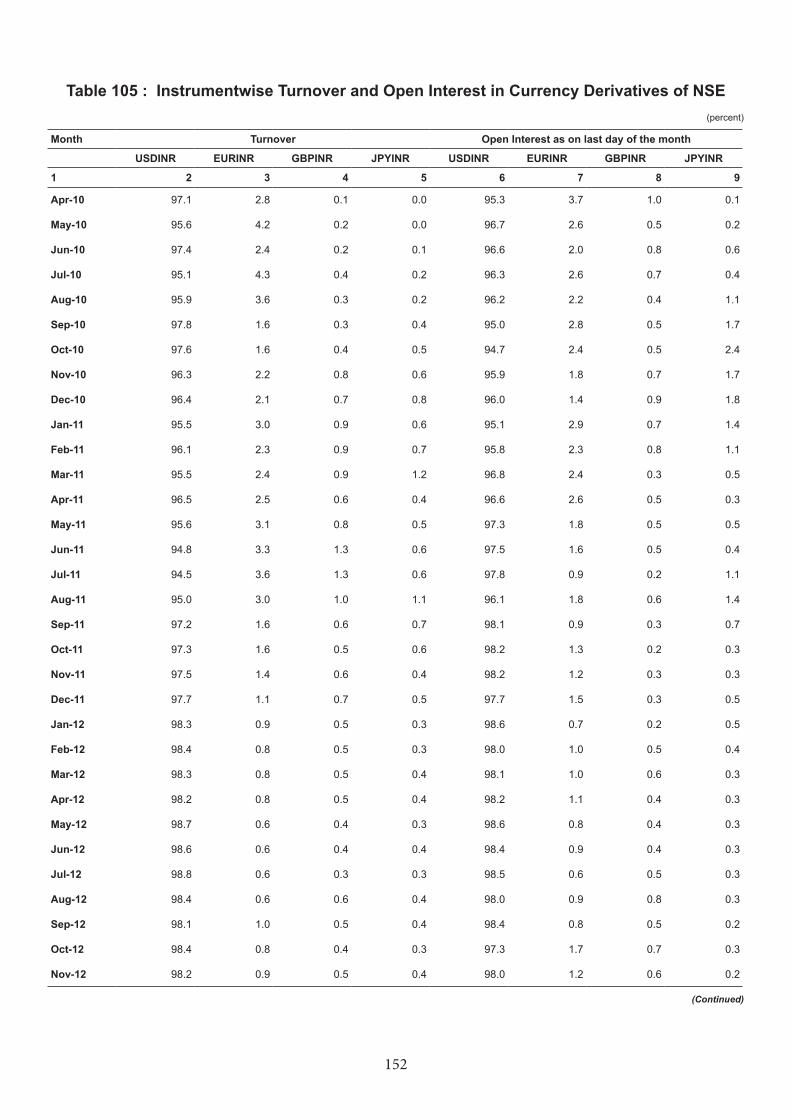
152
Table 105 : Instrumentwise Turnover and Open Interest in Currency Derivatives of NSE(percent)
Month Turnover Open Interest as on last day of the month
USDINR EURINR GBPINR JPYINR USDINR EURINR GBPINR JPYINR
1 2 3 4 5 6 7 8 9
Apr-10 97.1 2.8 0.1 0.0 95.3 3.7 1.0 0.1
May-10 95.6 4.2 0.2 0.0 96.7 2.6 0.5 0.2
Jun-10 97.4 2.4 0.2 0.1 96.6 2.0 0.8 0.6
Jul-10 95.1 4.3 0.4 0.2 96.3 2.6 0.7 0.4
Aug-10 95.9 3.6 0.3 0.2 96.2 2.2 0.4 1.1
Sep-10 97.8 1.6 0.3 0.4 95.0 2.8 0.5 1.7
Oct-10 97.6 1.6 0.4 0.5 94.7 2.4 0.5 2.4
Nov-10 96.3 2.2 0.8 0.6 95.9 1.8 0.7 1.7
Dec-10 96.4 2.1 0.7 0.8 96.0 1.4 0.9 1.8
Jan-11 95.5 3.0 0.9 0.6 95.1 2.9 0.7 1.4
Feb-11 96.1 2.3 0.9 0.7 95.8 2.3 0.8 1.1
Mar-11 95.5 2.4 0.9 1.2 96.8 2.4 0.3 0.5
Apr-11 96.5 2.5 0.6 0.4 96.6 2.6 0.5 0.3
May-11 95.6 3.1 0.8 0.5 97.3 1.8 0.5 0.5
Jun-11 94.8 3.3 1.3 0.6 97.5 1.6 0.5 0.4
Jul-11 94.5 3.6 1.3 0.6 97.8 0.9 0.2 1.1
Aug-11 95.0 3.0 1.0 1.1 96.1 1.8 0.6 1.4
Sep-11 97.2 1.6 0.6 0.7 98.1 0.9 0.3 0.7
Oct-11 97.3 1.6 0.5 0.6 98.2 1.3 0.2 0.3
Nov-11 97.5 1.4 0.6 0.4 98.2 1.2 0.3 0.3
Dec-11 97.7 1.1 0.7 0.5 97.7 1.5 0.3 0.5
Jan-12 98.3 0.9 0.5 0.3 98.6 0.7 0.2 0.5
Feb-12 98.4 0.8 0.5 0.3 98.0 1.0 0.5 0.4
Mar-12 98.3 0.8 0.5 0.4 98.1 1.0 0.6 0.3
Apr-12 98.2 0.8 0.5 0.4 98.2 1.1 0.4 0.3
May-12 98.7 0.6 0.4 0.3 98.6 0.8 0.4 0.3
Jun-12 98.6 0.6 0.4 0.4 98.4 0.9 0.4 0.3
Jul-12 98.8 0.6 0.3 0.3 98.5 0.6 0.5 0.3
Aug-12 98.4 0.6 0.6 0.4 98.0 0.9 0.8 0.3
Sep-12 98.1 1.0 0.5 0.4 98.4 0.8 0.5 0.2
Oct-12 98.4 0.8 0.4 0.3 97.3 1.7 0.7 0.3
Nov-12 98.2 0.9 0.5 0.4 98.0 1.2 0.6 0.2
(Continued)
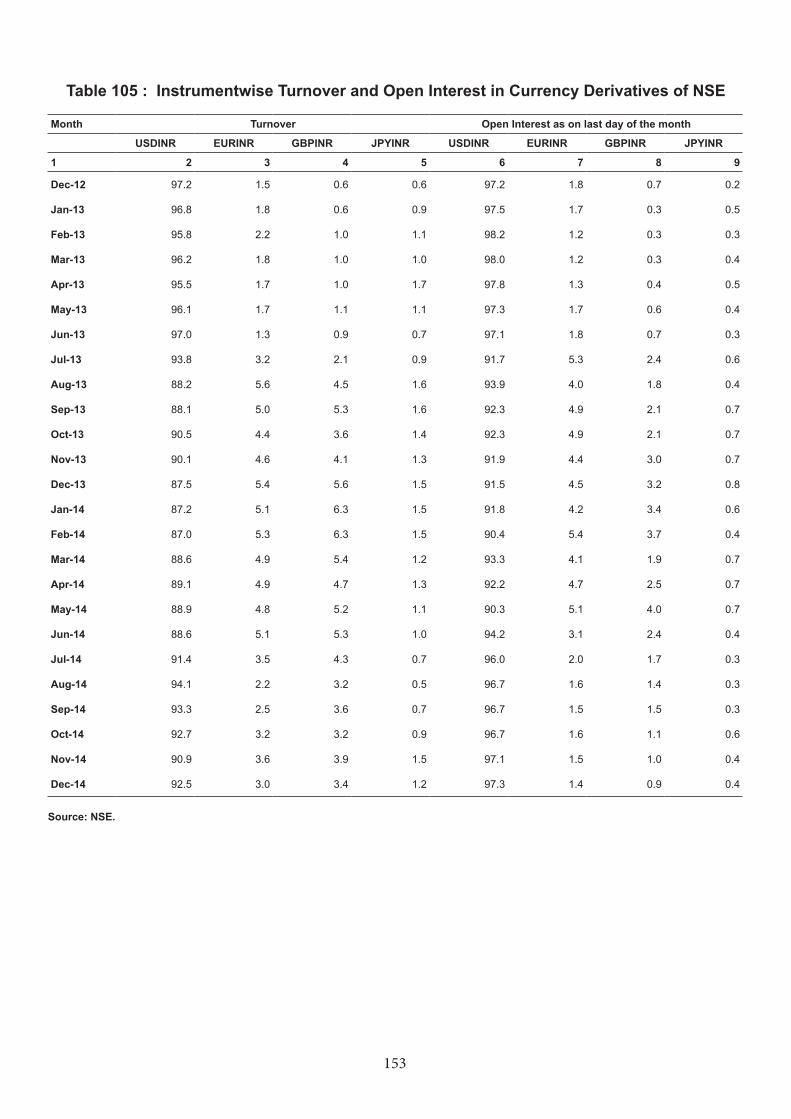
153
Table 105 : Instrumentwise Turnover and Open Interest in Currency Derivatives of NSE
Month Turnover Open Interest as on last day of the month
USDINR EURINR GBPINR JPYINR USDINR EURINR GBPINR JPYINR
1 2 3 4 5 6 7 8 9
Dec-12 97.2 1.5 0.6 0.6 97.2 1.8 0.7 0.2
Jan-13 96.8 1.8 0.6 0.9 97.5 1.7 0.3 0.5
Feb-13 95.8 2.2 1.0 1.1 98.2 1.2 0.3 0.3
Mar-13 96.2 1.8 1.0 1.0 98.0 1.2 0.3 0.4
Apr-13 95.5 1.7 1.0 1.7 97.8 1.3 0.4 0.5
May-13 96.1 1.7 1.1 1.1 97.3 1.7 0.6 0.4
Jun-13 97.0 1.3 0.9 0.7 97.1 1.8 0.7 0.3
Jul-13 93.8 3.2 2.1 0.9 91.7 5.3 2.4 0.6
Aug-13 88.2 5.6 4.5 1.6 93.9 4.0 1.8 0.4
Sep-13 88.1 5.0 5.3 1.6 92.3 4.9 2.1 0.7
Oct-13 90.5 4.4 3.6 1.4 92.3 4.9 2.1 0.7
Nov-13 90.1 4.6 4.1 1.3 91.9 4.4 3.0 0.7
Dec-13 87.5 5.4 5.6 1.5 91.5 4.5 3.2 0.8
Jan-14 87.2 5.1 6.3 1.5 91.8 4.2 3.4 0.6
Feb-14 87.0 5.3 6.3 1.5 90.4 5.4 3.7 0.4
Mar-14 88.6 4.9 5.4 1.2 93.3 4.1 1.9 0.7
Apr-14 89.1 4.9 4.7 1.3 92.2 4.7 2.5 0.7
May-14 88.9 4.8 5.2 1.1 90.3 5.1 4.0 0.7
Jun-14 88.6 5.1 5.3 1.0 94.2 3.1 2.4 0.4
Jul-14 91.4 3.5 4.3 0.7 96.0 2.0 1.7 0.3
Aug-14 94.1 2.2 3.2 0.5 96.7 1.6 1.4 0.3
Sep-14 93.3 2.5 3.6 0.7 96.7 1.5 1.5 0.3
Oct-14 92.7 3.2 3.2 0.9 96.7 1.6 1.1 0.6
Nov-14 90.9 3.6 3.9 1.5 97.1 1.5 1.0 0.4
Dec-14 92.5 3.0 3.4 1.2 97.3 1.4 0.9 0.4
Source: NSE.
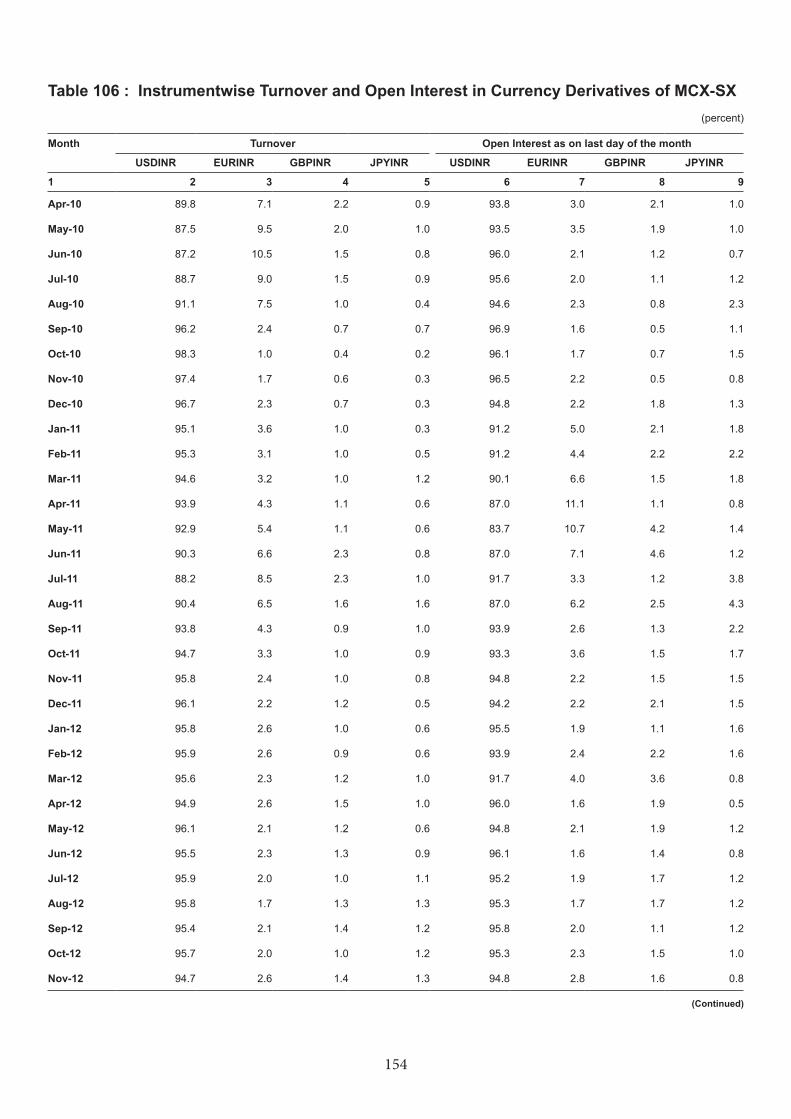
154
Table 106 : Instrumentwise Turnover and Open Interest in Currency Derivatives of MCX-SX (percent)
Month Turnover Open Interest as on last day of the month
USDINR EURINR GBPINR JPYINR USDINR EURINR GBPINR JPYINR
1 2 3 4 5 6 7 8 9
Apr-10 89.8 7.1 2.2 0.9 93.8 3.0 2.1 1.0
May-10 87.5 9.5 2.0 1.0 93.5 3.5 1.9 1.0
Jun-10 87.2 10.5 1.5 0.8 96.0 2.1 1.2 0.7
Jul-10 88.7 9.0 1.5 0.9 95.6 2.0 1.1 1.2
Aug-10 91.1 7.5 1.0 0.4 94.6 2.3 0.8 2.3
Sep-10 96.2 2.4 0.7 0.7 96.9 1.6 0.5 1.1
Oct-10 98.3 1.0 0.4 0.2 96.1 1.7 0.7 1.5
Nov-10 97.4 1.7 0.6 0.3 96.5 2.2 0.5 0.8
Dec-10 96.7 2.3 0.7 0.3 94.8 2.2 1.8 1.3
Jan-11 95.1 3.6 1.0 0.3 91.2 5.0 2.1 1.8
Feb-11 95.3 3.1 1.0 0.5 91.2 4.4 2.2 2.2
Mar-11 94.6 3.2 1.0 1.2 90.1 6.6 1.5 1.8
Apr-11 93.9 4.3 1.1 0.6 87.0 11.1 1.1 0.8
May-11 92.9 5.4 1.1 0.6 83.7 10.7 4.2 1.4
Jun-11 90.3 6.6 2.3 0.8 87.0 7.1 4.6 1.2
Jul-11 88.2 8.5 2.3 1.0 91.7 3.3 1.2 3.8
Aug-11 90.4 6.5 1.6 1.6 87.0 6.2 2.5 4.3
Sep-11 93.8 4.3 0.9 1.0 93.9 2.6 1.3 2.2
Oct-11 94.7 3.3 1.0 0.9 93.3 3.6 1.5 1.7
Nov-11 95.8 2.4 1.0 0.8 94.8 2.2 1.5 1.5
Dec-11 96.1 2.2 1.2 0.5 94.2 2.2 2.1 1.5
Jan-12 95.8 2.6 1.0 0.6 95.5 1.9 1.1 1.6
Feb-12 95.9 2.6 0.9 0.6 93.9 2.4 2.2 1.6
Mar-12 95.6 2.3 1.2 1.0 91.7 4.0 3.6 0.8
Apr-12 94.9 2.6 1.5 1.0 96.0 1.6 1.9 0.5
May-12 96.1 2.1 1.2 0.6 94.8 2.1 1.9 1.2
Jun-12 95.5 2.3 1.3 0.9 96.1 1.6 1.4 0.8
Jul-12 95.9 2.0 1.0 1.1 95.2 1.9 1.7 1.2
Aug-12 95.8 1.7 1.3 1.3 95.3 1.7 1.7 1.2
Sep-12 95.4 2.1 1.4 1.2 95.8 2.0 1.1 1.2
Oct-12 95.7 2.0 1.0 1.2 95.3 2.3 1.5 1.0
Nov-12 94.7 2.6 1.4 1.3 94.8 2.8 1.6 0.8
(Continued)
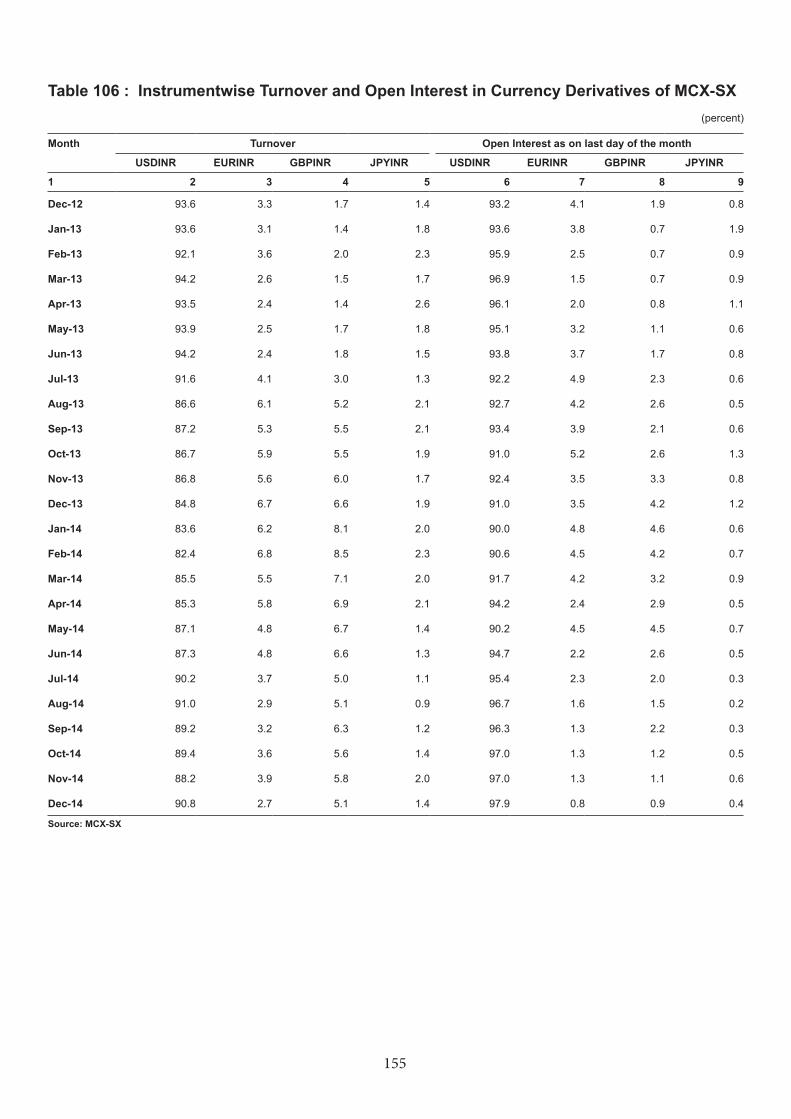
155
Table 106 : Instrumentwise Turnover and Open Interest in Currency Derivatives of MCX-SX (percent)
Month Turnover Open Interest as on last day of the month
USDINR EURINR GBPINR JPYINR USDINR EURINR GBPINR JPYINR
1 2 3 4 5 6 7 8 9
Dec-12 93.6 3.3 1.7 1.4 93.2 4.1 1.9 0.8
Jan-13 93.6 3.1 1.4 1.8 93.6 3.8 0.7 1.9
Feb-13 92.1 3.6 2.0 2.3 95.9 2.5 0.7 0.9
Mar-13 94.2 2.6 1.5 1.7 96.9 1.5 0.7 0.9
Apr-13 93.5 2.4 1.4 2.6 96.1 2.0 0.8 1.1
May-13 93.9 2.5 1.7 1.8 95.1 3.2 1.1 0.6
Jun-13 94.2 2.4 1.8 1.5 93.8 3.7 1.7 0.8
Jul-13 91.6 4.1 3.0 1.3 92.2 4.9 2.3 0.6
Aug-13 86.6 6.1 5.2 2.1 92.7 4.2 2.6 0.5
Sep-13 87.2 5.3 5.5 2.1 93.4 3.9 2.1 0.6
Oct-13 86.7 5.9 5.5 1.9 91.0 5.2 2.6 1.3
Nov-13 86.8 5.6 6.0 1.7 92.4 3.5 3.3 0.8
Dec-13 84.8 6.7 6.6 1.9 91.0 3.5 4.2 1.2
Jan-14 83.6 6.2 8.1 2.0 90.0 4.8 4.6 0.6
Feb-14 82.4 6.8 8.5 2.3 90.6 4.5 4.2 0.7
Mar-14 85.5 5.5 7.1 2.0 91.7 4.2 3.2 0.9
Apr-14 85.3 5.8 6.9 2.1 94.2 2.4 2.9 0.5
May-14 87.1 4.8 6.7 1.4 90.2 4.5 4.5 0.7
Jun-14 87.3 4.8 6.6 1.3 94.7 2.2 2.6 0.5
Jul-14 90.2 3.7 5.0 1.1 95.4 2.3 2.0 0.3
Aug-14 91.0 2.9 5.1 0.9 96.7 1.6 1.5 0.2
Sep-14 89.2 3.2 6.3 1.2 96.3 1.3 2.2 0.3
Oct-14 89.4 3.6 5.6 1.4 97.0 1.3 1.2 0.5
Nov-14 88.2 3.9 5.8 2.0 97.0 1.3 1.1 0.6
Dec-14 90.8 2.7 5.1 1.4 97.9 0.8 0.9 0.4
Source: MCX-SX
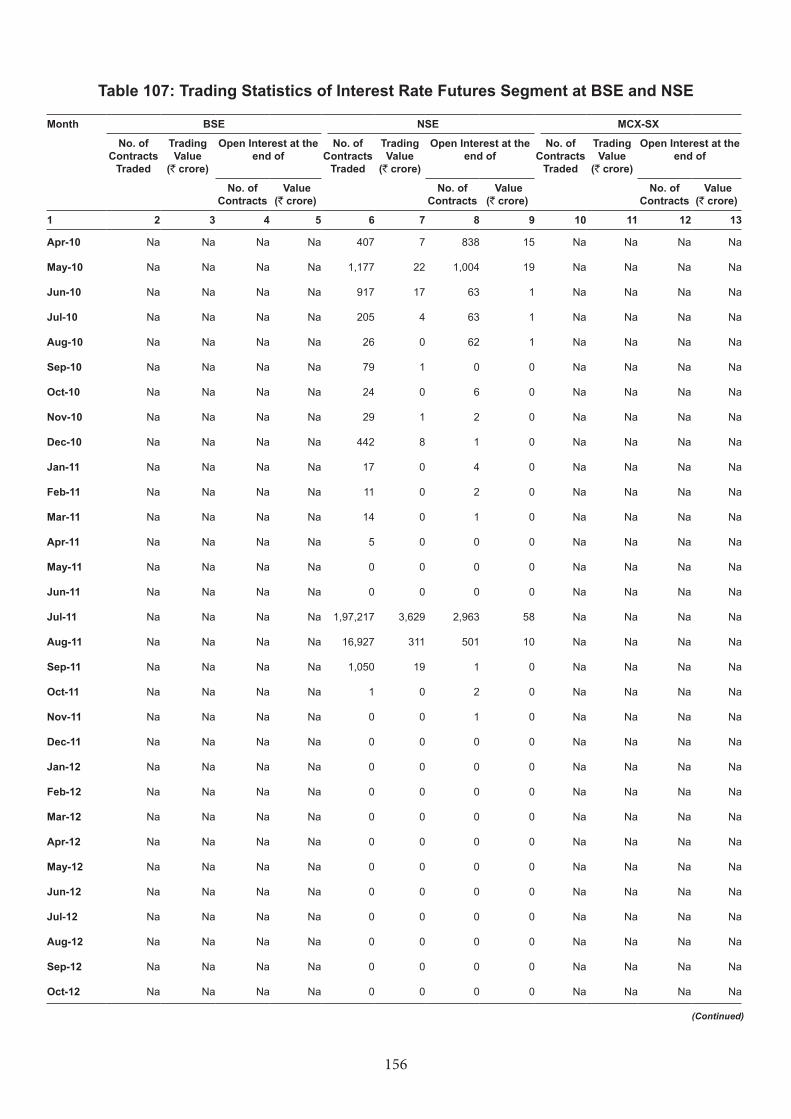
156
Table 107: Trading Statistics of Interest Rate Futures Segment at BSE and NSE
Month BSE NSE MCX-SX
No. of Contracts
Traded
Trading Value
(` crore)
Open Interest at the end of
No. of Contracts
Traded
Trading Value
(` crore)
Open Interest at the end of
No. of Contracts
Traded
Trading Value
(` crore)
Open Interest at the end of
No. of Contracts
Value(` crore)
No. of Contracts
Value(` crore)
No. of Contracts
Value(` crore)
1 2 3 4 5 6 7 8 9 10 11 12 13
Apr-10 Na Na Na Na 407 7 838 15 Na Na Na Na
May-10 Na Na Na Na 1,177 22 1,004 19 Na Na Na Na
Jun-10 Na Na Na Na 917 17 63 1 Na Na Na Na
Jul-10 Na Na Na Na 205 4 63 1 Na Na Na Na
Aug-10 Na Na Na Na 26 0 62 1 Na Na Na Na
Sep-10 Na Na Na Na 79 1 0 0 Na Na Na Na
Oct-10 Na Na Na Na 24 0 6 0 Na Na Na Na
Nov-10 Na Na Na Na 29 1 2 0 Na Na Na Na
Dec-10 Na Na Na Na 442 8 1 0 Na Na Na Na
Jan-11 Na Na Na Na 17 0 4 0 Na Na Na Na
Feb-11 Na Na Na Na 11 0 2 0 Na Na Na Na
Mar-11 Na Na Na Na 14 0 1 0 Na Na Na Na
Apr-11 Na Na Na Na 5 0 0 0 Na Na Na Na
May-11 Na Na Na Na 0 0 0 0 Na Na Na Na
Jun-11 Na Na Na Na 0 0 0 0 Na Na Na Na
Jul-11 Na Na Na Na 1,97,217 3,629 2,963 58 Na Na Na Na
Aug-11 Na Na Na Na 16,927 311 501 10 Na Na Na Na
Sep-11 Na Na Na Na 1,050 19 1 0 Na Na Na Na
Oct-11 Na Na Na Na 1 0 2 0 Na Na Na Na
Nov-11 Na Na Na Na 0 0 1 0 Na Na Na Na
Dec-11 Na Na Na Na 0 0 0 0 Na Na Na Na
Jan-12 Na Na Na Na 0 0 0 0 Na Na Na Na
Feb-12 Na Na Na Na 0 0 0 0 Na Na Na Na
Mar-12 Na Na Na Na 0 0 0 0 Na Na Na Na
Apr-12 Na Na Na Na 0 0 0 0 Na Na Na Na
May-12 Na Na Na Na 0 0 0 0 Na Na Na Na
Jun-12 Na Na Na Na 0 0 0 0 Na Na Na Na
Jul-12 Na Na Na Na 0 0 0 0 Na Na Na Na
Aug-12 Na Na Na Na 0 0 0 0 Na Na Na Na
Sep-12 Na Na Na Na 0 0 0 0 Na Na Na Na
Oct-12 Na Na Na Na 0 0 0 0 Na Na Na Na
(Continued)
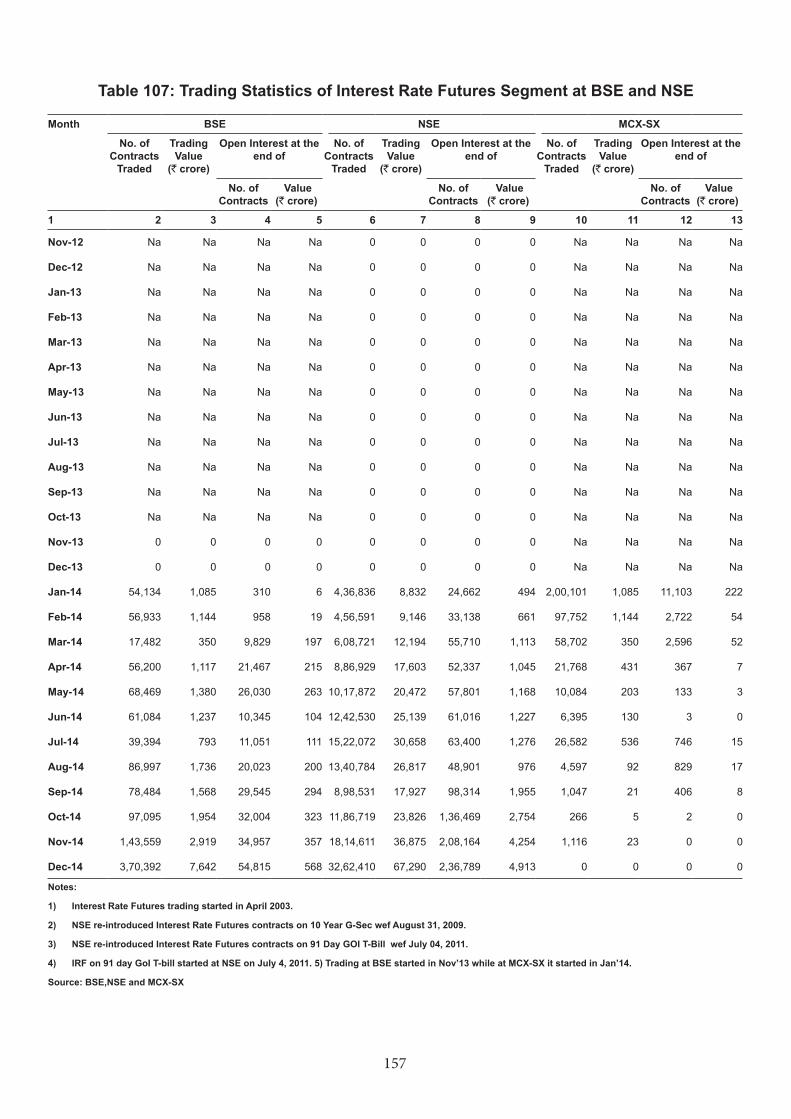
157
Table 107: Trading Statistics of Interest Rate Futures Segment at BSE and NSE
Month BSE NSE MCX-SX
No. of Contracts
Traded
Trading Value
(` crore)
Open Interest at the end of
No. of Contracts
Traded
Trading Value
(` crore)
Open Interest at the end of
No. of Contracts
Traded
Trading Value
(` crore)
Open Interest at the end of
No. of Contracts
Value(` crore)
No. of Contracts
Value(` crore)
No. of Contracts
Value(` crore)
1 2 3 4 5 6 7 8 9 10 11 12 13
Nov-12 Na Na Na Na 0 0 0 0 Na Na Na Na
Dec-12 Na Na Na Na 0 0 0 0 Na Na Na Na
Jan-13 Na Na Na Na 0 0 0 0 Na Na Na Na
Feb-13 Na Na Na Na 0 0 0 0 Na Na Na Na
Mar-13 Na Na Na Na 0 0 0 0 Na Na Na Na
Apr-13 Na Na Na Na 0 0 0 0 Na Na Na Na
May-13 Na Na Na Na 0 0 0 0 Na Na Na Na
Jun-13 Na Na Na Na 0 0 0 0 Na Na Na Na
Jul-13 Na Na Na Na 0 0 0 0 Na Na Na Na
Aug-13 Na Na Na Na 0 0 0 0 Na Na Na Na
Sep-13 Na Na Na Na 0 0 0 0 Na Na Na Na
Oct-13 Na Na Na Na 0 0 0 0 Na Na Na Na
Nov-13 0 0 0 0 0 0 0 0 Na Na Na Na
Dec-13 0 0 0 0 0 0 0 0 Na Na Na Na
Jan-14 54,134 1,085 310 6 4,36,836 8,832 24,662 494 2,00,101 1,085 11,103 222
Feb-14 56,933 1,144 958 19 4,56,591 9,146 33,138 661 97,752 1,144 2,722 54
Mar-14 17,482 350 9,829 197 6,08,721 12,194 55,710 1,113 58,702 350 2,596 52
Apr-14 56,200 1,117 21,467 215 8,86,929 17,603 52,337 1,045 21,768 431 367 7
May-14 68,469 1,380 26,030 263 10,17,872 20,472 57,801 1,168 10,084 203 133 3
Jun-14 61,084 1,237 10,345 104 12,42,530 25,139 61,016 1,227 6,395 130 3 0
Jul-14 39,394 793 11,051 111 15,22,072 30,658 63,400 1,276 26,582 536 746 15
Aug-14 86,997 1,736 20,023 200 13,40,784 26,817 48,901 976 4,597 92 829 17
Sep-14 78,484 1,568 29,545 294 8,98,531 17,927 98,314 1,955 1,047 21 406 8
Oct-14 97,095 1,954 32,004 323 11,86,719 23,826 1,36,469 2,754 266 5 2 0
Nov-14 1,43,559 2,919 34,957 357 18,14,611 36,875 2,08,164 4,254 1,116 23 0 0
Dec-14 3,70,392 7,642 54,815 568 32,62,410 67,290 2,36,789 4,913 0 0 0 0
Notes:
1) Interest Rate Futures trading started in April 2003.
2) NSE re-introduced Interest Rate Futures contracts on 10 Year G-Sec wef August 31, 2009.
3) NSE re-introduced Interest Rate Futures contracts on 91 Day GOI T-Bill wef July 04, 2011.
4) IRF on 91 day GoI T-bill started at NSE on July 4, 2011. 5) Trading at BSE started in Nov’13 while at MCX-SX it started in Jan’14.
Source: BSE,NSE and MCX-SX
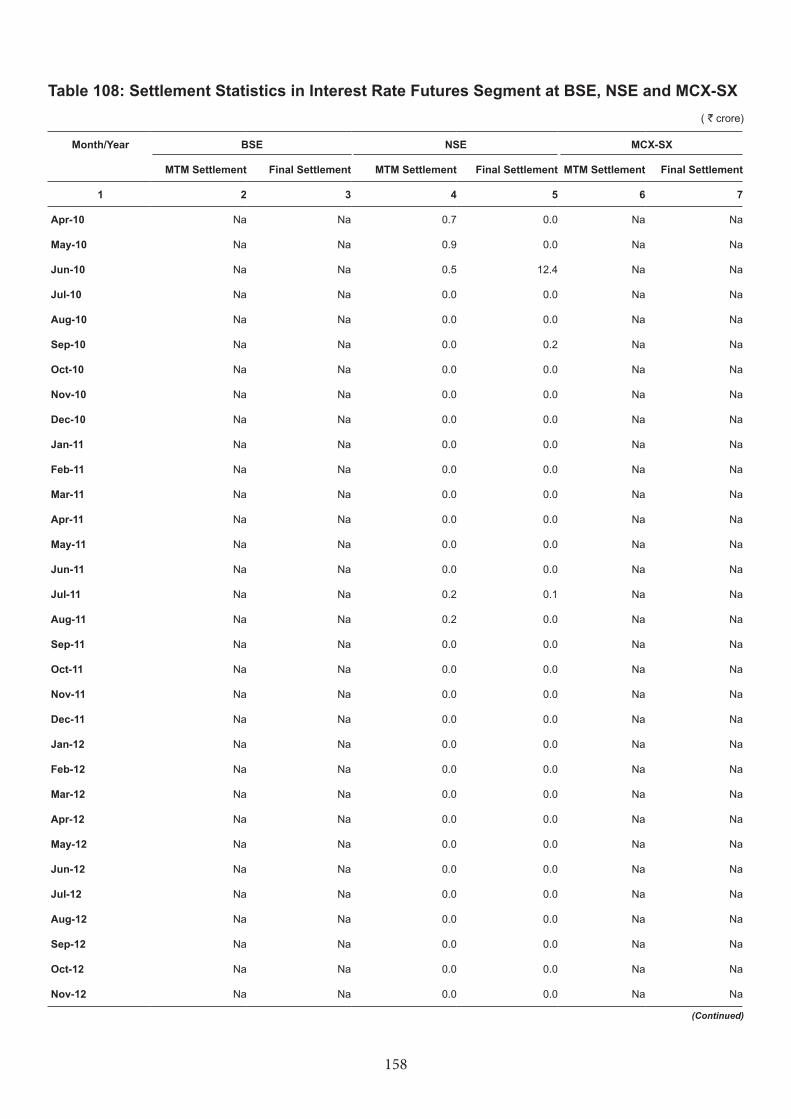
158
Table 108: Settlement Statistics in Interest Rate Futures Segment at BSE, NSE and MCX-SX ( ` crore)
Month/Year BSE NSE MCX-SX
MTM Settlement Final Settlement MTM Settlement Final Settlement MTM Settlement Final Settlement
1 2 3 4 5 6 7
Apr-10 Na Na 0.7 0.0 Na Na
May-10 Na Na 0.9 0.0 Na Na
Jun-10 Na Na 0.5 12.4 Na Na
Jul-10 Na Na 0.0 0.0 Na Na
Aug-10 Na Na 0.0 0.0 Na Na
Sep-10 Na Na 0.0 0.2 Na Na
Oct-10 Na Na 0.0 0.0 Na Na
Nov-10 Na Na 0.0 0.0 Na Na
Dec-10 Na Na 0.0 0.0 Na Na
Jan-11 Na Na 0.0 0.0 Na Na
Feb-11 Na Na 0.0 0.0 Na Na
Mar-11 Na Na 0.0 0.0 Na Na
Apr-11 Na Na 0.0 0.0 Na Na
May-11 Na Na 0.0 0.0 Na Na
Jun-11 Na Na 0.0 0.0 Na Na
Jul-11 Na Na 0.2 0.1 Na Na
Aug-11 Na Na 0.2 0.0 Na Na
Sep-11 Na Na 0.0 0.0 Na Na
Oct-11 Na Na 0.0 0.0 Na Na
Nov-11 Na Na 0.0 0.0 Na Na
Dec-11 Na Na 0.0 0.0 Na Na
Jan-12 Na Na 0.0 0.0 Na Na
Feb-12 Na Na 0.0 0.0 Na Na
Mar-12 Na Na 0.0 0.0 Na Na
Apr-12 Na Na 0.0 0.0 Na Na
May-12 Na Na 0.0 0.0 Na Na
Jun-12 Na Na 0.0 0.0 Na Na
Jul-12 Na Na 0.0 0.0 Na Na
Aug-12 Na Na 0.0 0.0 Na Na
Sep-12 Na Na 0.0 0.0 Na Na
Oct-12 Na Na 0.0 0.0 Na Na
Nov-12 Na Na 0.0 0.0 Na Na
(Continued)
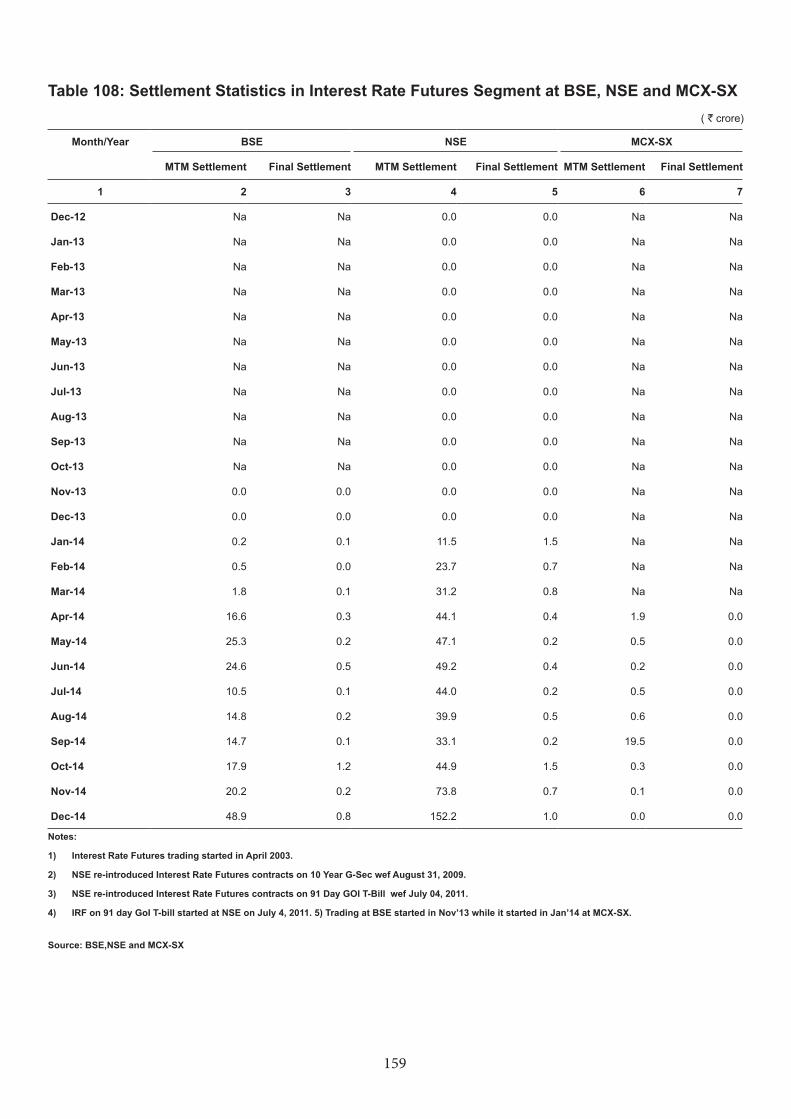
159
Table 108: Settlement Statistics in Interest Rate Futures Segment at BSE, NSE and MCX-SX ( ` crore)
Month/Year BSE NSE MCX-SX
MTM Settlement Final Settlement MTM Settlement Final Settlement MTM Settlement Final Settlement
1 2 3 4 5 6 7
Dec-12 Na Na 0.0 0.0 Na Na
Jan-13 Na Na 0.0 0.0 Na Na
Feb-13 Na Na 0.0 0.0 Na Na
Mar-13 Na Na 0.0 0.0 Na Na
Apr-13 Na Na 0.0 0.0 Na Na
May-13 Na Na 0.0 0.0 Na Na
Jun-13 Na Na 0.0 0.0 Na Na
Jul-13 Na Na 0.0 0.0 Na Na
Aug-13 Na Na 0.0 0.0 Na Na
Sep-13 Na Na 0.0 0.0 Na Na
Oct-13 Na Na 0.0 0.0 Na Na
Nov-13 0.0 0.0 0.0 0.0 Na Na
Dec-13 0.0 0.0 0.0 0.0 Na Na
Jan-14 0.2 0.1 11.5 1.5 Na Na
Feb-14 0.5 0.0 23.7 0.7 Na Na
Mar-14 1.8 0.1 31.2 0.8 Na Na
Apr-14 16.6 0.3 44.1 0.4 1.9 0.0
May-14 25.3 0.2 47.1 0.2 0.5 0.0
Jun-14 24.6 0.5 49.2 0.4 0.2 0.0
Jul-14 10.5 0.1 44.0 0.2 0.5 0.0
Aug-14 14.8 0.2 39.9 0.5 0.6 0.0
Sep-14 14.7 0.1 33.1 0.2 19.5 0.0
Oct-14 17.9 1.2 44.9 1.5 0.3 0.0
Nov-14 20.2 0.2 73.8 0.7 0.1 0.0
Dec-14 48.9 0.8 152.2 1.0 0.0 0.0
Notes:
1) Interest Rate Futures trading started in April 2003.
2) NSE re-introduced Interest Rate Futures contracts on 10 Year G-Sec wef August 31, 2009.
3) NSE re-introduced Interest Rate Futures contracts on 91 Day GOI T-Bill wef July 04, 2011.
4) IRF on 91 day GoI T-bill started at NSE on July 4, 2011. 5) Trading at BSE started in Nov’13 while it started in Jan’14 at MCX-SX.
Source: BSE,NSE and MCX-SX
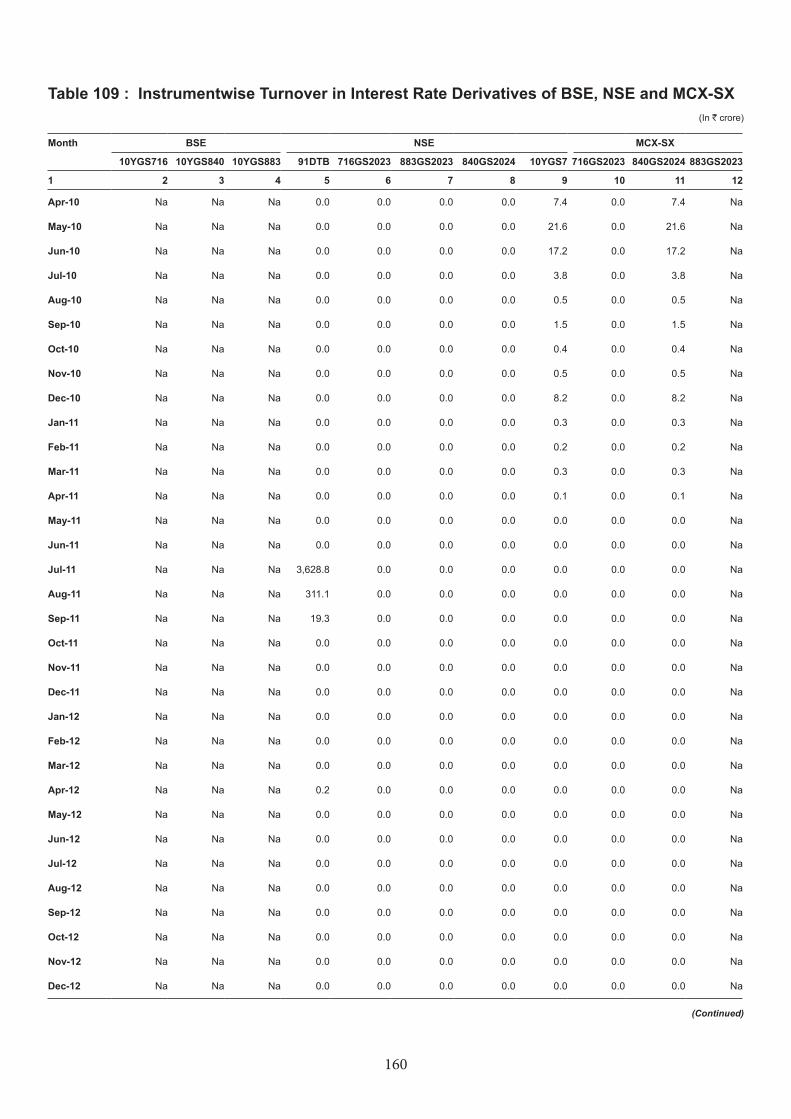
160
Table 109 : Instrumentwise Turnover in Interest Rate Derivatives of BSE, NSE and MCX-SX (In ` crore)
Month BSE NSE MCX-SX
10YGS716 10YGS840 10YGS883 91DTB 716GS2023 883GS2023 840GS2024 10YGS7 716GS2023 840GS2024 883GS2023
1 2 3 4 5 6 7 8 9 10 11 12
Apr-10 Na Na Na 0.0 0.0 0.0 0.0 7.4 0.0 7.4 Na
May-10 Na Na Na 0.0 0.0 0.0 0.0 21.6 0.0 21.6 Na
Jun-10 Na Na Na 0.0 0.0 0.0 0.0 17.2 0.0 17.2 Na
Jul-10 Na Na Na 0.0 0.0 0.0 0.0 3.8 0.0 3.8 Na
Aug-10 Na Na Na 0.0 0.0 0.0 0.0 0.5 0.0 0.5 Na
Sep-10 Na Na Na 0.0 0.0 0.0 0.0 1.5 0.0 1.5 Na
Oct-10 Na Na Na 0.0 0.0 0.0 0.0 0.4 0.0 0.4 Na
Nov-10 Na Na Na 0.0 0.0 0.0 0.0 0.5 0.0 0.5 Na
Dec-10 Na Na Na 0.0 0.0 0.0 0.0 8.2 0.0 8.2 Na
Jan-11 Na Na Na 0.0 0.0 0.0 0.0 0.3 0.0 0.3 Na
Feb-11 Na Na Na 0.0 0.0 0.0 0.0 0.2 0.0 0.2 Na
Mar-11 Na Na Na 0.0 0.0 0.0 0.0 0.3 0.0 0.3 Na
Apr-11 Na Na Na 0.0 0.0 0.0 0.0 0.1 0.0 0.1 Na
May-11 Na Na Na 0.0 0.0 0.0 0.0 0.0 0.0 0.0 Na
Jun-11 Na Na Na 0.0 0.0 0.0 0.0 0.0 0.0 0.0 Na
Jul-11 Na Na Na 3,628.8 0.0 0.0 0.0 0.0 0.0 0.0 Na
Aug-11 Na Na Na 311.1 0.0 0.0 0.0 0.0 0.0 0.0 Na
Sep-11 Na Na Na 19.3 0.0 0.0 0.0 0.0 0.0 0.0 Na
Oct-11 Na Na Na 0.0 0.0 0.0 0.0 0.0 0.0 0.0 Na
Nov-11 Na Na Na 0.0 0.0 0.0 0.0 0.0 0.0 0.0 Na
Dec-11 Na Na Na 0.0 0.0 0.0 0.0 0.0 0.0 0.0 Na
Jan-12 Na Na Na 0.0 0.0 0.0 0.0 0.0 0.0 0.0 Na
Feb-12 Na Na Na 0.0 0.0 0.0 0.0 0.0 0.0 0.0 Na
Mar-12 Na Na Na 0.0 0.0 0.0 0.0 0.0 0.0 0.0 Na
Apr-12 Na Na Na 0.2 0.0 0.0 0.0 0.0 0.0 0.0 Na
May-12 Na Na Na 0.0 0.0 0.0 0.0 0.0 0.0 0.0 Na
Jun-12 Na Na Na 0.0 0.0 0.0 0.0 0.0 0.0 0.0 Na
Jul-12 Na Na Na 0.0 0.0 0.0 0.0 0.0 0.0 0.0 Na
Aug-12 Na Na Na 0.0 0.0 0.0 0.0 0.0 0.0 0.0 Na
Sep-12 Na Na Na 0.0 0.0 0.0 0.0 0.0 0.0 0.0 Na
Oct-12 Na Na Na 0.0 0.0 0.0 0.0 0.0 0.0 0.0 Na
Nov-12 Na Na Na 0.0 0.0 0.0 0.0 0.0 0.0 0.0 Na
Dec-12 Na Na Na 0.0 0.0 0.0 0.0 0.0 0.0 0.0 Na
(Continued)
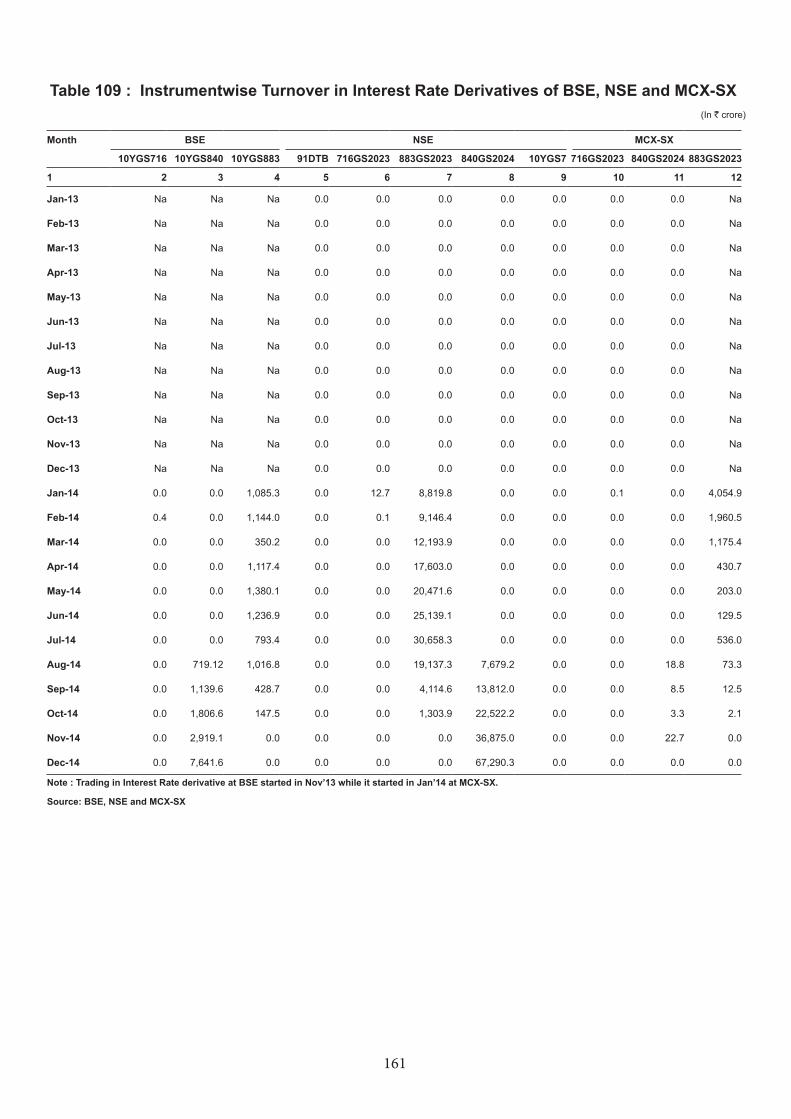
161
Table 109 : Instrumentwise Turnover in Interest Rate Derivatives of BSE, NSE and MCX-SX (In ` crore)
Month BSE NSE MCX-SX
10YGS716 10YGS840 10YGS883 91DTB 716GS2023 883GS2023 840GS2024 10YGS7 716GS2023 840GS2024 883GS2023
1 2 3 4 5 6 7 8 9 10 11 12
Jan-13 Na Na Na 0.0 0.0 0.0 0.0 0.0 0.0 0.0 Na
Feb-13 Na Na Na 0.0 0.0 0.0 0.0 0.0 0.0 0.0 Na
Mar-13 Na Na Na 0.0 0.0 0.0 0.0 0.0 0.0 0.0 Na
Apr-13 Na Na Na 0.0 0.0 0.0 0.0 0.0 0.0 0.0 Na
May-13 Na Na Na 0.0 0.0 0.0 0.0 0.0 0.0 0.0 Na
Jun-13 Na Na Na 0.0 0.0 0.0 0.0 0.0 0.0 0.0 Na
Jul-13 Na Na Na 0.0 0.0 0.0 0.0 0.0 0.0 0.0 Na
Aug-13 Na Na Na 0.0 0.0 0.0 0.0 0.0 0.0 0.0 Na
Sep-13 Na Na Na 0.0 0.0 0.0 0.0 0.0 0.0 0.0 Na
Oct-13 Na Na Na 0.0 0.0 0.0 0.0 0.0 0.0 0.0 Na
Nov-13 Na Na Na 0.0 0.0 0.0 0.0 0.0 0.0 0.0 Na
Dec-13 Na Na Na 0.0 0.0 0.0 0.0 0.0 0.0 0.0 Na
Jan-14 0.0 0.0 1,085.3 0.0 12.7 8,819.8 0.0 0.0 0.1 0.0 4,054.9
Feb-14 0.4 0.0 1,144.0 0.0 0.1 9,146.4 0.0 0.0 0.0 0.0 1,960.5
Mar-14 0.0 0.0 350.2 0.0 0.0 12,193.9 0.0 0.0 0.0 0.0 1,175.4
Apr-14 0.0 0.0 1,117.4 0.0 0.0 17,603.0 0.0 0.0 0.0 0.0 430.7
May-14 0.0 0.0 1,380.1 0.0 0.0 20,471.6 0.0 0.0 0.0 0.0 203.0
Jun-14 0.0 0.0 1,236.9 0.0 0.0 25,139.1 0.0 0.0 0.0 0.0 129.5
Jul-14 0.0 0.0 793.4 0.0 0.0 30,658.3 0.0 0.0 0.0 0.0 536.0
Aug-14 0.0 719.12 1,016.8 0.0 0.0 19,137.3 7,679.2 0.0 0.0 18.8 73.3
Sep-14 0.0 1,139.6 428.7 0.0 0.0 4,114.6 13,812.0 0.0 0.0 8.5 12.5
Oct-14 0.0 1,806.6 147.5 0.0 0.0 1,303.9 22,522.2 0.0 0.0 3.3 2.1
Nov-14 0.0 2,919.1 0.0 0.0 0.0 0.0 36,875.0 0.0 0.0 22.7 0.0
Dec-14 0.0 7,641.6 0.0 0.0 0.0 0.0 67,290.3 0.0 0.0 0.0 0.0
Note : Trading in Interest Rate derivative at BSE started in Nov’13 while it started in Jan’14 at MCX-SX.
Source: BSE, NSE and MCX-SX

162

163
PART IIIINTERNATIONAL SECURITIES MARKET

164
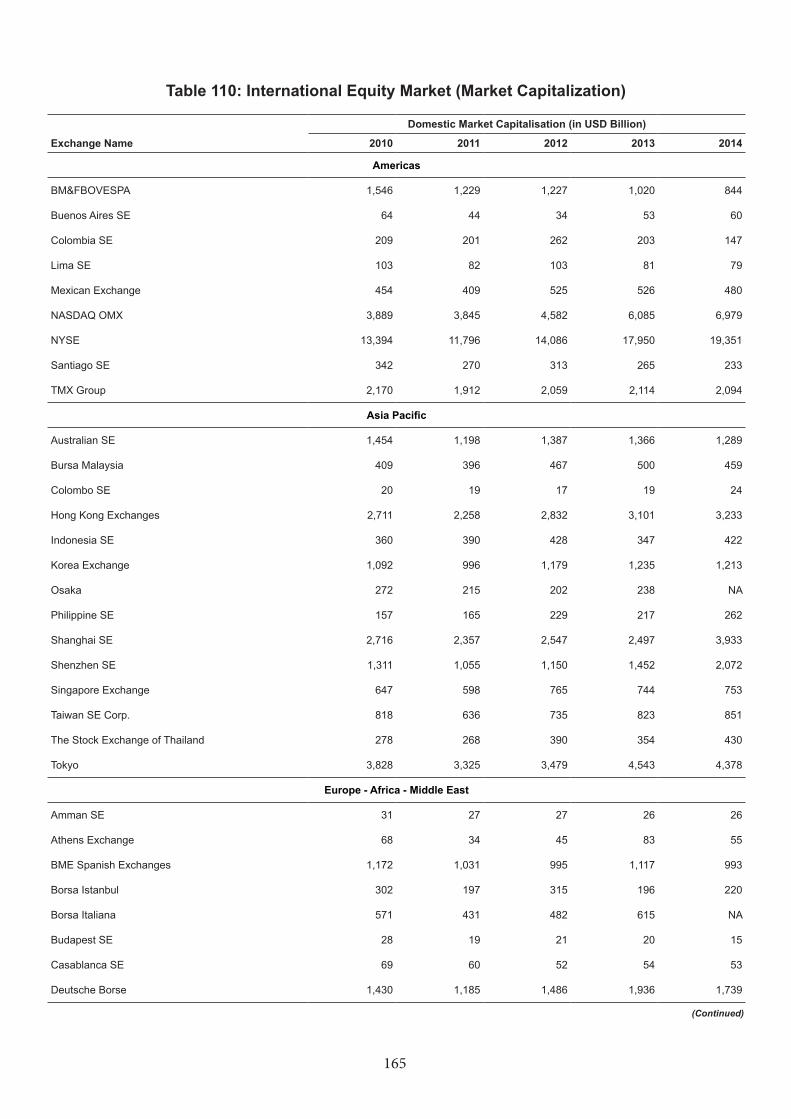
165
Table 110: International Equity Market (Market Capitalization)
Domestic Market Capitalisation (in USD Billion)
Exchange Name 2010 2011 2012 2013 2014
Americas
BM&FBOVESPA 1,546 1,229 1,227 1,020 844
Buenos Aires SE 64 44 34 53 60
Colombia SE 209 201 262 203 147
Lima SE 103 82 103 81 79
Mexican Exchange 454 409 525 526 480
NASDAQ OMX 3,889 3,845 4,582 6,085 6,979
NYSE 13,394 11,796 14,086 17,950 19,351
Santiago SE 342 270 313 265 233
TMX Group 2,170 1,912 2,059 2,114 2,094
Asia Pacific
Australian SE 1,454 1,198 1,387 1,366 1,289
Bursa Malaysia 409 396 467 500 459
Colombo SE 20 19 17 19 24
Hong Kong Exchanges 2,711 2,258 2,832 3,101 3,233
Indonesia SE 360 390 428 347 422
Korea Exchange 1,092 996 1,179 1,235 1,213
Osaka 272 215 202 238 NA
Philippine SE 157 165 229 217 262
Shanghai SE 2,716 2,357 2,547 2,497 3,933
Shenzhen SE 1,311 1,055 1,150 1,452 2,072
Singapore Exchange 647 598 765 744 753
Taiwan SE Corp. 818 636 735 823 851
The Stock Exchange of Thailand 278 268 390 354 430
Tokyo 3,828 3,325 3,479 4,543 4,378
Europe - Africa - Middle East
Amman SE 31 27 27 26 26
Athens Exchange 68 34 45 83 55
BME Spanish Exchanges 1,172 1,031 995 1,117 993
Borsa Istanbul 302 197 315 196 220
Borsa Italiana 571 431 482 615 NA
Budapest SE 28 19 21 20 15
Casablanca SE 69 60 52 54 53
Deutsche Borse 1,430 1,185 1,486 1,936 1,739
(Continued)
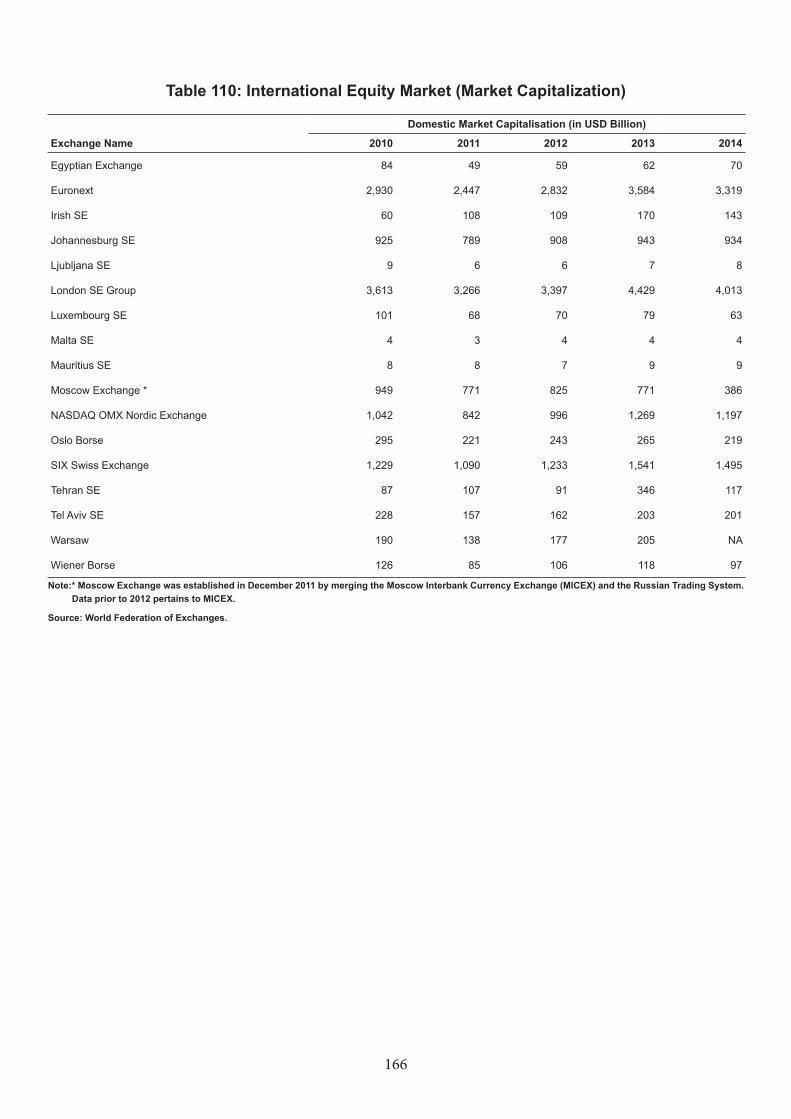
166
Table 110: International Equity Market (Market Capitalization)
Domestic Market Capitalisation (in USD Billion)
Exchange Name 2010 2011 2012 2013 2014
Egyptian Exchange 84 49 59 62 70
Euronext 2,930 2,447 2,832 3,584 3,319
Irish SE 60 108 109 170 143
Johannesburg SE 925 789 908 943 934
Ljubljana SE 9 6 6 7 8
London SE Group 3,613 3,266 3,397 4,429 4,013
Luxembourg SE 101 68 70 79 63
Malta SE 4 3 4 4 4
Mauritius SE 8 8 7 9 9
Moscow Exchange * 949 771 825 771 386
NASDAQ OMX Nordic Exchange 1,042 842 996 1,269 1,197
Oslo Borse 295 221 243 265 219
SIX Swiss Exchange 1,229 1,090 1,233 1,541 1,495
Tehran SE 87 107 91 346 117
Tel Aviv SE 228 157 162 203 201
Warsaw 190 138 177 205 NA
Wiener Borse 126 85 106 118 97
Note:* Moscow Exchange was established in December 2011 by merging the Moscow Interbank Currency Exchange (MICEX) and the Russian Trading System. Data prior to 2012 pertains to MICEX.
Source: World Federation of Exchanges.
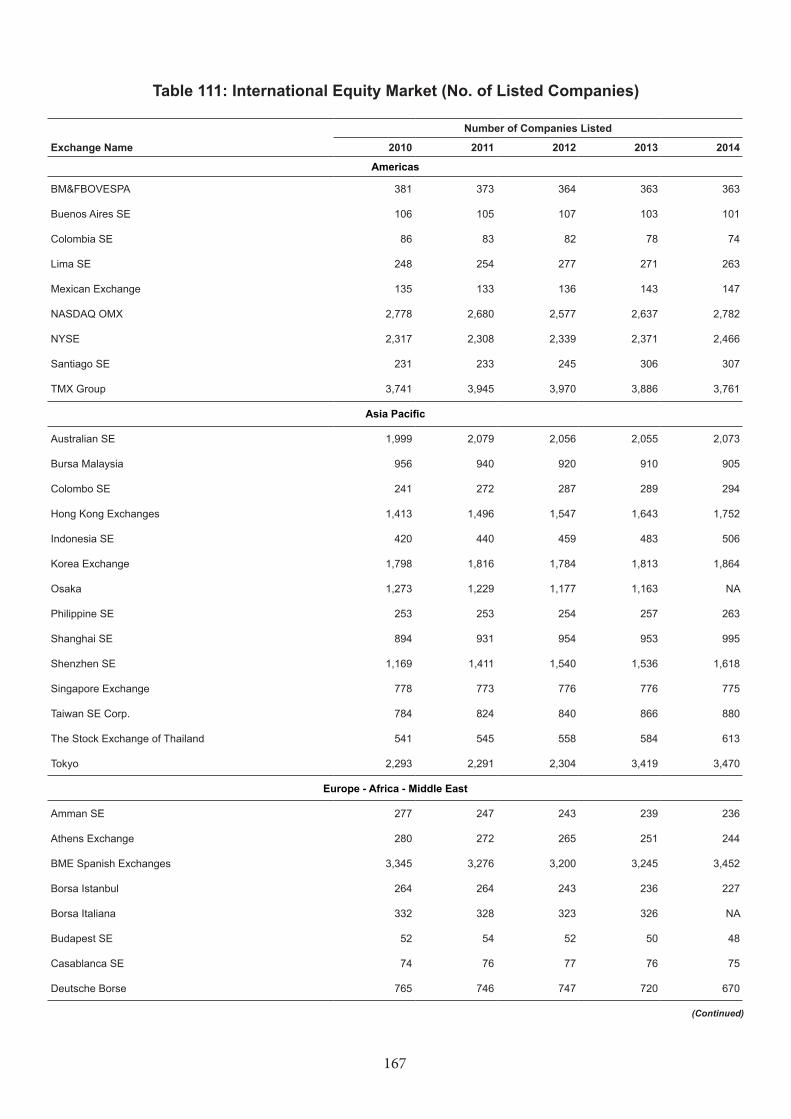
167
Table 111: International Equity Market (No. of Listed Companies)
Number of Companies Listed
Exchange Name 2010 2011 2012 2013 2014
Americas
BM&FBOVESPA 381 373 364 363 363
Buenos Aires SE 106 105 107 103 101
Colombia SE 86 83 82 78 74
Lima SE 248 254 277 271 263
Mexican Exchange 135 133 136 143 147
NASDAQ OMX 2,778 2,680 2,577 2,637 2,782
NYSE 2,317 2,308 2,339 2,371 2,466
Santiago SE 231 233 245 306 307
TMX Group 3,741 3,945 3,970 3,886 3,761
Asia Pacific
Australian SE 1,999 2,079 2,056 2,055 2,073
Bursa Malaysia 956 940 920 910 905
Colombo SE 241 272 287 289 294
Hong Kong Exchanges 1,413 1,496 1,547 1,643 1,752
Indonesia SE 420 440 459 483 506
Korea Exchange 1,798 1,816 1,784 1,813 1,864
Osaka 1,273 1,229 1,177 1,163 NA
Philippine SE 253 253 254 257 263
Shanghai SE 894 931 954 953 995
Shenzhen SE 1,169 1,411 1,540 1,536 1,618
Singapore Exchange 778 773 776 776 775
Taiwan SE Corp. 784 824 840 866 880
The Stock Exchange of Thailand 541 545 558 584 613
Tokyo 2,293 2,291 2,304 3,419 3,470
Europe - Africa - Middle East
Amman SE 277 247 243 239 236
Athens Exchange 280 272 265 251 244
BME Spanish Exchanges 3,345 3,276 3,200 3,245 3,452
Borsa Istanbul 264 264 243 236 227
Borsa Italiana 332 328 323 326 NA
Budapest SE 52 54 52 50 48
Casablanca SE 74 76 77 76 75
Deutsche Borse 765 746 747 720 670
(Continued)
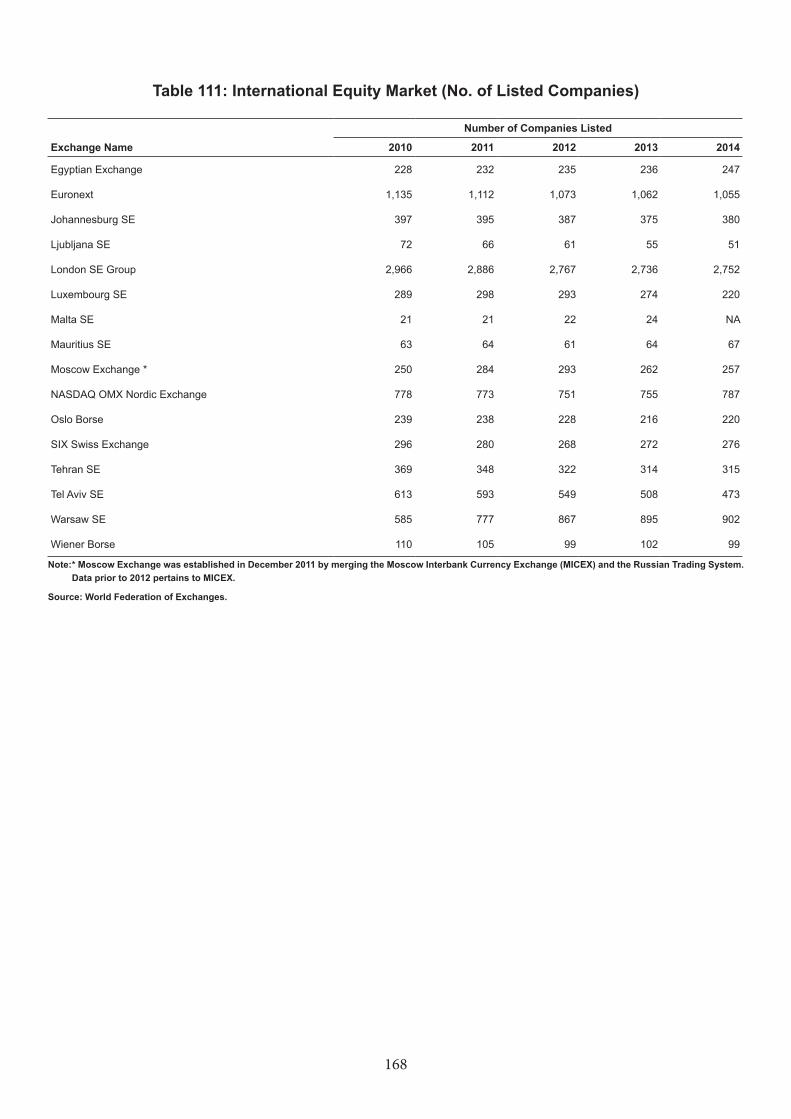
168
Number of Companies Listed
Exchange Name 2010 2011 2012 2013 2014
Egyptian Exchange 228 232 235 236 247
Euronext 1,135 1,112 1,073 1,062 1,055
Johannesburg SE 397 395 387 375 380
Ljubljana SE 72 66 61 55 51
London SE Group 2,966 2,886 2,767 2,736 2,752
Luxembourg SE 289 298 293 274 220
Malta SE 21 21 22 24 NA
Mauritius SE 63 64 61 64 67
Moscow Exchange * 250 284 293 262 257
NASDAQ OMX Nordic Exchange 778 773 751 755 787
Oslo Borse 239 238 228 216 220
SIX Swiss Exchange 296 280 268 272 276
Tehran SE 369 348 322 314 315
Tel Aviv SE 613 593 549 508 473
Warsaw SE 585 777 867 895 902
Wiener Borse 110 105 99 102 99
Note: * Moscow Exchange was established in December 2011 by merging the Moscow Interbank Currency Exchange (MICEX) and the Russian Trading System. Data prior to 2012 pertains to MICEX.
Source: World Federation of Exchanges.
Table 111: International Equity Market (No. of Listed Companies)
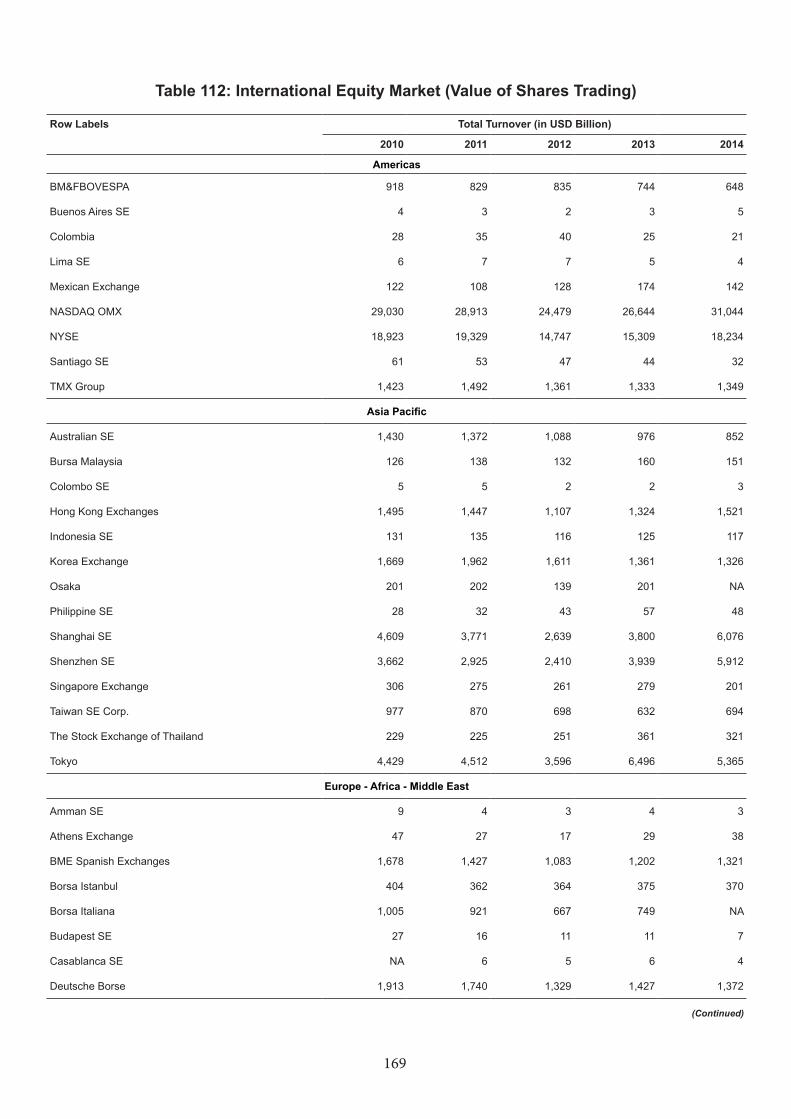
169
Table 112: International Equity Market (Value of Shares Trading)
Row Labels Total Turnover (in USD Billion)
2010 2011 2012 2013 2014
Americas
BM&FBOVESPA 918 829 835 744 648
Buenos Aires SE 4 3 2 3 5
Colombia 28 35 40 25 21
Lima SE 6 7 7 5 4
Mexican Exchange 122 108 128 174 142
NASDAQ OMX 29,030 28,913 24,479 26,644 31,044
NYSE 18,923 19,329 14,747 15,309 18,234
Santiago SE 61 53 47 44 32
TMX Group 1,423 1,492 1,361 1,333 1,349
Asia Pacific
Australian SE 1,430 1,372 1,088 976 852
Bursa Malaysia 126 138 132 160 151
Colombo SE 5 5 2 2 3
Hong Kong Exchanges 1,495 1,447 1,107 1,324 1,521
Indonesia SE 131 135 116 125 117
Korea Exchange 1,669 1,962 1,611 1,361 1,326
Osaka 201 202 139 201 NA
Philippine SE 28 32 43 57 48
Shanghai SE 4,609 3,771 2,639 3,800 6,076
Shenzhen SE 3,662 2,925 2,410 3,939 5,912
Singapore Exchange 306 275 261 279 201
Taiwan SE Corp. 977 870 698 632 694
The Stock Exchange of Thailand 229 225 251 361 321
Tokyo 4,429 4,512 3,596 6,496 5,365
Europe - Africa - Middle East
Amman SE 9 4 3 4 3
Athens Exchange 47 27 17 29 38
BME Spanish Exchanges 1,678 1,427 1,083 1,202 1,321
Borsa Istanbul 404 362 364 375 370
Borsa Italiana 1,005 921 667 749 NA
Budapest SE 27 16 11 11 7
Casablanca SE NA 6 5 6 4
Deutsche Borse 1,913 1,740 1,329 1,427 1,372
(Continued)
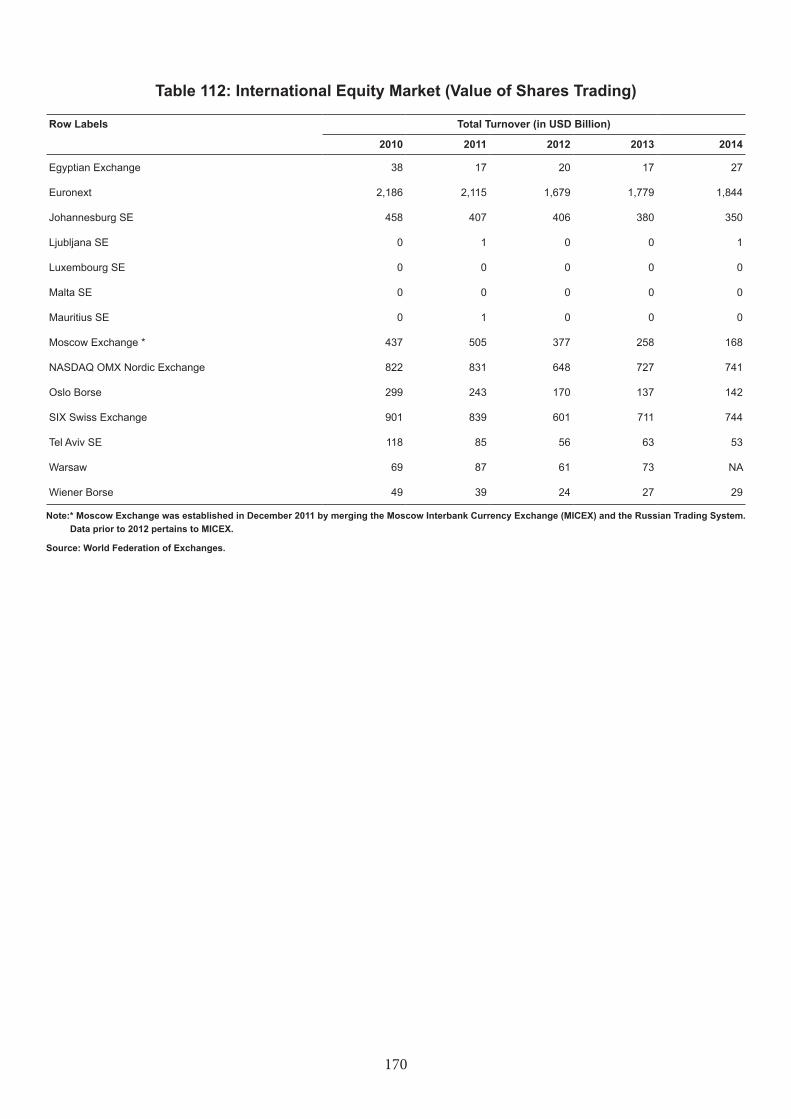
170
Row Labels Total Turnover (in USD Billion)
2010 2011 2012 2013 2014
Egyptian Exchange 38 17 20 17 27
Euronext 2,186 2,115 1,679 1,779 1,844
Johannesburg SE 458 407 406 380 350
Ljubljana SE 0 1 0 0 1
Luxembourg SE 0 0 0 0 0
Malta SE 0 0 0 0 0
Mauritius SE 0 1 0 0 0
Moscow Exchange * 437 505 377 258 168
NASDAQ OMX Nordic Exchange 822 831 648 727 741
Oslo Borse 299 243 170 137 142
SIX Swiss Exchange 901 839 601 711 744
Tel Aviv SE 118 85 56 63 53
Warsaw 69 87 61 73 NA
Wiener Borse 49 39 24 27 29
Note:* Moscow Exchange was established in December 2011 by merging the Moscow Interbank Currency Exchange (MICEX) and the Russian Trading System. Data prior to 2012 pertains to MICEX.
Source: World Federation of Exchanges.
Table 112: International Equity Market (Value of Shares Trading)

171
Table 113: International Equity Market (No. of Trading Days)
Exchange Name 2010 2011 2012 2013 2014
Americas
Bermuda SE 237 239 243 81 168
BM&FBOVESPA 247 249 246 248 248
Buenos Aires SE 246 245 241 241 241
Colombia 245 245 244 244 244
Lima SE 251 252 251 252 252
Mexican Exchange 253 257 248 248 230
NASDAQ OMX 252 252 250 252 252
NYSE 252 252 250 252 252
Santiago SE 249 252 247 248 249
TMX Group 251 250 250 250 250
Asia Pacific
Australian SE 253 252 253 253 253
Bursa Malaysia 248 245 245 247 246
Hong Kong Exchanges 249 246 247 244 247
Indonesia SE 245 247 246 244 242
Korea Exchange 251 248 248 247 245
Osaka 245 245 248 245 244
Philippine SE 244 249 244 242 242
Shanghai SE 242 244 243 238 245
Shenzhen SE 242 244 243 238 245
Singapore Exchange 252 253 251 251 252
The Stock Exchange of Thailand 242 244 245 245 245
Tokyo 245 245 248 245 244
Europe - Africa - Middle East
Amman SE 250 247 251 245 249
BME Spanish Exchanges 256 257 256 255 255
Borsa Istanbul 250 253 252 250 251
Borsa Italiana 254 255 253 252 NA
Deutsche Borse 256 257 254 253 252
Egyptian Exchange 247 207 245 243 244
Euronext 258 257 256 255 255
Johannesburg SE 251 249 250 250 249
Ljubljana SE 251 250 246 247 249
Luxembourg SE 254 252 252 251 253
Malta SE 248 250 246 231 250
Mauritius SE 252 247 247 250 249
Moscow Exchange * 248 248 255 250 231
NASDAQ OMX Nordic Exchange 255 256 254 253 253
Oslo Borse 252 253 250 249 250
SIX Swiss Exchange 254 254 250 249 249
Tel Aviv SE 244 244 245 244 245
Warsaw 253 251 249 247 NA
Wiener Borse 249 248 247 248 247 Note:* Moscow Exchange was established in December 2011 by merging the Moscow Interbank Currency Exchange (MICEX) and the Russian Trading System.
Data prior to 2012 pertains to MICEX.
Source: World Federation of Exchanges.
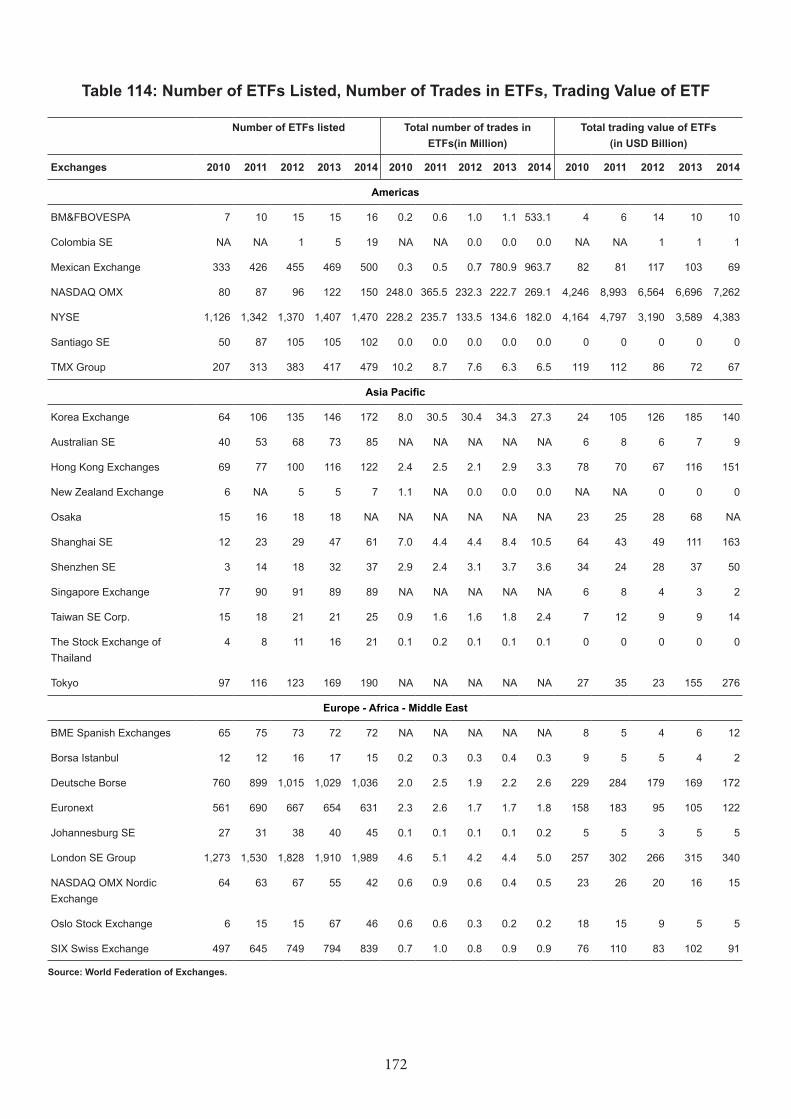
172
Table 114: Number of ETFs Listed, Number of Trades in ETFs, Trading Value of ETF
Number of ETFs listed Total number of trades in ETFs(in Million)
Total trading value of ETFs (in USD Billion)
Exchanges 2010 2011 2012 2013 2014 2010 2011 2012 2013 2014 2010 2011 2012 2013 2014
Americas
BM&FBOVESPA 7 10 15 15 16 0.2 0.6 1.0 1.1 533.1 4 6 14 10 10
Colombia SE NA NA 1 5 19 NA NA 0.0 0.0 0.0 NA NA 1 1 1
Mexican Exchange 333 426 455 469 500 0.3 0.5 0.7 780.9 963.7 82 81 117 103 69
NASDAQ OMX 80 87 96 122 150 248.0 365.5 232.3 222.7 269.1 4,246 8,993 6,564 6,696 7,262
NYSE 1,126 1,342 1,370 1,407 1,470 228.2 235.7 133.5 134.6 182.0 4,164 4,797 3,190 3,589 4,383
Santiago SE 50 87 105 105 102 0.0 0.0 0.0 0.0 0.0 0 0 0 0 0
TMX Group 207 313 383 417 479 10.2 8.7 7.6 6.3 6.5 119 112 86 72 67
Asia Pacific
Korea Exchange 64 106 135 146 172 8.0 30.5 30.4 34.3 27.3 24 105 126 185 140
Australian SE 40 53 68 73 85 NA NA NA NA NA 6 8 6 7 9
Hong Kong Exchanges 69 77 100 116 122 2.4 2.5 2.1 2.9 3.3 78 70 67 116 151
New Zealand Exchange 6 NA 5 5 7 1.1 NA 0.0 0.0 0.0 NA NA 0 0 0
Osaka 15 16 18 18 NA NA NA NA NA NA 23 25 28 68 NA
Shanghai SE 12 23 29 47 61 7.0 4.4 4.4 8.4 10.5 64 43 49 111 163
Shenzhen SE 3 14 18 32 37 2.9 2.4 3.1 3.7 3.6 34 24 28 37 50
Singapore Exchange 77 90 91 89 89 NA NA NA NA NA 6 8 4 3 2
Taiwan SE Corp. 15 18 21 21 25 0.9 1.6 1.6 1.8 2.4 7 12 9 9 14
The Stock Exchange of Thailand
4 8 11 16 21 0.1 0.2 0.1 0.1 0.1 0 0 0 0 0
Tokyo 97 116 123 169 190 NA NA NA NA NA 27 35 23 155 276
Europe - Africa - Middle East
BME Spanish Exchanges 65 75 73 72 72 NA NA NA NA NA 8 5 4 6 12
Borsa Istanbul 12 12 16 17 15 0.2 0.3 0.3 0.4 0.3 9 5 5 4 2
Deutsche Borse 760 899 1,015 1,029 1,036 2.0 2.5 1.9 2.2 2.6 229 284 179 169 172
Euronext 561 690 667 654 631 2.3 2.6 1.7 1.7 1.8 158 183 95 105 122
Johannesburg SE 27 31 38 40 45 0.1 0.1 0.1 0.1 0.2 5 5 3 5 5
London SE Group 1,273 1,530 1,828 1,910 1,989 4.6 5.1 4.2 4.4 5.0 257 302 266 315 340
NASDAQ OMX Nordic Exchange
64 63 67 55 42 0.6 0.9 0.6 0.4 0.5 23 26 20 16 15
Oslo Stock Exchange 6 15 15 67 46 0.6 0.6 0.3 0.2 0.2 18 15 9 5 5
SIX Swiss Exchange 497 645 749 794 839 0.7 1.0 0.8 0.9 0.9 76 110 83 102 91
Source: World Federation of Exchanges.
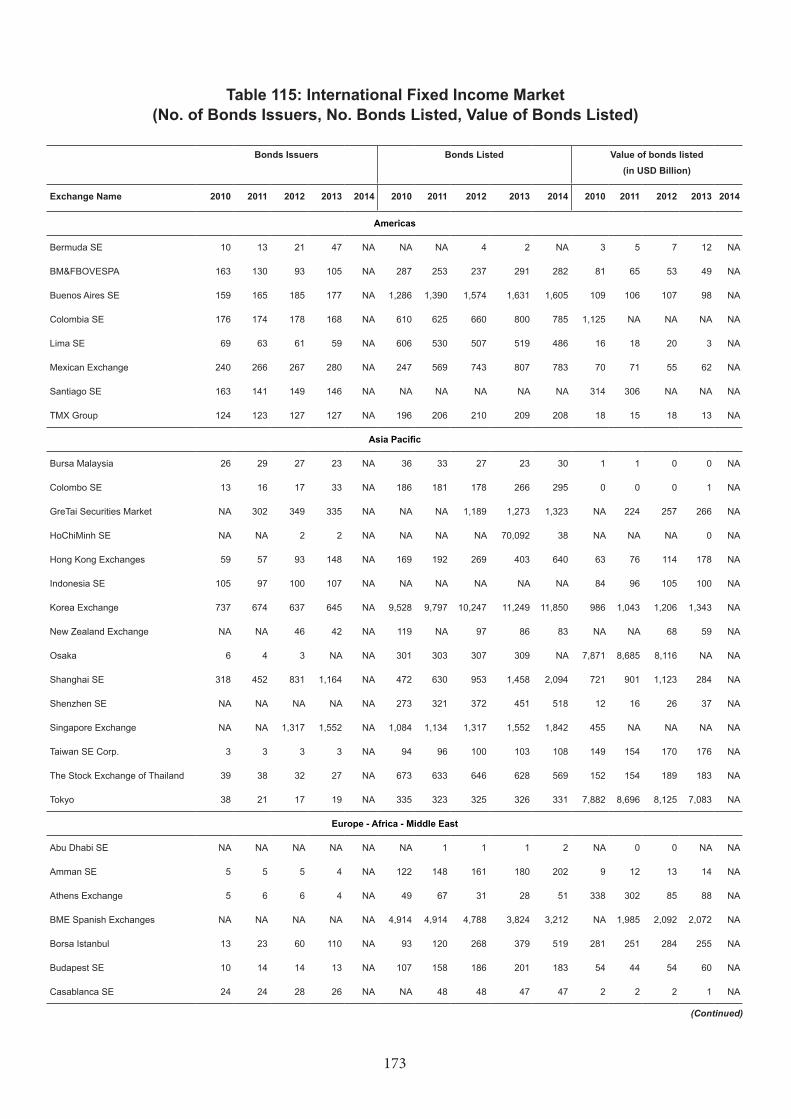
173
Table 115: International Fixed Income Market (No. of Bonds Issuers, No. Bonds Listed, Value of Bonds Listed)
Bonds Issuers Bonds Listed Value of bonds listed (in USD Billion)
Exchange Name 2010 2011 2012 2013 2014 2010 2011 2012 2013 2014 2010 2011 2012 2013 2014
Americas
Bermuda SE 10 13 21 47 NA NA NA 4 2 NA 3 5 7 12 NA
BM&FBOVESPA 163 130 93 105 NA 287 253 237 291 282 81 65 53 49 NA
Buenos Aires SE 159 165 185 177 NA 1,286 1,390 1,574 1,631 1,605 109 106 107 98 NA
Colombia SE 176 174 178 168 NA 610 625 660 800 785 1,125 NA NA NA NA
Lima SE 69 63 61 59 NA 606 530 507 519 486 16 18 20 3 NA
Mexican Exchange 240 266 267 280 NA 247 569 743 807 783 70 71 55 62 NA
Santiago SE 163 141 149 146 NA NA NA NA NA NA 314 306 NA NA NA
TMX Group 124 123 127 127 NA 196 206 210 209 208 18 15 18 13 NA
Asia Pacific
Bursa Malaysia 26 29 27 23 NA 36 33 27 23 30 1 1 0 0 NA
Colombo SE 13 16 17 33 NA 186 181 178 266 295 0 0 0 1 NA
GreTai Securities Market NA 302 349 335 NA NA NA 1,189 1,273 1,323 NA 224 257 266 NA
HoChiMinh SE NA NA 2 2 NA NA NA NA 70,092 38 NA NA NA 0 NA
Hong Kong Exchanges 59 57 93 148 NA 169 192 269 403 640 63 76 114 178 NA
Indonesia SE 105 97 100 107 NA NA NA NA NA NA 84 96 105 100 NA
Korea Exchange 737 674 637 645 NA 9,528 9,797 10,247 11,249 11,850 986 1,043 1,206 1,343 NA
New Zealand Exchange NA NA 46 42 NA 119 NA 97 86 83 NA NA 68 59 NA
Osaka 6 4 3 NA NA 301 303 307 309 NA 7,871 8,685 8,116 NA NA
Shanghai SE 318 452 831 1,164 NA 472 630 953 1,458 2,094 721 901 1,123 284 NA
Shenzhen SE NA NA NA NA NA 273 321 372 451 518 12 16 26 37 NA
Singapore Exchange NA NA 1,317 1,552 NA 1,084 1,134 1,317 1,552 1,842 455 NA NA NA NA
Taiwan SE Corp. 3 3 3 3 NA 94 96 100 103 108 149 154 170 176 NA
The Stock Exchange of Thailand 39 38 32 27 NA 673 633 646 628 569 152 154 189 183 NA
Tokyo 38 21 17 19 NA 335 323 325 326 331 7,882 8,696 8,125 7,083 NA
Europe - Africa - Middle East
Abu Dhabi SE NA NA NA NA NA NA 1 1 1 2 NA 0 0 NA NA
Amman SE 5 5 5 4 NA 122 148 161 180 202 9 12 13 14 NA
Athens Exchange 5 6 6 4 NA 49 67 31 28 51 338 302 85 88 NA
BME Spanish Exchanges NA NA NA NA NA 4,914 4,914 4,788 3,824 3,212 NA 1,985 2,092 2,072 NA
Borsa Istanbul 13 23 60 110 NA 93 120 268 379 519 281 251 284 255 NA
Budapest SE 10 14 14 13 NA 107 158 186 201 183 54 44 54 60 NA
Casablanca SE 24 24 28 26 NA NA 48 48 47 47 2 2 2 1 NA
(Continued)
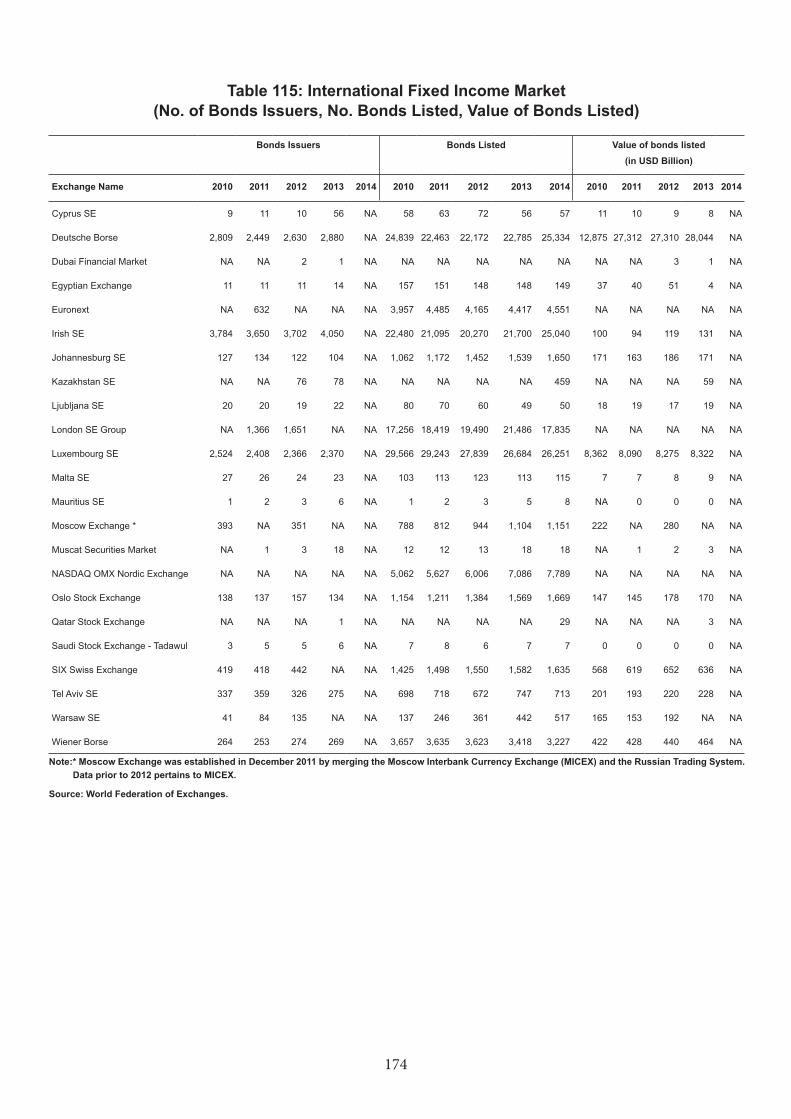
174
Bonds Issuers Bonds Listed Value of bonds listed (in USD Billion)
Exchange Name 2010 2011 2012 2013 2014 2010 2011 2012 2013 2014 2010 2011 2012 2013 2014
Cyprus SE 9 11 10 56 NA 58 63 72 56 57 11 10 9 8 NA
Deutsche Borse 2,809 2,449 2,630 2,880 NA 24,839 22,463 22,172 22,785 25,334 12,875 27,312 27,310 28,044 NA
Dubai Financial Market NA NA 2 1 NA NA NA NA NA NA NA NA 3 1 NA
Egyptian Exchange 11 11 11 14 NA 157 151 148 148 149 37 40 51 4 NA
Euronext NA 632 NA NA NA 3,957 4,485 4,165 4,417 4,551 NA NA NA NA NA
Irish SE 3,784 3,650 3,702 4,050 NA 22,480 21,095 20,270 21,700 25,040 100 94 119 131 NA
Johannesburg SE 127 134 122 104 NA 1,062 1,172 1,452 1,539 1,650 171 163 186 171 NA
Kazakhstan SE NA NA 76 78 NA NA NA NA NA 459 NA NA NA 59 NA
Ljubljana SE 20 20 19 22 NA 80 70 60 49 50 18 19 17 19 NA
London SE Group NA 1,366 1,651 NA NA 17,256 18,419 19,490 21,486 17,835 NA NA NA NA NA
Luxembourg SE 2,524 2,408 2,366 2,370 NA 29,566 29,243 27,839 26,684 26,251 8,362 8,090 8,275 8,322 NA
Malta SE 27 26 24 23 NA 103 113 123 113 115 7 7 8 9 NA
Mauritius SE 1 2 3 6 NA 1 2 3 5 8 NA 0 0 0 NA
Moscow Exchange * 393 NA 351 NA NA 788 812 944 1,104 1,151 222 NA 280 NA NA
Muscat Securities Market NA 1 3 18 NA 12 12 13 18 18 NA 1 2 3 NA
NASDAQ OMX Nordic Exchange NA NA NA NA NA 5,062 5,627 6,006 7,086 7,789 NA NA NA NA NA
Oslo Stock Exchange 138 137 157 134 NA 1,154 1,211 1,384 1,569 1,669 147 145 178 170 NA
Qatar Stock Exchange NA NA NA 1 NA NA NA NA NA 29 NA NA NA 3 NA
Saudi Stock Exchange - Tadawul 3 5 5 6 NA 7 8 6 7 7 0 0 0 0 NA
SIX Swiss Exchange 419 418 442 NA NA 1,425 1,498 1,550 1,582 1,635 568 619 652 636 NA
Tel Aviv SE 337 359 326 275 NA 698 718 672 747 713 201 193 220 228 NA
Warsaw SE 41 84 135 NA NA 137 246 361 442 517 165 153 192 NA NA
Wiener Borse 264 253 274 269 NA 3,657 3,635 3,623 3,418 3,227 422 428 440 464 NA
Note:* Moscow Exchange was established in December 2011 by merging the Moscow Interbank Currency Exchange (MICEX) and the Russian Trading System. Data prior to 2012 pertains to MICEX.
Source: World Federation of Exchanges.
Table 115: International Fixed Income Market (No. of Bonds Issuers, No. Bonds Listed, Value of Bonds Listed)
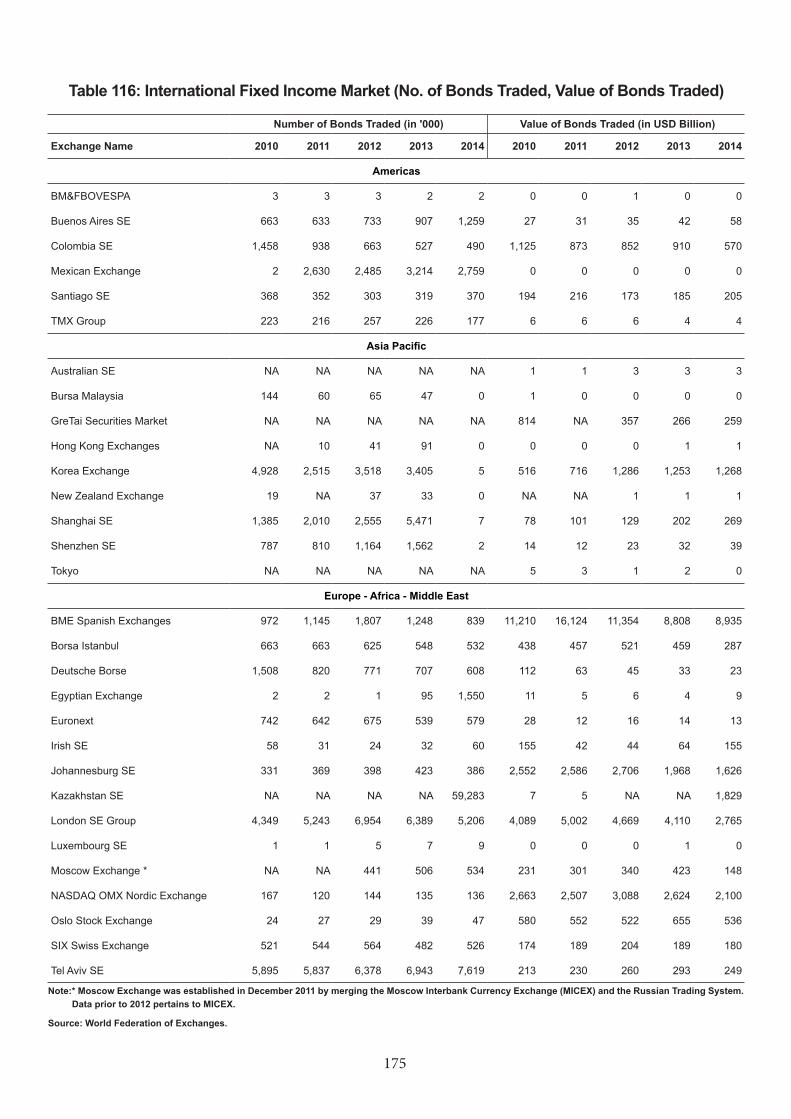
175
Table 116: International Fixed Income Market (No. of Bonds Traded, Value of Bonds Traded)
Number of Bonds Traded (in '000) Value of Bonds Traded (in USD Billion)
Exchange Name 2010 2011 2012 2013 2014 2010 2011 2012 2013 2014
Americas
BM&FBOVESPA 3 3 3 2 2 0 0 1 0 0
Buenos Aires SE 663 633 733 907 1,259 27 31 35 42 58
Colombia SE 1,458 938 663 527 490 1,125 873 852 910 570
Mexican Exchange 2 2,630 2,485 3,214 2,759 0 0 0 0 0
Santiago SE 368 352 303 319 370 194 216 173 185 205
TMX Group 223 216 257 226 177 6 6 6 4 4
Asia Pacific
Australian SE NA NA NA NA NA 1 1 3 3 3
Bursa Malaysia 144 60 65 47 0 1 0 0 0 0
GreTai Securities Market NA NA NA NA NA 814 NA 357 266 259
Hong Kong Exchanges NA 10 41 91 0 0 0 0 1 1
Korea Exchange 4,928 2,515 3,518 3,405 5 516 716 1,286 1,253 1,268
New Zealand Exchange 19 NA 37 33 0 NA NA 1 1 1
Shanghai SE 1,385 2,010 2,555 5,471 7 78 101 129 202 269
Shenzhen SE 787 810 1,164 1,562 2 14 12 23 32 39
Tokyo NA NA NA NA NA 5 3 1 2 0
Europe - Africa - Middle East
BME Spanish Exchanges 972 1,145 1,807 1,248 839 11,210 16,124 11,354 8,808 8,935
Borsa Istanbul 663 663 625 548 532 438 457 521 459 287
Deutsche Borse 1,508 820 771 707 608 112 63 45 33 23
Egyptian Exchange 2 2 1 95 1,550 11 5 6 4 9
Euronext 742 642 675 539 579 28 12 16 14 13
Irish SE 58 31 24 32 60 155 42 44 64 155
Johannesburg SE 331 369 398 423 386 2,552 2,586 2,706 1,968 1,626
Kazakhstan SE NA NA NA NA 59,283 7 5 NA NA 1,829
London SE Group 4,349 5,243 6,954 6,389 5,206 4,089 5,002 4,669 4,110 2,765
Luxembourg SE 1 1 5 7 9 0 0 0 1 0
Moscow Exchange * NA NA 441 506 534 231 301 340 423 148
NASDAQ OMX Nordic Exchange 167 120 144 135 136 2,663 2,507 3,088 2,624 2,100
Oslo Stock Exchange 24 27 29 39 47 580 552 522 655 536
SIX Swiss Exchange 521 544 564 482 526 174 189 204 189 180
Tel Aviv SE 5,895 5,837 6,378 6,943 7,619 213 230 260 293 249
Note:* Moscow Exchange was established in December 2011 by merging the Moscow Interbank Currency Exchange (MICEX) and the Russian Trading System. Data prior to 2012 pertains to MICEX.
Source: World Federation of Exchanges.
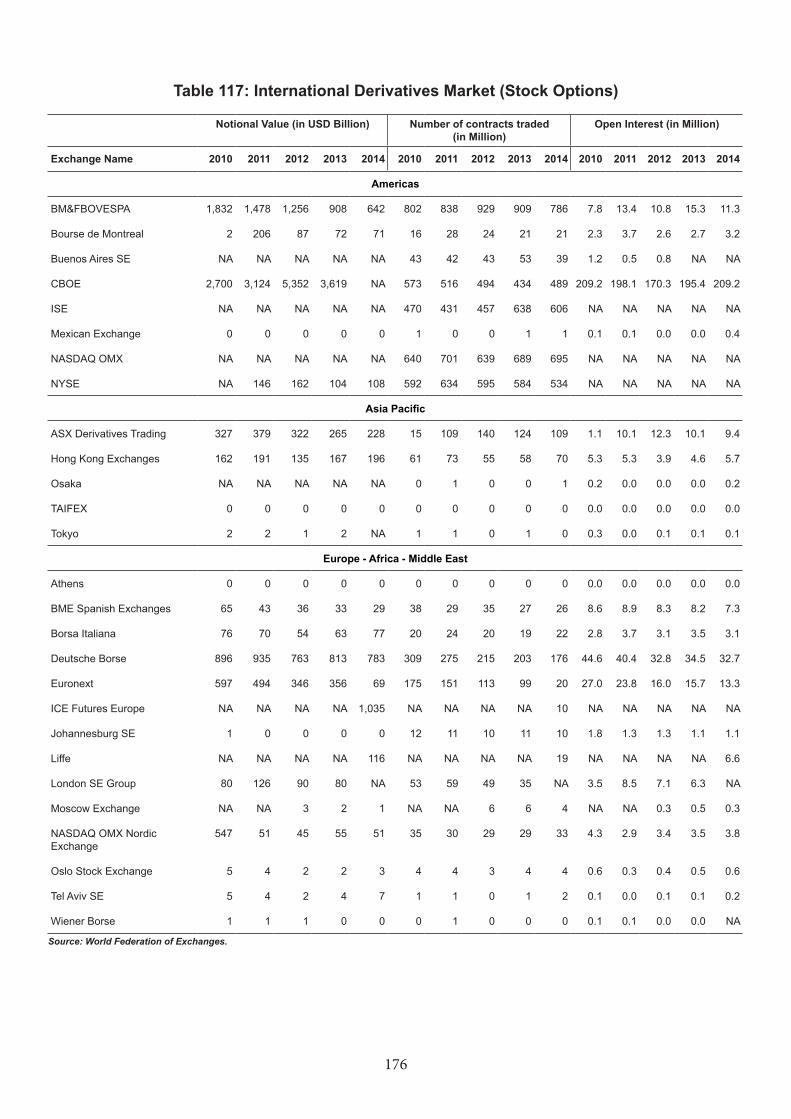
176
Table 117: International Derivatives Market (Stock Options)
Notional Value (in USD Billion) Number of contracts traded (in Million)
Open Interest (in Million)
Exchange Name 2010 2011 2012 2013 2014 2010 2011 2012 2013 2014 2010 2011 2012 2013 2014
Americas
BM&FBOVESPA 1,832 1,478 1,256 908 642 802 838 929 909 786 7.8 13.4 10.8 15.3 11.3
Bourse de Montreal 2 206 87 72 71 16 28 24 21 21 2.3 3.7 2.6 2.7 3.2
Buenos Aires SE NA NA NA NA NA 43 42 43 53 39 1.2 0.5 0.8 NA NA
CBOE 2,700 3,124 5,352 3,619 NA 573 516 494 434 489 209.2 198.1 170.3 195.4 209.2
ISE NA NA NA NA NA 470 431 457 638 606 NA NA NA NA NA
Mexican Exchange 0 0 0 0 0 1 0 0 1 1 0.1 0.1 0.0 0.0 0.4
NASDAQ OMX NA NA NA NA NA 640 701 639 689 695 NA NA NA NA NA
NYSE NA 146 162 104 108 592 634 595 584 534 NA NA NA NA NA
Asia Pacific
ASX Derivatives Trading 327 379 322 265 228 15 109 140 124 109 1.1 10.1 12.3 10.1 9.4
Hong Kong Exchanges 162 191 135 167 196 61 73 55 58 70 5.3 5.3 3.9 4.6 5.7
Osaka NA NA NA NA NA 0 1 0 0 1 0.2 0.0 0.0 0.0 0.2
TAIFEX 0 0 0 0 0 0 0 0 0 0 0.0 0.0 0.0 0.0 0.0
Tokyo 2 2 1 2 NA 1 1 0 1 0 0.3 0.0 0.1 0.1 0.1
Europe - Africa - Middle East
Athens 0 0 0 0 0 0 0 0 0 0 0.0 0.0 0.0 0.0 0.0
BME Spanish Exchanges 65 43 36 33 29 38 29 35 27 26 8.6 8.9 8.3 8.2 7.3
Borsa Italiana 76 70 54 63 77 20 24 20 19 22 2.8 3.7 3.1 3.5 3.1
Deutsche Borse 896 935 763 813 783 309 275 215 203 176 44.6 40.4 32.8 34.5 32.7
Euronext 597 494 346 356 69 175 151 113 99 20 27.0 23.8 16.0 15.7 13.3
ICE Futures Europe NA NA NA NA 1,035 NA NA NA NA 10 NA NA NA NA NA
Johannesburg SE 1 0 0 0 0 12 11 10 11 10 1.8 1.3 1.3 1.1 1.1
Liffe NA NA NA NA 116 NA NA NA NA 19 NA NA NA NA 6.6
London SE Group 80 126 90 80 NA 53 59 49 35 NA 3.5 8.5 7.1 6.3 NA
Moscow Exchange NA NA 3 2 1 NA NA 6 6 4 NA NA 0.3 0.5 0.3
NASDAQ OMX Nordic Exchange
547 51 45 55 51 35 30 29 29 33 4.3 2.9 3.4 3.5 3.8
Oslo Stock Exchange 5 4 2 2 3 4 4 3 4 4 0.6 0.3 0.4 0.5 0.6
Tel Aviv SE 5 4 2 4 7 1 1 0 1 2 0.1 0.0 0.1 0.1 0.2
Wiener Borse 1 1 1 0 0 0 1 0 0 0 0.1 0.1 0.0 0.0 NA
Source: World Federation of Exchanges.

177
Table 118: International Derivatives Market (Stock Futures)
Notional Value (in USD Billion) Number of contracts traded (in Million)
Open Interest (in Million)
Exchange Name 2010 2011 2012 2013 2014 2010 2011 2012 2013 2014 2010 2011 2012 2013 2014
Americas
Colombia SE 0 0 0 0 1 0 0 0 0 0 0.1 0.0 0.0 0.0 0.1
Mexican Exchange 0 0 0 0 0 0 0 0 0 0 0.0 0.0 NA 0.0 0.0
One Chicago NA NA NA NA NA 5 4 5 7 NA NA NA NA NA NA
Asia Pacific
ASX Derivatives Trading 7 6 7 11 11 1 3 5 6 7 0.1 0.9 1.0 1.0 1.2
Hong Kong Exchanges 1 2 1 1 1 0 0 0 0 0 0.0 0.0 0.0 0.0 0.0
Korea Exchange 19 31 56 59 60 45 60 100 96 96 0.5 0.3 0.8 0.8 1.0
TAIFEX 2 5 13 23 50 1 2 5 5 10 0.0 0.0 0.1 0.1 0.1
Thailand Futures Exchange 0 NA NA NA NA 1 2 2 8 20 0.0 0.0 0.2 0.3 0.7
Europe - Africa - Middle East
Athens Exchange 4 3 3 3 4 5 8 13 7 19 0.2 0.3 0.3 0.1 0.2
Athens Exchange 4 3 3 3 4 5 8 13 7 19 0.2 0.3 0.3 0.1 0.2
BME Spanish Exchanges 31 39 21 16 18 20 28 21 15 13 1.7 1.9 1.3 0.9 0.5
Borsa Italiana 49 40 18 4 2 13 11 6 1 1 0.0 0.1 0.0 0.0 0.0
Budapest SE 6 3 2 3 2 1 1 1 1 1 0.0 0.0 0.0 0.0 0.0
Deutsche Borse 542 753 523 785 571 202 174 196 179 124 2.5 3.3 4.9 3.1 4.2
Euronext 996 866 733 476 13 289 250 247 130 4 4.1 3.7 4.9 3.1 0.0
ICE Futures Europe NA NA NA NA 243 NA NA NA NA 63 NA NA NA NA NA
Johannesburg SE 42 25 30 16 17 79 51 29 26 20 7.0 3.3 2.9 1.9 1.0
Liffe NA NA NA NA 289 NA NA NA NA 86 NA NA NA NA 3.8
London SE Group 49 43 18 4 NA 13 12 6 2 NA 0.3 0.3 0.2 0.7 NA
Moscow Exchange * 6 4 92 79 56 13 7 241 234 343 0.1 0.0 1.5 2.3 1.6
NASDAQ OMX Nordic Exchange
25 4 2 5 4 4 4 2 4 3 0.4 0.3 0.1 0.2 0.3
Oslo Stock Exchange 2 2 1 2 2 1 2 2 4 3 0.3 0.2 0.2 0.5 0.3
Warsaw SE 1 2 1 2 2 0 1 1 1 1 0.0 0.0 0.0 0.0 0.0
Wiener Borse 0 0 0 0 NA 0 0 0 0 NA 0.0 NA NA NA NA
Note:* Moscow Exchange was established in December 2011 by merging the Moscow Interbank Currency Exchange (MICEX) and the Rus-sian Trading System. Data prior to 2012 pertains to MICEX.
Source: World Federation of Exchanges.
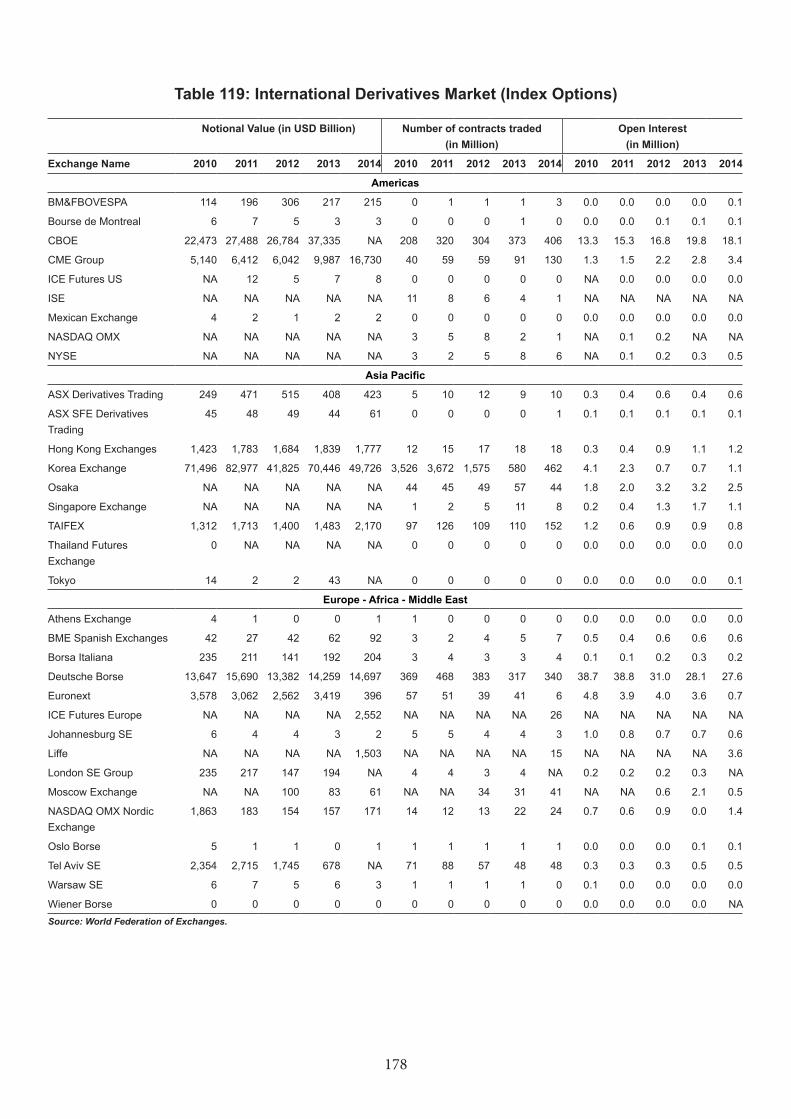
178
Table 119: International Derivatives Market (Index Options)
Notional Value (in USD Billion) Number of contracts traded (in Million)
Open Interest (in Million)
Exchange Name 2010 2011 2012 2013 2014 2010 2011 2012 2013 2014 2010 2011 2012 2013 2014
Americas
BM&FBOVESPA 114 196 306 217 215 0 1 1 1 3 0.0 0.0 0.0 0.0 0.1
Bourse de Montreal 6 7 5 3 3 0 0 0 1 0 0.0 0.0 0.1 0.1 0.1
CBOE 22,473 27,488 26,784 37,335 NA 208 320 304 373 406 13.3 15.3 16.8 19.8 18.1
CME Group 5,140 6,412 6,042 9,987 16,730 40 59 59 91 130 1.3 1.5 2.2 2.8 3.4
ICE Futures US NA 12 5 7 8 0 0 0 0 0 NA 0.0 0.0 0.0 0.0
ISE NA NA NA NA NA 11 8 6 4 1 NA NA NA NA NA
Mexican Exchange 4 2 1 2 2 0 0 0 0 0 0.0 0.0 0.0 0.0 0.0
NASDAQ OMX NA NA NA NA NA 3 5 8 2 1 NA 0.1 0.2 NA NA
NYSE NA NA NA NA NA 3 2 5 8 6 NA 0.1 0.2 0.3 0.5
Asia Pacific
ASX Derivatives Trading 249 471 515 408 423 5 10 12 9 10 0.3 0.4 0.6 0.4 0.6
ASX SFE Derivatives Trading
45 48 49 44 61 0 0 0 0 1 0.1 0.1 0.1 0.1 0.1
Hong Kong Exchanges 1,423 1,783 1,684 1,839 1,777 12 15 17 18 18 0.3 0.4 0.9 1.1 1.2
Korea Exchange 71,496 82,977 41,825 70,446 49,726 3,526 3,672 1,575 580 462 4.1 2.3 0.7 0.7 1.1
Osaka NA NA NA NA NA 44 45 49 57 44 1.8 2.0 3.2 3.2 2.5
Singapore Exchange NA NA NA NA NA 1 2 5 11 8 0.2 0.4 1.3 1.7 1.1
TAIFEX 1,312 1,713 1,400 1,483 2,170 97 126 109 110 152 1.2 0.6 0.9 0.9 0.8
Thailand Futures Exchange
0 NA NA NA NA 0 0 0 0 0 0.0 0.0 0.0 0.0 0.0
Tokyo 14 2 2 43 NA 0 0 0 0 0 0.0 0.0 0.0 0.0 0.1
Europe - Africa - Middle East
Athens Exchange 4 1 0 0 1 1 0 0 0 0 0.0 0.0 0.0 0.0 0.0
BME Spanish Exchanges 42 27 42 62 92 3 2 4 5 7 0.5 0.4 0.6 0.6 0.6
Borsa Italiana 235 211 141 192 204 3 4 3 3 4 0.1 0.1 0.2 0.3 0.2
Deutsche Borse 13,647 15,690 13,382 14,259 14,697 369 468 383 317 340 38.7 38.8 31.0 28.1 27.6
Euronext 3,578 3,062 2,562 3,419 396 57 51 39 41 6 4.8 3.9 4.0 3.6 0.7
ICE Futures Europe NA NA NA NA 2,552 NA NA NA NA 26 NA NA NA NA NA
Johannesburg SE 6 4 4 3 2 5 5 4 4 3 1.0 0.8 0.7 0.7 0.6
Liffe NA NA NA NA 1,503 NA NA NA NA 15 NA NA NA NA 3.6
London SE Group 235 217 147 194 NA 4 4 3 4 NA 0.2 0.2 0.2 0.3 NA
Moscow Exchange NA NA 100 83 61 NA NA 34 31 41 NA NA 0.6 2.1 0.5
NASDAQ OMX Nordic Exchange
1,863 183 154 157 171 14 12 13 22 24 0.7 0.6 0.9 0.0 1.4
Oslo Borse 5 1 1 0 1 1 1 1 1 1 0.0 0.0 0.0 0.1 0.1
Tel Aviv SE 2,354 2,715 1,745 678 NA 71 88 57 48 48 0.3 0.3 0.3 0.5 0.5
Warsaw SE 6 7 5 6 3 1 1 1 1 0 0.1 0.0 0.0 0.0 0.0
Wiener Borse 0 0 0 0 0 0 0 0 0 0 0.0 0.0 0.0 0.0 NA Source: World Federation of Exchanges.
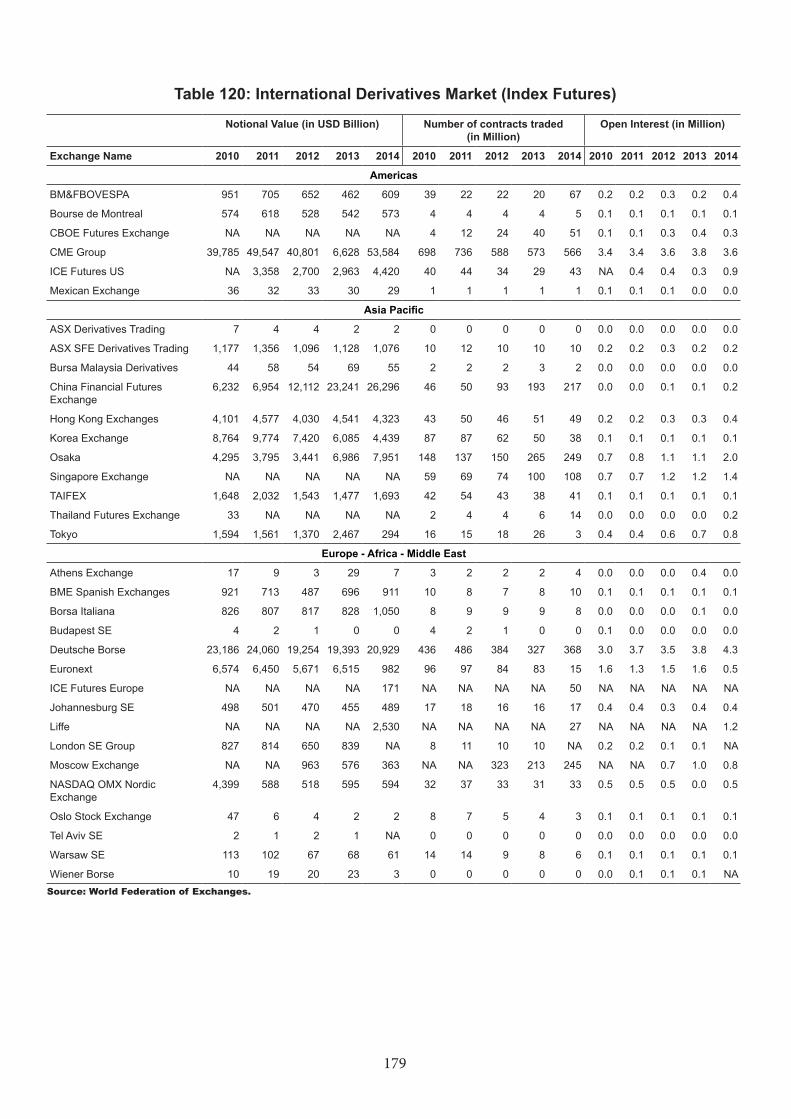
179
Table 120: International Derivatives Market (Index Futures)
Notional Value (in USD Billion) Number of contracts traded (in Million)
Open Interest (in Million)
Exchange Name 2010 2011 2012 2013 2014 2010 2011 2012 2013 2014 2010 2011 2012 2013 2014
Americas
BM&FBOVESPA 951 705 652 462 609 39 22 22 20 67 0.2 0.2 0.3 0.2 0.4
Bourse de Montreal 574 618 528 542 573 4 4 4 4 5 0.1 0.1 0.1 0.1 0.1
CBOE Futures Exchange NA NA NA NA NA 4 12 24 40 51 0.1 0.1 0.3 0.4 0.3
CME Group 39,785 49,547 40,801 6,628 53,584 698 736 588 573 566 3.4 3.4 3.6 3.8 3.6
ICE Futures US NA 3,358 2,700 2,963 4,420 40 44 34 29 43 NA 0.4 0.4 0.3 0.9
Mexican Exchange 36 32 33 30 29 1 1 1 1 1 0.1 0.1 0.1 0.0 0.0
Asia Pacific
ASX Derivatives Trading 7 4 4 2 2 0 0 0 0 0 0.0 0.0 0.0 0.0 0.0
ASX SFE Derivatives Trading 1,177 1,356 1,096 1,128 1,076 10 12 10 10 10 0.2 0.2 0.3 0.2 0.2
Bursa Malaysia Derivatives 44 58 54 69 55 2 2 2 3 2 0.0 0.0 0.0 0.0 0.0
China Financial Futures Exchange
6,232 6,954 12,112 23,241 26,296 46 50 93 193 217 0.0 0.0 0.1 0.1 0.2
Hong Kong Exchanges 4,101 4,577 4,030 4,541 4,323 43 50 46 51 49 0.2 0.2 0.3 0.3 0.4
Korea Exchange 8,764 9,774 7,420 6,085 4,439 87 87 62 50 38 0.1 0.1 0.1 0.1 0.1
Osaka 4,295 3,795 3,441 6,986 7,951 148 137 150 265 249 0.7 0.8 1.1 1.1 2.0
Singapore Exchange NA NA NA NA NA 59 69 74 100 108 0.7 0.7 1.2 1.2 1.4
TAIFEX 1,648 2,032 1,543 1,477 1,693 42 54 43 38 41 0.1 0.1 0.1 0.1 0.1
Thailand Futures Exchange 33 NA NA NA NA 2 4 4 6 14 0.0 0.0 0.0 0.0 0.2
Tokyo 1,594 1,561 1,370 2,467 294 16 15 18 26 3 0.4 0.4 0.6 0.7 0.8
Europe - Africa - Middle East
Athens Exchange 17 9 3 29 7 3 2 2 2 4 0.0 0.0 0.0 0.4 0.0
BME Spanish Exchanges 921 713 487 696 911 10 8 7 8 10 0.1 0.1 0.1 0.1 0.1
Borsa Italiana 826 807 817 828 1,050 8 9 9 9 8 0.0 0.0 0.0 0.1 0.0
Budapest SE 4 2 1 0 0 4 2 1 0 0 0.1 0.0 0.0 0.0 0.0
Deutsche Borse 23,186 24,060 19,254 19,393 20,929 436 486 384 327 368 3.0 3.7 3.5 3.8 4.3
Euronext 6,574 6,450 5,671 6,515 982 96 97 84 83 15 1.6 1.3 1.5 1.6 0.5
ICE Futures Europe NA NA NA NA 171 NA NA NA NA 50 NA NA NA NA NA
Johannesburg SE 498 501 470 455 489 17 18 16 16 17 0.4 0.4 0.3 0.4 0.4
Liffe NA NA NA NA 2,530 NA NA NA NA 27 NA NA NA NA 1.2
London SE Group 827 814 650 839 NA 8 11 10 10 NA 0.2 0.2 0.1 0.1 NA
Moscow Exchange NA NA 963 576 363 NA NA 323 213 245 NA NA 0.7 1.0 0.8
NASDAQ OMX Nordic Exchange
4,399 588 518 595 594 32 37 33 31 33 0.5 0.5 0.5 0.0 0.5
Oslo Stock Exchange 47 6 4 2 2 8 7 5 4 3 0.1 0.1 0.1 0.1 0.1
Tel Aviv SE 2 1 2 1 NA 0 0 0 0 0 0.0 0.0 0.0 0.0 0.0
Warsaw SE 113 102 67 68 61 14 14 9 8 6 0.1 0.1 0.1 0.1 0.1
Wiener Borse 10 19 20 23 3 0 0 0 0 0 0.0 0.1 0.1 0.1 NASource: World Federation of Exchanges.
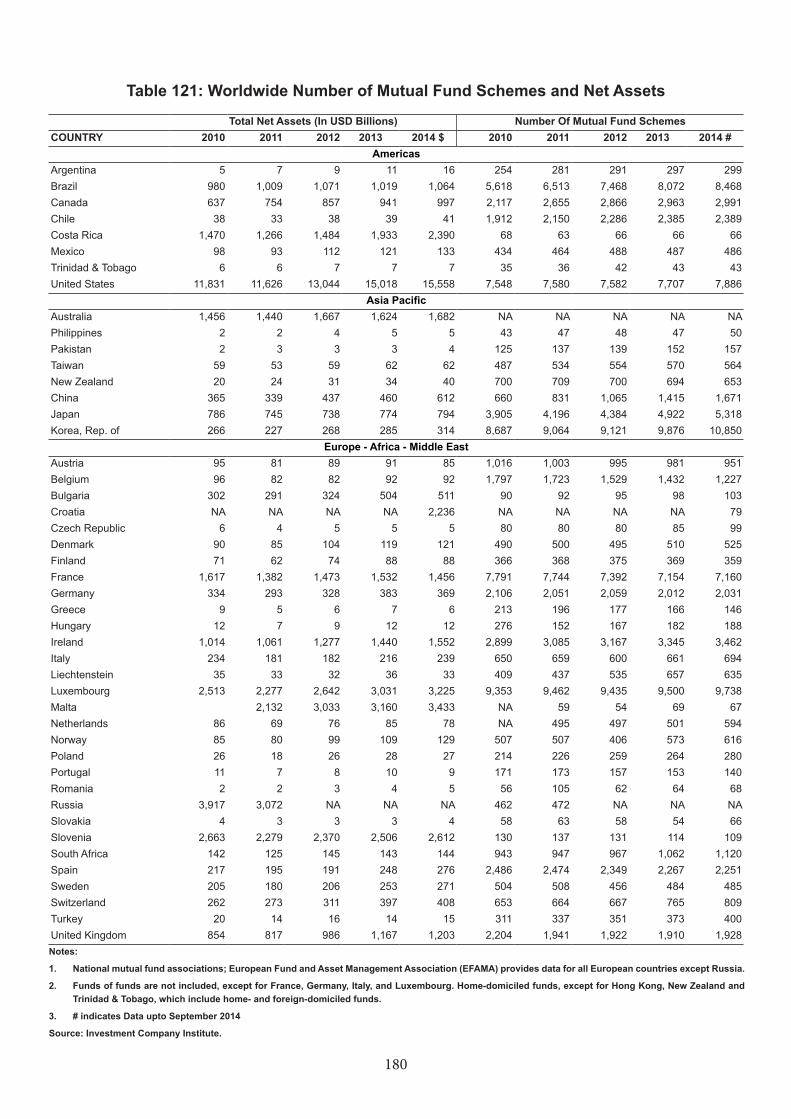
180
Table 121: Worldwide Number of Mutual Fund Schemes and Net Assets
Total Net Assets (In USD Billions) Number Of Mutual Fund SchemesCOUNTRY 2010 2011 2012 2013 2014 $ 2010 2011 2012 2013 2014 #
AmericasArgentina 5 7 9 11 16 254 281 291 297 299 Brazil 980 1,009 1,071 1,019 1,064 5,618 6,513 7,468 8,072 8,468 Canada 637 754 857 941 997 2,117 2,655 2,866 2,963 2,991 Chile 38 33 38 39 41 1,912 2,150 2,286 2,385 2,389 Costa Rica 1,470 1,266 1,484 1,933 2,390 68 63 66 66 66 Mexico 98 93 112 121 133 434 464 488 487 486 Trinidad & Tobago 6 6 7 7 7 35 36 42 43 43 United States 11,831 11,626 13,044 15,018 15,558 7,548 7,580 7,582 7,707 7,886
Asia PacificAustralia 1,456 1,440 1,667 1,624 1,682 NA NA NA NA NA Philippines 2 2 4 5 5 43 47 48 47 50 Pakistan 2 3 3 3 4 125 137 139 152 157 Taiwan 59 53 59 62 62 487 534 554 570 564 New Zealand 20 24 31 34 40 700 709 700 694 653 China 365 339 437 460 612 660 831 1,065 1,415 1,671 Japan 786 745 738 774 794 3,905 4,196 4,384 4,922 5,318 Korea, Rep. of 266 227 268 285 314 8,687 9,064 9,121 9,876 10,850
Europe - Africa - Middle EastAustria 95 81 89 91 85 1,016 1,003 995 981 951 Belgium 96 82 82 92 92 1,797 1,723 1,529 1,432 1,227 Bulgaria 302 291 324 504 511 90 92 95 98 103 Croatia NA NA NA NA 2,236 NA NA NA NA 79 Czech Republic 6 4 5 5 5 80 80 80 85 99 Denmark 90 85 104 119 121 490 500 495 510 525 Finland 71 62 74 88 88 366 368 375 369 359 France 1,617 1,382 1,473 1,532 1,456 7,791 7,744 7,392 7,154 7,160 Germany 334 293 328 383 369 2,106 2,051 2,059 2,012 2,031 Greece 9 5 6 7 6 213 196 177 166 146 Hungary 12 7 9 12 12 276 152 167 182 188 Ireland 1,014 1,061 1,277 1,440 1,552 2,899 3,085 3,167 3,345 3,462 Italy 234 181 182 216 239 650 659 600 661 694 Liechtenstein 35 33 32 36 33 409 437 535 657 635 Luxembourg 2,513 2,277 2,642 3,031 3,225 9,353 9,462 9,435 9,500 9,738 Malta 2,132 3,033 3,160 3,433 NA 59 54 69 67 Netherlands 86 69 76 85 78 NA 495 497 501 594 Norway 85 80 99 109 129 507 507 406 573 616 Poland 26 18 26 28 27 214 226 259 264 280 Portugal 11 7 8 10 9 171 173 157 153 140 Romania 2 2 3 4 5 56 105 62 64 68 Russia 3,917 3,072 NA NA NA 462 472 NA NA NA Slovakia 4 3 3 3 4 58 63 58 54 66 Slovenia 2,663 2,279 2,370 2,506 2,612 130 137 131 114 109 South Africa 142 125 145 143 144 943 947 967 1,062 1,120 Spain 217 195 191 248 276 2,486 2,474 2,349 2,267 2,251 Sweden 205 180 206 253 271 504 508 456 484 485 Switzerland 262 273 311 397 408 653 664 667 765 809 Turkey 20 14 16 14 15 311 337 351 373 400 United Kingdom 854 817 986 1,167 1,203 2,204 1,941 1,922 1,910 1,928 Notes:
1. National mutual fund associations; European Fund and Asset Management Association (EFAMA) provides data for all European countries except Russia.
2. Funds of funds are not included, except for France, Germany, Italy, and Luxembourg. Home-domiciled funds, except for Hong Kong, New Zealand and Trinidad & Tobago, which include home- and foreign-domiciled funds.
3. # indicates Data upto September 2014
Source: Investment Company Institute.
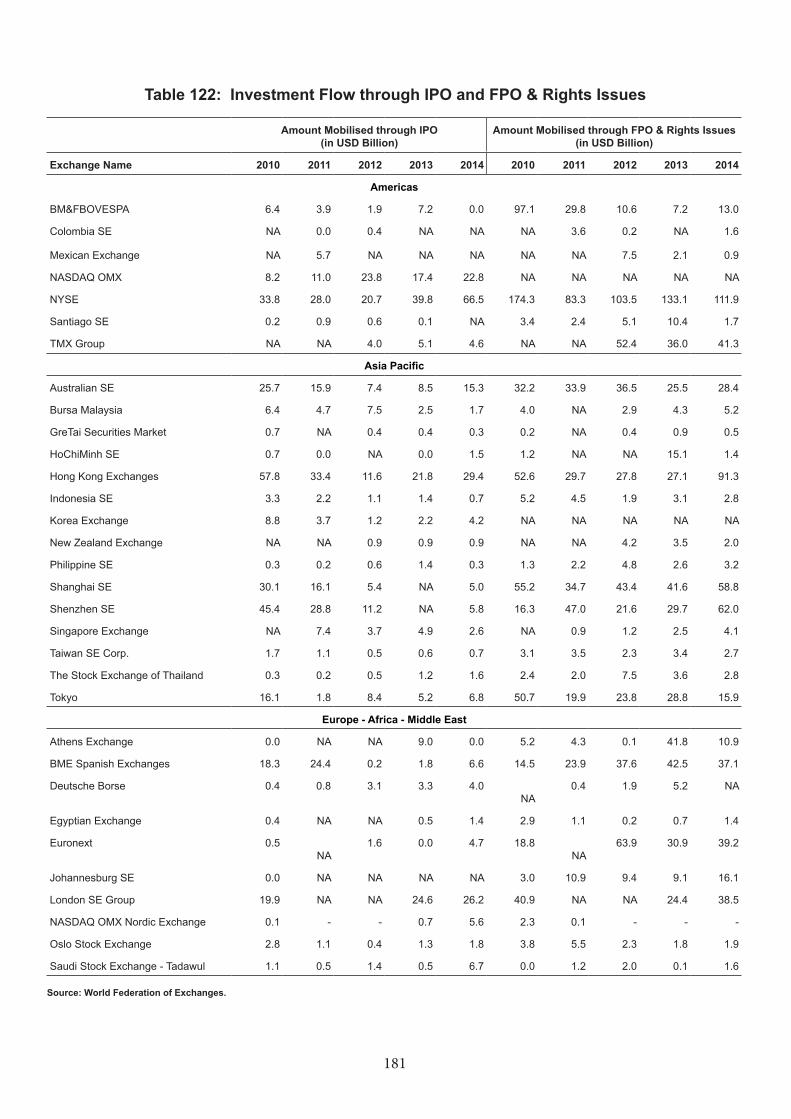
181
Table 122: Investment Flow through IPO and FPO & Rights Issues
Amount Mobilised through IPO (in USD Billion)
Amount Mobilised through FPO & Rights Issues (in USD Billion)
Exchange Name 2010 2011 2012 2013 2014 2010 2011 2012 2013 2014
Americas
BM&FBOVESPA 6.4 3.9 1.9 7.2 0.0 97.1 29.8 10.6 7.2 13.0
Colombia SE NA 0.0 0.4 NA NA NA 3.6 0.2 NA 1.6
Mexican Exchange NA 5.7 NA NA NA NA NA 7.5 2.1 0.9
NASDAQ OMX 8.2 11.0 23.8 17.4 22.8 NA NA NA NA NA
NYSE 33.8 28.0 20.7 39.8 66.5 174.3 83.3 103.5 133.1 111.9
Santiago SE 0.2 0.9 0.6 0.1 NA 3.4 2.4 5.1 10.4 1.7
TMX Group NA NA 4.0 5.1 4.6 NA NA 52.4 36.0 41.3
Asia Pacific
Australian SE 25.7 15.9 7.4 8.5 15.3 32.2 33.9 36.5 25.5 28.4
Bursa Malaysia 6.4 4.7 7.5 2.5 1.7 4.0 NA 2.9 4.3 5.2
GreTai Securities Market 0.7 NA 0.4 0.4 0.3 0.2 NA 0.4 0.9 0.5
HoChiMinh SE 0.7 0.0 NA 0.0 1.5 1.2 NA NA 15.1 1.4
Hong Kong Exchanges 57.8 33.4 11.6 21.8 29.4 52.6 29.7 27.8 27.1 91.3
Indonesia SE 3.3 2.2 1.1 1.4 0.7 5.2 4.5 1.9 3.1 2.8
Korea Exchange 8.8 3.7 1.2 2.2 4.2 NA NA NA NA NA
New Zealand Exchange NA NA 0.9 0.9 0.9 NA NA 4.2 3.5 2.0
Philippine SE 0.3 0.2 0.6 1.4 0.3 1.3 2.2 4.8 2.6 3.2
Shanghai SE 30.1 16.1 5.4 NA 5.0 55.2 34.7 43.4 41.6 58.8
Shenzhen SE 45.4 28.8 11.2 NA 5.8 16.3 47.0 21.6 29.7 62.0
Singapore Exchange NA 7.4 3.7 4.9 2.6 NA 0.9 1.2 2.5 4.1
Taiwan SE Corp. 1.7 1.1 0.5 0.6 0.7 3.1 3.5 2.3 3.4 2.7
The Stock Exchange of Thailand 0.3 0.2 0.5 1.2 1.6 2.4 2.0 7.5 3.6 2.8
Tokyo 16.1 1.8 8.4 5.2 6.8 50.7 19.9 23.8 28.8 15.9
Europe - Africa - Middle East
Athens Exchange 0.0 NA NA 9.0 0.0 5.2 4.3 0.1 41.8 10.9
BME Spanish Exchanges 18.3 24.4 0.2 1.8 6.6 14.5 23.9 37.6 42.5 37.1
Deutsche Borse 0.4 0.8 3.1 3.3 4.0 NA
0.4 1.9 5.2 NA
Egyptian Exchange 0.4 NA NA 0.5 1.4 2.9 1.1 0.2 0.7 1.4
Euronext 0.5 NA
1.6 0.0 4.7 18.8 NA
63.9 30.9 39.2
Johannesburg SE 0.0 NA NA NA NA 3.0 10.9 9.4 9.1 16.1
London SE Group 19.9 NA NA 24.6 26.2 40.9 NA NA 24.4 38.5
NASDAQ OMX Nordic Exchange 0.1 - - 0.7 5.6 2.3 0.1 - - -
Oslo Stock Exchange 2.8 1.1 0.4 1.3 1.8 3.8 5.5 2.3 1.8 1.9
Saudi Stock Exchange - Tadawul 1.1 0.5 1.4 0.5 6.7 0.0 1.2 2.0 0.1 1.6
Source: World Federation of Exchanges.
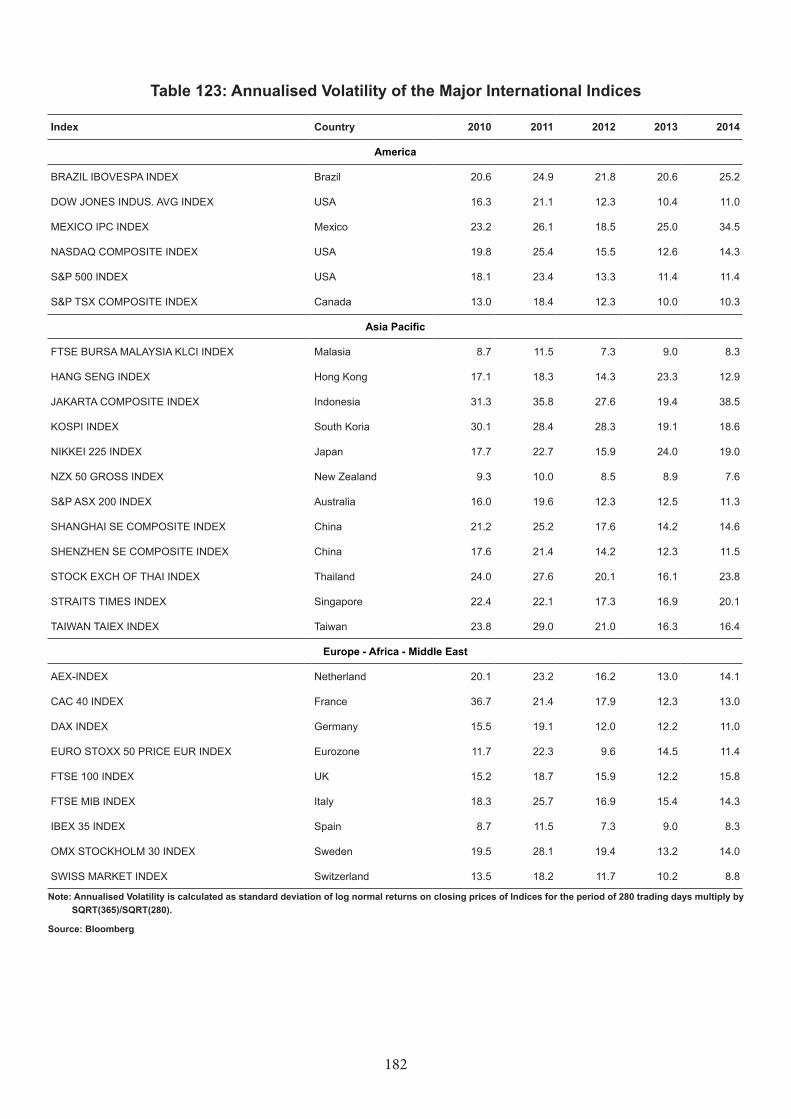
182
Table 123: Annualised Volatility of the Major International Indices
Index Country 2010 2011 2012 2013 2014
America
BRAZIL IBOVESPA INDEX Brazil 20.6 24.9 21.8 20.6 25.2
DOW JONES INDUS. AVG INDEX USA 16.3 21.1 12.3 10.4 11.0
MEXICO IPC INDEX Mexico 23.2 26.1 18.5 25.0 34.5
NASDAQ COMPOSITE INDEX USA 19.8 25.4 15.5 12.6 14.3
S&P 500 INDEX USA 18.1 23.4 13.3 11.4 11.4
S&P TSX COMPOSITE INDEX Canada 13.0 18.4 12.3 10.0 10.3
Asia Pacific
FTSE BURSA MALAYSIA KLCI INDEX Malasia 8.7 11.5 7.3 9.0 8.3
HANG SENG INDEX Hong Kong 17.1 18.3 14.3 23.3 12.9
JAKARTA COMPOSITE INDEX Indonesia 31.3 35.8 27.6 19.4 38.5
KOSPI INDEX South Koria 30.1 28.4 28.3 19.1 18.6
NIKKEI 225 INDEX Japan 17.7 22.7 15.9 24.0 19.0
NZX 50 GROSS INDEX New Zealand 9.3 10.0 8.5 8.9 7.6
S&P ASX 200 INDEX Australia 16.0 19.6 12.3 12.5 11.3
SHANGHAI SE COMPOSITE INDEX China 21.2 25.2 17.6 14.2 14.6
SHENZHEN SE COMPOSITE INDEX China 17.6 21.4 14.2 12.3 11.5
STOCK EXCH OF THAI INDEX Thailand 24.0 27.6 20.1 16.1 23.8
STRAITS TIMES INDEX Singapore 22.4 22.1 17.3 16.9 20.1
TAIWAN TAIEX INDEX Taiwan 23.8 29.0 21.0 16.3 16.4
Europe - Africa - Middle East
AEX-INDEX Netherland 20.1 23.2 16.2 13.0 14.1
CAC 40 INDEX France 36.7 21.4 17.9 12.3 13.0
DAX INDEX Germany 15.5 19.1 12.0 12.2 11.0
EURO STOXX 50 PRICE EUR INDEX Eurozone 11.7 22.3 9.6 14.5 11.4
FTSE 100 INDEX UK 15.2 18.7 15.9 12.2 15.8
FTSE MIB INDEX Italy 18.3 25.7 16.9 15.4 14.3
IBEX 35 INDEX Spain 8.7 11.5 7.3 9.0 8.3
OMX STOCKHOLM 30 INDEX Sweden 19.5 28.1 19.4 13.2 14.0
SWISS MARKET INDEX Switzerland 13.5 18.2 11.7 10.2 8.8
Note: Annualised Volatility is calculated as standard deviation of log normal returns on closing prices of Indices for the period of 280 trading days multiply by SQRT(365)/SQRT(280).
Source: Bloomberg
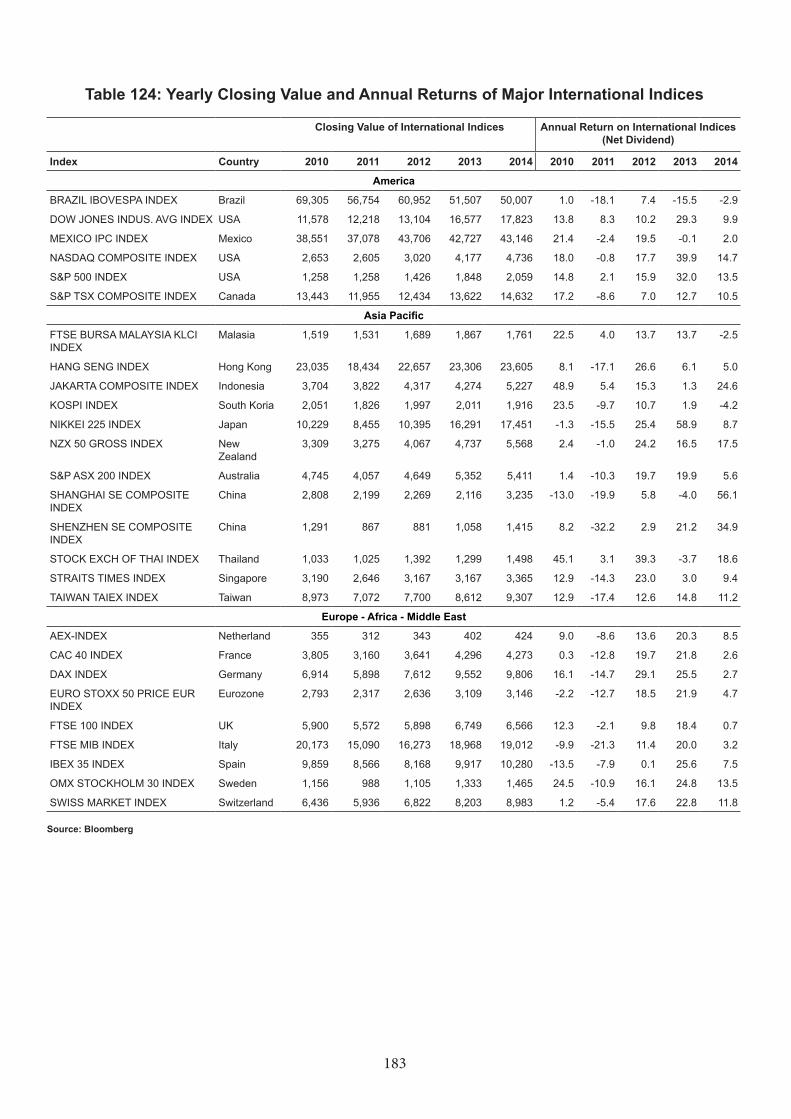
183
Table 124: Yearly Closing Value and Annual Returns of Major International Indices
Closing Value of International Indices Annual Return on International Indices (Net Dividend)
Index Country 2010 2011 2012 2013 2014 2010 2011 2012 2013 2014
America
BRAZIL IBOVESPA INDEX Brazil 69,305 56,754 60,952 51,507 50,007 1.0 -18.1 7.4 -15.5 -2.9
DOW JONES INDUS. AVG INDEX USA 11,578 12,218 13,104 16,577 17,823 13.8 8.3 10.2 29.3 9.9
MEXICO IPC INDEX Mexico 38,551 37,078 43,706 42,727 43,146 21.4 -2.4 19.5 -0.1 2.0
NASDAQ COMPOSITE INDEX USA 2,653 2,605 3,020 4,177 4,736 18.0 -0.8 17.7 39.9 14.7
S&P 500 INDEX USA 1,258 1,258 1,426 1,848 2,059 14.8 2.1 15.9 32.0 13.5
S&P TSX COMPOSITE INDEX Canada 13,443 11,955 12,434 13,622 14,632 17.2 -8.6 7.0 12.7 10.5
Asia Pacific
FTSE BURSA MALAYSIA KLCI INDEX
Malasia 1,519 1,531 1,689 1,867 1,761 22.5 4.0 13.7 13.7 -2.5
HANG SENG INDEX Hong Kong 23,035 18,434 22,657 23,306 23,605 8.1 -17.1 26.6 6.1 5.0
JAKARTA COMPOSITE INDEX Indonesia 3,704 3,822 4,317 4,274 5,227 48.9 5.4 15.3 1.3 24.6
KOSPI INDEX South Koria 2,051 1,826 1,997 2,011 1,916 23.5 -9.7 10.7 1.9 -4.2
NIKKEI 225 INDEX Japan 10,229 8,455 10,395 16,291 17,451 -1.3 -15.5 25.4 58.9 8.7
NZX 50 GROSS INDEX New Zealand
3,309 3,275 4,067 4,737 5,568 2.4 -1.0 24.2 16.5 17.5
S&P ASX 200 INDEX Australia 4,745 4,057 4,649 5,352 5,411 1.4 -10.3 19.7 19.9 5.6
SHANGHAI SE COMPOSITE INDEX
China 2,808 2,199 2,269 2,116 3,235 -13.0 -19.9 5.8 -4.0 56.1
SHENZHEN SE COMPOSITE INDEX
China 1,291 867 881 1,058 1,415 8.2 -32.2 2.9 21.2 34.9
STOCK EXCH OF THAI INDEX Thailand 1,033 1,025 1,392 1,299 1,498 45.1 3.1 39.3 -3.7 18.6
STRAITS TIMES INDEX Singapore 3,190 2,646 3,167 3,167 3,365 12.9 -14.3 23.0 3.0 9.4
TAIWAN TAIEX INDEX Taiwan 8,973 7,072 7,700 8,612 9,307 12.9 -17.4 12.6 14.8 11.2
Europe - Africa - Middle East
AEX-INDEX Netherland 355 312 343 402 424 9.0 -8.6 13.6 20.3 8.5
CAC 40 INDEX France 3,805 3,160 3,641 4,296 4,273 0.3 -12.8 19.7 21.8 2.6
DAX INDEX Germany 6,914 5,898 7,612 9,552 9,806 16.1 -14.7 29.1 25.5 2.7
EURO STOXX 50 PRICE EUR INDEX
Eurozone 2,793 2,317 2,636 3,109 3,146 -2.2 -12.7 18.5 21.9 4.7
FTSE 100 INDEX UK 5,900 5,572 5,898 6,749 6,566 12.3 -2.1 9.8 18.4 0.7
FTSE MIB INDEX Italy 20,173 15,090 16,273 18,968 19,012 -9.9 -21.3 11.4 20.0 3.2
IBEX 35 INDEX Spain 9,859 8,566 8,168 9,917 10,280 -13.5 -7.9 0.1 25.6 7.5
OMX STOCKHOLM 30 INDEX Sweden 1,156 988 1,105 1,333 1,465 24.5 -10.9 16.1 24.8 13.5
SWISS MARKET INDEX Switzerland 6,436 5,936 6,822 8,203 8,983 1.2 -5.4 17.6 22.8 11.8
Source: Bloomberg
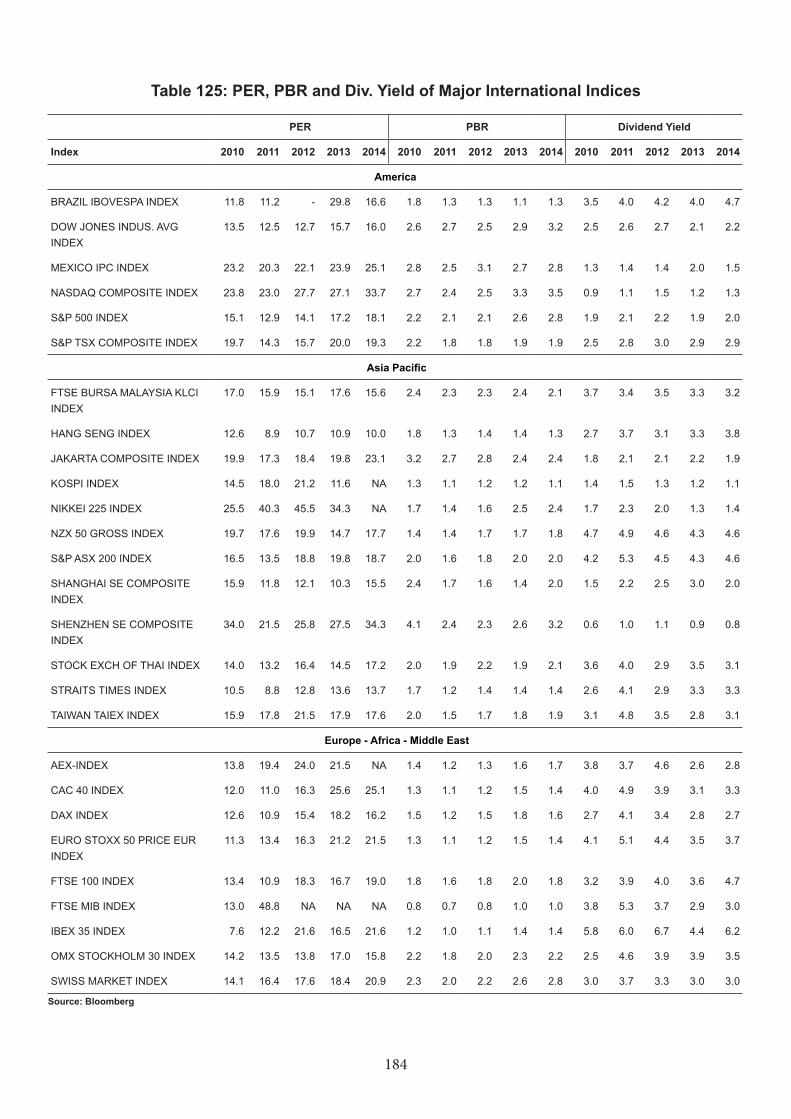
184
Table 125: PER, PBR and Div. Yield of Major International Indices
PER PBR Dividend Yield
Index 2010 2011 2012 2013 2014 2010 2011 2012 2013 2014 2010 2011 2012 2013 2014
America
BRAZIL IBOVESPA INDEX 11.8 11.2 - 29.8 16.6 1.8 1.3 1.3 1.1 1.3 3.5 4.0 4.2 4.0 4.7
DOW JONES INDUS. AVG INDEX
13.5 12.5 12.7 15.7 16.0 2.6 2.7 2.5 2.9 3.2 2.5 2.6 2.7 2.1 2.2
MEXICO IPC INDEX 23.2 20.3 22.1 23.9 25.1 2.8 2.5 3.1 2.7 2.8 1.3 1.4 1.4 2.0 1.5
NASDAQ COMPOSITE INDEX 23.8 23.0 27.7 27.1 33.7 2.7 2.4 2.5 3.3 3.5 0.9 1.1 1.5 1.2 1.3
S&P 500 INDEX 15.1 12.9 14.1 17.2 18.1 2.2 2.1 2.1 2.6 2.8 1.9 2.1 2.2 1.9 2.0
S&P TSX COMPOSITE INDEX 19.7 14.3 15.7 20.0 19.3 2.2 1.8 1.8 1.9 1.9 2.5 2.8 3.0 2.9 2.9
Asia Pacific
FTSE BURSA MALAYSIA KLCI INDEX
17.0 15.9 15.1 17.6 15.6 2.4 2.3 2.3 2.4 2.1 3.7 3.4 3.5 3.3 3.2
HANG SENG INDEX 12.6 8.9 10.7 10.9 10.0 1.8 1.3 1.4 1.4 1.3 2.7 3.7 3.1 3.3 3.8
JAKARTA COMPOSITE INDEX 19.9 17.3 18.4 19.8 23.1 3.2 2.7 2.8 2.4 2.4 1.8 2.1 2.1 2.2 1.9
KOSPI INDEX 14.5 18.0 21.2 11.6 NA 1.3 1.1 1.2 1.2 1.1 1.4 1.5 1.3 1.2 1.1
NIKKEI 225 INDEX 25.5 40.3 45.5 34.3 NA 1.7 1.4 1.6 2.5 2.4 1.7 2.3 2.0 1.3 1.4
NZX 50 GROSS INDEX 19.7 17.6 19.9 14.7 17.7 1.4 1.4 1.7 1.7 1.8 4.7 4.9 4.6 4.3 4.6
S&P ASX 200 INDEX 16.5 13.5 18.8 19.8 18.7 2.0 1.6 1.8 2.0 2.0 4.2 5.3 4.5 4.3 4.6
SHANGHAI SE COMPOSITE INDEX
15.9 11.8 12.1 10.3 15.5 2.4 1.7 1.6 1.4 2.0 1.5 2.2 2.5 3.0 2.0
SHENZHEN SE COMPOSITE INDEX
34.0 21.5 25.8 27.5 34.3 4.1 2.4 2.3 2.6 3.2 0.6 1.0 1.1 0.9 0.8
STOCK EXCH OF THAI INDEX 14.0 13.2 16.4 14.5 17.2 2.0 1.9 2.2 1.9 2.1 3.6 4.0 2.9 3.5 3.1
STRAITS TIMES INDEX 10.5 8.8 12.8 13.6 13.7 1.7 1.2 1.4 1.4 1.4 2.6 4.1 2.9 3.3 3.3
TAIWAN TAIEX INDEX 15.9 17.8 21.5 17.9 17.6 2.0 1.5 1.7 1.8 1.9 3.1 4.8 3.5 2.8 3.1
Europe - Africa - Middle East
AEX-INDEX 13.8 19.4 24.0 21.5 NA 1.4 1.2 1.3 1.6 1.7 3.8 3.7 4.6 2.6 2.8
CAC 40 INDEX 12.0 11.0 16.3 25.6 25.1 1.3 1.1 1.2 1.5 1.4 4.0 4.9 3.9 3.1 3.3
DAX INDEX 12.6 10.9 15.4 18.2 16.2 1.5 1.2 1.5 1.8 1.6 2.7 4.1 3.4 2.8 2.7
EURO STOXX 50 PRICE EUR INDEX
11.3 13.4 16.3 21.2 21.5 1.3 1.1 1.2 1.5 1.4 4.1 5.1 4.4 3.5 3.7
FTSE 100 INDEX 13.4 10.9 18.3 16.7 19.0 1.8 1.6 1.8 2.0 1.8 3.2 3.9 4.0 3.6 4.7
FTSE MIB INDEX 13.0 48.8 NA NA NA 0.8 0.7 0.8 1.0 1.0 3.8 5.3 3.7 2.9 3.0
IBEX 35 INDEX 7.6 12.2 21.6 16.5 21.6 1.2 1.0 1.1 1.4 1.4 5.8 6.0 6.7 4.4 6.2
OMX STOCKHOLM 30 INDEX 14.2 13.5 13.8 17.0 15.8 2.2 1.8 2.0 2.3 2.2 2.5 4.6 3.9 3.9 3.5
SWISS MARKET INDEX 14.1 16.4 17.6 18.4 20.9 2.3 2.0 2.2 2.6 2.8 3.0 3.7 3.3 3.0 3.0
Source: Bloomberg

HANDBOOK OF STATISTICS ON INDIAN SECURITIES MARKET 2011
HANDBOOK OF STATISTICS ON INDIAN SECURITIES MARKET 2014
HA
ND
BO
OK
OF STA
TISTICS O
N IN
DIA
N SEC
UR
ITIES MA
RK
ET 20
14