hands-on lab: get the most out of your network performance metrics with innovative visualizations...
TRANSCRIPT

World®’16
Hands-OnLab:GettheMostOutofYourNetworkPerformanceMetricsWithInnovativeVisualizationsandAdaptiveDashboards
JasonNormandin,Sr.PrincipalProductManager,CATechnologiesBernardClairmont,Sr.PrincipalConsultant,CATechnologies
DO4X160L
DEVOPS– AGILEOPERATIONS

2 ©2016CA.ALLRIGHTSRESERVED.@CAWORLD#CAWORLD
©2016CA.Allrightsreserved.Alltrademarksreferencedhereinbelongtotheirrespectivecompanies.
Thecontentprovidedinthis CAWorld2016presentationisintendedforinformationalpurposesonlyanddoesnotformanytypeofwarranty. The informationprovidedbyaCApartnerand/orCAcustomerhasnotbeenreviewedforaccuracybyCA.
ForInformationalPurposesOnlyTermsofthisPresentation

3 ©2016CA.ALLRIGHTSRESERVED.@CAWORLD#CAWORLD
Abstract
Yournetworkperformancedataisrighttherebuthowdoyouquicklyandeasilypresentittotherightpersonortherightgroupattherighttime?Inthissession,learnhowtocustomizedashboardsinCAPerformanceManagement3.0tobetteralignwithyourendusers’needsandtakeadvantageofsomeofthenew,dynamiccontextpages.Thepowertoreducethenumberofclickstoactionablecontentisatyourfingertips.Preregistrationisstronglyencouraged;spaceislimitedforthiseventandpreregisteredattendeeswillbeadmittedfirst..
BernardClairmontCATechnologiesSr.PrincipalConsultant
JasonNormandinCATechnologiesSr.PrincipalProductManager

4 ©2016CA.ALLRIGHTSRESERVED.@CAWORLD#CAWORLD
Agenda
DASHBOARDSFORWHO?
MTTR– FASTERBETTERINCONTEXT
LAYOUTANDDESIGN
KPIS ANDTHE8METRICSTHATMATTERMOST
1
2
3
4

5 ©2016CA.ALLRIGHTSRESERVED.@CAWORLD#CAWORLD
LabNetworkOverview
DockerContainers
PC DA
Vertica
DC
192.168.42.X/24 10.10.10.x/2410.10.20.x/24
192.168.1.10akaCAPM

6 ©2016CA.ALLRIGHTSRESERVED.@CAWORLD#CAWORLD
DashboardsForWho?

7 ©2016CA.ALLRIGHTSRESERVED.@CAWORLD#CAWORLD
NeedforMetricsandPredictiveAnalyticsAcrosstheOrganization– Ensuringgreatenduserexperiences
Dennis- ExecutivesandLOBOwners
Bill- NetworkTransformationTeam
Sally- NetworkPlanningTeam
• Makenetworkinvestmentdecisions• Trackthebusinessinitiativesandsuccess
• Evaluateandjustifynewtechnologies• Tracksuccessofimplementations
• Determinenewwaytoleveragetheexistingnetworkinvestment
• Designanddeploybuild-outsandupgrades
• Tracksuccessofimplementations
• Y.1731,IPSLA,QoS
• Trackutilization• Requestchangesandbuild-outsbasedonpredictions
• BackhaulLinks/Augments/Metro-ERings
• Conductdeeptriage• Manageproblems
• Setthresholdsandevents
• IdentifyQoS issues,watchfordiscards
• Identifyanomalies,manageincidents/workarounds• Proactivelyaddresstrendsand/orescalate
Cindy- CapacityManagementTeam
Rob- OperationsLevels1&2
Joe- OperationsLevels3&4Randy- Engineering

8 ©2016CA.ALLRIGHTSRESERVED.@CAWORLD#CAWORLD
GetMoreOutofYourMetrics– OverlaySimilarMetricsConsiderthisApproachasYouDesignDashboards
Load• Connections• Sessions• Operations
Inputs
Latency• Landing• Login• Transactions• Network• Back-end
*TakenfromWilsonMar– MakingDevelopmentTestReportingLessExpensive03/12/15Elastic{ON}Tour
Processing
Ratios• HTTP200/all• Error/Event• Memory/user
Queues• LoginWaiting• ServerWaiting• DBWaiting
AvailableRAM• AppServers• BackendServers• TestServers
Percentages• CPU/Server• FreeSpace
Outputs
Rate/Second• Hits• Errors• Swapping
DataThroughput• NetScalar/F5• bpsNetwork• Storage
9 ©2016CA.ALLRIGHTSRESERVED.@CAWORLD#CAWORLD
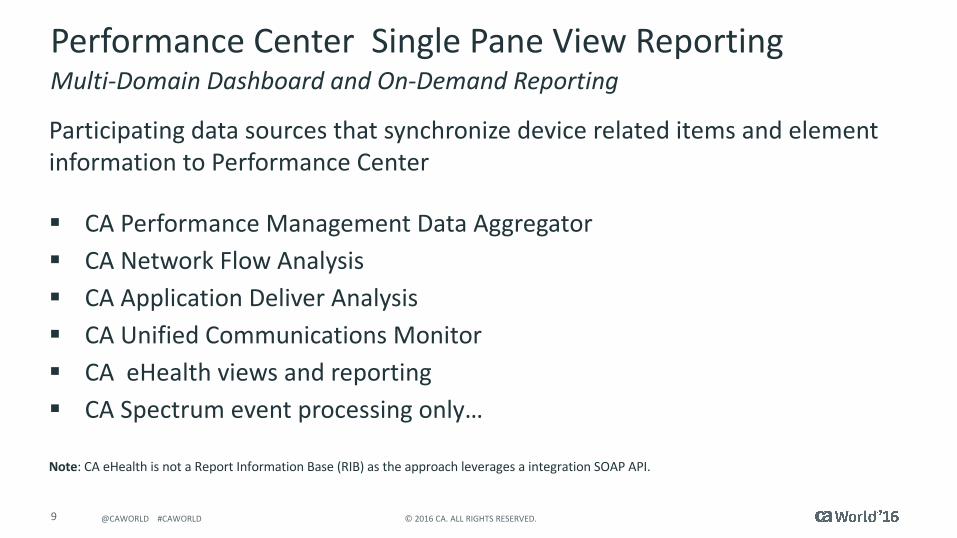
PerformanceCenterSinglePaneViewReporting
ParticipatingdatasourcesthatsynchronizedevicerelateditemsandelementinformationtoPerformanceCenter
§ CAPerformanceManagementDataAggregator§ CANetworkFlowAnalysis§ CAApplicationDeliverAnalysis§ CAUnifiedCommunicationsMonitor§ CAeHealthviewsandreporting§ CASpectrumeventprocessingonly…
Note:CAeHealthisnotaReportInformationBase(RIB)astheapproachleveragesaintegrationSOAPAPI.
Multi-DomainDashboardandOn-DemandReporting

10 ©2016CA.ALLRIGHTSRESERVED.@CAWORLD#CAWORLD
DashboardTypes
§ Inventorypages• High-levelinformationtoidentifymanageditemsandgroupsofitems- Groupsandsites,devicesandservers,interfaces,devicecomponents,elements
§ Summarypages• High-levelinformation,suchasaveragesfromgroupsofmanageditems;often
provideadrill-downpathtomoredetailed,relatedpagesfromaselecteditemcontext
§ Contextpages• Providespecific,focusedperformanceorstatusdatafromanarrowcontext,
suchasasinglerouterorserver;thesepagesareavailableasdrill-downlinksortabsfromsummarydashboards
CategoriesofDashboardsAreAvailablebyDefaultorThroughCustomization

11 ©2016CA.ALLRIGHTSRESERVED.@CAWORLD#CAWORLD
Dashboard/ViewVisualizationTypesAvailableViewstoBeCustomizedtoMeetCustomerNeeds
§ Tableforgridaggregatedata
§ Calendarheatchart
§ Piechart(combinedpieandtable)
§ Gaugeforthresholddissemination
§ Gauge/table(combined)
§ Trend/table(combined)
§ Trend/stackedchart
§ Horizontal/side-by-sidebarchart
§ Multi-view(mini-trendcharts)
§ Multi-trend(trendsrenderedonthesamechart)
§ Scorecardseverityhealthtableandtrendgrids
§ Dynamictrendchart(flexibilitytorendertrenddisplay)
§ On-demandfortheabilitytogeneratelivereports

12 ©2016CA.ALLRIGHTSRESERVED.@CAWORLD#CAWORLD
On-DemandReportingVisualizationTypesMultipleVisualizationandAggregationOptions
§ Chartwithmultiplemetrics
§ Chartpermetric
§ Chartperitemwithmultiplemetrics
§ Chartpermetricwithmultipleitems
§ Tablewithmultiplemetrics
§ Tableperitemwithmultiplemetrics
§ Summarytable/chartbymetrics
§ Summarytable/chartbyitems

13 ©2016CA.ALLRIGHTSRESERVED.@CAWORLD#CAWORLD
MTTR– Faster,Better,InContext

14 ©2016CA.ALLRIGHTSRESERVED.@CAWORLD#CAWORLD
UserViewSettingsAreImportant

15 ©2016CA.ALLRIGHTSRESERVED.@CAWORLD#CAWORLD
CopyDashboard

16 ©2016CA.ALLRIGHTSRESERVED.@CAWORLD#CAWORLD
CopiedDashboard

17 ©2016CA.ALLRIGHTSRESERVED.@CAWORLD#CAWORLD
SetUpGroups

18 ©2016CA.ALLRIGHTSRESERVED.@CAWORLD#CAWORLD
SetUpGroupRules

19 ©2016CA.ALLRIGHTSRESERVED.@CAWORLD#CAWORLD
UsetheNetworkOverviewCopyDashboardinyour”MyDashboards”menu
LockaViewtoaGroup

20 ©2016CA.ALLRIGHTSRESERVED.@CAWORLD#CAWORLD
Selectthegroupyoucreated“Routers”
LockaViewtoaGroup

21 ©2016CA.ALLRIGHTSRESERVED.@CAWORLD#CAWORLD
ReorderContextTabs– FollowtheClickPath

22 ©2016CA.ALLRIGHTSRESERVED.@CAWORLD#CAWORLD
ReorderContextTabs– FollowtheClickPath

23 ©2016CA.ALLRIGHTSRESERVED.@CAWORLD#CAWORLD
ChooseYourOwnAdventure– CustomContextPages

24 ©2016CA.ALLRIGHTSRESERVED.@CAWORLD#CAWORLD
FWConnectionsStats– ContextTabViews
§ Layout1x2x1
§ Views– CustomView– InfrastructureManagement– IMHorizontalBarChart(Device)– FW
ConnectionStats
– DynamicViews– IMOn-Demand/Multi-MetricTrendReport– FWConnectionStats
– CustomView– InfrastructureManagement– IMMulti-Trend(Device)
– IMMulti-Trend->FWConnectionRate– Avg
– IMTrendDevice->FWConnectionsAvg
– Devices– CalendarHeatChart– Reachability(don’tdothis)
– Devices– CalendarHeatChart– PercentMemoryUtilization(don’tdothis)

25 ©2016CA.ALLRIGHTSRESERVED.@CAWORLD#CAWORLD
ContextTab– FWConnectionsStats
NOTE:Bespecificandonlyaddcustomstatsotherwisethetabswillshowupinotherdeviceviewsi.e.ifyouaddreachabilitythenalldevicewillhavethisviewwithonlyreachabilityinit.

26 ©2016CA.ALLRIGHTSRESERVED.@CAWORLD#CAWORLD
CustomView– InfrastructureManagement– IMHorizontalBarChart(Device)– FWConnectionStats

27 ©2016CA.ALLRIGHTSRESERVED.@CAWORLD#CAWORLD
DynamicViews– IMOn-Demand/Multi-MetricTrendReport– FWConnectionStats

28 ©2016CA.ALLRIGHTSRESERVED.@CAWORLD#CAWORLD
CustomView– InfrastructureManagement– IMMulti-Trend(Device)

29 ©2016CA.ALLRIGHTSRESERVED.@CAWORLD#CAWORLD
IMTrendDevice->FWConnections Avg

30 ©2016CA.ALLRIGHTSRESERVED.@CAWORLD#CAWORLD
IMMulti-Trend->FWConnectionRate– Avg

31 ©2016CA.ALLRIGHTSRESERVED.@CAWORLD#CAWORLD
EnhancedSummaryStatisticsTableThatProvidesGreaterReportingFlexibility
CAPMSummaryStatisticsviewsprovideapowerfulanalyticalviewintokeyperformancemetrics.Theanalyticsprovidedwithinthoseviewsshouldbedrivenoffoftheanalyticoptionsforeachmetric.
§ Summarystatisticsviewswillnowincludetheconfiguredpercentilemetricsforalloftheselectedmetrics
§ Userscanchosetohide/showpercentilesbyselectingthecolumnstoviewintherenderedreport

32 ©2016CA.ALLRIGHTSRESERVED.@CAWORLD#CAWORLD
Multi-MetricScorecardsCanReflectAggregateHealthBasedonMultipleMetricsCAPerformanceManagementscorecardsprovideagreatoverviewofthehealthofindividualorgroupeditemsbasedonuserdefinedthresholds
§ NowinCAPerformanceManagement3.0,userscanselectupto5metricsforincludinginournewmulti-metricscorecard
§ Userscandefineindividualthresholdsonapermetricbasis
§ LimitedtoasinglemetricfamilyinCAPerformanceManagement3.0

33 ©2016CA.ALLRIGHTSRESERVED.@CAWORLD#CAWORLD
LayoutandDesign

34 ©2016CA.ALLRIGHTSRESERVED.@CAWORLD#CAWORLD
CustomDashboards
Out-of-the-boxdashboardsdonotalwaysmeetyourrequirements§ Notallmetricfamilies/metricsreported
• Userrequirements
– Temporaryfortroubleshooting
– Reportonaspecificsetofitems/groupofitems(e.g.:devicesinaregion/site,devicesbytype,devicesbyapplication)ExpressionGroup(TiedtoaMetricFamily)
Custommetricfamilies§ Requiresthecreationofacustomdashboardwithcustomviews

35 ©2016CA.ALLRIGHTSRESERVED.@CAWORLD#CAWORLD
Adddashboardoptions
CustomDashboards

36 ©2016CA.ALLRIGHTSRESERVED.@CAWORLD#CAWORLD
UsuallyBesttousethisasyourdefaultformat.
CustomDashboards

37 ©2016CA.ALLRIGHTSRESERVED.@CAWORLD#CAWORLD
8MetricsThatMatterMost

38 ©2016CA.ALLRIGHTSRESERVED.@CAWORLD#CAWORLD
GetMoreOutofYourMetrics– OverlaySimilarMetricsConsiderThisApproachasYouDesignDashboards
Load• Connections• Sessions• Operations
Inputs
Latency• Landing• Login• Transactions• Network• Back-end
*TakenfromWilsonMar– MakingDevelopmentTestReportingLessExpensive03/12/15Elastic{ON}Tour
Processing
Ratios• HTTP200/all• Error/Event• Memory/user
Queues• LoginWaiting• ServerWaiting• DBWaiting
AvailableRAM• AppServers• BackendServers• TestServers
Percentages• CPU/Server• FreeSpace
Outputs
Rate/Second• Hits• Errors• Swapping
DataThroughput• NetScalar/F5• bpsNetwork• Storage

39 ©2016CA.ALLRIGHTSRESERVED.@CAWORLD#CAWORLD
EightMetricsthatMatterMost
Network§ Packetloss§ Latency
Shareddetric§ Datatransfertime
• Network=Drivenhighduetoincreaseinpacketlossand/orlatency
• Server=DrivenhighduetoreducedTCPreceivewindowcausingdelays
• Application=PauseafterbeginningofDTTwhileappretrievesdata
• Averagedvolumes
Server§ Unresponsivesessions§ Refusedsessions§ Serverconnectiontime
Application§ Serverresponsetime§ Applicationturns

40 ©2016CA.ALLRIGHTSRESERVED.@CAWORLD#CAWORLD
NetworkMetricsthatMatterMost– PacketLoss/Latency
Outputs– interfacesintothenetwork/device/QoS§ Packetloss– errors/discards§ Latency§ Jitter(VoIP/video)§ Utilizationandpackets/second
Inputs– interfacesoutoffthenetwork/device/QoS§ Packetloss– errors/discards§ Latency§ Jitter(VoIP/video)§ Utilizationandpackets/second
Processing§ RouterCPU/memory
TheseAretheMetricsontheNetworkthatImpactEnd-UserPerformance

41 ©2016CA.ALLRIGHTSRESERVED.@CAWORLD#CAWORLD
FinalLab
§ Modifyyourgroups• Createinput/outputgroups
§ Modifyyourdashboard• Copytheviews• Tieyourviewstothegroups

42 ©2016CA.ALLRIGHTSRESERVED.@CAWORLD#CAWORLD
Stayconnectedatcommunities.ca.com
Thankyou.

43 ©2016CA.ALLRIGHTSRESERVED.@CAWORLD#CAWORLD
DevOps– AgileOps
FormoreinformationonDevOps– AgileOps,pleasevisit:http://cainc.to/wYXSg6