hanover future forward a winning strategy
TRANSCRIPT

Hanover Future Forward ─
A Winning Strategy
Investor DaySeptember 23, 2021

Agenda
9:00
9:00 – 9:30
9:30 – 10:00
10:00 – 10:20
10:20 – 10:30
10:30 – 11:00
Introduction
Oksana Lukasheva
A Winning Strategy Drives Superior
Performance
Jack Roche
Delivering Broad and Specialized
Capabilities in Core Commercial
and Personal Lines
Dick Lavey
Creating a Critical Growth Lever
with Specialty
Bryan Salvatore, Helen Savaiano and
Sarah Medina
Break
Q&A
Jack Roche, Jeff Farber, Dick Lavey and
Bryan Salvatore
11:00 – 11:15
11:15 – 11:30
11:30 – 11:45
11:45 – 12:15
Innovating Across The Value Chain
Will Lee
Driving Value Through a Claims
Operating Model of The Future
Mark Welzenbach
Capitalizing on a Solid Financial
Foundation
Jeff Farber
Q&A
Jack Roche, Jeff Farber, Will Lee and
Mark Welzenbach
2

Forward-looking Statements and Non-GAAP Financial Measures
Certain statements in this presentation and comments made by management throughout the
company’s investor day are forward-looking statements as defined in the Private Securities Litigation
Reform Act of 1995. This presentation also includes references to financial measures that are derived
from, but are not, measures presented in accordance with generally accepted accounting principles
(GAAP). Please see the final pages of this document for important information regarding forward-
looking statements and, to the extent available without unreasonable efforts, reconciliations of non-
GAAP financial measures to the most directly comparable GAAP measures, and cautions regarding
reliance on both forward-looking statements and non-GAAP financial measures used throughout the
company’s investor day. This presentation and the content thereof must be read and interpreted in
conjunction with information regarding risk factors and forward-looking information as set forth in this
presentation and in the company’s most recently filed reports on Forms 10-K and 10-Q and other
documents filed by The Hanover Insurance Group, Inc. with the Securities and Exchange Commission
(“SEC”) and that are also available at hanover.com under “Investors”.
3

A Winning Strategy Drives
Superior Performance
Jack RochePresident and Chief Executive Officer
4

Key Takeaways
Differentiated strategy accelerates growth
Growing market share with our consumer- and agent-centric approach, while leveraging our diverse
product set and proprietary analytical tools
Specialized capabilities are a critical growth driver
Further developing specialized capabilities across our business portfolio to position us for continued
growth, including expansion of our specialty commercial business through new product solutions
Innovation and data analytics ensure competitiveness and consistent top performance
Deploying new capabilities and tools to enhance growth opportunities, increase operating efficiency and
further improve claims expenses as the industry undergoes rapid change
Rigorous financial management enhances shareholder value
Building shareholder value and driving broad-based profitability through book value growth, delivering top-
quartile operating ROE(1) (~14%) and rigorously managing capital to invest in our most profitable
opportunities – building on our strong track record
ESG focus builds sustainable organization
Continuing our sustainability journey and focusing on human capital development, enterprise risk
management and climate change
1.
2.
3.
4.
5.
5(1) See information about this and other non-GAAP measures and definitions used throughout this presentation on the final pages of this document.

Personal Lines41%
Specialty(2)
21%
Small Commercial
20%
Middle Market
18%
$4.7BMarket Capitalization*
“A”Financial Strength**
*As of close of trading on September 17, 2021
**AM Best and S&P
2020 Net Premiums Written (NPW)
4,300Employees
2,110Agency Partners
$4.6B
A Balanced, Focused and Specialized Commercial and Personal Insurer
6

Successfully Executing on Our Ambitious 2017 AgendaExecution track record drives conviction in our new goals
Forward-looking non-GAAP measures, including normalized run rate, 2021 forecast and 2026 forecast, are not reconciled because such measures and reconciliations are not available without
unreasonable effort that would require the company to make estimates or assumptions about unidentified and unknown factors during the period referenced, such as catastrophes, economic and
market conditions, and competitive factors, among others. References to return on equity (“ROE”) and earnings per share (“EPS”) on this page and throughout this presentation reflect operating ROE
and operating EPS, which are non-GAAP measures.
*Normalized run rate for operating ROE is based on the company’s best estimate for 2021, and includes normalization for catastrophe losses, favorable prior-year development, partnership income
and current accident year losses, which were normalized primarily for COVID-19. In addition, this is consistent with the historical average over the past 3.5-year period.
**Represents domestic growth (excluding the impact of Chaucer, which was divested in 2018).
***Normalized operating EPS for 2016 includes normalization for unfavorable development and catastrophe losses. 2021 operating EPS forecast is based on the company’s best estimate for 2021,
and includes normalization for catastrophe losses, favorable prior-year development, partnership income and current accident year losses, which were normalized primarily for COVID-19
What We Expect to
Achieve in 2021
Operating ROE 11-12%~12.5%
Normalized Run Rate*
Book Value per
Share$100 per share
$95.48 per share(3)
as of Q2’21(Adjusted for special dividends)
Expense Ratio(4)
Improvement
~1.5 point
improvement1.9 point improvement
Net Premiums
Written
CAGR
7 – 9%
5.2%**(Intentional discipline in
challenging market coupled with
COVID-19)
Operating EPS(5)
Growth CAGR**11-13%
~13%
Normalized***
Strategic Achievements
• Broadened capabilities
• Expanded depth and
breadth of agency
network
• Replatformed technology
and leveraged innovation
• Improved mix and sold
non-strategic entity
• Efficiently returned capital
7
2021 Goals
(What We Said in 2017)

Differentiated business strategy supported
by sustainability enablers
8

Competitive Advantages
Strategic Sustainability Enablers 9
Our Differentiated Strategy Presents a Sustainable Competitive Advantage
SPECIALIZED
PRODUCTS AND
CAPABILITIES
DISTINCTIVE
AGENCY
PARTNERSHIPS
CUSTOMER-
DRIVEN
APPROACH
Agile
innovator
Attractive
employer
Admirable
company

Well Positioned in the Current, Highly Dynamic Environment
Market Dynamics
• Authentic partnership strategy
• Actionable customer insights
• Opportunity for agile innovation in every aspect of
our business
• Customer-centric approach
• Digital solutions
• Granular understanding of the market
• Moving from reacting to anticipating loss trends
Our Strategic Focus
Migrating
Profit Pools
and New Risks
Distribution
Consolidation
Tech and Data
Analytics
Evolving
Customer
Expectations
Dynamic
Workforce
• Coveted magnet of talent
• Highly engaged and agile workforce
10

1 business
unit53%
1 business unit 28%
2+ business
units47%
2+ business
units72%
2010 2020
A Distinctive Independent Agency (IA) Approach Driving Growth and
Profitability
Consultative
approach
$76 billion of
target market data
profiled
Targeted
Distribution
2,110 of the best
agents in the U.S.
Broad and
Relevant
Underwriting
Expertise
Deep
Business
Insights
Specialized
products
Local
underwriting
Three-Pronged Partnership Approach Increased Depth and Breadth Drive Improved Economics
Breadth of Hanover Relationships
Increased relevance leads to higher retention and improved loss ratios
Franchise value
<$5M68%
<$5M35%
$5M+32%
$5M+65%
2010 2020
Distinctive
Agency
Partnerships
11
Depth of Hanover Relationships(Premium per Agent)
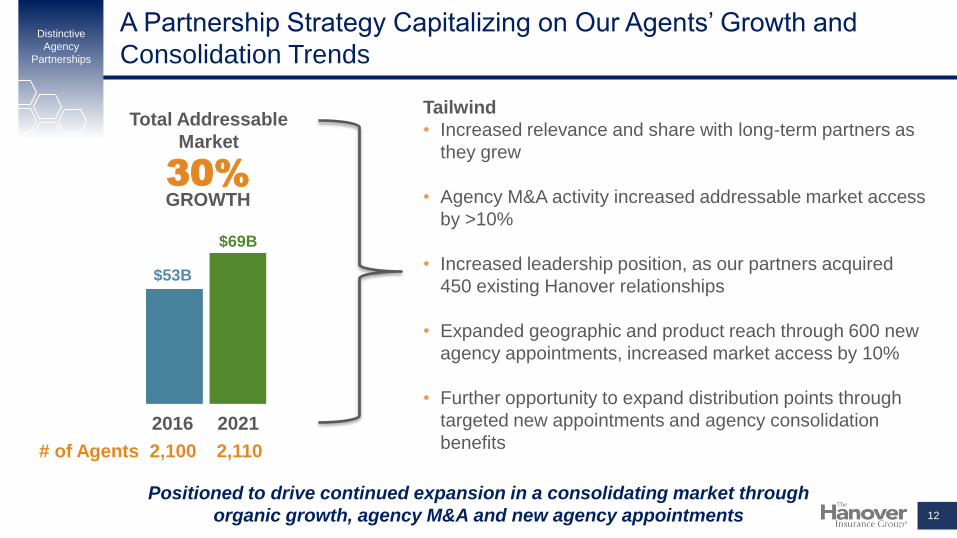
Total Addressable
Market
Positioned to drive continued expansion in a consolidating market through
organic growth, agency M&A and new agency appointments
Tailwind
• Increased relevance and share with long-term partners as
they grew
• Agency M&A activity increased addressable market access
by >10%
• Increased leadership position, as our partners acquired
450 existing Hanover relationships
• Expanded geographic and product reach through 600 new
agency appointments, increased market access by 10%
• Further opportunity to expand distribution points through
targeted new appointments and agency consolidation
benefits
30%GROWTH
2016 2021
$69B
$53B
A Partnership Strategy Capitalizing on Our Agents’ Growth and
Consolidation Trends
# of Agents 2,100 2,110
12
Distinctive
Agency
Partnerships
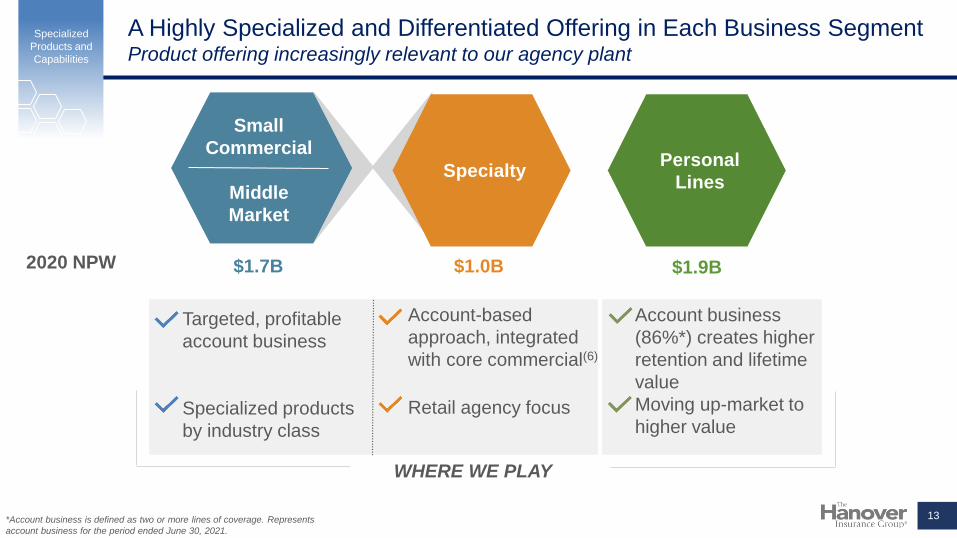
A Highly Specialized and Differentiated Offering in Each Business Segment Product offering increasingly relevant to our agency plant
Specialty
Small
Commercial
Middle
Market
2020 NPW $1.7B $1.0B $1.9B
Personal
Lines
Targeted, profitable
account business
Specialized products
by industry class
WHERE WE PLAY
Account-based
approach, integrated
with core commercial(6)
Retail agency focus
Account business
(86%*) creates higher
retention and lifetime
value
Moving up-market to
higher value
*Account business is defined as two or more lines of coverage. Represents
account business for the period ended June 30, 2021.
13
Specialized
Products and
Capabilities

Broad-Based Profitability and Diversification Providing Optionality for
Future Growth
Furthering agency penetration
Leveraging new
platform
Enhancing
capabilities
GROWTH OPPORTUNITIES
Expanding product
offerings
Small/digital
Specialty distribution
Entering new states
Moving upstream
Leveraging digital
Specialty
Small
Commercial
Middle
Market
Personal
Lines
3-year Average
Combined Ratio 95.7% 95.0% 94.7%
Expanding appetite
14
Specialized
Products and
Capabilities

A Leading Specialized Commercial Insurer for Independent Agency Channel$1.5 billion of highly specialized commercial business
1
4 Highly Specialized
Core Commercial
Industry Offerings
Hanover Programs
E&S
Specialty Industrial
Marine
Management Liability
Professional Liability
Surety
Healthcare
8Distinct Specialty
Businesses
$1.5 Billion
2020 Premiums Written
Contractors
Educational Institutions
Human Services
Technology/Life Sciences
Need for efficiency and modernization drives shift from product-centric to
customer-centric focus
~$0.5B
$1.0B
15
Specialized
Products and
Capabilities

1-2 lines22%
1-2 lines59%
3+ lines78%
3+ lines41%
The Hanover Industry
Delivering Holistic, Customer-Centric SolutionsDifferentiated and relevant approach in an increasingly fragmented market
Middle Market
Source: The Hanover Agency Insight
Monoline 14%
Monoline 47%
Account 86%
Account 53%
The Hanover IndustryThe Hanover Industry
(Independent
Agency only)
Personal Lines
Confident that our success in personal lines account business can be achieved in
sectors of commercial lines as agents strengthen customer focus
Premium Mix by Number of Lines Written With One Carrier
The Hanover
Benefits of customer-centric
approach
• Ease of doing business
• Reduction in coverage gaps
• Better servicing needs and
coordination
• Higher retention and account
tenure
Industry
(Independent
Agency only)
16
Customer-
Driven
Approach

Product Lines NPW
Commercial Multiple Peril (“CMP”)/
Business Owners’ Policy (“BOP”)$4,950
Professional Liability $2,250
Cyber $1,200
Workers’ Comp $3,750
Auto $2,100
Umbrella $750
Total Premium $15,000
Additional Coverage/Services
International coverage
(180 countries)
Risk control and engineering
E-Risk hub
Customer service center
Dedicated claims team
Average Technology ClientIllustrative
Technology Practice Case StudyCustomer-centricity is a win-win-win for customers, agents and The Hanover
Sophisticated Risk Solutions
• ~$150 million in premiums written as
of year-end 2020, and growing fast
• Industry focus: IT services,
electronics, communications and life
sciences
• Comprehensive coverage solution
for small to mid-size businesses,
with pre-revenue to $250 million in
revenue being our sweet spot
• Average account size of $15,000
• Consistent sub-80s combined ratio
17
Customer
centricity &
specialized
capabilities
Customer-
Driven
Approach &
Specialized
Capabilities

$14 billion
3+ lines are
placed with a
single insurer
$56 billion
Commercial Lines
data available through
Agency Insight
$35 billion
Agency controls 3+
lines on an account
Client Buying Patterns /
Account Fragmentation
$21 billion
account
opportunity
• Based on our Agency Insight data, $35 billion, or
63% of overall profiled commercial lines premiums
are assembled by agents as accounts, but only $14
billion, or 25% are placed with the same insurer
− This represents a $21 billion opportunity for
The Hanover to help agents improve
efficiencies by leveraging our insights and
capabilities
• Account-centric industries typically include, among
others:
− Tech
− Schools
− Manufacturing
− Media
− Energy and Utilities
• The true market premium associated with such
industries accounts for 45% of the commercial lines
market (~$155 billion)
Winning in a Fragmented MarketEnhancing our growth and relevancy in sectors that become more account centric
18
Customer
centricity &
specialized
capabilities
Source: The Hanover Agency Insight
Customer-
Driven
Approach &
Specialized
Capabilities

Strategic business enablers to
ensure sustainability
19
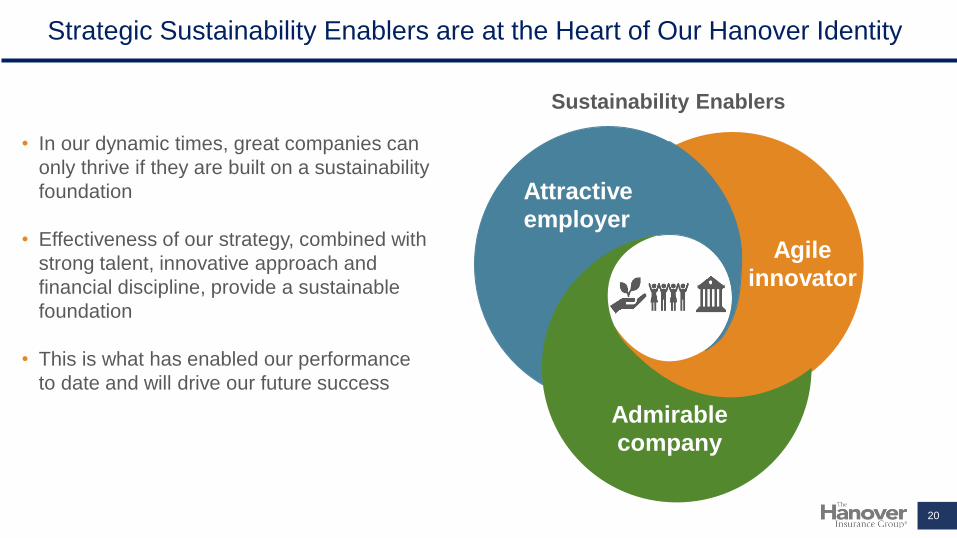
Strategic Sustainability Enablers are at the Heart of Our Hanover Identity
Sustainability Enablers
Attractive
employer
Admirable
company
Agile
innovator
• In our dynamic times, great companies can
only thrive if they are built on a sustainability
foundation
• Effectiveness of our strategy, combined with
strong talent, innovative approach and
financial discipline, provide a sustainable
foundation
• This is what has enabled our performance
to date and will drive our future success
20

Technology Investments to Enhance Our Front-End Capabilities
Invested over $200 million to upgrade or replace
nearly all core systems within our technology stack:
• Small commercial platform
• Personal Lines platforms
• Claims
• Billing, general ledger
Open-ended infrastructure allows for agility in future
innovation and investments in R&D, with a focus on:
• Agent engagement and experience
• Digital customer experience
• New business sourcing models
2016 – 2020
Legacy Modernization
2021 and Beyond
Customer-Facing, High-Visibility Enhancements
Core Systems
Data and Analytics
Digital and APIs
Processes and
Business Models
$280
Million~70%
Core Systems
Data and Analytics
Digital and APIs
Processes and Business Models
~30%
21

Our Technology TransformationFundamentally changed how customers and agents experience The Hanover
Prefill 65% of
Personal Lines quote fields
PL Agent
NPS score
increased
20pts
Reduced
quote time
of Small CL
product by
50%
Streamlined
U/W
applications
Our technology
investments have paid off
70%
of claims
leverage
predictive
analytics
22

A Claims Organization Strongly Contributing to Earnings and Growth
• Technology and digital capabilities have
yielded a ~60 basis point reduction in
unallocated loss adjustment expense
(“ULAE”) ratio between 2017 and 2020
• Over the next five years, pursuit of our
claims strategy implementation should yield
80 to 100 basis point reduction in the loss
adjustment expense (“LAE”) ratio
Claims
strategy
Enhance customer
experience through
digital and self-service
Optimize indemnity outcomes through data and analytics
23
Reduce
operating
costs through
AI and automation

The Hanover Culture. Our Greatest Asset.
100%
Highly engaged and agile workforce positions us well to compete in
the dynamic environment and drives top-quartile growth and returns
Recognized by Forbes
as one of America’s best mid-size
employers
Best place to work
for LGBTQ equality, Disability,
Inclusion and Women
CCollaboration
AAccountability
RRespect
EEmpowerment
Our CARE Values
of employees who can work
remotely have flexibility in
when and where they work
8
Business resource groups for
women and underrepresented
populations
88%
of managers have received
leadership development training
83%
Participation in annual
United Way campaign,
donating $1.5 million
24

A Sustainable Organization Built On Rigorous Financial Discipline and
Governance
Financial Discipline
• Top-quartile returns with
lower-than-average
volatility
• Rigorous underwriting and
reserving
• Strong balance sheet
Operating Sustainably
• Prudent risk management
• Long-term oriented
• Implementing initiatives to
mitigate climate change
risks, reduce energy use,
carbon footprint and
emissions
Robust Governance
• Separate CEO and Board
chair
• All board members are
independent, other than
CEO
• 55%* gender, race or
ethnically diverse board
Admirable, stakeholder-focused company
*Excluding CEO25

Well positioned to augment and deliver
on our financial targets
26

Ambitious, But Achievable Financial Targets for The Next Five Years
CAGR
NPW
7+%
EPS
12-13%
BVPS
7-8%
Our Long-Term Aspirational GoalsLong-Term
Target
ROE
~14%
27
For additional information regarding forward-looking non-GAAP measures on this page and throughout this presentation, please refer to page 108 of this presentation.

A Differentiated Strategy that Positions us for Profitable Growth
7+%
CAGR Further Enhance
Innovation
• Increased share
• New
appointments
Leverage Strong
Position in IA
Channel
Expand Specialized
Capabilities
• New products,
risks and talent
• Leveraging new,
agile platforms
~$7B
2026
$5B
2021F
28
Net Premiums Written
For additional information regarding forward-looking non-GAAP measures on this page and throughout this presentation, please refer to page 108 of this presentation.

Key Takeaways – A Winning Combination
Differentiated strategy accelerates growth
Specialized capabilities are a critical growth driver
Innovation and data analytics ensure competitiveness and top performance
Rigorous financial management enhances shareholder value
ESG focus builds sustainable organization
1.
2.
3.
4.
5.
29

Delivering Broad and
Specialized Capabilities
in Core Commercial
and Personal Lines
Dick LaveyEVP, President, Agency Markets
30

Key Themes
Target returns
Core Commercial and Personal Lines portfolios hitting target returns, enabling a robust
growth strategy
Major investments
Significant investments -- over $100M -- in the last three years in products, platforms
and analytics will fuel our relevancy in the market
Selective distribution
A targeted, distinctive and deep distribution strategy coupled with our proprietary
analytics tool, Agency Insight, enables us to drive informed growth
Account strategy
Unrelenting focus on account strategy and non-commoditized market segments with
specialized and industry specific coverages
Skilled portfolio management
Our teams are skilled portfolio managers, balancing geography, product and industry mix
1.
2.
3.
4.
5.31
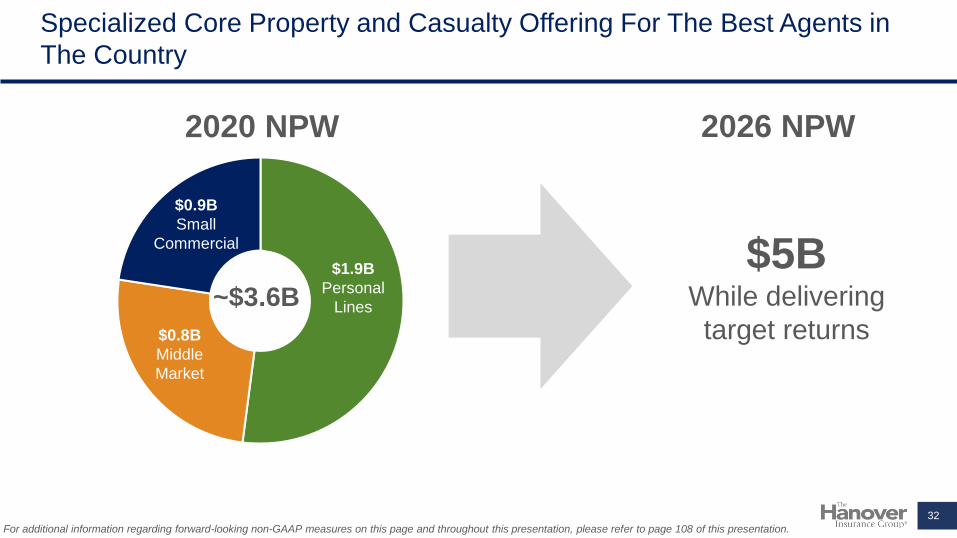
Specialized Core Property and Casualty Offering For The Best Agents in
The Country
2020 NPW
$1.9B
Personal
Lines
$0.8B
Middle
Market
$0.9B
Small
Commercial
~$3.6B
$5BWhile delivering
target returns
2026 NPW
32
For additional information regarding forward-looking non-GAAP measures on this page and throughout this presentation, please refer to page 108 of this presentation.

We are Well Positioned to Thrive In The Dynamic Market
Market Dynamics
Migrating
Profit Pools
and New
Risks
Distribution
Consolidation
Tech and Data
Analytics
Evolving
Customer
Expectations
Dynamic
Workforce
Our Response
• To assist winning, consolidating
agents
Highly Analytic and
Consultative Approach
• To enable agility
Modern Platform
Architecture
• To enable engagement with
customers and agents
Digital Tools and
Investments
Proprietary Analytics and
Third-Party Data
• To optimize risk selection and
pricing
• Breadth and
depth of agency
relationships
• Pricing
sophistication
• Insightful
underwriting and
risk selection
33

The Independent Agency Channel Continues to Show Resilience
and Shifting Agency Dynamics Play Into Our Strengths
*Source: McKinsey
• Independent agents control the
majority of our target Personal and
Commercial Lines business AND their
market share is consistent over time
• Tech entrants are pivoting from
disruptors to enablers and becoming
partners with the agency channel
• The IA channel has attracted billions in
investments and >700 private equity
investments in recent years*
• As larger distributors and acquirers look
to achieve synergies from these
investments, we expect they will look to
consolidate with their strongest,
account driven markets
34
Property and Casualty Market Share
Middle
Market
Small
CommercialPersonal
Lines
Direct and Captive Controlled
$94B $105B $130B
36%
68%
97%
Independent Agency Controlled

Small Commercial
35
Our market-leading capabilities, operating model and portfolio
performance position us to continue winning in this high-margin
$105 billion market segment

Small Commercial: Our Full-Spectrum Solution Positions The Hanover as
One of The Broadest Markets in the Less-Than-50 Employee Segment
Our differentiation and competitive advantagesSmall Commercial
*Products are not available in all jurisdictions. Please reference page 103 of this presentation for more information.
750Industry
Classes
~30% Commercial
Package Policy
• Full spectrum of product capabilities* enable
underwriting flexibility covering 70% of small
commercial market, including small specialty
• 70% account business, coming from 8,000
account managers
• Market leading ease-of-doing-business on new
quoting and issuance platform
• Distinctive industry specialization
• Rich agency insight into opportunities due to
unique agency analytical tools
• Market-leading customer service center,
including larger accounts and specialty coverages
• Full suite of digital self-service tools
BOP/
Point-of-Sale
Market
Package
Market
Admitted
Specialty
Excess &
Surplus
Risk Complexity
Ris
k S
ize
36

Small Commercial Growth Will Be Powered By Our New TAP Sales Platform
New platform enables agile integration with third parties
and digital distributors and platforms
+
+
Enhanced agent quoting experience
TAP Sales
Upgraded product
Hanover Business Owners’ Advantage
New policy admin platform
Policy decisions
1
2
3
Old Platform New Platform
Pricing tiers 4 75
Straight thru %Below $5,000
40% 70%
Classes 500 750
States 37 49
Avg. quote time 10 minutes 5 minutes
Data pre-fill Limited Significant
Expect growth lift of 2 – 3 points annually
37

Market Place Reaction Has Been Incredibly Positive — Signaling
Excellent Upside in $105 Billion Market With Existing Agents
The Hanover
has cut the
quoting time
in half.
This system
is faster than
XYZ Company,
and you know their
system is pretty good.
Yours is
better.
This is the
easiest and most
intuitive and
logical rating
platform
I have ever
used.
Best
quoting
system out
right now!
The quote proposal is one
of my favorite things you changed – it’s
really improvedand the defaults
work well.
Pricing
continues to
look good. I like
that you don't have to
choose a company
and the system picks
the tier for you.
Quote flow:
very user friendly.I cannot underscore
how much of an
improvement this
is over point-of-sale.
Massive
improvement.
38

Small Commercial is Poised to Grow With $105 Billion Market Opportunity
7+%
CAGR
2021F 2026
Distribution Expansion Market Consolidation Product Enhancement
~$1.4B
$1.0B
• ~125 new agency
appointments
• Increased access to
market by $16 billion in
recent years
• Agency Insight-driven
partnerships account for
~15% of new business
annually
• 250 new classes and
11 new states
• Specialty
collaboration to drive
portfolio balance and
margin
TAP Sales Deployment
39
Net Premiums Written
For additional information regarding forward-looking non-GAAP measures on this page and throughout this presentation, please refer to page 108 of this presentation.

Middle Market
40
Our highly relevant middle market appetite and set of
capabilities are essential to our partnership strategy in this
$94 billion market

Middle Market: An Industry Targeted Approach is a Key Portfolio
Management Lever
Our differentiation and competitive advantages
• Broad and relevant suite of industry specific,
specialized products and services for firms with 50+
employees
• Deploy optimal intersection of industry, line and
geography to assure long-term profitable growth
• Organized around an account-oriented approach
to business (67% account business*)
• Proprietary territorial and line of business pricing
models
• Localized field structure and insights create
competitive advantage sourcing business
• Leading claims and risk management capabilities
tailored to middle market customer needs
Industry
GeographyLine of
Business
Localized,
Targeted
Growth
Strategies
*As of December 31, 2020
41

Our Highly Diversified Middle Market Portfolio Enables a Targeted Approach
Industry Class
2020 Premiums Written
Geography
42
Northeast33%
Southeast16%
Midwest26%
West14%
Pacific11%
Real Estate16%
Manufacturing 15%
Educational Institutions
13%
Contractors11%
Human Services
9%
Tech8%
Wholesale5%
Retail3%
Maintenance Services3%
All Other17%
Targeted Industries and Geographies
Account Rounding with Specialty
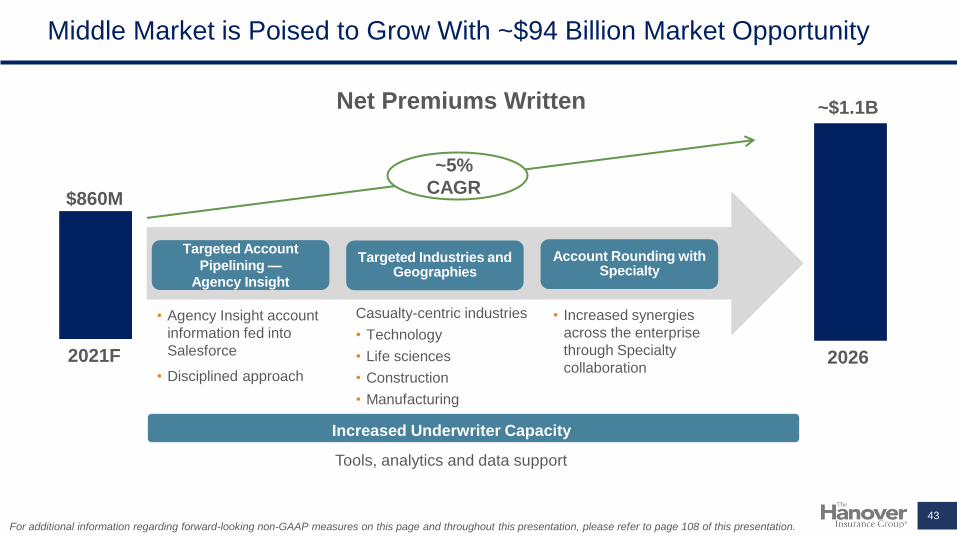
Middle Market is Poised to Grow With ~$94 Billion Market Opportunity
~5%
CAGR
2021F 2026
~$1.1B
$860M
Increased Underwriter Capacity
Tools, analytics and data support
• Agency Insight account
information fed into
Salesforce
• Disciplined approach
Casualty-centric industries
• Technology
• Life sciences
• Construction
• Manufacturing
• Increased synergies
across the enterprise
through Specialty
collaboration
43
Net Premiums Written
Targeted Account
Pipelining —Agency Insight
For additional information regarding forward-looking non-GAAP measures on this page and throughout this presentation, please refer to page 108 of this presentation.

Personal Lines
44
Our preferred customer and full account profile drive
sustainable performance

Personal Lines: Resilient, Account-focused Portfolio That Delivers Higher
Lifetime Value
Our differentiation and competitive advantages
• Full account (86%), value-oriented offering
with customer base more resilient to
commoditization and protection-minded
• 95% with $100K/$300K auto liability limits
indicates preferred customer
• An attractive 20-state footprint with a strong IA
presence
• Ease of doing business via modern Tap Sales
platform
• Intensely local in our approach – from pricing,
underwriting, agency engagement and claims
handling
• Direct access to underwriters and state
alignment creates a robust support ecosystem for
agents
Our Target
Market Segment
High net worth
“Middle market”
Account customers
$3.0M
$750K
$250K
Coverage A
Limits
“Emerging affluent
market”
Account customers
Future
consideration
45
Non-standard and monoline

Our Entire Suite of Offerings — Product and Service — Enables
Agents to Best Serve Their Account Customers
Account Profile
The Hanover writes more
accounts than any competitor
in our agencies
• Preferred customer profile
• Higher retention
• Higher lifetime value
Account Profile Telematics
Expanding the offering
beyond SafeTeen
• Increased pricing sophistication
• Preparing for the future of auto
rating
Customer Self-Service
Customers have the option to interact with
their insurance in the way they choose
The Hanover can meet all
product needs of preferred
account customers
• Market differentiation
• Higher retention
• Higher margin ancillary lines
Product Suite
Company 7
Company 6
Company 5
Company 4
Company 3
Company 2
The Hanover
46

Prestige Market: Provides Access to $20 Billion “Up-market” Opportunity
Market Positioning
Excellent solution positioned between the national players
and high net worth carriers for customers with more
complex needs in the $750,000 - $3 million coverage A
Account Premium
All Other Prestige
Results
Umbrella Penetration
All Other Prestige
3x
Scheduled Property
All Other Prestige
2.4x
1.8x
47
Flexibility
and
ChoiceCare and
Service
Powerful
Protection
National
CarriersUnderserved Inflexible
High Net
Worth
Carriers
We believe flexibility and choice are our distinct
advantages for our agents and customers

Personal Lines Poised to Grow with $65 Billion Market Opportunity
• Addition of high margin
ancillary coverages that
enhance core account
retention
• Prestige – Targeting over
$300 million in the next
three years
48
Distribution Expansion Market Consolidation Product Enhancement
~6%
CAGR
~$2.6B
$2.0B
2021F 2026
• Selectively appoint
~125 agents per year
• Added ~$7 billion of
addressable market in
recent years
• Industry-leading book
consolidation
capabilities drive 15%
of new business
Net Premiums Written
For additional information regarding forward-looking non-GAAP measures on this page and throughout this presentation, please refer to page 108 of this presentation.

Our Core Commercial and Personal Lines Portfolios are Healthy,
Thriving and Critical to Our Partnership Model
Target returns
A financially sound business
Major investments
Preparing us to accelerate into the future
Selective distribution
Partnering with winning agents
Account strategy
Targeting profitable customer segments
Skilled portfolio management
Adapting to a dynamic environment
1.
2.
3.
4.
5.49

Creating a Critical Growth
Lever with Specialty
Bryan SalvatoreEVP, President, Specialty
50

Key Takeaways
01
Over the last several years, our Specialty business has matured into a robust,
diversified and profitable segment
Consistent and broad-based profitability opens multiple levers to accelerate our growth 2.
Specialty constitutes a critical growth driver for our organization going forward
We will continue to enhance our product capabilities, penetrate existing agents,
proactively tap into specialist distribution and leverage core commercial relationships to
grow Specialty into a $1.7 billion portfolio in the next five years
3.
Specialty is a strategic differentiator for The Hanover
Our broad offering of capabilities for retail agents, close coordination across Commercial
Lines and account-centric approach punctuate our distinct competitive advantages in the
specialty marketplace
1.
51

The Hanover’s Specialty Business Delivers Relevant and Coordinated
Solutions to Our Agents
• Most compelling offering in the market - targeted
at retail agents
• Diversified product portfolio with 8 dedicated
businesses and 18 product areas
• Focused mainly on the lower end of the risk and
account-size spectrum
• Account-centric approach
• Coordinated agency relationship management
• Best-in-class customer service center
Continued focus on enhancing our product, service and digital capabilities
through a Total Hanover approach to drive profitable growth with agents
Our distinct and competitive advantages2020
Net Premiums Written
52
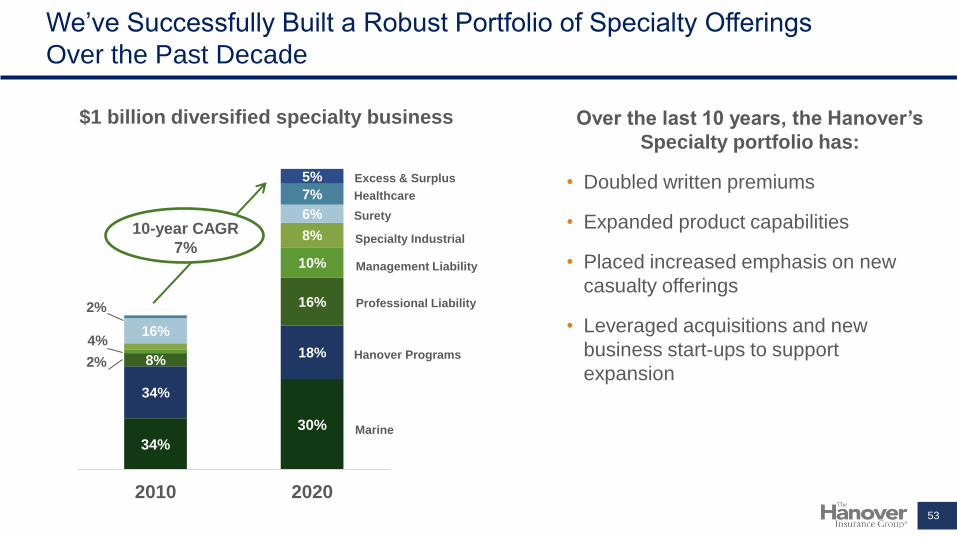
$1.0B
Hanover Programs
18%
E&S 5%
Specialty Industrial
8%
Marine30%
Management Liability,
10%
Professional Liability,
16%
Surety6%
Healthcare7%
34%
30%
34%
18%8%
16%
2%
10%
4%
8%
16%
6%
2%
7%
5%
2010 2020
10-year CAGR
7%
Marine
Hanover Programs
Professional Liability
Excess & Surplus
Healthcare
Surety
Specialty Industrial
Management Liability
$1 billion diversified specialty business
We’ve Successfully Built a Robust Portfolio of Specialty Offerings
Over the Past Decade
Over the last 10 years, the Hanover’s
Specialty portfolio has:
• Doubled written premiums
• Expanded product capabilities
• Placed increased emphasis on new
casualty offerings
• Leveraged acquisitions and new
business start-ups to support
expansion
53

Broad and Relevant Offering to Retail Agents and Specialists
• The Hanover is positioned as a top
specialty carrier in the small to mid-
size market with:
– Capabilities aligned with agent
needs
– Market focus that tempers volatility
– Total account solutions
– Agent-facing digital capabilities
• Hyper-focused on lines of business
where we have competitive
relevance
• Distribution strategically aligned
across our commercial practice
positions us to capture growth
opportunities54
Higher
Risk

Our Portfolio Has Matured and Is Consistently Delivering Above-Target
Profitability (ROE)
106.5%114.1%
101.4%94.2% 96.3% 94.4%
2015 2016 2017 2018 2019 2020
Combined Ratio
38.6% 38.6% 38.4%37.3% 37.0%
36.2%
2015 2016 2017 2018 2019 2020
Expense Ratio
Meaningfully improved profitability profile of
our Specialty business through:
• Specific profit actions
• Portfolio mix management
• Casualty portfolio development
• Disciplined reserving practices
• Granular cost management and harvesting
growth leverage on expenses
Our ability to achieve broad-based profitability in Specialty allows
multiple levers to accelerate growth going forward
Growth combined with rigorous management of
portfolio mix, pricing and workflows continues to
deliver accident year loss ratio and expense
ratio improvement
55

Well Positioned in the Current Market Environment
Market Dynamics Our Strategic Focus
Migrating Profit
Pools and New
Risks
Distribution
Consolidation
Tech and Data
Analytics
Evolving Customer
Expectations
2026
• $1.7 billion+ portfolio
• Top-quartile ROE
Key Foundational Elements:
Talent Portfolio
Management
Enterprise
AlignmentPricing Operational
Efficiencies
Data-driven
Decision Making
Accelerate Growth
Deliver meaningful CAGR
over the next five years
Optimize Distribution
Deepen retail, specialist and
wholesaler partnerships
Advance Technology
Optimize performance
through digital investment
Dynamic
Workforce
56

Strategic Priorities to Deliver Profitable Growth Over The Long-Term
Net Premiums Written
• Total Hanover account solutions
• Specialist distribution
• Digital capabilities
Accelerate Growth
Optimize Distribution
Advance Technology
• Expanding product capabilities focused on
agent needs:
- Financial institutions
- Retail E&S
- Cyber
- Micro-to-small accounts
- Specialty GL (coming soon)
• Expanding shelf space with agent partners
• Leveraging account strategy across
Commercial Lines
• Growth in capital-efficient fronted business
• Specialist distribution strategy
$1.1B
~$1.7B
57
5-year CAGR~10%
For additional information regarding forward-looking non-GAAP measures on this page and throughout this presentation, please refer to page 108 of this presentation.

Helen SavaianoPresident of Management Liability
Management and Executive
Liability Practice
58

Diversified Portfolio Delivering Historical Growth and Profitability
Private Company
54%
Fidelity and Crime26%
EPLI10%
Nonprofit8%
Financial Institutions
2%
Column1
Management and Executive
Liability Portfolio
2020 NPW
Began as a start-up in 2009, 12 years in business
33 best-in-class, regionally placed underwriters
with an average of 15 years experience
Digital distribution capabilities with 13%
growth
$1B+ market opportunity with existing
agents
90.5% average combined ratio over the last
four years, delivering above-target ROE
$103M
59
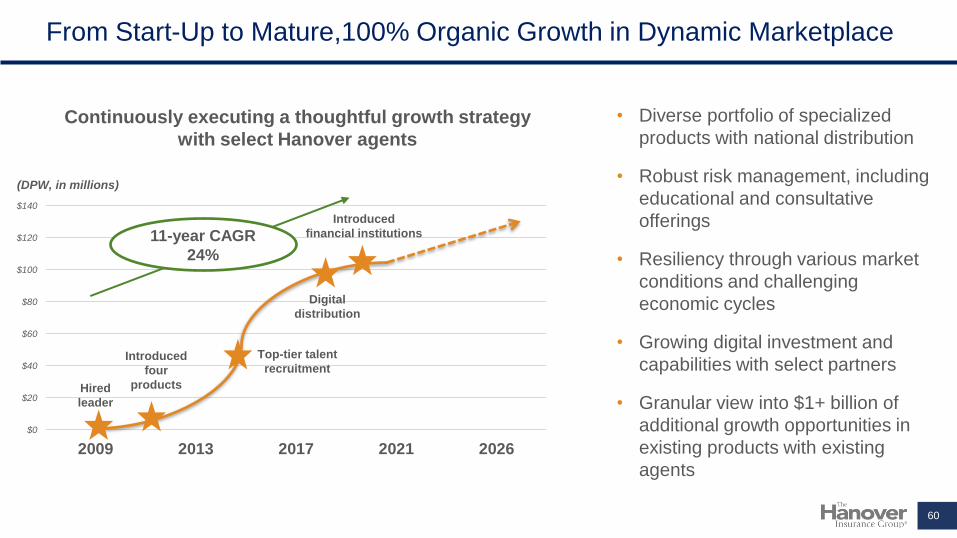
From Start-Up to Mature,100% Organic Growth in Dynamic Marketplace
Continuously executing a thoughtful growth strategy
with select Hanover agents
• Diverse portfolio of specialized
products with national distribution
• Robust risk management, including
educational and consultative
offerings
• Resiliency through various market
conditions and challenging
economic cycles
• Growing digital investment and
capabilities with select partners
• Granular view into $1+ billion of
additional growth opportunities in
existing products with existing
agents
$0
$20
$40
$60
$80
$100
$120
$140
2009 2013 2017 2021 2026
(DPW, in millions)
Hired
leader
Introduced
financial institutions11-year CAGR
24%
Introduced
four
products
Digital
distribution
Top-tier talent
recruitment
60
Sarah MedinaPresident of Professional Liability
Professional Liability Practice
61

Highly Diversified Portfolio Positioned to Accelerate Growth and
Deliver Sustainable Profitability
Lawyers23%
Miscellaneous18%
Architects & Engineers
15%
Accountants13%
Allied Health17%
Eldercare13%
Practitioners1%
Professional Liability and
Healthcare Portfolio
2020 NPW
1,400+ retail, specialist and
wholesale partners
73 best-in-class, regionally placed
underwriters with an average of 15 years
experience
$35M of premium written via online
digital portals
9.4% DPW CAGR since 2016
Above-target ROE
$228M
62

Small Firm Focus Delivers Long-Term Profitability With Significant
Headroom in Existing Agency Base
51% 63%
Small Firm All Other
7-year Ultimate Loss and ALAE Ratios
Historical Profitability
Firm Size Prof Liab. Healthcare
Small 86% 51%
Mid-Large 14% 49%
Small Firm Focus
Per Claim Limit Prof Liab. Healthcare
< $1M 33% 2%
$1M - < $2M 55% 77%
$2M+ 12% 21%
Low Volatility
Significant headroom with existing agents reinforced
with granular data insights
In-
Appetite
49%
In-
Appetite
71%
Healthcare Professional
Liability
Allied
Eldercare
Practitioners
55%
39%
6%
Mix MPL
LPL
A&E
APL
35%
31%
29%
5%
Mix
$1.4B $0.8B
63

Innovating Across the
Value Chain
Will LeeEVP, Chief Information and Innovation Officer
64

Key Takeaways
Managing the complexity by utilizing a dual horizon operating model
Optimizing current technology while building new capabilities for the future in an
integrated enterprise approach2.
Innovation approach enables us to accelerate where needed
Future investments focused on digital customer and agent experiences, data and
analytics, and distribution opportunities3.
Today’s insurance organizations face an ever-evolving and complex environment
Our technology team has delivered on legacy modernization efforts to position The
Hanover for flexibility and agility into the future1.
65

CORE SYSTEMS
AGENT-FACING
• Policy admin
• Billing/general ledger
• Claims
• Commissions
Modernization across the value chain…. … that provides us strategic options
SECURITY
• Data protection
• Third-party risk
• Threat and vulnerability
DATA AND ANALYTICS
• Claims predictive
analytics
• Unstructured data
• Enterprise data
warehouse
INFRASTRUCTURE
• PL point of sale
• CL point of sale
• Data center
• Technology debt
• Operations management
DIGITAL
• Agent portal
• Customer portal
• Claims
• Platforms that can easily plug into
other ecosystems
• Reduced total cost of ownership now
and into the future
• Integrated infrastructure and security
• Modern data management and
governance
• Architecture that can capitalize on
external business capabilities that are
maturing everyday
Modernization Has Enabled Flexibility and AgilityMore than $200 million invested to reduce cost of ownership and accelerate our strategy
66

Then Now Benefits
From slow, high touch quoting to streamlined, efficient quoting
From highly manual to more digitally enabled experiences
Personal Lines
• Enhanced agent quoting experience
• Upgraded product offerings
• New policy administration platform
• Dated quoting and issuance systems
• Slow comparative rater quote
• Limited self-service capabilities
• Data-entry intensive
• Full-service agency portal (TAP)
• Sleek, modern quoting platform
• Third party data prefill capabilities
• Agent straight-through issuance
Commercial Lines and Specialty
Distribution Enablement and EngagementAddressing the evolution of independent agent technology ecosystem
Agile integration with third-
parties and digital
distributors
Agent straight-through
processing up 55%
Average time to quote has
decreased by 50%
Broadened market reach
Improved agency
experience and efficiency
67

Then NowBenefits
From high touch to leveraging technology and data for a more digital-centric
approach to underwriting
• Single underwriting workstation
• Automated risk and pricing
dashboards
• Cloud-based tools
• Third-party data integration
• Predictive analytics
• Top-quartile rating programs
• Multiple underwriting and pricing
platforms
• MS Excel-based tools
• Manual and limited third-party data
• Limited rating elements
• Physical inspections only
Small commercial product
multivariate pricing tiers
increased from 4 to 75+
Improved rating accuracy
and loss ratio performance
Digital-Centric and Efficient UnderwritingEvolving technology-enabled underwriting capabilities
Increased underwriting
efficiency
68

Then Now Benefits
From paper-dependent to technology-enabled programs
From basic data management to big data enablement
Customer Servicing
• Customer self-service capabilities
• E-signature enabled forms
• Safety-focused telematics program
• Limited or no portal capabilities
• Paper applications and wet signatures
• No telematics utilization
• Paper policy output and delivery
• Limited data download
• Agent self-service capabilities
• TAP rewards
• Personal and commercial agency data
download, eDocs, eMemos
• APIs and data exchange
Data Exchange
Customer-Centricity Through Data EnablementDriving differentiated and seamless digital agency and customer experiences
Over 10,000 TAP agency
visits per day
Increased Personal Lines
My Hanover Policy
registrations by ~50%
Increased agent and
Hanover efficiency,
productivity and capacity
~20% of Commercial Lines
customers registered for
portal
Increased growth through
agents leveraging
marketing resources
69

Digital and Automation
Core Systems
Infrastructure
Security
An Operating Model for This Dynamic EnvironmentDelivering the technology of today while reimagining tomorrow
Sustaining and incrementally
continuing to improve current
capabilities
OptimizeReimagining capabilities that
transform and differentiate
The Hanover
Transform
Balancing the portfolio of investments to support how business is transacted
today, while ensuring we are transforming the parts of the value chain that will
matter to us in the future70
LeverageReimagine
Integrate
Optimize
Sustain
Enhance
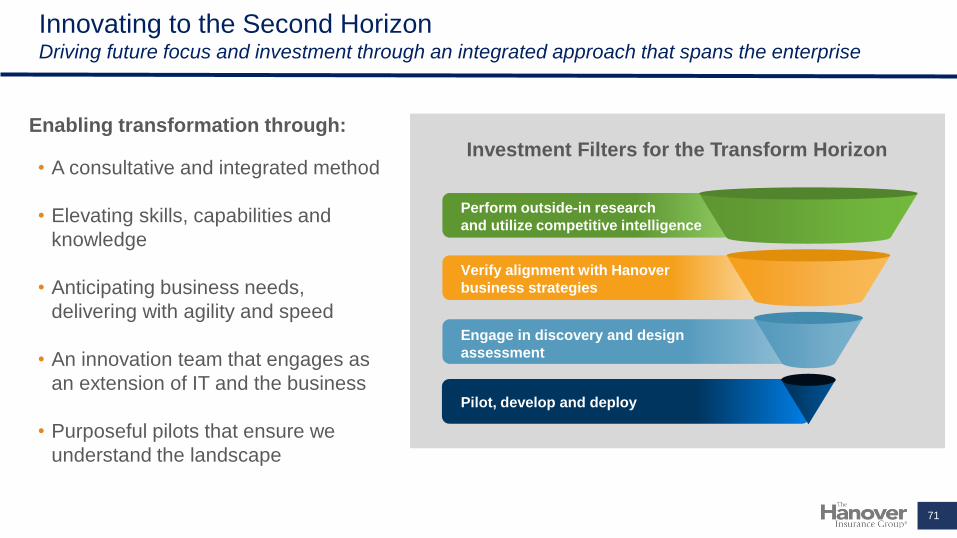
Innovating to the Second HorizonDriving future focus and investment through an integrated approach that spans the enterprise
Perform outside-in research
and utilize competitive intelligence
Verify alignment with Hanover
business strategies
Engage in discovery and design
assessment
Pilot, develop and deploy
Enabling transformation through:
• A consultative and integrated method
• Elevating skills, capabilities and
knowledge
• Anticipating business needs,
delivering with agility and speed
• An innovation team that engages as
an extension of IT and the business
• Purposeful pilots that ensure we
understand the landscape
Investment Filters for the Transform Horizon
71
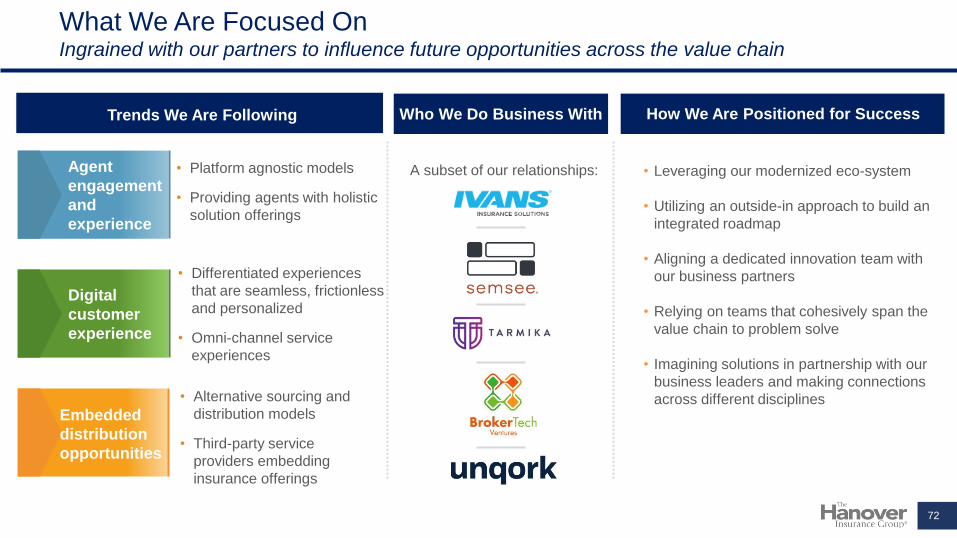
What We Are Focused OnIngrained with our partners to influence future opportunities across the value chain
Trends We Are Following How We Are Positioned for Success
• Platform agnostic models
• Providing agents with holistic
solution offerings
Agent
engagement
and
experience
Digital
customer
experience
• Differentiated experiences
that are seamless, frictionless
and personalized
• Omni-channel service
experiences
Embedded
distribution
opportunities
• Alternative sourcing and
distribution models
• Third-party service
providers embedding
insurance offerings
• Leveraging our modernized eco-system
• Utilizing an outside-in approach to build an
integrated roadmap
• Aligning a dedicated innovation team with
our business partners
• Relying on teams that cohesively span the
value chain to problem solve
• Imagining solutions in partnership with our
business leaders and making connections
across different disciplines
Who We Do Business With
A subset of our relationships:
72

Driving Value Through a
Claims Operating Model
of the Future
Mark WelzenbachEVP, Chief Claims Officer
7373

Key Takeaways
Broad and sophisticated capabilities
Our claims organization has broad and sophisticated capabilities that provide strong support
to The Hanover’s diverse and growing business1.
Transforming the way in which we operate
We have made substantial investments in data, analytics, technology and AI which we are
leveraging to completely rethink the way in which we manage the claims process2.
Specific and measurable objectives
Over the next five years, we expect our investments to improve the experience of our
customers and our staff, yield additional claims expense ratio improvement of 80-100 basis
points, and contribute toward maintaining The Hanover’s excellent loss ratios
3.
74
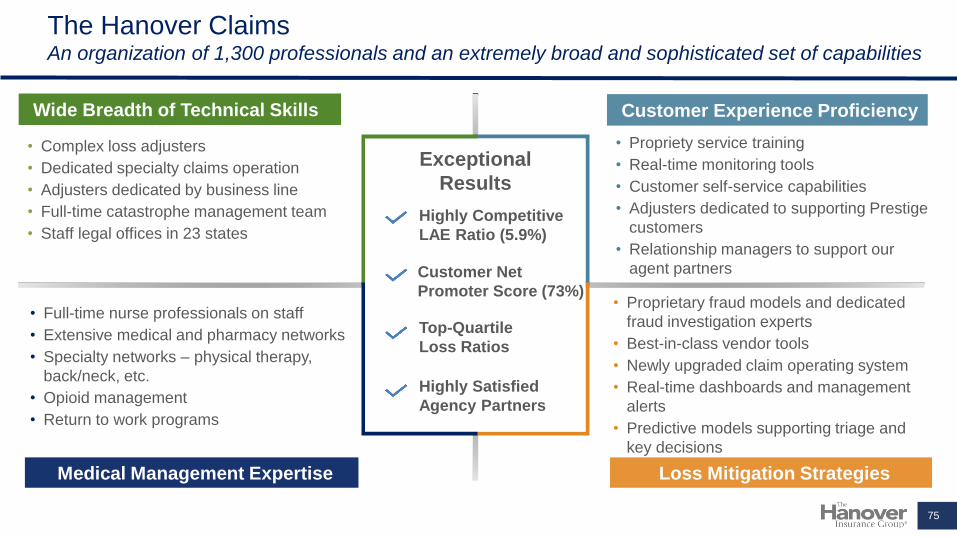
The Hanover ClaimsAn organization of 1,300 professionals and an extremely broad and sophisticated set of capabilities
Wide Breadth of Technical Skills Customer Experience Proficiency
Medical Management Expertise Loss Mitigation Strategies
• Complex loss adjusters
• Dedicated specialty claims operation
• Adjusters dedicated by business line
• Full-time catastrophe management team
• Staff legal offices in 23 states
• Propriety service training
• Real-time monitoring tools
• Customer self-service capabilities
• Adjusters dedicated to supporting Prestige
customers
• Relationship managers to support our
agent partners
• Full-time nurse professionals on staff
• Extensive medical and pharmacy networks
• Specialty networks – physical therapy,
back/neck, etc.
• Opioid management
• Return to work programs
• Proprietary fraud models and dedicated
fraud investigation experts
• Best-in-class vendor tools
• Newly upgraded claim operating system
• Real-time dashboards and management
alerts
• Predictive models supporting triage and
key decisions
Exceptional
Results
Highly Competitive
LAE Ratio (5.9%)
Customer Net
Promoter Score (73%)
Top-Quartile
Loss Ratios
Highly Satisfied
Agency Partners
75

Transforming Our OperationsWe have invested heavily in capabilities to support our vision of re-inventing our operations through
data, analytics, artificial intelligence and technology
Management Dashboards
Business Insights/
Leading Indicators
Performance Metrics
Manager Alerts
Predictive Tools
Customer Insights
Business Transformation
Data ScienceActuarial
ScienceCustomer Experience
Management
Change Management
Business Process
Redesign
Technology
Robotics
76
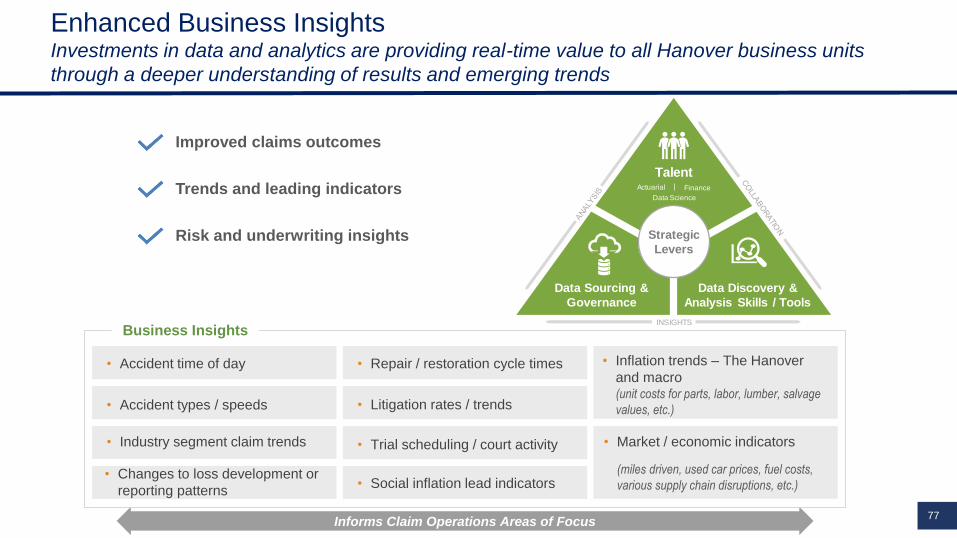
Enhanced Business InsightsInvestments in data and analytics are providing real-time value to all Hanover business units
through a deeper understanding of results and emerging trends
Informs Claim Operations Areas of Focus
• Accident time of day
• Accident types / speeds
• Industry segment claim trends
• Changes to loss development or
reporting patterns
• Repair / restoration cycle times
• Litigation rates / trends
• Trial scheduling / court activity
• Social inflation lead indicators
• Inflation trends – The Hanover
and macro(unit costs for parts, labor, lumber, salvage
values, etc.)
• Market / economic indicators
(miles driven, used car prices, fuel costs,
various supply chain disruptions, etc.)
Business Insights
Improved claims outcomes
Trends and leading indicators
Risk and underwriting insights
TalentActuarial
Data Science
Finance
INSIGHTS
Strategic
Levers
Data Sourcing &
Governance
Data Discovery &
Analysis Skills / Tools
77

Operating Model of the FutureOur vision for transforming our operations is a multi-faceted journey for which we have established
specific and measurable objectives
Enhance Customer and Employee Experiences Significantly Reduce Operating Costs Improve Indemnity Outcomes
Key Performance Goals
reduction in our loss
adjustment expense
ratio in 5 years
80-100bps
50%of first party lower risk
claims straight-through
processed
80%of first-party lower risk
claims low-touch handled or
straight-through processed
5%improvement in net
promoter score (NPS) in
3 years
65%of all claims include
digital interaction
5%overall voluntary
employee turnover ratio
of all casualty claims
leverage predictive
analytics
50bps
loss cost improvement over
5 years (not included in
current long-term models)
100%
minimum return on
investment for all analytics
initiatives
6x
Improve Indemnity Outcomes by
Leveraging Data, Analytics and
Decision Support Tools
Plan and Implement Our Future Workforce Vision
78For additional information regarding forward-looking non-GAAP measures on this page and throughout this presentation, please refer to page 108 of this presentation.
Enhance Our Customer and Employee
Experiences Through Digital, Virtual and Self-Service Capabilities
Significantly Reduce Operating Costs
Through the Integrations of Artificial Intelligence and Automation

Enhancing Our Customer and Employee Experiences Leveraging digital, virtual and self-service capabilities guided by customer journey maps
Customer Journey
ErinInvolved in minor
rear-end collision
Digital First
Notice of Loss
Erin notifies us
about the accident
via a simple,
intuitive interactive
virtual assistant on
her phone
Automated
Claims
Management
Her claim is
analyzed, and fraud
checked in real-
time and classified
as a minor claim
Digital Loss
Evaluation
As prompted, she
selects a repair
appointment with a
nearby shop; her
car is picked up at
her office for repair
Automated
Settlement
The Hanover
digitally receives the
repair invoice, which
is automatically
validated and paid
Repair and
Digital Status
Tracking
Erin is prompted to
upload a video of the
damaged vehicle, and
receives a personalized
education of coverages
and the claim process
Existing Capabilities- Examples -
Upcoming Future Investments- Examples -
Self-Service Photo App
Predictive Total Loss Determination
Predictive Fraud Tool
Intelligent Digital First Notice of Loss
Digital Repair Shop Scheduling
Digital Status Tracker
Digital Payment
79

Operational EfficiencyIntegrating artificial intelligence and automation to reduce number of touches, improving our cost
structure and redistributing adjuster time to higher value activities
Touchless
and Touch-Less
Claim Handling
Auto
Property
Predictive method of inspection
tailored to damage
Artificial intelligence with modern
imagery technology automates estimate
process
Natural language processing and robotics
facilitates liability determination
Use of drones makes roof
inspections safe for employees
and provides 3D model
Contents portal allows customers to
identify products and provides values in
real-time
Mobile app enables virtual inspections
capturing measurements and integrates with
estimating software to reduce cycle time
Technology in Motion
Artificial Intelligence
Automation
Digital Self-Service
Traditional
Leve
rs
Near-TermStarting
Point
90%
Traditional
Claim
Handling
10%
25%
45%
40%
15%
20%
55%
Future
80
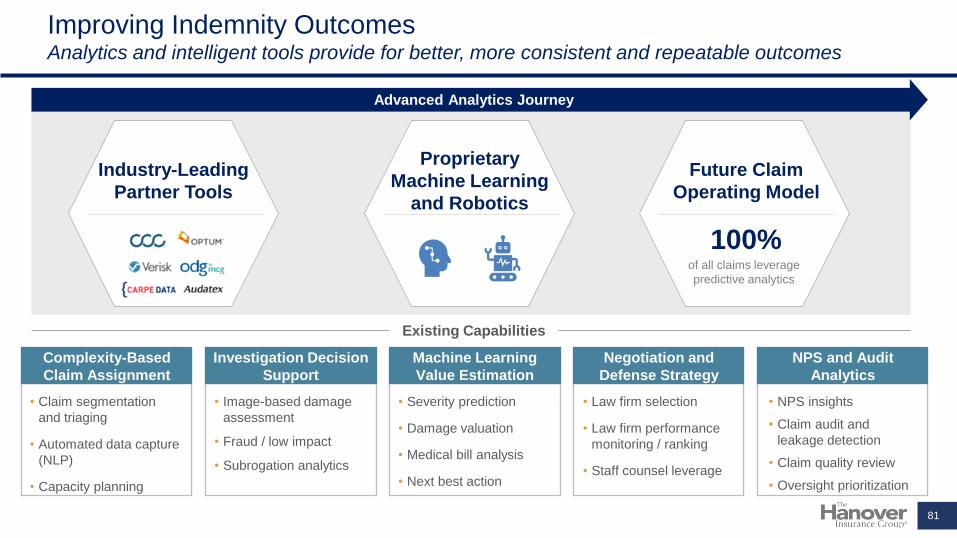
Improving Indemnity OutcomesAnalytics and intelligent tools provide for better, more consistent and repeatable outcomes
Complexity-Based
Claim Assignment
Investigation Decision
Support
Machine Learning
Value Estimation
Negotiation and
Defense Strategy
NPS and Audit
Analytics
• Image-based damage
assessment
• Fraud / low impact
• Subrogation analytics
• Claim segmentation
and triaging
• Automated data capture
(NLP)
• Capacity planning
• Severity prediction
• Damage valuation
• Medical bill analysis
• Next best action
• Law firm selection
• Law firm performance
monitoring / ranking
• Staff counsel leverage
• NPS insights
• Claim audit and
leakage detection
• Claim quality review
• Oversight prioritization
Advanced Analytics Journey
Future Claim
Operating Model
Proprietary
Machine Learning
and Robotics
100%of all claims leverage
predictive analytics
Industry-Leading
Partner Tools
Existing Capabilities
81

Benefits RealizationWhile still early in our journey, we are already realizing benefits
Loss Cost Improvements(YE Run-Rate)
LAE Improvements(YE Run-Rate)
Net Promoter Score
0.20%0.44%
0.20%
0.24%
0.20%
2019 2020 2021F
New Benefit Maintained Benefit
Benefit % EP
Benefit % EP
68%70%
73%
1Q20 4Q20 2Q21
0.44%
0.64%
0.09%0.19%
0.09%
0.11%
0.17%
2019 2020 2021F
New Benefit Maintained Benefit
0.20%
0.36%
3.84%
3.84%
2017
3.39%
2020
3.22%
0.17%
Underlying
Resource
Related
Enhanced
Capabilities
-62bps
Continued efficiency improvement while
self-funding claims transformation:
Data and Analytics
Digital Roadmap
Customer Experience
Resource Related ULAE %
82For additional information regarding forward-looking non-GAAP measures on this page and throughout this presentation, please refer to page 108 of this presentation.

4.7% 5.9% 6.0% 6.7% 10.4%
The
HanoverTop
Quartile
Second
Quartile
Third
Quartile
Bottom
Quartile
5.9% 5.9% 6.4%
8.2%
13.1%
ULAE Ratio and Competitive BenchmarkSteady improvement, highly competitive position and more improvement ahead
2020 ULAE %*
Composite** Mean = 7.4% • Strong position for The Hanover
relative to the industry, and
supporting a broad range of
business segments with sophisticated capabilities
• Continued investments in digital,
virtual and automation to maintain competitive advantage over time
Source: SNL
*Weighted to The Hanover premium composition
**Competitor composite includes the following companies: ALL, TRV, HIG, CNA, CB, WRB, CINF, MCY, SIGI, ORI, STFC, AXS, UFCS, PRA, RLI, SAFT, HMN
Quartile Range (Min/Max)
Quartile Minimum
4.5%
5.5%
6.5%
7.5%
2014 2015 2016 2017 2018 2019 2020
The Hanover
Industry
ULAE % Trend
83

Capitalizing on a
Strong Financial
Foundation
Jeff FarberEVP, Chief Financial Officer
84

Key Takeaways
Built strong track record
• Top-quartile ROE results and consistently strong earnings
• Rock-solid balance sheet1.
Positioning us well to continue building shareholder value
• Meaningful expense leverage from growth
• Cost savings from claims operating model
• Continue achieving pricing commensurate with long-term loss trends
2.
Backed by rigorous financial discipline
• Prudent reserving philosophy
• Resilient, well-diversified investment portfolio
• Thoughtful capital allocation and management
3.
85

Our Proven Track Record and Consistent Broad-Based Profitability Provide
Confidence in Achieving Our New Financial Targets
*The Hanover operating ROE is adjusted for Chaucer in 2017 through 2019
**The Hanover catastrophe ratio excludes Chaucer in 2017 through 2019
***The Hanover combined ratio for periods ended March 31, 2017, through December 31, 2019, exclude Chaucer
Peer group for operating ROE and combined ratio include AFG, ALL,SAFT, HIG, SIGI, RLI, ORI, KMPR, TRV, JRVR, WRB, CB, CINF,
CNA, STFC, ARGO, MCY, PRA, AXS, HMN, UFCS, AIG, MKL, DGICA. Peer group for catastrophe ratio excludes liability-only peers.
Track Record of Delivering
Top-Quartile Operating ROE
Other Accomplishments Since 2017 Investor Day
✓ Total shareholder return
Multi-year trend of outperformance versus peers
✓ Successful sale of Chaucer
20% IRR, 1.6x book value
✓ Moody’s upgrade in 2019
With Consistency of Earnings
Supported by Lower Catastrophe Volatility
Quarterly GAAP Combined Ratio Standard Deviation
Q1 2017 - Q2 2021
86
6.4%5.2%
3.8%
6.3%8.0%
5.9%3.9%
8.3%
2017 2018 2019 2020
The Hanover** Peer Average
9.1%
12.6% 12.8% 13.1%
5.7%7.7% 8.6%
7.5%
2017 2018 2019 2020The Hanover* Peer Average 1.9%
4.3%
7.7%
The Hanover***
Top-Quartile Peer Average
Peer Average

Our Five-Year Strategy is Designed to Continue to Deliver Top-Quartile
Financial Performance
CAGR
NPW
7+%
EPS
12-13%
BVPS
7-8%
Our Long-Term Aspirational GoalsLong-Term
Target
ROE
~14%
87For additional information regarding forward-looking non-GAAP measures on this page and throughout this presentation, please refer to page 108 of this presentation.

Roadmap to Even Stronger Returns
Growth in EPS and increasing ROE:
• Expense leverage from growth is an
important driver
• Claims cost efficiency enabled by
new platform and operating model,
as well as enhanced legal spend
rigor
Will more than overcome:
• Net investment income growth slower
than premiums
Return on Equity (ROE)
~12.5%
~14%
NormalizedRun Rate*
UnderwritingExpenseLeverage
ClaimsOperatingModel &
Initiatives
ClaimsExpenseLeverage
Net InvestmentIncome
2026
2021F Margin onGrowth
ExpenseLeverage
ClaimsOperatingModel &
Initiatives
Net InvestmentIncome
2026
Earnings per Share (EPS)
12-13%
CAGR
88For additional information regarding forward-looking non-GAAP measures on this page and throughout this presentation, please refer to page 108 of this presentation.
Normalized

• All segments contributing to aspirational
growth targets
• Portfolio shifts modestly towards the
Specialty Lines, with slight mix reduction to
Personal Lines
• Will continue to emphasize casualty growth
to balance existing property exposure
• Broad-based profitability allows for multiple
growth levers in each business
Net Premiums Written Mix
by Business Unit
Broad-Based Profitability With Multiple Growth Levers in Each BusinessWill further emphasize specialized capabilities as we grow
40%38%
20%
21%17%
16%23%
25%
$5B
~$7B
2021F 2026
Personal Lines Small Middle Specialty
~10%
~5%
7+%
~6%
CAGR
89For additional information regarding forward-looking non-GAAP measures on this page and throughout this presentation, please refer to page 108 of this presentation.
7+%
2021F 2026

Growth is Heavily Accretive to Earnings and ROE, Providing Underwriting
Expense Leverage
90
Return on Equity (ROE)
~12.5%
~14%
NormalizedRun Rate*
UnderwritingExpenseLeverage
ClaimsOperatingModel &
Initiatives
ClaimsExpenseLeverage
NetInvestment
Income
2026
For additional information regarding forward-looking non-GAAP measures on this page and throughout this presentation, please refer to page 108 of this presentation.

Continued Fixed Cost Leverage From Growth is the Foundation of
Improved Financial Performance Looking Forward
31.3%
~30.0%
2021F 2026
Deliver 130 basis points of expense ratio improvement
on the $2 billion in premium growth
• At least 20 basis point annual
improvement via fixed cost leverage
• After significant investment in
modernization of our enterprise
platforms, spend becomes
increasingly available to further
enable business growth and
innovation
Expense Ratio Improvement
from Fixed Cost Leverage
91For additional information regarding forward-looking non-GAAP measures on this page and throughout this presentation, please refer to page 108 of this presentation.

Enhancements in Claims and Continued Expense Leverage Should
Reduce LAE by up to 1 Point of the Combined Ratio
92
Return on Equity (ROE)
~12.5%
~14%
NormalizedRun Rate*
UnderwritingExpenseLeverage
ClaimsOperatingModel &
Initiatives
ClaimsExpenseLeverage
NetInvestment
Income
2026
For additional information regarding forward-looking non-GAAP measures on this page and throughout this presentation, please refer to page 108 of this presentation.

Claims Organization Benefits From Cost Savings and Leverage –
Reducing Claims Expenses by 80-100 Basis Points by 2026
• Significantly reduce operating costs through the integration of artificial intelligence and automation, enabled by recent new platform implementation
• Enhanced analytics, monitoring and utilization driving improved legal costs
Operating Model and Initiatives
• Continue managing overhead cost growth well below premium growth
Expense Leverage
93For additional information regarding forward-looking non-GAAP measures on this page and throughout this presentation, please refer to page 108 of this presentation.

Net Investment Income Growth Slower Than Underwriting Income Growth Due
to Lower Interest Rate Environment, Maintaining Prudent Investment Approach
94
Return on Equity (ROE)
~12.5%
~14%
NormalizedRun Rate*
UnderwritingExpenseLeverage
ClaimsOperatingModel &
Initiatives
ClaimsExpenseLeverage
NetInvestment
Income
2026
For additional information regarding forward-looking non-GAAP measures on this page and throughout this presentation, please refer to page 108 of this presentation.

2021F 2026
Invested
Assets
(85% Fixed
Maturities)
Cash Flows
Net
Investment
Income
Earned Yield
$9.1B
Net Investment Income Growth Slower Than Premium
Five-year strategy
Consistent, conservative approach
• Drive investment income growth with higher underwriting cash flows
• Maintain allocation strategy – investment grade fixed income continues to be foundational
• Avoid credit concentration or duration risk
• New money rates projected to steadily increase throughout the forecast period; however, earned yield on fixed maturity portfolio will modestly decline
Current Portfolio*
96%Fixed maturities are investment grade
A+Weighted
average quality
5 yearsDuration
95
$426M
3.3%
$265M
*As of period ended June 30, 2021
For additional information regarding forward-looking non-GAAP measures on this page and throughout this presentation, please refer to page 108 of this presentation.

Financial Discipline Drives Success
Capital
Management
Reserving
Discipline
Risk and
Volatility
Management
Optimize
Enterprise
Performance
• Business investment based on risk-adjusted returns
• Return excess capital to shareholders
• Rigorous underwriting performance management
• Investment in innovation
• Enterprise-wide risk management
• Responsible appetite expansion
• Conservative reserving
philosophy strengthens
resilience for future
uncertainty
• Limited earnings
volatility
96

Shares Outstanding
(in millions)
36.4
38.4
42.3
42.5
42.4
43.0
43.9
43.7
44.3
44.6
44.92010
2011
2012
2013
2014
2015
2016
2017
2018
2019
2020
Annual Return of
Excess Capital
(in millions)
Dividend Repurchases
Total $1,642
We Will Maintain Our Thoughtful and Consistent Capital Management
Philosophy
• In addition to the repurchase amounts shown, we
returned capital related to the sale of Chaucer ($550M
of share repurchases and ~$300M of special dividends)
in 2019
• Optimize reinsurance with holistic, organizational
strategy for reinsurance purchasing
• Maintain consistent debt to capital leverage and ratings
• Focused capital allocation based on risk-adjusted
returns
• Prioritize organic growth for which we generate plenty of
capital
• Return excess capital to shareholders
− Maintain track record of consistent dividend growth
− Seek opportunistic stock buy-backs
97

Potential Upside to Our Five-Year Financial Model and Strategy –
Factors Not Considered in Aspirational Goals or Financial Model
✓ Must be consistent with distribution model
✓ Accretive quickly
✓ Cultural fit
✓ Leverages data,
analytics and
enhanced
modeling tools
✓ Provides flexibility
to reinvest into the
business or take
to the bottom line
Indemnity Improvement
in ClaimsInorganic Growth
Opportunities
Expense
Efficiencies
✓ Future investments
to yield benefits in
automation and
digitization
✓ Another lever in
our discretionary
toolkit to pull for
reinvesting into the
business
98

Our Five-year Strategy Is Designed To Deliver Top-quartile Financial
Performance
Enabled by Our Value Drivers
✓ Differentiated
strategy
✓ Specialized
capabilities✓ Innovation,
data and
analytics
✓ Rigorous
financial
management
✓ ESG
focus
─ CAGR ─
NPW
7+%
EPS
12-13%
BVPS
7-8%
Our Long-Term Aspirational GoalsLong-Term
Target
ROE
~14%
99For additional information regarding forward-looking non-GAAP measures on this page and throughout this presentation, please refer to page 108 of this presentation.

Appendix
100

The Hanover’s Senior Team (Partner Group)
Will Lee
EVP, Chief Technology
and Innovation Officer
30 years
Dick Lavey
EVP, President,
Hanover Agency
Markets
30+ years
Dennis Kerrigan
EVP, General
Counsel
30+ years
Jeff Farber
EVP, Chief
Financial Officer
35 years
Jack Roche
President and CEO
35+ years
experience
Bryan Salvatore
EVP, President,
Specialty
30+ years
Mark Welzenbach
EVP, Chief Claims
Officer
40 years
Denise Lowsley
EVP, Chief Human
Resources Officer
25+ years
Ann Tripp
EVP, Chief
Investment Officer
and Treasurer
40+ years 101

Diverse Board Focused on Delivering Stakeholder Value Through
Strong Governance
Board Member Selected Experience
Cynthia Egan
Chair of the BoardT. Rowe Price, Fidelity
Kevin Bradicich McKinsey
Theodore Bunting, Jr. Entergy
Jane Carlin Morgan Stanley, Credit
Suisse
J. Paul Condrin III Liberty Mutual, KPMG
Daniel Henry American Express, Ernst &
Young
Martin Hughes HUB
Wendell Knox Abt Associates
Kathleen Lane TJX, National Grid, Gillette,
GE, Pepsi
Joseph Ramrath Colchester Partners, United
Asset Management
Harriett “Tee” Taggart Wellington
Jack Roche
CEO, The Hanover
Travelers, Fireman’s Fund,
Atlantic Mutual
P&C Insurance
Collective Expertise
Mergers and
Acquisitions
Financial Services
Finance / Accounting
Investments / Capital
Markets
Technology
Senior Management
and Talent
Development
Operations
Marketing and
Distribution
Governance
55%*gender, race
or ethnically
diverse 36%*
Female
Female
board
chairSeparate
CEO and
board chair
6.6 years*
average
tenure
*Excluding CEO
102
About The Hanover
The Hanover Insurance Group, Inc. is the holding company for several property and casualty insurance
companies, which together constitute one of the largest insurance businesses in the United States. The
company provides exceptional insurance solutions through a select group of independent agents and
brokers. Together with its agent partners, The Hanover offers standard and specialized insurance protection
for small and mid-sized businesses, as well as for homes, automobiles, and other personal items. For more
information, please visit hanover.com.
All products are underwritten by The Hanover Insurance Company or one of its insurance company
subsidiaries or affiliates ("The Hanover"). Coverage may not be available in all jurisdictions and is subject
to the company underwriting guidelines and the issued policy. This material is provided for informational
purposes only and does not provide any coverage. For more information about The Hanover visit our
website at hanover.com.
103

Forward-Looking Statements
Certain statements in this document and comments made by management may be “forward-looking statements” as defined in the Private Securities Litigation Reform Act of 1995. All statements,
other than statements of historical facts, including those related to financial and operational results and metrics from the company’s targets, 2021 forecast, 2021 outlook, 2026 strategy, and 2026
forecast, are forward-looking statements. Words such as, but not limited to, “believes”, “anticipates”, “expects”, “may”, “projects”, “projections”, “plan”, “likely”, “potential”, “targeted”, “forecasts”,
“should”, “could”, “continue”, “outlook”,” “guidance”, “modeling”,“moving forward”, “confident” and other similar expressions are intended to identify forward-looking statements, as are our references to
“goals”, “aspirations”, “targets”, “long-term aspirational goals” and “long-term targets”. Forward-looking statements by their nature address matters that are, to different degrees, uncertain. The
company cautions investors that any such forward-looking statements are estimates, beliefs, expectations and/or projections that involve significant judgment, and that historical results, trends and
forward-looking statements are not guarantees and are not necessarily indicative of future performance. Actual results could differ materially from those anticipated.
These statements include, but are not limited to, the company’s statements regarding:
• The company’s outlook and its ability to execute on five-year financial goals, including above-average profitable growth, earnings per share (EPS), book value per share (BVPS), target operating
return on equity (ROE), net premiums written (NPW) in total or by line of business, improvement in expense ratio, and top-quartile returns;
• Success of the implementation of the claims operating model, including LAE and loss cost improvement from both new and maintained benefits, combined ratio, and operating costs;
• Expectations for future operational structure in claims, including artificial intelligence, automation and digital self-service;
• The impact of the COVID-19 outbreak and subsequent global pandemic (“Pandemic”) and related economic conditions on the company’s operating and financial results, including, but not limited
to, the impact on the company’s investment portfolio, declining claims frequency as a result of reduced economic activity, severity from higher cost of repairs due to, among other things, supply
chain disruptions, declines in premium as a result of, among other things, credits or returns to the company’s customers, lower submissions, changes in renewals and policy endorsements, public
health guidance, and the impact of government orders and restrictions in the states and jurisdictions in which the company operates;
• Uses of capital for share repurchases, special or ordinary cash dividends, business investments or growth, or otherwise, and outstanding shares in future periods as a result of various share
repurchase mechanisms, capital management framework, especially in the current environment, and overall comfort with liquidity and capital levels;
• Variability of catastrophe losses due to risk concentrations, changes in weather patterns including climate change, wildfires, terrorism, civil unrest, riots or other events, as well as the complexity
in estimating losses from large catastrophe events due to delayed reporting of the existence, nature or extent of losses or where “demand surge,” regulatory assessments, litigation, coverage
and technical complexities or other factors may significantly impact the ultimate amount of such losses;
• Current accident year losses and loss selections (“picks”), excluding catastrophes, and prior accident year loss reserve development patterns, particularly in complex “longer-tail” liability lines, as
well as the inherent variability in short-tail property and non-catastrophe weather losses;
• The confidence or concern that the current level of reserves is adequate and/or sufficient for future claim payments, whether due to losses that have been incurred but not reported,
circumstances that delay the reporting of losses, business complexity, adverse judgments or developments with respect to case reserves, the difficulties and uncertainties inherent in projecting
future losses from historical data, changes in replacement and medical costs, as well as complexities related to the Pandemic, including legislative, regulatory or judicial actions that expand the
intended scope of coverages, or other factors;
• Characterization of some business or customers as being “more profitable” in light of inherent uncertainty of ultimate losses incurred, especially for “longer-tail” liability businesses;
• Efforts to manage and improve the expense ratio, including the company’s long-term expense savings targets and benefit from cost savings, while allocating capital to business investment, which
is at management’s discretion;
• Mix improvement, underwriting initiatives, coverage restrictions and pricing segmentation actions, among others, to grow businesses believed to be more profitable or reduce premiums
attributable to products or lines of business believed to be less profitable; balance rate actions and retention; offset long-term and/or short-term loss trends due to increased frequency; increased
“social inflation” from a more litigious environment and higher average cost of resolution, increased property replacement costs, and/or social movements;
Forward-looking Statements and Additional Risks and Uncertainties
104

• The ability to generate growth and expand market share in targeted segments through new agency appointments; rate increases (as a result of its market position, agency relationships or
otherwise), retention improvements or new business; expansion into new geographies; new product introductions; agency consolidation benefits; addressable market share; penetration of
existing agents; expense leverage; technology platforms, including TAP sales; or otherwise;
• Ability to capture new customer segments, including micro businesses, emerging affluent and high net worth;
• Ability to drive growth through market opportunities and addressable market share;
• 2026 mix of business, including mix of net written premiums by segment and/or line of business;
• Expansion of the company’s specialty commercial business through cross selling and new product solutions; and
• Investment returns and the effect of macro-economic interest rate trends and overall security yields, including the macro-economic impact of the Pandemic and corresponding
governmental initiatives taken in response, and geopolitical circumstances on new money yields and overall investment returns.
Additional Risks and Uncertainties
Investors are further cautioned and should consider the risks and uncertainties in the company’s business that may affect such estimates and future performance that are discussed in the
company’s most recently filed reports on Form 10-K and Form 10-Q and other documents filed by The Hanover Insurance Group, Inc. with the Securities and Exchange Commission (“SEC”)
and that are also available at www.hanover.com under “Investors.” These risks and uncertainties include, but are not limited to:
• The severity, duration and long-term impact related to the Pandemic, including, but not limited to, actual and possible government responses, legislative, regulatory and judicial actions,
changes in frequency and severity of claims in both Commercial and Personal Lines, impacts to distributors (including agent partners), and the possibility of additional premium
adjustments, including credits and returns, for the benefit of insureds;
• Changes in regulatory, legislative, economic, market and political conditions, particularly in response to COVID-19 and the Pandemic (such as legislative or regulatory actions that would
retroactively require insurers to cover business interruption or other types of claims irrespective of terms, exclusions or other conditions included in the contractual terms of the policies
that would otherwise preclude coverage, mandatory returns and other rate-related actions, as well as presumption legislation in regards to workers’ compensation);
• Heightened investment market volatility, fluctuations in interest rates (which have a significant impact on the market value of the investment portfolio and thus book value), U.S. Federal
Reserve actions, inflationary pressures, default rates, prolonged global market conditions and other factors that affect investment returns from the investment portfolio;
• Adverse claims experience, including those driven by large or increased frequency of catastrophe events (including those related to terrorism, riots and civil unrest), and severe weather;
• The uncertainty in estimating weather-related losses or the long-term impacts of the Pandemic, and the limitations and assumptions used to model other property and casualty losses
(particularly with respect to products with longer-tail liability lines, such as casualty and bodily injury claims, or involving emerging issues related to losses incurred as the result of new
lines of business, such as cyber or financial institutions coverage, or reinsurance contracts and reinsurance recoverables), leading to potential adverse development of loss and loss
adjustment expense reserves;
• Litigation and the possibility of adverse judicial decisions, including those which expand policy coverage beyond its intended scope and/or award “bad faith” or other non-contractual
damages, and the impact of “social inflation” affecting judicial awards and settlements;
• The ability to increase or maintain insurance rates in line with anticipated loss costs and/or governmental action, including mandates by state departments of insurance to either raise or
lower rates or provide credits or return premium to insureds as occurred in 2020;
• Investment impairments, which may be affected by, among other things, the company’s ability and willingness to hold investment assets until they recover in value, as well as credit and
interest rate risk and general financial and economic conditions;
Forward-looking Statements and Additional Risks and Uncertainties
(Continued)
105

• Disruption of the independent agency channel, including the impact of competition and consolidation in the industry and among agents and brokers;
• Competition, particularly from competitors who have resource and capability advantages;
• The global macroeconomic environment, including actions taken in response to the Pandemic, inflation, global trade wars, energy market disruptions, equity price risk, and interest rate
fluctuations, which, among other things, could result in reductions in market values of fixed maturities and other investments;
• Adverse state and federal regulation, legislative and/or regulatory actions (including recent significant revisions to Michigan’s automobile personal injury protection system and related
litigation, and various regulations, orders and proposed legislation related to business interruption and workers’ compensation coverages, premium grace periods and returns, and rate
actions);
• Financial ratings actions, in particular, downgrades to the company’s ratings;
• Operational and technology risks and evolving technological and product innovation, including risks created by remote work environments, and the risk of cyber-security attacks on or
breaches of the company’s systems and/or impacting our outsourcing relationships and third-party operations, or resulting in claim payments (including from products not intended to
provide cyber coverage);
• Uncertainties in estimating indemnification liabilities recorded in conjunction with obligations undertaken in connection with the sale of various businesses and discontinued operations;
and
• The ability to collect from reinsurers, reinsurance pricing, reinsurance terms and conditions, and the performance of the run-off voluntary property and casualty pools business (including
those in the Other segment or in Discontinued operations).
Investors should not place undue reliance on forward-looking statements, which speak only as of the date they are made and should understand the risks and uncertainties inherent in or
particular to the company’s business. The company does not undertake the responsibility to update or revise such forward-looking statements.
Additional Risks and Uncertainties (Continued)
106

The discussion in this presentation and the webcast include reference to certain financial measures that are not derived from generally accepted accounting principles, or GAAP. As discussed on
page 38 of the company’s Annual Report on Form 10-K for the year ended December 31, 2020, the company uses non-GAAP financial measures as important measures of its operating performance,
including operating income, operating income before interest expense and income taxes, operating income per share, and components of the combined ratio, both excluding and/or including,
catastrophe losses, prior-year reserve development and the expense ratio. Management believes these non-GAAP financial measures are important indications of the company’s operating
performance. The definition of other non-GAAP financial measures and terms can be found in the 2020 Annual Report on pages 67-70.
Operating income and operating income per share are non-GAAP measures. They are defined as net income (loss) excluding the after-tax impact of net realized and unrealized investment gains
(losses), gains and/or losses on the repayment of debt, other non-operating items, and results from discontinued operations. Net realized and unrealized investment gains (losses), which include
changes in the fair value of equity securities still held, are excluded for purposes of presenting operating income, as they are, to a certain extent, determined by interest rates, financial markets and
the timing of sales. Operating income also excludes net gains and losses from disposals of businesses, gains and losses related to the repayment of debt, costs to acquire businesses, restructuring
costs, the cumulative effect of accounting changes and certain other items. Operating income is the sum of the segment income from: Commercial Lines, Personal Lines, and Other, after interest
expense and income taxes. In reference to one of the company’s three segments, “operating income” is the segment income before both interest expense and income taxes. The company also uses
“operating income per share” (which is after both interest expense and income taxes). It is calculated by dividing operating income by the weighted average number of diluted shares of common stock.
The company believes that metrics of operating income and operating income in relation to its three segments provide investors with a valuable measure of the performance of the company’s
continuing businesses because they highlight the portion of net income attributable to the core operations of the business. Income (loss) from continuing operations is the most directly comparable
GAAP measure for operating income (and operating income before income taxes) and measures of operating income that exclude the effects of catastrophe losses and/or reserve development
should not be misconstrued as substitutes for income from continuing operations or net income determined in accordance with GAAP. A reconciliation of operating income (loss) to income from
continuing operations and net income for the relevant periods is included in note (5) of this presentation.
The company may also provide measures of operating income and combined ratios that exclude the impact of catastrophe losses (which in all respects include prior accident year catastrophe loss
development). A catastrophe is a severe loss, resulting from natural or manmade events, including, but is not limited to, hurricanes, tornadoes, windstorms, earthquakes, hail, severe winter weather,
freeze events, fire, explosions, civil unrest and terrorism. Due to the unique characteristics of each catastrophe loss, there is an inherent inability to reasonably estimate the timing or loss amount in
advance. The company believes a separate discussion excluding the effects of catastrophe losses is meaningful to understand the underlying trends and variability of earnings, loss and combined
ratio results, among others.
Prior accident year reserve development, which can either be favorable or unfavorable, represents changes in the company’s estimate of costs related to claims from prior years. Calendar year loss
and loss adjustment expense (“LAE”) ratios determined in accordance with GAAP, excluding prior accident year reserve development, are sometimes referred to as “accident year loss ratios.” The
company believes a discussion of loss and combined ratios, excluding prior accident year reserve development, is helpful since it provides insight into both estimates of current accident year results
and the accuracy of prior-year estimates.
The loss and combined ratios in accordance with GAAP are the most directly comparable GAAP measures for the loss and combined ratios calculated excluding the effects of catastrophe losses
and/or reserve development. The presentation of loss and combined ratios calculated excluding the effects of catastrophe losses and/or reserve development should not be misconstrued as
substitutes for the loss and/or combined ratios determined in accordance with GAAP.
Non-GAAP Financial Measures
107
Operating return on equity (“ROE”) and adjusted operating ROE (“Adjusted Operating ROE”) are non-GAAP measures. See end note (1) for a detailed explanation of how these
measures are calculated. Operating ROE is based on non-GAAP operating income, and adjusted operating ROE is a measure of operating income as a return on only that portion
of shareholders’ equity attributable to the continuing operations. In addition, the portion of shareholder equity attributed to unrealized appreciation (depreciation) on fixed maturity
investments, net of tax, is excluded. For measurement periods prior to the close of the Chaucer transaction, which occurred on December 28, 2018, “equity attributable to
Chaucer”, which was reported as discontinued operations, is excluded. For measurement periods after the closing of that transaction, “the undeployed equity”, and related net
investment income, is excluded. This eliminates the dilutive impact of any excess capital that would have been included in shareholders’ equity and net investment income
included in operating income for the corresponding periods presented. The company believes this measure is helpful in that it provides insight to the capital used by, and results
of, the continuing business exclusive of interest expense, income taxes, and other non-operating items. These measures should not be misconstrued as substitutes for GAAP
ROE, which is based on net income and shareholders’ equity of the entire company and without adjustments. Total shareholders’ equity, excluding net unrealized appreciation
(depreciation) on fixed maturity investments, net of tax, is a non-GAAP measure. Total shareholders’ equity is the most directly comparable GAAP measure.
Book value per share, adjusted for special dividends, is a non-GAAP measure. Book value per share is the most directly comparable GAAP measure.
Forward-looking Non-GAAP Measures
The company calculates forward-looking non-GAAP financial measures based on its internal forecasts, among other factors. Forward-looking non-GAAP measures, including
normalized run rate, 2021 forecast and 2026 forecast, are not reconciled because such measures and reconciliations are not available without unreasonable effort that would
require the company to make estimates or assumptions about unidentified and unknown factors during the period referenced, such as catastrophes, economic and market
conditions, and competitive factors, among others. References to return on equity (“ROE”) and earnings per share (“EPS”) on this page and throughout this presentation reference
operating ROE and operating EPS, which are non-GAAP measures. The company’s forecast, including, but not limited to, operating return on equity (“ROE”), net premiums
written (“NPW”), operating earnings per share (“EPS”), book value per share (“BVPS”) and expense ratio, are non-GAAP measures. The company’s forecast represents long-term
aspirational goals, which reflect the company’s current expectations for future periods and could differ materially from actual results.
Normalized run rate for operating ROE is based on the company’s best estimate for 2021, and includes normalization for catastrophe losses, favorable prior-year development,
partnership income and current accident year losses, primarily COVID-19. In addition, this is consistent with the historical average over the past 3.5-year period. Normalized
operating EPS for 2016 includes normalization for unfavorable development and catastrophe losses. 2021 operating EPS forecast is based on the company’s best estimate for
2021, and includes normalization for catastrophe losses as well as for favorable prior-year development, partnership income and current accident year losses, which were
normalized primarily for COVID-19.
Non-GAAP Financial Measures (Continued)
108

End Notes
(1) Operating Return on Average Equity and Adjusted Operating Return on Average Equity (“Operating ROE” and “Adjusted Operating ROE”)
are non-GAAP measures. Operating ROE is calculated by dividing annualized operating income after tax for the applicable period (end note
(5)), by average shareholders’ equity, excluding unrealized appreciation (depreciation) on fixed maturity investments, net of tax, for the stated
period (end note (7)). For the calculation of Adjusted Operating ROE, shareholders’ equity is adjusted for “equity attributable to Chaucer” for
measurement periods prior to the close, which occurred on December 28, 2018, for “the [then] undeployed equity” for measurement periods
post-close and for net unrealized appreciation (depreciation) on fixed maturity investments, net of tax (end note (7)). Please see end note (7)
for a detailed reconciliation of adjusted shareholders’ equity with and without both net unrealized appreciation (depreciation) on fixed maturity
investments, net of tax, and including the payment of the $250 million ASR agreement for the full year 2019 calculation. Additionally, for the
calculation of Adjusted Operating ROE, operating income, net of tax, is adjusted for the net investment income related to undeployed equity
attributable to Chaucer, net of tax. Operating ROE and Adjusted Operating ROE should not be construed as substitutes for GAAP ROE. See
calculations in table on the following page, including the calculation of Net Income ROE using net income, annualized, and average
shareholders’ equity without adjustments:
109

End Notes (Continued)
*Net investment income related to the un-deployed equity attributable for each quarter is calculated by multiplying the respective
quarter’s un-deployed equity attributable to Chaucer by the respective quarter’s total pre-tax yield, net of tax and dividing by 4.
110
Year ended
December 31 December 31 December 31 December 31
Net Income ROE (GAAP) 2017 2018 2019 2020
Net Income (GAAP) $186.2 $391.0 $425.1 $358.7
Average shareholders' equity (GAAP) (end note (7)) 2,942.6 2,957.5 2,965.2 3,016.3
Return on equity (GAAP) 6.3% 13.2% 14.3% 11.9%
Operating Income ROE (non-GAAP)
Operating income, net of tax (non-GAAP) $192.6 $292.1 $331.6 $355.0
Average shareholders' equity, excluding net unrealized
appreciation (depreciation) on fixed maturity investments,
net of tax, and including the ASR payment (non-GAAP) (end note (7))2,732.7 2,946.4 2,773.7 2,701.6
Operating return on equity (non-GAAP) 7.0% 9.9% 12.0% 13.1%
Adjusted Operating Income ROE (non-GAAP)
Operating income, net of tax (non-GAAP) $192.6 $292.1 $331.6
Less: Annualized net investment income related to un-deployed
equity attributable to Chaucer, net of tax (non-GAAP) - - 9.3
Operating income, excluding the net investment income
related to the un-deployed equity attributable to Chaucer, net of tax (non-GAAP) $192.6 $292.1 $322.3
Average adjusted shareholders' equity, excluding both net
unrealized appreciation (depreciation) on fixed maturity
investments, net of tax, and un-deployed equity; and
including the ASR payment (non-GAAP) (end note (7)) 2,118.1 2,323.4 2,508.5
Adjusted operating return on equity (non-GAAP) 9.1% 12.6% 12.8%

End Notes (Continued)
(2) Specialty lines, a major component of Other Commercial Lines, consist of products such as marine, surety, specialty industrial property,
excess and surplus, professional liability, management liability and program business. When discussing net premiums written and other
financial measures of our specialty businesses, the company may include non-specialty premiums that are written as part of the entire
account.
(3) Book value per share, adjusted for special dividends, is a non-GAAP measure. The company paid special dividends of $4.75 and $2.50
in January 2019 and December 2019, respectively, following the sale of its Chaucer business. Chaucer constituted the company’s
international business and was sold to China Reinsurance (Group) Corporation in 2018. Book value per share is the most directly
comparable GAAP measure and is reconciled in the table below.
(4) Here, and later in this document, the expense ratio is reduced by installment and other revenues for purposes of the ratio calculation.
December 31, June 30,
2016 2021
67.40$ 88.23$
- 7.25
67.40$ 95.48$
Period ended
Book value per share
Plus: Special dividends of $4.75 and $2.50 paid in January
2019 and December 2019, respectively
Book value per share, adjusted for special dividends
111

End Notes (Continued)
(5) Operating income (loss) and operating income (loss) per diluted share are non-GAAP measures. The following table provides the
reconciliation of operating income (loss) and operating income (loss) per diluted share to the most directly comparable GAAP measures,
income from continuing operations and income from continuing operations per diluted share, respectively, which are then reconciled to net
income and net income per diluted share, respectively:
December 31, December 31, December 31, December 31, December 31,
(in millions, except per share data) 2016 2017 2018 2019 2020
$
Per
Share $
Per
Share $
Per
Share $
Per
Share $
Per
Share
Commercial Lines $34.7 $177.4 $265.7 $300.1 $275.4
Personal Lines 177.7 158.7 146.2 144.9 212.5
Other (19.5) (8.8) (5.4) 8.6 (3.2)
192.9 327.3 406.5 453.6 484.7
(51.4) (45.2) (45.1) (37.5) (37.1)
141.5 $3.27 282.1 $6.56 361.4 $8.40 416.1 $10.24 447.6 $11.75
(46.3) (1.07) (89.5) (2.08) (69.3) (1.61) (84.5) (2.08) (92.6) (2.43)
95.2 2.20 192.6 4.48 292.1 6.79 331.6 8.16 355.0 9.32
Net realized gains (losses) from sales and other 37.6 0.87 26.7 0.62 (2.7) (0.06) 4.9 0.12 17.9 0.47
Net change in fair value of equity securities - - - - (43.4) (1.01) 106.5 2.62 13.4 0.35
Impairment losses on investments (27.4) (0.63) (5.6) (0.13) (4.6) (0.11) (2.0) (0.05) (26.3) (0.69)
Loss from repayment of borrowings (88.3) (2.05) - - (28.2) (0.65) - - (6.2) (0.16)
Other non-operating items 2.6 0.06 (10.3) (0.24) - - (3.4) (0.08) (1.6) (0.05)
Income tax benefit (expense) on non-operating items 47.3 1.10 12.7 0.30 25.8 0.60 (8.6) (0.21) 9.8 0.26
67.0 1.55 216.1 5.03 239.0 5.56 429.0 10.56 362.0 9.50
Sale of Chaucer business - - - - 131.9 3.07 (1.2) (0.03) - -
Income (loss) from Chaucer business 89.1 2.06 (13.1) (0.30) 20.0 0.46 1.6 0.04 0.4 0.01
Income (loss) from discontinued life businesses (1.0) (0.02) (16.8) (0.40) 0.1 - (4.3) (0.11) (3.7) (0.09)
$155.1 $3.59 $186.2 $4.33 $391.0 $9.09 $425.1 $10.46 $358.7 $9.42
Dilutive weighted average shares outstanding 43.2 43.0 43.0 40.6 38.1
Year ended
Operating income before income taxes
Income tax expense on operating income
Operating income after income taxes
Non-operating items:
As Reported
Income from continuing operations, net of taxes
Discontinued Operations (net of taxes):
Net income
OPERATING INCOME (LOSS)
Total
Interest expense
(6) Core Commercial business provides commercial property and casualty coverages to small and mid-sized businesses in the U.S.,
generally with annual premiums per policy up to $250,000, primarily through the commercial multiple peril, commercial auto and
workers’ compensation lines of business, as reported in the company’s financial supplement. 112

End Notes (Continued)
(7) Total shareholders’ equity, excluding net unrealized appreciation (depreciation) on fixed maturity investments, net of tax, is a non-GAAP
measure. Total shareholders’ equity is the most directly comparable GAAP measure and is reconciled in the table below and on the following pages.
For the calculation of Operating ROE, the average of total shareholders’ equity, excluding net unrealized appreciation (depreciation) on fixed
maturity investments, net of tax, for the beginning, ending, and interim (if applicable) quarters are used. For the calculation of Adjusted Operating
ROE, the average shareholders’ equity, excluding both net unrealized appreciation (depreciation) on fixed maturity investments, net of tax, and
“equity attributable to Chaucer” for measurement periods prior to the close, or “post-close undeployed equity” for measurement periods post-close,
for the beginning and ending, and interim (if applicable) quarters are used. For the calculation of Operating ROE and Adjusted Operating ROE for
the full year 2019 only, the balance at December 31, 2018 was adjusted by the $250 million paid on January 2, 2019 to eliminate the dilutive impact
the ASR would have had on unadjusted and adjusted Operating ROE.
($ in millions)
December 31,
2016
March 31,
2017
June 30,
2017
September 30,
2017
December 31,
2017
Total shareholders' equity (GAAP) $2,857.5 $2,913.5 $2,972.5 $2,972.0 $2,997.7
Less: net unrealized appreciation (depreciation) on fixed
maturity investments, net of tax 186.0 205.0 224.8 228.5 205.4
Total shareholders' equity, excluding net unrealized
appreciation (depreciation) on fixed maturity
investments, net of tax 2,671.5 2,708.5 2,747.7 2,743.5 2,792.3
Less: Pre-sale, equity attributable to Chaucer 614.6 614.6 614.6 614.6 614.6
Adjusted shareholders' equity, excluding both net unrealized
appreciation (depreciation) on fixed maturity investments,
net of tax, and equity attributable to Chaucer $2,056.9 $2,093.9 $2,133.1 $2,128.9 $2,177.7
Average shareholders' equity (GAAP) $2,942.6
Average shareholders' equity, excluding net unrealized apprecation
(depreciation) on fixed maturity investments, net of tax $2,732.7
Average adjusted shareholders' equity, excluding both net
unrealized appreciation (depreciation) on fixed maturity
investments, net of tax, and equity attributable to Chaucer $2,118.1
All of these tables are using the language found in their respective presentations
113

End Notes (Continued)
($ in millions)
December 31,
2017
March 31,
2018
June 30,
2018
September 30,
2018
December 31,
2018
Total shareholders' equity (GAAP) $2,997.7 $2,913.1 $2,939.8 $2,982.4 $2,954.7
Less: net unrealized appreciation (depreciation) on fixed
maturity investments, net of tax 205.4 0.3 (48.8) (74.0) (27.2)
Total shareholders' equity, excluding net unrealized
appreciation (depreciation) on fixed maturity
investments, net of tax 2,792.3 2,912.8 2,988.6 3,056.4 2,981.9
Less: Pre-sale, equity attributable to Chaucer; or post-close,
un-deployed equity 614.6 614.6 614.6 614.6 656.6
Adjusted shareholders' equity, excluding both net unrealized
appreciation (depreciation) on fixed maturity investments,
net of tax, and pre-sale, equity attributable to Chaucer;
or post-close, un-deployed equity $2,177.7 $2,298.2 $2,374.0 $2,441.8 $2,325.3
Average shareholders' equity (GAAP) $2,957.5
Average shareholders' equity, excluding net unrealized
appreciation (depreciation) on fixed maturity
investments, net of tax $2,946.4
Average adjusted shareholders' equity, excluding both net
unrealized appreciation (depreciation) on fixed maturity
investments, net of tax, and pre-sale, equity attributable
to Chaucer; or post-close, un-deployed equity $2,323.4
114

End Notes (Continued)
($ in millions)
December 31,
2018
March 31,
2019
June 30,
2019
September 30,
2019
December 31,
2019
Total shareholders' equity (GAAP) $2,954.7 $2,927.0 $2,941.1 $3,086.8 $2,916.2
Less: net unrealized appreciation (depreciation) on fixed
maturity investments, net of tax (27.2) 90.7 192.3 235.3 216.0
Total shareholders' equity, excluding net unrealized
appreciation (depreciation) on fixed maturity
investments, net of tax 2,981.9 2,836.3 2,748.8 2,851.5 2,700.2
Less: Payment made on January 2, 2019 for the ASR
agreement entered into on December 30, 2018 250.0 - - - -
Total shareholders' equity, excluding net unrealized
appreciation (depreciation) on fixed maturity investments,
net of tax, and including the ASR payment 2,731.9 2,836.3 2,748.8 2,851.5 2,700.2
Less: Pre-sale, equity attributable to Chaucer; or post-close,
un-deployed equity 406.6 406.6 256.6 256.6 -
Adjusted shareholders' equity, excluding both net unrealized
appreciation (depreciation) on fixed maturity investments,
net of tax, and pre-sale, equity attributable to Chaucer;
or post-close, un-deployed equity $2,325.3 $2,429.7 $2,492.2 $2,594.9 $2,700.2
Average shareholders' equity (GAAP) $2,965.2
Average shareholders' equity, excluding net unrealized
appreciation (depreciation) on fixed maturity
investments, net of tax, and including the ASR payment $2,773.7
Average adjusted shareholders' equity, excluding both net
unrealized appreciation (depreciation) on fixed maturity
investments, net of tax, and pre-sale, equity attributable
to Chaucer; or post-close, un-deployed equity; and
including the ASR payment $2,508.5
115

End Notes (Continued)
($ in millions)
December 31,
2019
March 31,
2020
June 30,
2020
September 30,
2020
December 31,
2020
Total shareholders' equity (GAAP) $2,916.2 $2,736.6 $3,071.7 $3,155.0 $3,202.2
Less: net unrealized appreciation (depreciation) on fixed
maturity investments, net of tax 216.0 132.8 384.5 412.3 428.1
Total shareholders' equity, excluding net unrealized
appreciation (depreciation) on fixed maturity
investments, net of tax 2,700.2 2,603.8 2,687.2 2,742.7 2,774.1
Average shareholders' equity (GAAP) $3,016.3
Average shareholders' equity, excluding net unrealized apprecation
(depreciation) on fixed maturity investments, net of tax $2,701.6
116