hansman-dryden impact of inf techn on air transport
DESCRIPTION
Impact of ITCs technology on development of air transportTRANSCRIPT

AIAA-2005-0001
American Institute of Aeronautics and Astronautics1
The Impact of Information Technologies on AirTransportation
R. John Hansman*
Massachusetts Institute of Technology, Cambridge MA 02139, USA
The Air Transportation System and several key subsystems including the Aircraft,Airline, and Air Traffic Management are modeled as interacting control loops. The impactof Information Technologies on each of these subsystems is evaluated through theperformance of these control loops. Information technologies are seen to have a significantimpact on the safety, efficiency, capability, capacity, environmental impact and financialperformance of the Air Transportation System and its components.
Introductionhe US and International Air Transportation Systems have demonstrated remarkable growth and increasedperformance over the past few decades. Fig.1 demonstrates the growth in passenger and cargo traffic in
international regions since 1972. Strong growth can be seen in North America and Europe which continue todominate the passenger traffic. In addition, extraordinary growth can be seen in Asia/Pacific which has dominatedthe cargo traffic since the early 1990’s.
This growth in traffic has been accompanied by an increase in safety and cost efficiency. The world commercial jetaircraft fatal or hull loss accident rate decreased by a factor of 5 from 1972 to 2002 and by more than 25 from theentry of commercial jet aircraft in the early 1960’s.2 Cost efficiency has also increased. The average Cost perAvailable Seat Mile (CASM) for U.S. Airlines has decreased by over 40% since the late 1970’s.3 It is interesting tonote that this period of strong air transportation performance correlates with both the deregulation of the U.S AirlineIndustry in 1978 and the growth in Information Technologies. The commercial introduction of the microprocessorwas in 1971 and the introduction of the Intel 8086 processor (which powered most personal computers) occurred in1978 (Ref. 4) the year the US Airline industry was deregulated.
This paper explores the impact of Information Technologies on Air Transportation and attempts to identify keyInformation Technology trends, emergent issues and future opportunities for Air Transportation. In order to limit it’sscope, this paper will focus primarily on Information Technologies that influence operational closed loop feedbackcontrol at various levels. It will not address Information Technologies such as CFD and computational modelingwhich have had a significant impact on vehicle design. * Professor, MIT Department of Aeronautics and Astronautics, 33-303 MIT, Cambridge MA 02139, AIAA FellowCopyright © by MIT. Published by the American Institute of Aeronautics and Astronautics, Inc. with permission.
T
Scheduled Revenue Passenger-Kilometers by Region
0
200
400
600
800
1000
1200
1400
1970 1975 1980 1985 1990 1995 2000 2005
RP
K (
bill
ion
)
North America
Europe
Asia andPacific
Latin America& Caribbean
Middle East
Africa
Freight Tonne-Kilometers by Region
0
5
10
15
20
25
30
35
40
45
1970 1975 1980 1985 1990 1995 2000 2005
FT
K (
bill
ion
)
North America
Europe
Asia andPacific
Latin America& Caribbean
Middle East
Africa
Figure 1. Scheduled Passenger and Cargo Traffic by Region.1

AIAA-2005-0001
American Institute of Aeronautics and Astronautics2
Air Transportation System ElementsThe Air Transportation System is a classic example of what has become know as a “System of Systems”. It is an
evolved complex system with many interacting subsystems. These subsystems include technical, operational,organizational and social components. For the purposes of this paper the Air Transportation System will be parsedinto several interacting subsystems:the Vehicle System (Including thePilot), the Air Traffic Management(ATM) System, the Airline Systemand the Air Transportation System.The interaction of these subsystems isshown graphically in the Venndiagram in Fig. 2. The Vehicle Systemis the smallest operational systemelement in this decomposition. Thecontrol of the vehicle and itssubsystems constitute the inner loop ofthe air transportation system. Thevehicle is a joint element of Airlineand the Air Traffic Managementsubsystems which interact operationally through joint control of the vehicles they are responsible for. The AirlineSystem also includes a business component that involves scheduling and pricing. All of these subsystems are part ofa macro loop that defines the response of the overall Air Transportation System to demand and other social,technical and operational drivers. Each of these systems and control loops will be discussed in more detail below.
A. Air Transportation System LevelA simple conceptual model of
the interaction loop between the AirTransportation Systems and theeconomy is shown in Fig. 3. TheAir Transportation System isrepresented by the capability of theNational Airspace System (NAS),the capability of the vehicles andoperators (e.g. Airlines). Internal tothe Air Transportation System is asupply and demand loop where theairlines provide supply through theirschedule and pricing. At themacroeconomic level the AirTransportation System interacts withthe economy through severalmechanisms. The economy providesboth the source of demand andcapital which drives the AirTransportation System. In turn, theAir Transportation System drives the economy through traditional macroeconomic mechanisms such as direct,indirect and induced employment effects. However, air transportation also provides an economic “enabling” effectin the form of rapid access to people, markets, ideas and capital. While this “enabling” effect is difficult to measuredirectly, it is hypothesized that the availability of low cost air travel, coupled with low cost telecommunication hasreduced geographical barriers and stimulated economic and social mobility within the U.S. and internationally. Thiscan be observed in the growth of national and international business activity and perhaps more strikingly in socialdiffusion as families and other social units expand geographically following economic and quality of lifeopportunities.
The interaction between air transportation and the economy can be seen in Fig. 4 which shows the annual growthin U.S. GDP and U.S. Passenger Traffic measured in Revenue Passenger Miles (RPM). The clear correlationbetween GDP and air transportation activity that is observed in the U.S. is also seen in other parts of the world. It is
Figure 2. Air Transportation System Elements.
Economy
Demand Supply
AirlinesRevenue/ProfitabilityRevenue/Profitability
Pricing & SchedulePricing & Schedule
Financial Equity/Debt Markets
Direct / Indirect / Induced employment effects
Travel/Freight Need
Economic Enabling Effect(Access to people / markets / ideas / capital)
Air Transportation System
Vehicle Capability
NASCapability
Figure 3. Air Transportation System Macroeconomic Interaction Model.

AIAA-2005-0001
American Institute of Aeronautics and Astronautics3
not clear if a strong economy simplyprovides sufficient discretionaryincome to stimulate air travel or ifstrong air travel stimulates economicdevelopment however it is likely thatboth contribute.
The U.S. National AirspaceSystem (NAS) includes the Airports,Air Navigation, Surveillance,Communication, ATC and Weathersystems. The accessibility of theNAS is illustrated in Fig. 5 whichdepicts the distribution of the 3175public airports.5 The airportdistribution generally correlates withthe U.S. population distribution. Amajority of traffic flows through thetop 60 airports and much of the air
traffic is concentrated in the Eastern U.S. and at hub airports which can be seen in the plot of U.S. air traffic densityshown in Fig. 6. This concentration is a natural consequence of the hub and spoke network structure which hasevolved in the U.S. This structure is very efficient at providing accessibility throughout the network but also resultsin peak demand traffic concentrations and non-linear propagation of disturbances in the network.
There are indications that the U.S. National AirspaceSystem (NAS) is approaching capacity limits at key pointsin the system. Nominal interruptions due to weather orother factors result in non-linear amplification of delays.This can be seen in the FAA reported monthly delays inFig. 7. Starting in 2000, the system began to saturate dueto traffic growth, weather interruptions, and overscheduling at New York’s LaGuardia (LGA) airport.Decreased traffic following the September 11 attacks in2001 reduced pressure on the system until late 2003 whena return of traffic and over scheduling of Chicago’s O’Hareairport (ORD) increased delays to record levels.
The factors that determine the capacity limits of theNational Airspace System include Airport and AirspaceCapacity. At the airport level, the key constraint is runwaycapacity limited by wake vortex separation requirements.
-10%
-5%
0%
5%
10%
15%
20%
25%
30%
1965 1968 1971 1974 1977 1980 1983 1986 1989 1992 1995 1998 2001
An
nu
al G
row
th (
%)
RPMs
GDP
RecessionsDeregulationDeregulation
Figure 4. Correlation between U.S. Passenger Traffic and GDP.Data source: US Bureau of Economic Analysis and Bureau ofTransportation Statistics.
Large-Hub Primary airport
Medium-Hub Primary airport
Small-Hub Primary airport
Non-Hub Primary airport
Other Commercial airport
Relievers
General Aviation
Large-Hub Primary airport
Medium-Hub Primary airport
Small-Hub Primary airport
Non-Hub Primary airport
Other Commercial airport
Relievers
General Aviation
Figure 5. US National Airport System.Data Source: FAA.5 Figure 6. US Air Traffic Density.
OPSNET National Delays
0
10000
20000
30000
40000
50000
60000
Jan Feb Mar Apr May Jun Jul Aug Sep Oct Nov Dec
Month
To
tal D
elay
s 2004
2003
2002
2001
2000
Figure 7. US Flight Delays Reported by FAA.6

AIAA-2005-0001
American Institute of Aeronautics and Astronautics4
However it is important to note that the airport, like the NAS, is a complex adaptive system. The capacity of theother elements of the airport system, such as gates, taxiways, and landside systems such as parking are matched tothe runway capacity. Increasing runway and airport capacity at the most constrained points of the NAS is difficultdue to environmental limitations regarding noise and emissions. Information technology enabled operations such aslow noise approaches and efficient airport surface management may mitigate these limitations.
Airspace capacity is limited by controller workload, airspace design, separation standards and the bufferingcapacity of the system. Aircraft flows are restricted to assure that downstream sectors do not exceed acceptablelevels of traffic, which are set by controller workload and procedural limitations. Because of the limited ability ofthe system to buffer aircraft in the air and difficulties in coordination across multiple sectors, the system normallyruns well below the theoretical maximum capacity.
Capacity issues and delays are expected to grow in the future as air transportation activity continues to increase.Only marginal increases in airport and airspace capacity are expected under existing operating procedures. Newoperating paradigms have been proposed based on information technologies such as airborne self separation toincrease airspace capacity and dependant parallel or formation approach and departure procedures to increase airportcapacity. However, major changes in operating procedures are difficult to implement and will likely require a majorcapacity crisis or other transformative event to stimulate system change.
B. Vehicle System LevelAt the Vehicle System level there have been profound changes in aircraft systems driven by Information
Technologies over the past few decades. This is strikingly apparent in the transformation from “Steam Gauge”cockpits with electromechanical analogue instrumentation to digital “Glass Cockpit” displays. Some aircraft such asthe Boeing B-737 and B-747 series have models that span this cockpit transformation illustrating the rapid change ininformation technologies within the vehicle system. While the cockpit changes may be the most apparent, they areonly part of deeper IT changes in the vehicle subsystems.
There have been significant IT impacts at the Vehicle System level. These include safety improvements,resulting from enhanced flight control, the incorporation of alerting systems and improved crew situation awarenessdisplays. Other impacts include capability improvements such as all weather operations and operational efficiencyimprovements such as increased fuel efficiency and reduction in required crew.
As an example, some of the key IT trends and impacts on each of the major elements in the aircraft informationflow loop represented generically in Fig. 8 are discussed below.Databus – The digital databus has transformed aircraft information architectures. The databus architecture allowsdata to be used by multiple elements in the information architecture and enables a degree of functional interactionand coordination between components that was not feasible in analogue or pneumatic information transmissionsystems. The databus architecture includes both the physical elements and the interface standards.Sensors – Individual sensor technology has been revolutionized by electronic and microprocessor enabled sensorsystems. These sensors have enhanced performance and other desirable characteristics such as linear output,automatic compensation and databus compatible outputs. Entirely new classes of sensors are evolving such asmicromechanical sensors and multi-sensor systems. An example is the modern air data system that electronicallycompensates for static system installation errors as well as thermal and other effects. The improved air data systemperformance has had the effect of allowing Reduced Vertical Separation Minima (RVSM) at high altitudes, doublingthe number of flight levels above 29,000 ft and increasing airspace capacity.
Control
Sensors
ActuationDecisionSupport PilotDisplay
Databus
Figure 8. Basic Vehicle Information Flow.

AIAA-2005-0001
American Institute of Aeronautics and Astronautics5
Navigation sensors have also evolved and have had a significant impact on vehicle capability. Radio beaconsystems such as VOR/DME have been supplemented by Inertial Reference Systems (IRS) and more recently bysatellite based systems such as GPS. New complementary satellite systems such as Galileo are in development. Forapproach navigation, ILS precision approach capability has evolved to allow zero visibility landings (Cat III) forappropriately equipped airports and aircraft. GPS is currently used for non-precision approaches and severalaugmentation systems have been developed to allow GPS precision approach capability.
Radio communication capability has also evolved. Increased bandwidth in voice and data channels is availablethrough new modulation approaches and softwarebased radios. Satellite based communicationnetworks are emerging from their initialapplications in oceanic operations to domesticoperations. Air-Ground datalink capabilityimplementation has been somewhat limited by theinability to reach consensus on standards.
A number of External Threat Sensors havebeen developed which have had a significantimpact on flight safety. Airborne weather radarhas reduced the convective weather encounters.Radar altimeter based Ground Proximity WarningSystems (GPWS) terrain data base enhancementsand Terrain Awareness Warning Systems(TAWS) have reduced the incidence ofControlled Flight Into Terrain (CFIT). TrafficCollision and Avoidance Systems (TCAS) haveprovided a redundant safety net when Air TrafficControl facilities fail.Actuation – Actuation capability has evolvedfrom mechanically driven hydraulic actuators to Fly By Wire (FBW) and Fly By Light (FBL) systems. Fly by Wiresystems were initially developed for military aircraft to allow enhanced maneuvering performance. Theirincorporation on commercial aircraft is primarily driven by cost and manufacturing considerations but does open upopportunities in flight control design. There are, however, significant cost and complexity issues due to the hardwareand software integrity requirements in critical flight FBW/FBL control systems.
Control – Autoflight systems have evolved frombasic autopilot functions such as wing levelersand yaw dampers to more sophisticated 3 axisautopilots and coupled approach capability.Autothrottles evolved from simple mechanicallyservoed throttles to Full Authority Digital EngineControllers (FADEC) that provide autothrottlefunctions and also optimize engine performanceand fuel efficiency.
Flight Management Systems (FMS) integrateautoflight and navigation systems to allowtrajectory level control (Fig. 9) as well as otherflight management functions (e.g. monitoring fuel,estimating weight, performance calculations andautomatically tuning the navigation radios). Theintegrated on Flight Management Systems withFly By Wire actuation systems has enabledenvelope protection (e.g. stall and bank anglelimits) as a mechanism to increase flight safety.There are, however, different design philosophieson how these envelope protection limits should be
implemented and communicated to the crew. There is some discussion of integrating Terrain Awareness andWarning Systems (TAWS) with FBW envelope protection to prevent CFIT and potential use of aircraft as weapons.
AircraftF light
M anagementC ompute r
S tate
N av igation
Autop ilo tAuto thrust
MCP Controls
S tateCommands
Trajecto ryC ommands
CDU
Pilot
DisplaysManual Control
Figure 9. Autoflight Control Loops.
B727B737B757B777
Vertical/Speed Domain
Stab Augmentation Attitude Control State Control Trajectory Control Envelope ProtectionFBW System Turn/Pitch Knob Altitude Hold Glide Slope Track Stall protection
Control Wheel Steering Glide Slope Arm VNAV Path Overspeed protectionGo Around Turbulence* VNAV Speed
EPR VNAV AltitudeTakeoffVertical SpeedSpeedFlareAltitude CaptureGo AroundIdleThrust HoldFlight Path Angle
Lateral Domain
Stab Augmentation Attitude Control State Control Trajectory Control Envelope ProtectionYaw Dampers Turn/Pitch Knob Heading Select Localizer Auto Bank LimitingFBW System Control Wheel Steering Heading Hold LNAV
ATT: Hold Engage VOR TrackRolloutTakeoffGo AroundTrack SelectTrack Hold
Figure 10. Mode Proliferation in Boeing Aircraft.7

AIAA-2005-0001
American Institute of Aeronautics and Astronautics6
The evolution of the autoflight systems has resulted inan exponential increase in system complexity, softwareand the number of autoflight modes as illustrated in Figs.10 and 11. The increasing role of software in flight criticalapplications and the growth of software complexity haveraised new challenges on the design, certification,operations and life cycle cost containment. The emergenceof mode awareness errors in FMS equipped aircrafthighlighted the need to include human cognitiveconsiderations in the specification of automation systemsand their software.7
Displays – As discussed above there has been asignificant evolution in cockpit display technologies.Displays have transitioned from electro-mechanicallybased instrumentation to integrated electronic displays.These displays include Primary Flight Displays (PFD)(Fig. 12) which integrate basic aircraft state and guidanceinformation, Horizontal Situation Displays (HSD) andrecently Vertical Situation Displays (VSD) (Figs. 13 and14) which integrate navigation, FMS and external threatinformation to enhance pilot situation awareness.Integrated system monitoring displays such as the AirbusElectronic Centralized Aircraft Monitor (ECAM) orBoeing Engine Indicating and Crew Alerting System(EICAS) (Fig. 15) have become standard on modernaircraft cockpits. Head Up Displays (HUD) such as theexample in Fig. 16 have emerged in commercial aircraftcockpits primarily for approach and landing guidance andhave allowed lower (Cat II) ILS minimums under manualcontrol reducing autopilot calibration and maintenancecosts normally required for Cat II approaches.
Information Technology advances such as enhanceddatabases and communication systems are also changing
B747-200 B757/767-200B747-400
B777-200
0
25
50
75
100
1970 1975 1980 1985 1990 1995 2000
Y e a r
Object Code ( M B )
Figure 11. Software Growth in Boeing Aircraft.7
Figure 12. Primary Flight Display.8
Figure 14. Airbus Horizontal and VerticalSituation Display (courtesy of Airbus).
Figure 13. Boeing Horizontal and VerticalSituation Display.8

AIAA-2005-0001
American Institute of Aeronautics and Astronautics7
flight documentation from traditional paper based approaches to Electronic documentation systems. Normal andEmergency electronic checklist systems have been incorporated in new aircraft systems (e.g. B777 and A380).Electronic Flight Bag (EFB) systems are emerging which include instrument approach procedure charts as well asMinimum Equipment List (MEL), load planning and other information.Decision Support - Information Technologies have enabled the emergence of decision support systems includingAlerting Systems, Guidance Systems and Planning Systems. Alerting Systems have evolved from basic vehicle statemonitoring (e.g. fuel, temperatures, stall warning) to alerting based on external states. This is accomplished basedon the advanced sensor technologies discussed above (Weather Radar, EGPWS, TCAS). Guidance Systems haveevolved from Course Deviation Indicators (CDI) to Flight Directors (FD) integrated with the aircraft radionavigation or FMS systems. Planning Systems are integrated into the FMS to support flight planning, fuelmanagement, and weight and balance analysis.Crew - Required flight crew for commercial flight operations have been systematically reduced by the incorporationof Information Technologies as well as the design of simpler systems and procedures. As flight crew are a majoroperational cost, this has resulted in increased cost efficiency and operational flexibility. In the 1950’s a transoceanic cockpit crew would consist of 5 (Captain, First Officer, Flight Engineer, Navigator, Radio Operator).Advances in radio systems such as frequencytuning and selective addressing (SELCAL)allowed the radio operator to be eliminated. Theincorporation of advanced long-range navigationsystems (initially IRS systems and subsequentlyGPS) replaced the Navigator. Systemsimplification and system alerting systems (e.g.EICAS, ECAM) allowed the Flight Engineer tobe eliminated resulting in the current crewcomplement of 2 pilots (Captain and FirstOfficer).
The increasing capability of Autoflightsystems coupled with the recent successes ofmilitary UAVs has raised the potential ofuncrewed air transport for cargo and ultimatelypassenger carrying operations in the mid or farfuture. The barriers to uncrewed operations aremore social and regulatory than technical.However they raise questions regarding theallocation of function and responsibility betweenhumans and automation.
Figure 16. Head Up Display. 8
Vectors
AircraftF light
M anagementC omp ute r
S tate
N av igation
Flight PlanAmendments
Autop ilo tAuto thrust
MCP Controls
ATCF lightS trip s
Surveillance:Enroute: 12.0 sTerminal: 4.2 s
S tateC ommands
Tra jecto ryC ommands
InitialClearances
CDU
ADS : 1 sDisplays
AOC:AirlineOperationsCenter
Pilot
DisplaysManual Control
Voice
ACARS(Datalink)
Decision Aids
Figure 17. Air Traffic Management Tactical ControlLoop.
Figure 15. Engine Indicating and Crew AlertingDisplay.8

AIAA-2005-0001
American Institute of Aeronautics and Astronautics8
C. Air Traffic Management System LevelThe key Information Technologies in Air Traffic Management are; Communication, Navigation, Surveillance,
Decision Support and Information Sharing Systems. At the tactical level the basic control loop is shown in Fig. 17.The Air Traffic Controller receives aircraft state information through surveillance systems and issues commands(i.e. clearances) over voice communication channels. These commands are executed by the pilot using the aircraftautoflight and navigation systems.
The navigation systems historically determine the airway structure of the ATM system as airways were requiredto pass over traditional radio beacons. As area based navigation systems become dominant, the airway structure willbecome more flexible and efficient. However, this has yet to be fully realized because the system is required toaccommodate legacy navigation systems. Communications are still primarily by voice communications howeversome datalink ATC communications are slowly emerging generally through airline managed data communicationnetworks such as ACARS.
Aircraft position surveillance is generally through primary or secondary radars. The low update rate of ATCRADARS (typically 12 sec for enroute, 4.2 sec for terminal areas) coupled with radar resolution limits results inconservative radar separation standards and a very slow control loop. Radar resolution has improved significantlyover the past 40 years however capacity gains have been limited as separation standards were not changed at thetime of improvement and post hoc separation reductions would be perceived as compromising safety. It should benoted that the safety record for aircraft under positive radar control is extraordinary.
Capacity improvements are expected with higher update rate surveillance systems such as Automatic DependantSurveillance Broadcast (ADS-B) which is in initial implementation. These also offer the potential of direct aircraftto aircraft surveillance which would allow aircraft to self separate in some conditions allowing a much faster andmore efficient control process.
Another example of enhanced surveillance are enhanced weather surveillance systems such as the TerminalDoppler Weather Radar (TDWR) which have reduced the exposure to hazardous convective microburst encountersand have been integrated into Integrated Terminal Weather Systems (ITWS) which have increased the safety andcapacity of the key airports but providing enhanced and predictive weather information to the controllers.
Information technologies are also being used to improve efficiency and capacity of the ATM system at a morestrategic level as seen in Fig. 18 which is adapted from a representation of the ATM system by Haraldsdottier.9 The
National ATM system is aseries of interacting tacticalATC facilities which mustbe coordinated to deal withcapac i ty cons t ra in ts .Currently planned systemi n f o r m a t i o n s y s t e mi m p r o v e m e n t s a r enumerous and beyond thescope of this paper todescribe in detail. However,they can be categorized asfunctionally as improvingIn format ion Shar ing,Surveillance or DecisionSupport. It is interesting tonote that under currentoperating conditions themost effective systemsappear to be those whichsupport I n f o r m a t i o nSharing to allow enhancedcoordination and utilization
of capacity constrained resources in the NAS. Examples include Collaborative Decision Making (CDM) whichallow airlines and the FAA to coordinate schedules during weather and traffic based interruptions as well as theTraffic Flow Management function in CTAS which allows schedule coordination between Enroute and TerminalArea ATC Faculties.
AircraftGuidance and
Navigation
AC StateSensor
Traffic Control
TrafficSensor
VectorsClearances
SectorTraffic
Planning
NationalFlow
Planning
ApprovedFlight Plans
ApprovedHandoffs
DesiredSectorLoads
ClearanceRequests
Other AircraftStates
FlightPlanning
WeatherNAS Status
FlightSchedule
FiledFlight Plans
NegotiateHandoffs
Schedule ofCapacities
< 5 min5 min5-20 minhrs - day
FacilityFlow
Planning
hrs
ExecutionPlanning
PlannedFlowRates
CTAS
CTAS
AOCNETCDMASDI
ATNRadar Net
CPDLC
CPDLC
ADS-BCDTI
TrackerADS-AADS-B
AOC
CTAS
Voice
Voice
NASWIS
Delay Est.
Information Sharing
Surveillance
Decision Support
SMA
UPRURET
SMA
Figure 18. Information Technology Planned Upgrades in the Air TrafficManagement Strategic Control Loop (adapted from Ref. 9).

AIAA-2005-0001
American Institute of Aeronautics and Astronautics9
D. Airline System LevelA simple model of the key operational control elements at the airline system level is shown in Fig. 15. On the
right is the airline operational loop where the Airline Operations Control (AOC) center dispatches and coordinatesflights and related resources such as crew, aircraft, maintenance and local station facilities such as gates, ramps,baggage handling, etc. The aircraft are dispatched and controlled in flight in collaboration with Air Traffic Controland the flight crew in a triad of responsibility and control. Passengers and cargo are managed through a passengerprocessing function that is related to, but separate from, the dispatch control loop. The operational loop isresponsible for providing the air transportation services. It’s efficiency influences operating costs and the Cost perAvailable Seat Mile (CASM).
On the left side of Fig. 19 is thebusiness control loop. This loop isresponsible for determining flightschedules through the NetworkPlanning process, determiningpr i c ing th rough RevenueManagement p rocess anddistributing the seat inventorythrough Marketing and theComputer Reservation Systems.Reservation pattern data is fed backto the revenue management andnetwork planning processes. Theefficiency of the business loopcontrols revenue and determine theRevenue per Available Seat Mile(RASM). The business andoperational control loops interactthrough the flight schedule andindividual flight reservations.
Airline Flight OperationsCommunication and surveillance have had a significant impact improving system coordination in the airline
operational loop which can often span multiple continents.For flight operations the Aircraft Communication Addressing and Reporting System (ACARS) VHF datalink is
one of the most significant examples. The ACARS system is a commercial air-ground datalink operated by AIRINClimited to text messagingdue to it’s relatively lowbandwidth. ACARS wasintroduced in the late1970’s and the firstapplication was automaticreporting of aircraft Out,In, Off, On times. Manyadditional applicationsfollowed as illustrated inFig. 20 and ACARS is nowa critical component inmany airline operationalprograms from, dispatchfunctions, to coordinatingpassenger transfers, tosending maintenancerequests to automaticengine monitoring. These
Aircraft
NetworkPlanning
AirlineOps
Control
DistributionCRS
ATC
PassengerProcessing
RevenueManagement
FlightSchedule
Reservations
Payload:Passengers
BaggageCargo
TravelDemand Passengers
Dispatch
Maint
Crew
Station
etc.Sched &Pricing
SeatInventory (ASM)
Load FactorYieldsRPMsRASM
Operational LoopBusiness Loop
Figure 19. Airline Level Flight Operation and Business Control Loops.
From Aircraft
Off
En Route
From Aircraft
Position ReportsWeather ReportsDelay Info/ETAVoice RequestEngine InformationMaintenance Reports
To Aircraft
ATC Oceanic ClearancesWeather ReportsReclearanceGround Voice Request(SELCAL)
Land
From Aircraft
On
Approach
From Aircraft
Provisioning Gate Requests Estimated Time-of-Arrival Special Requests Engine Information Maintenance Reports
To Aircraft
Gate Assignment Connecting Gates Passengers and Crew ATIS
From Aircraft
Link Test/Clock UpdateFuel/Crew InformationDelay ReportsOut
To Aircraft
PDCATISWeight and BalanceAirport AnalysisV-Speeds FlightPlan-Hard CopyLoad FMC
Departure
From Aircraft
Engine Data
To Aircraft
Flight PlanUpdate WeatherReports
Taxi
From Aircraft
InFuel InformationCrew InformationFault Data (from CentralMaintenance Computer)
Taxi Takeoff
Figure 20. Example ACARS Applications (courtesy of AIRINC).

AIAA-2005-0001
American Institute of Aeronautics and Astronautics10
have had a major impact on cost and operational efficiency. For example, in-flight engine performance monitoringthrough ACARS is a critical part of engine on-condition maintenance programs which save millions of dollars inextended engine life. ACARS based maintenance reporting improves dispatch reliability by alerting stationmaintenance of discrepancies so replacement parts can be pre-positioned to allow maintenance within normalscheduled ground times.
Enhanced communication and surveillance systems have also had an impact on the other operational elements ofthe system. As in many operational industries, cell phones have provided a flexible mechanism to coordinate withcrew and personnel distributed over large geographical regions. In-flight communication and passengerentertainment systems have also influence the passenger connectivity. New services such as in-flight internet andcell phone access are in development or testing.
At the station level security requirements such as positivebag match have increased the need for surveillance andtracking of passengers and baggage. Bar code scanning ofboarding passes and baggage tags are currently used andRFID approaches have been proposed at several locations.Wireless applications for station level coordination are alsobeing tested.
Scheduling and planning tools have improved theefficiency within many of the airline operational controlsubfunctions such as maintenance scheduling, crewscheduling and dispatch. However, many of these systemswere initially developed and implemented as stand alonesystems and airlines are struggling to integrate and upgradelegacy operational systems. There are efforts to integrate thevarious operational databases into a real time flightoperational database to support day of operations activities asillustrated in Fig. 21.
Airline BusinessOptimization and simulation tools have been heavily used to maximize revenue in both the Network Planning
and revenue management processes. However clearly the most significant recent IT factor on the airline businessloop has been the internet which has shifted the playing field and undermined many of the schedule and pricingassumptions of the traditional airline industry. Airline tickets are the ideal Internet product where a consumerpurchases the product online and goes to the point of delivery to receive the product. In 1999, Airline ticketsovertook personal computers as the highest category of internet sales in the U.S.10 The internet has also improvedcost efficiency in passenger services through the proliferation of electronic tickets and online or kiosk check-insystems.
The ramification of large volume internetsales has been to increase price competitionand decrease the value consumers andairlines place on tightly scheduled airlinenetworks. Traditional Computer ReservationSystem (CRS) listed flights by elapsed timeand there was a premium to be on the firstpage of the CRS as many ticket agents wouldnot move to the second page. This led to theemergence of hub and spoke systems withvery tight connecting banks. As most internetsystems display flights by price airlines havebegun to modify their scheduling and pricingbehavior. In 2003, American Airlinesdepeaked their bank structure in their DFWand ORD hubs. An example of the DFWoriginal and depeaked departure schedule isshow in Fig 22.
Real Time Flight Ops Database
Dispatch
AircraftPassengerProcessing
CrewSchedule
Maintenance
Gates
CAPPS II
Bag Match
Customs
Figure 21. Information Sharing BetweenOperational Databases.
Figure 22. American Airlines Depeaked Schedule at DFW.11
AIAA-2005-0001
American Institute of Aeronautics and Astronautics11
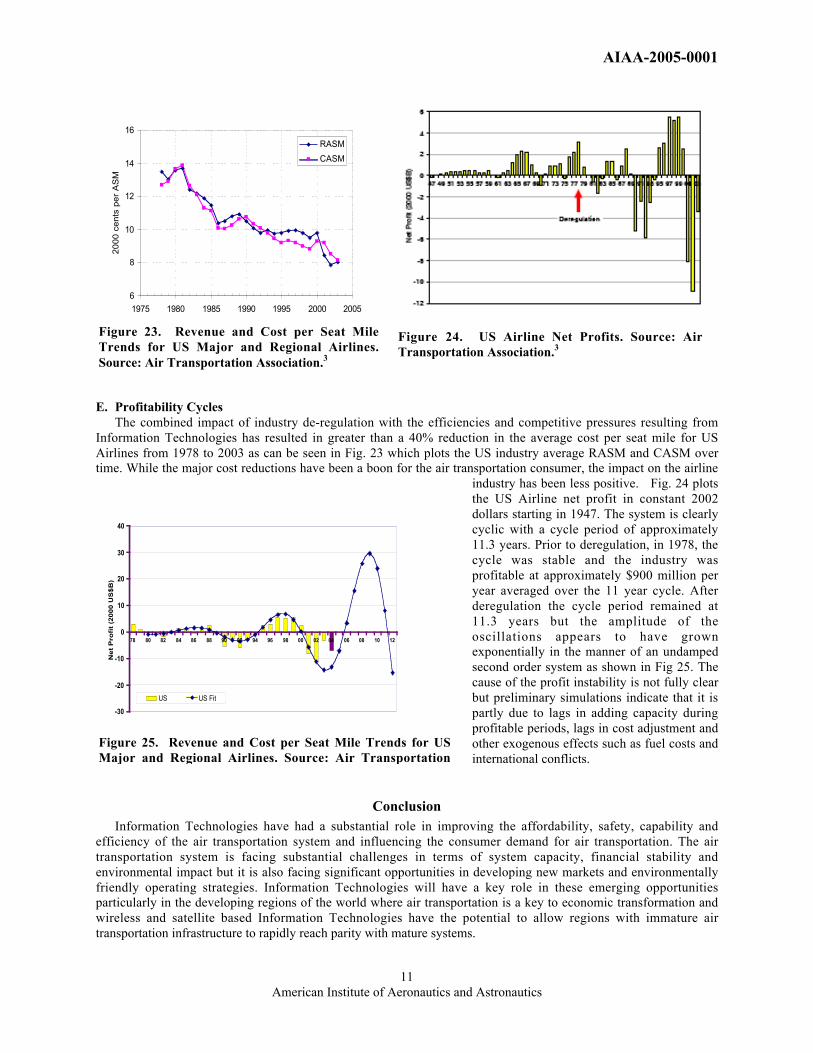
E. Profitability CyclesThe combined impact of industry de-regulation with the efficiencies and competitive pressures resulting from
Information Technologies has resulted in greater than a 40% reduction in the average cost per seat mile for USAirlines from 1978 to 2003 as can be seen in Fig. 23 which plots the US industry average RASM and CASM overtime. While the major cost reductions have been a boon for the air transportation consumer, the impact on the airline
industry has been less positive. Fig. 24 plotsthe US Airline net profit in constant 2002dollars starting in 1947. The system is clearlycyclic with a cycle period of approximately11.3 years. Prior to deregulation, in 1978, thecycle was stable and the industry wasprofitable at approximately $900 million peryear averaged over the 11 year cycle. Afterderegulation the cycle period remained at11.3 years but the amplitude of theoscillations appears to have grownexponentially in the manner of an undampedsecond order system as shown in Fig 25. Thecause of the profit instability is not fully clearbut preliminary simulations indicate that it ispartly due to lags in adding capacity duringprofitable periods, lags in cost adjustment andother exogenous effects such as fuel costs andinternational conflicts.
ConclusionInformation Technologies have had a substantial role in improving the affordability, safety, capability and
efficiency of the air transportation system and influencing the consumer demand for air transportation. The airtransportation system is facing substantial challenges in terms of system capacity, financial stability andenvironmental impact but it is also facing significant opportunities in developing new markets and environmentallyfriendly operating strategies. Information Technologies will have a key role in these emerging opportunitiesparticularly in the developing regions of the world where air transportation is a key to economic transformation andwireless and satellite based Information Technologies have the potential to allow regions with immature airtransportation infrastructure to rapidly reach parity with mature systems.
-30
-20
-10
0
10
20
30
40
78 80 82 84 86 88 90 92 94 96 98 00 02 04 06 08 10 12
Ne
t P
rofi
t (2
00
0 U
S$
B)
US US Fit
Figure 25. Revenue and Cost per Seat Mile Trends for USMajor and Regional Airlines. Source: Air TransportationAssociation.3
6
8
10
12
14
16
1975 1980 1985 1990 1995 2000 2005
20
00
ce
nts
pe
r A
SM
RASM
CASM
Figure 23. Revenue and Cost per Seat MileTrends for US Major and Regional Airlines.Source: Air Transportation Association.3
Figure 24. US Airline Net Profits. Source: AirTransportation Association.3

AIAA-2005-0001
American Institute of Aeronautics and Astronautics12
AcknowledgmentsI would like to thank the many current and former students who contributed directly or indirectly to this paper
including Helen Jiang, Ryan Tam, Philippe Bonnefoy, Sanjay Vakil, and Aleksandra Mozdzanowska. I would alsolike to thank Brian Kelly and Aslaug Haroldsdottir of Boeing and John Lauber of Airbus and AIRINC for figuresused in this paper.
References
1. ICAO 1966-2002 Civil Aviation Statistics of the World, ICAO Statistical Yearbook, International Civil AviationOrganization, Montreal, 2002.
2. Boeing, 2003 Statistical Summary of Commercial Jet Aircraft Accidents.3. Jiang, H., Hansman, R. J., “An Analysis of Profit Cycles in the Airline Industry”, MIT ICAT Report ICAT-2004-7.4. Intel, www.intel.com/research/silicon/mooreslaw.htm accessed 1/5/05].5. FAA National Plan for the Integrated Airport System.6. FAA OPSNET Data analyzed by Jim Evans, MIT Lincoln Laboratory.7. Vakil, S., Hansman, R. J., “Approaches to Mitigating Complexity-Driven Issues in Commercial Autoflight Systems,”
Reliability Engineering and System Safety, Elsevier Science, 75 (2002), 133-145, January 2002.8. Kelly, B., “Flight Deck Design and Integration in Commercial Air Transport”, Boeing Presentation to MIT Aircraft
Systems Engineering Open Courseware, http://ocw.mit.edu/OcwWeb/Aeronautics-and-Astronautics/16-885JFall2003/CourseHome/index.htm [accessed 1/5/05].
9. Haraldsdottir, A, Schwab, R., Alcabin, M., “Air Traffic Management Capacity-Driven Operational Concept Through2015” 2ne USA/Europe Air Traffic Management R&D Seminar, Orlando, December 1998.
10. U.S Statistical Abstract, 2000.11. Tam, R., Hansman, R.J., “Impact of Air Transportation on Regional Economic and Social Connectivity in the United
States”, AIAA Aircraft Technology, Integration, and Operations Forum, Los Angeles, CA, October 2002.