hardware-software implementation of a sensor network for ... · nodes are capable of detecting car...
TRANSCRIPT

Hardware-Software Implementation of a Sensor Network for CityTraffic Monitoring Using the FPGA- and ASIC-BasedSensor Nodes
Marek Wójcikowski & Robert Żaglewski &Bogdan Pankiewicz & Miron Kłosowski &Stanisław Szczepański
Received: 5 August 2011 /Revised: 19 May 2012 /Accepted: 22 May 2012 /Published online: 27 June 2012# The Author(s) 2012. This article is published with open access at Springerlink.com
Abstract This paper presents a prototype sensor networkfor monitoring urban traffic. The sensor network node,equipped with a low-resolution camera, observes the streetand detects moving objects. Object detection is based on thecustom video segmentation algorithm, using dual back-ground subtraction, edge detection and shadow detection,running on dedicated multi-processor SoC hardware. Thenumber and the speed of the detected objects are transmittedusing a low-power license-free radio transceiver to anotherneighboring node. All the nodes create a self-organizednetwork, data are aggregated at the nodes and passed furtherto the nodes closer to data sinks. Finally, information aboutthe traffic flow is collected from the sinks and visualized ona PC. The prototype sensor network node has been realizedin two versions: FPGA and ASIC. The ASIC version con-sumes approximately 500 mWand it can be powered from aphotovoltaic solar panel combined with a single cell Li-Pobattery. The comparison of power consumption of bothversions has also been made. Apart from collecting trafficdata, the proposed sensor network can gather environmentaldata, such as the temperature, the acoustic noise or the
intensity of the sunlight. The set of 26 prototype sensorshas been mounted on street lamp-poles on streets and testedin real conditions.
Keywords Wireless sensor networks . Sensor systems .
Object detection
1 Introduction
Sensor networks are very useful in collecting data fromlarge areas. Many potential examples of sensor networkscan be found in the literature [1–4]. The sensor network canalso be effectively used for urban traffic. Traffic monitoringsystems are very useful in providing management of thetraffic flow and they can help in increasing the throughputand safety of the transportation and provide valuable infor-mation for planning of future road developments. Typically,detection of moving vehicles is done by inductive loops,passive infrared sensors, magnetometers, microphones,radars or microwave sensors [5–8]. Also, high-resolutioncameras connected to the monitoring center using high-bandwidth cables or fiber optic links are often used butcollecting data from remote sensors is usually very expen-sive as far as installation and usage are concerned. In recentyears, an automatic video detection has been becomingmore popular in the literature. There are many algorithmsand systems for this purpose. Unfortunately, most of themwork with high-resolution images and require significantcomputing power, which is not suitable for low-power sen-sor networks. The paper [9] contains a survey of variousimage detection algorithms, from simple background sub-traction to optical flow and stereo vision methods. In [10],
Index Terms—wireless sensor networks, sensor systems, objectdetection
M. Wójcikowski (*) :B. Pankiewicz :M. Kłosowski :S. SzczepańskiGdańsk University of Technology,Gdańsk, POLANDe-mail: [email protected]
R. ŻaglewskiIntel Shannon Ltd.,Shannon, Ireland
J Sign Process Syst (2013) 71:57–73DOI 10.1007/s11265-012-0681-7

the authors present the algorithm dedicated for existingstreet cameras, which uses background subtraction withthe Bayesian Network Classifier. The background subtrac-tion is also used in the algorithm described in [11, 12],where pixels are modeled as the mixture of Gaussians andthe pixel model is learned using the EM algorithm. Themixture of Gaussian for low-level tracking is also proposedin [13], while high-level position estimation is done usingthe Kalman filter. The PC-based system described in [14]utilizes the probability-based foreground extraction, withcolor image processing and shadow removal. Two separatealgorithms for day and night operation are proposed in [15]:the spatio-temporal analysis is used during daytime, themorphological analysis of headlights is used at night, thecollected information is processed with the forward chainingrule production system. Another approach is described in[16], where the outlines of the detected cars are representedas quadratic B-spline curves. The 3-D model consisting ofthe edge segments is matched with 2-D image segments in[17]. In [18] an adaptive background estimation on imagedivided into non-overlapped blocks is described, with PC-based implementation capable of 15 fps image processing.In [19, 20], FPGA-based implementations are proposed,where some regions of interest are defined and analyzed inthe observed image. The self-contained computer systemrunning Linux with the attached camera is described in[21], where the authors demonstrate the application of sim-ple background detection algorithm. Traffic detection basedon frame differencing, background subtraction and virtualinduction coils are presented in [22]. [23] contains cameradetection systems evaluation and optimal camera placementconsiderations. Other video detection systems use statisticalapproach using principal component analysis and indepen-dent component analysis [24], neural network approachwith multilayer feed-forward neural network [25], supportvector machine [26] or symmetry-based vehicle detection[27, 28].
The motivation of the presented work was to propose thelow cost method (in terms of the hardware and the mainte-nance costs) of measuring the city traffic. The set of small,low-power, autonomous devices (i.e. sensor networknodes), taken out-of-the-box and attached to the streetlamp-poles, is able to evaluate the traffic using their built-in cameras and to transmit traffic data to the central com-puter, using the self-organized radio network (even ad-hocinstallation is possible in emergency situations). Data col-lected by the network can be used for many purposes, suchas: informing citizens by local radio station or internet,detecting extraordinary traffic events, guiding the emergen-cy vehicles to achieve their goal more quickly or interactingwith the traffic lights to improve the traffic flow, resulting ina decrease in traffic jams and environmental pollution.Compared to the standard vehicle detection method with
the inductive loops, the use of small sensor network nodeshas many benefits: simple installation, lack of wire connec-tions, independent radio communication, possibility to esti-mate the speed, direction and size of the vehicles, captureand transmission of single images to the monitoring center.
In this paper, a sensor network for monitoring the trafficof the vehicles on the street of a city is described. The designtarget is a low-power sensor network node capable of esti-mating the traffic flow, due to the carefully developed videodetection algorithms and proper hardware/software co-design. The node of the sensor network is designed to beinstalled on street lamp-poles to observe the scene from thelocation high above the road. Analysis of the video streamlocally by each node of the sensor network significantlyreduces the amount of data which needs to be transmittedover the radio, further decreasing the energy usage. Thenodes are capable of detecting car traffic; additionally, sin-gle images from the nodes’ cameras can be sent, informingthe operator, for example, about snow on the street.
The proposed sensor network node (Fig. 1) uses a typicallow-cost camera, thus the installation near the street lamp ismandatory to enable observation in the night.
The sensor network can be quickly and simply installedwithout the need for expensive cabling or permissions, sincethe nodes have a built-in, low-power radio working onlicense-free frequency band (see Fig. 2) and they can bepowered from the solar panel.
The layout of the paper is as follows: in section II, theauthors present the algorithm and realization of the imageprocessing for moving object detection. Section III describesthe protocol and organization of the radio communicationnetwork. The details about the realization of the prototypenodes are given in section IV. The results of the sensornetwork operation and conclusions are presented in sectionsV and VI, respectively
Main Processor(32-bit)
TransceiverController
AES
detectedobjects'dataImage
Processing Hardware
SoC
868 MHzTransceiver
Camera
SolarPanel
Sensors(temperature, etc.)
Figure 1 A conceptual diagram of the sensor network node.
58 J Sign Process Syst (2013) 71:57–73

2 Moving Object Detection
Monitoring of the traffic with a camera is a very challengingtask. It requires an image-processing algorithm capable ofdetecting cars under variable light conditions. Implementa-tion of an image-processing algorithm in the sensor networknode is further constrained by the limited resources of thenode. The sensor network node is usually a low-powerdevice using as simple hardware as possible to decrease thesize and the power consumption. Due to this fact, a carefuldesign of an image-processing algorithm which would fit intothose limited hardware resources is very important. In the
presented solution, a monochrome camera is used to reducethe complexity of the hardware by about 3 times at a cost ofdecreasing the segmentation sensitivity; additionally, the im-age resolution has been decreased to 128×128 pixels.
A. Low–Level Image Processing
In the presented implementation, the non-model-basedapproach for moving object detection with background sub-traction is used, where each current frame from the camerais subtracted from the background image stored in the mem-ory. Among the algorithms mentioned in section I, thebackground subtraction is the easiest to implement in
Non-selectiveBackground
Update
SelectiveBackground
Update
TemporalEdge
Detection
SpatialEdge
Detection
BackgroundSubtraction
BackgroundSubtraction
BinaryMask
Combination
Non-linearBrightness
Transformation
ShadowDetection
Highlightand
Extra-pixelDetection
Shadow andHighlightProcessing
FinalProcessing
mN
mS
mB
mET
mES
mHSm
SH
mHI
mX
It-1
mBEHSX
It
singleframedelay
HoughTransform m
V
N
S
Background generation blocks
Edge detection blocks
Shadow and Highlight detection blocks
Final Processing blocks
Figure 3 General diagram depicting the idea of the proposed image processing algorithm.
Front-End to the City Traffic Center
DataSink
Node 3
Node 2
Node 1
...
...
other nodes
other nodes
Figure 2 An overview of thesensor network application forcollecting traffic data.
J Sign Process Syst (2013) 71:57–73 59
hardware, but it does not provide in its basic form thedetection quality acceptable for the outdoor vehicle detec-tion. The complete block diagram of the image-processingalgorithm is shown in Fig. 3. The detailed description of thelow-level image segmentation algorithm can be found in[29], where the earlier work of the authors is presented.
The authors decided to use two background models con-currently [30–33]: long-term with non-selective update andshort-term with selective background update. In this way,the stopped objects are initially not included into the selectivebackground, but after a while become a part of the non-selective background. After being part of the non-selectivebackground, the stopped object is not detected any more, thusit can be quickly included into the selective background too.
Both background models assume single Gaussian dis-tribution of pixel intensities for time t with the averagebrightness μt and the standard deviation σt updatedusing running mode, which can be very efficiently real-ized in hardware.
I t � μtj j > k � σt ð1Þ
The detection results, using inequality (1), in the form ofthe masks: mN and mS from non-selective and selectivebackground model, respectively, are combined into a singlebinary mask mB, using special combination of and and oroperations, similarly as described in [32]. For the simplicity
of the hardware, apart from the current pixel, instead ofeight neighboring pixels, only the four previously analyzedpixels are used. To improve the segmentation quality, twoedge detection blocks have been introduced: temporal edgedetection and spatial edge detection, resulting in mask mET
and mES, respectively. To further increase the selectivity ofthe object detection, several additional blocks have beenadded, such as shadow detection block (mask mSH) orhighlight detection block detecting highlights from the carlights in the night (mask mHI) and very dark pixels on abright background (mask mX). The basic detection of shad-ows is done by comparing the decrease in brightness [34].The Final Processing block from Fig. 3 is responsible forbasic morphological operations (erosion followed by dila-tion, using 2×2 rectangular structuring element) to condi-tion the final mask mBEHSX. The final detection result is
PP116-bit
PP216-bit
PP316-bit
PP48-bit
PP58-bit
PP68-bit
PP71-bit
PP81-bit
PP91-bit
cameraImage
Transformation
Data Memory
HoughTransform
programmable switch matrix
It
It-1 N N S S
mN
mS
mB
mET
mES
mSH
mHI
mX
mBEHSX
mV
mTF
It
It - 1 N N S S
mN
mS
mB
mET
mES
mSH
mH I
mX
mBEH SX
mV
mTF
It
It - 1 N N S S
mN
mS
mB
mET
mES
mSH
mH I
mX
mBEH SX
mV
mTF
It
It - 1 N N S S
mN
mS
mB
mET
mES
mSH
mH I
mX
mBEH SX
mV
mTF
It
It - 1 N N S S
mN
mS
mB
mET
mES
mSH
mH I
mX
mBEH SX
mV
mTF
It
It - 1 N N S S
mN
mS
mB
mET
mES
mSH
mH I
mX
mBEH SX
mV
mTF
It
It - 1 N N S S
mN
mS
mB
mET
mES
mSH
mH I
mX
mBEH SX
mV
mTF
It
It - 1 N N S S
mN
mS
mB
mET
mES
mSH
mH I
mX
mBEH SX
mV
mTF
It
It - 1 N N S S
mN
mS
mB
mET
mES
mSH
mH I
mX
mBEH SX
mV
mTF
It
It - 1 N N S S
mN
mS
mB
mET
mES
mSH
mH I
mX
mBEH SX
mV
mTF
It
It - 1 N N S S
mN
mS
mB
mET
mES
mSH
mH I
mX
mBEH SX
mV
mTF
It
It - 1 N N S S
mN
mS
mB
mET
mES
mSH
mH I
mX
mBEH SX
mV
mTF
It
It - 1 N N S S
mN
mS
mB
mET
mES
mSH
mH I
mX
mBEH SX
mV
mTF
It
It - 1 N N S S
mN
mS
mB
mET
mES
mSH
mH I
mX
mBEH SX
mV
mTF
It
It - 1 N N S S
mN
mS
mB
mET
mES
mSH
mH I
mX
mBEH SX
mV
mTF
It
It - 1 N N S S
mN
mS
mB
mET
mES
mSH
mH I
mX
mBEH SX
mV
mTF
Image Memory
... 128 bits of data for single pixel
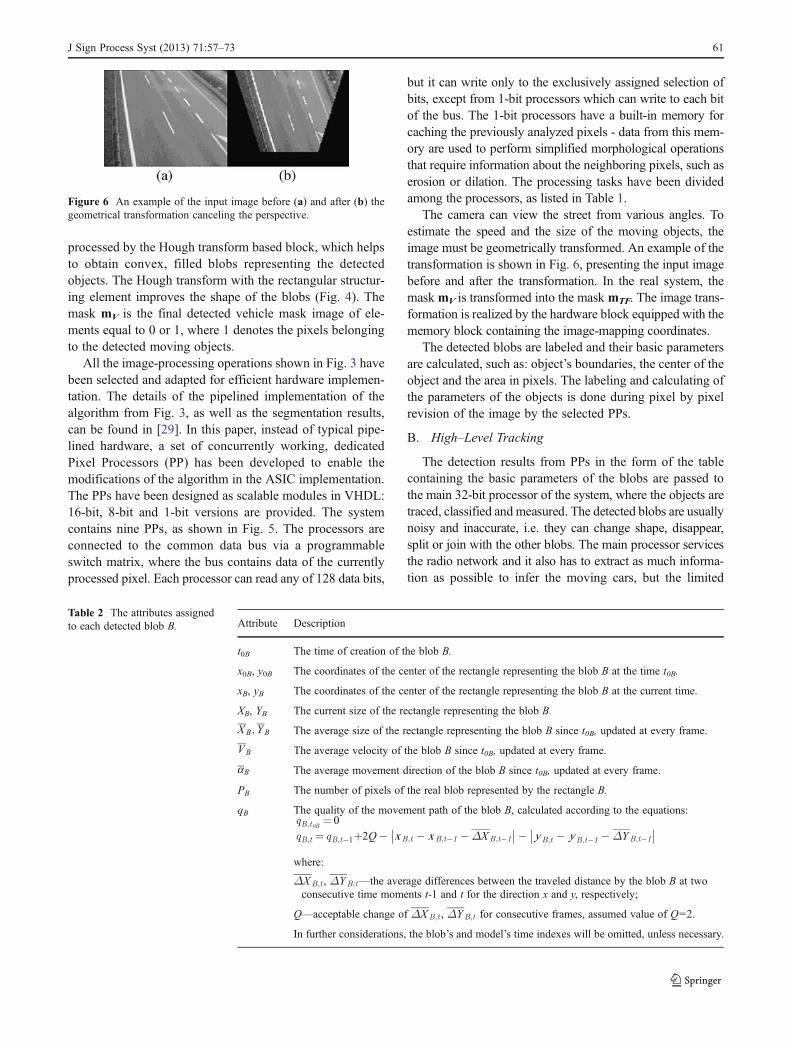
Figure 5 Block diagram of the image-processing hardware.
Table 1 The assigned tasks for PPs.
Processor Tasks
PP1 The non-selective background maintenance. Calculationof mask mB. Storing It-1.
PP2 The selective background maintenance. Calculation ofmask mS.
PP3 Calculation of masks mSH and mET.
PP4 Calculation of masks mES, mHI and mX.
PP5 Indexing of the detected objects (phase 1).
PP6 Indexing of the detected objects (phase 2). Generatingimage after indexation.Generation of the tables with objects’ parameters.
PP7 Calculating the combination of the masks mN and mS.
Calculating the combination of the masks mES and mET.
Erosion of mask mSH.
PP8 Generating the final combination of masks. Erosion of thefinal mask mBEHSX.
PP9 Dilation of the final mask mBEHSX.
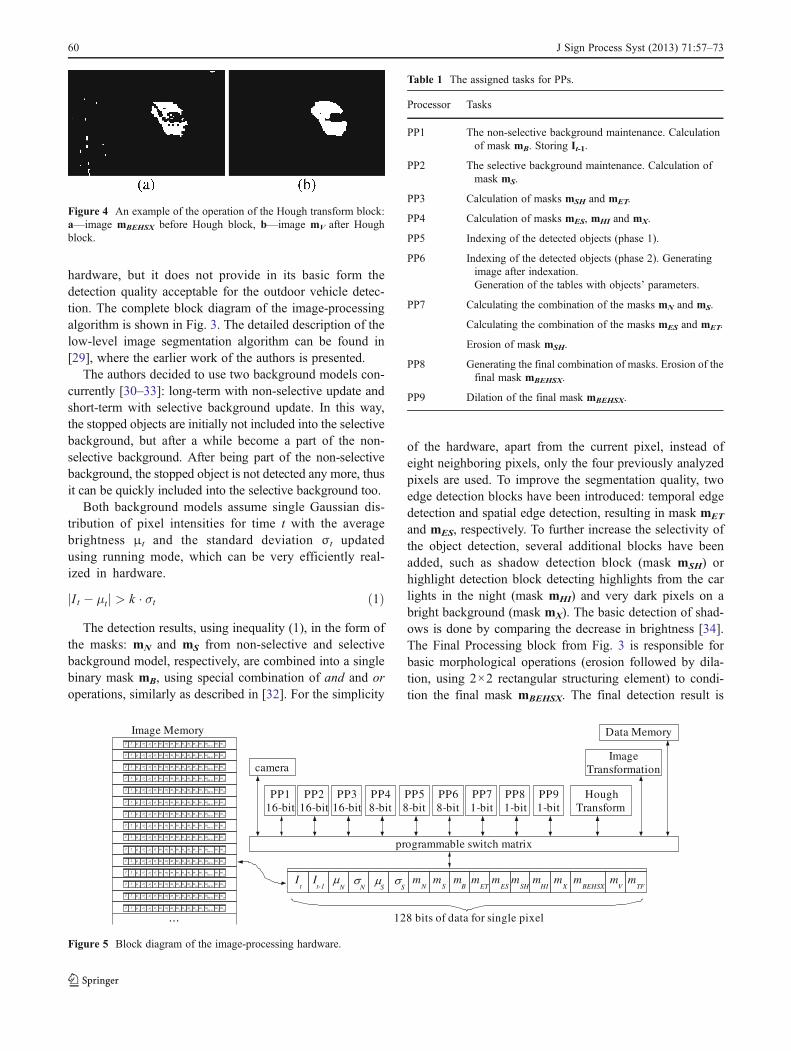
Figure 4 An example of the operation of the Hough transform block:a—image mBEHSX before Hough block, b—image mV after Houghblock.
60 J Sign Process Syst (2013) 71:57–73
processed by the Hough transform based block, which helpsto obtain convex, filled blobs representing the detectedobjects. The Hough transform with the rectangular structur-ing element improves the shape of the blobs (Fig. 4). Themask mV is the final detected vehicle mask image of ele-ments equal to 0 or 1, where 1 denotes the pixels belongingto the detected moving objects.
All the image-processing operations shown in Fig. 3 havebeen selected and adapted for efficient hardware implemen-tation. The details of the pipelined implementation of thealgorithm from Fig. 3, as well as the segmentation results,can be found in [29]. In this paper, instead of typical pipe-lined hardware, a set of concurrently working, dedicatedPixel Processors (PP) has been developed to enable themodifications of the algorithm in the ASIC implementation.The PPs have been designed as scalable modules in VHDL:16-bit, 8-bit and 1-bit versions are provided. The systemcontains nine PPs, as shown in Fig. 5. The processors areconnected to the common data bus via a programmableswitch matrix, where the bus contains data of the currentlyprocessed pixel. Each processor can read any of 128 data bits,
but it can write only to the exclusively assigned selection ofbits, except from 1-bit processors which can write to each bitof the bus. The 1-bit processors have a built-in memory forcaching the previously analyzed pixels - data from this mem-ory are used to perform simplified morphological operationsthat require information about the neighboring pixels, such aserosion or dilation. The processing tasks have been dividedamong the processors, as listed in Table 1.
The camera can view the street from various angles. Toestimate the speed and the size of the moving objects, theimage must be geometrically transformed. An example of thetransformation is shown in Fig. 6, presenting the input imagebefore and after the transformation. In the real system, themaskmV is transformed into the maskmTF. The image trans-formation is realized by the hardware block equipped with thememory block containing the image-mapping coordinates.
The detected blobs are labeled and their basic parametersare calculated, such as: object’s boundaries, the center of theobject and the area in pixels. The labeling and calculating ofthe parameters of the objects is done during pixel by pixelrevision of the image by the selected PPs.
B. High–Level Tracking
The detection results from PPs in the form of the tablecontaining the basic parameters of the blobs are passed tothe main 32-bit processor of the system, where the objects aretraced, classified and measured. The detected blobs are usuallynoisy and inaccurate, i.e. they can change shape, disappear,split or join with the other blobs. The main processor servicesthe radio network and it also has to extract as much informa-tion as possible to infer the moving cars, but the limited
Table 2 The attributes assignedto each detected blob B. Attribute Description
t0B The time of creation of the blob B.
x0B, y0B The coordinates of the center of the rectangle representing the blob B at the time t0B.
xB, yB The coordinates of the center of the rectangle representing the blob B at the current time.
XB, YB The current size of the rectangle representing the blob B.
X B; YB The average size of the rectangle representing the blob B since t0B, updated at every frame.
VB The average velocity of the blob B since t0B, updated at every frame.
aB The average movement direction of the blob B since t0B, updated at every frame.
PB The number of pixels of the real blob represented by the rectangle B.
qB The quality of the movement path of the blob B, calculated according to the equations:qB;t0B ¼ 0
qB;t ¼ qB;t�1þ2Q� x B;t � x B;t�1 �ΔXB;t�1
�� ��� y B;t � y B;t�1 �ΔYB;t�1
�� ��where:
ΔXB;t , ΔYB;t—the average differences between the traveled distance by the blob B at twoconsecutive time moments t-1 and t for the direction x and y, respectively;
Q—acceptable change of ΔXB;t , ΔYB;t for consecutive frames, assumed value of Q02.
In further considerations, the blob’s and model’s time indexes will be omitted, unless necessary.
Figure 6 An example of the input image before (a) and after (b) thegeometrical transformation canceling the perspective.
J Sign Process Syst (2013) 71:57–73 61

computing resources did not allow the use of the Kalman filterapproach in real time, therefore a simplified method has beenused. For that purpose, a set of if-then heuristic rules has beenapplied, working on simple rectangular models of the blobs.For every picture frame, each detected blob is always modeledas the rectangle B (denoted as blob B in the further text) withthe assigned attributes shown in Table 2.
For simplicity, all the average values are calculated asrunning mean and the movement path is approximated witha straight line. The overlapping of the blobs in the current andthe previous frame is detected by the PP and both such blobsare treated as representing the same moving object, providingthe continuity of the existence of the blob’s rectangle B. If theblob B disappears, the virtual model M is created, continuingthe movement of the blob B, using the last known values forsize, direction and speed of the disappeared blob B. Theattributes of the model M are listed in Table 3.
A simple example of blob processing is shown in Fig. 7,where at the time t, a new blob has been detected and
marked as Bt (the speed VB; t and the direction aB; t areunknown at this time). At the next time step t+1, the blobchanges its position and shape, but, due to the overlappingwith the blob from time t, it is treated as the same movingblob, so the attributes of Bt are copied to Bt+1, also the first
approximation of the speed of the blob VB;tþ1 can becalculated, as well as aB;tþ1. At the time step t+2, the blobdisappears, but its existence is represented by the newlycreated model Mt+2 with the following attributes:
t0M ¼ t0BXM ; YMð Þ ¼ XB;tþ1; YB;tþ1
� �VM ¼ VB;tþ1; aM ¼ aB;tþ1
ð2Þ
When the size of the blob B changes (which could meanjoining with another blob or splitting), new objects arecreated: a new model M, as a continuation of the B, andthe new blob (or blobs in the case of splitting) representingthe current blob. As an example, two moving blobs are
Bt
VB,t
= unknown
YB,t
XB,t
Bt+1
VB,t+1
YB,t+1
XB,t+1
Mt+2
VMY
M
t
XM
Figure 7 An example of transforming the blob B into the modelM. Atthe time t a new blob has been detected and marked as Bt. Next, at t+1,the new blob overlaps with the blob from time t, so it is considered as
the continuation of Bt. At the time t+2 the blob disappears, but themodel Mt+2 continues the movement of B.
Table 3 The attributes assignedto each model M. Attribute Description
t0M The time of creation of the blob replaced by the model M.
x0M, y0M The coordinates of the center of the rectangle M at the time t0M.
xM, yM The current coordinates of the center of the rectangle M, calculated as:
xM;t ¼ xM;t�1 þ VM cos aMð ÞyM;t ¼ yM;t�1 þ VM sin aMð Þ
XM, YM The size of the rectangle M.
VM The velocity of the model M.
αM The movement direction of the model M.
TM Time to live for the model M. At every time step, the value of TM is decreased by 1. If TM00, themodel is deleted (applicable only for the short-term model, as explained in the text).
SM The value informing about the size of the model, relative to the size of a typical car:
10small when w<0.5·Wt
20normal when 0.5·Wt≤w≤3·Wt
30big when w>3·Wt
where:
w is calculated as the width of car cast in the direction of its movement;
Wt is the width of a typical car (2 m).
62 J Sign Process Syst (2013) 71:57–73
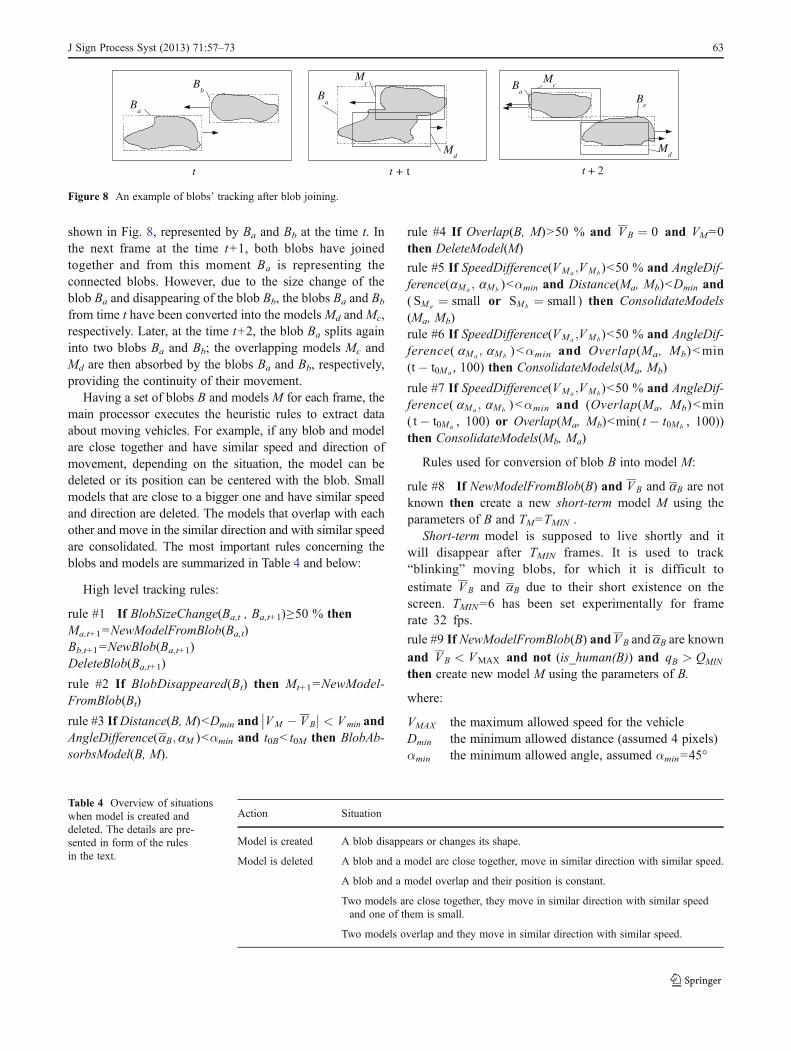
shown in Fig. 8, represented by Ba and Bb at the time t. Inthe next frame at the time t+1, both blobs have joinedtogether and from this moment Ba is representing theconnected blobs. However, due to the size change of theblob Ba and disappearing of the blob Bb, the blobs Ba and Bb
from time t have been converted into the modelsMd andMc,respectively. Later, at the time t+2, the blob Ba splits againinto two blobs Ba and Bb; the overlapping models Mc andMd are then absorbed by the blobs Ba and Bb, respectively,providing the continuity of their movement.
Having a set of blobs B and models M for each frame, themain processor executes the heuristic rules to extract dataabout moving vehicles. For example, if any blob and modelare close together and have similar speed and direction ofmovement, depending on the situation, the model can bedeleted or its position can be centered with the blob. Smallmodels that are close to a bigger one and have similar speedand direction are deleted. The models that overlap with eachother and move in the similar direction and with similar speedare consolidated. The most important rules concerning theblobs and models are summarized in Table 4 and below:
High level tracking rules:
rule #1 If BlobSizeChange(Ba,t , Ba,t+1)≥50 % thenMa,t+10NewModelFromBlob(Ba,t)Bb,t+10NewBlob(Ba,t+1)DeleteBlob(Ba,t+1)
rule #2 If BlobDisappeared(Bt) then Mt+10NewModel-FromBlob(Bt)
rule #3 If Distance(B, M)<Dmin and VM � VBj < Vmin
�� andAngleDifference(aB; aM )<αmin and t0B<t0M then BlobAb-sorbsModel(B, M).
rule #4 If Overlap(B, M)>50 % and VB ¼ 0 and VM00then DeleteModel(M)
rule #5 If SpeedDifference(VMa ;VMb)<50 % and AngleDif-ference(aMa ; aMb )<αmin and Distance(Ma, Mb)<Dmin and( SMa ¼ small or SMb ¼ small ) then ConsolidateModels(Ma, Mb)rule #6 If SpeedDifference(VMa ;VMb)<50 % and AngleDif-ference( aMa ; aMb ) <αmin and Overlap(Ma, Mb) <min(t� t0Ma , 100) then ConsolidateModels(Ma, Mb)
rule #7 If SpeedDifference(VMa ;VMb)<50 % and AngleDif-ference( aMa ; aMb ) <αmin and (Overlap(Ma, Mb)<min( t� t0Ma , 100) or Overlap(Ma, Mb)<min( t � t0Mb , 100))then ConsolidateModels(Mb, Ma)
Rules used for conversion of blob B into model M:
rule #8 If NewModelFromBlob(B) and VB and aB are notknown then create a new short-term model M using theparameters of B and TM0TMIN .
Short-term model is supposed to live shortly and itwill disappear after TMIN frames. It is used to track“blinking” moving blobs, for which it is difficult to
estimate VB and aB due to their short existence on thescreen. TMIN06 has been set experimentally for framerate 32 fps.
rule #9 If NewModelFromBlob(B) andVB and aB are known
and VB < VMAX and not (is_human(B)) and qB > QMIN
then create new model M using the parameters of B.
where:
VMAX the maximum allowed speed for the vehicleDmin the minimum allowed distance (assumed 4 pixels)αmin the minimum allowed angle, assumed αmin045°
Table 4 Overview of situationswhen model is created anddeleted. The details are pre-sented in form of the rulesin the text.
Action Situation
Model is created A blob disappears or changes its shape.
Model is deleted A blob and a model are close together, move in similar direction with similar speed.
A blob and a model overlap and their position is constant.
Two models are close together, they move in similar direction with similar speedand one of them is small.
Two models overlap and they move in similar direction with similar speed.
Bb
Ba
Md
Mc
Ba
+tt t
Be
Ba
Mc
Md
t + 2
Figure 8 An example of blobs’ tracking after blob joining.
J Sign Process Syst (2013) 71:57–73 63

The function is_human() is a simple and rough estimate,if the detected blob could be a person walking along thestreet (assuming that the camera is situated high above theroad) and is calculated as:
is humanðBÞ ¼ true when VB < VMIN ^ 3 < YB XB < 6 ^ PHMIN < PB < PHMAX
�false otherwise
� �
ð3Þwhere:
VMIN the maximum speed for walking humanPHMIN,PHMAX
the constant defining the minimum andmaximum number of pixels, respectively, forthe blob recognized as a person. The values ofPHMIN and PHMAX are calculated to representthe area of 0.75 m2 and 3 m2, respectively, atthe image after geometrical transformation.
QMIN the constant defining the minimum allowedobject’s movement path quality qB.
The quality qB of the movement path of the blob B iscalculated according to the equations:
qB;t0B ¼ 0
qB;t ¼ qB;t�1 þ 2Q� xB;t � xB;t�1 �ΔXB;t�1
�� ��� yB;t � yB;t�1 �ΔYB;t�1
�� ��ð4Þ
where:
ΔXB;t; ΔYB;T the average differences between the traveleddistance by the blob B at two consecutive
time moments t-1 and t for the direction xand y, respectively.
Q acceptable change of ΔXB;t; ΔYB;T forconsecutive frames, assumed value of Q02.
BlobSizeChange Bt;Btþ1ð Þ ¼ maxXB;t�XB;tþ1j j
max XB;t ;XB;tþ1ð Þ ;YB;t�YB;tþ1j j
max YB;t ;YB;tþ1ð Þ�
ð5Þ
Distance(B, M)
the shortest distance between the outlines oftwo rectangles: B and M. If the rectanglesoverlap, the distance is 0.
SpeedDifference V1 ;V2ð Þ ¼ V1 � V2j jmax V1 ;V2ð Þ 100% ð6Þ
AngleDifference(α1, α2)
the difference between two angles α1
and α2.Overlap(B, M)
returns % of overlapping area between therectangles B and M with respect to the areaof B.
BlobAbsorbsModel(B, M)
the attributes’ values of the model M arecopied to the blob B and the model M isdeleted.
ConsolidateModels(Ma, Mb)
the models Ma and Mb are compared andthe model which exists shorter is deleted,the remaining model is updated with thespeed and moving direction as the averageof the respective values from Ma and Mb.
Table 6 The comparison of themost important parameters of802.15.4 and the protocol pre-sented in this paper.
Description 802.15.4 The protocol used in this thepresented sensor network node
Beacon interval approx. 15 ms–4 min. 100 s
Access to the transmission medium Contention based and contentionfree periods
Only contention free.
Number of channels 1 at 868 MHz 1 at 868.5 MHz10 at 902–928 MHz
16 at 2400–2483.5 MHz
Data rate (at 868 MHz band) 20 kbps 38.4 kbps
Preamble length 32 bits 10 bits
Table 5 The bit lengths of thetransmission headers indifferent protocols.
Protocol/remarks Description Length [bits]
802.11 MAC header 240
802.15.4, (PHY+MAC header) Beacon: 80–176
Data: 96–192
Ack 32
Protocol used in this paper. Header already contains its own16-bit CRC. Each header (including Ack) contains additionaldata about the state of the transmitting node: battery state,external power supply, data buffer level.
Beacon 64
Data 64
Ack 64
64 J Sign Process Syst (2013) 71:57–73
The rules have been presented in a simplified form to aidthe readability, in fact more conditions are checked, i.e. toprotect from processing invalid data, division by 0, etc.
The moving models which leave the picture frame arefiltered and only those considered as reliable are counted.The model is considered reliable if it comes from a blob thathas been moving smoothly for some time (depending on thequality qB of the movement path) or it has been often over-lapping with blobs moving with similar size, speed anddirection. The traffic flow data are constantly updated, themoving vehicles are classified according to their speed anddirection—this information is periodically transmitted bythe radio to a nearby node which is closer to the data sink.
3 Data Transfer in the Sensor Network
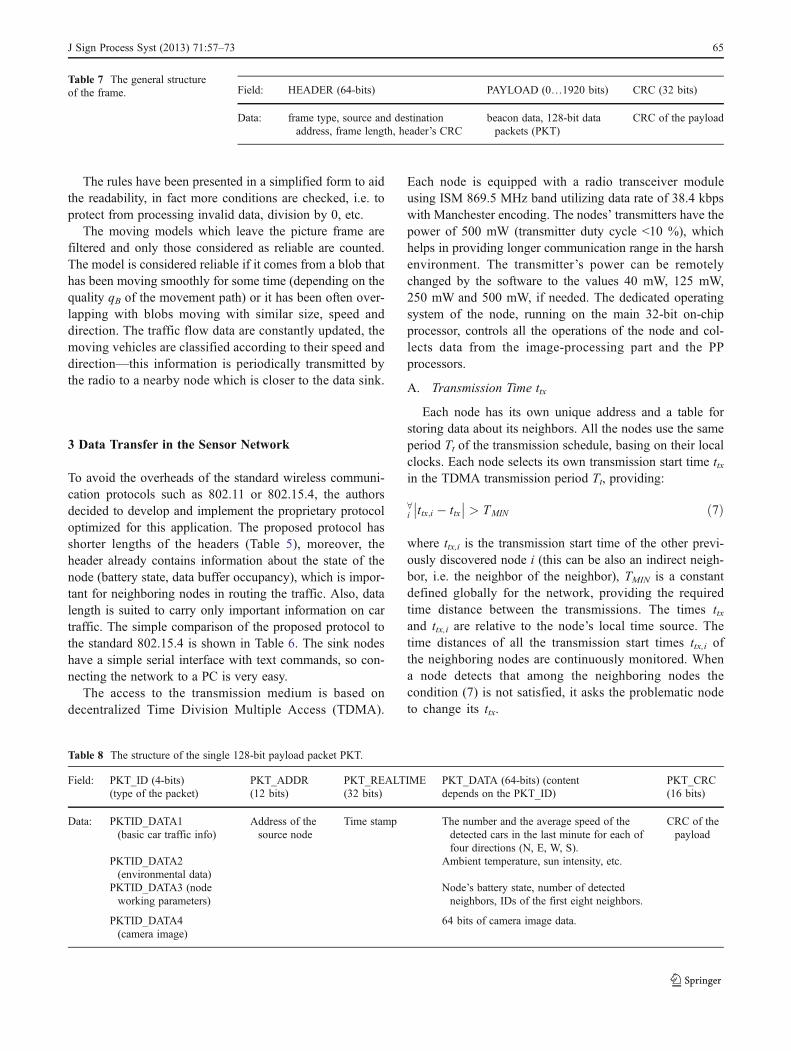
To avoid the overheads of the standard wireless communi-cation protocols such as 802.11 or 802.15.4, the authorsdecided to develop and implement the proprietary protocoloptimized for this application. The proposed protocol hasshorter lengths of the headers (Table 5), moreover, theheader already contains information about the state of thenode (battery state, data buffer occupancy), which is impor-tant for neighboring nodes in routing the traffic. Also, datalength is suited to carry only important information on cartraffic. The simple comparison of the proposed protocol tothe standard 802.15.4 is shown in Table 6. The sink nodeshave a simple serial interface with text commands, so con-necting the network to a PC is very easy.
The access to the transmission medium is based ondecentralized Time Division Multiple Access (TDMA).
Each node is equipped with a radio transceiver moduleusing ISM 869.5 MHz band utilizing data rate of 38.4 kbpswith Manchester encoding. The nodes’ transmitters have thepower of 500 mW (transmitter duty cycle <10 %), whichhelps in providing longer communication range in the harshenvironment. The transmitter’s power can be remotelychanged by the software to the values 40 mW, 125 mW,250 mW and 500 mW, if needed. The dedicated operatingsystem of the node, running on the main 32-bit on-chipprocessor, controls all the operations of the node and col-lects data from the image-processing part and the PPprocessors.
A. Transmission Time ttx
Each node has its own unique address and a table forstoring data about its neighbors. All the nodes use the sameperiod Tt of the transmission schedule, basing on their localclocks. Each node selects its own transmission start time ttxin the TDMA transmission period Tt, providing:
8i ttx;i � ttx�� �� > TMIN ð7Þ
where ttx,i is the transmission start time of the other previ-ously discovered node i (this can be also an indirect neigh-bor, i.e. the neighbor of the neighbor), TMIN is a constantdefined globally for the network, providing the requiredtime distance between the transmissions. The times ttxand ttx,i are relative to the node’s local time source. Thetime distances of all the transmission start times ttx,i ofthe neighboring nodes are continuously monitored. Whena node detects that among the neighboring nodes thecondition (7) is not satisfied, it asks the problematic nodeto change its ttx.
Table 8 The structure of the single 128-bit payload packet PKT.
Field: PKT_ID (4-bits)(type of the packet)
PKT_ADDR(12 bits)
PKT_REALTIME(32 bits)
PKT_DATA (64-bits) (contentdepends on the PKT_ID)
PKT_CRC(16 bits)
Data: PKTID_DATA1(basic car traffic info)
Address of thesource node
Time stamp The number and the average speed of thedetected cars in the last minute for each offour directions (N, E, W, S).
CRC of thepayload
PKTID_DATA2(environmental data)
Ambient temperature, sun intensity, etc.
PKTID_DATA3 (nodeworking parameters)
Node’s battery state, number of detectedneighbors, IDs of the first eight neighbors.
PKTID_DATA4(camera image)
64 bits of camera image data.
Table 7 The general structureof the frame. Field: HEADER (64-bits) PAYLOAD (0…1920 bits) CRC (32 bits)
Data: frame type, source and destinationaddress, frame length, header’s CRC
beacon data, 128-bit datapackets (PKT)
CRC of the payload
J Sign Process Syst (2013) 71:57–73 65

B. Beacon
The beacon contains basic information about the node,such as the node’s address, the distance of the node from thesink (measured in transmission hops), the node’s batterycondition, the node’s data buffer occupancy and data aboutthe node’s neighbors. Beacon is transmitted at ttx every NB
data transmission periods, typical value of NB is from 3 to10. Beacons are also used for establishing data links be-tween the nodes. Each node infers from its neighbors’beacons the existence of the indirect neighboring nodes,which helps to prevent the hidden terminal problem [2].
C. Startup and Discovery of the Neighbors
At the startup, each node enters the discovery mode, whenit continuously listens to the transmitted beacons, identifiesneighbors and saves neighbors’ transmission times ttx,i. Tofind new nodes and accommodate the network topologychanges, the discovery mode is periodically repeated. This issimilar to the procedure used in S-MAC protocol [35].
There are four types of frames that can be transmittedthrough the network: beacon, data, acknowledge and config-uration packets. All the frames have a 64-bit header of asimilar structure. The beacon frame may contain information
for the neighboring nodes needed for organizing the network(Table 7). The data frame carries the encrypted 128-bit packets(PKT) with car traffic information (Table 8), which can beaggregated from several nodes and transmitted together in asingle frame. The acknowledge frame, transmitted just afterthe successful reception of the data frame, is used to confirmthe reception of data, so the data transmitting node can free itsbuffer.
Each node switches on its receiver at the time ttx,i to listento the possible transmission of the i-th neighbor. If thereceiving node is not an addressee of the data transmission,it switches off its receiver just after receiving the header, inorder to avoid overhearing.
Car traffic data in the sensor network are regularly trans-mitted from the nodes to the data sinks using data frames. Toprovide the ability of sending information in the reversedirection, i.e. from the sink to distributed nodes, the config-uration frame is used. The configuration frame is transmittedwithout acknowledgement. Each node, after receiving a newconfiguration packet, simply retransmits it several times.This simple mechanism causes a heavy load of radio linksbut it is used rarely and only for service purposes, such asconfiguring remote nodes’ parameters, updating the firm-ware (FPGA nodes only) or the software.
Each data packet (PKT) contains the time stamp comingfrom the node’s real clock. The time stamp is used forchecking the validity of data at the host computer. Thesensor network utilizes global real clock synchronizationscheme. The sync packets are periodically generated bythe main sink node and distributed through the network byeach node using the beacons.
D. Data Protection
Each packet header is protected with 16-bit CRC, so thereceiver can quickly verify the integrity of the header andthe addressee of the packet without receiving the wholepacket. Additionally, the payload has its own 32-bit CRC.
The header is transmitted using plain text, while thepayload (PKT_DATA) is encrypted using AES with sym-metric key. The hardware encryption, compared to the soft-ware encryption, has better energy efficiency measured in
Table 9 The resources used in the FPGA implementation using XilinxVirtex-4 XC4VLX60.
Resource Total used
Flip Flops 10 325
LUTs (used as logic) 30 784
Total number of LUTs 31 676
Occupied Slices 19 220
18 Kb Block RAMs 157
DMA LocalMemory
BA12Processor
Debug
GPIO UART UART2
AES
TransceiverController
ARF29 Transceiver
Camera
VGA
JTAG
Power SupplyConfiguration
SDRAM, FLASH
PC
Wishbone bus
MemoryController
ImageProcessingHardware
ImageMemory
DataMemory
LEDs,Switches
FPGA/ASIC
Figure 10 Block diagram of the Sensor Network Processing Module.
Sensor Network
ProcessingModule
camera
50MHzoscillator
MemorySDRAM512Mb
MemoryFLASH(SW)64Mb
Transceiver ARF29868MHz 500mW
PowerSupply
A/C converterfor RSSI
I/O:LEDs, switches
VGA outputRS232JTAG
Watchdog
Figure 9 Block diagram of the prototype node.
66 J Sign Process Syst (2013) 71:57–73

energy/bit, thus each node has the hardware encryptionblock. Decryption is used occasionally by the nodes (exceptthe sink nodes), so it has been implemented in the software.
The 3 prioritized AES keys have been used: KEY1 andKEY2 are the same for all the nodes, the KEY3 is differentfor each node. During regular transmission, the KEY1 isused. To change the KEY1, the KEY2 is required. At aregular time interval, the change of the KEY1 (protectedby KEY2) is commanded by the sink node. The KEY3enables changes to the KEY1 and KEY2 and it should beused in case of a node’s takeover.
4 Hardware Realization of the Sensor Network
A. Block Diagram of the Sensor Network Nodes
The block diagram of the node’s hardware, common forFPGA and ASIC prototype, is presented in Fig. 9. The mainpart of the hardware has been integrated into a Sensor NetworkProcessing Module (SNPM), containing the custom micro-electronic system with 32-bit processor BA12 from BeyondSemiconductor (the same class as Arm’s ARM9™) and theperipherals connected to the Wishbone bus. The hardwaremoving object detection system, described in section II, hasalso been integrated, together with the additional hardwareblocks providing quick AES encryption and control of thelow level operations of the transceiver (Fig. 10).
B. Hardware Implementation
The first prototype sensor network node has been devel-oped using Xilinx’s XC4VLX60 FPGA. The main board con-tains all the elements from Fig. 10 with the camera MT9V111from Micron and the transceiver ARF29 from Adeunis. Thepower supply has been implemented on additional boardsusing 12V 6Ah gel cell sealed lead acid battery. The resourcesused in FPGA implementation are listed in Table 9 and thepictures of the prototypes with the FPGA are shown in Fig. 11.
After the successful startup with the FPGA, the ASIC hasbeen designed in 130 nm UMC CMOS process and manufac-tured through Europractice (Fig. 12), using the RTL code fromthe FPGA prototype. Both FPGA and ASIC provide almost thesame functionality. The design of ASIC has been made usingCadence SoC software with Faraday L130FSG (LP and HS)library of digital gates. The code consisting of ~95 000 lines ofVHDL and Verilog has been synthesized using Cadence RTLCompiler with clock gating optimization. DFT flip-flops andJTAG controller have been added to enable future tests. For theimplementation, Cadence SOC Encounter GXL 6.2 has beenused, with crosstalk and signal integrity analysis and powersupply analysis (electromigration, IR drop). The parameters ofthe designed ASIC are listed in Table 10. Comparing Tables 9and 10, a large difference in the number of Flip Flops can beobserved. The reason is that small memories and shift registersin FPGA are implemented using LUTs, while ASIC
Table 10 The resources used in ASIC implementation using Faradaylibrary and UMC 130 nm CMOS process.
Resource Total used
Flip Flops 18 478
Primitives (gates, buffers, flip flops, etc.) 549 062
Chip area 25 mm2
Memory blocks 75
Memory bits 1 661 952
powersupply
transceiver
camera
battery
(a) (b)
Figure 11 Prototype sensornetwork node with FPGA, a—picture of the node, b—two testnodes installed on a street lamp-pole.
Figure 12 A photo of the manufactured ASIC realized in 130 nmUMC process packed in CQFP208 package.
J Sign Process Syst (2013) 71:57–73 67

implementation uses FFs for that purpose. Moreover, in theFPGA all the memory is composed of 18Kbit block memories,resulting in wasted bits. Each memory block used in ASIC isdesigned to exactly fit the required size.
The manufactured ASIC has been used to build the low-power version of the node shown in Fig. 13, which works withLi-Ion 3.7 V 3.5 Ah single cell battery and can be supplied bya solar panel of area of 0.5 m2 (50 W peak power).
The set of the nodes has been installed on the street lamp-poles on several streets, as shown in Fig. 14. The detailed planof the deployment is presented in the next section of the paper.The nodes have been using their batteries during the day; atnight the batteries have been charging from the lamps’ powersupply. The ASIC node consumes less power than the FPGAcounterpart and therefore it is capable of working with a solarpanel, instead of using the lamp’s power supply.
5 Simulation and Test Results
A. Object Detection
The vehicles detected by the system have been verifiedon-line by the human operator. The road selected for traffic
detection tests had various traffic conditions: from trafficjams to speeding vehicles. The sensor network node in-stalled above the road was detecting and counting passingvehicles. Concurrently, the human operator was manuallycounting the cars. The comparison of the detection for100 cars for various conditions has been presented inTable 11. More results, including the object segmentationsimulations and videos, are available on-line at http://www.ue.eti.pg.gda.pl/sn.
As can be seen from Table 11, the image detection systemrecognized 63–93 % of the moving vehicles registered by thehuman. There were typically 1–9% additional false detectionsof non-existent vehicles. During the sunny day, the mostimportant problem are the shadows, resulting in joining theblobs from different cars. The basic shadow detection used inthis system is not able to detect all the shadows. On a cloudyday, the most errors come from the dark cars of gray levelsimilar to the color of the road. In this situation, the edgedetection blocks are very helpful in increasing the detectedpixel rate. The detection quality is significantly lower in thenight, where mostly the car lights are detected. The achievedaccuracy is the result of the compromises made during thedesign, such as a processing of monochrome and low resolu-tion images and 4-bit representation of the pixel values, toobtain a low-power operation and simpler hardware. Thedetection rates are satisfactory for the collecting of the statis-tical data on average traffic flow and getting the overallgeneral picture of the traffic. However, the authors feel thatimprovements in accuracy should be the next step in thefurther development of the presented idea.
B. Network Data Transmission
The sensor network has been simulated to estimate thetraffic parameters. The proposed sensor network is based onnon-standard communication protocol and the use of popularsimulation packages such as ns2 would require the creation ofthe exact communication model of the node. Instead of this,
NODE4NODE6
NODE2NODE1
NODE3 NODE5
(c)(b)(a)
Figure 14 Photographs of the test nodes installed on the street lamp-poles, a—set of nodes along the street, b—two nodes with FPGA, c—thenode with ASIC from Fig. 13 installed in a typical housing of an industrial security camera.
power supplyand battery
charging circuitcamera transceiver ASIC
153 mm
70 m
m
Figure 13 Photo of the ASIC version of the node.
68 J Sign Process Syst (2013) 71:57–73
the authors decided to embed the exact copy of the node’ssoftware into the custom simulator written in C++. In this waythere is no need to create the separate simulation model of thenode and the simulation results are very close to reality.
In the simulator, ideal radio links have been assumed, so alltransmissions are successful. Assuming that each node regu-larly generates on average 9 bps of data stream containinginformation about the car traffic and basic node’s informationsuch as battery condition or node’s neighbors, the maximalthroughput for the data packets at the single radio link is620 bps. Other parameters are listed in Table. 12.
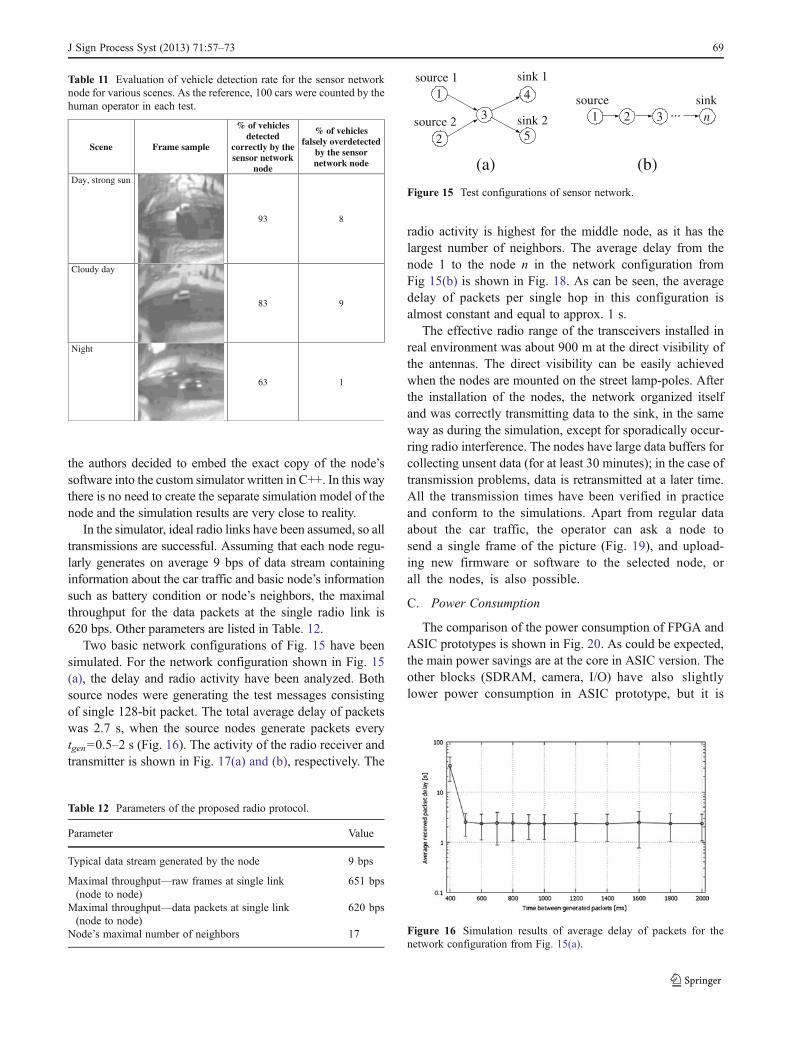
Two basic network configurations of Fig. 15 have beensimulated. For the network configuration shown in Fig. 15(a), the delay and radio activity have been analyzed. Bothsource nodes were generating the test messages consistingof single 128-bit packet. The total average delay of packetswas 2.7 s, when the source nodes generate packets everytgen00.5–2 s (Fig. 16). The activity of the radio receiver andtransmitter is shown in Fig. 17(a) and (b), respectively. The
radio activity is highest for the middle node, as it has thelargest number of neighbors. The average delay from thenode 1 to the node n in the network configuration fromFig 15(b) is shown in Fig. 18. As can be seen, the averagedelay of packets per single hop in this configuration isalmost constant and equal to approx. 1 s.
The effective radio range of the transceivers installed inreal environment was about 900 m at the direct visibility ofthe antennas. The direct visibility can be easily achievedwhen the nodes are mounted on the street lamp-poles. Afterthe installation of the nodes, the network organized itselfand was correctly transmitting data to the sink, in the sameway as during the simulation, except for sporadically occur-ring radio interference. The nodes have large data buffers forcollecting unsent data (for at least 30 minutes); in the case oftransmission problems, data is retransmitted at a later time.All the transmission times have been verified in practiceand conform to the simulations. Apart from regular dataabout the car traffic, the operator can ask a node tosend a single frame of the picture (Fig. 19), and upload-ing new firmware or software to the selected node, orall the nodes, is also possible.
C. Power Consumption
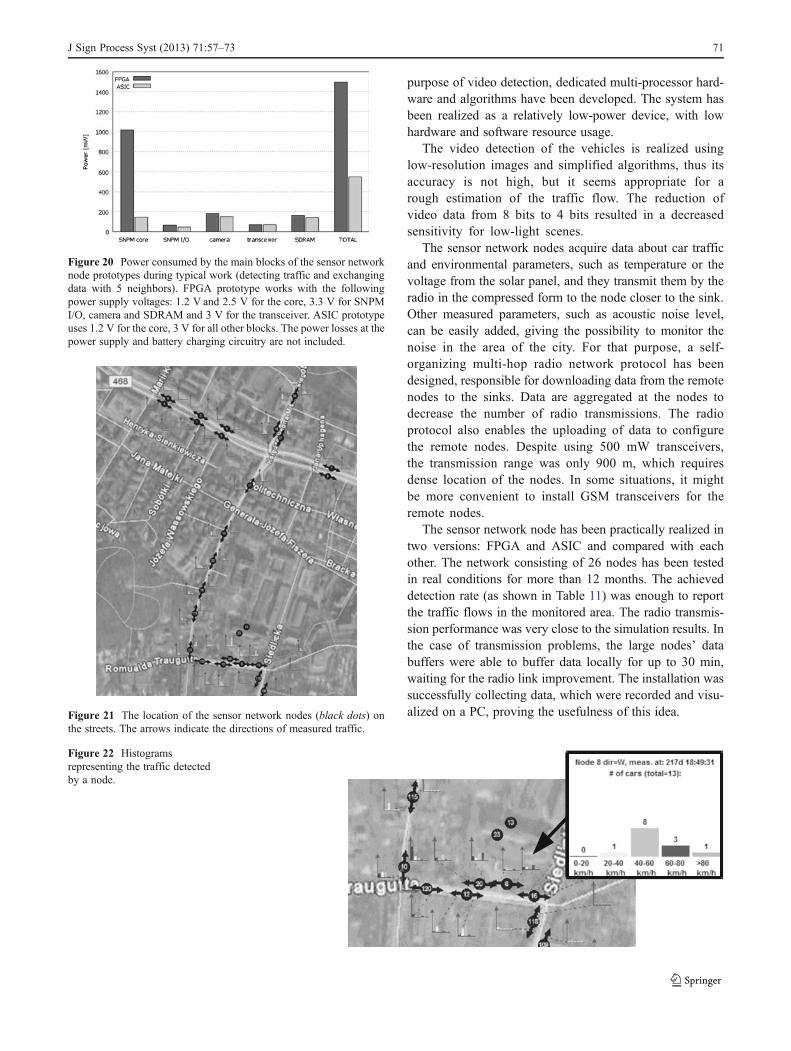
The comparison of the power consumption of FPGA andASIC prototypes is shown in Fig. 20. As could be expected,the main power savings are at the core in ASIC version. Theother blocks (SDRAM, camera, I/O) have also slightlylower power consumption in ASIC prototype, but it is
Table 12 Parameters of the proposed radio protocol.
Parameter Value
Typical data stream generated by the node 9 bps
Maximal throughput—raw frames at single link(node to node)
651 bps
Maximal throughput—data packets at single link(node to node)
620 bps
Node’s maximal number of neighbors 17
source 1
source 2
sink 1
sink 2
1
2
3
4
5
1source
2 3 n...sink
(b)(a)
Figure 15 Test configurations of sensor network.
Figure 16 Simulation results of average delay of packets for thenetwork configuration from Fig. 15(a).
Table 11 Evaluation of vehicle detection rate for the sensor networknode for various scenes. As the reference, 100 cars were counted by thehuman operator in each test.
Scene Frame sample
% of vehicles detected
correctly by the sensor network
node
% of vehicles falsely overdetected
by the sensor network node
Day, strong sun
93 8
Cloudy day
Night
83 9
63 1
J Sign Process Syst (2013) 71:57–73 69

only due to the fact that they work with lower supplyvoltage (3 V instead of 3.3 V used at FPGA prototype).
D. The Sensor Network Installation
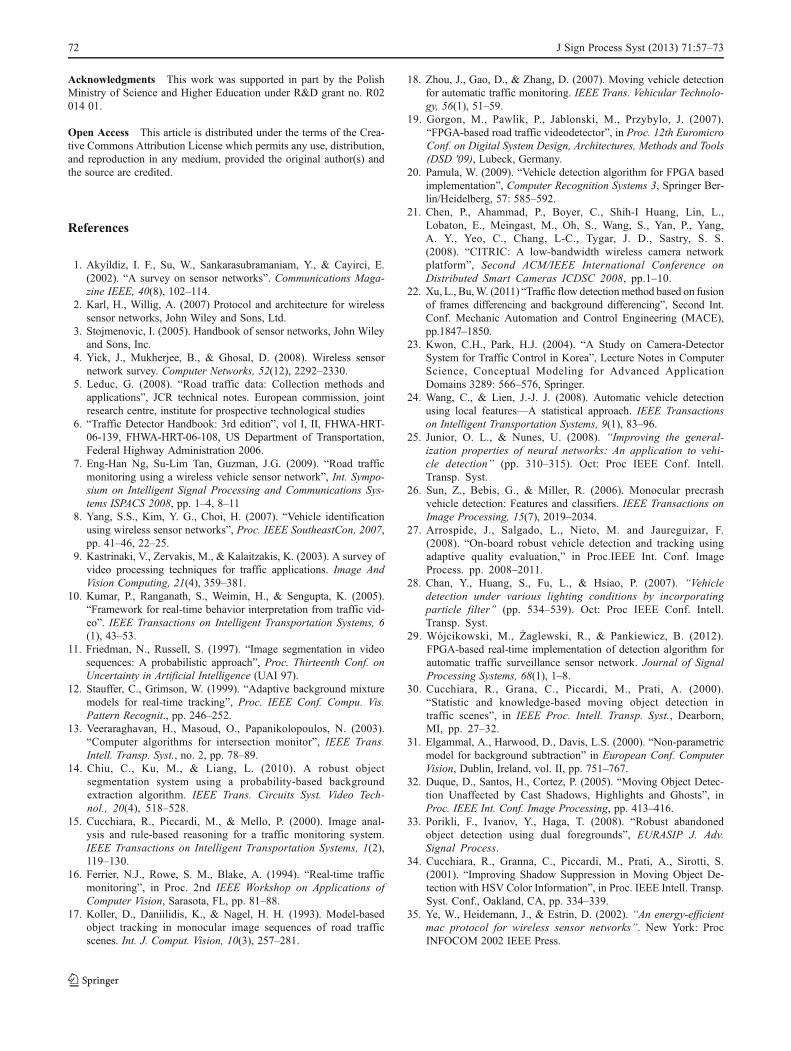
The sensor network consisting of 26 nodes (22 FPGA-based and 4 ASIC-based) has been tested in real conditions.Data from the remote nodes are transferred to the sink node.The sink node is connected via RS-232 to the PC computer,which plays the role of operator’s console, where the col-lected data are visualized. The map of the installation isshown in Fig. 21, the installed nodes are configured tomeasure only the traffic along the street, as indicated bythe arrows on the map. For the deployment of the nodes, thefollowing criteria have been chosen: the vicinity of theuniversity, the possibility to test multi-hop radio transmis-sion, one-way and two-way streets and the various conges-tion of the nodes’ positions.
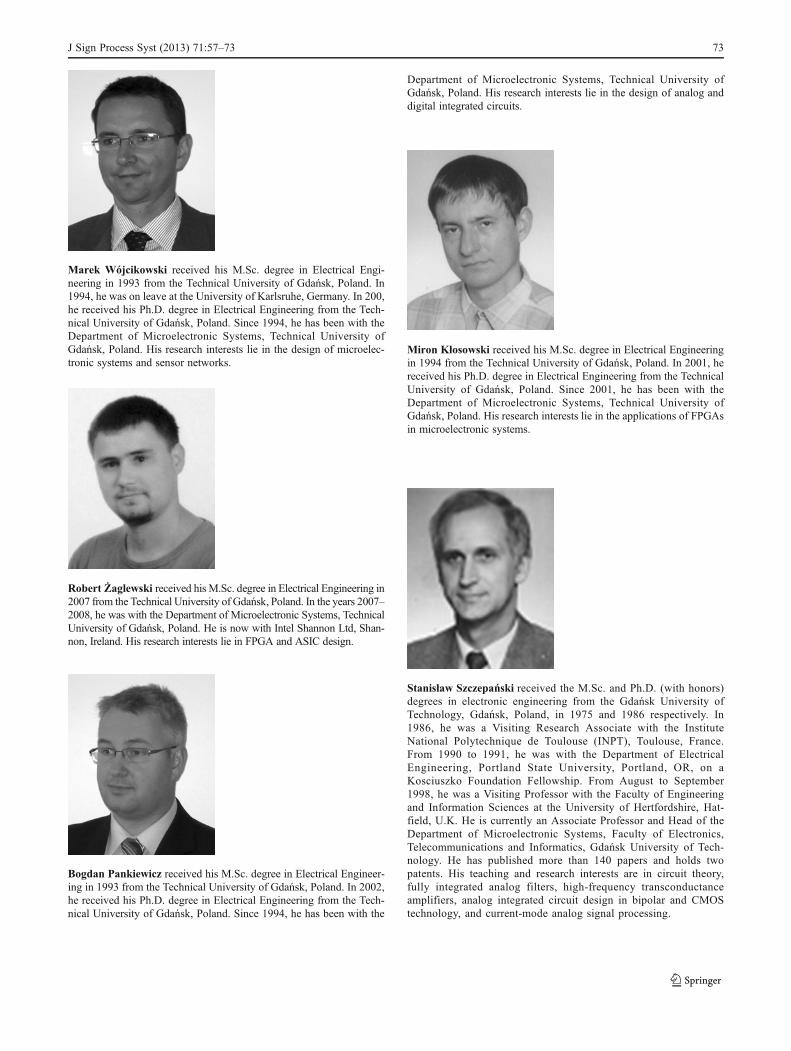
Each node accumulates information about the trafficand transmits it every 60 s. Finally, this information ispresented at the console as simple histograms (Fig. 22),showing the number of vehicles detected for each di-rection. Each node maintains statistics about averagetracks of the moving vehicles, so standing vehicles,for which the moving direction cannot be determined,shall be classified according to their location on the
street. The project had a strictly scientific purpose,therefore the collected data were used only by theresearchers, the controlling of the city lights was notintroduced at this stage.
Apart from the current state of the traffic, the historyof the traffic for each node and each direction can bedisplayed in the form of a time graph. The operator canalso: configure a single parameter of each node, resetthe node, update its software or download logs or singlecamera pictures, however these operations work slowlydue to the low throughput of the radio network. Eachnode is also equipped with on-board temperature sensorand A/D converters for measuring the solar panel andbattery voltages and currents. The proposed networkprotocol has dedicated data slots for transmitting 8-bitvalues of the measured temperature, noise, sun intensityand node’s internal battery state.
6 Conclusions
This work represents an attempt to solve the problem ofmeasuring street traffic using a sensor network. For the
Figure 17 Simulation results of the activity of radio receiver a and radio transmitter b for the network configuration from Fig. 15(a).
Figure 18 Simulation results of average delay of packets for thenetwork configuration from Fig. 15(b) for tgen01 s. Figure 19 The picture uploaded from the node.
70 J Sign Process Syst (2013) 71:57–73
purpose of video detection, dedicated multi-processor hard-ware and algorithms have been developed. The system hasbeen realized as a relatively low-power device, with lowhardware and software resource usage.
The video detection of the vehicles is realized usinglow-resolution images and simplified algorithms, thus itsaccuracy is not high, but it seems appropriate for arough estimation of the traffic flow. The reduction ofvideo data from 8 bits to 4 bits resulted in a decreasedsensitivity for low-light scenes.
The sensor network nodes acquire data about car trafficand environmental parameters, such as temperature or thevoltage from the solar panel, and they transmit them by theradio in the compressed form to the node closer to the sink.Other measured parameters, such as acoustic noise level,can be easily added, giving the possibility to monitor thenoise in the area of the city. For that purpose, a self-organizing multi-hop radio network protocol has beendesigned, responsible for downloading data from the remotenodes to the sinks. Data are aggregated at the nodes todecrease the number of radio transmissions. The radioprotocol also enables the uploading of data to configurethe remote nodes. Despite using 500 mW transceivers,the transmission range was only 900 m, which requiresdense location of the nodes. In some situations, it mightbe more convenient to install GSM transceivers for theremote nodes.
The sensor network node has been practically realized intwo versions: FPGA and ASIC and compared with eachother. The network consisting of 26 nodes has been testedin real conditions for more than 12 months. The achieveddetection rate (as shown in Table 11) was enough to reportthe traffic flows in the monitored area. The radio transmis-sion performance was very close to the simulation results. Inthe case of transmission problems, the large nodes’ databuffers were able to buffer data locally for up to 30 min,waiting for the radio link improvement. The installation wassuccessfully collecting data, which were recorded and visu-alized on a PC, proving the usefulness of this idea.
Figure 20 Power consumed by the main blocks of the sensor networknode prototypes during typical work (detecting traffic and exchangingdata with 5 neighbors). FPGA prototype works with the followingpower supply voltages: 1.2 V and 2.5 V for the core, 3.3 V for SNPMI/O, camera and SDRAM and 3 V for the transceiver. ASIC prototypeuses 1.2 V for the core, 3 V for all other blocks. The power losses at thepower supply and battery charging circuitry are not included.
Figure 21 The location of the sensor network nodes (black dots) onthe streets. The arrows indicate the directions of measured traffic.
Figure 22 Histogramsrepresenting the traffic detectedby a node.
J Sign Process Syst (2013) 71:57–73 71
Acknowledgments This work was supported in part by the PolishMinistry of Science and Higher Education under R&D grant no. R02014 01.
Open Access This article is distributed under the terms of the Crea-tive Commons Attribution License which permits any use, distribution,and reproduction in any medium, provided the original author(s) andthe source are credited.
References
1. Akyildiz, I. F., Su, W., Sankarasubramaniam, Y., & Cayirci, E.(2002). “A survey on sensor networks”. Communications Maga-zine IEEE, 40(8), 102–114.
2. Karl, H., Willig, A. (2007) Protocol and architecture for wirelesssensor networks, John Wiley and Sons, Ltd.
3. Stojmenovic, I. (2005). Handbook of sensor networks, John Wileyand Sons, Inc.
4. Yick, J., Mukherjee, B., & Ghosal, D. (2008). Wireless sensornetwork survey. Computer Networks, 52(12), 2292–2330.
5. Leduc, G. (2008). “Road traffic data: Collection methods andapplications”, JCR technical notes. European commission, jointresearch centre, institute for prospective technological studies
6. “Traffic Detector Handbook: 3rd edition”, vol I, II, FHWA-HRT-06-139, FHWA-HRT-06-108, US Department of Transportation,Federal Highway Administration 2006.
7. Eng-Han Ng, Su-Lim Tan, Guzman, J.G. (2009). “Road trafficmonitoring using a wireless vehicle sensor network”, Int. Sympo-sium on Intelligent Signal Processing and Communications Sys-tems ISPACS 2008, pp. 1–4, 8–11
8. Yang, S.S., Kim, Y. G., Choi, H. (2007). “Vehicle identificationusing wireless sensor networks”, Proc. IEEE SoutheastCon, 2007,pp. 41–46, 22–25.
9. Kastrinaki, V., Zervakis, M., & Kalaitzakis, K. (2003). A survey ofvideo processing techniques for traffic applications. Image AndVision Computing, 21(4), 359–381.
10. Kumar, P., Ranganath, S., Weimin, H., & Sengupta, K. (2005).“Framework for real-time behavior interpretation from traffic vid-eo”. IEEE Transactions on Intelligent Transportation Systems, 6(1), 43–53.
11. Friedman, N., Russell, S. (1997). “Image segmentation in videosequences: A probabilistic approach”, Proc. Thirteenth Conf. onUncertainty in Artificial Intelligence (UAI 97).
12. Stauffer, C., Grimson, W. (1999). “Adaptive background mixturemodels for real-time tracking”, Proc. IEEE Conf. Compu. Vis.Pattern Recognit., pp. 246–252.
13. Veeraraghavan, H., Masoud, O., Papanikolopoulos, N. (2003).“Computer algorithms for intersection monitor”, IEEE Trans.Intell. Transp. Syst., no. 2, pp. 78–89.
14. Chiu, C., Ku, M., & Liang, L. (2010). A robust objectsegmentation system using a probability-based backgroundextraction algorithm. IEEE Trans. Circuits Syst. Video Tech-nol., 20(4), 518–528.
15. Cucchiara, R., Piccardi, M., & Mello, P. (2000). Image anal-ysis and rule-based reasoning for a traffic monitoring system.IEEE Transactions on Intelligent Transportation Systems, 1(2),119–130.
16. Ferrier, N.J., Rowe, S. M., Blake, A. (1994). “Real-time trafficmonitoring”, in Proc. 2nd IEEE Workshop on Applications ofComputer Vision, Sarasota, FL, pp. 81–88.
17. Koller, D., Daniilidis, K., & Nagel, H. H. (1993). Model-basedobject tracking in monocular image sequences of road trafficscenes. Int. J. Comput. Vision, 10(3), 257–281.
18. Zhou, J., Gao, D., & Zhang, D. (2007). Moving vehicle detectionfor automatic traffic monitoring. IEEE Trans. Vehicular Technolo-gy, 56(1), 51–59.
19. Gorgon, M., Pawlik, P., Jablonski, M., Przybylo, J. (2007).“FPGA-based road traffic videodetector”, in Proc. 12th EuromicroConf. on Digital System Design, Architectures, Methods and Tools(DSD '09), Lubeck, Germany.
20. Pamula, W. (2009). “Vehicle detection algorithm for FPGA basedimplementation”, Computer Recognition Systems 3, Springer Ber-lin/Heidelberg, 57: 585–592.
21. Chen, P., Ahammad, P., Boyer, C., Shih-I Huang, Lin, L.,Lobaton, E., Meingast, M., Oh, S., Wang, S., Yan, P., Yang,A. Y., Yeo, C., Chang, L-C., Tygar, J. D., Sastry, S. S.(2008). “CITRIC: A low-bandwidth wireless camera networkplatform”, Second ACM/IEEE International Conference onDistributed Smart Cameras ICDSC 2008, pp.1–10.
22. Xu, L., Bu,W. (2011) “Traffic flow detectionmethod based on fusionof frames differencing and background differencing”, Second Int.Conf. Mechanic Automation and Control Engineering (MACE),pp.1847–1850.
23. Kwon, C.H., Park, H.J. (2004). “A Study on Camera-DetectorSystem for Traffic Control in Korea”, Lecture Notes in ComputerScience, Conceptual Modeling for Advanced ApplicationDomains 3289: 566–576, Springer.
24. Wang, C., & Lien, J.-J. J. (2008). Automatic vehicle detectionusing local features—A statistical approach. IEEE Transactionson Intelligent Transportation Systems, 9(1), 83–96.
25. Junior, O. L., & Nunes, U. (2008). “Improving the general-ization properties of neural networks: An application to vehi-cle detection” (pp. 310–315). Oct: Proc IEEE Conf. Intell.Transp. Syst.
26. Sun, Z., Bebis, G., & Miller, R. (2006). Monocular precrashvehicle detection: Features and classifiers. IEEE Transactions onImage Processing, 15(7), 2019–2034.
27. Arrospide, J., Salgado, L., Nieto, M. and Jaureguizar, F.(2008). “On-board robust vehicle detection and tracking usingadaptive quality evaluation,” in Proc.IEEE Int. Conf. ImageProcess. pp. 2008–2011.
28. Chan, Y., Huang, S., Fu, L., & Hsiao, P. (2007). “Vehicledetection under various lighting conditions by incorporatingparticle filter” (pp. 534–539). Oct: Proc IEEE Conf. Intell.Transp. Syst.
29. Wójcikowski, M., Żaglewski, R., & Pankiewicz, B. (2012).FPGA-based real-time implementation of detection algorithm forautomatic traffic surveillance sensor network. Journal of SignalProcessing Systems, 68(1), 1–8.
30. Cucchiara, R., Grana, C., Piccardi, M., Prati, A. (2000).“Statistic and knowledge-based moving object detection intraffic scenes”, in IEEE Proc. Intell. Transp. Syst., Dearborn,MI, pp. 27–32.
31. Elgammal, A., Harwood, D., Davis, L.S. (2000). “Non-parametricmodel for background subtraction” in European Conf. ComputerVision, Dublin, Ireland, vol. II, pp. 751–767.
32. Duque, D., Santos, H., Cortez, P. (2005). “Moving Object Detec-tion Unaffected by Cast Shadows, Highlights and Ghosts”, inProc. IEEE Int. Conf. Image Processing, pp. 413–416.
33. Porikli, F., Ivanov, Y., Haga, T. (2008). “Robust abandonedobject detection using dual foregrounds”, EURASIP J. Adv.Signal Process.
34. Cucchiara, R., Granna, C., Piccardi, M., Prati, A., Sirotti, S.(2001). “Improving Shadow Suppression in Moving Object De-tection with HSV Color Information”, in Proc. IEEE Intell. Transp.Syst. Conf., Oakland, CA, pp. 334–339.
35. Ye, W., Heidemann, J., & Estrin, D. (2002). “An energy-efficientmac protocol for wireless sensor networks”. New York: ProcINFOCOM 2002 IEEE Press.
72 J Sign Process Syst (2013) 71:57–73
Marek Wójcikowski received his M.Sc. degree in Electrical Engi-neering in 1993 from the Technical University of Gdańsk, Poland. In1994, he was on leave at the University of Karlsruhe, Germany. In 200,he received his Ph.D. degree in Electrical Engineering from the Tech-nical University of Gdańsk, Poland. Since 1994, he has been with theDepartment of Microelectronic Systems, Technical University ofGdańsk, Poland. His research interests lie in the design of microelec-tronic systems and sensor networks.
Robert Żaglewski received his M.Sc. degree in Electrical Engineering in2007 from the Technical University of Gdańsk, Poland. In the years 2007–2008, he was with the Department of Microelectronic Systems, TechnicalUniversity of Gdańsk, Poland. He is now with Intel Shannon Ltd, Shan-non, Ireland. His research interests lie in FPGA and ASIC design.
Bogdan Pankiewicz received his M.Sc. degree in Electrical Engineer-ing in 1993 from the Technical University of Gdańsk, Poland. In 2002,he received his Ph.D. degree in Electrical Engineering from the Tech-nical University of Gdańsk, Poland. Since 1994, he has been with the
Department of Microelectronic Systems, Technical University ofGdańsk, Poland. His research interests lie in the design of analog anddigital integrated circuits.
Miron Kłosowski received his M.Sc. degree in Electrical Engineeringin 1994 from the Technical University of Gdańsk, Poland. In 2001, hereceived his Ph.D. degree in Electrical Engineering from the TechnicalUniversity of Gdańsk, Poland. Since 2001, he has been with theDepartment of Microelectronic Systems, Technical University ofGdańsk, Poland. His research interests lie in the applications of FPGAsin microelectronic systems.
Stanisław Szczepański received the M.Sc. and Ph.D. (with honors)degrees in electronic engineering from the Gdańsk University ofTechnology, Gdańsk, Poland, in 1975 and 1986 respectively. In1986, he was a Visiting Research Associate with the InstituteNational Polytechnique de Toulouse (INPT), Toulouse, France.From 1990 to 1991, he was with the Department of ElectricalEngineering, Portland State University, Portland, OR, on aKosciuszko Foundation Fellowship. From August to September1998, he was a Visiting Professor with the Faculty of Engineeringand Information Sciences at the University of Hertfordshire, Hat-field, U.K. He is currently an Associate Professor and Head of theDepartment of Microelectronic Systems, Faculty of Electronics,Telecommunications and Informatics, Gdańsk University of Tech-nology. He has published more than 140 papers and holds twopatents. His teaching and research interests are in circuit theory,fully integrated analog filters, high-frequency transconductanceamplifiers, analog integrated circuit design in bipolar and CMOStechnology, and current-mode analog signal processing.
J Sign Process Syst (2013) 71:57–73 73