harlem investment opportunity initial overview & analysis june 2012
TRANSCRIPT
Investment Opportunity in Harlem, New-York, NY
Initial Overview & Analysis
June 2012

The approach…In order to provide an initial opinion regarding the investment
opportunity in question, I reviewed:
• The invetment opportunity in view of Harlem’s Real Estate
Market trends and recent figures;
• As a general reference - Yields and recent years capital
appreciation of U.S. residential REIT’s, which offer exposure to
similar type of properties.
2Prepared by: Tomi Deutsch (C.P.A., EMBA) [email protected] , June 2012
similar type of properties.
Harlem Real Estate Market
Trends & Figures Trends & Figures
3
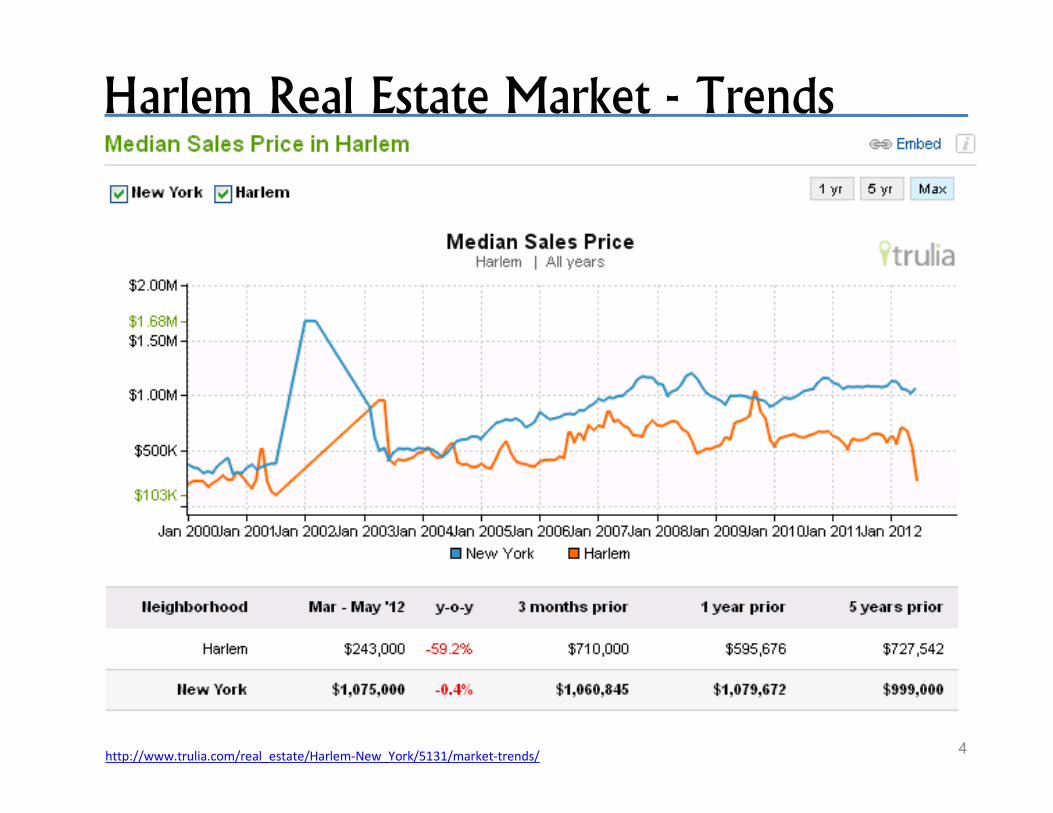
Harlem Real Estate Market - Trends
4
http://www.trulia.com/real_estate/Harlem-New_York/5131/market-trends/
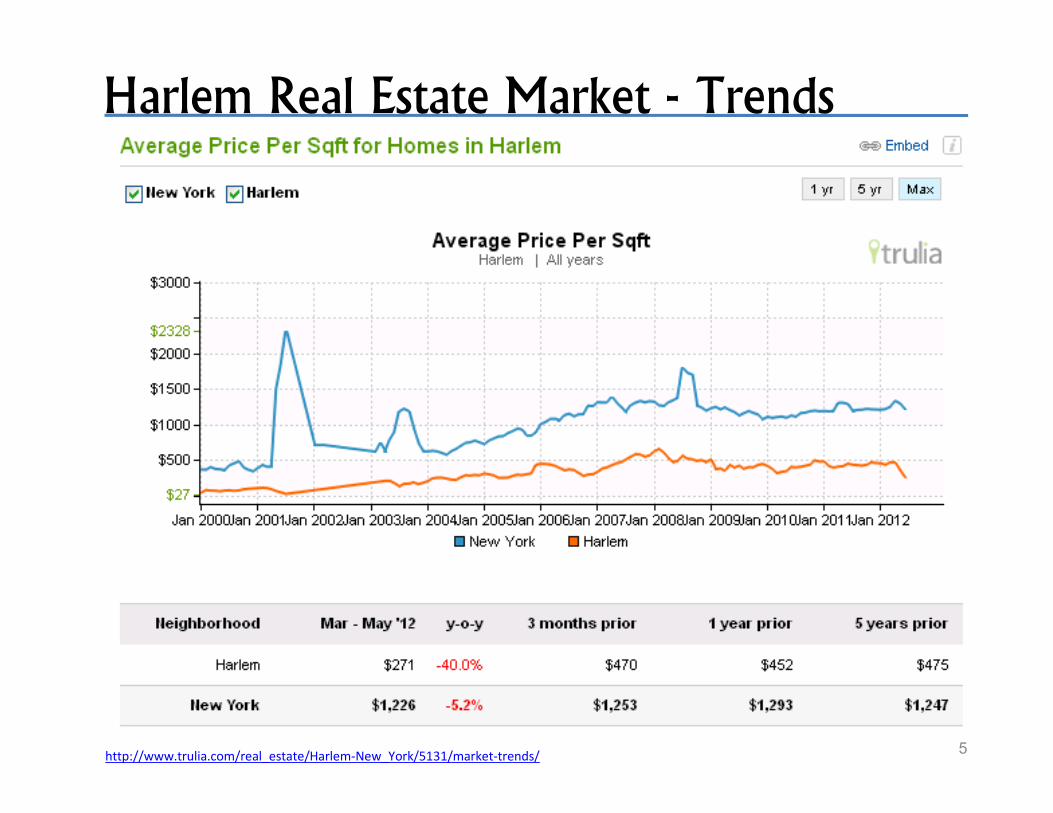
Harlem Real Estate Market - Trends
5
http://www.trulia.com/real_estate/Harlem-New_York/5131/market-trends/
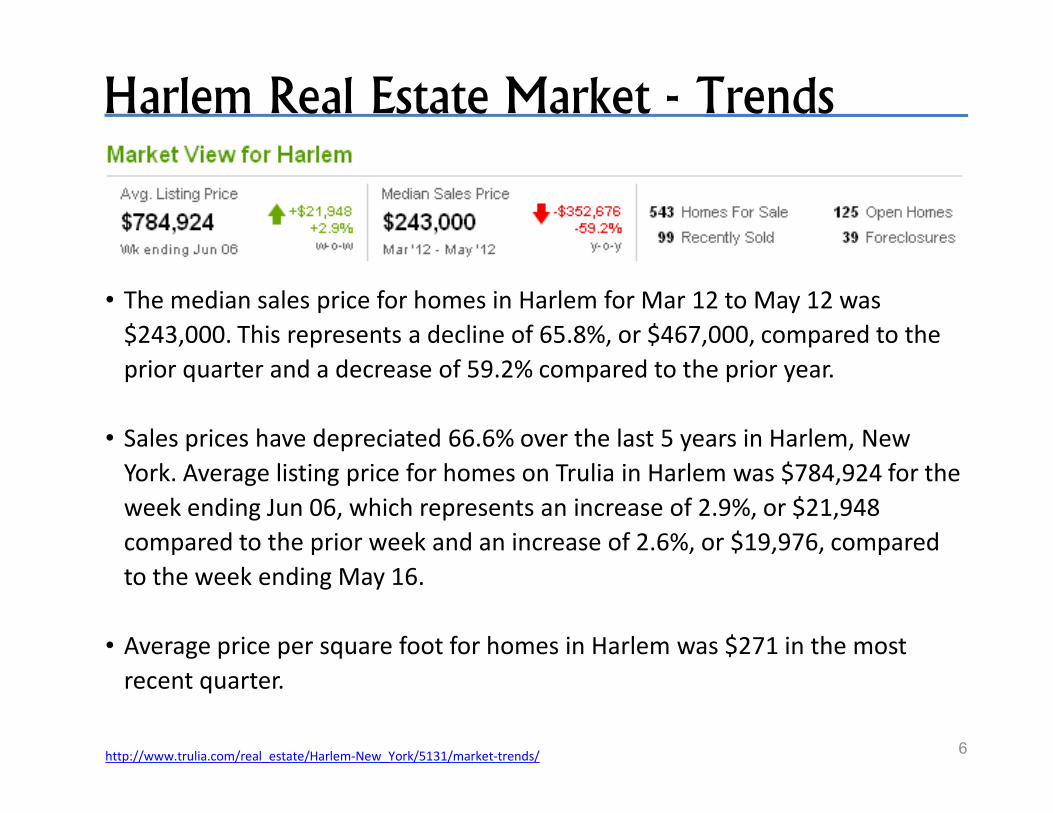
• The median sales price for homes in Harlem for Mar 12 to May 12 was
$243,000. This represents a decline of 65.8%, or $467,000, compared to the
prior quarter and a decrease of 59.2% compared to the prior year.
Harlem Real Estate Market - Trends
6
http://www.trulia.com/real_estate/Harlem-New_York/5131/market-trends/
• Sales prices have depreciated 66.6% over the last 5 years in Harlem, New
York. Average listing price for homes on Trulia in Harlem was $784,924 for the
week ending Jun 06, which represents an increase of 2.9%, or $21,948
compared to the prior week and an increase of 2.6%, or $19,976, compared
to the week ending May 16.
• Average price per square foot for homes in Harlem was $271 in the most
recent quarter.
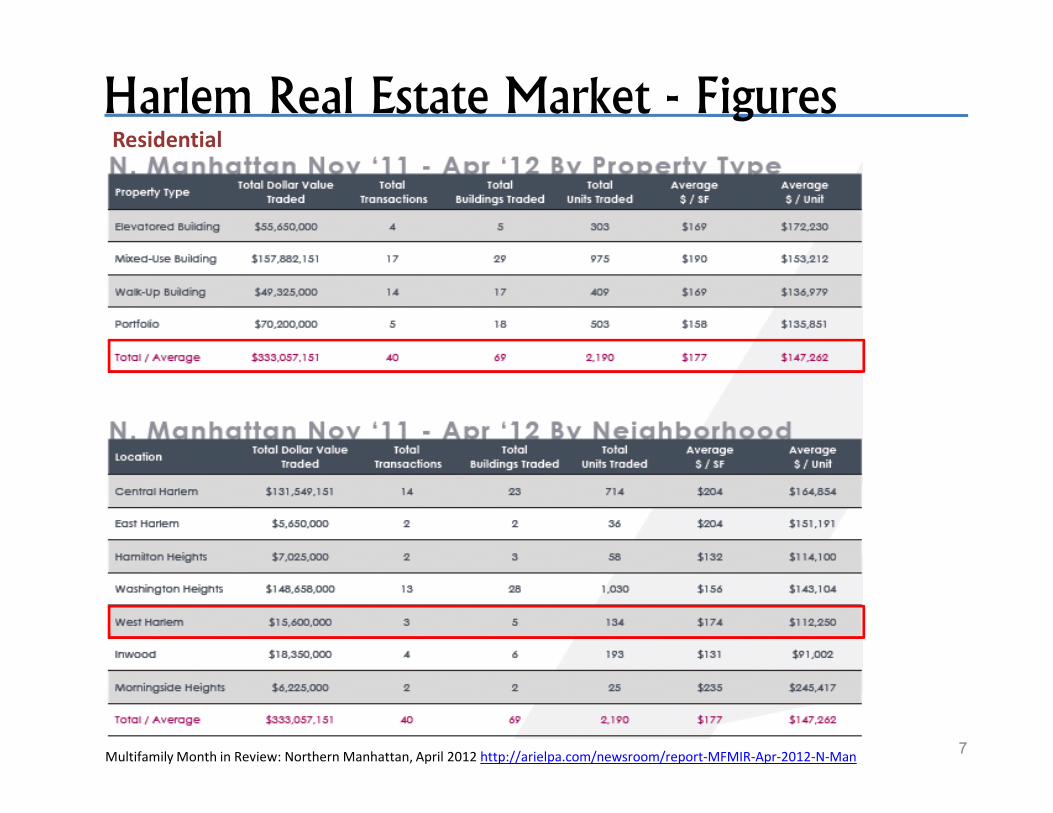
Harlem Real Estate Market - FiguresResidential
7Multifamily Month in Review: Northern Manhattan, April 2012 http://arielpa.com/newsroom/report-MFMIR-Apr-2012-N-Man

Harlem Real Estate Market - TrendResidential
8Northern Manhattan Fundamentals Report - comprehensive overview of the retail, rental and condo market Released February 2012
http://arielpa.com/newsroom/report-ArielPA-NM-Fundamentals-2011
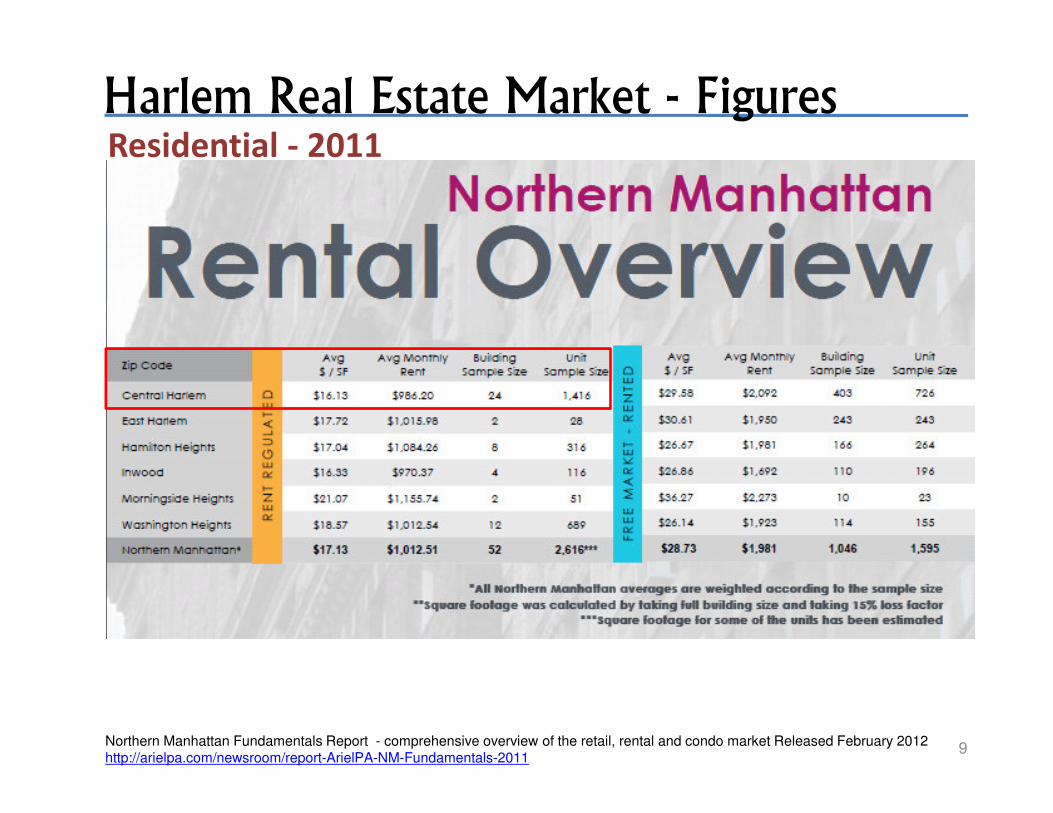
Harlem Real Estate Market - FiguresResidential - 2011
9Northern Manhattan Fundamentals Report - comprehensive overview of the retail, rental and condo market Released February 2012
http://arielpa.com/newsroom/report-ArielPA-NM-Fundamentals-2011
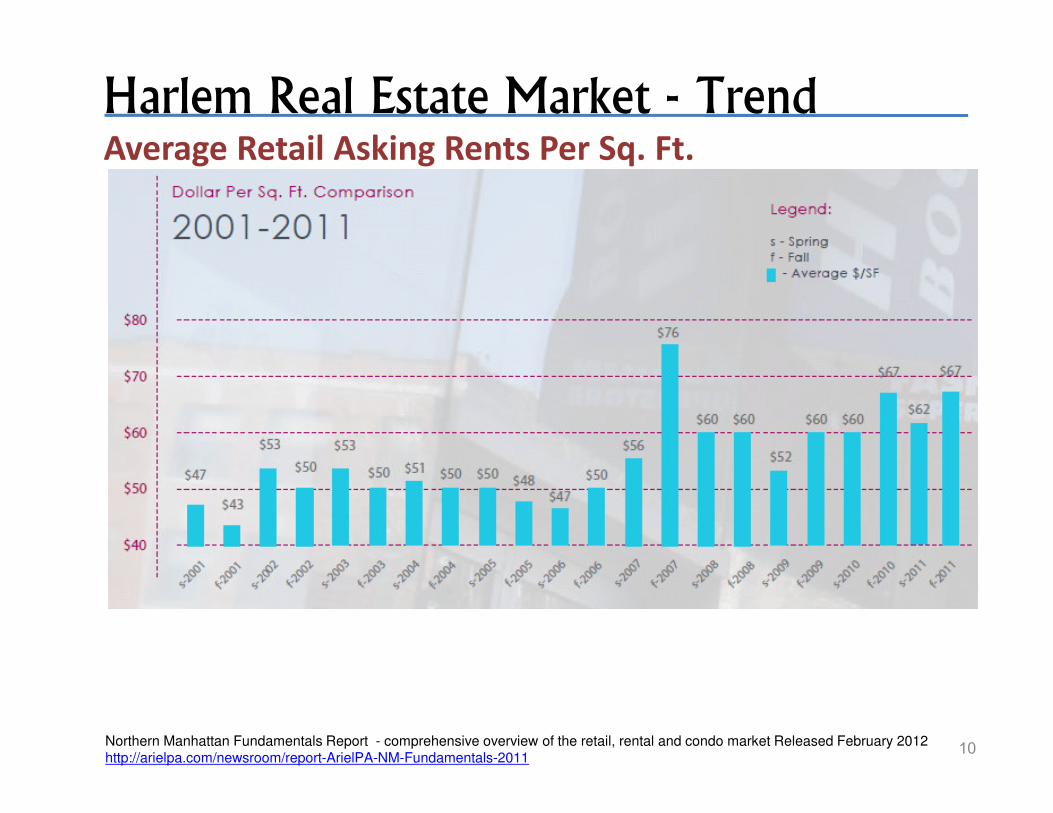
Harlem Real Estate Market - TrendAverage Retail Asking Rents Per Sq. Ft.
10Northern Manhattan Fundamentals Report - comprehensive overview of the retail, rental and condo market Released February 2012
http://arielpa.com/newsroom/report-ArielPA-NM-Fundamentals-2011
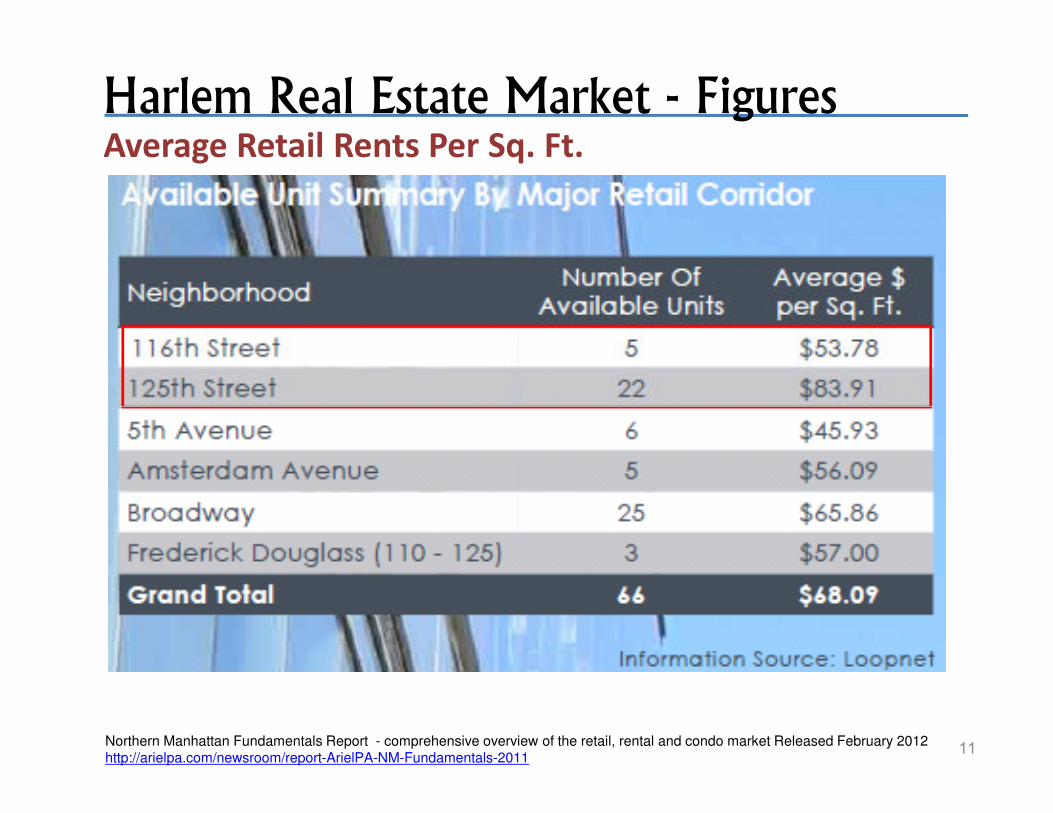
Harlem Real Estate Market - FiguresAverage Retail Rents Per Sq. Ft.
11Northern Manhattan Fundamentals Report - comprehensive overview of the retail, rental and condo market Released February 2012
http://arielpa.com/newsroom/report-ArielPA-NM-Fundamentals-2011

Market figures vs. the investment opportunity
Upside potential ~
Status vs. current
market value
INVESTMENT
OPPORTUNITY
Rent stabilization
MARKET
Rent regulated
?$ 16$ 16-17Average Rents
Per Sq. Ft.
Residential
12
Upside potential ~
Status vs. current
market value
INVESTMENT
OPPORTUNITY
MARKET
Below market
value
$ 158 (3)
$ 85 – 203 (4)
$ 174 (1)
$ 271 (2)
Average Sell
Price Per Sq. Ft.
(1) Multifamily Month in Review: Northern Manhattan, April 2012 http://arielpa.com/newsroom/report-MFMIR-Apr-2012-N-Man
(2) http://www.trulia.com/real_estate/Harlem-New_York/5131/market-trends/
(3) According to the OFFERING MEMORANDUM/Excel spreadsheet
(4) According to the adjusted calc. (see also annex A)

Market figures vs. the investment opportunity
Upside potential ~
Status vs. current
market value
INVESTMENT
OPPORTUNITY
Average Retail
Rents Per Sq. Ft.
MARKET
Average Retail
Rents Per Sq. Ft.
Location
?$ 53$ 54116th st.
Below market
value
$ 23$ 84125th st.
Retail
13
value
According to the gatherd data, it seems as if the upside potential exists only re. the
retail space on 125th st.
As a result, should the rent be adjust to the abovementioned
average market value then the Gross Potential Commercial Rent
would increase by an additional $167,750 p.a. (compared to an
estimated increase presented in the pro forma of $68,132)
U.S. residential REIT’s
Yields & Capital AppreciationYields & Capital Appreciation
14

Largest residential REIT’s by Mkt. Cap
Div. - Yields
2.2%
2.8%
14.9%
3.4%
In the past 3 years those REITs gained 68.25 – 182.66 % in capital appreciation
June 15, 2012
15
http://finance.yahoo.com/echarts?s=EQR+Interactive#symbol=eqr;range=20090617,20120615;compare=avb+agnc+udr;indicator=volume;charttype=area
;crosshair=on;ohlcvalues=0;logscale=off;source=undefined;

Fund Summary
• The investment seeks to provide a high level of income and moderate long-term capital appreciation by tracking the performance
of a benchmark index that measures the performance of publicly traded equity REITs. The fund employs an indexing investment
approach designed to track the performance of the MSCI US REIT Index. The index is composed of stocks of publicly traded equity
real estate investment trusts (known as REITs). It attempts to replicate the index by investing all, or substantially all, of its assets in
the stocks that make up the index, holding each stock in approximately the same proportion as its weighting in the index.
• It pays dividends on a quarterly basis. Beta (3y): 0.95
• .Performance Overview
Vanguard REIT Index ETF (VNQ)
16
Year to Date Return (Mkt): 13.77%
3-Year Total Return (Mkt): 32.47%
Yield (ttm)²:²As of Apr 29, 2012
3.27
http://finance.yahoo.com/q?s=VNQ
• In the past 3 years it
gained 93.65% in capital
appreciation (more than
doubled the S&P 500)
http://finance.yahoo.com/echarts?s=VNQ+Interactive#symbol=vnq;range=20090615,20120611;compare=^gspc;indicator=volume;charttype=area;crosshair=on;ohlcvalues=0;logscale=off;source=undefined;
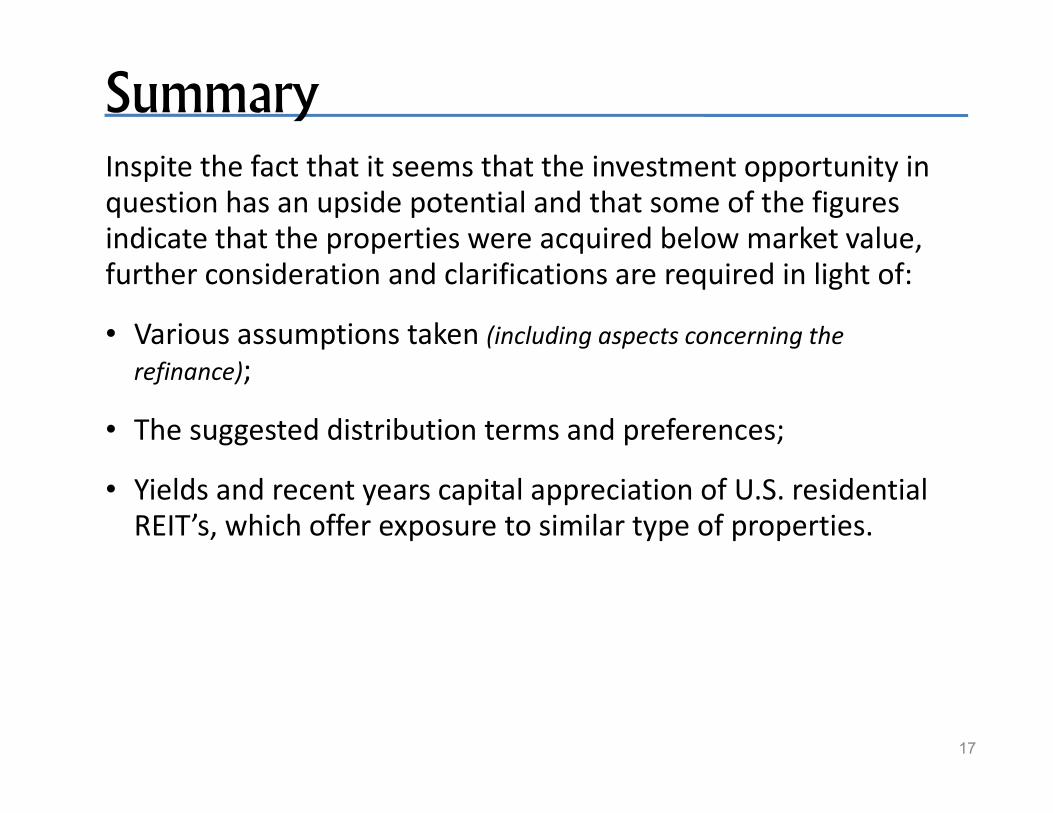
SummaryInspite the fact that it seems that the investment opportunity in question has an upside potential and that some of the figures indicate that the properties were acquired below market value, further consideration and clarifications are required in light of:
• Various assumptions taken (including aspects concerning the
refinance);
17
• The suggested distribution terms and preferences;
• Yields and recent years capital appreciation of U.S. residential REIT’s, which offer exposure to similar type of properties.