harmonic compliance assessment and mitigation … compliance assessment and mitigation design in...
TRANSCRIPT
CIDER17-1 1
Harmonic compliance assessment and mitigation design inrenewable energy networks
M Jansen, Optimised Network EquipmentEmail: [email protected]
Abstract—The analysis approach for harmonic emission compliancestudies in distributed generation systems is shaped by a regulatoryframework that requires a priori resolution of several performancerequirements. This approach is steeped in risk avoidance and, like mostrisk avoidance, results in conservative outcomes that are not necessarilyin the best interest of the market. This article describes this analysisapproach and demonstrates how the regulation and associated analysisresult in increased rather than decreased risk to the stakeholders. Asuggestion is made for a pragmatic approach that will result in betteroutcomes for network owners as well as generation proponents. Therecommended approach provides for an initial risk assessment followedby field measurements that quantify the extent of compliance and assistin the design of mitigation systems.
I. INTRODUCTION
The rate at which relatively large blocks of power electronic basedgeneration are now being connected to the grid requires diligentapplication of the procedures set out in the standard [1] as expectedin the regulatory legislation.
Connection agreements are negotiated between generator propo-nents and network operators within the prevailing regulatory frame-work. The resulting grid connection agreements require proponentsto adhere to a set of performance standards ranging from reactivepower capability to active power control [4] and includes quality ofelectricity generated, deemed to cover aspects of voltage fluctuations,harmonic distortion and voltage unbalance. This article exploresimportant aspects of the compliance and mitigation system designrequirements relating to generation of harmonic distortion.
Assessing compliance with harmonic emission limits as part ofa grid connection study requires an understanding of the interactionbetween the external network and the proposed generator – especiallyrelating to non-linear aspects of the generator. In its simplest form,a renewable energy source connected to an existing network can berepresented as shown in the figure below. It is important to keepthis representation in mind as each of the elements is in fact quitecomplex.
External network
Point of connection
Generator
Fig. 1. Simplest representation of embedded generation
Harmonic assessment consists of estimating the effect of non-linearities within the generator on voltage distortion at the pointof connection. Harmonic mitigation design consists of proposingsolutions that will result in compliance with agreed (automatic ornegotiated) access standards as documented in a grid connectionagreement. The required ratings of proposed solutions are thendetermined according to the most onerous foreseeable operatingconditions.
Presented at the CIGRE Australia CIDER 17 event,15th –16th August2017 in Sydney Australia.
At first glance the process is simple: the network service providerestablishes an access standard that is quantified in terms of maximumvoltage (and sometimes current) emissions by the proposed newgenerator. The generator must demonstrate that these limits are notexceeded under the range of operating conditions that the plant willbe exposed to when connected to the network, either by virtue ofthe nature of the generators or due to mitigation measures. Once thegenerator is commissioned, performance tests verify compliance.
The diagram in figure 1 above includes a network element, essen-tially “everything above the point of connection.” In reality the situ-ation is complex: networks are not perfectly known and can operatein multiple configurations, the generator and network influence eachother, and both will change over time. The considerable advancesin analysis and measurement tools have been counter-weighed byrapid development of new generating technology, more sensitiveloads and the demand for highly optimised, low loss operation. Thehigh penetration of renewable, distributed generators demands carefulconsideration of the most appropriate approach to the voltage qualityaspect of grid connections.
II. NETWORK MODELS
Power system engineers are acutely aware of the need for anaccurate representation of the electricity network and improvementsin computer technology now allow modelling of any aspect ofthe network, from basic load flows (important for efficient energydispatch), fault levels (essential for effective protection coordina-tion) and control system modelling (to safeguard system stability).Harmonic analysis tools are now able to perform detailed balancedand unbalanced harmonic load flows, and electro-magnetic transientanalysis open up views on sub-microsecond events in the network.Such power demands the responsibility to construct accurate, robustmodels of the network, so that all stakeholders are aware of theassumptions, limitations and predictive accuracy of models.
Harmonic analysis essentially consists of load flows at multiplefrequencies. The network impedance at each of frequency is criti-cally important. Without an accurate representation of the frequencydependent impedance of the network, harmonic analysis is not ofmuch practical use. Some aspects that bear consideration are:
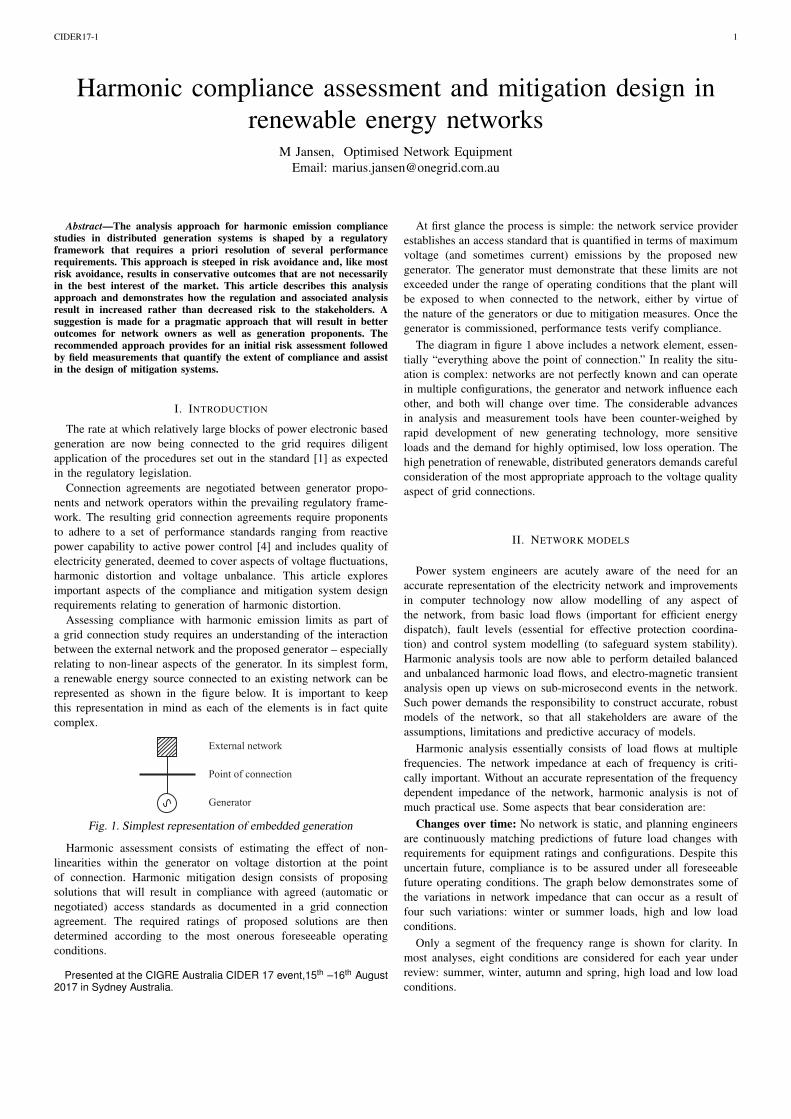
Changes over time: No network is static, and planning engineersare continuously matching predictions of future load changes withrequirements for equipment ratings and configurations. Despite thisuncertain future, compliance is to be assured under all foreseeablefuture operating conditions. The graph below demonstrates some ofthe variations in network impedance that can occur as a result offour such variations: winter or summer loads, high and low loadconditions.
Only a segment of the frequency range is shown for clarity. Inmost analyses, eight conditions are considered for each year underreview: summer, winter, autumn and spring, high load and low loadconditions.
CIDER17-1 2
Summer highSummer lowWinter highWinter low
Impe
danc
e (Ω
)
10
100
Frequency (× 50 Hz)3 4 5 6 7 8
Fig. 2. Subset of network impedance depending on time
Contingencies: Each of the above time-based variations will besubject to several network contingencies. The ability of the generatorto remain functional despite, for example, the loss of one or morefeeders in the surrounding network, the status of bus couplers, or theloss of transformers, is a key requirement of connection agreements.These contingencies have a marked effect on network impedance, asshown in the example below for only two possible operating modes.
System normalSingle contingency
Impe
danc
e (Ω
)
1
102
104
Frequency (× 50 Hz)0 10 20 30 40 50
Fig. 3. Subset of network impedance depending on contingencies
Basic network uncertainty: Network operators are surprisinglyunaware of the status of their own network, specifically relating toparameters that determine frequency dependent impedance. It can bea considerable hurdle to obtain, for example, the tuned frequencyof existing capacitor banks, or the correlation between the switchedstatus of such banks in the various time-based variations (for example,whether any particular capacitor bank is connected or disconnectedduring a high load period) and uncertainty in these parameters canonly be modelled as a set of possible values.
Other, normal changes need to be considered as well, such as theeffect of temperature variation on capacitance, resistance and loads,normal fundamental frequency deviations, and the impact of voltagefluctuations.
Loads and generators Most harmonic studies assume that thenetwork impedance (everything in the network element) is inde-pendent of the impedance of the generator. This is generally truein conventional systems where the short circuit ratio (the ratioof the total system fault current to the load/generator current) isrelatively high. In most renewable and distributed generation systemsthat are located in weak networks this assumption does not hold:the frequency dependent impedance as measured at the point ofconnection is significantly impacted by the generator impedance. Thisis demonstrated in the graph below, and has important consequencesfor harmonic studies as each of the several hundred possible networkscenarios now also needs to consider the many possible variations ingenerator configurations, most of which will almost certainly not beknown until detail design of the generator is complete.
Generator connectedGenerator not connected
Impe
danc
e (Ω
)
101
102
103
104
Frequency (× 50 Hz)0 10 20 30 40 50
Fig. 4. Subset of network impedance depending on generatorconnection
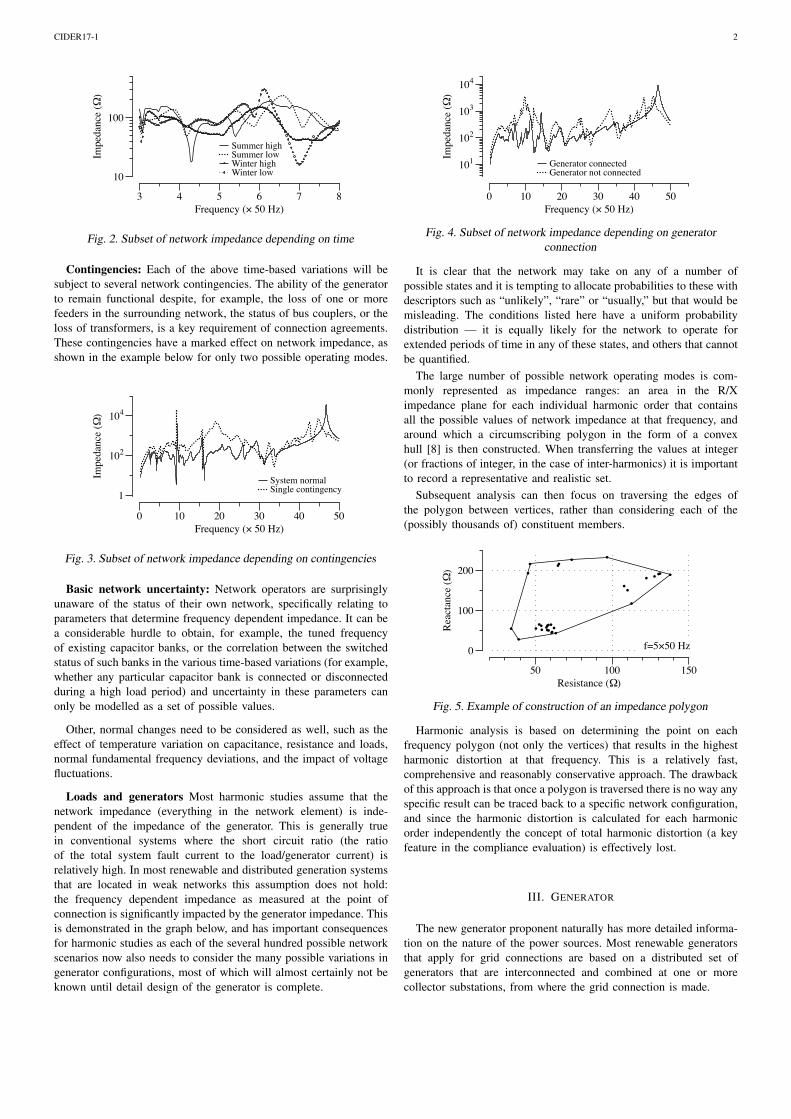
It is clear that the network may take on any of a number ofpossible states and it is tempting to allocate probabilities to these withdescriptors such as “unlikely”, “rare” or “usually,” but that would bemisleading. The conditions listed here have a uniform probabilitydistribution — it is equally likely for the network to operate forextended periods of time in any of these states, and others that cannotbe quantified.
The large number of possible network operating modes is com-monly represented as impedance ranges: an area in the R/Ximpedance plane for each individual harmonic order that containsall the possible values of network impedance at that frequency, andaround which a circumscribing polygon in the form of a convexhull [8] is then constructed. When transferring the values at integer(or fractions of integer, in the case of inter-harmonics) it is importantto record a representative and realistic set.
Subsequent analysis can then focus on traversing the edges ofthe polygon between vertices, rather than considering each of the(possibly thousands of) constituent members.
f=5×50 Hz
Reac
tanc
e (Ω
)
0
100
200
Resistance (Ω)50 100 150
Fig. 5. Example of construction of an impedance polygon
Harmonic analysis is based on determining the point on eachfrequency polygon (not only the vertices) that results in the highestharmonic distortion at that frequency. This is a relatively fast,comprehensive and reasonably conservative approach. The drawbackof this approach is that once a polygon is traversed there is no way anyspecific result can be traced back to a specific network configuration,and since the harmonic distortion is calculated for each harmonicorder independently the concept of total harmonic distortion (a keyfeature in the compliance evaluation) is effectively lost.
III. GENERATOR
The new generator proponent naturally has more detailed informa-tion on the nature of the power sources. Most renewable generatorsthat apply for grid connections are based on a distributed set ofgenerators that are interconnected and combined at one or morecollector substations, from where the grid connection is made.
CIDER17-1 3
...
...
External network
Grid connectiontransformer
Turbines
Collectorgroups
Cable network
Fig. 6. Slightly expanded view of embedded generator
Most of the information in this distributed network is well-defined:transformer impedance, cable construction and length, location andnumber of generators.
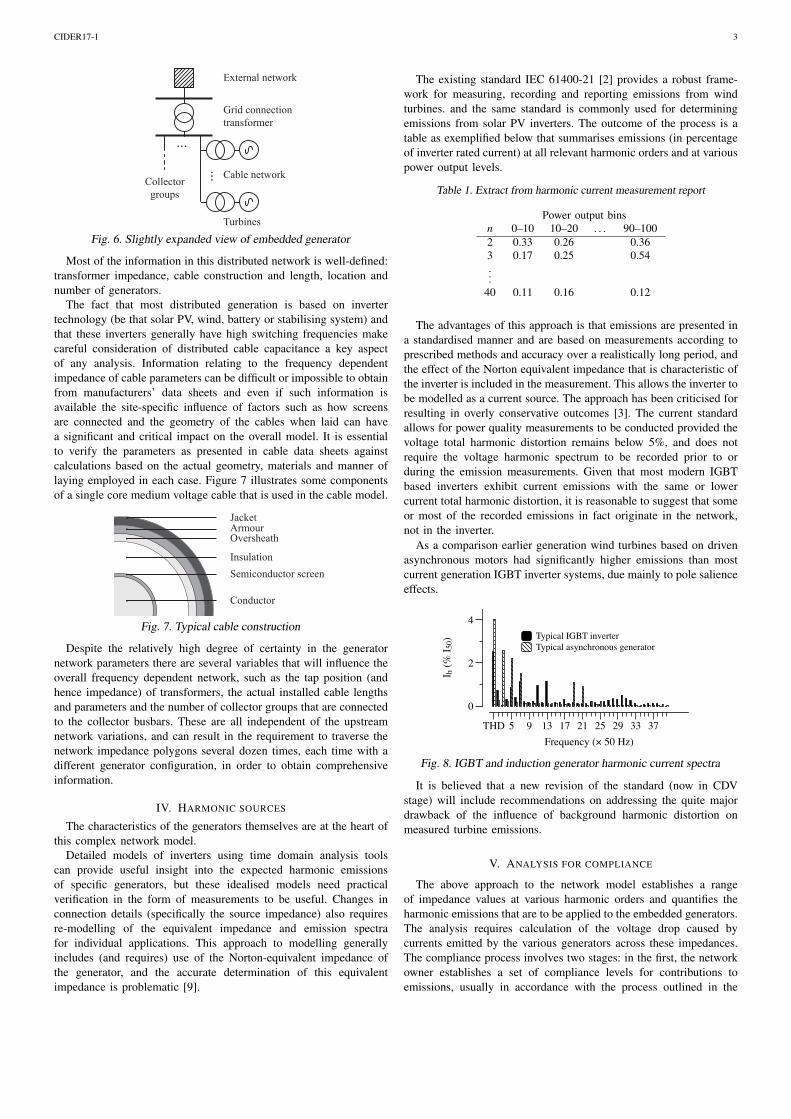
The fact that most distributed generation is based on invertertechnology (be that solar PV, wind, battery or stabilising system) andthat these inverters generally have high switching frequencies makecareful consideration of distributed cable capacitance a key aspectof any analysis. Information relating to the frequency dependentimpedance of cable parameters can be difficult or impossible to obtainfrom manufacturers’ data sheets and even if such information isavailable the site-specific influence of factors such as how screensare connected and the geometry of the cables when laid can havea significant and critical impact on the overall model. It is essentialto verify the parameters as presented in cable data sheets againstcalculations based on the actual geometry, materials and manner oflaying employed in each case. Figure 7 illustrates some componentsof a single core medium voltage cable that is used in the cable model.
Conductor
Semiconductor screenInsulation
OversheathArmourJacket
Fig. 7. Typical cable construction
Despite the relatively high degree of certainty in the generatornetwork parameters there are several variables that will influence theoverall frequency dependent network, such as the tap position (andhence impedance) of transformers, the actual installed cable lengthsand parameters and the number of collector groups that are connectedto the collector busbars. These are all independent of the upstreamnetwork variations, and can result in the requirement to traverse thenetwork impedance polygons several dozen times, each time with adifferent generator configuration, in order to obtain comprehensiveinformation.
IV. HARMONIC SOURCES
The characteristics of the generators themselves are at the heart ofthis complex network model.
Detailed models of inverters using time domain analysis toolscan provide useful insight into the expected harmonic emissionsof specific generators, but these idealised models need practicalverification in the form of measurements to be useful. Changes inconnection details (specifically the source impedance) also requiresre-modelling of the equivalent impedance and emission spectrafor individual applications. This approach to modelling generallyincludes (and requires) use of the Norton-equivalent impedance ofthe generator, and the accurate determination of this equivalentimpedance is problematic [9].
The existing standard IEC 61400-21 [2] provides a robust frame-work for measuring, recording and reporting emissions from windturbines. and the same standard is commonly used for determiningemissions from solar PV inverters. The outcome of the process is atable as exemplified below that summarises emissions (in percentageof inverter rated current) at all relevant harmonic orders and at variouspower output levels.
Table 1. Extract from harmonic current measurement report
Power output binsn 0–10 10–20 . . . 90–1002 0.33 0.26 0.363 0.17 0.25 0.54...
40 0.11 0.16 0.12
The advantages of this approach is that emissions are presented ina standardised manner and are based on measurements according toprescribed methods and accuracy over a realistically long period, andthe effect of the Norton equivalent impedance that is characteristic ofthe inverter is included in the measurement. This allows the inverter tobe modelled as a current source. The approach has been criticised forresulting in overly conservative outcomes [3]. The current standardallows for power quality measurements to be conducted provided thevoltage total harmonic distortion remains below 5%, and does notrequire the voltage harmonic spectrum to be recorded prior to orduring the emission measurements. Given that most modern IGBTbased inverters exhibit current emissions with the same or lowercurrent total harmonic distortion, it is reasonable to suggest that someor most of the recorded emissions in fact originate in the network,not in the inverter.
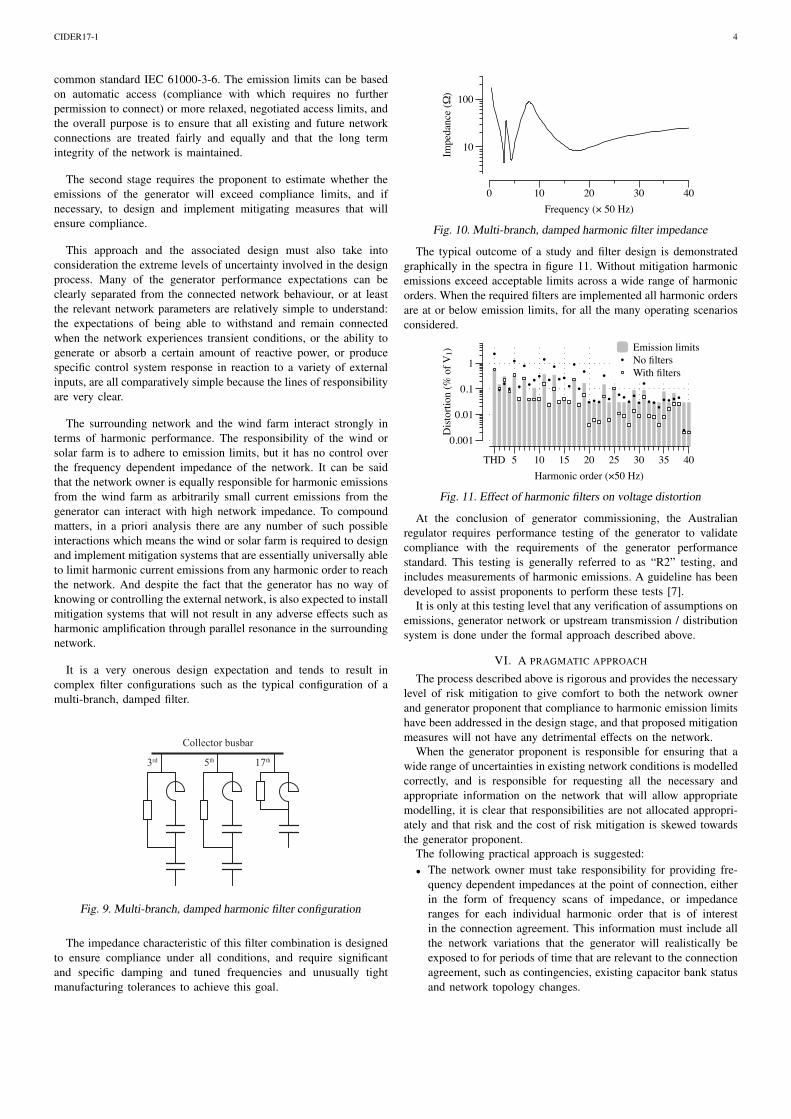
As a comparison earlier generation wind turbines based on drivenasynchronous motors had significantly higher emissions than mostcurrent generation IGBT inverter systems, due mainly to pole salienceeffects.
Typical IGBT inverterTypical asynchronous generator
I h (%
I 50)
0
2
4
Frequency (× 50 Hz)THD 5 9 13 17 21 25 29 33 37
Fig. 8. IGBT and induction generator harmonic current spectra
It is believed that a new revision of the standard (now in CDVstage) will include recommendations on addressing the quite majordrawback of the influence of background harmonic distortion onmeasured turbine emissions.
V. ANALYSIS FOR COMPLIANCE
The above approach to the network model establishes a rangeof impedance values at various harmonic orders and quantifies theharmonic emissions that are to be applied to the embedded generators.The analysis requires calculation of the voltage drop caused bycurrents emitted by the various generators across these impedances.The compliance process involves two stages: in the first, the networkowner establishes a set of compliance levels for contributions toemissions, usually in accordance with the process outlined in the
CIDER17-1 4
common standard IEC 61000-3-6. The emission limits can be basedon automatic access (compliance with which requires no furtherpermission to connect) or more relaxed, negotiated access limits, andthe overall purpose is to ensure that all existing and future networkconnections are treated fairly and equally and that the long termintegrity of the network is maintained.
The second stage requires the proponent to estimate whether theemissions of the generator will exceed compliance limits, and ifnecessary, to design and implement mitigating measures that willensure compliance.
This approach and the associated design must also take intoconsideration the extreme levels of uncertainty involved in the designprocess. Many of the generator performance expectations can beclearly separated from the connected network behaviour, or at leastthe relevant network parameters are relatively simple to understand:the expectations of being able to withstand and remain connectedwhen the network experiences transient conditions, or the ability togenerate or absorb a certain amount of reactive power, or producespecific control system response in reaction to a variety of externalinputs, are all comparatively simple because the lines of responsibilityare very clear.
The surrounding network and the wind farm interact strongly interms of harmonic performance. The responsibility of the wind orsolar farm is to adhere to emission limits, but it has no control overthe frequency dependent impedance of the network. It can be saidthat the network owner is equally responsible for harmonic emissionsfrom the wind farm as arbitrarily small current emissions from thegenerator can interact with high network impedance. To compoundmatters, in a priori analysis there are any number of such possibleinteractions which means the wind or solar farm is required to designand implement mitigation systems that are essentially universally ableto limit harmonic current emissions from any harmonic order to reachthe network. And despite the fact that the generator has no way ofknowing or controlling the external network, is also expected to installmitigation systems that will not result in any adverse effects such asharmonic amplification through parallel resonance in the surroundingnetwork.
It is a very onerous design expectation and tends to result incomplex filter configurations such as the typical configuration of amulti-branch, damped filter.
Collector busbar
3rd 5th 17th
Fig. 9. Multi-branch, damped harmonic filter configuration
The impedance characteristic of this filter combination is designedto ensure compliance under all conditions, and require significantand specific damping and tuned frequencies and unusually tightmanufacturing tolerances to achieve this goal.
Impe
danc
e (Ω
)
10
100
Frequency (× 50 Hz)0 10 20 30 40
Fig. 10. Multi-branch, damped harmonic filter impedance
The typical outcome of a study and filter design is demonstratedgraphically in the spectra in figure 11. Without mitigation harmonicemissions exceed acceptable limits across a wide range of harmonicorders. When the required filters are implemented all harmonic ordersare at or below emission limits, for all the many operating scenariosconsidered.
Emission limitsNo filtersWith filters
Dist
ortio
n (%
of V
1)0.001
0.01
0.1
1
Harmonic order (×50 Hz)THD 5 10 15 20 25 30 35 40
Fig. 11. Effect of harmonic filters on voltage distortion
At the conclusion of generator commissioning, the Australianregulator requires performance testing of the generator to validatecompliance with the requirements of the generator performancestandard. This testing is generally referred to as “R2” testing, andincludes measurements of harmonic emissions. A guideline has beendeveloped to assist proponents to perform these tests [7].
It is only at this testing level that any verification of assumptions onemissions, generator network or upstream transmission / distributionsystem is done under the formal approach described above.
VI. A PRAGMATIC APPROACH
The process described above is rigorous and provides the necessarylevel of risk mitigation to give comfort to both the network ownerand generator proponent that compliance to harmonic emission limitshave been addressed in the design stage, and that proposed mitigationmeasures will not have any detrimental effects on the network.
When the generator proponent is responsible for ensuring that awide range of uncertainties in existing network conditions is modelledcorrectly, and is responsible for requesting all the necessary andappropriate information on the network that will allow appropriatemodelling, it is clear that responsibilities are not allocated appropri-ately and that risk and the cost of risk mitigation is skewed towardsthe generator proponent.
The following practical approach is suggested:• The network owner must take responsibility for providing fre-
quency dependent impedances at the point of connection, eitherin the form of frequency scans of impedance, or impedanceranges for each individual harmonic order that is of interestin the connection agreement. This information must include allthe network variations that the generator will realistically beexposed to for periods of time that are relevant to the connectionagreement, such as contingencies, existing capacitor bank statusand network topology changes.
CIDER17-1 5
This is contrary to the existing situation, where network infor-mation is generally provided with disclaimers distancing theprovider of the information and the owner of the networkassets from responsibility for the accuracy and completenessof the information, and explicitly shifts the risk of any errors,incompleteness or lack suitability to the generator proponent.Responsibility for the accuracy of this information cannot bepassed to the generator proponent.
• The network owner is responsible for setting emission limits, andfor providing information on the prevailing harmonic distortionin the network prior to the generator being connected. Thisis vital information for the generator proponent as it allowscorrect ratings of any required mitigation equipment and allowsfor future evaluation of harmonic emissions contributing toprevailing harmonic distortion.
• Using this set of information, and the additional informationavailable on the generator network and inverter emissions, theproponent is responsible for a harmonic compliance assessment.This includes identifying the need for mitigation measures suchas harmonic filters. The proponent is responsible for providingsufficient infrastructure in the facility (in terms of availablespace, civil benching, switchgear, etc) to allow for these mea-sures to be implemented.
• During “R2” measurements, the actual emissions from the gener-ator are to be established, and if voltage distortion levels exceedthose set out in the emission limits, then mitigation is installedon the basis of the earlier assessment as modified by actualmeasurements. The “R2” measurement template unfortunatelydoes not address the issue of measurement error and uncertainty,suggesting only that measurement equipment should have validcalibration certificates. Magnetic voltage transformers typicallyin use in medium and some high voltage applications can exhibitunacceptable errors above approximately 1 kHz [6]. In general,the recommended guidelines in IEC TR61869 [5] suggeststhat any application that uses capacitive voltage transformerscommonly applied at HV and EHV cannot be used in anyway as the basis for voltage harmonic measurements, and thatcurrent technology restricts useful voltage measurements toresistive shunts, capacitor voltage dividers, or optical voltagetransformers. Current measurement is less problematic, withreasonable bandwidth possible with a variety of technologies,including the commonly used inductive type.The common absence of calibration certificates including fre-quency response tests for transmission or distribution levelinstrument transformers, and the inherent difficulty in measuringlow amplitude harmonic voltages and currents using existinginstrument transformers should be taken into consideration notonly during post-commissioning measurements, but also whensetting the emission limits.Another shortcoming of the “R2” measurement template is thatno guidance is provided on how to identify contributions toharmonic distortion at the point of connection in the presenceof existing background harmonic distortion. The measurementplan should identify how this will be done once backgroundharmonic measurements are made.
• The proponent is to guarantee a fixed time period withinwhich emissions will be made compliant once generation hascommenced.
VII. CONCLUSION
The pragmatic approach to harmonic compliance assessment sug-gested in this article reduces the risk to the network owner, as anyerrors in the original network information are detected and corrected
in the subsequent measurement process. It reduces the risk to theproponent of having to design and install mitigation measures thatmay be unnecessary, expensive and due to lack of accurate networkinformation, ill suited to the application. The final outcome is agenerator that is integrated correctly into the local network with least-cost, reliable and robust harmonic emission performance.
REFERENCES
[1] IEC/TR 61000. Electromagnetic compatibility (EMC) — part 3-6:Limits — Assessment of emission limits for the connection of distortinginstallations to MV, HV and EHV power systems. Technical report, IEC,2008.
[2] IEC 61400-21. Wind turbines — Part 21: Measurement and assessmentof power quality characteristics of grid connected wind turbines, 2008.
[3] F. Santjer J. Niiranen B. Andresen, P. E. Sørensen. Overview, statusand outline of the new revision for the IEC 61400-21: Measurementand assessment of power quality characteristics of grid connected windturbines. 12th International Workshop on Large-Scale Integration ofWind Power into Power Systems as well as on Transmission Networksfor Offshore Wind Power Plants, 12, 2013.
[4] Australian Energy Market Commission. National Electricity Rules Ver-sion 91, May 2017.
[5] International Electrotechnical Commission. Instrument transformers —the use of instrument transformers for power quality measurement.Technical Report TR 61869, IEC Central Office 3, rue de Varembe CH-1211 Geneva 20 Switzerland, 2012.
[6] Jarosław Luszcz. Voltage Harmonics Measuring Issues in MediumVoltage Systems. Number ISBN: 978-953-307-335-4. InTech, Availablefrom: http://www.intechopen.com/books/power-quality-harmonics-analysis-and-real-measurements-data/voltage-harmonics-measuring-issues-in-medium-voltage-systems, 2011.
[7] Australian Energy Market Operator. GPS compliance assessment and R2model validation test plan template, November 2016.
[8] F. P. Preparata and S. J. Hong. Convex hulls of finite sets of points intwo and three dimensions. Communications of the ACM, 20:87–93, 1977.
[9] Jian Sun. Modeling and analysis of harmonic resonance involvingrenewable energy sources. In IPST2013, Vancouver, Canada, July 2013.International Conference on Power Systems Transients.