harnessing the landscape of microbial culture media …ruppin/ncomm_media.pdf · harnessing the...
TRANSCRIPT

ARTICLE
Received 21 Jan 2015 | Accepted 27 Aug 2015 | Published 13 Oct 2015
Harnessing the landscape of microbial culturemedia to predict new organism–media pairingsMatthew A. Oberhardt1,2,3,*, Raphy Zarecki1,*, Sabine Gronow4, Elke Lang4, Hans-Peter Klenk5,
Uri Gophna2,** & Eytan Ruppin1,3,**
Culturing microorganisms is a critical step in understanding and utilizing microbial life.
Here we map the landscape of existing culture media by extracting natural-language media
recipes into a Known Media Database (KOMODO), which includes 418,000 strain–media
combinations, 43300 media variants and compound concentrations (the entire collection of
the Leibniz Institute DSMZ repository). Using KOMODO, we show that although media
are usually tuned for individual strains using biologically common salts, trace metals and
vitamins/cofactors are the most differentiating components between defined media of strains
within a genus. We leverage KOMODO to predict new organism–media pairings using a
transitivity property (74% growth in new in vitro experiments) and a phylogeny-based
collaborative filtering tool (83% growth in new in vitro experiments and stronger growth on
predicted well-scored versus poorly scored media). These resources are integrated into a
web-based platform that predicts media given an organism’s 16S rDNA sequence, facilitating
future cultivation efforts.
DOI: 10.1038/ncomms9493 OPEN
1 Blavatnik School of Computer Sciences and Sackler School of Medicine, Tel Aviv University, Tel Aviv 69978, Israel. 2 Department of Molecular Microbiologyand Biotechnology, Faculty of Life Sciences, Tel Aviv University, Tel Aviv 69978, Israel. 3 Center for Bioinformatics and Computational Biology (CBCB),Department of Computer Science, and University of Maryland, Institute of Advanced Computer Science (UMIACS), University of Maryland, College Park,Maryland 20742, USA. 4 Leibniz Institute DSMZ—German Collection of Microorganisms and Cell Cultures, Braunschweig 38124, Germany. 5 School ofBiology, Newcastle University, Newcastle upon Tyne NE1 7RU, UK. * These authors contributed equally to this study. ** These authors jointly supervised thework. Correspondence and requests for materials should be addressed to M.A.O. (email: [email protected]) or to U.G. (email: [email protected]) or toE.R. (email: [email protected]).
NATURE COMMUNICATIONS | 6:8493 | DOI: 10.1038/ncomms9493 | www.nature.com/naturecommunications 1
& 2015 Macmillan Publishers Limited. All rights reserved.

Culturing microorganisms is a classic microbiology chal-lenge that is critical for tapping the biotechnologicalpotential of microbial life. For example, a recent break-
through in culturing of soil microbes enabled extraction of a newantibiotic compound that did not incur detectable resistanceamong tested pathogens, thus serving a critical need in humanhealth1. Despite the very large time and effort spent in culturingorganisms over the last century and a half, much of the process ofdeveloping of culture media is still strikingly similar to what itlooked before the (gen)omics era (compare, for example, refs 2–6,from 1936, 1979, 2001, 2003 and 2012, respectively), and mostmicroorganisms in nature still have not been cultured (B99%, byclassical estimates7). Best practices for culturing new organismshave been developed, and are embedded in guides such asBergey’s Manual of Systematic Bacteriology8. However, even withthese best practices, the typical procedure for culturing a newmicroorganism still requires a great deal of experience and trialand error.
In recent years, some culturing efforts, particularly fordifficult-to-culture organisms, have begun to include genomeand pathway analysis9,10, as well as high-throughput technologiesfor determining microbial nutrient needs11. Instrumental in thiswork is pathway-based metabolic modelling, which encompassesmany powerful tools for interrogating the metabolic capabilitiesof organisms12–14. Metagenomic sequencing technology,meanwhile, is now enabling the amassment of huge quantitiesof data about currently uncultured organisms. This confluence oftechnological, computational and theoretical advances marks aturning point and a challenge in ecological microbiology, as ourdata collection abilities now far surpass our ability to culturemicrobes. Integrating all of these areas will require freshapproaches to rapidly bring new organisms into culture. Alogical starting point for this is to first catalogue the large currentset of lab media that have been painstakingly and manuallydeveloped to date, and then to explore what insight these knownmedia can give into predicting successful organism–mediapairings.
Fortunately, a large collection of proven culture media exists inthe Leibniz Institute DSMZ, a German non-profit centre thatstores and disseminates microbes. The DSMZ repository (https://www.dsmz.de/?id=441) contains around 1,300 media (as well asmany individualized variations) for around 23,000 microbialstrains, encompassing the majority of culturing media in generaluse today. However, the DSMZ media are listed as recipes in non-standardized portable document format (PDF) files from whichfinal compound concentrations can only be obtained via carefulreading, cross-referencing, rearrangement and integration ofstrain-specific instructions. Codifying the exact nutritionalcompositions of these media is an undertaking of fundamentalimportance for microbiologists and systems biologists, but doingthis requires collating and standardizing the component lists inthese files, which is very tedious and a highly non-trivial task initself.
In this work, we have integrated and codified these mediadocuments into a relational database (KOMODO) that can beaccessed computationally using Structured Query Language,enabling an analysis of broad features and trends in proven labmedia. Notably, the database we have built is an order ofmagnitude larger than a previous effort to build a known mediadatabase15: our database contains 18,049 species, 3,335 media and20,824 organism–media pairings, whereas the previous databaseincluded 208 species, 461 media and 765 organism–mediapairings. Our compilation has enabled the systematic study ofthe majority of growth media for the first time, revealing patternsand principles determining whether organisms tend to grow onmedia. We mine this database in the context of microbial
phylogeny to explore which nutrients are most commonly used inmedia across the tree of life, and which ones are mostdifferentiating between close species. Next, we develop aphylogeny-based predictor of new organism–media pairings,which enables successful prediction of new organism–mediapairings among cultured organisms. We provide this resource inan online searchable database and a tool that predicts media forany bacteria or archaea, given a 16S rDNA sequence or NationalCenter for Biotechnology Information (NCBI) taxon ID (thetool can be found at: http://delta-tomcat-vm.cs.tau.ac.il:40678/komodo/default.htm).
ResultsAn overview of KOMODO, the known-media database. A largecollection of media for bacteria and archaea is publically availablethrough the collection of strains and media at the DSMZ (https://www.dsmz.de/?id=441), but these media are listed in non-stan-dardized PDF files that cannot be computationally accessed.Putting these media into a usable database form required exten-sive and non-trivial work, parsing, merging and organizing, aswell as handling cross-references between media and submediacompound mixtures such as ‘trace element solutions,’ whichcould be detailed and referenced from any DSMZ medium. Thiswas achieved by extensive manual curation followed by anautomated pipeline to import the data, and finally several vali-dation checks against ‘gold-standard’ data sets that were curatedsemi-manually. This pipeline is depicted in the flowchart inSupplementary Fig. 1, and is thoroughly described in theMethods.
The result of the work is the Known Media Database(KOMODO), a database of microbial culture media thatencompasses almost the entire DSMZ collection. The databaseincludes 3,335 media variants (expanded from an initial B1,300because of special instructions and substitutions), 1,324 uniquemetabolic component names composing the media, 18,049microbial strains and 20,824 media–strain pairings. The basicstructure of KOMODO is shown in Fig. 1. Components inKOMODO were decomposed when possible into chemical namesfrom Model SEED, a large, consistent systems biology andgenome annotation database16. This was done to eliminatedegeneracies in component names, as a service to thebioinformatics and metagenomics communities that use SEED,and especially to enable integration and comparison ofKOMODO media with genome-scale metabolic modellingefforts in the future (along the lines of ref. 17). KOMODO hasbeen made available for browsing by users at: http://delta-tomcat-vm.cs.tau.ac.il:40678/komodo/default.htm. It has also beenleveraged to create an online tool that enables users to input abacterial or archaeal 16S rDNA sequence or an NCBI taxon IDand in turn get predicted media that the organism can grow on(this tool is based on GROWREC, as described below, and isprovided on the same website).
KOMODO reveals global patterns of media and compound usage.Typical patterns of media usage and composition in KOMODOcan reveal fundamental trends in microbial nutrition, as well asgaps and investigator biases. To gain an overview of these relation-ships, we built histograms of component, media and organismdistributions across the database (Fig. 2a–d). We observed thatcomponent usage across media, and media usage across organismsboth follow power-laws, which suggests a ‘rich gets richer’ structureto the assignment of phenotypes and component usages (Fig. 2a,b).This structure might reflect converging nutrient requirementsamong organisms, the preferential way in which ‘successful’ mediaare selected for organisms by human investigators, or both.
ARTICLE NATURE COMMUNICATIONS | DOI: 10.1038/ncomms9493
2 NATURE COMMUNICATIONS | 6:8493 | DOI: 10.1038/ncomms9493 | www.nature.com/naturecommunications
& 2015 Macmillan Publishers Limited. All rights reserved.
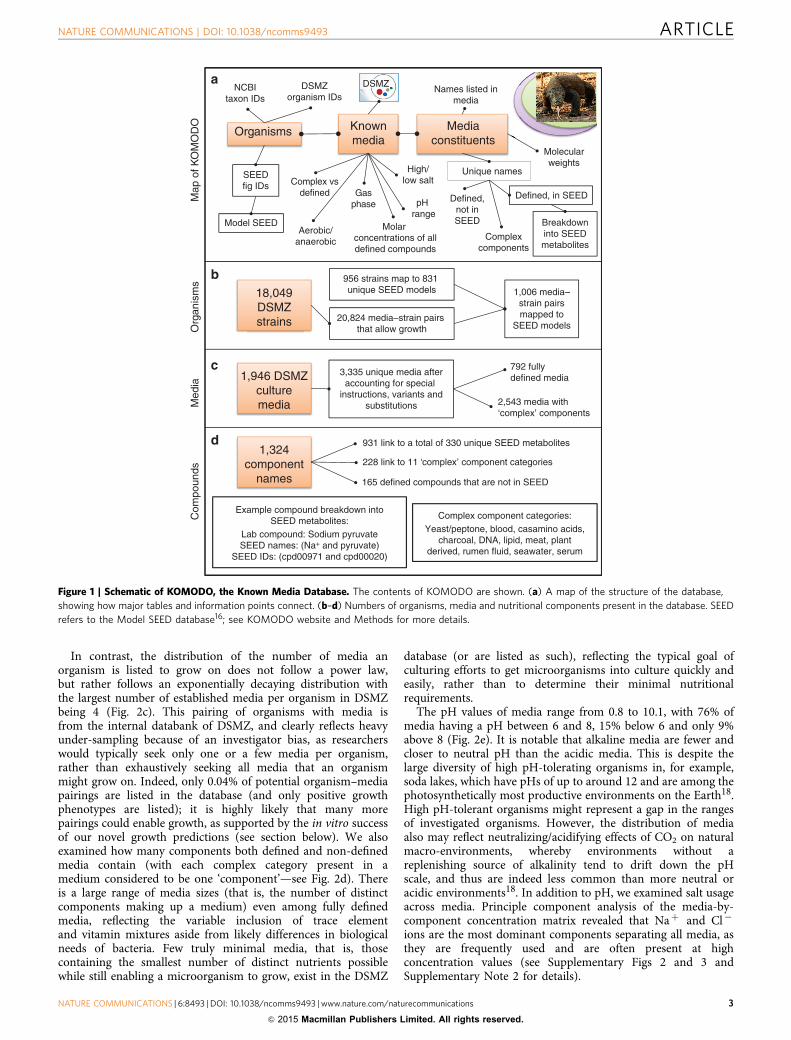
In contrast, the distribution of the number of media anorganism is listed to grow on does not follow a power law,but rather follows an exponentially decaying distribution withthe largest number of established media per organism in DSMZbeing 4 (Fig. 2c). This pairing of organisms with media isfrom the internal databank of DSMZ, and clearly reflects heavyunder-sampling because of an investigator bias, as researcherswould typically seek only one or a few media per organism,rather than exhaustively seeking all media that an organismmight grow on. Indeed, only 0.04% of potential organism–mediapairings are listed in the database (and only positive growthphenotypes are listed); it is highly likely that many morepairings could enable growth, as supported by the in vitro successof our novel growth predictions (see section below). We alsoexamined how many components both defined and non-definedmedia contain (with each complex category present in amedium considered to be one ‘component’—see Fig. 2d). Thereis a large range of media sizes (that is, the number of distinctcomponents making up a medium) even among fully definedmedia, reflecting the variable inclusion of trace elementand vitamin mixtures aside from likely differences in biologicalneeds of bacteria. Few truly minimal media, that is, thosecontaining the smallest number of distinct nutrients possiblewhile still enabling a microorganism to grow, exist in the DSMZ
database (or are listed as such), reflecting the typical goal ofculturing efforts to get microorganisms into culture quickly andeasily, rather than to determine their minimal nutritionalrequirements.
The pH values of media range from 0.8 to 10.1, with 76% ofmedia having a pH between 6 and 8, 15% below 6 and only 9%above 8 (Fig. 2e). It is notable that alkaline media are fewer andcloser to neutral pH than the acidic media. This is despite thelarge diversity of high pH-tolerating organisms in, for example,soda lakes, which have pHs of up to around 12 and are among thephotosynthetically most productive environments on the Earth18.High pH-tolerant organisms might represent a gap in the rangesof investigated organisms. However, the distribution of mediaalso may reflect neutralizing/acidifying effects of CO2 on naturalmacro-environments, whereby environments without areplenishing source of alkalinity tend to drift down the pHscale, and thus are indeed less common than more neutral oracidic environments18. In addition to pH, we examined salt usageacross media. Principle component analysis of the media-by-component concentration matrix revealed that Naþ and Cl�
ions are the most dominant components separating all media, asthey are frequently used and are often present at highconcentration values (see Supplementary Figs 2 and 3 andSupplementary Note 2 for details).
3,335 unique media afteraccounting for special
instructions, variants andsubstitutions
1,946 DSMZculturemedia
20,824 media–strain pairs that allow growth
18,049DSMZstrains
1,006 media–strain pairsmapped to
SEED models
792 fully defined media
Example compound breakdown intoSEED metabolites:
Lab compound: Sodium pyruvateSEED names: (Na+ and pyruvate)
SEED IDs: (cpd00971 and cpd00020)
228 link to 11 ‘complex’ component categories
165 defined compounds that are not in SEED
Complex component categories:Yeast/peptone, blood, casamino acids,
charcoal, DNA, lipid, meat, plantderived, rumen fluid, seawater, serum
956 strains map to 831 unique SEED models
2,543 media with ‘complex’ components
Med
iaC
ompo
unds
Org
anis
ms
931 link to a total of 330 unique SEED metabolites1,324
componentnames
Defined, in SEED
Organisms Knownmedia
Mediaconstituents
SEEDfig IDs Complex vs
definedpH
range
Defined,not inSEED
NCBItaxon IDs
Gasphase
Molar concentrations of alldefined compounds
Unique names
Breakdowninto SEEDmetabolites
Names listed inmedia
Model SEED
Molecularweights
DSMZorganism IDs
Map
of K
OM
OD
O
Aerobic/anaerobic
a
d
c
b
Complexcomponents
High/low salt
DSMZ
Figure 1 | Schematic of KOMODO, the Known Media Database. The contents of KOMODO are shown. (a) A map of the structure of the database,
showing how major tables and information points connect. (b–d) Numbers of organisms, media and nutritional components present in the database. SEED
refers to the Model SEED database16; see KOMODO website and Methods for more details.
NATURE COMMUNICATIONS | DOI: 10.1038/ncomms9493 ARTICLE
NATURE COMMUNICATIONS | 6:8493 | DOI: 10.1038/ncomms9493 | www.nature.com/naturecommunications 3
& 2015 Macmillan Publishers Limited. All rights reserved.

To gain a more complete picture of component usage acrossthe tree of life, we examined which components are used in themedia of the most genera (Fig. 2f, left bar graph). We observedthat the most frequent components are biologically commonions/salts that are usually present as macronutrients (1–100 mM),
followed by trace metal elements and vitamins (which arepresent in 0.1–10 mM and 1–1,000 nM ranges, respectively; seeconcentrations bar on the left of Fig. 2f). Also frequent acrossgenera are some complex media components (peptone and meatextract) and the carbon sources (glucose and starch). Some of
Component is used in genus
Component is differential in genus
Component is differential in defined media in genus
Component appears in strain-specific instructions in genus
F–
Sr2+
CO2
Br–
N2
L-CysteineCitrateStarch
ResazurinComplex-meat
D-GlucoseComplex-yeast/peptone
PyridoxolRiboflavin
FolateNiacin
4-AminobenzoatePantothenate
BiotinThiamin
Coenzyme B12Fe2+
Ni2+
MolybdateCo2+
Cu2+
Zn2+
Fe3+
Mn2+
Boric acidS2–
NH4+
H2CO3
Ca2+
SulfatePhosphate
Mg2+
K+
Cl–Na+
1
10
100
Com
pone
nt c
ount
# Media a component is in
Distribution of components in media
0
50
100
150
200
250
300
1 4 107 13 16 19 22 25 28 31 34 37 40 43 46 49
Med
ia c
ount
Number of components per medium
Distribution of media by # components
Defined media
Non-defined media
1
10
100
1,000
10,000
100,000
Distribution of organisms on media
1
10
100
1,000
Med
ia c
ount
Distribution of media by # organisms
a
b
c
d
2 4 6 8 10100
101
102
103
pH
# M
edia
Distribution of media pH
e
# Genera
f Most frequently used media components
Vita
min
s/co
enzy
mes
Oth
er
Com
mon
ions
and
com
poun
dsT
race
met
als/
met
allo
ids
# Genera # Genera # Genera
–1–1–2–3–2–3–3–2–2–3–6–6–5–6–7–6–7–7–5–9–7–7–7–6–6–7–7–6
–2
–5–3–3–3
–3
–4–4
Log10 (avg. molar concentration)
# Organisms growing on medium
Org
anis
m c
ount
# Media organism grows on
1 100 10,000
1 100 10,000
0 1 2 3 4 5
0 0400 800 80 160 0 5 10 0 60 120
Figure 2 | Large-scale properties of known media. (a) Distributions of components in media. This includes both defined and complex/undefined
components, where undefined components are grouped into their complex categories and each category present in a medium is counted as one
component. (b) Distributions of media by the number of organisms that grow on them. (c) Distributions of the number of media that organisms grow on.
(d) Distribution of media by the number of components within them. (e) Distribution of pH values of known media. Red squares in a and b denote the bins
used for the power law fit. (f) The 40 most frequently used media components across genera. Ions listed here were typically added to media as salts, which
we assume completely dissociate in solution (for example, MgCl2 becomes Mg2þ and Cl� ). Components are broken into four groups: biologically
common ions/compounds, trace metals/metalloids, vitamins/coenzymes and other. Within each group, components are listed in order of their frequency
of usage across genera, from most to least. Left of the bar graphs is a list of average concentrations of each component in media across KOMODO, listed in
units of log10(molar concentration). A component is ‘differential’ in a genus if it appears in media for some strains in that genus but not others.
ARTICLE NATURE COMMUNICATIONS | DOI: 10.1038/ncomms9493
4 NATURE COMMUNICATIONS | 6:8493 | DOI: 10.1038/ncomms9493 | www.nature.com/naturecommunications
& 2015 Macmillan Publishers Limited. All rights reserved.

these components might be added to many media but are notselective between related organisms. To better understand whichcomponents are actually differentiating between similar species,we checked the number of genera in which a component ispresent in media for some species/strains but not for others. Wedid this first taking into account all media, and then onlyconsidering fully defined media (Fig. 2f, middle two bar graphs).Strikingly, when considering only fully defined media, thecomponents that are differential across the most genera are tracemetals and vitamins/coenzymes, despite their being less com-monly used across genera than the common ions/salts. Thissignal was likely hidden when also including non-defined mediaas complex components such as meat extract provide many ofthese trace components at once. Supporting this observation, the‘complex-meat’ category is a highly differentiating componentacross genera when considering all media—see second bar graphin Fig. 2f.
This analysis points to trace compounds such as metal ions andcofactors as key ingredients to consider when trying to grow newspecies from within cultured genera, a principle that has beennoted recently in trying to culture as-yet-uncultured genera aswell1,19. For comparison, we also extracted from KOMODO allinstances where a nutritional ingredient is specifically added,removed or has its concentration changed from a base medium inorder to grow a given strain, and assessed the number of genera inwhich each component is altered this way (Fig. 2f, right bargraph). The most frequently altered compounds in this way arethe biologically common ions/salts, followed by trace metals andvitamins. This lends further evidence that these trace componentsplay key roles in differentiating growth between close species, andthus should be considered in future media design.
Beyond these analyses, we examine broad trends in compoundusage across phyla at different taxonomic levels. Heat maps ofenrichment of different taxonomic groups for media componentscan be found in Supplementary Figs 4–8 and Supplementary Note 3.
Media usage follows phylogenetic and ecological trends. Animplicit assumption that investigators make when trying to cul-tivate new microorganisms is that the best medium to start with isone from a phylogenetic or ecological neighbour. Despite itsapparent logic, this assumption has not, to our knowledge, beenrigorously tested and validated. To do this, we mapped organismsin DSMZ to operational taxonomic units in Greengenes ecolo-gical data as clustered into environments (see Methods for details;clustering in ref. 20), and also to taxonomic classifications fromthe Interactive Tree of Life project (Itol21). We find that, indeed,the likelihood that two organisms share at least one lab mediumstrongly correlates with both their ecological and phylogeneticsimilarity (see Fig. 3; r¼ 0.76, P¼ 2.3e� 13, and r¼ 0.92,P¼ 1.3e� 3, respectively, for ecological and phylogeneticsimilarities, as determined by cohabitation Jaccard index(ecological) or inverse subtree count in the iTOL taxonomictree (phylogenetic); see Methods for details). This indicates thatphylogenetic and ecological closeness are good heuristics fordetermining the likelihood that two organisms have successfullybeen grown in the same lab medium. Indeed, we show later thatthis is not just descriptive of what has been done in the past, butthat it holds a signal that can be used predictively for derivingnew successful organism–media pairings. Importantly, thefractions of organism pairs sharing lab media listed in Fig. 3are likely underestimates, as the organism-by-media matrix inKOMODO is highly underpopulated (see previous section). Thisobservation is indeed upheld when we perform new growthexperiments, as most of our predictions (which were not listedpreviously in KOMODO) yield growth.
In addition to exact media matches as just described, we testedwhether these associations would also hold for partial matchesbetween lab media. We considered two organisms to have apartial medium match if a comparison of the best matchingmedia of the two organisms (or of the sets formed from theunions of components from all of their listed media) exceeded aspecified similarity threshold (see Methods for details). Indeed,over a range of thresholds and with all combinations of thesemetrics, the correlations between media similarity and ecologicalor phylogenetic relatedness are maintained (see SupplementaryFig. 13). These associations not only indicate that ecological orphylogenetic data may be helpful in guiding culturing oforganisms on known lab media, but, importantly, that these datamay be usable for determining likely subsets of media to includefor a given organism when developing novel media formulations.
Predicting new organism–media pairings via transitivity. Afundamental property in logic and math is the potentialtransitivity of a given relation R; that is, if R is transitive, then(ARB and BRC) implies that (ARC). To better understand theknown patterns of microbial growth in KOMODO, we askedwhether the property ‘organism sharing of media’ is transitive.
(Random pairs)
(Random pairs)
� = 0.76P = 2.3e–13
� = 0.92P = 1.3e–3
1
0.1
0.010 0.5 1
Ecological similarity of organism pairs vs.frequency of sharing a lab medium
Ecological similarity of organism pairs
Fra
ctio
n of
org
anis
m p
airs
sha
ring
a la
b m
ediu
m
Fra
ctio
n of
org
anis
m p
airs
sha
ring
a la
b m
ediu
m
Phylogenetic similarity of organism pairs vs.frequency of sharing a lab medium
Phylogenetic similarity of organism pairs
0.1
0.01
0.001
0.0001
0.000010 0.5 1
a
b
Figure 3 | Media usage is correlated with ecological and phylogenetic
similarity. The (a) ecological and (b) phylogenetic distances between pairs
of species are plotted versus the fraction of species pairs within each
ecological or phylogenetic distance bin that share at least one DSMZ
medium. Bubble areas are scaled to the number of organism pairs in each
bin. The fraction of random organism pairs of any ecological/phylogenetic
distance sharing a lab medium is shown by the horizontal blue line, for
reference. Distances are determined by a Jaccard metric of ecological co-
growth in Greengenes database (ecological) or by subtree distance
(phylogenetic; Methods).
NATURE COMMUNICATIONS | DOI: 10.1038/ncomms9493 ARTICLE
NATURE COMMUNICATIONS | 6:8493 | DOI: 10.1038/ncomms9493 | www.nature.com/naturecommunications 5
& 2015 Macmillan Publishers Limited. All rights reserved.

To test this, we searched the KOMODO data for growth mediapatterns involving three organisms A, B and C, in which it isgiven that A and B grow together on a certain medium (m1), Band C grow together on another medium (m2) and C grows on athird medium (m3; see Fig. 4a). Given this pattern and assumingtransitivity, we predicted that organism A would be more likelythan a randomly chosen organism to grow on m3 (see Methodsfor details). Out of 1,000 such tests, we identified 694 positive(that is, documented growth) instances of transitivity versus only1 positive case among the 1,000 randomly selected organisms.This result strongly indicates that media preferences are indeedtransitive (binomial Po1e� 186).
The significant under-sampling of bacterial growth media perorganism that is manifested in KOMODO means that a largenumber of potential organism–media pairings may be viable, buthave simply never been tested in vitro. We therefore used thetransitivity identified above to predict a total of 15,147 neworganism–media pairings that may be viable which, if true, wouldnearly double the number of organism–media pairings in thedatabase (from an initial 20,840). Interestingly, when including allof the new transitive-predicted phenotypes in the database, weobserved that the distribution of organisms on media now doesfollow a power-law, as opposed to the exponential distributionseen originally (compare Supplementary Fig. 14c and Fig. 2c).
Using this expanded database to re-evaluate how phylogenetic orecological distance affects the chance for two organisms to share alab medium (analogous to Fig. 3) yielded a significant correlationversus ecological distance but only borderline-significance againstphylogenetic distance, indicating the limits of this method (seeSupplementary Fig. 9 and Supplementary Note 4). We addition-ally tested how often non-defined or ‘rich’ media (see latersections for ‘richness’ definition) participate in transitive associa-tions. We found that the most common and accurate transitivepredictions are for organisms known to grow on rich media, butthat these predictions can be based on transitive associationslinking through media of any richness (see Supplementary Note 5for details).
Experimental validation of transitivity predictions. To testwhether organism–medium pairings predicted via transitivity arevalid, we performed the following two-step process. First, weasked expert curators at DSMZ to assess the reasonableness of alarge set of more than 1,000 predictions. Four experts participatedin this test. Given lists of organism–medium pair predictions,they were asked to label the reasonableness of the predictions, andto give comments if they had particular insights. We classifiedtheir responses into three categories: yes, no and maybe/inde-terminate. In all, they confirmed 64% of predictions they assessed(that is, they said ‘yes’ for 873 out of 1,354 predictions, with 109‘maybes’—see Fig. 4b).
Next, we chose a subset of 43 predictions to test experimentallyin lab. For this, we chose organism–media pairings with varyingcurator confidences (24 predicted to yield growth, and 19 unsureor predicted not to). We found that a remarkable 74% ofpredicted pairings yielded strong or medium growth, withpositive growth phenotypes found among all of the curator-predicted classes (strong or medium growth was found in: 20 of24 predicted to grow; 3 of 6 predicted not to grow; 3 of 7 listed as‘maybes’ and 6 of 6 not previously assessed by the curators). Thissuccess rate may be further appreciated by noting that thepercentage of mid-to-high growth of the same organisms whengrown on their standard listed DSMZ media is only slightlyhigher, reaching a level of 81%, albeit with a higher percentage of‘strong’ versus ‘mid’ growth (Fig. 4c). These experimentsdemonstrate our ability to harness growth media transitivity topredict many new organism–media pairings that are almost asgood as existing ones.
Predicting media usage via collaborative filtering. The asso-ciations we observed between phylogenetic (or ecological) dis-tance and likelihood of two organisms sharing a lab medium, aswell as the observation of transitivity of growth on lab media,suggest a new way to predict new organism–medium pairings. Toleverage these observed relationships towards this goal, wedeveloped a collaborative filtering medium recommendationsystem, which proceeds in two steps. Given an input ‘test’organism for which we aim to predict growth media, we firstselect a set of organisms from within KOMODO that are phy-logenetically (or ecologically) close to the ‘test’ organism (which isnot required to be in KOMODO). Next, we integrate the knownmedium preferences of those organisms into a ‘collaborativescore’ (or ‘collab score’) that indicates which media the testorganism is likely to grow on (see Fig. 5a and Methods fordetails). The phylogeny-based predictor was used in all followinganalyses, unless specifically stated otherwise; the ‘closeness’threshold was set at a phylogenetic subtree distance of 0.04, asthis yielded the most accurate results (see Supplementary Note 6for a sensitivity analysis of this threshold).
17
15
10
1
2411
8
0
New experimental validation of predictionsc
Growth of organisms on their listed DSMZ media
Growth of organisms on transitive-predicted media
(81% Strong/mid) (74% Strong/mid)
Strong Mid Low None
Species 1 2 3
Org A Yes ?
Org B Yes Yes
Org C Yes Yes
Media
If transitive, then ‘Yes’
a Transitive prediction schema
873109
481
Yes Maybe No
Expert curator assessmentsb
Will organism grow on transitive-predicted medium?
(67% ‘Yes’ or ‘maybe’)
Figure 4 | Transitive media predictions. Organism–media pairings are
predicted based on an observed transitivity heuristic following a schema
shown in (a). Organisms orgA and orgB share a medium (M1), organisms
orgB and orgC grow on M2 and the third organism orgC grows on medium
3; we then predict, based on transitivity, that orgA will grow on medium 3.
(b) Distribution of expert DSMZ curator opinions on whether organisms
will grow in transitive-predicted media (full opinion descriptions are
provided in Supplementary Data 1). (c) Pie charts that represent the
number of growth phenotypes observed for organisms grown in vitro on
their listed lab media (left) and for the same organisms grown on newly
predicted media (right). Numbers in the pie charts show the number of
organism–medium pairs tested.
ARTICLE NATURE COMMUNICATIONS | DOI: 10.1038/ncomms9493
6 NATURE COMMUNICATIONS | 6:8493 | DOI: 10.1038/ncomms9493 | www.nature.com/naturecommunications
& 2015 Macmillan Publishers Limited. All rights reserved.

In all, our phylogenetic-based collaborative filtering predictor(hereafter called GROWREC) recommended 47,060 organism–medium pairings. (A higher threshold could yield a score for anyorganism–medium pairing, but lower specificity (for example, seeSupplementary Fig. 12c–e for details).) Of these predictions, 1,768(4%) were ‘true positive’ organism–medium pairings (that is,those already present in the DSMZ database), a percent extremelyunlikely by chance (P¼ 5.4e� 49 in empirical permutation testwhen compared with a ‘null’ predictor based solely on the relativeabundance of media and organisms in KOMODO—see Methodsfor details). It is important to note that GROWREC predictionstake into account the media preferences of phylogeneticneighbours of an organism, but do not take into account anyknown media associations of the organism itself. Therefore, truepositive media pairings predicted for an organism are notcircular, but rather represent the success of a leave-one-out test.Remarkably, the collaborative score correlates extremely stronglywith the rate of such ‘true positive’ organism–medium pairings(Fig. 5b; r¼ 0.76, P¼ 2.7e� 4 in Spearman test, where fractionsof true positives are plotted per bin of collaborative scores). Thecollaborative score also strongly correlates with medium usagefrequency from the database (Supplementary Fig. 15a; rho¼ 0.87,Po3e� 5 also binning by collaborative score). Therefore, weused partial correlations as controls and found that the frequencyof true positives correlates with the collaborative score even whencorrecting for media usage frequency (Fig. 5c; r ¼ 0.51,P¼ 2.9e� 2 in a partial Spearman test).
Among the most important factors determining microbialgrowth on a medium is the salt content (as revealed via principlecomponent analysis; see Supplementary Fig. 2) and the presenceor absence of oxygen. To further refine GROWREC, we classifiedorganisms into salt and oxygen usage groups (for example, highsalt, low salt and so on) based on observed patterns of growth onDSMZ media, and imposed filters on GROWREC predictions toeliminate pairings of high-salt organisms with low-salt media,and so on (see Methods and Supplementary Note 7 for full detailsof the analysis). This significantly increased the accuracy andquality of our predictions (for example, total true positivesincreased from 3.8 to 6.8%, with 20,357 (44%) predictionseliminated without losing true positives). To display thisimprovement, we show a plot of GROWREC accuracyversus the percent of results considered (starting from thosewith the best scores), pre- and post-filtering (Fig. 5d). It canbe seen from the plot that filtering allows consideration ofnearly twice the number of results, while keeping the sameexpected accuracy.
GROWREC predicts levels of key nutritional factors in media.Aside from predicting full media (as just reported), we wereinterested in using GROWREC to predict strain preferences forkey nutritional features, as such a method could then be used inprinciple to design novel media. We tested this concept on thefeature of media ‘richness,’ which should be matched with strain
–6 –4 –2 0 2 4
–10
–5
0
5
Collab score residuals
TP
frac
tion
resi
dual
s
101 102 103 104 1050.1
1
10
100
% K
now
n tr
ue p
ositi
ves
Collab score, bin centers
b Correlation of collaborative score withfraction true positive predictions
Collab score vs fraction true positivepredictions, correcting for media usage
frequency
d Improvement in predictor by application of O2 and salt filters
c
Base collab predictor
Collab predictor with O2 filter
Collab predictor with O2 and salt filter
Rho=0.76P=2.7e–4
rho=0.51P=2.9e–2
1 10 1000
20
40
60
80
100
% Predictions considered(starting from best)
% K
now
n tr
ue p
ositi
ves
1
Growthmedia:
2Organisms:
Known organism–mediapairs from KOMODO
3
Phylogeneticsimilarity
Predicted media for organism 3, basedon similarity to organism 2
GROWREC collaborative filtering predictora
CBA
Figure 5 | Collaborative filtering predicts media usage. (a) The concept of collaborative filtering. In brief, the media preferences for a new organism
(org3) are predicted based on known preferences of phylogenetically similar organisms (here, org2). (b) Circles represent bins per collaborative score, with
diameters proportional to the number of organism–media pairs per bin. Collaborative scores correlate with the true positive fraction (that is, the number of
organism–media pairings known in the actual DSMZ database). (c) The partial correlation of collaborative (¼ collab) score versus true positive fraction,
corrected for media usage frequency. (d) The true positive percentages of collaborative filtering predictions from GROWREC are presented with the base
predictor, and with oxygen and/or salt filters added on. The x axis shows the % of organism–media pair predictions considered (starting from the one with
the highest collaborative score and taking predictions in descending order of collaborative score), and the y axis shows the percentage of predicted
organism–media pairs within a given set that are known true positives (that is, are already listed in KOMODO).
NATURE COMMUNICATIONS | DOI: 10.1038/ncomms9493 ARTICLE
NATURE COMMUNICATIONS | 6:8493 | DOI: 10.1038/ncomms9493 | www.nature.com/naturecommunications 7
& 2015 Macmillan Publishers Limited. All rights reserved.
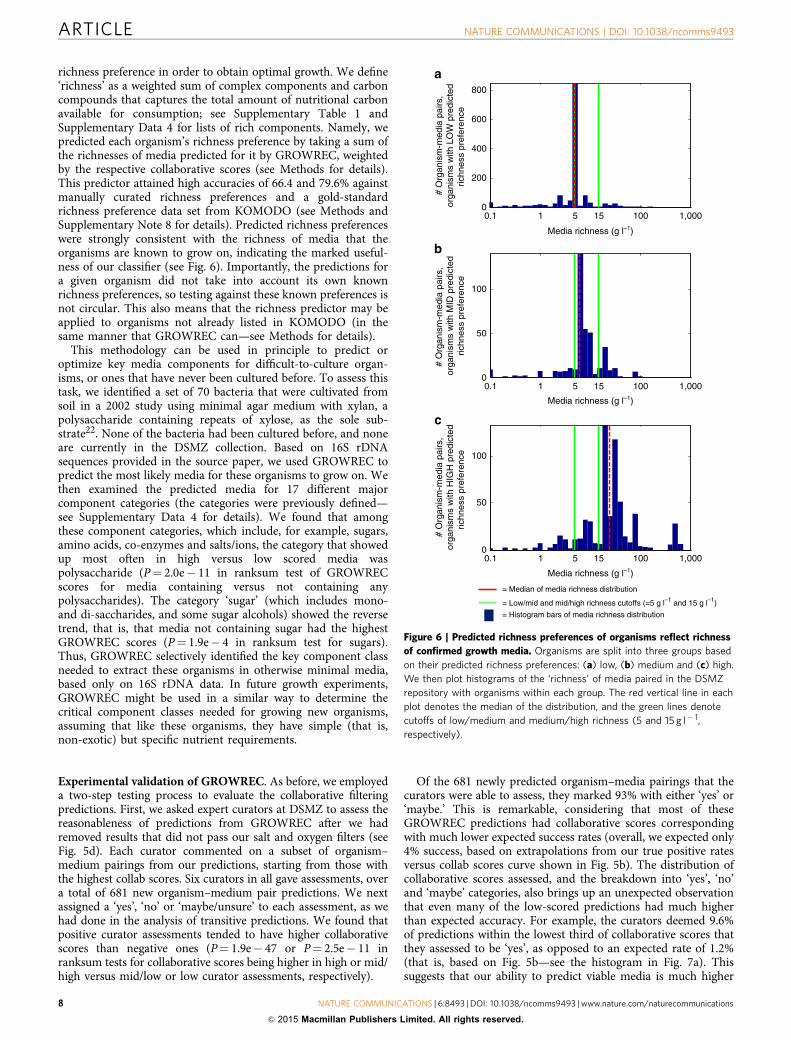
richness preference in order to obtain optimal growth. We define‘richness’ as a weighted sum of complex components and carboncompounds that captures the total amount of nutritional carbonavailable for consumption; see Supplementary Table 1 andSupplementary Data 4 for lists of rich components. Namely, wepredicted each organism’s richness preference by taking a sum ofthe richnesses of media predicted for it by GROWREC, weightedby the respective collaborative scores (see Methods for details).This predictor attained high accuracies of 66.4 and 79.6% againstmanually curated richness preferences and a gold-standardrichness preference data set from KOMODO (see Methods andSupplementary Note 8 for details). Predicted richness preferenceswere strongly consistent with the richness of media that theorganisms are known to grow on, indicating the marked useful-ness of our classifier (see Fig. 6). Importantly, the predictions fora given organism did not take into account its own knownrichness preferences, so testing against these known preferences isnot circular. This also means that the richness predictor may beapplied to organisms not already listed in KOMODO (in thesame manner that GROWREC can—see Methods for details).
This methodology can be used in principle to predict oroptimize key media components for difficult-to-culture organ-isms, or ones that have never been cultured before. To assess thistask, we identified a set of 70 bacteria that were cultivated fromsoil in a 2002 study using minimal agar medium with xylan, apolysaccharide containing repeats of xylose, as the sole sub-strate22. None of the bacteria had been cultured before, and noneare currently in the DSMZ collection. Based on 16S rDNAsequences provided in the source paper, we used GROWREC topredict the most likely media for these organisms to grow on. Wethen examined the predicted media for 17 different majorcomponent categories (the categories were previously defined—see Supplementary Data 4 for details). We found that amongthese component categories, which include, for example, sugars,amino acids, co-enzymes and salts/ions, the category that showedup most often in high versus low scored media waspolysaccharide (P¼ 2.0e� 11 in ranksum test of GROWRECscores for media containing versus not containing anypolysaccharides). The category ‘sugar’ (which includes mono-and di-saccharides, and some sugar alcohols) showed the reversetrend, that is, that media not containing sugar had the highestGROWREC scores (P¼ 1.9e� 4 in ranksum test for sugars).Thus, GROWREC selectively identified the key component classneeded to extract these organisms in otherwise minimal media,based only on 16S rDNA data. In future growth experiments,GROWREC might be used in a similar way to determine thecritical component classes needed for growing new organisms,assuming that like these organisms, they have simple (that is,non-exotic) but specific nutrient requirements.
Experimental validation of GROWREC. As before, we employeda two-step testing process to evaluate the collaborative filteringpredictions. First, we asked expert curators at DSMZ to assess thereasonableness of predictions from GROWREC after we hadremoved results that did not pass our salt and oxygen filters (seeFig. 5d). Each curator commented on a subset of organism–medium pairings from our predictions, starting from those withthe highest collab scores. Six curators in all gave assessments, overa total of 681 new organism–medium pair predictions. We nextassigned a ‘yes’, ‘no’ or ‘maybe/unsure’ to each assessment, as wehad done in the analysis of transitive predictions. We found thatpositive curator assessments tended to have higher collaborativescores than negative ones (P¼ 1.9e� 47 or P¼ 2.5e� 11 inranksum tests for collaborative scores being higher in high or mid/high versus mid/low or low curator assessments, respectively).
Of the 681 newly predicted organism–media pairings that thecurators were able to assess, they marked 93% with either ‘yes’ or‘maybe.’ This is remarkable, considering that most of theseGROWREC predictions had collaborative scores correspondingwith much lower expected success rates (overall, we expected only4% success, based on extrapolations from our true positive ratesversus collab scores curve shown in Fig. 5b). The distribution ofcollaborative scores assessed, and the breakdown into ‘yes’, ‘no’and ‘maybe’ categories, also brings up an unexpected observationthat even many of the low-scored predictions had much higherthan expected accuracy. For example, the curators deemed 9.6%of predictions within the lowest third of collaborative scores thatthey assessed to be ‘yes’, as opposed to an expected rate of 1.2%(that is, based on Fig. 5b—see the histogram in Fig. 7a). Thissuggests that our ability to predict viable media is much higher
Media richness (g l–1)
= Median of media richness distribution
= Low/mid and mid/high richness cutoffs (=5 g l–1 and 15 g l–1)
= Histogram bars of media richness distribution
# O
rgan
ism
-med
ia p
airs
,or
gani
sms
with
LO
W p
redi
cted
richn
ess
pref
eren
ce
Media richness (g l–1)
Media richness (g l–1)
# O
rgan
ism
-med
ia p
airs
, or
gani
sms
with
MID
pre
dict
edric
hnes
s pr
efer
ence
# O
rgan
ism
-med
ia p
airs
,or
gani
sms
with
HIG
H p
redi
cted
richn
ess
pref
eren
ce
0.1 1 5 15 100 1,0000
200
400
600
800
0.1 1 5 15 100 1,0000
50
100
0.1 1 5 15 100 1,0000
50
100
a
b
c
Figure 6 | Predicted richness preferences of organisms reflect richness
of confirmed growth media. Organisms are split into three groups based
on their predicted richness preferences: (a) low, (b) medium and (c) high.
We then plot histograms of the ‘richness’ of media paired in the DSMZ
repository with organisms within each group. The red vertical line in each
plot denotes the median of the distribution, and the green lines denote
cutoffs of low/medium and medium/high richness (5 and 15 g l� 1,
respectively).
ARTICLE NATURE COMMUNICATIONS | DOI: 10.1038/ncomms9493
8 NATURE COMMUNICATIONS | 6:8493 | DOI: 10.1038/ncomms9493 | www.nature.com/naturecommunications
& 2015 Macmillan Publishers Limited. All rights reserved.

than that suggested from our previous analysis of true positivepercentages, and that the successes may also range to much lowerthan expected collaborative scores.
In a second testing step, we chose 61 predicted organism–media pairs to study further. These pairings were taken from thetop range of our predictions (see the histogram in Fig. 7b for therange of collab scores, and see Methods for a detailed explanationof how pairs were selected for testing), and fell into the likely (18)or uncertain (43) curator opinion categories. We were able toverify 26 of these predictions by literature search or in-houseDSMZ data that had not been included in KOMODO. For the 35predictions remaining, we conducted new in vitro growthexperiments, from which we obtained growth in 29 cases (11 ofwhich had been classed by curators as ‘maybe’). Taken in full,90% of these 61 organism–medium pairings either yielded strongor medium growth in new experiments, or were shown inprevious reports to be viable (Fig. 7b). The projected accuracy ofthe assessed predictions based on their collaborative scores (usingthe collab-score-to-TP-ratio mapping from Fig. 5b, as before) is5%, again significantly lower than the 90% accuracy obtained.These results indicate that GROWREC predictions even with
mid-range collaborative scores have much higher than expectedaccuracies.
It was possible that the high percentage of positive growthphenotypes we observed was due to a general ability of organisms,particularly aerobic heterotrophs, to grow on any of the commonlab media. It was important, therefore, to test growth oforganisms on the predicted media as compared with a baselineof poorly predicted media, and to assess the difference. Wetherefore chose a set of 40 ‘good’ organism–medium pairs andalso a set of 40 ‘bad’ organism–medium pairs as predicted byGROWREC (the ‘bad’ pairs were predicted using a permissivephylogeny cutoff—see Methods for details). Importantly, wechose the ‘good’ and ‘bad’ pairings using the same exact set oforganisms and media, but merely swapping them around to formoptimal good or bad combinations. To avoid trivial obstacles togrowth, we did not include any organisms or media that grow inhigh salt or in anaerobic environments. The analysis included 36bacterial strains each belonging to a different Genus (all of whichwere used in the ‘good’ set and 30 of which were used in the ‘bad’set) and 13 media (all of which were used in both the ‘good’ andthe ‘bad’ picks), for 80 growth assays total (actually 76, after
Yes
Maybe
No
29
26
6
201
432
48
Expert curator assessments
Will organism grow on GROWREC-predicted medium?
Growth of organisms on GROWREC-predicted media
New experiments and literature verification
Cou
nt o
f org
anis
m-m
edia
pairs
per
col
lab
scor
e bi
n
Cou
nt o
f org
anis
m-m
edia
pairs
per
col
lab
scor
e bi
n
Collab score (bin centers)
(93% ‘Yes’ or ‘maybe’)
(90% Growth)
Growth (our experiments)
Growth (literature)
No growth (our experiments)
Key: Key:
1e0 1e1 1e2 1e3 1e4+0
10
20
1e0 1e1 1e2 1e3 1e4+0
100
1e0 1e1 1e2 1e3 1e4+0
50
100
1e0 1e1 1e20
10
20
1e0 1e1 1e20
10
1e0 1e1 1e20
5
Collab score (bin centers)
a b
Figure 7 | Curator assessments and experimental validation of GROWREC predictions. (a) Expert curator opinions on the goodness of GROWREC
predictions. (b) Results from our in vitro growth experiments or found in literature verifying top GROWREC predictions. Histograms in a and b represent the
distributions of collab scores for the org-medium pairs assessed, and are coloured the same way as the pie charts. Numbers in the pie charts denote how
many org-medium pairs were tested for growth.
NATURE COMMUNICATIONS | DOI: 10.1038/ncomms9493 ARTICLE
NATURE COMMUNICATIONS | 6:8493 | DOI: 10.1038/ncomms9493 | www.nature.com/naturecommunications 9
& 2015 Macmillan Publishers Limited. All rights reserved.

removing contaminated samples—see Supplementary Data 5 fordetails).
This assay showed a striking difference in the strength ofgrowth between the ‘good’ and ‘bad’ sets ( Fig. 8). The good groupoutgrew the bad group significantly as a whole (P¼ 1.6e� 3 inranksum test based on quantized strength of growth assessments,as per Fig. 8a) and on an organism-specific basis (P¼ 2.5e� 3 inpaired signrank test, as per Fig. 8b). This last finding indicatesstrongly the practical usefulness of GROWREC, as it enabled thechoice of a better medium than a random selection might haveyielded in over half of the organisms tested. It also reinforces thatthe relationship between organisms being close phylogeneticallyand their sharing lab media (that is, that shown in Fig. 3) is notmerely descriptive, but can be used predictively to determine neworganism–media pairs.
DiscussionA large effort among microbiologists for over a century has beenthe development of suitable lab media for growing microorgan-isms. This has led to a broad range of artificial mediumconditions of varying complexities that have been used tocultivate microbial life. Here, we map this culture medialandscape by developing a database to incorporate the specificcompositions of thousands of media, to link organisms withmedia and with the latter’s respective components, and to link allof these elements out to other relevant growth-related featuresand/or databases. The resulting resource enables extensiveintegration of growth media information with existing tools suchas genomic and metagenomic data and large-scale metabolicmodels, to facilitate predictive metabolic research. Such aresource has never before been produced at this scale. We makethis resource publically available in the form of a web server thatpredicts media for bacteria and archaea given an input of 16SrRNA gene sequence, running on a GROWREC engine. We alsoprovide in Supplementary Data 2 a large set of new organism–media predictions from our method, and in Supplementary Note3 and associated Supplementary Figs 4–8, a range of analyses ofhow growth conditions differ among microbial phyla. Taken as a
whole, this work represents a first ever large-scale analysis of theconditions implicit in growth media among the cultivateduniverse, as well as a platform for making new predictions oforganism–media pairings within this space.
We see this work as a first step towards the goal of a morepredictive science of microbial nutrition, in which informationembedded in guides such as Bergey’s Manual of SystematicBacteriology can be mined for their insight and used alongsidelarge and ever-growing repositories of metagenomic data andgenome-scale modelling17,20 to rapidly develop cultivation mediafor any organism. Thus, part of our aim is to uncover principlesfor growing microorganisms that may be universal across life, andthus useful for culturing as-yet uncultivated organisms as well. Tothis end, we reveal that although most strain-specific mediainstructions relate to common salts, it is rarer metal ions andvitamins and cofactors that are the largest differentiators amongdefined growth conditions for strains within a given genus. Thiscomplements recent observations that many previouslyuncultivated microorganisms require specific cofactors or rarecompounds in order to grow, and thus that emphasis on thesetypes of trace nutrients in developing new media is warranted1,19.Importantly, the common approach of providing a standard traceelements mixture may not work for difficult to grow species, anda more nuanced or combinatorial approach might be necessary.For example, media for most strains of the nitrogen-fixing genusAzotobacter contain B20mM molybdenum (which is used by thenitrogenase enzyme in these species), which is two orders ofmagnitude higher than the concentration in most molybdenum-containing media. The emerging importance of trace elementsalso raises the question of what other kinds of trace compoundsmight be important for developing culture media. Recentevidence shows that growth factors such as quorum sensingmolecules and siderophores provided in bacterial co-cultures canenable growth of otherwise unculturable organisms23. These areimportant nutrients to explore in future culturing efforts.
We do not go so far as to cultivate uncultivated species in thisstudy. However, we do show proof-of-principle that ourGROWREC-based predictions can aid efforts to culture neworganisms through two analyses: (i) by predicting media richness
––
+
++
+++
Organism–medium prediction group from collaborative filtering
P= 1.6e–3
+ ++ +++
+
++
+++
Ave
rage
gro
wth
of s
peci
eson
“go
od”
med
ia
Average growth of species on ‘bad’ media
Species grows better on ‘good’ mediaNo differenceSpecies grows better on ‘bad’ media
Str
engt
h of
gro
wth
‘Bad’ ‘Good’
––––
a b
Figure 8 | Growth of organisms on ‘good’ versus ‘bad’ media as predicted by GROWREC: A set of 40 ‘good’ and 40 ‘bad’ organism–media pairings were
chosen by GROWREC, using the same 36 species and 13 media for both sets (but swapping which organisms paired with which media; 4 pairs were
removed because of contamination). All organisms are aerobic heterotrophs with low salt requirements. (a) ‘Good’ organism–media pairs showed
significantly better growth than ‘bad’ pairs (P¼ 1.6e� 3 in ranksum test). (b) Growth was also better on ‘good’ versus ‘bad’ media on an organism-by-
organism basis (P¼ 2.5e� 3 in paired signrank test for each organism growing better on its ‘good’ versus its ‘bad’ media). Each circle in the plot represents
a single organism, with its average growth on ‘good’ media on the y axis, and its average growth on ‘bad’ media on the x axis (dots are jittered for visibility).
Organisms are coloured based on whether they grow better on their ‘good’ versus their ‘bad’ media (see legend).
ARTICLE NATURE COMMUNICATIONS | DOI: 10.1038/ncomms9493
10 NATURE COMMUNICATIONS | 6:8493 | DOI: 10.1038/ncomms9493 | www.nature.com/naturecommunications
& 2015 Macmillan Publishers Limited. All rights reserved.

preferences of bacterial strains with high accuracy (Fig. 6) and(ii) by correctly predicting that xylan-consuming bacteria requirepolysaccharide nutrient sources, based solely on their 16S rDNA.Notably, using GROWREC in the manner we did for theseanalyses enables prediction of specific nutrients (here, mediarichness and polysaccharides), which can be done in principle forany nutrient deemed important, and for any organism regardlessof whether it has previously been cultured. These analyses thuslay groundwork for future extensions that aim to design newmedia for as-yet-uncultured organisms, using observed andconsistent principles that have been derived from the tree ofcultivated life.
A major limitation of the work presented here is its reliance ona highly under-sampled organism-by-media growth matrix bywhich to train our predictors and derive insights. Namely, noorganisms are listed as not growing on a given medium, andmany organism–media pairings that could support growth are notlisted in the DSMZ repositories (upon which KOMODO is based).This reflects the fact that researchers are usually interested infinding one or two good media for growing a particular strain,rather than in building consistent databases that can be minedfor universal insights into microbial metabolism. The degree ofaccuracy we achieve in our new organism–media predictionsdespite these limitations attests to the enormous and largelyyet-untapped potential of these approaches. Future work shouldfocus on better populating subsets of the organism–mediamatrix deemed most critical for uncovering key growth principles,which can be done by performing many new growth experimentswhere a large set of organisms is tested on a large set of mediain an all-grown-on-all fashion. The extent of such work willstrongly dictate the depth of insight that can be derived and thenaimed towards ‘unculturables’. In addition, many of the mediathat are in common use contain complex ingredients (for example,beef extract or peptone). In developing GROWREC, suchundefined media are an asset, as they greatly expand our trainingset for making predictions. However, improvements shouldalso focus on determining defined replacements for complexcomponents, as these components obscure the signal of whichnutrients are truly important for growing organisms in differentphylogenetic groups.
MethodsBuilding KOMODO, the known media database. Overview. A large collection ofmedia recipes for microbial strains is available through the German LeibnizInstitute DSMZ strain and media collection (accessible here: https://www.dsmz.de/?id=441). These recipes are publicly available, but they are contained as instruc-tions in PDF files that must be searched on an organism-by-organism basis. Puttingthese recipes into a usable database form required extensive and non-trivial workparsing, merging and organizing, as well as handling cross-references betweenmedia and submedia compound mixtures such as ‘trace element solutions,’ whichcould be detailed and referenced from any DSMZ medium.
Dealing with such cross-references involves handling multiplication of volumes,masses and concentrations, even in cases when the same media component isincluded both in a submedium mixture and in the main medium description, oftenwith non-matching names and/or units (for example, once in gram per litre andonce in moles per litre). Medium and submedium volumes also are often not listedin media, but are assumed by microbiologists to be 1 l per the number of grams (ormoles, or millilitres) of compounds listed for inclusion. However, there is nogeneral rule for this, as some media do list specific volumes, some of which do notsum up to 1 l. Often, the volumes are left to be deciphered through common sense.
We tackled these challenges with a pipeline that is part manual and partautomated. We used this pipeline to read in more than 1,500 PDF mediadescriptions and to create the KOMODO database, containing media compositionswith standardized units. The pipeline is depicted as a 15-step process inSupplementary Fig. 1. Each step is explained in detail below:
Steps 1–3: Manual standardization of media descriptions. First, PDFs of all themedia in the DSMZ database were copied verbatim into a text file. Next, theresulting B27,000 lines of text were manually reformatted in a way that could bemachine read, using tags such as /ph/ (set the pH tag of the medium), /replace/(replace one compound with another), /conc/ (change the concentration of acompound) and /rm/ (remove a compound from the medium) to denote media
features and instructions. These tags were embedded in a specialized syntax thatwas similar to natural language media instructions, and thus required minimalalterations from the instructions listed in the original PDFs, but that followed adefined syntactical structure that could be interpreted by a computer programme.We were able to extract and reformat the majority of media from the DSMZdatabase in this way.
We noticed that a large number of organisms had specialized growthinstructions listed either within the media descriptions or in the organism–mediummapping file provided to us by DSMZ. We considered these instructions critical tobuilding an accurate database. To incorporate them, we copied the components ofthe base media and then implemented the stated changes to create mediumdefinitions for each media variant. In all, this process resulted in nearly a doublingof the number of media in the database, from 1,946 to 3,672. In the DSMZ listing(http://www.dsmz.de/?id=441), each medium is referenced by an ID number. Wegenerated unique new media IDs for these media variants by following the basemedia IDs with a period (.) or an underscore (_), and then a unique numerical ortext string.
In addition, many media included in their compositions submedia, which wereto be mixed independently and then combined. To ease the formation of thedatabase, we treated each submedium as an independent medium with a newmedium ID of 2,000 or above. This then allowed us to calculate cross-referencesbetween media and submedia using a standardized methodology.
Steps 4–5: Manual standardization of compound names. Media components aslisted in the literature are highly redundant and degenerate. For example, thecompound sodium sulfide is listed in the database in at least nine different ways(sodium sulfide, sodium sulphide, Na2S� 9 H2O, Na2S� 9H2O and so on). Toconvert the database to the most versatile form, we manually mapped compoundnames to ‘semi-unique names’ as an intermediate layer, and then finally to ‘uniquenames’ that contained only the precise metabolites contributed to a medium by ametabolite. For example, the ‘semi-unique’ name mapped to all original forms ofsodium sulfide (including hydrated forms) from media descriptions is ‘sodium sulfide’,and the ‘unique name’ is ‘SEED-cpd00239#cpd00971#,’ which precisely depicts thetwo SEED compounds (cpd00239¼ sulfide ion and cpd00971¼ sodium ion).
We defined three classes of unique names:
(1) SEED compounds, which are denoted with a ‘SEED-’ tag and then up to threeSEED metabolites contained within them (for example, ‘SEED-cpd00239#cpd00971#’).
(2) Complex components, which are denoted with a ‘rich-’ tag (for example, ‘rich-peptone’). (Note, this ‘richness’ is not to be confused with media richness;rather, it denotes complexity (media richness is treated differently in the work).In the main text, complex components are presented with a complex- taginstead of a rich- tag. The two are interchangeable, and both denotecomplexity, not media richness.)
(3) Other compounds, which are chemically defined but are not in SEED. Theseare simply written out in full (for example, ‘1,4-Naphthaquinone’).
Steps 6–7: Determining media volumes and unit multipliers. A rule of thumb inmicrobiology media recipes is that the quantities of compounds listed are thoseneeded to produce 1 l of final medium. Because of this, media volumes are oftenomitted (and assumed to be 1 l) or are explicitly accounted for by mixing of mediacompounds with 1 l of water. However, there are many exceptions to this rule, suchas media or submedia compositions that include some volume of water that is not1 l or that contain very small volumes of liquid (from, for example, addition ofsome volume of ethanol), which should not be considered the ‘final volume’ of themedium by any means. It was critical to determine the exact volume of media inorder to properly convert compound units into concentrations (see Steps 9–11 fordetails).
To deal with this, we classed media and submedia into categories called ‘fill’ and‘scale.’ The ‘fill’ tag means that whatever volume a medium has should be ‘filled’ to1 l, that is, that the volume listed should simply be ignored; the ‘scale’ tag meansthat the concentrations of compounds listed in a medium description should bescaled up with the listed volume until that volume comes out to 1 liter. Media wereclassed as ‘fill’ and ‘scale’ using general rules, which were overridden in ambiguouscases by manual curation (filling and scaling pseudocode is listed below). Finally,we adjusted final volumes of ‘fill’ media and then determined a multiplier for each‘scale’ medium and submedium composition in order to convert compound unitsfrom moles to moles per litre (see Steps 9–11 for details).
Step 8: Unpacking cross-media references. Large proportions of DSMZ mediacontain cross-references either to other media or to complex submedia (B60% and425%, respectively). Many of these references also contain references, sosometimes multiple layers of references must be unpacked in order to build a givenmedium. Faithfully unpacking these cross-references requires (i) determining themolar concentrations of all compounds in the cross-referenced submedium/medium, (ii) determining the volume of the submedium/medium per litre of finalmedium, (iii) multiplying these two factors correctly to get the concentration ofeach submedium compound and (iv) accounting for the volume of the cross-referenced submedium/medium in determining the final medium volumes. Thisprocess was fully automated.
Steps 9–11: Converting concentrations into moles per litre. A goal of this projectwas to include every compound if possible with standardized units, as this would
NATURE COMMUNICATIONS | DOI: 10.1038/ncomms9493 ARTICLE
NATURE COMMUNICATIONS | 6:8493 | DOI: 10.1038/ncomms9493 | www.nature.com/naturecommunications 11
& 2015 Macmillan Publishers Limited. All rights reserved.

ease analyses between media and between compounds. Compounds in the originalmedia files were listed with over 30 distinct units. As a first step, we built amapping with multipliers to convert all of these units into five standard ones: gramper liter, liter per liter, moles per liter, trace and ‘gas substrate’.
The next step was to convert all of these units (except for the ‘trace’ and ‘gassubstrate’ ones, which were treated separately) into Moles. To do this, we needed toobtain the molecular weights of all defined media components, as well as the molarratios of each component forming each semi-unique compound name. Whenavailable, molecular weights of SEED compounds were taken from the SEEDdatabase. For SEED compounds without molecular weights listed, as well as forcompounds falling into the ‘Other’ category (that is, defined but not listed inSEED), we curated molecular weights manually based on Internet searches. Finally,we manually curated molar ratios of compounds in the original compound names,as well as the number of waters linked to each compound. With all of thisinformation, we were able to calculate from, for example, the compound name‘CoCl2� 6 H2O,’ the exact molar amounts of cobalt and chloride in a final mediumcomposition, even if the original compound was listed in grams and not moles.
For the subset of compounds listed with units of volume rather than grams ormoles, we universally assumed that the densities of the fluids were equal to thedensity of water (1 g ml� 1), in order to ease the conversion of units. This rule wasnot used for volumes of submedia or media, but only for units of individualcompounds.
Finally, we needed to convert the units for each compound from a molaramount (moles, M) into a molar concentration (moles per litre). This was done bymultiplying the molar amount of each compound by the medium volumemultipliers as determined in steps 6–7.
Steps 12–14: Validating steps 6–11 versus gold standards. Many complicatedbookkeeping calculations are automated in steps 6–11 of this workflow, and thereare many potential sources for mistakes or errors. Therefore, it was important tovalidate several key results as a sanity check in order to ensure that the databasewas faithfully converted. To do this, we manually produced three ‘gold-standard’files for validation:
i Manually calculated media volumes for 149 media and ‘fill’ or ‘scale’ statusesfor 138 media, to check against the results of step 6.
ii Manually calculated quantities (including units) of 973 compoundsreferenced across media, to validate the results of steps 7–9.
iii Manually calculated molar concentrations of 965 SEED compounds inmedia, to validate the results of steps 10–11.
These files were used for extensive troubleshooting and debugging of theconversion code and of the syntax in the files for conversion, until there were nomismatches left between the manual files and the automated results.
Step 15: Integrating media information into KOMODO. The work in steps 1–14ultimately produces a high confidence matrix of media versus the concentrations ofcompounds within them. This information was next integrated into a databaseformat, along with the information provided by DSMZ of which organisms growon which media, and linkages of DSMZ organism IDs to NCBI IDs and SEEDorganism IDs, when available.
Pseudocode for automated portion of database build. Here we providepseudocode for steps 6–11 of the database building process, which are theautomated portions for reading in the initial database information:
(1) Determine volumes of each of the media.
a All submedia are considered to have volumes. Therefore, convert ones withunits of mass into units of volume with the 1 ml¼ 1 g conversion (eventhough it is not always precise).
b For metabolites added with parentheses, add the volume if it exists in one ofthe parentheses. For example: in /notag/ NaCl @ (100 ml)*(5 g l� 1), thevolume added is 100 ml.
(2) Adjust volumes based on the following formula:
a All rules about to be written are overridden by the tags put on specific media/submedia for determining the fill or scale status. The tags are: ‘fill’ and ‘scale’.‘Fill’ means that the medium should have volume added to it so that the finalvolume is 1 l, but without altering the amounts of compounds in themedium. ‘Scale’ means that concentrations in the medium should scale upalong with the volume of the medium, until the volume is 1 l. For example:
i Fill: if there is 1 g HCl in 700 ml medium, and the tag is ‘fill’, then the finalvolume is 1 l and the final concentration of HCl is 1 g l� 1.
ii Scale: if there is 1 g HCl in 700 ml medium, and the tag is ‘scale’, then thefinal volume is 1 l and the final concentration of HCl is (1 g per0.7 l)¼ 1.43 g l� 1.
b If a medium or submedium has a volume of 0, adjust the volume to 1 l (thatis, the rule is ‘fill’).
c If a medium or submedium has a volume of 1 l, keep as it is.
d If a medium has a volume above 1 l, the rule is ‘scale’.e All submedia with non-zero volumes should be ‘scaled’.
(3) Determine the amount of each compound in each medium. For this,parenthesis are multiplied out (for example, (100 ml)*(5 g l� 1) - 0.5 g l� 1),with the general principle that all compounds are in units of mass or moles(that is, gram per litre or moles per litre). A compound that has a volumeshould be converted to grams using the formula: 1 ml¼ 1 g (even though this isnot strictly accurate, it is a reasonable approximation for most compounds weare dealing with). Also, submedia are treated like more embedded parentheses.For example, if medium a contains 10 ml of medium b, medium b contains15 ml medium c and medium c contains 5 ml of metabolite X, thenmedium a contains (10 ml l� 1)*(15 ml l� 1)*(5 ml metabolite X)*(1 g ml� 1
conversion)¼ 0.00075 g metabolite X. Percentages are converted as shown inthe conversion sheet.
(4) For all SEED compounds, convert grams into moles. For this calculation, watermolecules that are attached to the compound molecules should be accountedfor. Water molecules that should be accounted for are always in the form‘metabolite�N H2O’. For example, the metabolite: /notag/ CaCl2� 2 H2O @10 mg would be converted as such:
a Molecular weight of CaCl2 is 110.b Molecular weight of H2O is 18.c So 10 mg of CaCl2� 2 H2O¼ (10 mg)/((110þ 2*18) mg per mmol)¼ 0.0684
mmol of CaCl2.
Coupling with SEED. An ultimate goal of this work is to combine the knowledgeembedded in manually built media with modern sequencing and genomicsdatabases, in a form that may be used for large-scale metabolic analysis. A naturalchoice for this linkage is the Model SEED, a project that utilizes the RAST genomeannotation server to automatically build and store genome-scale metabolicmodels16,24. To this end, we converted all compounds that had SEED equivalentsinto SEED compound names and IDs, with each ingredient listed in a mediumconverted into between one and three SEED compounds (see example in Fig. 1).The quantities of these SEED compounds (as well as compounds without SEEDequivalents) were then combined in final media compositions and converted tomolar units.
Future work on KOMODO. Future work that can be done to improveKOMODO is described in Supplementary Note 1.
Choosing organism–media pairs for experiments. We describe three sets of newin vitro experiments in this study: (i) validating transitive predictions; (ii) validatingcollaborative filtering predictions and (iii) determining whether highly rankedcollaborative filtering predictions grow better than low-ranked predictions. As wehad many predicted organism–media pairs to choose from for running each set ofexperiments, we chose pairs to test based on the following criteria:
Experiments 1 and 2: Transitive and collaborative filtering. For theseexperiments we chose organism–media pairs that were: (i) the highest ranked basedon our predictions (hence ‘top’); (ii) convenient for our collaborators at the DSMZto test (mainly, which involved media that are not difficult to produce and strainsthat are both under the care of the curators involved in the study and that are notknown to be extremely difficult to grow) and (iii) contained some organism–mediapairs that the curators deemed likely to grow, and some that they were unsure ornegative about. Transitive pairs we validated were also chosen based on curatorpreferences for working with certain organisms and media.
As just mentioned, we tried to choose an assortment of pairings that curatorshad guessed would yield growth, and also of pairings that curators gave a ‘maybe’,‘no’ or did not have an idea about. Of transitive predictions tested, 24 werepredicted beforehand by the curators to yield growth and 19 were eitherindeterminate or were predicted to not yield growth. Of collaborative filteringpredictions tested (in the original experiments), 38 were predicted beforehand bythe curators to yield growth and 23 were indeterminate or no.
Experiment 3: Good versus bad predictions. For this experiment, we choseorganism–medium pairings by optimizing for four factors (with decreasing levelsof strictness): (i) using only a set of organisms and media that our experimentalcollaborators at the DSMZ told us they preferred to work with; (ii) maximizing theGROWREC scores of the ‘good’ group as selected from within these organisms andmedia; (iii) minimizing the GROWREC scores of the ‘bad’ group and (iv)maximizing the number of organisms from the ‘good’ group that were also used inthe ‘bad’ group. All media were used in both, but it was not possible to designexperiments where every organism would be included in both the ‘good’ and the‘bad’ group while still maintaining a large difference in the collab scores, given theset of organisms and media we could work with; hence, we maximized the numberof organisms shared between the groups given the other constraints. No organismswere included in the ‘bad’ group that were not included in the ‘good’ group, but afew were in the ‘good’ group and not the ‘bad’. The collaborative filtering scores forthe ‘bad’ group were determined after relaxing the phylogenetic distance cutoffbuilt into the GROWREC predictor, thus enabling it to be highly permissive and to
ARTICLE NATURE COMMUNICATIONS | DOI: 10.1038/ncomms9493
12 NATURE COMMUNICATIONS | 6:8493 | DOI: 10.1038/ncomms9493 | www.nature.com/naturecommunications
& 2015 Macmillan Publishers Limited. All rights reserved.

determine scores for phylogenetically distant organisms. These scores were ingeneral very low; we selected the lowest for the ‘bad’ group, as just described.
Calculating partial media matches. To compare phylogenetic or ecologicalsimilarity to partial matches between the known lab media that two organisms cangrow on, we considered the (i) union or (ii) best matching of media each organismgrows on in KOMODO. Within each ecological/phylogenetic distance bin, we tookthe fraction of organism pairs whose media were similar above some (iii) Jaccardthreshold or (iv) count of components. All combinations of these four methodswere tried (see Supplementary Fig. 13a–d for details). For analyses of the counts, itwas important to examine thresholds that were lower than the number of com-ponents in any of the examined media (otherwise, even two organisms that exactlyshare a lab medium would not be considered to ‘match’). Therefore, for thisanalysis, we examined only media of 15 or more components, and we only con-sidered thresholds up to 15 (see Supplementary Fig. 13b,d for details).
Determining ecological or phylogenetic similarity. Ecological similarity betweenpairs of organisms was determined using a Jaccard metric of co-growth in theGreengenes database; that is, the number of environments that both organismsgrow in, divided by the total number of environments that either organism growsin (this was done in the same manner as in ref. 17). Phylogenetic similarity wasdetermined as (1� normalized phylogenetic distance), where phylogenetic distanceis the number of organisms from the NCBI taxonomic tree beneath the lowestcommon ancestor of two organisms (that is, subtree distance) divided by the totalnumber organisms in the tree. Pairs of organisms were then binned by ecological(or phylogenetic) distances, and the fraction of pairs in each bin sharing a labmedium according to KOMODO was used as the final ‘medium distance’ for thatecological distance bin (results plotted and Spearman correlations given in Fig. 3).
Testing transitivity of organism-media pairings. First, we excluded media thathave o3 or 4100 organisms listed as growing on them. We define an XY|m eventas organisms X and Y each being listed in the KOMODO database for medium m.We then identified 1,000 cases in which AB|m1, BC|m2 and C|m3, enforcing thatmedia m1, m2 and m3 are different and that organisms A, B and C are different.Given the relations stated above, for each of the 1,000 cases we checked the numberof instances of CA|m3 (test case) versus the number of instances of CX|m3 (randomcontrol), where X was a randomly chosen organism from the database. Test casesthat were positive were counted as true transitive events and random control caseswere considered to be an estimate of noise.
Building GROWREC. To predict new potentially viable organism–media pairings,we developed a collaborative filtering predictor as follows: first, phylogenetic orecological distances between pairs of organisms are determined. Phylogeneticdistance is determined by the count of organisms beneath the lowest commonancestor in the ITOL taxonomic tree (subtree elements count), and ecologicaldistance is determined via a Jaccard metric of co-growth across environments listedin Greengenes25, as clustered previously by Chaffron26. Unless otherwise specified,we used phylogenetic distance for analyses.
To determine a collaborative score for the likelihood of a ‘test’ organismgrowing on a given medium, we count how many organisms phylogeneticallyrelated to the test organism can grow on it. We chose a distance cutoff and aweighting based on phylogenetic distance (cutoff was set at a normalizedphylogenetic subtree distance of 0.04; weighting of the collaborative score wastaken as cutoff/subtree distance; see Supplementary Note 6). The threshold forecological distance was a Jaccard distance of 0.15, with no distance weighting.These cutoffs were chosen to bolster precision, using an analysis similar to thoseshown in Supplementary Figs 10 and 11.
Collaborative filtering predictions were validated using a leave-one-out method,in which media predictions made for organisms present in KOMODO werecompared against true pairings of those organisms with lab media from thedatabase. To predict media for a given organism, the organism was left out fromthe database, and its phylogenetic relationships to other organisms in the databasewere used as input to the collaborative filtering predictor.
As a validation of the collaborative filtering predictor, we developed another‘null’ predictor that is based solely on media and organism popularity in thedatabase. This predictor pairs organisms with media randomly, with distributionsof both organisms and media weighted by their commonality in known pairings inthe DSMZ database. When predicting results to compare against the collaborativefiltering predictor (which are the results presented in the present paper), we onlyconsidered organisms that are present in the phylogenetic data set.
Improving GROWREC with O2 and salt filters. Filtering of collaborative filteringresults based on biological features proceeded in two steps:
i We determined the preference of an organism for that feature by looking atinstances in the known DSMZ organism–media database of the organismbeing paired with media containing that feature. If, for example, an organismalways grows on a medium containing O2, then we label the organism as
‘aerobic’; if an organism always grows on an anaerobic medium, we label theorganism as ‘anaerobic’; if it sometimes grows with and sometimes withoutO2, we label it ‘facultative’. For salt tolerance, a ‘salty’ medium was one withZ15 g NaCl per l, or containing the word ‘sea’.
ii Collaborative filtering results were then filtered based on mismatchesbetween the preference of the organism and the contents of the predictedmedium. For example, an ‘anaerobic’ organism growing on an ‘aerobic’medium would be excluded by the filter, as would an ‘aerobic’ organismgrowing on an ‘anaerobic’ medium.
Determining rich medium preferences. Media containing any complex com-ponent (that is, 1 of the 11 categories shown in Fig. 1) were broken into ‘low’,‘medium’ and ‘high’ richness groups based on a weighted sum of complex com-ponents present in the medium, using the weights in Supplementary Table 1.Cutoffs for the three richness groups were 5 g per l and 15 g per l of ‘rich’ com-ponent (as determined through the weighted sum). The amounts of certain definedcomponents were also included in the richness determination—these componentsare listed in Supplementary Data 1.
To determine the category that an organism falls into, we summed thecollaborative scores of all low, medium and high richness media that the organismwas predicted to grow on via GROWREC, after filtering results for oxygen and salt(that is, eliminating pairing of a high-salt medium with a low-salt organism and soon). The category with the highest combined score is the category chosen as the‘preference’ of the organism.
Predicted organism richness preferences were compared with manually curatedpreferences (from DSMZ curators) as well as a ‘gold-standard’ set of richnesspreferences from KOMODO. These are known organism–medium pairings wherethe organism is only found growing on media within a given (predicted) richnesscategory—low, medium or high. If an organism, for example, is known to growonly on two ‘low’ richness media, then the gold-standard richness preference forthat organism is ‘low’. The results of these comparisons are described in detail inSupplementary Data 3.
Integrating GROWREC into an online platform. The GROWREC engine wasused to produce an online tool that predicts media from the DSMZ repository mostlikely to enable growth of any organism. Users can input organisms in the form of a16S rDNA sequence or an NCBI taxon ID. If a DNA sequence is inputted, thealgorithm will use BLAST to determine related organisms, and then will performcollaborative filtering (in the manner of GROWREC) to predict viable media.Predicted media are given with their collab scores, which denote the strength of theprediction. The tool can be found at: http://delta-tomcat-vm.cs.tau.ac.il:40678/komodo/default.htm.
Experimental methods. To test a given organism–medium pair, strains werereactivated from freeze-dried ampoules as recommended in the DSMZ catalogue(http://www.dsmz.de/catalogues/catalogue-microorganisms.html) and incubatedon the medium used as standard for this organism. After incubation at the tem-perature recommended for the specific strains by the DSMZ, colony counts andsize were evaluated and subcultures were prepared in the predicted medium.Growth was documented after 24 and 48 h of incubation. Strong and mediumgrowth were both considered positive growth phenotypes.
The strains used for experiments, and all of the results, are listed in thefollowing documents:
Supplementary Data 5—Transitive experiments.Supplementary Data 6—First set of collaborative filtering experiments.Supplementary Data 7—Good–bad collaborative filtering experiments.
References1. Ling, L. L. et al. A new antibiotic kills pathogens without detectable resistance.
Nature 527, 455–459 (2015).2. Richardson, G. M. The nutrition of Staphylococcus aureus. Necessity for uracil
in anaerobic growth. Biochem. J. 30, 2184–2190 (1936).3. Warren, W. J. & Miller, R. D. Growth of Legionnaires disease bacterium
(Legionella pneumophila) in chemically defined medium. J. Clin. Microbiol. 10,50–55 (1979).
4. Letort, C. & Juillard, V. Development of a minimal chemically-defined mediumfor the exponential growth of Streptococcus thermophilus. J. Appl. Microbiol. 91,1023–1029 (2001).
5. Kim, K. W. & Lee, S. B. Growth of the hyperthermophilic marine archaeonAeropyrum pernix in a defined medium. J. Biosci. Bioeng. 95, 618–622 (2003).
6. Kim, Y. J. et al. Development of a chemically defined minimal medium for theexponential growth of Leuconostoc mesenteroides ATCC8293. J. Microbiol.Biotechnol. 22, 1518–1522 (2012).
7. Vartoukian, S. R., Palmer, R. M. & Wade, W. G. Strategies for culture of’unculturable’ bacteria. FEMS Microbiol. Lett. 309, 1–7 (2010).
8. Parte, A. Bergey’s Manual of Systematic Bacteriology (Springer, 2012).9. Baart, G. J. et al. Modeling Neisseria meningitidis metabolism: from genome to
metabolic fluxes. Genome Biol. 8, R136 (2007).
NATURE COMMUNICATIONS | DOI: 10.1038/ncomms9493 ARTICLE
NATURE COMMUNICATIONS | 6:8493 | DOI: 10.1038/ncomms9493 | www.nature.com/naturecommunications 13
& 2015 Macmillan Publishers Limited. All rights reserved.

10. Carini, P., Steindler, L., Beszteri, S. & Giovannoni, S. J. Nutrient requirementsfor growth of the extreme oligotroph ’Candidatus Pelagibacter ubique’HTCC1062 on a defined medium. ISME J 7, 592–602 (2013).
11. Omsland, A. et al. Host cell-free growth of the Q fever bacterium Coxiellaburnetii. Proc. Natl Acad. Sci. USA 106, 4430–4434 (2009).
12. Oberhardt, M. A., Palsson, B. O. & Papin, J. A. Applications of genome-scalemetabolic reconstructions. Mol. Syst. Biol. 5, 320 (2009).
13. McCloskey, D., Palsson, B. O. & Feist, A. M. Basic and applied uses of genome-scale metabolic network reconstructions of Escherichia coli. Mol. Syst. Biol. 9,661 (2013).
14. Karp, P. D. et al. Pathway Tools version 13.0: integrated software for pathway/genome informatics and systems biology. Brief Bioinform. 11, 40–79 (2010).
15. Richards, M. A. et al. MediaDB: a database of microbial growth conditions indefined media. PLoS ONE 9, e103548 (2014).
16. Henry, C. S. et al. Connecting genotype to phenotype in the era of high-throughput sequencing. Biochim. Biophys. Acta 1810, 967–977 (2011).
17. Zarecki, R., Oberhardt, M. A., Reshef, L., Gophna, U. & Ruppin, E. A novelnutritional predictor links microbial fastidiousness with lowered ubiquity,growth rate, and cooperativeness. PLoS Comput. Biol. 10, e1003726 (2014).
18. Jones, B. E., Grant, W. D., Duckworth, A. W. & Owenson, G. G. Microbialdiversity of soda lakes. Extremophiles 2, 191–200 (1998).
19. Pol, A. et al. Rare earth metals are essential for methanotrophic life in volcanicmudpots. Environ. Microbiol. 16, 255–264 (2014).
20. Freilich, S. et al. Competitive and cooperative metabolic interactions in bacterialcommunities. Nat Commun 2, 589 (2011).
21. Letunic, I. & Bork, P. Interactive Tree Of Life v2: online annotation and displayof phylogenetic trees made easy. Nucleic Acids Res. 39, W475–W478 (2011).
22. Sait, M., Hugenholtz, P. & Janssen, P. H. Cultivation of globally distributed soilbacteria from phylogenetic lineages previously only detected in cultivation-independent surveys. Environ. Microbiol. 4, 654–666 (2002).
23. Stewart, E. J. Growing unculturable bacteria. J. Bacteriol. 194, 4151–4160(2012).
24. Henry, C. S. et al. High-throughput generation, optimization and analysis ofgenome-scale metabolic models. Nature Biotechnol. 28, 977–982 (2010).
25. DeSantis, T. Z. et al. Greengenes, a chimera-checked 16S rRNA gene databaseand workbench compatible with ARB. Appl. Environ. Microbiol. 72, 5069–5072(2006).
26. Chaffron, S., Rehrauer, H., Pernthaler, J. & von Mering, C. A global network ofcoexisting microbes from environmental and whole-genome sequence data.Genome Res. 20, 947–959 (2010).
AcknowledgementsWe thank the curators of the collection of microorganisms at the Leibniz Institute DSMZfor their extensive help and cooperation. M.A.O. acknowledges funding from theWhitaker Foundation (Whitaker International Scholars Program) and the Dan DavidFellowship; E.R. gratefully acknowledges support from the EU FP7 INFECT project,the I-CORE Program of the Planning and Budgeting Committee, the Israel ScienceFoundation (grant No 41/11) and CONTIBUGS EU bacterial research grants. U.G. issupported by the National Center for Evolutionary Synthesis (NESCent) and the German-Israeli Project Cooperation (DIP). Komodo photo in Fig. 1 taken from whl.travel undercreative common license: https://creativecommons.org/licenses/by-nc-sa/2.0/.
Author contributionsM.A.O. wrote and edited the manuscript, performed analyses, conceived and developedmethods. R.Z. contributed to the manuscript, performed analyses, conceived anddeveloped methods. S.G. performed growth experiments, provided expert curations. E.L.performed growth experiments, provided expert curations. H.P.K. performed growthexperiments and provided expert curations. U.G. contributed to manuscript and guidedmethod development. E.R. wrote and contributed to the manuscript, conceived andguided the method development.
Additional informationSupplementary Information accompanies this paper at http://www.nature.com/naturecommunications
Competing financial interests: The authors declare no competing financial interests.
Reprints and permission information is available online at http://npg.nature.com/reprintsandpermissions/
How to cite this article: Oberhardt, M. A. et al. Harnessing the landscape of microbialculture media to predict new organism–media pairings. Nat. Commun. 6:8493doi: 10.1038/ncomms9493 (2015).
This work is licensed under a Creative Commons Attribution 4.0International License. The images or other third party material in this
article are included in the article’s Creative Commons license, unless indicated otherwisein the credit line; if the material is not included under the Creative Commons license,users will need to obtain permission from the license holder to reproduce the material.To view a copy of this license, visit http://creativecommons.org/licenses/by/4.0/
ARTICLE NATURE COMMUNICATIONS | DOI: 10.1038/ncomms9493
14 NATURE COMMUNICATIONS | 6:8493 | DOI: 10.1038/ncomms9493 | www.nature.com/naturecommunications
& 2015 Macmillan Publishers Limited. All rights reserved.