harnessing the power of genomics for infectious diseases
TRANSCRIPT

Harnessing the Power of Genomics for Infectious Diseases Diagnostics,
Prognostics, Epidemiology, and Novel Virus Discovery
Christopher W. Wong, Ph.D.CSO, Genome Institute of Singapore
Founder, PathGEN Dx Pte [email protected]

Genome Institute of Singapore
March 2001: 5 membersMarch 2003 135 membersMarch 2008: 254 membersMarch 2011: 265 members
28 Principle Investigators (“PI’s”)12 Research Scientists72 Post-docs57 Ph.D. students
Located at the BiopolisFunded by A*STAR (govt)

Genomics in BioMedicine
Strategy: Innovation Core Clinical Derivatives
Why some people get serious effects of
infectious diseases?
Diagnostics for tracking pandemics
Predictive Diagnostics: Who will get ill?
New Therapeutics: Link between infection and
macular degeneration
Control of stem cell functions
New applications for bioengineering devices
New “tailored” cellular products for
pharmaceutical screening
Biology and Genomics of
Cancer
Predictive Biomarkers, Cancer Risk
Predictive Biomarkers, Cancer Treatment
New Cancer Treatments

Translational Technologies
• Aim is to enable people to benefit from our research discoveries, within a shorter timeframe.
• Collaboration with biotech companies, pharmaceuticals, hospitals, investors to validate and harden appropriate technologies
• Active technology transfer or commercialization.
Selected Projects• SARS Diagnostic Kit
(Roche)• H1N1(2009)
Biosurveillance Kit (Roche Nimblegen & AIT Biotech)
• Pathogen Diagnostics Kit (PathGEN Pte. Ltd.)
• Dengue hospitalization prognostic
• Breast Cancer prognostics/diagnostics/theranostics

GIS H1N1 BIOSURVEILLANCE RESEQUENCING SYSTEM

Clinical/Public Health Questions
• Do mutations in the virus correlate with disease severity, or response to treatment?
• Is there a particular strain of the virus that appears to be dominant?
• Are there any mutations that will lead to Tamiflu/other anti-viral drug resistance?

H1N1 Biosurveillance Kit
• GIS H1N1 8-segment RT-PCR primer mix• GIS-optimized 3rd party RT-PCR reagents• Nimblegen microarray reagents• GIS-designed Nimblegen microarray• Nimblegen Nimblescan 2.5 software• Evolstar: GIS proprietary analysis software
(sequence calling and visualization)
http://flu.gis.a-star.edu.sg

http://flu.gis.a-star.edu.sg
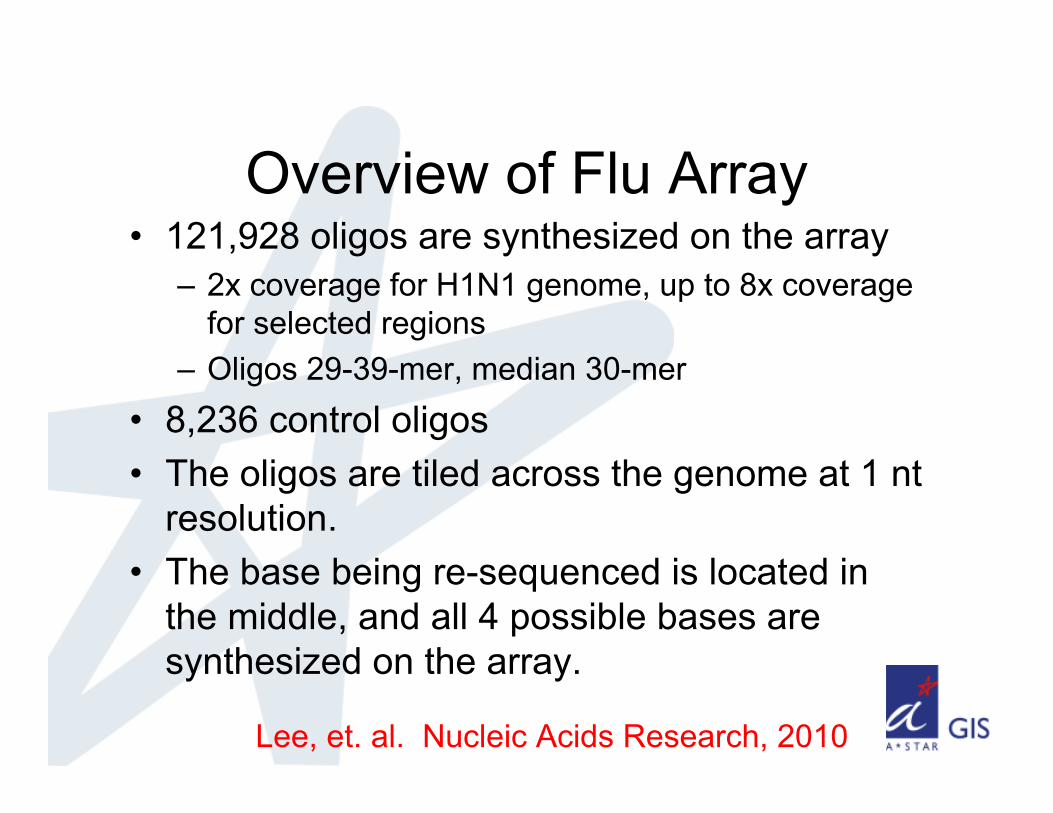
Overview of Flu Array• 121,928 oligos are synthesized on the array
– 2x coverage for H1N1 genome, up to 8x coverage for selected regions
– Oligos 29-39-mer, median 30-mer• 8,236 control oligos• The oligos are tiled across the genome at 1 nt
resolution.• The base being re-sequenced is located in
the middle, and all 4 possible bases are synthesized on the array.
Lee, et. al. Nucleic Acids Research, 2010
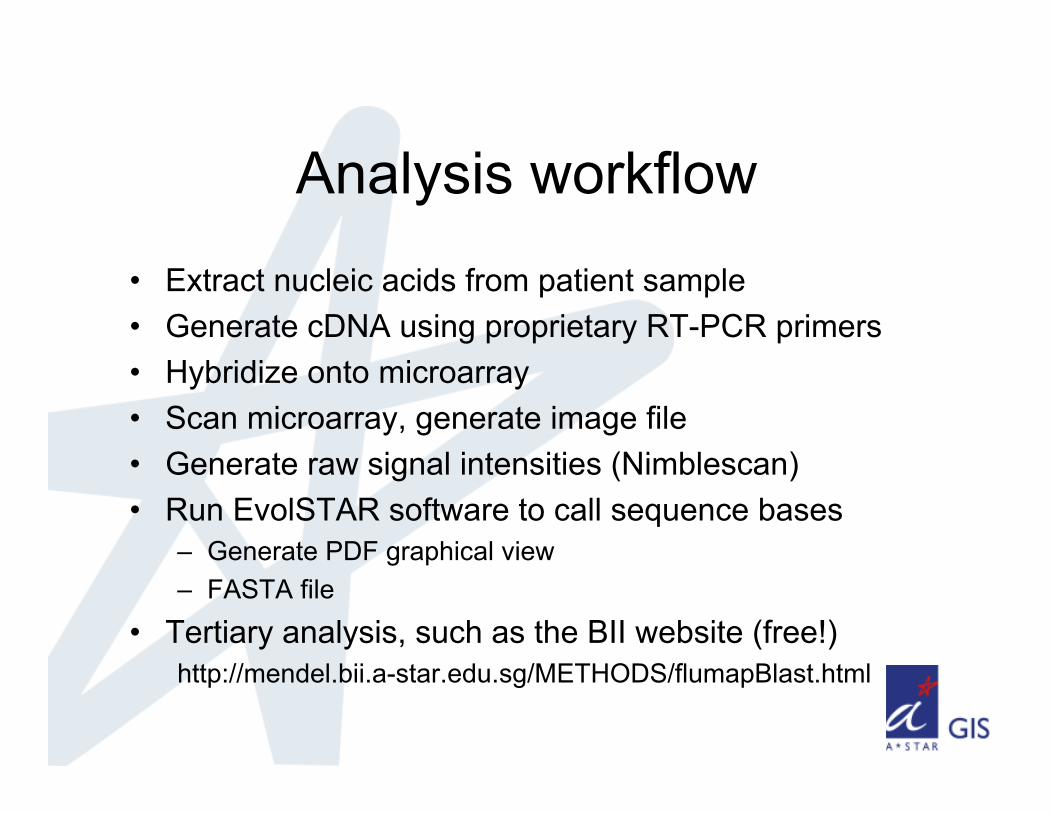
Analysis workflow
• Extract nucleic acids from patient sample• Generate cDNA using proprietary RT-PCR primers• Hybridize onto microarray• Scan microarray, generate image file• Generate raw signal intensities (Nimblescan)• Run EvolSTAR software to call sequence bases
– Generate PDF graphical view– FASTA file
• Tertiary analysis, such as the BII website (free!)http://mendel.bii.a-star.edu.sg/METHODS/flumapBlast.html
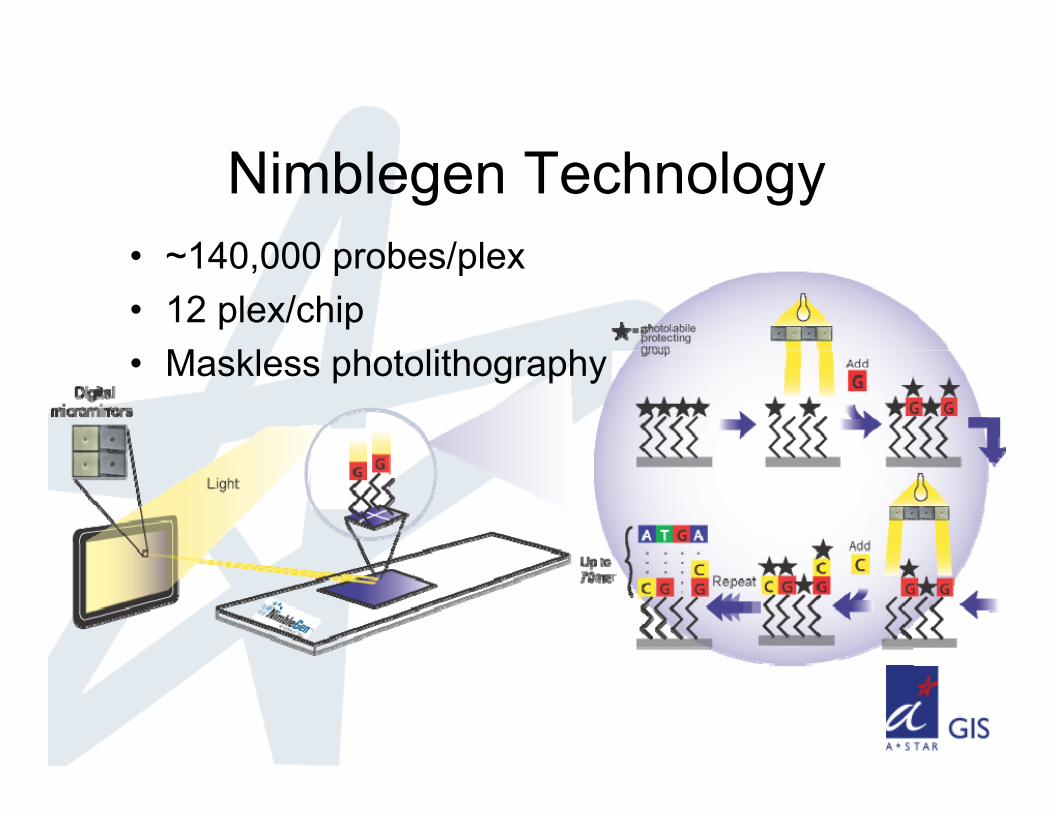
Nimblegen Technology• ~140,000 probes/plex• 12 plex/chip• Maskless photolithography

..TTTGGGAAGAGAAGTCCCCCAACCGACATTCGGACAACCCTGTAGGCCGCATGGTCACCC..
TTTGGGAAGAGAAGTCCCCCAACCGACAT
TTTGGGAAGAGAAGACCCCCAACCGACAT
TTTGGGAAGAGAAGCCCCCCAACCGACAT
TTTGGGAAGAGAAGGCCCCCAACCGACATPMMM
..AAACCCTTCTCTTCAGGGGGTTGGCTGTA..
..AAACCCTTCTCTTCAGGGGGTTGGCTGTA..
..AAACCCTTCTCTTCAGGGGGTTGGCTGTA..
..AAACCCTTCTCTTCAGGGGGTTGGCTGTA..
Sequencing by Hybridization

Overall PerformanceDiscordant calls
Ambiguous calls (Ns) Call Rate Accuracy
Average1.4 per 100,000 bases
96 99.28% ±0.61%
100% ±0.01%
• Field tested in Mexico in July 2009 (all lab and analysis work done there)
• Sequencing method for critical samples in Singapore (over 200 samples sequenced)
• > 80 samples published in GenBank

Case studies using Flu Chip• Transmission pattern in a 747 airplane
– Ooi et al, Archives of Internal Medicine, 170(10) 913-915. 2010.
• Effectiveness of using Tamiflu as a prophylaxis treatment in army camps– Lee et al, New England Journal of Medicine,
362(23) 2166-2174 2010.
• Emergence of Tamiflu-resistant virus after treatment– Inoue et al, Emerging Infectious Diseases,
16(10) 1633-6 2010.
• Causes of Oseltamivir chemoprophylaxis failures– Lee et al, J. Clinical Virology, 50(2):104-8 2011.
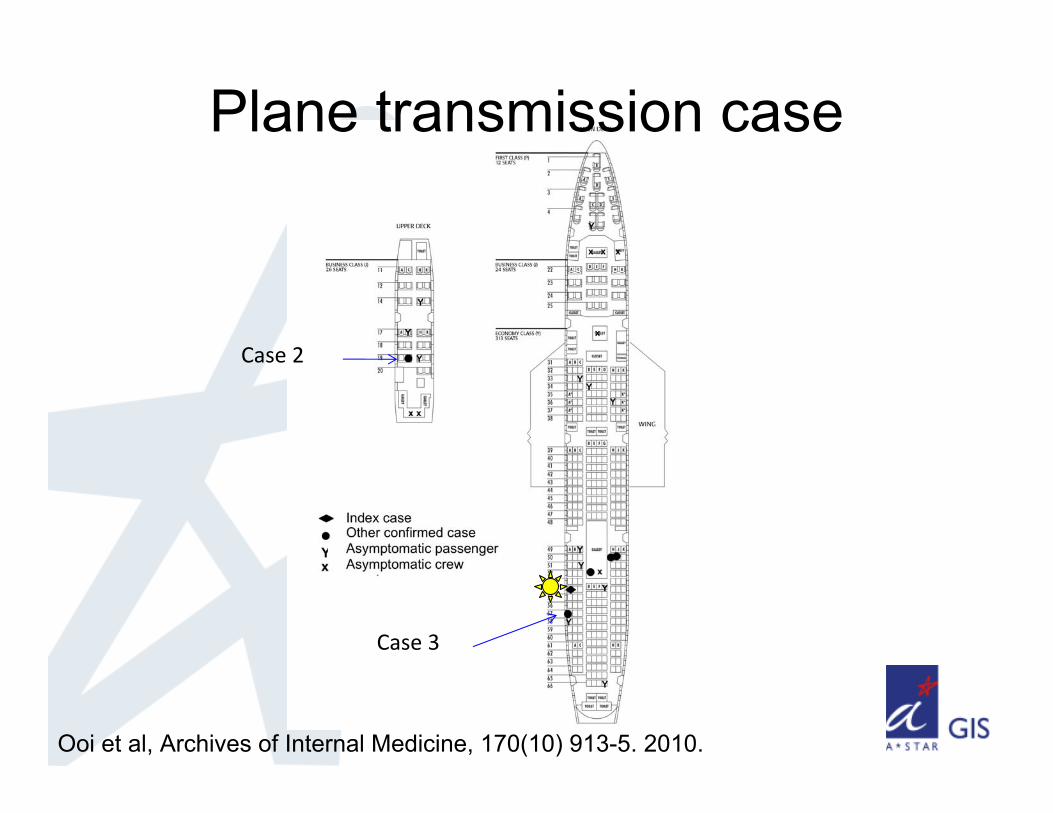
Plane transmission case
Case 3
Case 2
Ooi et al, Archives of Internal Medicine, 170(10) 913-5. 2010.

Plane transmission case
Ooi et al, Archives of Internal Medicine, 170(10) 913-5. 2010.

Plane transmission caseA/New York/18/2009(H1N1)
G A A C T A A C C A A
A/Mexico/4604/2009(H1N1)
G A T C T A A C C A G
A/Mexico/InDRE4487/2009(H1N1)
G A T C C A G C C G G
A/California/04/2009(H1N1)
G A T C C A G C C G G
A/SG/Case 4/2009(H1N1)
G A A C T A A C C A A
A/SG/Contact of Case 3/2009(H1N1)
G G A T T A A C C A A
A/SG/Case 3/2009(H1N1)
G G A T T A a C C A A
A/SG/Case 1/2009(H1N1)
G G G T T A A C C A A
A/SG/Case 2/2009(H1N1)
A A A T T A A C C A a
Ooi et al, Archives of Internal Medicine, 170(10) 913-5. 2010.

Identifying critical mutations in new sequences
Dr Sebastian Maurer-Stroh, BII, A*STAR http://mendel.bii.a-star.edu.sg/METHODS/flumapBlast.html

Conclusions
• Our advantages are:– Easy to use, no sequence assembly– Speed (<30 hrs)– Sensitivity (qPCR CT <25)– Cost – RT-PCR primers can be used for sample prep for
other sequencing technologies• Limitations:
– Can’t get first and last 14 bases of sequence– Homopolymer regions (longer than 4 bases)

Technology Access Partners
• Microarrays & associated reagents
• Primers & EvolSTAR Software
http://flu.gis.a-star.edu.sg

• >200 H1N1 genomes resequenced• >80 H1N1 genomes published in GenBank• 6 manuscripts published• 2 patent apps (1 filed Sept 2009, 2nd in Apr 2010)• Used by Singapore Ministries of Health and
Defence• Licensed to AIT Biotech • SOLD! to INMEGEN Mexico City

PATHGEN® PATHCHIP KIT

Imagine….
• An Unbiased Diagnostic tool that accurately and sensitively detects all pathogens: viral, bacteria, and fungi, including novel species
• Detect co-infections.• Results in <8 hrs.• Can be automated.

Paradigm Shift
Moving away from traditional clinician decision processes:
“Is this (xxx) virus present in my sample?”
to a system which automatically identifies all the pathogen(s) present in a sample (and excludes the rest):
“What pathogen(s) are present in my sample?”

Current diagnostic tests
• Culture-based tests• Antibody-based tests (ELISA, current POC
devices, strip tests)• Nucleic acid-based tests (specific PCR, or
panel tests, eg. Luminex, Qiagen)• Abbott mass-tag PCR mass spectrometry
(16S/23S/25S RNA detection)

Discovery that SARS is a novel Coronavirus by microarray
• Random PCR patient sample• Hybridize onto microarray chip with 10,000
conserved probes to 1000 viruses.

Problems with microarrays
• Probe design – Why do some probes “work” and some don’t?
• Detection sensitivity– How do you know what is present?– Can you predict the pathogen hybridization
signature?– Background noise/cross-hybridization issues

To make microarrays practical:
• Optimize sample amplification• Intelligent probe design• Understand dynamics of probe-
cDNA cross-hybridization: Predict pathogen hybridization patterns in silico
• Robust statistical-based algorithm to analyze microarray data and make diagnosis

1. Determine content2. Intelligent probe design
3. Probe annotation into pathogen recognition signatures
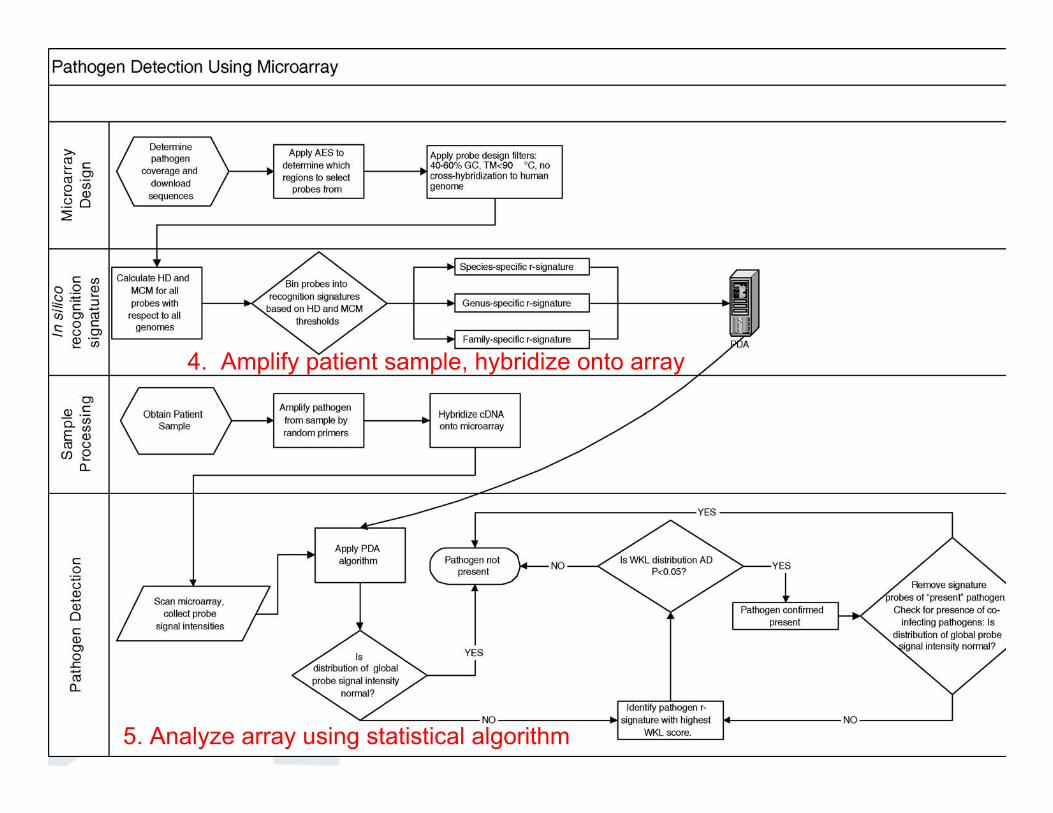
4. Amplify patient sample, hybridize onto array
5. Analyze array using statistical algorithm

Empirical determination of the dynamics for probe hybridization
• 35 viral genomes• 40-mer oligos• Tiled across genome with
at least 4 overlapping probes/base
• 400 human control oligos• 10,000 non-specific
hybridization control oligos
• 7-fold replication of all probes (~380,000 total)
Analyze hyb results to determine which probes work best. Computer modeling to correlate results with other design predictors for good annealing characteristics. Extrapolate to other genomes

Full-genome coverage• Picornaviridae
– Enteroviruses A-D– Echovirus– Rhinovirus A, B– Hepatitis A– Foot & mouth
• Coronaviridae– SARS– OC43, 229E
• Orthomyxoviridae– Flu A, B
• Flaviviridae– Dengue 1-4– Japan Encephalitis– West Nile– Yellow Fever
• Paramyxoviridae– Paraflu 1-3– Newcastle– Nipah– RSV– Metapneumovirus
• Bunyaviridae– Hantaan– Sin Nombre
• Possible +ve ctrls/misc:– HIV-1– Papillomavirus 10 (HPV)– Hepatitis B– Rubella– Lymphochtic choriomeningitis– Pepper mild mottle (PMMV)

Specific PCR vs Tagged-random PCR
SARS 850Specific PCRSARS 850Specific PCR
Dengue 1Specific PCRDengue 1Specific PCR
RSVRandom PCRRSVRandom PCR

PCR Primer Design
• Mathematical algorithm “Amplification Efficiency Score” predicts how well pathogen can be amplified with any given Random PCR primer tag.
m
AESAESAverage
mx
xii
1
x
xj
j
jxk
rfx kPjPAES
1000
1000
)500,1max(
)()(
Dr Charlie Lee

Practical Use of Amplification Efficiency Model
1948 probes tiled across the RSV B genome Primer A1: Standard tagged‐random primer (Bohlander, 1992). Primer A2: A primer with high AES
Findings Primer with overall higher AES
works better
Usage Predict performance of a tagged‐
random primer on target DNA Probe design
Choose probes in regions of high AES Omit probes in regions of low AES
Tagged‐random primer design

Factors that Influence Probe Performance
Selection of a minimal number of “good” probes is vital Avoid extreme CG‐content, melting temperatures Specific to target, avoid cross‐hybridization
▪ For 40‐mers: Hamming Distance ≤ 4 or Maximum Contiguous Match ≥ 18 Avoid regions of low AES
98% detected

Overview of Detection Algorithm
WKL(Pa | Pa ) Qa ( j)log(Qa ( j)
Qa ( j))
Qa ( j) 1Qa ( j) j 0
k1
Main Idea: Detect the heavy tail of the distribution Use Weighted Kullback‐Leibler
divergence▪ Avoid volatility of using standard deviation as “light up” cutoff
▪ Give weights to probes based on intensities
▪ Use cumulative distribution function to avoid volatility of KL‐divergence
▪ Bootstrapping to determine p‐value▪ Remove probe set from detected pathogen, reanalyze to detect co‐infections
Log2 Signal Intensity
Cum
ulat
ive
Freq
uenc
y
RSV
All probes except RSV

Overview of Detection Algorithm
• WKL scores of all non‐present pathogens should approximate a normal distribution
• Pathogen with outlier WKL score is “present”– Probes belonging to signature set are removed
– Re‐compute WKL for all pathogens
• Iterate to find all co‐infections

http://www.biomedcentral.com/1471-2105/9/368
http://genomebiology.com/2007/8/5/R93

PathGEN® PathChip Kit• Comprises proprietary primers for RT-PCR, chip and
analysis software• Chip runs on FDA-approved Affymetrix GeneChip®
system• Semi-automated lab protocol• Fully automated analysis and interpretation• Chip detects all clinically relevant viruses
– Coverage for 50,000 full-virus genomes (59 families,156 genus)
– Identifies viruses at species level and strain level• Chip detects all clinically-relevant bacteria
– Current coverage for 20,000 bacteria sequences, representing 26 genera
Affymetrix, GeneChip® and Gene Atlas™ are registered trademark of Affymetrix, Inc.

Study on 300 Children in Philippines with Flu-like Symptoms
• Purpose was to compare viral diagnostic results of nasal wash specimens from the GIS system to cell cultures and two other PCR testing platforms, EraGen and Luminex.
• A “gold standard” diagnosis was ascertained for each specimen using the results from the culture, EraGen and Luminex
• GIS results were compared to this gold standard to measure concordance
Dr Eric A F SimõesUniv of Colorado Hospital

CLINICAL INTERFACE

Report SummaryReport Summary
Quality ControlsQuality Controls
Detected PathogensDetected
Pathogens
Can be viewed online, sent through email or mobile devices
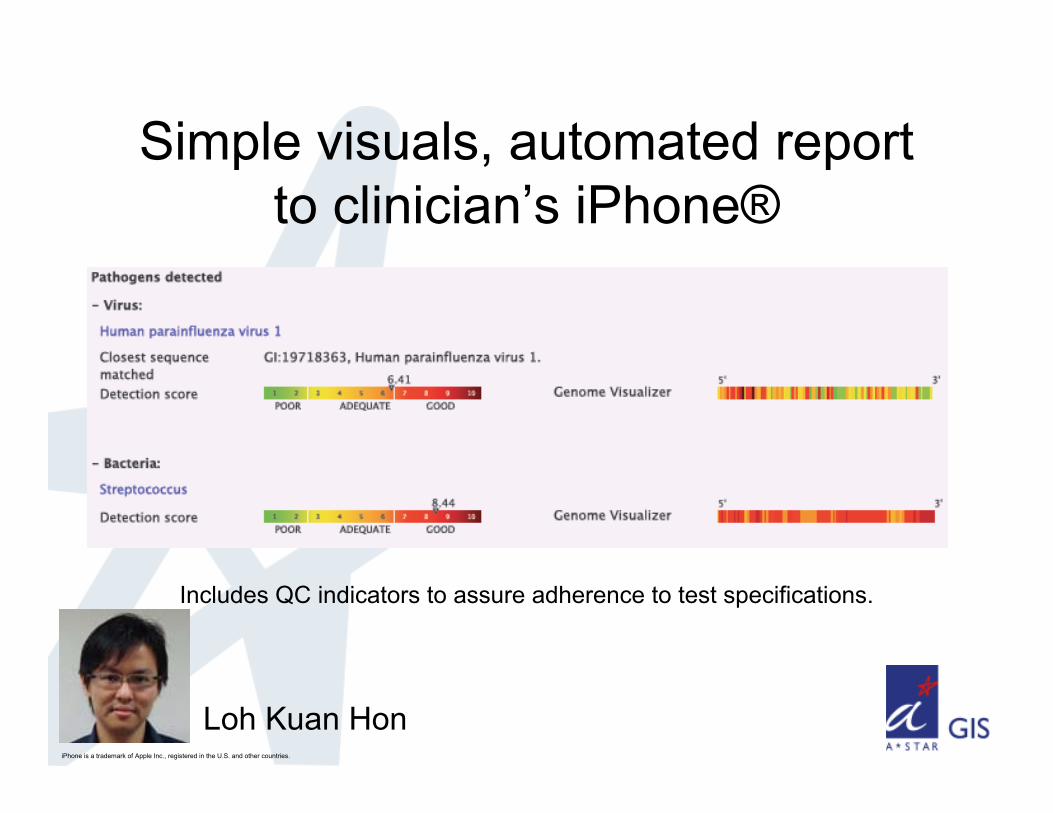
Simple visuals, automated report to clinician’s iPhone®
Includes QC indicators to assure adherence to test specifications.
iPhone is a trademark of Apple Inc., registered in the U.S. and other countries.
Loh Kuan Hon
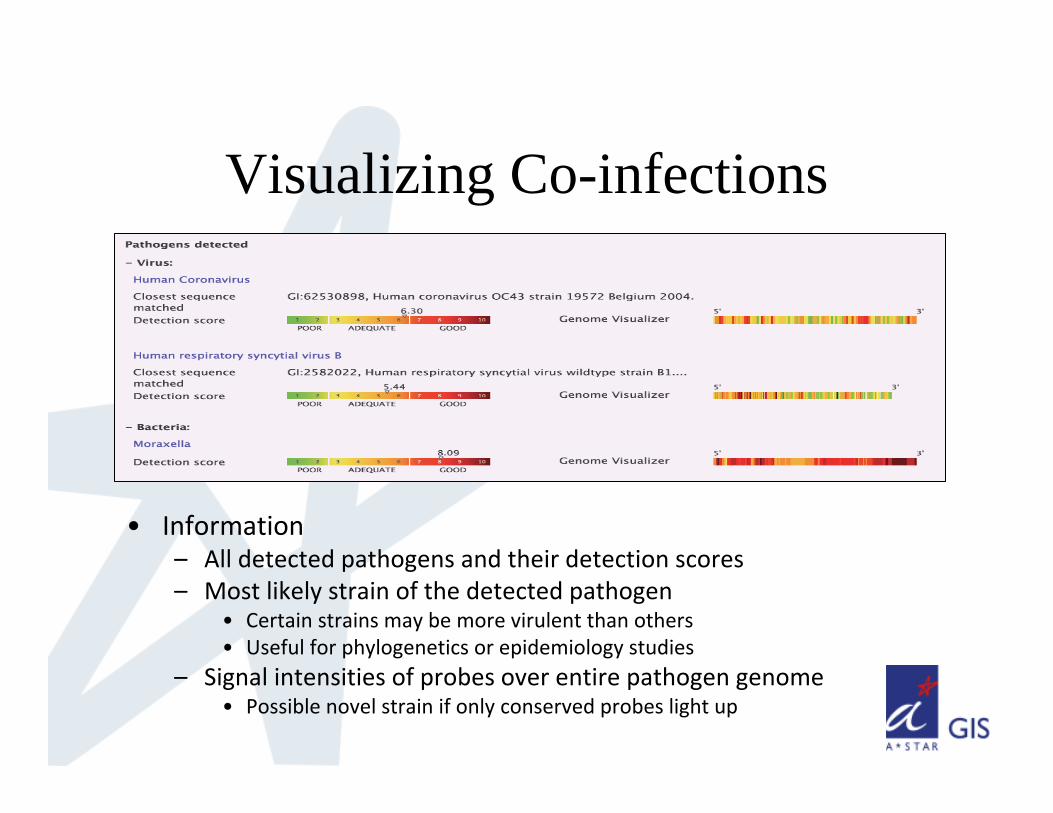
Visualizing Co-infections
• Information– All detected pathogens and their detection scores– Most likely strain of the detected pathogen
• Certain strains may be more virulent than others• Useful for phylogenetics or epidemiology studies
– Signal intensities of probes over entire pathogen genome• Possible novel strain if only conserved probes light up

Trial at Children’s Hospital, Denver in 2011
Virus No. of samples
Virus No. of samples
Adenovirus 4 metapneumovirus (HMPV) 23Bocavirus 6 parainfluenza virus 1 11Coronavirus 229E 4 parainfluenza virus 2 8Coronavirus OC43 12 parainfluenza virus 3 18Coronavirus NL63 2 parainfluenza virus 4 4Coxsackievirus 30 parechovirus 5
Cytomegalo/herpesvirus 5 8 Poliovirus 1
Echovirus 8respiratory syncytial virus A 37
Enterovirus 15respiratory syncytial virus B 37
Influenza A virus (H1N1) 3 rhinovirus 70Influenza A virus (H3N2) 23 Rotavirus 1I fl B i 9

Denver – bacteria POC (pediatric pneumonia nasal wash from Philippines)
Bacteria detected No. of samplesMoraxella 162
Streptococcus 28Haemophilus 15Mycoplasma 3Micrococcus 2
Staphylococcus 1
• Most of these bacteria are part of the normal commensal microbiome of the mouth or respiratory tract of humans.
• May affect compromised host defences, thus more serious disease

Co-Infections Rate
No. of co-infecting viruses
No. of samples No. of samples with virus + bacteria co-
infections0 49 301 152 1122 57 453 18 164 2 2
• 83% of samples had co‐infections

Assay Efficacy > 300 patients
Negative Predictive Value(true negative)
98 ±2%
Specificity(not false positive)
98 ±1%
Sensitivity(not false negative)
88 ±8%

RESEARCHER INTERFACE
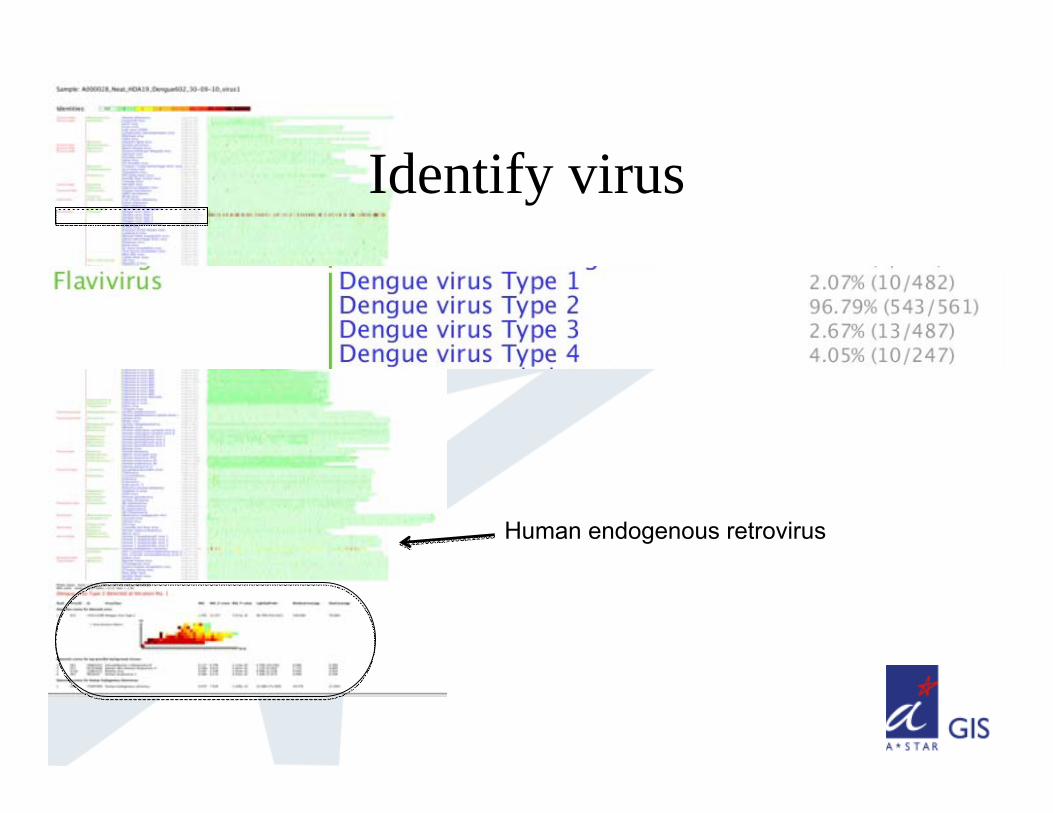
Identify virus
Human endogenous retrovirus

Statistical score of confidence
No co-infections present. Background virus scores within 1 SD of mean WKL
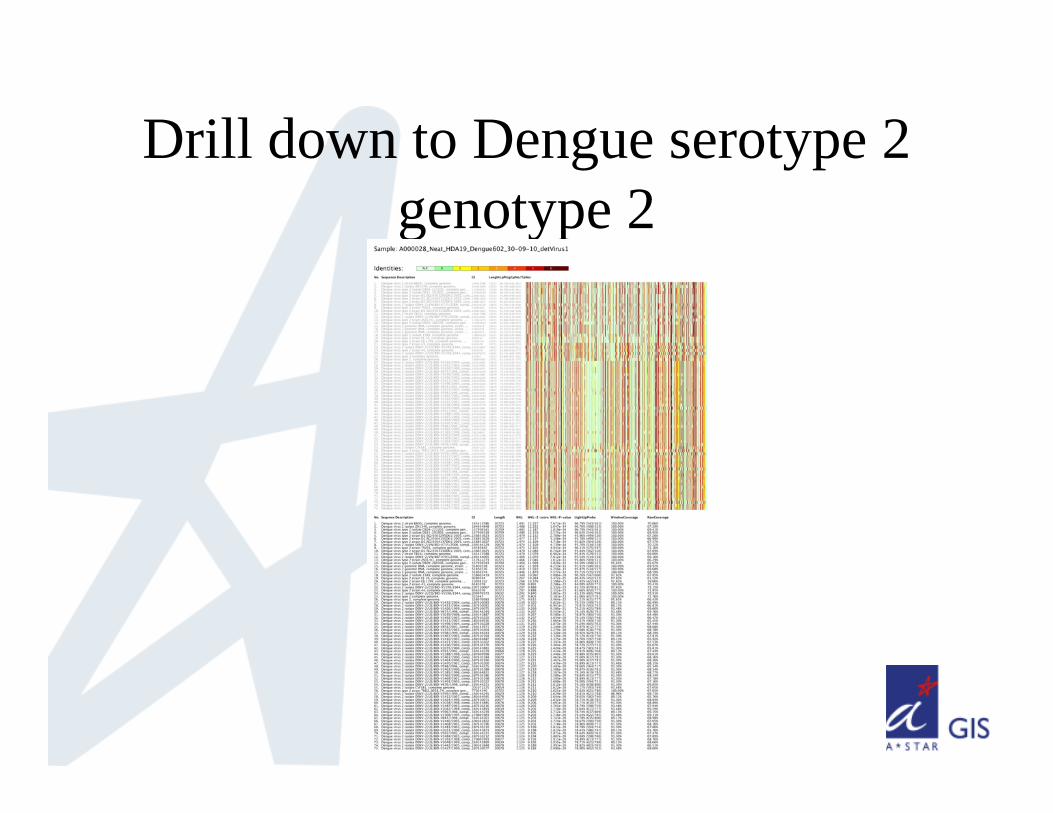
Drill down to Dengue serotype 2 genotype 2

Virus Detection ExamplesRNA VirusRNA Virus
DNA VirusDNA Virus
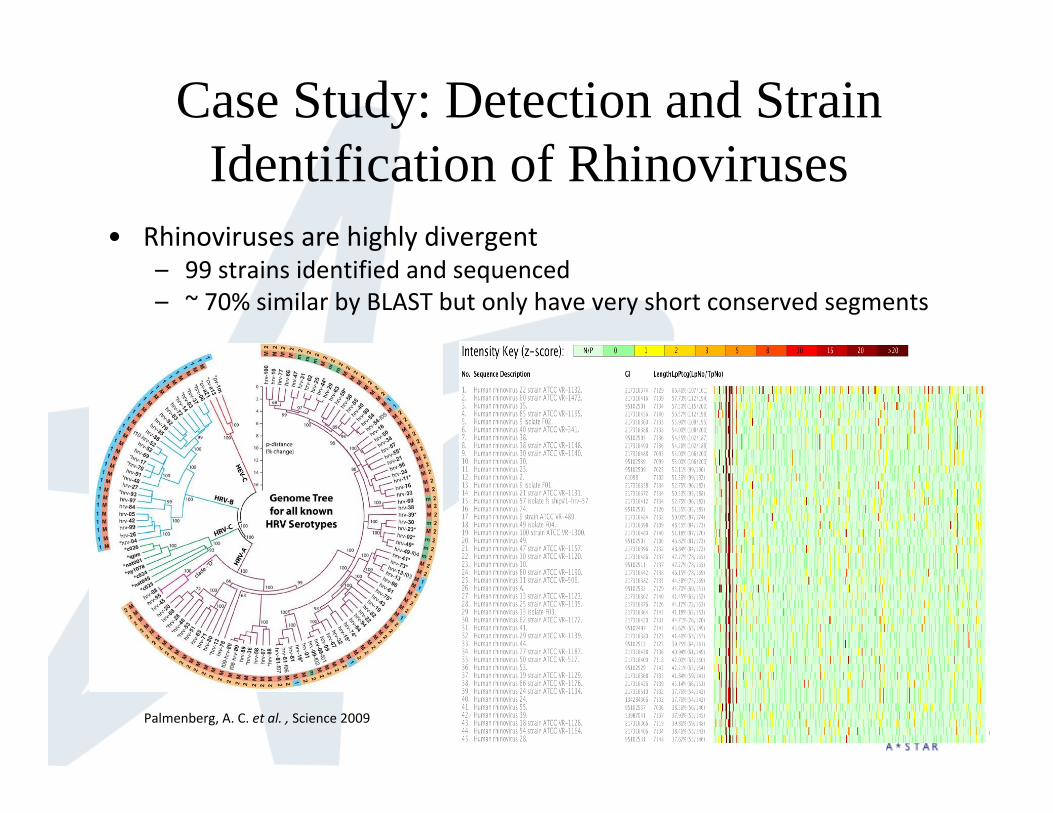
Case Study: Detection and Strain Identification of Rhinoviruses
• Rhinoviruses are highly divergent– 99 strains identified and sequenced– ~ 70% similar by BLAST but only have very short conserved segments
Palmenberg, A. C. et al. , Science 2009
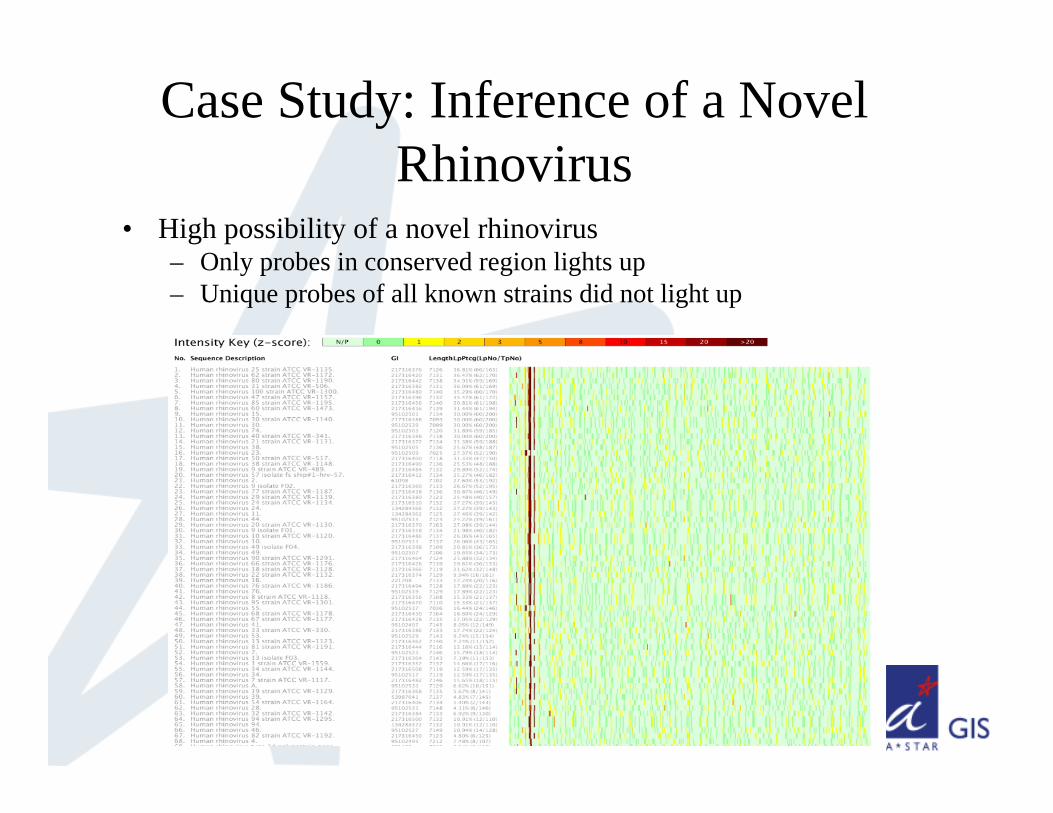
Case Study: Inference of a Novel Rhinovirus
• High possibility of a novel rhinovirus– Only probes in conserved region lights up– Unique probes of all known strains did not light up

Key findings• Ability to predict pathogen hybridization
signatures in silico• Random PCR is biased - but it can be corrected
through intelligent primer design• Robust “Pathogen Detection Algorithm”
(improvement on Kullbeck-Leibler and Anderson-Darling statistics)
• We can identify presence of virus & bacteria in patient samples
• We can detect presence of co-infecting viruses
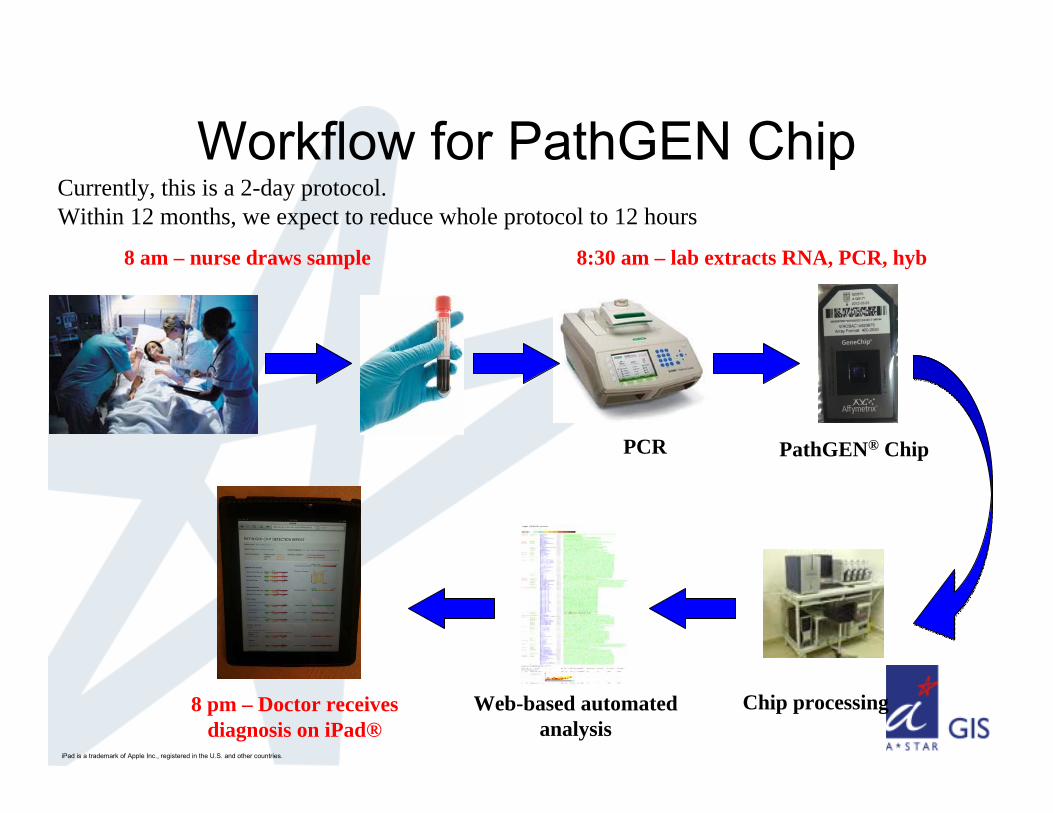
Workflow for PathGEN Chip
8 am – nurse draws sample
PathGEN® ChipPCR
8:30 am – lab extracts RNA, PCR, hyb
Currently, this is a 2-day protocol.Within 12 months, we expect to reduce whole protocol to 12 hours
Web-based automated analysis
Chip processing8 pm – Doctor receives diagnosis on iPad®
iPad is a trademark of Apple Inc., registered in the U.S. and other countries.

Acknowledgement• Technology:
– Koh Chee Wee– Thien Pei Ling– Geraldine Nai– Chan Yang Sun– Lance Miller– Leong Wan Yee– Ken Sung– Charlie Lee– Hans Loh– Ong Swee Hoe
• Infectious Disease:– Martin Hibberd– Pauline Aw– Shirlena Soh
Clinicians•Univ Colorado Children’s Hospital, Denver, US
– Eric Simoes
•Bandung, Indonesia– Cissy Kartasasmita
•NUH, Singapore– Evelyn Koay– Julian Tang
•Karolinska Institute Hospital, Sweden
– Thomas Tolfvenstam

Thank [email protected]