harold tünnemann & david g....
TRANSCRIPT
Full Terms & Conditions of access and use can be found athttp://www.tandfonline.com/action/journalInformation?journalCode=uijw20
International Journal of Wrestling Science
ISSN: 2161-5667 (Print) 2161-3524 (Online) Journal homepage: http://www.tandfonline.com/loi/uijw20
Scoring Analysis of the Wrestling from the 2016 RioOlympic Games
Harold Tünnemann & David G. Curby
To cite this article: Harold Tünnemann & David G. Curby (2016) Scoring Analysis of the Wrestlingfrom the 2016 Rio Olympic Games, International Journal of Wrestling Science, 6:2, 90-116, DOI:10.1080/21615667.2017.1315197
To link to this article: https://doi.org/10.1080/21615667.2017.1315197
Published online: 22 Jun 2016.
Submit your article to this journal
Article views: 87
View related articles
View Crossmark data
Scoring Analysis of the Wrestling from the 2016 RioOlympic Games
Harold Tünnemann1 and David G. Curby2
ABSTRACT. The videos of all wrestling matches from the 2016 Olympic Games in Rio wereanalyzed for scoring and technique. Summaries were compiled for all three styles—Men’sFreestyle, Women’s Freestyle, and Greco-Roman. The performance of the top countries andthe champions are presented. Attack efficacy, represented by points scored per minute, ispresented for the style as a whole for the top countries and for the weight-class champions.The technical structure of the champions, with scoring by type of technique, is also presented.This was done for all three styles—Men’s Freestyle, Women’s Freestyle, and Greco-Roman.Trends observed during the Olympic cycle between London 2012 and Rio 2016 are discussed.
Keywords: rules, scoring analysis, competition, history, Olympics
PRELIMINARY REMARKS
The extremely fair and enthusiastic crowds in the CariocaArena 2, along with the numerous volunteers, who werealways polite and enthusiastic, made the Rio Games ones ofhope and glory. For fans, young and old, the games were afantastic festival of sport. Credit must be extended to ourfriend Pedro Gama Filho, president of the Brazilian wres-tling federation, who prepared the wrestling competition inthe Carioca Arena with “body and soul.”
United World Wrestling (UWW) made some seriouschanges during the Olympic Cycle of 2012–2016 withpositive effects and reestablished the value of wrestling inthe Olympic family. Changes were seen in the following:
● The scoring system;● The ratings of technical-tactical actions;● Overall presentation of the competition; and● Multimedia presentation.
The most successful medal collectors were Russia andAzerbaijan (9), Japan (7), Turkey and Iran (5), and Cuba,the United States, Georgia, Belarus, Kazakhstan, and
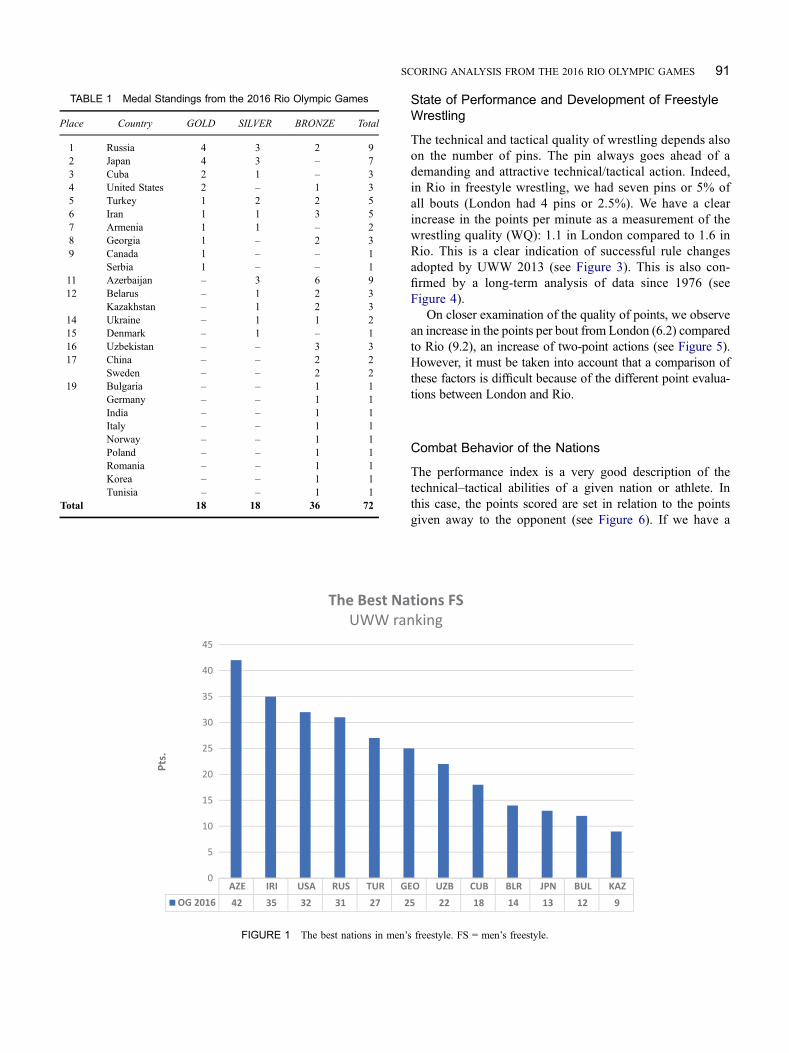
Uzbekistan (3). If we take into consideration the quality ofmedals, the most successful nations were Russia, Japan,Cuba, the United States, Turkey, Iran, Armenia, Georgia,Canada, and Serbia (see Table 1). Turkey showed remark-able development (Rio: five medals; London: one medal)and Tunisia as a representative of Africa won its firstOlympic wrestling medal.
The stars of the games were of course the athletes. Infemale wrestling, we must certainly emphasize Kaori Icho(Japan) who became the first ever wrestler in Olympichistory to win four Olympic Gold medals, while, inGreco-Roman Wrestling, Mijain Lopez Nunez (Cuba) cele-brated being a three-time Olympic Champion.
ANALYSIS OF THE RIO OLYMPIC GAMES 2016 INFREESTYLE WRESTLING
Country-Specific Aspects
In freestyle wrestling, Azerbaijan, Iran, Russia, the UnitedStates, Turkey, Georgia Uzbekistan, Cuba, Belarus, andJapan were the 10 most successful nations (see Figure 1).
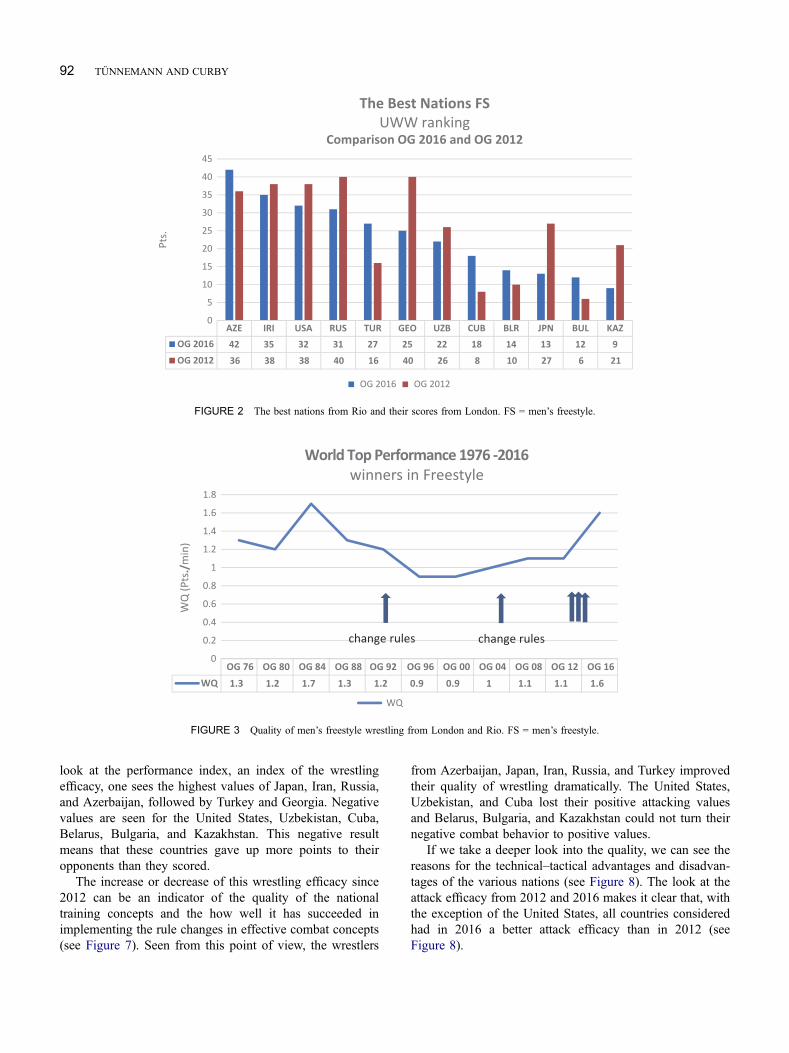
When we compare the nations’ rankings from 2012 to2016 (see Figure 2), we can see that Azerbaijan was the bestnation and had six more points than in London. Turkeyshowed great success with their freestyle wrestlers gaining11 points since London, with Cuba improving by 10 andBelarus by 4 points. The following nations suffered losses:India (-18), Georgia (-15), Japan (-14), Kazakhstan (-12),Russia (-9), and the United States (-6).
1United World Wrestling, Corsier-sur-Vevey, Switzerland2International Network of Wrestling Researchers, LaGrange, Illinois,
USACorrespondence should be addressed to David G. Curby, International
Network of Wrestling Researchers, 1719 W. 60th Street, LaGrange, IL60525, USA. E-mail: [email protected]
INTERNATIONAL JOURNAL OF WRESTLING SCIENCE, 6: 90–116, 2016Copyright © The Curby Research Group, LLCISSN: 2161-5667 print / 2161-3524 onlineDOI: 10.1080/21615667.2017.1315197
State of Performance and Development of FreestyleWrestling
The technical and tactical quality of wrestling depends alsoon the number of pins. The pin always goes ahead of ademanding and attractive technical/tactical action. Indeed,in Rio in freestyle wrestling, we had seven pins or 5% ofall bouts (London had 4 pins or 2.5%). We have a clearincrease in the points per minute as a measurement of thewrestling quality (WQ): 1.1 in London compared to 1.6 inRio. This is a clear indication of successful rule changesadopted by UWW 2013 (see Figure 3). This is also con-firmed by a long-term analysis of data since 1976 (seeFigure 4).
On closer examination of the quality of points, we observean increase in the points per bout from London (6.2) comparedto Rio (9.2), an increase of two-point actions (see Figure 5).However, it must be taken into account that a comparison ofthese factors is difficult because of the different point evalua-tions between London and Rio.
Combat Behavior of the Nations
The performance index is a very good description of thetechnical–tactical abilities of a given nation or athlete. Inthis case, the points scored are set in relation to the pointsgiven away to the opponent (see Figure 6). If we have a
TABLE 1 Medal Standings from the 2016 Rio Olympic Games
Place Country GOLD SILVER BRONZE Total
1 Russia 4 3 2 92 Japan 4 3 – 73 Cuba 2 1 – 34 United States 2 – 1 35 Turkey 1 2 2 56 Iran 1 1 3 57 Armenia 1 1 – 28 Georgia 1 – 2 39 Canada 1 – – 1
Serbia 1 – – 111 Azerbaijan – 3 6 912 Belarus – 1 2 3
Kazakhstan – 1 2 314 Ukraine – 1 1 215 Denmark – 1 – 116 Uzbekistan – – 3 317 China – – 2 2
Sweden – – 2 219 Bulgaria – – 1 1
Germany – – 1 1India – – 1 1Italy – – 1 1Norway – – 1 1Poland – – 1 1Romania – – 1 1Korea – – 1 1Tunisia – – 1 1
Total 18 18 36 72
AZE IRI USA RUS TUR GEO UZB CUB BLR JPN BUL KAZ
OG 2016 42 35 32 31 27 25 22 18 14 13 12 9
0
5
10
15
20
25
30
35
40
45
Pts.
The Best Nations FS
UWW ranking
FIGURE 1 The best nations in men’s freestyle. FS = men’s freestyle.
SCORING ANALYSIS FROM THE 2016 RIO OLYMPIC GAMES 91
look at the performance index, an index of the wrestlingefficacy, one sees the highest values of Japan, Iran, Russia,and Azerbaijan, followed by Turkey and Georgia. Negativevalues are seen for the United States, Uzbekistan, Cuba,Belarus, Bulgaria, and Kazakhstan. This negative resultmeans that these countries gave up more points to theiropponents than they scored.
The increase or decrease of this wrestling efficacy since2012 can be an indicator of the quality of the nationaltraining concepts and the how well it has succeeded inimplementing the rule changes in effective combat concepts(see Figure 7). Seen from this point of view, the wrestlers
from Azerbaijan, Japan, Iran, Russia, and Turkey improvedtheir quality of wrestling dramatically. The United States,Uzbekistan, and Cuba lost their positive attacking valuesand Belarus, Bulgaria, and Kazakhstan could not turn theirnegative combat behavior to positive values.
If we take a deeper look into the quality, we can see thereasons for the technical–tactical advantages and disadvan-tages of the various nations (see Figure 8). The look at theattack efficacy from 2012 and 2016 makes it clear that, withthe exception of the United States, all countries consideredhad in 2016 a better attack efficacy than in 2012 (seeFigure 8).
AZE IRI USA RUS TUR GEO UZB CUB BLR JPN BUL KAZ
OG 2016 42 35 32 31 27 25 22 18 14 13 12 9
OG 2012 36 38 38 40 16 40 26 8 10 27 6 21
0
5
10
15
20
25
30
35
40
45P
ts.
The Best Nations FS
UWW ranking
Comparison OG 2016 and OG 2012
OG 2016 OG 2012
FIGURE 2 The best nations from Rio and their scores from London. FS = men’s freestyle.
OG 76 OG 80 OG 84 OG 88 OG 92 OG 96 OG 00 OG 04 OG 08 OG 12 OG 16
WQ 1.3 1.2 1.7 1.3 1.2 0.9 0.9 1 1.1 1.1 1.6
0
0.2
0.4
0.6
0.8
1
1.2
1.4
1.6
1.8
WQ
(P
ts./
min
)
World Top Performance 1976 -2016
winners in Freestyle
WQ
change rules change rules
FIGURE 3 Quality of men’s freestyle wrestling from London and Rio. FS = men’s freestyle.
92 TÜNNEMANN AND CURBY

The improvement in the values of attack effectivenessalso results from the rule-driven increase in the evaluationof technical actions but does not explain the values of theU.S. wrestlers. On the other hand, there must be anotherwinning factor if a lot of wrestlers were successful with a
good attack efficacy and others were not. And this becomesclearer if we also examine defensive abilities (see Figure 9).We see a good balance between attack and defensive abilityin Azerbaijan, Iran, Russia, Turkey, and Japan, and theproblems with defense in the other countries.
76 78 80 82 84 86 88 90 92 93 94 95 96 97 98 99 00 01 02 03 04 05 06 07 08 09 10 11 12 13 14 15 16
WQ - FS 1 1 1 1 2 2 1 1 1 1 1 1 1 1 1 1 1 1 1 1 1 1 1 1 1 1 1 1 1 2 2 2 2
0
0.2
0.4
0.6
0.8
1
1.2
1.4
1.6
1.8
2
WQ
(p
ts./
min
)
World top performance 1976 - 2016
winners in FS -Men
World Championships and Olympic Games
WQ - FS
change ruleschange rules
FIGURE 4 Development of the points per minute made by the winners since 1976. FS = men’s freestyle.
0
100
200
300
400
500
600
700
800
900
Rio 2016London 2012
Pts.
Quality of Points in Men's FS (all participants)
Olympic Games 2012 and 2016
5 pts
4 pts
3 pts
2 pts
1 pt
bouts: 155 Pts: 1010
Pts/bt: 6.5
bouts: 141 Pts: 1298
Pts/bt: 9.2
FIGURE 5 Development of the quality of points in freestyle wrestling from London to Rio. FS = men’s freestyle.
SCORING ANALYSIS FROM THE 2016 RIO OLYMPIC GAMES 93

Combat Behavior of the Winner
TheOlympic cycle analysis of 2012–2016 shows the rule-drivenincrease in wrestling performance since 2013 with the effective-ness of the defense remaining at a high level (see Figure 10).
When we look at the attack efficacy, the domination ofthe Olympic champions Soslan Romanov (Russia, 65 kg),Hassan Yazdani (Iran, 74 kg), and Taha Akguel (Turkey,125 kg) becomes evident (Figure 11). They surpass theaverage 1.59 points per minute of the Olympic champions.By the way, the average for the London Olympic championswas only 1.1. This is evidence for the successful offensivestrategy during the Olympic Freestyle Wrestling tournament
that filled the spectators in the Olympic Carioca Arena withso much enthusiasm.
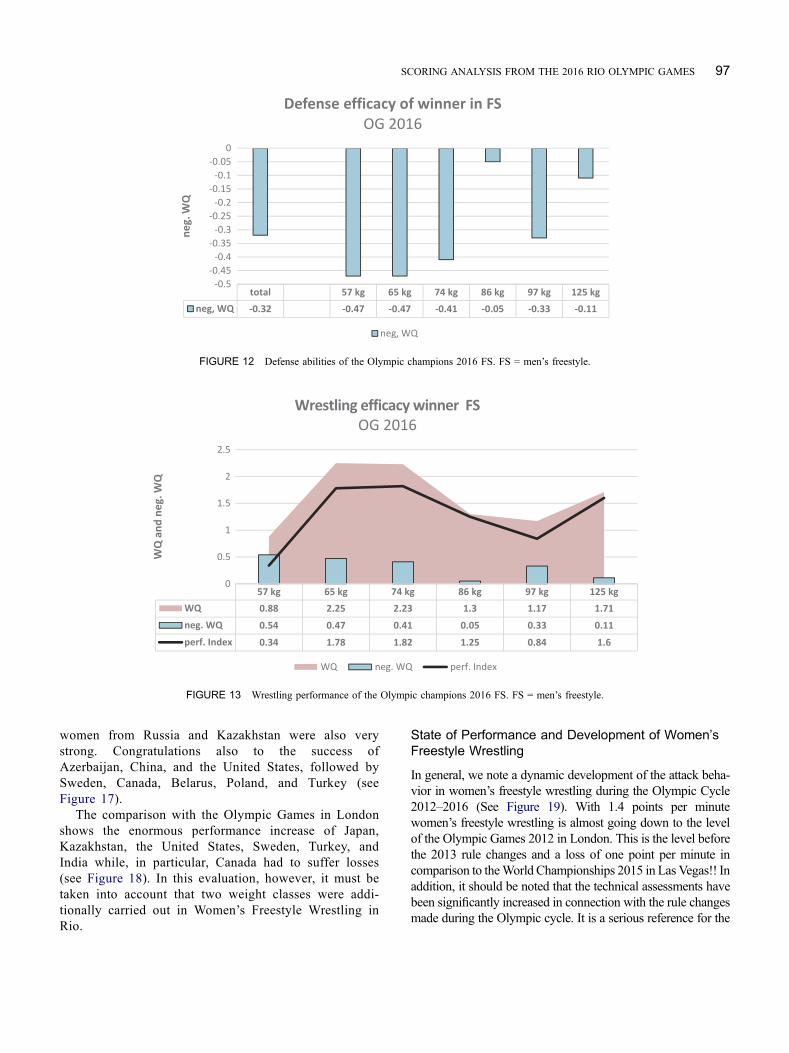
We also have to consider the outstanding defensive abilitiesof the 2016Olympic champions, Abdulrashid Sadulaev (Russia,86 kg) and TahaAkguel (Turkey, 125 kg). All the other Olympicchampions are far from their level (see Figure 12).
The analysis of the complex wrestling performance ofthe Olympic champions shows the superiority of SoslanRomanov (Russia, 65 kg), Hassan Yazdani (Iran, 74 kg),and Taha Akguel (Turkey, 125 kg). Not to be forgotten inthis respect is Abdulrashid Sadulaev (Russia, 86 kg), who isvery stable in the defense but does only as much as neces-sary in the attack (see Figure 13).
AZE IRI USA RUS TUR GEO UZB CUB BLR JPN BUL KAZ
perf. Index 16 0.73 0.81 -0.13 0.77 0.39 0.33 -0.05 -0.14 -0.15 0.84 -0.12 -0.19
-0.4
-0.2
0
0.2
0.4
0.6
0.8
1
WQ
-n
eg
. W
Q
The best Nations FS
performance Index OG 2016
perf. Index 16
FIGURE 6 Best values of the performance index (wrestling efficacy) of nations. FS = men’s freestyle.
AZE IRI USA RUS TUR GEO UZB CUB BLR JPN BUL KAZ
perf. Index 16 0.73 0.81 -0.13 0.77 0.39 0.33 -0.05 -0.14 -0.15 0.84 -0.12 -0.19
perf. Index 12 0.49 0.39 0.25 0.38 -0.17 0.33 0.22 0.05 -0.39 0.39 -0.32 -0.21
-0.4
-0.2
0
0.2
0.4
0.6
0.8
1
WQ
-n
eg
. W
Q
The Best Nations FS
comparison of performance index OG 2016 and OG 2012
perf. Index 16 perf. Index 12
FIGURE 7 Comparison of the wrestling efficacy of nations for 2012 and 2016. FS = men’s freestyle.
94 TÜNNEMANN AND CURBY

It is very important for coaches to analyze the technical–tactical structure of the winner. They must look at the technicalcapacity of their athletes and compare this with the top athletesof their weight class. It is also very important for the planning ofthe technical-training process as well as for the training conceptsof the promising young talent. Just as in Greco-Roman wres-tling, the freestyle wrestlers are also starting their final bouts
with a “safe strategy” (see Figure 14). In the final bouts for goldmedal, this tendency of the relatively late first-point score isclear (average after 2.6 minutes). This is especially true forAkguel (Turkey, 125 kg), Yazdani (Iran, 74 kg), andKhinchegashvili (Georgia, 57 kg).
We see in Rio, in general, leg attacks as the dominatingtechniques followed by the gut wrench, counter, take down,
AZE IRI USA RUS TUR GEO UZB CUB BLR JPN BUL KAZ
WQ 16 1.35 1.33 0.74 1.29 0.95 1.09 1.35 0.89 0.89 1.41 1.18 0.93
WQ 12 0.94 0.85 0.84 0.88 0.65 0.95 0.71 0.69 0.62 0.83 0.52 0.79
0
0.2
0.4
0.6
0.8
1
1.2
1.4
1.6
WQ
(p
ts./
min
)
Attack efficacy of the best nations FS
Comparison attack efficacy OG 2016 and OG 2012
WQ 16 WQ 12
FIGURE 8 Best values of the attack efficacy during the Olympic Games 2012 and 2016. FS = men’s freestyle.
AZE IRI USA RUS TUR GEO UZB CUB BLR JPN BUL KAZ
WQ 16 1.35 1.33 0.74 1.29 0.95 1.09 1.35 0.89 0.89 1.41 1.18 0.93
neg. WQ 16 0.62 0.52 0.87 0.52 0.56 0.76 1.4 1.03 1.04 0.57 1.3 1.12
perf. Index 16 0.73 0.81 -0.13 0.77 0.39 0.33 -0.05 -0.14 -0.15 0.84 -0.12 -0.19
-0.4
-0.2
0
0.2
0.4
0.6
0.8
1
1.2
1.4
1.6
pts.
/ m
in
Wrestling efficacy of best nations FS
OG 2016
WQ 16 neg. WQ 16 perf. Index 16
FIGURE 9 Wrestling performance of the best nations in 2016 in Rio. FS = men’s freestyle.
SCORING ANALYSIS FROM THE 2016 RIO OLYMPIC GAMES 95

and “push out” (see Figure 15). Leg attacks are very popularbecause after rule changes you can get for one attack fourpoints. Of course, even under the Olympic champions, thereare individual differences within the technique profile. SoSadulaev (Russia, 86 kg) and Akguel (Turkey, 125 kg) arevery strong with the gut wrench while Khinchegashvili(Georgia, 57 kg) does not prefer this technique. Snyder(United States, 97 kg) is the specialist for “push out” techni-ques and Yazdani (Iran, 74 kg) is versatile besides leg attackswith ankle lace and take downs.
With a look at the technical structure within theOlympic cycle 2012–2016, it becomes clear that legattacks are the dominant techniques with a rule-driven
increase since 2013 (see Figure 16). Take downs, gutwrench, and counter also belonged to the most importanttechniques with different peaks in the different years.Overall, there is a high technical–tactical versatility inthe cycle 2012–2016.
ANALYSIS OF THE RIO OLYMPIC GAMES 2016 INWOMEN’S FREESTYLE
Country-Specific Aspects
In women’s freestyle wrestling, Japan was once againthe measure of all things with 49 nation points. The
OG 12 WC 13 WC 15 OG 16
WQ 1.12 1.53 1.55 1.59
neg. WQ 0.25 0.33 0.28 0.32
index 0.87 1.29 1.27 1.27
0
0.2
0.4
0.6
0.8
1
1.2
1.4
1.6
1.8
WQ
(p
ts./
min
)
Wrestling performance of champions
Olympic cycle 2012 - 2016 FS
FIGURE 10 Comparison of the wrestling efficacy during the Olympic cycle 2012 and 2016 FS. FS = men’s freestyle.
total 57 kg 65 kg 74 kg 86 kg 97 kg 125 kg
WQ 1.59 0.88 2.25 2.23 1.3 1.17 1.71
0
0.5
1
1.5
2
2.5
WQ
(p
ts./
min
)
Attack efficacy of champions
OG 2016 FS
FIGURE 11 Attack efficacy of the Rio Olympic champions in freestyle wrestling. FS = men’s freestyle.
96 TÜNNEMANN AND CURBY
women from Russia and Kazakhstan were also verystrong. Congratulations also to the success ofAzerbaijan, China, and the United States, followed bySweden, Canada, Belarus, Poland, and Turkey (seeFigure 17).
The comparison with the Olympic Games in Londonshows the enormous performance increase of Japan,Kazakhstan, the United States, Sweden, Turkey, andIndia while, in particular, Canada had to suffer losses(see Figure 18). In this evaluation, however, it must betaken into account that two weight classes were addi-tionally carried out in Women’s Freestyle Wrestling inRio.
State of Performance and Development of Women’sFreestyle Wrestling
In general, we note a dynamic development of the attack beha-vior in women’s freestyle wrestling during the Olympic Cycle2012–2016 (See Figure 19). With 1.4 points per minutewomen’s freestyle wrestling is almost going down to the levelof the Olympic Games 2012 in London. This is the level beforethe 2013 rule changes and a loss of one point per minute incomparison to theWorld Championships 2015 in Las Vegas!! Inaddition, it should be noted that the technical assessments havebeen significantly increased in connection with the rule changesmade during the Olympic cycle. It is a serious reference for the
total 57 kg 65 kg 74 kg 86 kg 97 kg 125 kg
neg, WQ -0.32 -0.47 -0.47 -0.41 -0.05 -0.33 -0.11
-0.5
-0.45
-0.4
-0.35
-0.3
-0.25
-0.2
-0.15
-0.1
-0.05
0
ne
g.
WQ
Defense efficacy of winner in FS
OG 2016
neg, WQ
FIGURE 12 Defense abilities of the Olympic champions 2016 FS. FS = men’s freestyle.
57 kg 65 kg 74 kg 86 kg 97 kg 125 kg
WQ 0.88 2.25 2.23 1.3 1.17 1.71
neg. WQ 0.54 0.47 0.41 0.05 0.33 0.11
perf. Index 0.34 1.78 1.82 1.25 0.84 1.6
0
0.5
1
1.5
2
2.5
WQ
an
d n
eg
. W
Q
Wrestling efficacy winner FS
OG 2016
WQ neg. WQ perf. Index
FIGURE 13 Wrestling performance of the Olympic champions 2016 FS. FS = men’s freestyle.
SCORING ANALYSIS FROM THE 2016 RIO OLYMPIC GAMES 97
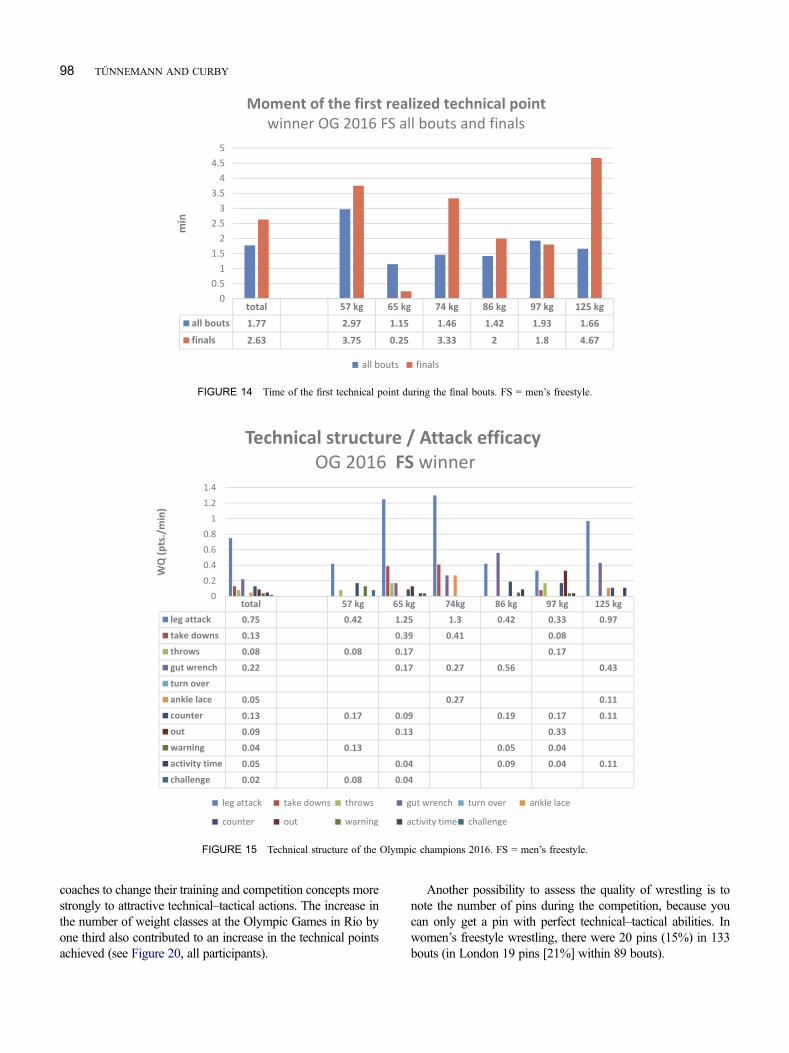
coaches to change their training and competition concepts morestrongly to attractive technical–tactical actions. The increase inthe number of weight classes at the Olympic Games in Rio byone third also contributed to an increase in the technical pointsachieved (see Figure 20, all participants).
Another possibility to assess the quality of wrestling is tonote the number of pins during the competition, because youcan only get a pin with perfect technical–tactical abilities. Inwomen’s freestyle wrestling, there were 20 pins (15%) in 133bouts (in London 19 pins [21%] within 89 bouts).
total 57 kg 65 kg 74 kg 86 kg 97 kg 125 kg
all bouts 1.77 2.97 1.15 1.46 1.42 1.93 1.66
finals 2.63 3.75 0.25 3.33 2 1.8 4.67
0
0.5
1
1.5
2
2.5
3
3.5
4
4.5
5
min
Moment of the first realized technical point
winner OG 2016 FS all bouts and finals
all bouts finals
FIGURE 14 Time of the first technical point during the final bouts. FS = men’s freestyle.
total 57 kg 65 kg 74kg 86 kg 97 kg 125 kg
leg attack 0.75 0.42 1.25 1.3 0.42 0.33 0.97
take downs 0.080.410.390.13
throws 0.170.170.080.08
gut wrench 0.430.560.270.170.22
turn over
ankle lace 0.110.270.05
counter 0.13 0.17 0.09 0.19 0.17 0.11
out 0.330.130.09
warning 0.040.050.130.04
activity time 0.110.040.090.040.05
challenge 0.02 0.08 0.04
0
0.2
0.4
0.6
0.8
1
1.2
1.4
WQ
(p
ts./
min
)
Technical structure / Attack efficacy
OG 2016 FS winner
leg attack take downs throws gut wrench turn over ankle lace
counter out warning activity time challenge
FIGURE 15 Technical structure of the Olympic champions 2016. FS = men’s freestyle.
98 TÜNNEMANN AND CURBY

Combat Behavior of the Nations
With the performance index, you can well describe thetechnical–tactical abilities of a given nation or athlete. Inthis case, the points achieved will be set in relation to thepoints given away to the opponent (see Figure 21).
We see in Figure 22 the absolute technical–tactical super-iority of the female athletes from Japan, Sweden, and the
United States, followed by Azerbaijan, Russia, and China.The coaches from Tunisia, Poland, Turkey, and Canadashould go deeper into the analysis because of their negativevalues. This also becomes clear if we look at the quality ofwrestling in 2016 and 2012. We see Japan increased theirbest values from 2012, a great step forward for the UnitedStates and Sweden concerning the quality of wrestling,
leg attacktake
downthrows
gut
wrenchturn over
ankle
lacecounter out warning challenge
activity
time
WC 11 0.49 0.13 0.02 0.08 0.08 0.13 0.08
WC 13 0.64 0.29 0.02 0.07 0.16 0.24 0.07 0.02 0.04
WC 14 0.74 0.12 0.11 0.38 0.12 0.06 0.18 0.04 0.05 0.03
WC 15 0.10.060.150.110.020.10.050.190.74
OG 16 0.75 0.13 0.08 0.22 0.05 0.13 0.09 0.04 0.02 0.05
0
0.1
0.2
0.3
0.4
0.5
0.6
0.7
0.8
WQ
(p
ts./
min
)
Technical structure / Attack efficacy FS (winner)
WC 2011, 2013, 2014,2015 and OG 2016
FIGURE 16 Comparison of the technical structure during the Olympic cycle 2012 and 2016. FS = men’s freestyle.
JPN RUS KAZ AZE CHN USA SWE CAN BLR POL TUR IND BUL TUN
OG 2016 49 32 31 23 22 22 17 16 15 14 12 9 8 8
0
10
20
30
40
50
60
Pts.
The best Nations FW
UWW ranking
FIGURE 17 The most successful nations in women’s freestyle wrestling in Rio. FS = men’s freestyle.
SCORING ANALYSIS FROM THE 2016 RIO OLYMPIC GAMES 99

while Azerbaijan, Kazakhstan, Poland, and Bulgaria suf-fered losses since 2012.
If we take a deeper look into the quality, we can see thereasons for the technical-tactical advantages and disadvantagesof various nations (see Figure 23).
An examination of the attack efficacy makes it clear thatJapan, China, Sweden, and the United States are in frontconcerning this factor. Kazakhstan, especially, has reserves
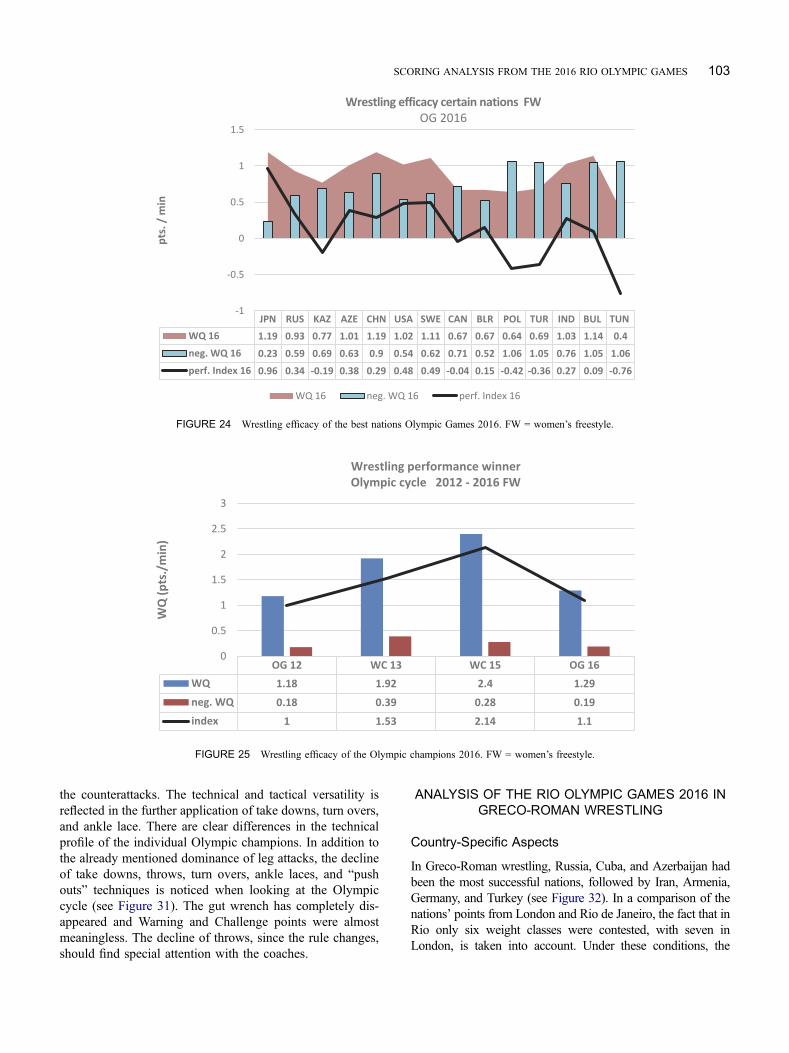
in the quality of attacks because they lost their good attackbehavior from 2012. The overall technical and tactical per-formance also depends on the quality of the defense cap-ability. In this regard, apart from Japan, we see majorweaknesses in many countries in 2016 (see Figure 24).The Japanese ladies are extremely stable in the attacks oftheir opponents. Japan is the only country that can point to astable balance with both the best attack scores (1.19) and the
JPN RUS KAZ AZE CHN USA SWE CAN BLR POL TUR IND BUL TUN
OG 2016 49 32 31 23 22 22 17 16 15 14 12 9 8 8
OG 2012 30 24 8 17 15 8 7 23 9 10 0 0 9 3
0
10
20
30
40
50
60P
ts.
The best Nations FW
UWW ranking
Comparison OG 2016 and OG 2012
OG 2016 OG 2012
FIGURE 18 Comparison of the best nations 2012 and 2016. FS = men’s freestyle.
2001 2002 2003 2004 2005 2006 2007 2008 2009 2010 2011 2012 2013 2014 2015 2016
WQ - GR 1.2 0.9 0.9 0.9 2.4 1.7 1.7 1.6 1.1 0.9 0.8 0.8 1.4 1 1.3 1.3
WQ - FS 1.1 1 1.2 1 1.2 1.4 1.3 1.1 1.1 1.2 1.2 1.1 1.5 1.8 1.6 1.6
WQ - FW 1.5 1.2 1.5 1.4 1.7 1.9 1.6 1.7 1.4 1.7 1.6 1.2 1.9 1.3 2.4 1.4
0
0.5
1
1.5
2
2.5
3
WQ
(p
ts./
min
)
World top performance 2001 - 2016
winner in GR, FS and FW
World Championships and Olympic Games
WQ - GR WQ - FS WQ - FW
change rules
change rules
FIGURE 19 Development of the three wrestling disciplines since 2001. FS = men’s freestyle.
100 TÜNNEMANN AND CURBY

best defense scores (0.23). With a better defensive perfor-mance, countries such as China, Kazakhstan, Canada,Poland, and Turkey could realize better results.
Combat Behavior of the Winners
We consider a different picture concerning the performanceindex, which describes the technical–tactical abilities of thewinners (see Figure 25). As already described, we had arule-driven positive performance increase in the Olympiccycle 2012–2016, in particular, with regard to attack beha-vior. But there is a significant decline in the Olympic Gamesin Rio while the defensive capability of the winnersremained at a high level in the cycle.
If we have a look at the attack efficacy, the dominatingroles of Helen Maroulis (USA, 53 kg), Risako Kawai (Japan,63 kg), Sara Dosho (Japan, 69 kg), and Kaori Icho (Japan, 58kg)—the four-time Olympic champion—becomes evident forthe Olympic Games 2016 (see Figure 26). During the 2012Olympic Games, the heavyweight wrestler Natalya Vorobievawas the best attacker with 1.56 points per minute; in Rio, thesame best value was reached by Helen Maroulis.
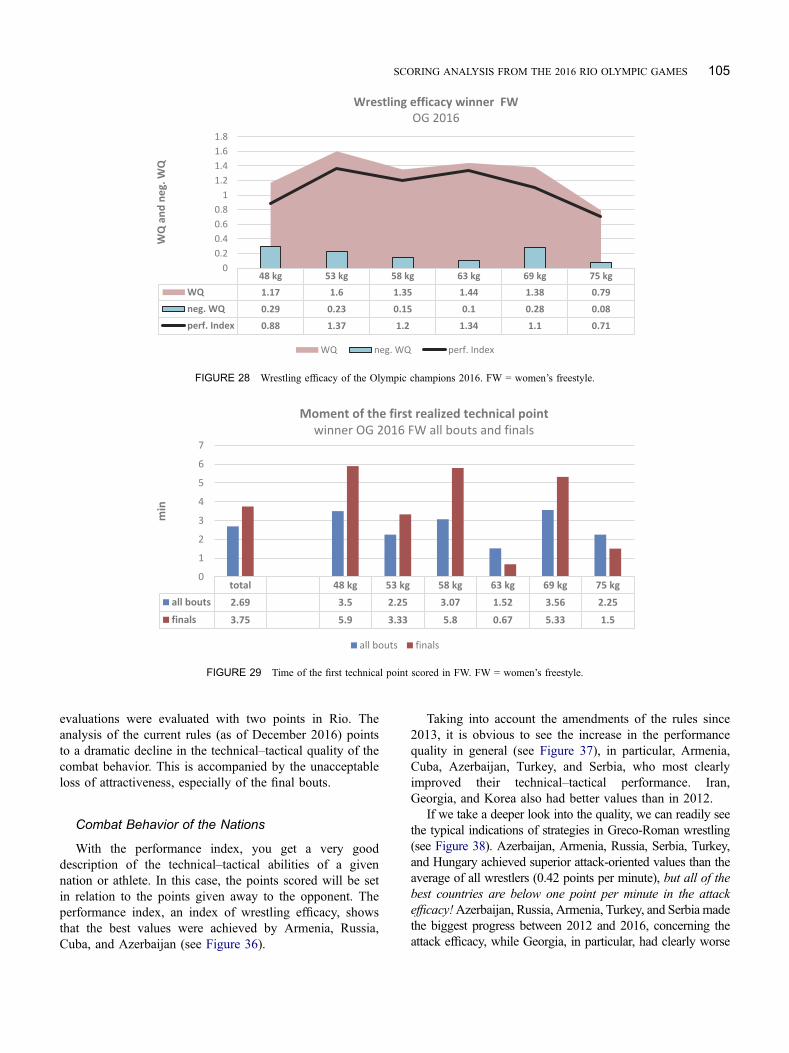
In Figure 27, we can see the unbelievable defensivestability of all female champions. The average value is0.19, which is lower than in London with 0.22.Summarizing the wrestling efficacy, all women Olympicchampions have demonstrated excellent performances (seeFigure 28). Especially, Helen Maroulis (1.37), Risako
0
100
200
300
400
500
600
700
London 2012 Rio 2016
Pts.
Quality of points Women's Freestyle FW (all participants)
Olympic Games 2012 and 2016
5 pts
4 pts
3 pts
2 pts
1 pt
bouts: 155 Pts: 1010
bouts: 133 Pts.: 1140
Pts/bt: 8.6
FIGURE 20 Quality of points Rio FW (all participants). FW = women’s freestyle.
JPN RUS KAZ AZE CHN USA SWE CAN BLR POL TUR IND BUL TUN
perf. Index 16 0.96 0.34 -0.19 0.38 0.29 0.48 0.49 -0.04 0.15 -0.42 -0.36 0.27 0.09 -0.76
-1
-0.8
-0.6
-0.4
-0.2
0
0.2
0.4
0.6
0.8
1
1.2
WQ
- n
eg
. W
Q
The best Nations FW
performance Index OG 2016
perf. Index 16
FIGURE 21 Wrestling efficacy of the best nations in women’s freestyle in Rio. FW = women’s freestyle.
SCORING ANALYSIS FROM THE 2016 RIO OLYMPIC GAMES 101

Kawai (1.34), and Kaori Icho (1.2) had the best technical–tactical performances during the Olympic Games in Rio.
It is very important for the coaches to analyze the tech-nical–tactical structure of the winners. Then they can com-pare the technical capacity of their athletes with the topathletes of the weight class. It is also very important forthe planning of the technical-training process as well as forthe training concepts of the promising young talents.
As in the Greco-Roman wrestling and men’s freestylewrestling, the women’s freestyle wrestlers are also startingtheir final bouts with a “safe strategy” (see Figure 29). In thefinal bouts for a gold medal, this tendency of the relatively latefirst-point realization is clear (average after 3.75minutes). This
is especially true for Eri Tosaka (Japan, 48 kg), Sara Dosho(Japan, 69 kg), and Kaori Icho (Japan, 58 kg). They scoredtheir first technical point in the grand finale during the lastminute of the bout but after the scoring of an activity point.This seemed to be a typical “Japanese strategy” in Rio, and itbears witness to the tremendous physical, psychological, andtechnical–tactical strength of the Japanese women. This isunderpinned by the fact that both Eri Tosaka and Kaori Ichomade their victory points in the final 10 seconds of the bout,after they had been behind in points.
As with the men’s freestyle wrestling, the women’s wres-tling bouts are dominated by leg attacks (see Figure 30). It isinteresting but understandable because of the high value of
JPN RUS KAZ AZE CHN USA SWE CAN BLR POL TUR IND BUL TUN
perf. Index 16 0.96 0.34 -0.19 0.38 0.29 0.48 0.49 -0.04 0.15 -0.42 -0.36 0.27 0.09 -0.76
perf. Index 12 0.72 0.3 0.24 0.83 0.09 -0.3 0.1 0.1 0.08 0.23 0.32
-1
-0.5
0
0.5
1
1.5
WQ
- n
eg
. W
Q
The best nations FW
comparison performance index OG 2016 and OG 2012
perf. Index 16 perf. Index 12
FIGURE 22 Comparison of the wrestling efficacy 2016 and 2012. FW = women’s freestyle.
JPN RUS KAZ AZE CHN USA SWE CAN BLR POL TUR IND BUL TUN
WQ 16 1.19 0.93 0.77 1.01 1.19 1.02 1.11 0.67 0.67 0.64 0.69 1.03 1.14 0.4
WQ 12 1.02 0.89 1.09 1.04 0.86 0.49 0.74 0.71 0.61 0.76 0.64
0
0.2
0.4
0.6
0.8
1
1.2
1.4
WQ
(p
ts./
min
)
Attack efficacy of the best nations FW
Comparison attack efficacy OG 2016 and OG 2012
WQ 16 WQ 12
FIGURE 23 Attack efficacy Olympic Games 2012 and 2016 FW. FW = women’s freestyle.
102 TÜNNEMANN AND CURBY
the counterattacks. The technical and tactical versatility isreflected in the further application of take downs, turn overs,and ankle lace. There are clear differences in the technicalprofile of the individual Olympic champions. In addition tothe already mentioned dominance of leg attacks, the declineof take downs, throws, turn overs, ankle laces, and “pushouts” techniques is noticed when looking at the Olympiccycle (see Figure 31). The gut wrench has completely dis-appeared and Warning and Challenge points were almostmeaningless. The decline of throws, since the rule changes,should find special attention with the coaches.
ANALYSIS OF THE RIO OLYMPIC GAMES 2016 INGRECO-ROMAN WRESTLING
Country-Specific Aspects
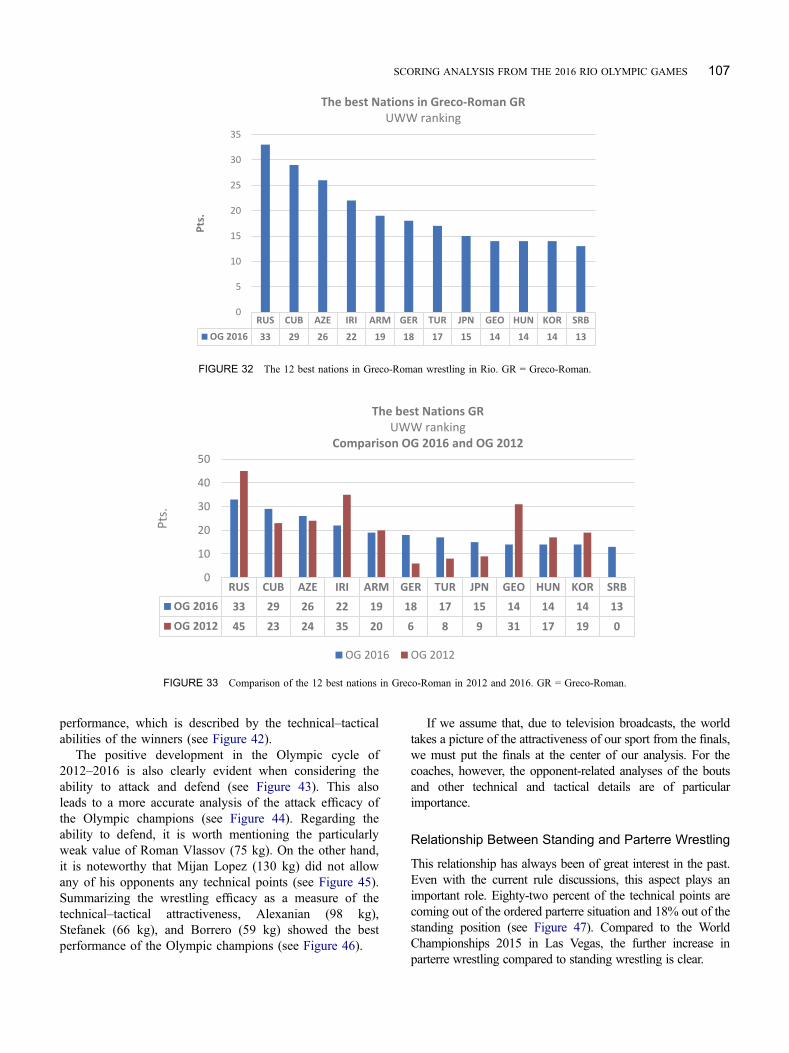
In Greco-Roman wrestling, Russia, Cuba, and Azerbaijan hadbeen the most successful nations, followed by Iran, Armenia,Germany, and Turkey (see Figure 32). In a comparison of thenations’ points from London and Rio de Janeiro, the fact that inRio only six weight classes were contested, with seven inLondon, is taken into account. Under these conditions, the
JPN RUS KAZ AZE CHN USA SWE CAN BLR POL TUR IND BUL TUN
WQ 16 1.19 0.93 0.77 1.01 1.19 1.02 1.11 0.67 0.67 0.64 0.69 1.03 1.14 0.4
neg. WQ 16 0.23 0.59 0.69 0.63 0.9 0.54 0.62 0.71 0.52 1.06 1.05 0.76 1.05 1.06
perf. Index 16 0.96 0.34 -0.19 0.38 0.29 0.48 0.49 -0.04 0.15 -0.42 -0.36 0.27 0.09 -0.76
-1
-0.5
0
0.5
1
1.5
pts.
/ m
in
Wrestling efficacy certain nations FW
OG 2016
WQ 16 neg. WQ 16 perf. Index 16
FIGURE 24 Wrestling efficacy of the best nations Olympic Games 2016. FW = women’s freestyle.
OG 12 WC 13 WC 15 OG 16
WQ 1.18 1.92 2.4 1.29
neg. WQ 0.18 0.39 0.28 0.19
index 1 1.53 2.14 1.1
0
0.5
1
1.5
2
2.5
3
WQ
(p
ts./
min
)
Wrestling performance winner
Olympic cycle 2012 - 2016 FW
FIGURE 25 Wrestling efficacy of the Olympic champions 2016. FW = women’s freestyle.
SCORING ANALYSIS FROM THE 2016 RIO OLYMPIC GAMES 103

increase in the performance of Germany, Turkey, Japan, andSerbia must be emphasized since London (see Figure 33).Russia, Iran, and Georgia could not repeat their extremelygood performances from London in Rio.
Qualitative Analysis of Combat Behavior
State of Performance and Development of Greco-Roman Wrestling
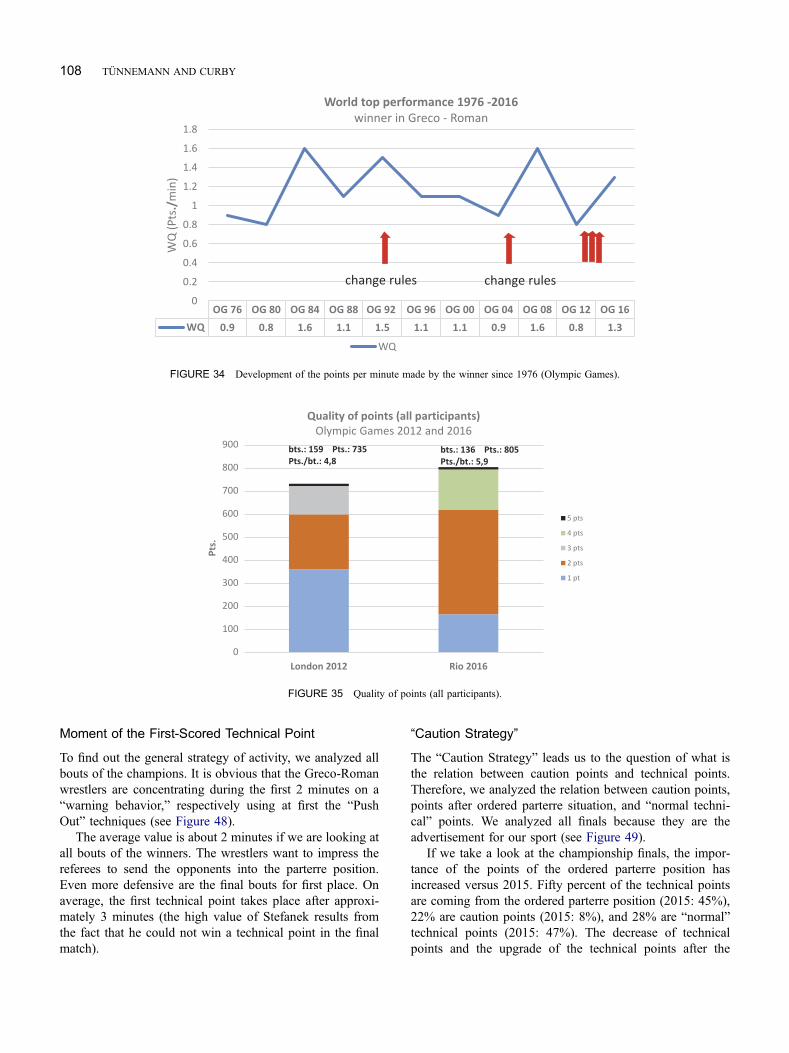
The number of pins can be used as an indicator of thetechnical and tactical quality of wrestling. The pin is ademanding and attractive technical and tactical action.Indeed, we had in London in Greco-Roman wrestling onlytwo pins (2%). The first indication of increased quality of
technical and tactical performance after the 2013 ruleschanges is found at the Olympic Games in Rio, where thenumber of pins totaled eight (5.9%) and the number of boutswith technical superiority was 30 (22%). The next indica-tion of increased quality of the Greco-Roman wrestling atthe Olympic Games in Rio is given by the technical pointsper minute. During the Olympic Games in London, we hadthe deepest value of this quality factor since the games in1980. The quality increase during the games in Rio isclearly a result of extensive rule changes (see Figure 34).
The increase in the technical points achieved per boutfrom 4.8 (London) to 5.9 (Rio) is also indicative of qualityimprovement of Greco-Roman wrestling in this Olympiccycle (see Figure 35). It must, of course, be taken intoaccount that, in principle, previous technical one-point
total 48 kg 53 kg 58 kg 63 kg 69 kg 75 kg
WQ 1.29 1.17 1.6 1.35 1.44 1.38 0.79
0
0.2
0.4
0.6
0.8
1
1.2
1.4
1.6
1.8
WQ
(p
ts./
min
)
Attack efficacy of winners
OG 2016 FW
FIGURE 26 Attack efficacy of the Olympic Champions 2016 FW. FW = women’s freestyle.
total 48 kg 53 kg 58 kg 63 kg 69 kg 75 kg
neg, WQ -0.19 -0.29 -0.23 -0.15 -0.1 -0.28 -0.08
-0.35
-0.3
-0.25
-0.2
-0.15
-0.1
-0.05
0
ne
g.
WQ
Defense efficacy winner FW
OG 2016
neg, WQ
FIGURE 27 Defensive efficacy of the Olympic champions 2016. FW = women’s freestyle.
104 TÜNNEMANN AND CURBY
evaluations were evaluated with two points in Rio. Theanalysis of the current rules (as of December 2016) pointsto a dramatic decline in the technical–tactical quality of thecombat behavior. This is accompanied by the unacceptableloss of attractiveness, especially of the final bouts.
Combat Behavior of the Nations
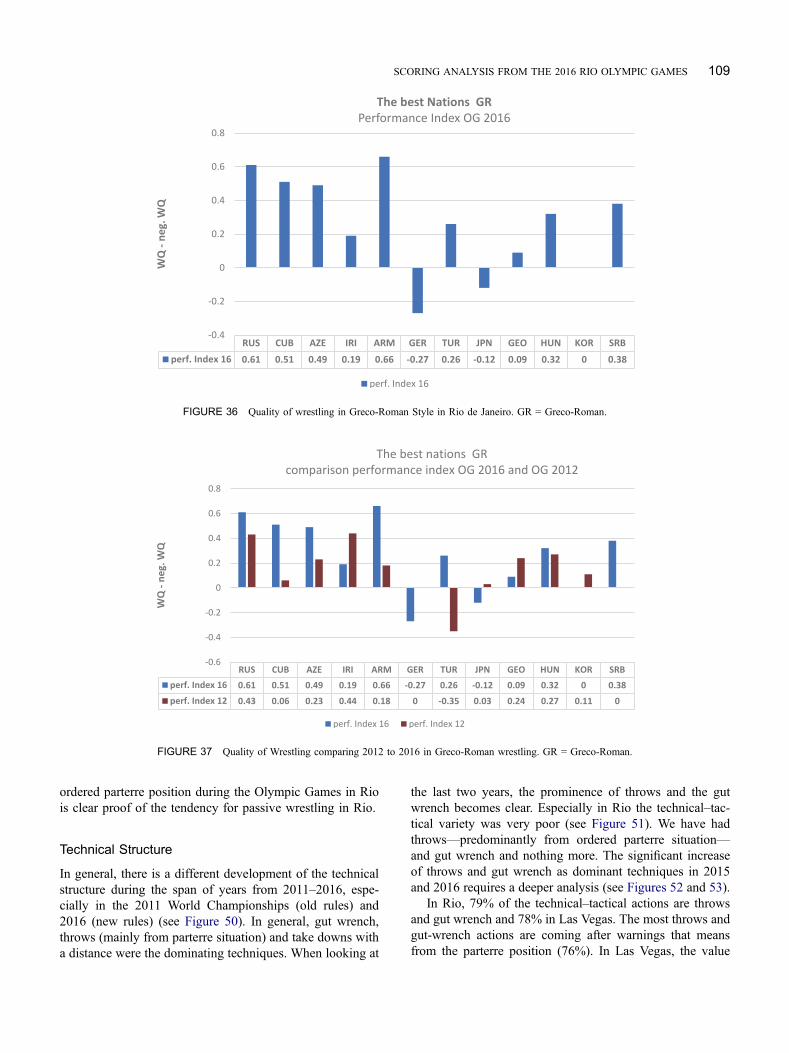
With the performance index, you get a very gooddescription of the technical–tactical abilities of a givennation or athlete. In this case, the points scored will be setin relation to the points given away to the opponent. Theperformance index, an index of wrestling efficacy, showsthat the best values were achieved by Armenia, Russia,Cuba, and Azerbaijan (see Figure 36).
Taking into account the amendments of the rules since2013, it is obvious to see the increase in the performancequality in general (see Figure 37), in particular, Armenia,Cuba, Azerbaijan, Turkey, and Serbia, who most clearlyimproved their technical–tactical performance. Iran,Georgia, and Korea also had better values than in 2012.
If we take a deeper look into the quality, we can readily seethe typical indications of strategies in Greco-Roman wrestling(see Figure 38). Azerbaijan, Armenia, Russia, Serbia, Turkey,and Hungary achieved superior attack-oriented values than theaverage of all wrestlers (0.42 points per minute), but all of thebest countries are below one point per minute in the attackefficacy!Azerbaijan, Russia, Armenia, Turkey, and Serbia madethe biggest progress between 2012 and 2016, concerning theattack efficacy, while Georgia, in particular, had clearly worse
48 kg 53 kg 58 kg 63 kg 69 kg 75 kg
WQ 1.17 1.6 1.35 1.44 1.38 0.79
neg. WQ 0.29 0.23 0.15 0.1 0.28 0.08
perf. Index 0.88 1.37 1.2 1.34 1.1 0.71
0
0.2
0.4
0.6
0.8
1
1.2
1.4
1.6
1.8
WQ
an
d n
eg
. W
Q
Wrestling efficacy winner FW
OG 2016
WQ neg. WQ perf. Index
FIGURE 28 Wrestling efficacy of the Olympic champions 2016. FW = women’s freestyle.
total 48 kg 53 kg 58 kg 63 kg 69 kg 75 kg
all bouts 2.69 3.5 2.25 3.07 1.52 3.56 2.25
finals 3.75 5.9 3.33 5.8 0.67 5.33 1.5
0
1
2
3
4
5
6
7
min
Moment of the first realized technical point
winner OG 2016 FW all bouts and finals
all bouts finals
FIGURE 29 Time of the first technical point scored in FW. FW = women’s freestyle.
SCORING ANALYSIS FROM THE 2016 RIO OLYMPIC GAMES 105

values (see Figure 39). Cuba, Armenia, Russia, and Georgia areamong the best “Defenders” (see Figure 40), while Japan,Germany, Korea, and Turkey show some problems with theirdefensive abilities.
Summarizing the wrestling efficacy of the Greco-Romanwrestlers (see Figure 41), we consider the best performancewrestlers to be from Armenia, Russia, Cuba, and Azerbaijanwhile Japan, Germany, and Korea had some problems with theirdefense abilities in comparison to the attack efficacy. Mostremarkable were the defense abilities of the wrestlers of Cuba
and Armenia. With a better performance of their defense, thewrestlers of Azerbaijan and Iran could be even more successful.
Combat Behavior of the Winner
Looking at the peak performances of the Olympic Gamessince 1976, the sharp rise since 2012 has been noticeable.(The aberration of the 2005 rule changes, which had led tothe high value of 2008, has already been described in otheranalyses). We consider a different picture concerning the
total 48 kg 53 kg 58 kg 63 kg 69 kg 75 kg
leg attack 0.50 0.30 0.50 0.30 1.00 0.50 0.30
take downs 0.13 0.39 0.20 0.17
throws 0.06 0.08 0.17 0.08
gut wrench
turn over 0.13 0.17 0.08 0.50 0.08
ankle lace 0.09 0.34 0.08 0.10
counter 0.25 0.34 0.35 0.20 0.30 0.33
out 0.02 0.04 0.04 0.04
warning
activity time 0.07 0.09 0.08 0.15 0.05 0.04 0.04
challenge 0.01 0.04
0.00
0.20
0.40
0.60
0.80
1.00
1.20
WQ
(p
ts./
min
)
Technical structure /Attack efficacy
OG 2016 FW winner
FIGURE 30 Technical structure of the winners in women’s freestyle. FW = women’s freestyle.
leg
attack
take
downthrows
gut
wrench
turn
over
ankle
lacecounter out
warnin
g
activity
time
challen
ge
WC 11 0.46 0.27 0.15 0.1 0.29 0.2 0.07
WC 13 0.53 0.38 0.32 0.12 0.23 0.3 0.02
WC 14 0.72 0.14 0.05 0.08 0.1 0.22 0.01 0.03 0.01
WC 15 0.79 0.28 0.20 0.10 0.11 0.36 0.38 0.01 0.04 0.04
OG 16 0.5 0.13 0.06 0.13 0.09 0.33 0.02 0.07 0.01
0
0.1
0.2
0.3
0.4
0.5
0.6
0.7
0.8
0.9
WQ
(p
ts./
min
)
Technical structure/ attack efficacy FW winner
WC 2011, 2013, 2014,2015 and 2016
FIGURE 31 Technical structure during the Olympic Cycle 2012–2016. FW = women’s freestyle.
106 TÜNNEMANN AND CURBY
performance, which is described by the technical–tacticalabilities of the winners (see Figure 42).
The positive development in the Olympic cycle of2012–2016 is also clearly evident when considering theability to attack and defend (see Figure 43). This alsoleads to a more accurate analysis of the attack efficacy ofthe Olympic champions (see Figure 44). Regarding theability to defend, it is worth mentioning the particularlyweak value of Roman Vlassov (75 kg). On the other hand,it is noteworthy that Mijan Lopez (130 kg) did not allowany of his opponents any technical points (see Figure 45).Summarizing the wrestling efficacy as a measure of thetechnical–tactical attractiveness, Alexanian (98 kg),Stefanek (66 kg), and Borrero (59 kg) showed the bestperformance of the Olympic champions (see Figure 46).
If we assume that, due to television broadcasts, the worldtakes a picture of the attractiveness of our sport from the finals,we must put the finals at the center of our analysis. For thecoaches, however, the opponent-related analyses of the boutsand other technical and tactical details are of particularimportance.
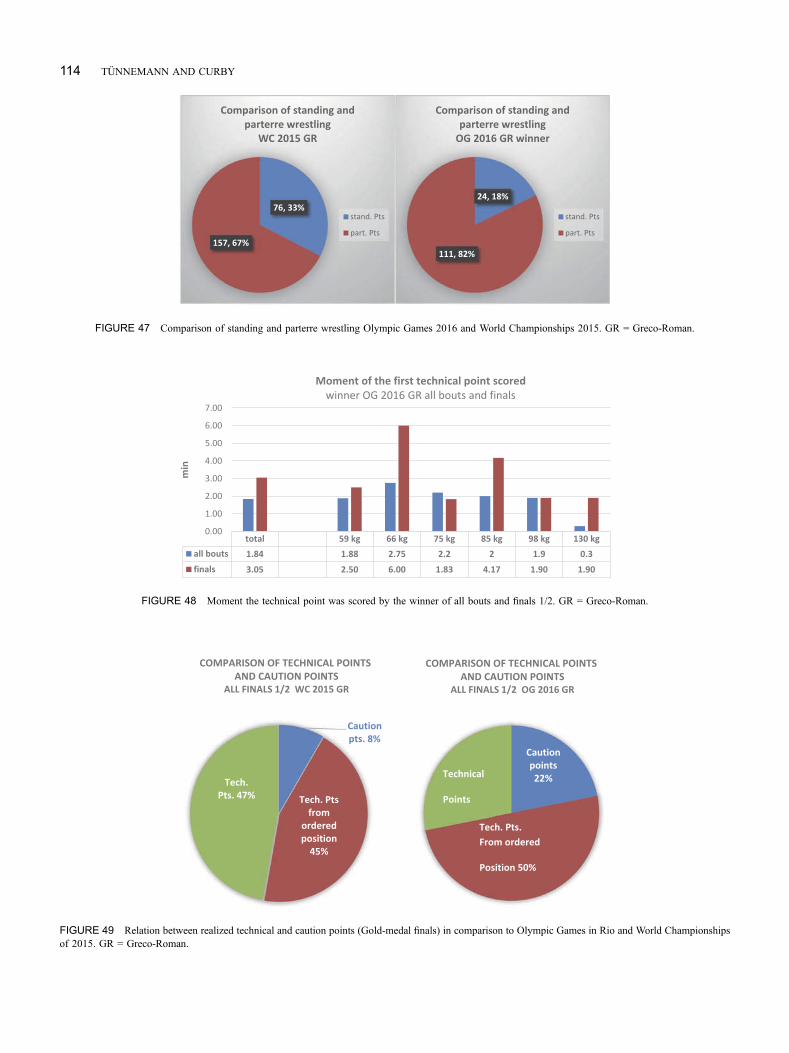
Relationship Between Standing and Parterre Wrestling
This relationship has always been of great interest in the past.Even with the current rule discussions, this aspect plays animportant role. Eighty-two percent of the technical points arecoming out of the ordered parterre situation and 18% out of thestanding position (see Figure 47). Compared to the WorldChampionships 2015 in Las Vegas, the further increase inparterre wrestling compared to standing wrestling is clear.
RUS CUB AZE IRI ARM GER TUR JPN GEO HUN KOR SRB
OG 2016 33 29 26 22 19 18 17 15 14 14 14 13
0
5
10
15
20
25
30
35
Pts.
The best Nations in Greco-Roman GR
UWW ranking
FIGURE 32 The 12 best nations in Greco-Roman wrestling in Rio. GR = Greco-Roman.
RUS CUB AZE IRI ARM GER TUR JPN GEO HUN KOR SRB
OG 2016 33 29 26 22 19 18 17 15 14 14 14 13
OG 2012 45 23 24 35 20 6 8 9 31 17 19 0
0
10
20
30
40
50
Pts.
The best Nations GR
UWW ranking
Comparison OG 2016 and OG 2012
OG 2016 OG 2012
FIGURE 33 Comparison of the 12 best nations in Greco-Roman in 2012 and 2016. GR = Greco-Roman.
SCORING ANALYSIS FROM THE 2016 RIO OLYMPIC GAMES 107
Moment of the First-Scored Technical Point
To find out the general strategy of activity, we analyzed allbouts of the champions. It is obvious that the Greco-Romanwrestlers are concentrating during the first 2 minutes on a“warning behavior,” respectively using at first the “PushOut” techniques (see Figure 48).
The average value is about 2 minutes if we are looking atall bouts of the winners. The wrestlers want to impress thereferees to send the opponents into the parterre position.Even more defensive are the final bouts for first place. Onaverage, the first technical point takes place after approxi-mately 3 minutes (the high value of Stefanek results fromthe fact that he could not win a technical point in the finalmatch).
“Caution Strategy”
The “Caution Strategy” leads us to the question of what isthe relation between caution points and technical points.Therefore, we analyzed the relation between caution points,points after ordered parterre situation, and “normal techni-cal” points. We analyzed all finals because they are theadvertisement for our sport (see Figure 49).
If we take a look at the championship finals, the impor-tance of the points of the ordered parterre position hasincreased versus 2015. Fifty percent of the technical pointsare coming from the ordered parterre position (2015: 45%),22% are caution points (2015: 8%), and 28% are “normal”technical points (2015: 47%). The decrease of technicalpoints and the upgrade of the technical points after the
OG 76 OG 80 OG 84 OG 88 OG 92 OG 96 OG 00 OG 04 OG 08 OG 12 OG 16
WQ 0.9 0.8 1.6 1.1 1.5 1.1 1.1 0.9 1.6 0.8 1.3
0
0.2
0.4
0.6
0.8
1
1.2
1.4
1.6
1.8
WQ
(P
ts./
min
)
World top performance 1976 -2016
winner in Greco - Roman
WQ
change rules change rules
FIGURE 34 Development of the points per minute made by the winner since 1976 (Olympic Games).
0
100
200
300
400
500
600
700
800
900
London 2012 Rio 2016
Pts.
Quality of points (all participants)
Olympic Games 2012 and 2016
5 pts
4 pts
3 pts
2 pts
1 pt
bts.: 159 Pts.: 735
Pts./bt.: 4,8
bts.: 136 Pts.: 805
Pts./bt.: 5,9
FIGURE 35 Quality of points (all participants).
108 TÜNNEMANN AND CURBY
ordered parterre position during the Olympic Games in Riois clear proof of the tendency for passive wrestling in Rio.
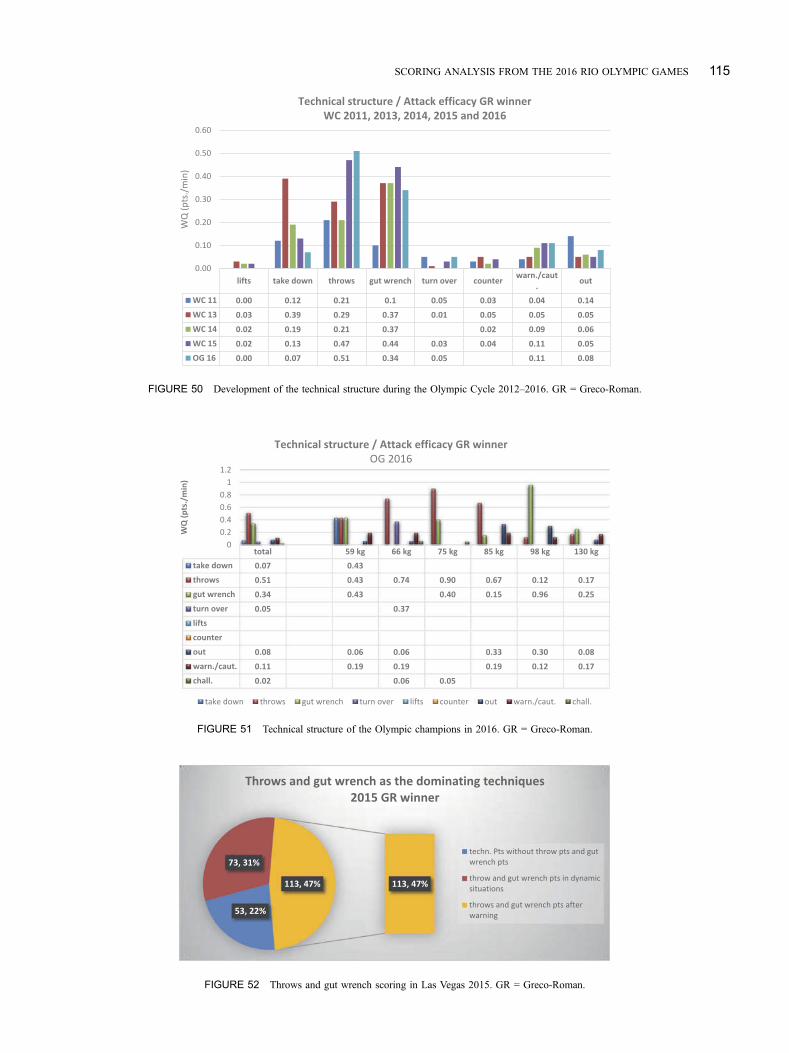
Technical Structure
In general, there is a different development of the technicalstructure during the span of years from 2011–2016, espe-cially in the 2011 World Championships (old rules) and2016 (new rules) (see Figure 50). In general, gut wrench,throws (mainly from parterre situation) and take downs witha distance were the dominating techniques. When looking at
the last two years, the prominence of throws and the gutwrench becomes clear. Especially in Rio the technical–tac-tical variety was very poor (see Figure 51). We have hadthrows—predominantly from ordered parterre situation—and gut wrench and nothing more. The significant increaseof throws and gut wrench as dominant techniques in 2015and 2016 requires a deeper analysis (see Figures 52 and 53).
In Rio, 79% of the technical–tactical actions are throwsand gut wrench and 78% in Las Vegas. The most throws andgut-wrench actions are coming after warnings that meansfrom the parterre position (76%). In Las Vegas, the value
RUS CUB AZE IRI ARM GER TUR JPN GEO HUN KOR SRB
perf. Index 16 0.61 0.51 0.49 0.19 0.66 -0.27 0.26 -0.12 0.09 0.32 0 0.38
-0.4
-0.2
0
0.2
0.4
0.6
0.8
WQ
- n
eg
. W
Q
The best Nations GR
Performance Index OG 2016
perf. Index 16
FIGURE 36 Quality of wrestling in Greco-Roman Style in Rio de Janeiro. GR = Greco-Roman.
RUS CUB AZE IRI ARM GER TUR JPN GEO HUN KOR SRB
perf. Index 16 0.61 0.51 0.49 0.19 0.66 -0.27 0.26 -0.12 0.09 0.32 0 0.38
perf. Index 12 0.43 0.06 0.23 0.44 0.18 0 -0.35 0.03 0.24 0.27 0.11 0
-0.6
-0.4
-0.2
0
0.2
0.4
0.6
0.8
WQ
- n
eg
. W
Q
The best nations GR
comparison performance index OG 2016 and OG 2012
perf. Index 16 perf. Index 12
FIGURE 37 Quality of Wrestling comparing 2012 to 2016 in Greco-Roman wrestling. GR = Greco-Roman.
SCORING ANALYSIS FROM THE 2016 RIO OLYMPIC GAMES 109
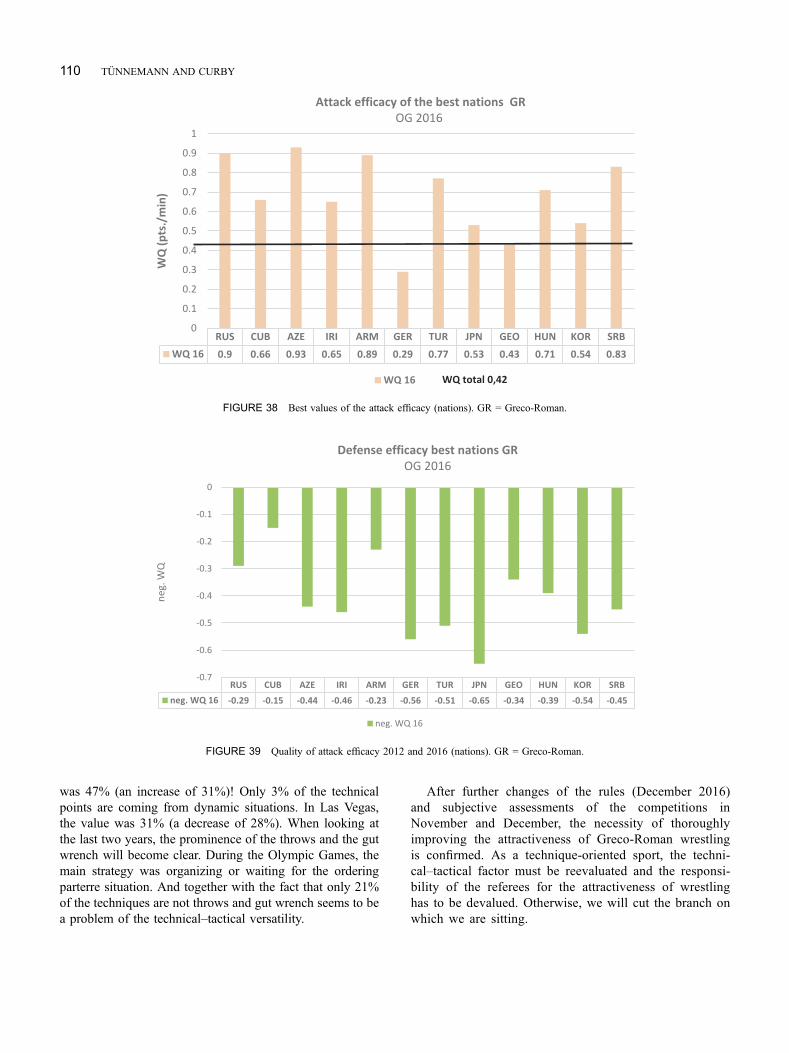
was 47% (an increase of 31%)! Only 3% of the technicalpoints are coming from dynamic situations. In Las Vegas,the value was 31% (a decrease of 28%). When looking atthe last two years, the prominence of the throws and the gutwrench will become clear. During the Olympic Games, themain strategy was organizing or waiting for the orderingparterre situation. And together with the fact that only 21%of the techniques are not throws and gut wrench seems to bea problem of the technical–tactical versatility.
After further changes of the rules (December 2016)and subjective assessments of the competitions inNovember and December, the necessity of thoroughlyimproving the attractiveness of Greco-Roman wrestlingis confirmed. As a technique-oriented sport, the techni-cal–tactical factor must be reevaluated and the responsi-bility of the referees for the attractiveness of wrestlinghas to be devalued. Otherwise, we will cut the branch onwhich we are sitting.
RUS CUB AZE IRI ARM GER TUR JPN GEO HUN KOR SRB
WQ 16 0.9 0.66 0.93 0.65 0.89 0.29 0.77 0.53 0.43 0.71 0.54 0.83
0
0.1
0.2
0.3
0.4
0.5
0.6
0.7
0.8
0.9
1
WQ
(p
ts./
min
)
Attack efficacy of the best nations GR
OG 2016
WQ 16 WQ total 0,42
FIGURE 38 Best values of the attack efficacy (nations). GR = Greco-Roman.
RUS CUB AZE IRI ARM GER TUR JPN GEO HUN KOR SRB
neg. WQ 16 -0.29 -0.15 -0.44 -0.46 -0.23 -0.56 -0.51 -0.65 -0.34 -0.39 -0.54 -0.45
-0.7
-0.6
-0.5
-0.4
-0.3
-0.2
-0.1
0
ne
g.
WQ
Defense efficacy best nations GR
OG 2016
neg. WQ 16
FIGURE 39 Quality of attack efficacy 2012 and 2016 (nations). GR = Greco-Roman.
110 TÜNNEMANN AND CURBY

RUS CUB AZE IRI ARM GER TUR JPN GEO HUN KOR SRB
WQ 16 0.9 0.66 0.93 0.65 0.89 0.29 0.77 0.53 0.43 0.71 0.54 0.83
WQ 12 0.69 0.46 0.63 0.66 0.48 0 0.23 0.6 0.76 0.6 0.54 0
0
0.1
0.2
0.3
0.4
0.5
0.6
0.7
0.8
0.9
1
WQ
(p
ts./
min
)
Attack efficacy of the best nations GR
Comparison attack efficacy OG 2016 and OG 2012
WQ 16 WQ 12
FIGURE 40 Best defense efficacy values in Greco-Roman in 2016. GR = Greco-Roman.
RUS CUB AZE IRI ARM GER TUR JPN GEO HUN KOR SRB
WQ 16 0.9 0.66 0.93 0.65 0.89 0.29 0.77 0.53 0.43 0.71 0.54 0.83
neg. WQ 16 0.29 0.15 0.44 0.46 0.23 0.56 0.51 0.65 0.34 0.39 0.54 0.45
perf. Index 16 0.61 0.51 0.49 0.19 0.66 -0.27 0.26 -0.12 0.09 0.32 0 0.38
-0.4
-0.2
0
0.2
0.4
0.6
0.8
1
pts.
/ m
in
Wrestling efficacy certain nations GR
OG 2016
WQ 16 neg. WQ 16 perf. Index 16
FIGURE 41 Wrestling efficacy of the 12 best nations in Greco-Roman wrestling 2016. GR = Greco-Roman.
SCORING ANALYSIS FROM THE 2016 RIO OLYMPIC GAMES 111
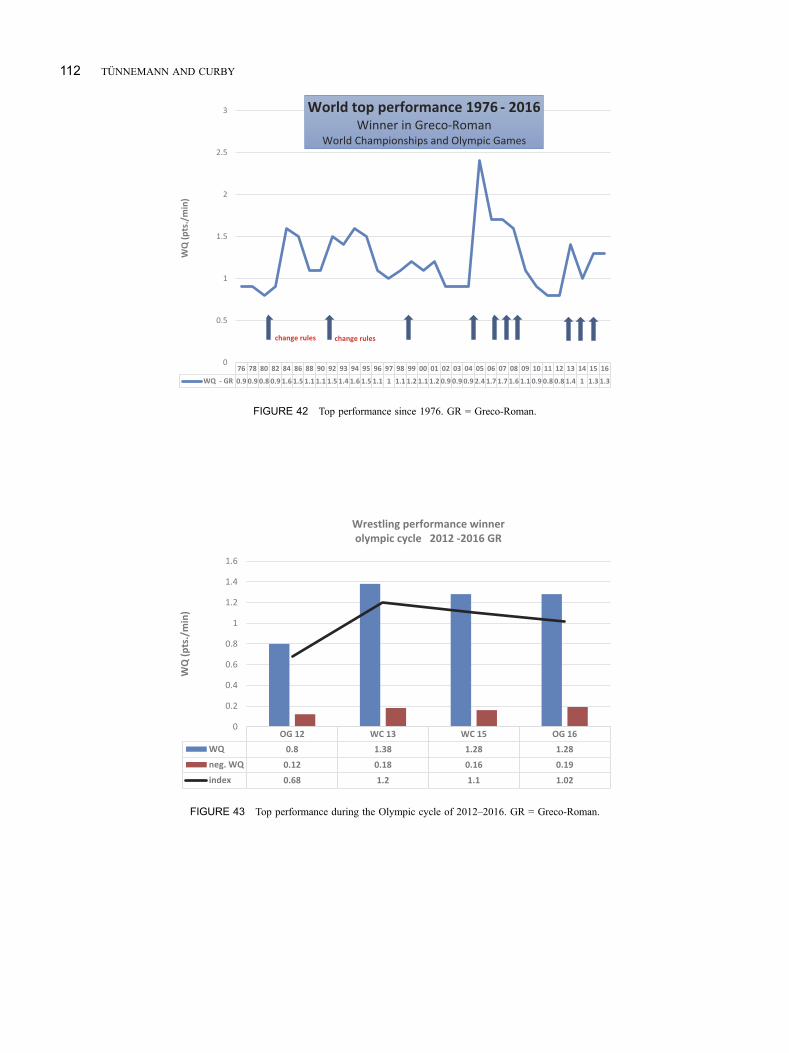
OG 12 WC 13 WC 15 OG 16
WQ 0.8 1.38 1.28 1.28
neg. WQ 0.12 0.18 0.16 0.19
index 0.68 1.2 1.1 1.02
0
0.2
0.4
0.6
0.8
1
1.2
1.4
1.6
WQ
(p
ts./
min
)
Wrestling performance winner
olympic cycle 2012 -2016 GR
FIGURE 43 Top performance during the Olympic cycle of 2012–2016. GR = Greco-Roman.
76 78 80 82 84 86 88 90 92 93 94 95 96 97 98 99 00 01 02 03 04 05 06 07 08 09 10 11 12 13 14 15 16
WQ - GR 0.9 0.9 0.8 0.9 1.6 1.5 1.1 1.1 1.5 1.4 1.6 1.5 1.1 1 1.1 1.2 1.1 1.2 0.9 0.9 0.9 2.4 1.7 1.7 1.6 1.1 0.9 0.8 0.8 1.4 1 1.3 1.3
0
0.5
1
1.5
2
2.5
3
WQ
(p
ts./
min
)
World top performance 1976 - 2016
Winner in Greco-Roman
World Championships and Olympic Games
change rules change rules
FIGURE 42 Top performance since 1976. GR = Greco-Roman.
112 TÜNNEMANN AND CURBY
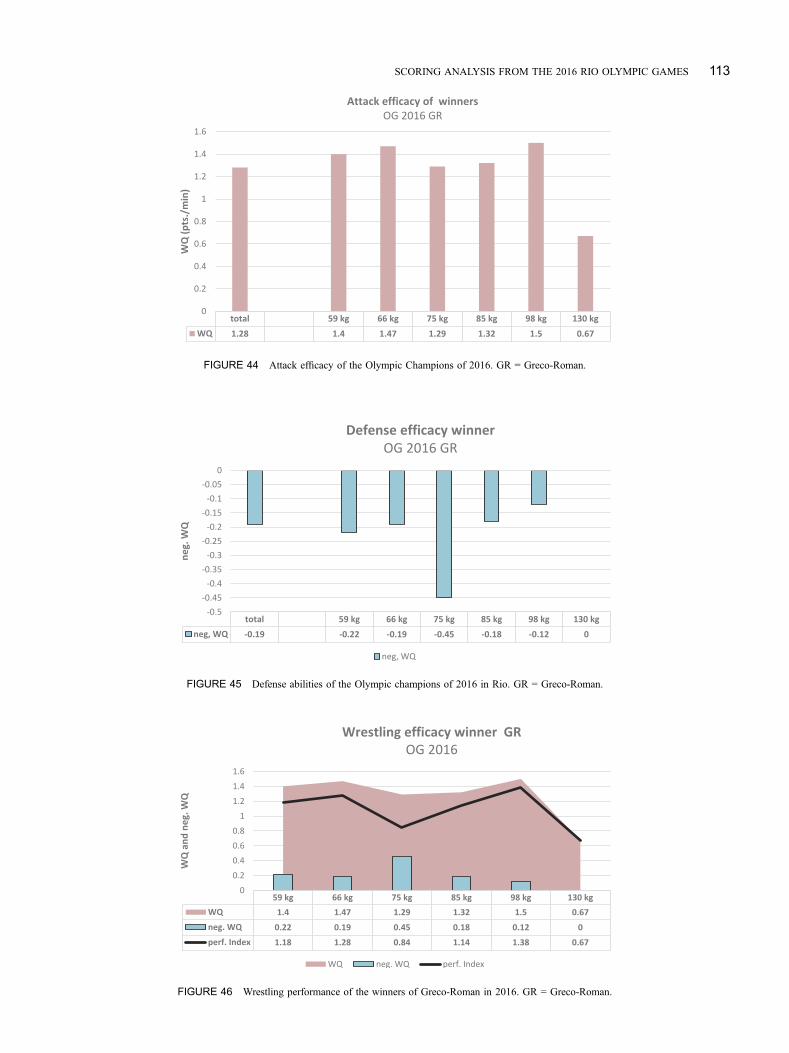
total 59 kg 66 kg 75 kg 85 kg 98 kg 130 kg
WQ 1.28 1.4 1.47 1.29 1.32 1.5 0.67
0
0.2
0.4
0.6
0.8
1
1.2
1.4
1.6
WQ
(p
ts./
min
)
Attack efficacy of winners
OG 2016 GR
FIGURE 44 Attack efficacy of the Olympic Champions of 2016. GR = Greco-Roman.
total 59 kg 66 kg 75 kg 85 kg 98 kg 130 kg
neg, WQ -0.19 -0.22 -0.19 -0.45 -0.18 -0.12 0
-0.5
-0.45
-0.4
-0.35
-0.3
-0.25
-0.2
-0.15
-0.1
-0.05
0
ne
g.
WQ
Defense efficacy winner
OG 2016 GR
neg, WQ
FIGURE 45 Defense abilities of the Olympic champions of 2016 in Rio. GR = Greco-Roman.
59 kg 66 kg 75 kg 85 kg 98 kg 130 kg
WQ 1.4 1.47 1.29 1.32 1.5 0.67
neg. WQ 0.22 0.19 0.45 0.18 0.12 0
perf. Index 1.18 1.28 0.84 1.14 1.38 0.67
0
0.2
0.4
0.6
0.8
1
1.2
1.4
1.6
WQ
an
d n
eg
. W
Q
Wrestling efficacy winner GR
OG 2016
WQ neg. WQ perf. Index
FIGURE 46 Wrestling performance of the winners of Greco-Roman in 2016. GR = Greco-Roman.
SCORING ANALYSIS FROM THE 2016 RIO OLYMPIC GAMES 113
76, 33%
157, 67%
Comparison of standing and
parterre wrestling
WC 2015 GR
stand. Pts
part. Pts
24, 18%
111, 82%
Comparison of standing and
parterre wrestling
OG 2016 GR winner
stand. Pts
part. Pts
FIGURE 47 Comparison of standing and parterre wrestling Olympic Games 2016 and World Championships 2015. GR = Greco-Roman.
total 59 kg 66 kg 75 kg 85 kg 98 kg 130 kg
all bouts 1.84 1.88 2.75 2.2 2 1.9 0.3
finals 3.05 2.50 6.00 1.83 4.17 1.90 1.90
0.00
1.00
2.00
3.00
4.00
5.00
6.00
7.00
min
Moment of the first technical point scored
winner OG 2016 GR all bouts and finals
FIGURE 48 Moment the technical point was scored by the winner of all bouts and finals 1/2. GR = Greco-Roman.
Caution
pts. 8%
Tech. Pts
from
ordered
position
45%
Tech.
Pts. 47%
COMPARISON OF TECHNICAL POINTS
AND CAUTION POINTS
ALL FINALS 1/2 WC 2015 GR
Caution
points
22%
COMPARISON OF TECHNICAL POINTS
AND CAUTION POINTS
ALL FINALS 1/2 OG 2016 GR
Tech. Pts.
From ordered
Position 50%
Technical
Points
FIGURE 49 Relation between realized technical and caution points (Gold-medal finals) in comparison to Olympic Games in Rio and World Championshipsof 2015. GR = Greco-Roman.
114 TÜNNEMANN AND CURBY
lifts take down throws gut wrench turn over counterwarn./caut
.out
WC 11 0.00 0.12 0.21 0.1 0.05 0.03 0.04 0.14
WC 13 0.03 0.39 0.29 0.37 0.01 0.05 0.05 0.05
WC 14 0.02 0.19 0.21 0.37 0.02 0.09 0.06
WC 15 0.02 0.13 0.47 0.44 0.03 0.04 0.11 0.05
OG 16 0.00 0.07 0.51 0.34 0.05 0.11 0.08
0.00
0.10
0.20
0.30
0.40
0.50
0.60
WQ
(p
ts./
min
)
Technical structure / Attack efficacy GR winner
WC 2011, 2013, 2014, 2015 and 2016
FIGURE 50 Development of the technical structure during the Olympic Cycle 2012–2016. GR = Greco-Roman.
total 59 kg 66 kg 75 kg 85 kg 98 kg 130 kg
take down 0.07 0.43
throws 0.51 0.43 0.74 0.90 0.67 0.12 0.17
gut wrench 0.34 0.43 0.40 0.15 0.96 0.25
turn over 0.05 0.37
lifts
counter
out 0.08 0.06 0.06 0.33 0.30 0.08
warn./caut. 0.11 0.19 0.19 0.19 0.12 0.17
chall. 0.02 0.06 0.05
0
0.2
0.4
0.6
0.8
1
1.2
WQ
(p
ts./
min
)
Technical structure / Attack efficacy GR winner
OG 2016
take down throws gut wrench turn over lifts counter out warn./caut. chall.
FIGURE 51 Technical structure of the Olympic champions in 2016. GR = Greco-Roman.
53, 22%
73, 31%
113, 47%113, 47%
Throws and gut wrench as the dominating techniques
2015 GR winner
techn. Pts without throw pts and gut
wrench pts
throw and gut wrench pts in dynamic
situations
throws and gut wrench pts after
warning
FIGURE 52 Throws and gut wrench scoring in Las Vegas 2015. GR = Greco-Roman.
SCORING ANALYSIS FROM THE 2016 RIO OLYMPIC GAMES 115

29, 21%
4, 3%
102, 76%102, 76%
Throws and gut wrench as the dominating techniques OG
2016 GR winner
techn. Pts without throw pts and gut
wrench pts
throw and gut wrench pts in dynamic
situations
throws and gut wrench pts after
warning
FIGURE 53 Throws and gut wrench as the dominating techniques in Rio. GR = Greco-Roman.
116 TÜNNEMANN AND CURBY