hart district council strategic flood risk assessment...hart district council strategic flood risk...
TRANSCRIPT
Hart District Council Strategic Flood
Risk Assessment December 2016
Hart District Council Strategic Flood Risk Assessment December 2016
Contents
1. Introduction 7
2. Study Area 9 2.1 Main Urban Areas 10 2.2 Infrastructure 10 2.3 Hydrology 11 2.4 Regional Geology 11 2.5 Topography 12
3. Policy and Local Context 14 3.1 National Policy 14 3.2 Local Context 15
4. SFRA Methodology 18 4.1 Description 18 4.2 Data Collection/processing 18 4.3 Stakeholders 18 4.4 Need for a Level 2 SFRA 20
5. Flooding From Rivers 21 5.1 Description 21 5.2 Data Collection 21 5.3 Historical Fluvial Flood Events 21 5.4 Assessing Flooding From Rivers 25 5.5 Discussion of Fluvial Flooding in Hart 27 5.6 Management of Fluvial Flooding in Hart 32 5.7 Planning Considerations 32
6. Flooding From Surface Water 33 6.1 Description 33 6.2 Data Collection 36 6.3 Historical Surface Water Flood Events 36 6.4 Assessing Flooding From Surface Water 38 6.5 Discussion of Surface Water Flooding in Hart 39 6.6 Planning Considerations 40
7. Flooding From Sewers 41 7.1 Description 41 7.2 Data Collection 43 7.3 Historic Sewer Flooding 43 7.4 Discussion of Sewer Flooding in Hart 49
8. Flooding From Groundwater 50 8.1 Description 50 8.2 Causes of high groundwater levels 50 Page intentionally blank 52 8.3 Impacts of groundwater flooding 53 8.4 Topography, geology and groundwater flooding 54 8.5 Data Collection 54 8.6 Assessing Flooding From Groundwater 55 8.7 Discussion of Groundwater Flooding in Hart 56 8.8 Climate Change 58 8.9 Management of Groundwater Flooding in Hart 58 8.10 Planning Considerations 58
9. Flooding from Artificial Sources 60 9.1 Description 60 9.2 Discussion of Flooding From Reservoirs in Hart 60 9.3 Discussion of Flooding From Canals in Hart 62 9.4 Management of Flooding From Artificial Sources in Hart 64 9.5 Planning Considerations 64
Hart District Council Strategic Flood Risk Assessment December 2016
10. Indicative Flood Problem Areas 66 10.1 Description 66 10.2 Data Collection 66
11. Causal Areas 73 11.1 Description of Causal Areas 73 11.2 Data Collection 73 11.3 Planning Considerations 77
12. Climate Change Allowances 78 12.1 Description 78 12.2 Environment Agency Best Practice Guidance 78 12.3 Applying Appropriate Climate Change Allowances in Hart 79 12.4 Determining Climate Change Allowances 79 12.5 Assessing the Impact of Climate Change Allowances in Hart 82 12.6 The Impact of Climate Change on Existing Development 86
13. Guidance on application of the Sequential and Exception Tests 88 13.1 Sequential Test 88 13.2 Exception Test 93
14. Site Specific FRA Guidance 96 14.1 Managing Flooding In New Development 96 14.2 Managing surface water runoff from new developments 97 14.3 The Sustainable Drainage System (SuDS) Approach 99 14.4 Flood Resistant and Resilient Design 107 14.5 Flood Hazard 108 14.6 Dry Islands 109
15. Emergency Planning & Flood Warning 111 15.1 Introduction 111 15.2 Emergency Planning 111 15.3 Flood Warning 111 15.4 Flood Warning Areas 113 15.5 Flood Alert Areas 113 15.6 Using Emergency Flood Plans in Planning Applications 115
16. Defences and Asset Management 116 16.1 Introduction 116 16.2 Defences 116 16.3 Maintenance 117 16.4 Works in or near a watercourse 118
17. Summary and Recommendations 119 17.1 Site Allocation Process 119 17.2 Council Policy 119 17.3 Emergency Planning 121 17.4 Future Updates of the SFRA 121
18. Glossary 123
19. Appendix 1 125
Tables Table 0.1 Responsibilities managing flood risk within Hart 4 Table 0.2 Statutory and/or non-statutory planning consultees for Flood
Risk Issues (Source: The Town & Country Planning (Development Management Procedure) (England) Order 2015 – Schedule 4) 5
Table 3.1 National Policies and guidance relevant to Hart and SFRAs 14 Table 3.2 Local level policy and guidance relevant to the SFRA 15 Table 3.3 Responsibilities for managing flood risk in Hart 16 Table 4.1 Key datasets collated for analysis 19 Table 5.1 Historic Flood events in Hart as captured in the previous SFRA 24 Table 5.2 Definitions of Flood Zones (Table 1, NPPG) 25 Table 5.3 SFRA fluvial flood zone mapping sources 30
Hart District Council Strategic Flood Risk Assessment December 2016
Table 5.4 Factors that increase fluvial flood risk in Hart 31 Table 6.1 General factors that increase surface water flood risk 34 Table 7.1 Causes of flooding from sewers 42 Table 8.1 Causes of high groundwater levels 51 Table 8.2 BGS susceptibility to groundwater flooding classifications 56 Table 9.1 Properties at risk from reservoir failure 60 Table 10.1 Performance of the uFMfSW against historic data 67 Table 10.2 Performance of the FMfSW against historic data 67 Table 11.1 Surface water flood risk in Hart (based on FMfSW) 73 Table 11.2 Groundwater flood risk in Hart (based on BGS susceptibility to
groundwater flooding) 75 Table 11.3 Fluvial risk based on the Environment Agency’s Flood Map for
Planning 76 Table 12.1 Climate change allowances as per development vulnerability
and flood zone 80 Table 12.2 Peak river flow allowances by river basin district (1961-1990
baseline) 80 Table 12.3 Peak rainfall intensities in small and urban catchments (1961-
1990 baseline) 81 Table 12.4 High ++ for peak river flows 81 Table 12.5 Indicative guides to an assessment approach for climate
change 85 Table 12.6 Comparison of properties within ‘current’ and ‘future’ Flood
Zone 3 86 Table 13.1 Flood Risk Vulnerability Classifications (NPPG, 2014) 90 Table 13.2 Flood Risk Vulnerability Classifications and Flood Zone
‘Compatibility’ (NPPG, 2014) 91 Table 14.1 Summary of SuDS Techniques and their Suitability to meet the
three goals of Sustainable Drainage 101 Table 14.2 Drainage summary map classifications 105 Table 14.3 Flood Hazard (source Table 13.1 of FD2320/TR2- extended
version) 109 Table 15.1 Environment Agency Flood Warnings 112 Table 15.2 River monitoring gauges in Hart 113 Table 16.1 Medium Term Plan 117 Table 17.1 Key policy recommendations 120
Figures Figure 1.1 Taking flood risk into account in Local Plan preparation (NPPG,
2014) 8 Figure 2.1 Study Area 9 Figure 2.2 Topography of Hart 13 Figure 5.1 Historic fluvial flood records across Hart 22 Figure 5.2 Fluvial flooding across Hart by flood event 23 Figure 5.3 Properties across Hart that fall within Flood Zone 3 28 Figure 5.4 Environment Agency Flood Maps for Planning 29 Figure 6.1 Factors that influence surface water flooding as per the source-
pathway-receptor model 33 Figure 6.2 Occurrences of surface water flooding across Hart 37 Figure 6.3 Surface water flooding across Hart by flood event 38 Figure 6.4 Properties at risk of surface water flooding according to the
Flood Map for Surface Water 39 Figure 7.1 Internal sewer flooding incidents in Hart 44 Figure 7.2 External sewer flooding incidents in Hart 45 Figure 7.3 Internal sewer flooding by postcode area 46 Figure 7.4 External sewer flooding by postcode area 47
Hart District Council Strategic Flood Risk Assessment December 2016
Figure 7.5 Foul flooding incidents reported to Hart District Council 48 Figure 8.1 Winter 2013/2014 reported groundwater flooding incidents 55 Figure 8.2 Areas susceptible to groundwater flooding 57 Figure 9.1 Key features of Fleet Pond Reservoir 62 Figure 9.2 Raised embankments along the Basingstoke Canal 63 Figure 10.1 Properties located in the uFMfSW and FMfSW 1 in 30 flood
extents 68 Figure 10.2 Properties in the FMfSW 1 in 200 extent vs. the uFMfSW 1 in
1000 extent 69 Figure 10.3 Mapped historic flood records against the FMfSW 70 Figure 10.4 Mapped historic flood records against the uFMfSW 70 Figure 12.1 Comparison of the 1 in 100 peak flow adjusted for each
climate change allowance with the existing 1 in 1000 modelled flow 83 Figure 13.1 Sequential Test Flow Chart 89 Figure 13.2 Application of the Exception Test for Local Plan Preparation
(NPPG Flood Risk and Coastal Change) 95 Figure 14.1 Infiltration SuDS suitability 106 Figure 14.2 Rationale for design strategies, improving flood performance of
new buildings: Flood Resilient Construction, CLG 2007 108 Figure 14.3 A dry island in Fleet 110 Figure 15.1 Direct river alarm and groundwater alerts at Crondall 114
Prepared By: Susanna Hope (Flood Risk Infrastructure Engineer, Hart District Council)
Amanda Dunn Principal Policy Planner (East Hampshire District Council on behalf of Hart District Council)
Hart District Council Strategic Flood Risk Assessment December 2016
1
Executive Summary Introduction This report is a Level 1 Strategic Flood Risk Assessment (SFRA) carried out by Hart District Council (HDC). The National Planning Policy Framework (NPPF) and associated National Planning Practice Guidance (NPPG) for Flood Risk and Coastal Change emphasise the active role Local Planning Authorities such as HDC should take to ensure that flood risk is understood and managed effectively and sustainably throughout all stages of the planning process. The NPPF outlines that Local Plans should be supported by a SFRA and Local Planning Authorities should use the findings to inform strategic land use planning. The purpose of a Level 1 SFRA is to collate and analyse the most up to date flood risk information for use by HDC to inform the preparation of robust planning documents as part of the upcoming HDC Local Plan. The Level 1 SFRA will also support prudent decision-making by the Council’s Development Management Officers on a day to day basis. The SFRA has been prepared in such a way that it will provide relevant and easily accessible information for applicants preparing site-specific flood risk assessments (FRAs). It also provides a robust flood risk evidence base allowing HDC to apply the Sequential Test (as set out in Chapter 13 of this SFRA) in the allocation of future development sites within the District, as required by the NPPF, taking into account all sources of flooding.
Sources of flooding specifically affecting Hart The SFRA identifies five sources of flooding that affect Hart:
Fluvial – flooding from rivers;
Surface water – rain water flowing over the ground surface that has not entered a natural channel or artificial drainage system;
Sewers – sewer flooding occurs when water backs up in the sewer until it emerges from manholes etc. This can be foul (sewerage) or surface water sewer flooding;
Groundwater – caused by the emergence of water originating from permeable rocks; and
Artificial sources – defined as flooding arising from failure of man-made infrastructure or human intervention, such as failure of canals or reservoir embankments.
Fluvial There are a large number of watercourses in Hart, the vast majority (over 30) of which have been designated as main rivers due to their important role in local drainage. The top four urban areas at risk of fluvial flooding in HDC are: Fleet, Yateley, Blackwater/Hawley and Crondall respectively with a further 8 urban areas having some level of risk. Manmade activities to watercourses can detrimentally affect river
channels and floodplains, and have contributed directly to fluvial flood risk issues in Hart District. Flooding
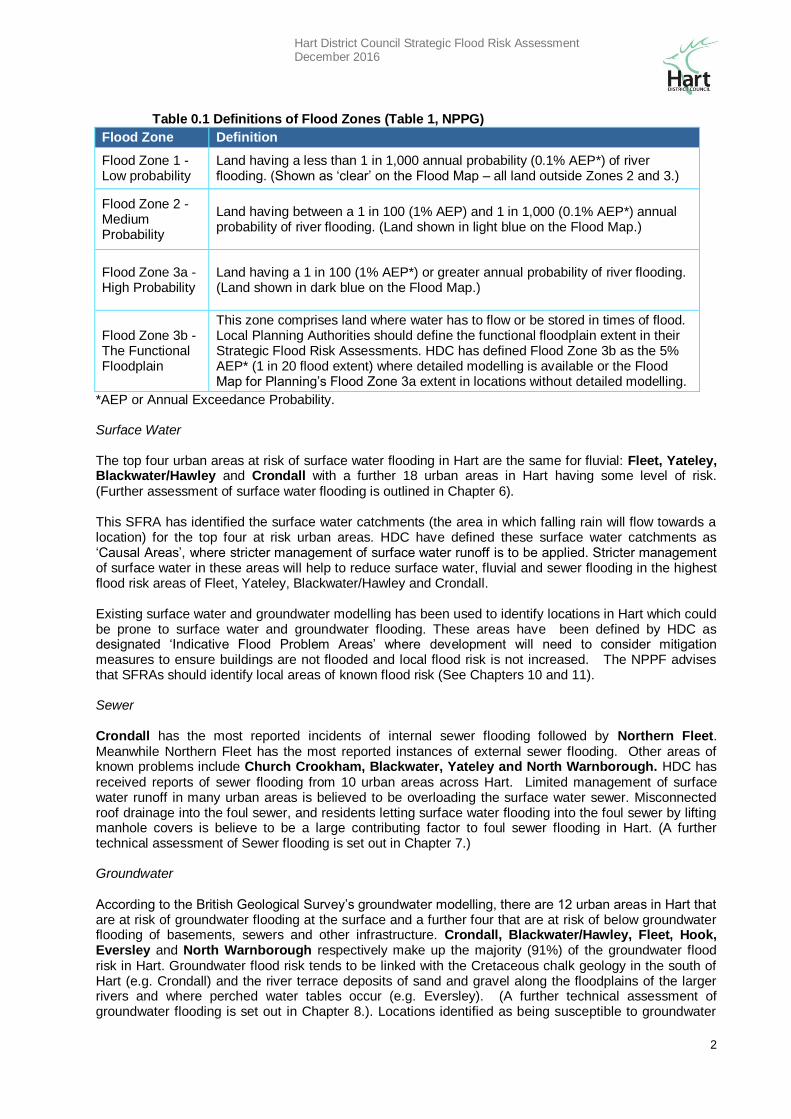
tends to be rapid and for a short duration with little to no warning. Very few of the rivers are gauged so flood warning coverage is sparse. Flood warning is only available on the Blackwater River and the downstream sections of the River Hart and River Whitewater. (A further technical assessment of fluvial flooding is set out in Chapter 5.) The table below defines the level of fluvial flood risk in an area based on the probability that a location will flood from a main river. These areas of differing flood risk are called ‘Flood Zones’.
Hart District Council Strategic Flood Risk Assessment December 2016
2
Table 0.1 Definitions of Flood Zones (Table 1, NPPG)
Flood Zone Definition
Flood Zone 1 - Low probability
Land having a less than 1 in 1,000 annual probability (0.1% AEP*) of river flooding. (Shown as ‘clear’ on the Flood Map – all land outside Zones 2 and 3.)
Flood Zone 2 - Medium Probability
Land having between a 1 in 100 (1% AEP) and 1 in 1,000 (0.1% AEP*) annual probability of river flooding. (Land shown in light blue on the Flood Map.)
Flood Zone 3a - High Probability
Land having a 1 in 100 (1% AEP*) or greater annual probability of river flooding. (Land shown in dark blue on the Flood Map.)
Flood Zone 3b - The Functional Floodplain
This zone comprises land where water has to flow or be stored in times of flood. Local Planning Authorities should define the functional floodplain extent in their Strategic Flood Risk Assessments. HDC has defined Flood Zone 3b as the 5% AEP* (1 in 20 flood extent) where detailed modelling is available or the Flood Map for Planning’s Flood Zone 3a extent in locations without detailed modelling.
*AEP or Annual Exceedance Probability. Surface Water The top four urban areas at risk of surface water flooding in Hart are the same for fluvial: Fleet, Yateley, Blackwater/Hawley and Crondall with a further 18 urban areas in Hart having some level of risk. (Further assessment of surface water flooding is outlined in Chapter 6). This SFRA has identified the surface water catchments (the area in which falling rain will flow towards a location) for the top four at risk urban areas. HDC have defined these surface water catchments as ‘Causal Areas’, where stricter management of surface water runoff is to be applied. Stricter management of surface water in these areas will help to reduce surface water, fluvial and sewer flooding in the highest flood risk areas of Fleet, Yateley, Blackwater/Hawley and Crondall. Existing surface water and groundwater modelling has been used to identify locations in Hart which could be prone to surface water and groundwater flooding. These areas have been defined by HDC as designated ‘Indicative Flood Problem Areas’ where development will need to consider mitigation measures to ensure buildings are not flooded and local flood risk is not increased. The NPPF advises that SFRAs should identify local areas of known flood risk (See Chapters 10 and 11). Sewer Crondall has the most reported incidents of internal sewer flooding followed by Northern Fleet. Meanwhile Northern Fleet has the most reported instances of external sewer flooding. Other areas of known problems include Church Crookham, Blackwater, Yateley and North Warnborough. HDC has received reports of sewer flooding from 10 urban areas across Hart. Limited management of surface water runoff in many urban areas is believed to be overloading the surface water sewer. Misconnected roof drainage into the foul sewer, and residents letting surface water flooding into the foul sewer by lifting manhole covers is believe to be a large contributing factor to foul sewer flooding in Hart. (A further technical assessment of Sewer flooding is set out in Chapter 7.) Groundwater According to the British Geological Survey’s groundwater modelling, there are 12 urban areas in Hart that are at risk of groundwater flooding at the surface and a further four that are at risk of below groundwater flooding of basements, sewers and other infrastructure. Crondall, Blackwater/Hawley, Fleet, Hook, Eversley and North Warnborough respectively make up the majority (91%) of the groundwater flood risk in Hart. Groundwater flood risk tends to be linked with the Cretaceous chalk geology in the south of Hart (e.g. Crondall) and the river terrace deposits of sand and gravel along the floodplains of the larger rivers and where perched water tables occur (e.g. Eversley). (A further technical assessment of groundwater flooding is set out in Chapter 8.). Locations identified as being susceptible to groundwater
Hart District Council Strategic Flood Risk Assessment December 2016
3
flooding at the surface have been designated as ‘Indicative Flood Problem Areas’ to ensure development in these locations consider appropriate mitigation. Artificial sources Areas adjacent to embanked sections of the Basingstoke Canal and areas downstream of large raised reservoirs could be at risk of flooding should their infrastructure fail. Fleet Pond Reservoir represents the greatest reservoir risk in Hart should embankment failure occur. Development immediately adjacent to embanked sections of the canal will need to consider the risk to the development should the canal embankments fail and developments that could affect key features of Fleet Pond Reservoir must demonstrate no detrimental impact on the reservoir to the satisfaction of the council’s reservoirs engineer. (Chapter 9 outlines flooding from artificial sources.)
Recent Environment Agency ‘Climate Change Allowances’ The Environment Agency (EA) updated climate change allowance guidelines in February 2016. Any
Flood Risk Assessment (FRA) will need to take into account this guidance. The expected increase in river flows and rainfall intensities due to climate change is expected to vary across the country, over time and will vary dependent on which climate change scenario is used. There are four likely climate change scenarios: Central, Higher Central, Upper End and High ++. The EA have devised a methodology whereby which climate change scenario should be applied to a development is determined based on the Flood Zone the development is located in, the vulnerability of that type of development to flooding and the likely lifespan of the development. The level of assessment needed within the FRA will depend on the size of the development, with larger developments expected to undertake a more detailed assessment. (Chapter 12 and Appendix 1 provide further guidance). Hart district is located in the Thames River Basin where, depending on the climate change scenario used, river flows could increase by anywhere between 25% - 80% over the next 100 year (i.e. lifespan of a residential development) and rainfall intensities could increase between 20%- 40% over the same period. So that the impact of climate change could be considered when HDC is determining where to allocate development in the Local Plan, the SFRA undertook a high level assessment into the impact of climate change on rivers in Hart. This involved increasing modelled river flows for the Flood Zone 3 (1 in 100) flood event by each of the climate change scenarios in turn and comparing these revised flows to the existing modelled Flood Zone 2 (1 in 1000) river flows. The results show that Flood Zone 2 can be used to approximate for the Central and Higher Central climate change scenarios in Hart, but will underestimate the Upper End and High ++ scenarios. Applying these results to the EA guidance indicates that Flood Zone 2 can be used to approximate the 1 in 100 plus climate change extent as long as development is located in Flood Zone 1. Because there is a risk that the climate change extent could be wider than this, development allocated in Flood Zone 1 close to Flood Zone 2 must employ additional mitigation to minimise this risk. The Environment Agency guidance states that the highest climate change allowance category (High ++) must be used for infrastructure projects, urban extensions and new settlements.
Hart District Council Strategic Flood Risk Assessment December 2016
4
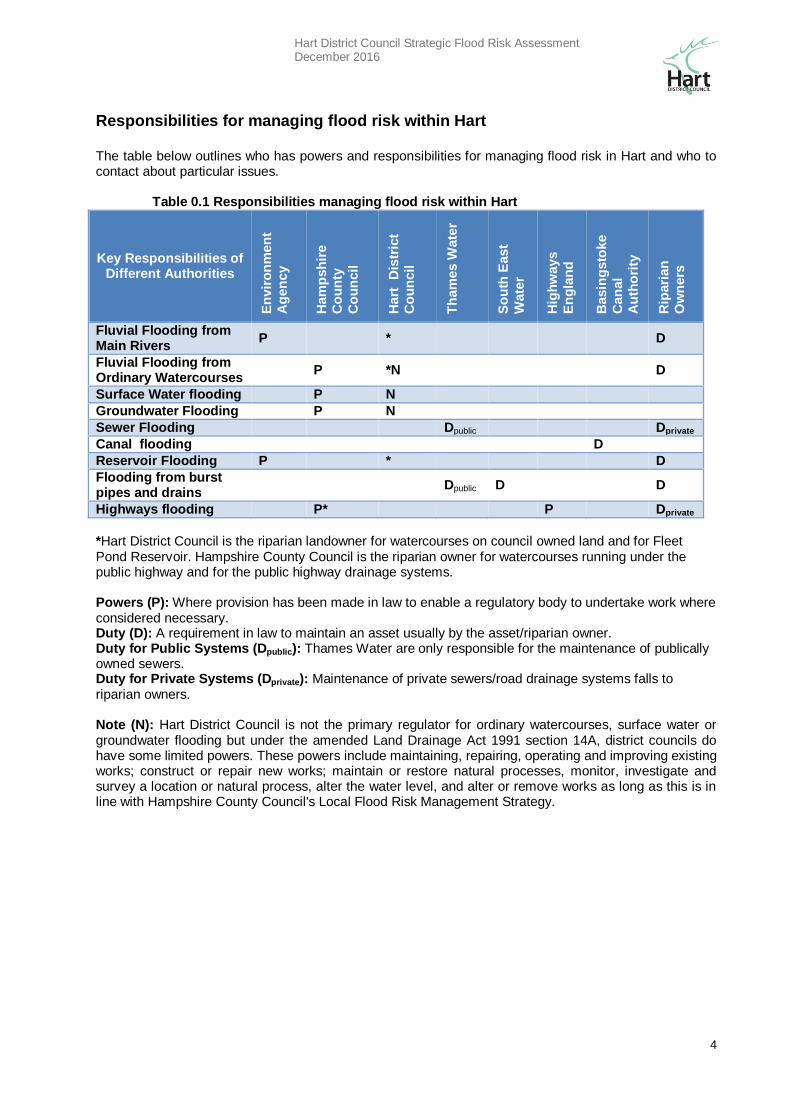
Responsibilities for managing flood risk within Hart The table below outlines who has powers and responsibilities for managing flood risk in Hart and who to contact about particular issues.
Table 0.1 Responsibilities managing flood risk within Hart
Key Responsibilities of Different Authorities
En
vir
on
men
t A
gen
cy
Ham
psh
ire
Co
un
ty
Co
un
cil
Hart
D
istr
ict
Co
un
cil
Th
am
es W
ate
r
So
uth
East
Wate
r
Hig
hw
ays
En
gla
nd
Basin
gsto
ke
Can
al
Au
tho
rity
Rip
ari
an
O
wn
ers
Fluvial Flooding from Main Rivers
P *
D
Fluvial Flooding from Ordinary Watercourses
P *N
D
Surface Water flooding P N
Groundwater Flooding P N
Sewer Flooding Dpublic Dprivate
Canal flooding D
Reservoir Flooding P * D
Flooding from burst pipes and drains
Dpublic D D
Highways flooding P* P Dprivate
*Hart District Council is the riparian landowner for watercourses on council owned land and for Fleet Pond Reservoir. Hampshire County Council is the riparian owner for watercourses running under the public highway and for the public highway drainage systems. Powers (P): Where provision has been made in law to enable a regulatory body to undertake work where considered necessary. Duty (D): A requirement in law to maintain an asset usually by the asset/riparian owner. Duty for Public Systems (Dpublic): Thames Water are only responsible for the maintenance of publically owned sewers. Duty for Private Systems (Dprivate): Maintenance of private sewers/road drainage systems falls to riparian owners. Note (N): Hart District Council is not the primary regulator for ordinary watercourses, surface water or groundwater flooding but under the amended Land Drainage Act 1991 section 14A, district councils do have some limited powers. These powers include maintaining, repairing, operating and improving existing works; construct or repair new works; maintain or restore natural processes, monitor, investigate and survey a location or natural process, alter the water level, and alter or remove works as long as this is in line with Hampshire County Council's Local Flood Risk Management Strategy.
Hart District Council Strategic Flood Risk Assessment December 2016
5
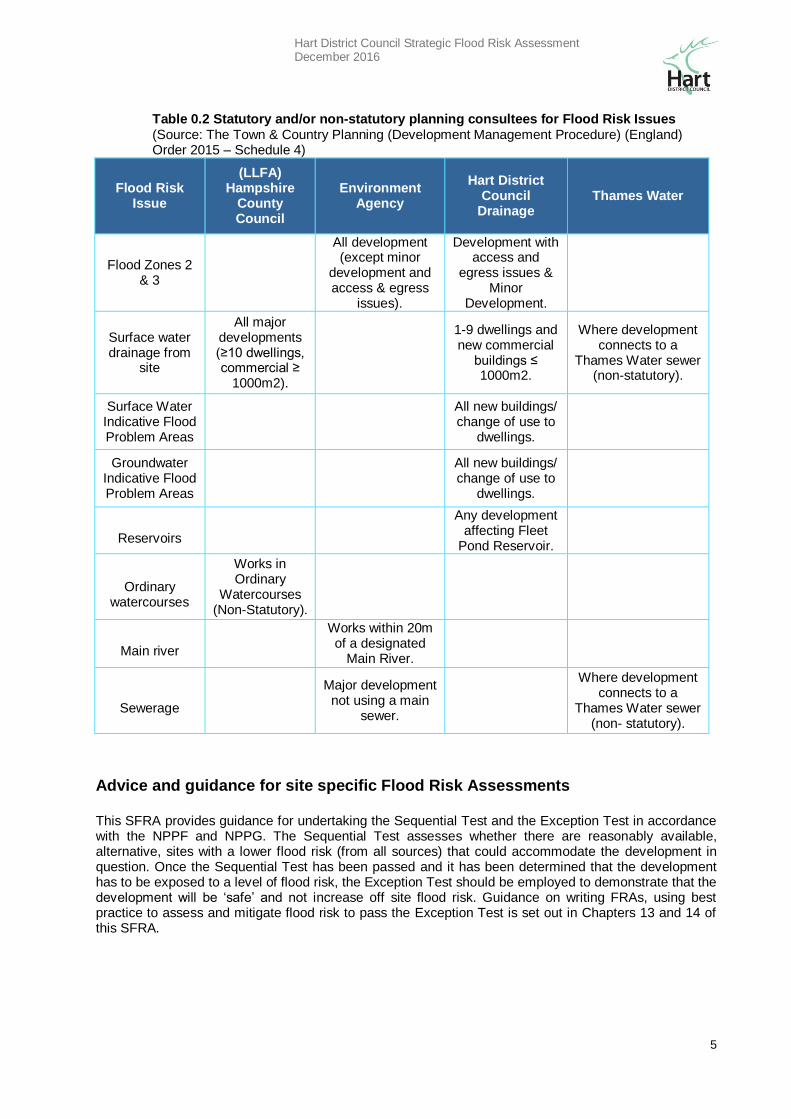
Table 0.2 Statutory and/or non-statutory planning consultees for Flood Risk Issues (Source: The Town & Country Planning (Development Management Procedure) (England) Order 2015 – Schedule 4)
Flood Risk Issue
(LLFA) Hampshire
County Council
Environment Agency
Hart District Council
Drainage Thames Water
Flood Zones 2 & 3
All development (except minor
development and access & egress
issues).
Development with access and
egress issues & Minor
Development.
Surface water drainage from
site
All major developments (≥10 dwellings, commercial ≥
1000m2).
1-9 dwellings and new commercial
buildings ≤ 1000m2.
Where development connects to a
Thames Water sewer (non-statutory).
Surface Water Indicative Flood Problem Areas
All new buildings/ change of use to
dwellings.
Groundwater Indicative Flood Problem Areas
All new buildings/ change of use to
dwellings.
Reservoirs
Any development
affecting Fleet Pond Reservoir.
Ordinary
watercourses
Works in Ordinary
Watercourses (Non-Statutory).
Main river
Works within 20m of a designated
Main River.
Sewerage
Major development
not using a main sewer.
Where development connects to a
Thames Water sewer (non- statutory).
Advice and guidance for site specific Flood Risk Assessments This SFRA provides guidance for undertaking the Sequential Test and the Exception Test in accordance with the NPPF and NPPG. The Sequential Test assesses whether there are reasonably available, alternative, sites with a lower flood risk (from all sources) that could accommodate the development in question. Once the Sequential Test has been passed and it has been determined that the development has to be exposed to a level of flood risk, the Exception Test should be employed to demonstrate that the development will be ‘safe’ and not increase off site flood risk. Guidance on writing FRAs, using best practice to assess and mitigate flood risk to pass the Exception Test is set out in Chapters 13 and 14 of this SFRA.
Hart District Council Strategic Flood Risk Assessment December 2016
6
Policy recommendations Chapter 17 of the SFRA identifies 14 policy recommendations to be considered. The key aims and messages of these recommendations are summarised below:
Protect the functional floodplain from development;
Direct vulnerable development (e.g. housing) away from areas prone to flooding from any source;
Ensure all development is ‘safe’ from flood risk;
Promote the use of Sustainable Drainage Systems (SuDS) in all flood zones for both brownfield and greenfield sites; and
Reduce flood risk from all sources where possible particularly in the identified Causal Areas.
This SFRA is a key evidence based document and should contain up to date information. The SFRA is therefore adopted as a ‘living’ document and will be reviewed regularly.
Hart District Council Strategic Flood Risk Assessment December 2016
7
1. Introduction
A Joint Level 1 Strategic Flood Risk Assessment (SFRA) was carried out for Hart District Council (HDC) and Surrey Heath Borough Council in 2008, the Blackwater Valley SFRA. Since then, a number of changes in planning policy have occurred. In addition to this updated datasets have been made available namely the Environment Agency’s updated Flood Map for Surface Water (uFMfSW), Reservoir flooding mapping, the British Geological Survey’s (BGS) SuDS Infiltration Map and revised hydraulic modelling along the River Blackwater Tributaries.
The relevant sections of the National Planning Policy Framework (NPPF) and associated National Planning Practice Guide (NPPG) for Flood Risk and Coastal Change emphasise the active role Local Planning Authorities (LPAs) such as HDC should take to ensure that flood risk is understood and managed effectively and sustainably throughout all stages of the planning process. The NPPF outlines that Local Plans should be supported by a SFRA and LPAs should use the findings to inform strategic land use planning.
The purpose of the Level 1 SFRA is to collate and analyse the most up-to-date flood risk information for use by HDC to inform the preparation of robust planning documents as part of the HDC Local Plan. The Level 1 SFRA will also support decision-making by Development Management officers on a day-to-day basis and support the Sustainability Appraisal.
In order to achieve this, the Level 1 SFRA will be delivered to provide a robust flood risk evidence base, therefore allowing HDC to apply the Sequential Test in the allocation of future development sites within the District, as required by the NPPF, taking into account all sources of flooding. The SFRA does not, however, replace the responsibility at a broader level to consider wider catchment flood risk management approaches and solutions, nor does it remove the requirement for appropriately focused local/site Flood Risk Assessments (FRAs).
Hart District Council Strategic Flood Risk Assessment December 2016
8
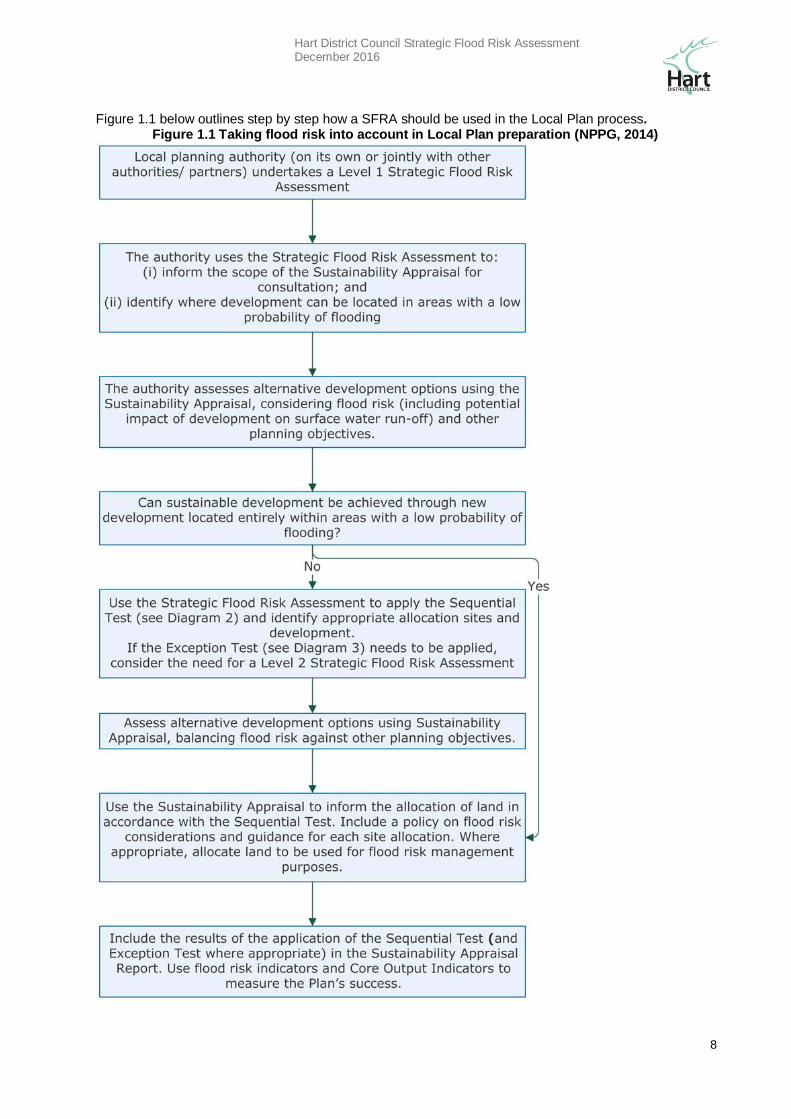
Figure 1.1 below outlines step by step how a SFRA should be used in the Local Plan process. Figure 1.1 Taking flood risk into account in Local Plan preparation (NPPG, 2014)
Hart District Council Strategic Flood Risk Assessment December 2016
9
2. Study Area
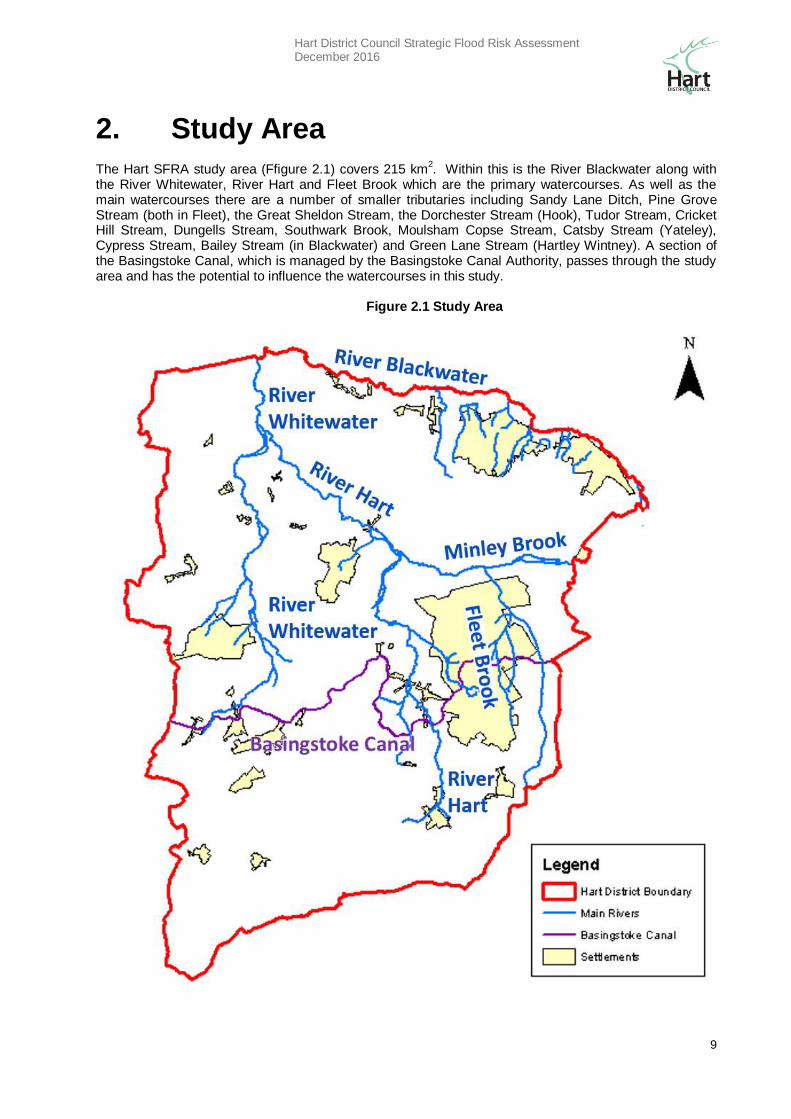
The Hart SFRA study area (Ffigure 2.1) covers 215 km2. Within this is the River Blackwater along with
the River Whitewater, River Hart and Fleet Brook which are the primary watercourses. As well as the main watercourses there are a number of smaller tributaries including Sandy Lane Ditch, Pine Grove Stream (both in Fleet), the Great Sheldon Stream, the Dorchester Stream (Hook), Tudor Stream, Cricket Hill Stream, Dungells Stream, Southwark Brook, Moulsham Copse Stream, Catsby Stream (Yateley), Cypress Stream, Bailey Stream (in Blackwater) and Green Lane Stream (Hartley Wintney). A section of the Basingstoke Canal, which is managed by the Basingstoke Canal Authority, passes through the study area and has the potential to influence the watercourses in this study.
Figure 2.1 Study Area
Hart District Council Strategic Flood Risk Assessment December 2016
10
The Blackwater skirts along the northern and eastern boundary of the Hart District Boundary. The watercourse rises south of Aldershot and is highly urbanised passing through the town of Aldershot before entering the SFRA study area. It continues to pass through the towns of Blackwater, Sandhurst and Yateley before joining the Whitewater just west of Yateley. The rural nature of the area, its good communication links and its proximity to London has put development pressure on the area in recent years. The section of the Basingstoke Canal within the study area is used mainly for recreational purposes. The canal extends between Greywell at the western boundary of the study area to Farnborough airport in the East. The canal has the potential of influencing the watercourses and runoff routes in the study area. In the upper reaches of all of the catchments in the study area the canal will have an impact on the flow regime.
The western part of the catchment around Hook and Odiham drains into the River Whitewater and its tributaries, the largest of which is Potbridge Brook. The Whitewater flows in a northerly direction past Hook and Hartley Wintney where it joins the Blackwater to the east of Riseley. The central and southeast area of Hart District are drained by the River Hart, Fleet Brook and their tributaries, the largest of which are the Itchel, Minley Brooks, Sandy Lane Ditch and the Gelvert Stream. The Fleet Brook flows around Fleet before joining the Hart at the confluence north west of the town. The River Hart flows into the Whitewater to the northwest of Hartley Wintney, near Hazeley. Current flood risk management measures are confined to localised flood bunds, bank protection, culverting, balancing ponds and sluices. On the Blackwater a number of changes and improvements have been made to the river channel in the urban area. There is the Crondall Flood Alarm on the River Hart which is a direct Alarm for flood warning and there are also three walls identified by the Environment Agency as performing a flood defence function. Hart has three small scale flood alleviation schemes (FAS) all built by Hart District Council in the 1980’s and 90’s. These are:
Royal Oak Valley FAS: small upstream storage on the Tudor Stream;
Church View Surface Water FAS: surface water interception ditch; and
Beacon Hill Balancing Pond: upstream storage on the Fleet Brook.
2.1 Main Urban Areas
There are several significant urban areas in the catchment. To the west of the study area the towns of Hook, Odiham and Hartley Wintney are within close proximity to both the watercourses of the Whitewater and Hart. The town of Fleet lies to the centre of the catchment close to both the River Hart and Fleet Brook. The towns of Sandhurst and Yateley lie to the north of the catchment.
2.2 Infrastructure
In the study area the two main transport infrastructure links are the M3 motorway and the London to Southampton Railway. Both cross the main watercourses in the catchment in a north-easterly to south-westerly direction. The Reading to Guildford railway also runs along part of the Blackwater Valley running north to south along the eastern edge of the study area. The bridges, tunnels, embankments and culverts associated with these transport links crossing the rivers and floodplains have a significant effect on flooding processes, as described in section 6.5.4. It has been highlighted by the Environment Agency that the motorway impacts on land drainage, particularly in the Elvetham area. The other main roads in the area are the A287 in the south and the A30 in the north. The major sewage treatment works (STWs) in the study area are in Fleet, Hartley Wintney and Eversley along with a number of smaller STWs.
Hart District Council Strategic Flood Risk Assessment December 2016
11
2.3 Hydrology
There are a number watercourses within the study area and these are shown in Figure 2.1.
The Blackwater River rises on the south-western fringe of Aldershot. The Blackwater forms part of the boundary between Hart, Rushmoor, Surrey Heath, Bracknell Forest and Wokingham Councils. The watercourse passes under the Basingstoke Canal and around Aldershot before entering the SFRA study area. It then passes underneath the M3 motorway near Hawley before it is joined by the Cove Brook. The Blackwater continues to follow the northerly Hart District boundary whilst passing through the Trilakes Country Park. The Whitewater joins with the Blackwater 2km east of Riseley before the Blackwater continues for another 3km until its confluence with the River Loddon at Swallowfield. The Blackwater begins at a height of approximately 110m AOD and at the confluence with the River Loddon is approximately 47m AOD. The Blackwater from source in Aldershot to confluence with the River Loddon is approximately 35km long.
The Whitewater starts out as a small stream 2.5km west of Odiham. It rises from a series of unnamed lakes between Upton Grey and Greywell. Approximately 2km downstream from this point the watercourse crosses the Basingstoke Canal between Greywell and North Warnborough. The watercourse proceeds in a northerly direction towards the town of Hook where it passes under the M3 motorway. The Whitewater flows to the west of Hook before meandering through a predominantly rural landscape before being joined by the Hart and then flows into Blackwater east of Riseley. It begins at a height of 82m AOD and at the confluence with the Blackwater is at a height of 48m AOD. The Whitewater from source to confluence with the Blackwater is approximately 20km long. The River Hart rises in the village of Crondall, 5km south of Fleet. The River Hart has three main tributaries; the Itchel Brook (which joins the Hart south of Dogmersfield), the Sandy Lane Ditch (which joins west of Winchfield Hurst) and the Minley Brook (which joins just north of Fleet). The River Hart drains in a northerly direction crossing the Basingstoke Canal south west of the town of Fleet. The watercourse passes under the Railway and M3 motorway between the towns of Fleet and Hartley Wintney. The confluence with the Minley Brook is situated 2km east of Hartley Wintney. The watercourse continues to meander through relatively rural surroundings until it joins the Whitewater just south of the Heckfield Bridge. The River Hart begins at a height of 88m and at the confluence with the Whitewater it is at a height of 49m. The River Hart from its source in Crondall to the confluence with the Whitewater is approximately 20km long.
The Fleet Brook rises in a wooded area south east of the town of Fleet. From here the watercourse passes under the Basingstoke Canal and into a large raised reservoir known as Fleet Pond that is on the northeast outskirts of the town of Fleet. Approximately 1km downstream of Fleet Pond the Fleet Brook passes under the M3 motorway and joins with its other significant tributary the Minley Brook. Up to this point the Brook had been draining in a northerly direction. It now turns to the west and continues for 3.5km until its confluence with the River Hart between Fleet and Hartley Wintney. The Fleet Brook begins at a height of approximately 150m AOD and at the confluence with the River Hart is approximately 58m AOD. As well as the larger main rivers described above, there are a further 29 smaller main rivers that pass through many of the towns, villages and built up urban areas. Due to the density of buildings and proximity to the channels many of these smaller watercourses play a locally important part in the flood risk issues across Hart.
2.4 Regional Geology
The underlying geology of the Blackwater Catchment is mixed with a significant area having not been surveyed or classified as urban and industrial areas. The River Blackwater rises as springs in Bagshot Beds (sandstone), overlying London Clay. As the river flows north, the catchment geology mainly consists of Bracklesham Beds (sandstone which overlie the Bagshot Beds), overlaid by patches of Barton Sand. Plateau gravels overlie the peak of the Barton Sands in the lower half of the catchment downstream of Mytchett.
Hart District Council Strategic Flood Risk Assessment December 2016
12
The upper chalk of the North Downs chalk ridge underlies the western part of the Whitewater catchment. The chalk strata dips to the northwest and is overlain by Reading Beds. Overlying the Reading Beds, which form most of the low-lying land in the Thames basin, is London Clay which forms the eastern Whitewater geology. The Hart and Fleet Brook catchments contain a mixture of Bagshot Beds (mixed clay, sand and loams), Bracklesham Beds (dark green sand) and Barton Beds (yellow sands) overlain by London Clay in patches.
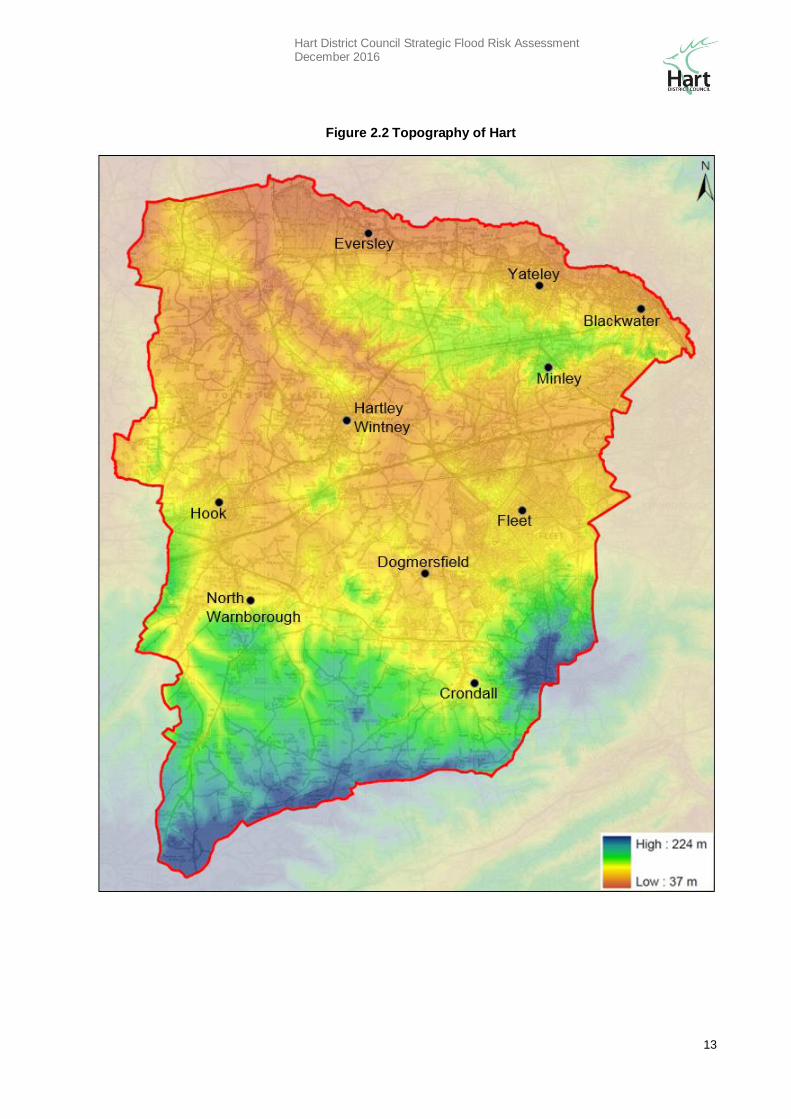
2.5 Topography
The topography of a catchment has a significant impact on the mechanisms and processes of flooding. The topography changes significantly within the SFRA study area, with the upstream point at the source of Fleet Brook being approximately 150m AOD and at the point of eventual confluence with the River Loddon being approximately 47m AOD. Towards the main watercourses the topography flattens out and most of the urban areas are relatively flat. LiDAR data was used, where available, to generate a Digital Terrain Model within the study area, this is shown in Figure 2.2. Development around the watercourses varies from west to east. In the south west the catchment is predominantly rural and there has therefore been little, if any, diversion of the river from its natural course. In the east there is a distinct contrast due to the urban extents which surround the Blackwater floodplain. In this area the Blackwater channel has been changed significantly with the floodplain being constrained by development including numerous railway lines and major roads. These changes have also occurred to many other Tributaries within Hart.
Hart District Council Strategic Flood Risk Assessment December 2016
13
Hook
Eversley
Yateley
Fleet
Minley Hartley Wintney
Dogmersfield
North Warnborough
Figure 2.2 Topography of Hart
Hart District Council Strategic Flood Risk Assessment December 2016
14
3. Policy and Local Context
3.1 National Policy
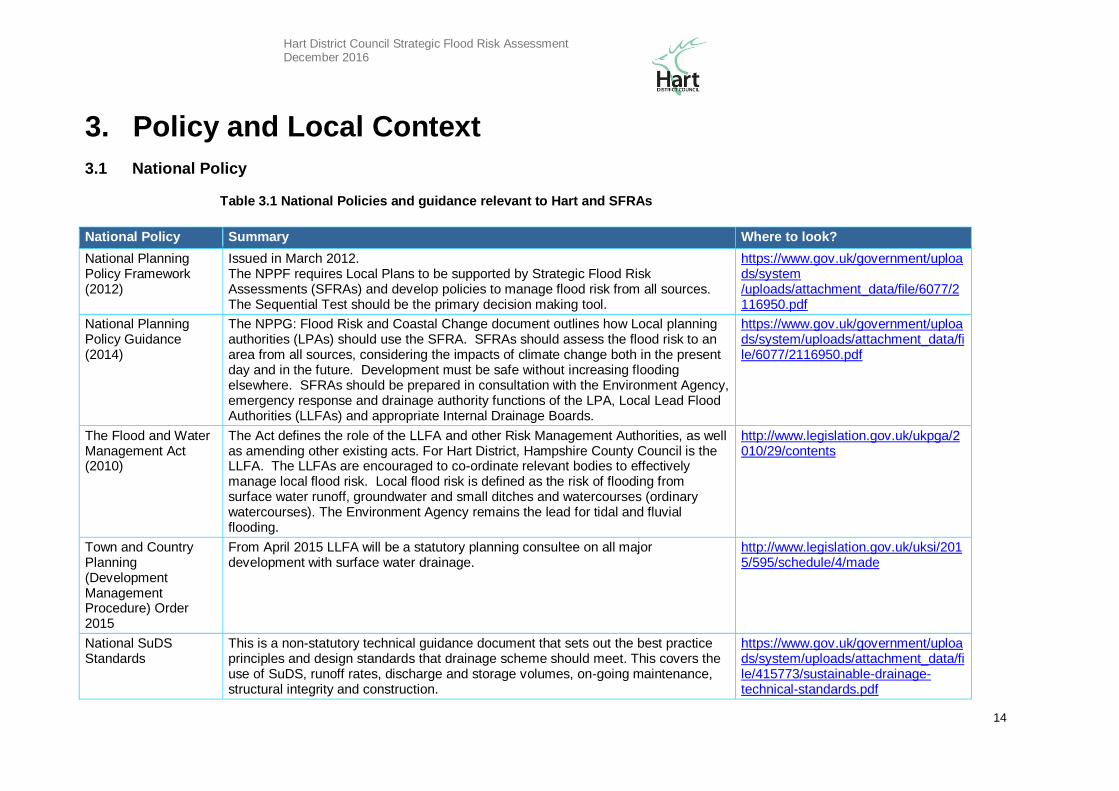
Table 3.1 National Policies and guidance relevant to Hart and SFRAs
National Policy Summary Where to look?
National Planning Policy Framework (2012)
Issued in March 2012. The NPPF requires Local Plans to be supported by Strategic Flood Risk Assessments (SFRAs) and develop policies to manage flood risk from all sources. The Sequential Test should be the primary decision making tool.
https://www.gov.uk/government/uploads/system /uploads/attachment_data/file/6077/2116950.pdf
National Planning Policy Guidance (2014)
The NPPG: Flood Risk and Coastal Change document outlines how Local planning authorities (LPAs) should use the SFRA. SFRAs should assess the flood risk to an area from all sources, considering the impacts of climate change both in the present day and in the future. Development must be safe without increasing flooding elsewhere. SFRAs should be prepared in consultation with the Environment Agency, emergency response and drainage authority functions of the LPA, Local Lead Flood Authorities (LLFAs) and appropriate Internal Drainage Boards.
https://www.gov.uk/government/uploads/system/uploads/attachment_data/file/6077/2116950.pdf
The Flood and Water Management Act (2010)
The Act defines the role of the LLFA and other Risk Management Authorities, as well as amending other existing acts. For Hart District, Hampshire County Council is the LLFA. The LLFAs are encouraged to co-ordinate relevant bodies to effectively manage local flood risk. Local flood risk is defined as the risk of flooding from surface water runoff, groundwater and small ditches and watercourses (ordinary watercourses). The Environment Agency remains the lead for tidal and fluvial flooding.
http://www.legislation.gov.uk/ukpga/2010/29/contents
Town and Country Planning (Development Management Procedure) Order 2015
From April 2015 LLFA will be a statutory planning consultee on all major development with surface water drainage.
http://www.legislation.gov.uk/uksi/2015/595/schedule/4/made
National SuDS Standards
This is a non-statutory technical guidance document that sets out the best practice principles and design standards that drainage scheme should meet. This covers the use of SuDS, runoff rates, discharge and storage volumes, on-going maintenance, structural integrity and construction.
https://www.gov.uk/government/uploads/system/uploads/attachment_data/file/415773/sustainable-drainage-technical-standards.pdf
Hart District Council Strategic Flood Risk Assessment December 2016
15
3.2 Local Context
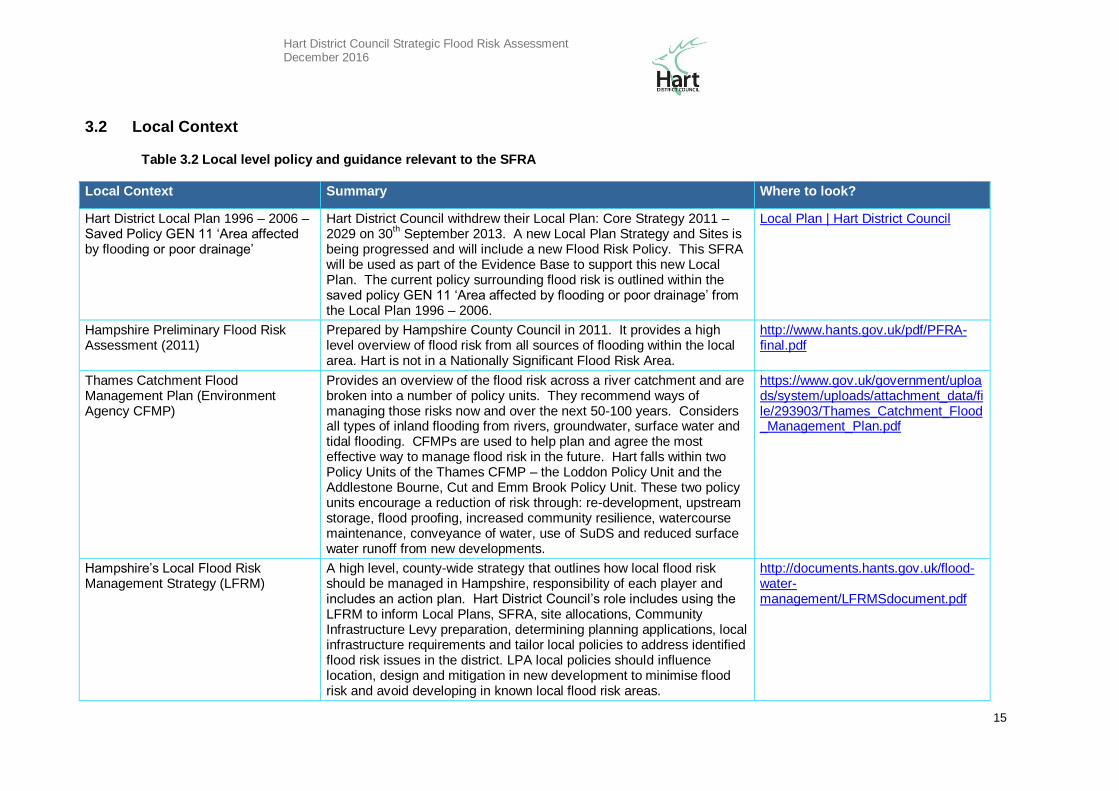
Table 3.2 Local level policy and guidance relevant to the SFRA
Local Context Summary Where to look?
Hart District Local Plan 1996 – 2006 – Saved Policy GEN 11 ‘Area affected by flooding or poor drainage’
Hart District Council withdrew their Local Plan: Core Strategy 2011 – 2029 on 30
th September 2013. A new Local Plan Strategy and Sites is
being progressed and will include a new Flood Risk Policy. This SFRA will be used as part of the Evidence Base to support this new Local Plan. The current policy surrounding flood risk is outlined within the saved policy GEN 11 ‘Area affected by flooding or poor drainage’ from the Local Plan 1996 – 2006.
Local Plan | Hart District Council
Hampshire Preliminary Flood Risk Assessment (2011)
Prepared by Hampshire County Council in 2011. It provides a high level overview of flood risk from all sources of flooding within the local area. Hart is not in a Nationally Significant Flood Risk Area.
http://www.hants.gov.uk/pdf/PFRA-final.pdf
Thames Catchment Flood Management Plan (Environment Agency CFMP)
Provides an overview of the flood risk across a river catchment and are broken into a number of policy units. They recommend ways of managing those risks now and over the next 50-100 years. Considers all types of inland flooding from rivers, groundwater, surface water and tidal flooding. CFMPs are used to help plan and agree the most effective way to manage flood risk in the future. Hart falls within two Policy Units of the Thames CFMP – the Loddon Policy Unit and the Addlestone Bourne, Cut and Emm Brook Policy Unit. These two policy units encourage a reduction of risk through: re-development, upstream storage, flood proofing, increased community resilience, watercourse maintenance, conveyance of water, use of SuDS and reduced surface water runoff from new developments.
https://www.gov.uk/government/uploads/system/uploads/attachment_data/file/293903/Thames_Catchment_Flood_Management_Plan.pdf
Hampshire’s Local Flood Risk Management Strategy (LFRM)
A high level, county-wide strategy that outlines how local flood risk should be managed in Hampshire, responsibility of each player and includes an action plan. Hart District Council’s role includes using the LFRM to inform Local Plans, SFRA, site allocations, Community Infrastructure Levy preparation, determining planning applications, local infrastructure requirements and tailor local policies to address identified flood risk issues in the district. LPA local policies should influence location, design and mitigation in new development to minimise flood risk and avoid developing in known local flood risk areas.
http://documents.hants.gov.uk/flood-water-management/LFRMSdocument.pdf
Hart District Council Strategic Flood Risk Assessment December 2016
16
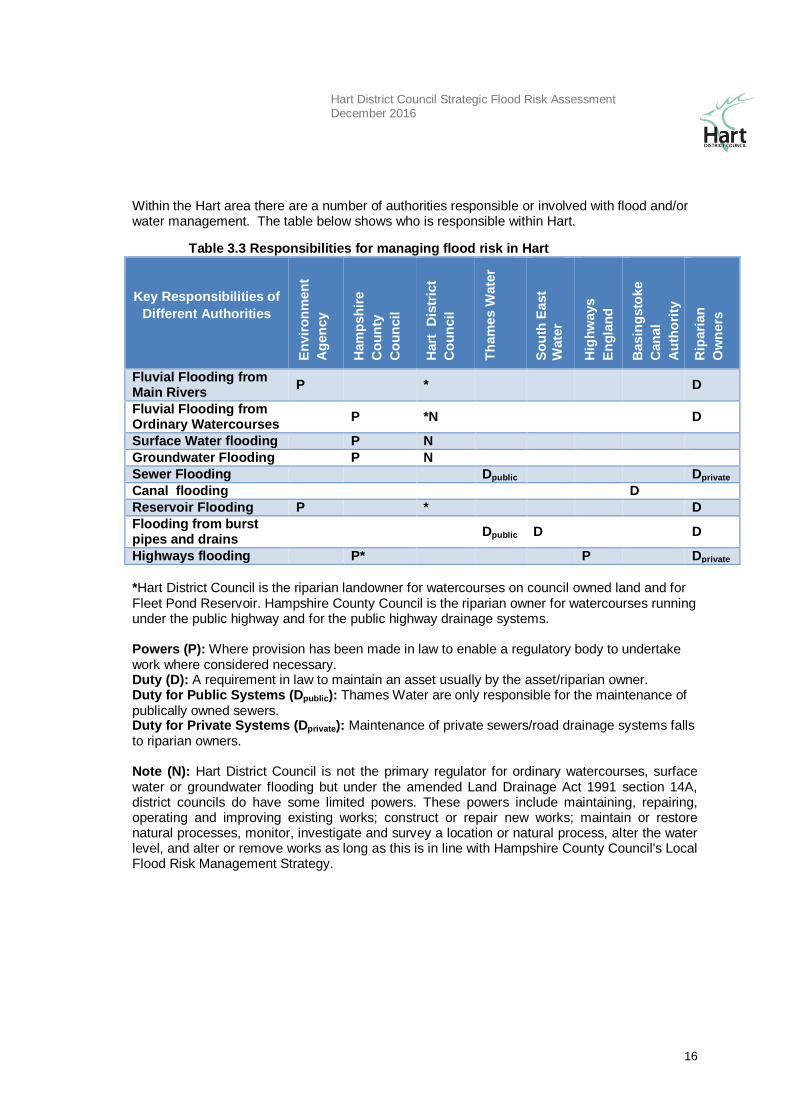
Within the Hart area there are a number of authorities responsible or involved with flood and/or water management. The table below shows who is responsible within Hart.
Table 3.3 Responsibilities for managing flood risk in Hart
Key Responsibilities of
Different Authorities E
nvir
on
men
t
Ag
en
cy
Ham
psh
ire
Co
un
ty
Co
un
cil
Hart
D
istr
ict
Co
un
cil
Th
am
es W
ate
r
So
uth
East
Wate
r
Hig
hw
ays
En
gla
nd
Basin
gsto
ke
Can
al
Au
tho
rity
Rip
ari
an
Ow
ners
Fluvial Flooding from Main Rivers
P *
D
Fluvial Flooding from Ordinary Watercourses
P *N
D
Surface Water flooding P N
Groundwater Flooding P N
Sewer Flooding Dpublic Dprivate
Canal flooding D
Reservoir Flooding P * D
Flooding from burst pipes and drains
Dpublic D D
Highways flooding P* P Dprivate
*Hart District Council is the riparian landowner for watercourses on council owned land and for Fleet Pond Reservoir. Hampshire County Council is the riparian owner for watercourses running under the public highway and for the public highway drainage systems. Powers (P): Where provision has been made in law to enable a regulatory body to undertake work where considered necessary. Duty (D): A requirement in law to maintain an asset usually by the asset/riparian owner. Duty for Public Systems (Dpublic): Thames Water are only responsible for the maintenance of publically owned sewers. Duty for Private Systems (Dprivate): Maintenance of private sewers/road drainage systems falls to riparian owners. Note (N): Hart District Council is not the primary regulator for ordinary watercourses, surface water or groundwater flooding but under the amended Land Drainage Act 1991 section 14A, district councils do have some limited powers. These powers include maintaining, repairing, operating and improving existing works; construct or repair new works; maintain or restore natural processes, monitor, investigate and survey a location or natural process, alter the water level, and alter or remove works as long as this is in line with Hampshire County Council's Local Flood Risk Management Strategy.
Hart District Council Strategic Flood Risk Assessment December 2016
17
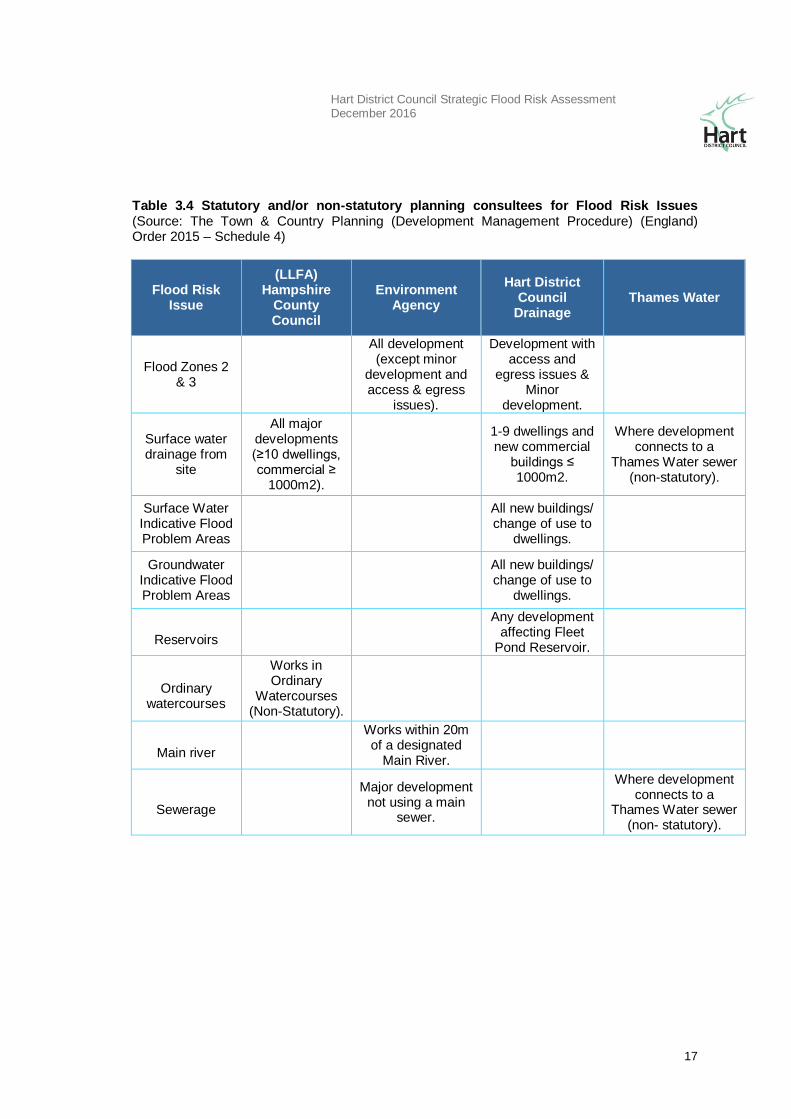
Table 3.4 Statutory and/or non-statutory planning consultees for Flood Risk Issues (Source: The Town & Country Planning (Development Management Procedure) (England) Order 2015 – Schedule 4)
Flood Risk Issue
(LLFA) Hampshire
County Council
Environment Agency
Hart District Council
Drainage Thames Water
Flood Zones 2 & 3
All development (except minor
development and access & egress
issues).
Development with access and
egress issues & Minor
development.
Surface water drainage from
site
All major developments (≥10 dwellings, commercial ≥
1000m2).
1-9 dwellings and new commercial
buildings ≤ 1000m2.
Where development connects to a
Thames Water sewer (non-statutory).
Surface Water Indicative Flood Problem Areas
All new buildings/ change of use to
dwellings.
Groundwater Indicative Flood Problem Areas
All new buildings/ change of use to
dwellings.
Reservoirs
Any development
affecting Fleet Pond Reservoir.
Ordinary
watercourses
Works in Ordinary
Watercourses (Non-Statutory).
Main river
Works within 20m of a designated
Main River.
Sewerage
Major development
not using a main sewer.
Where development connects to a
Thames Water sewer (non- statutory).
Hart District Council Strategic Flood Risk Assessment December 2016
18
4. SFRA Methodology
4.1 Description
The Level 1 SFRA is a desk-based study, using readily available existing information and datasets to enable the application of the Sequential Test and to identify where the Exception Test may be required.
4.2 Data Collection/processing
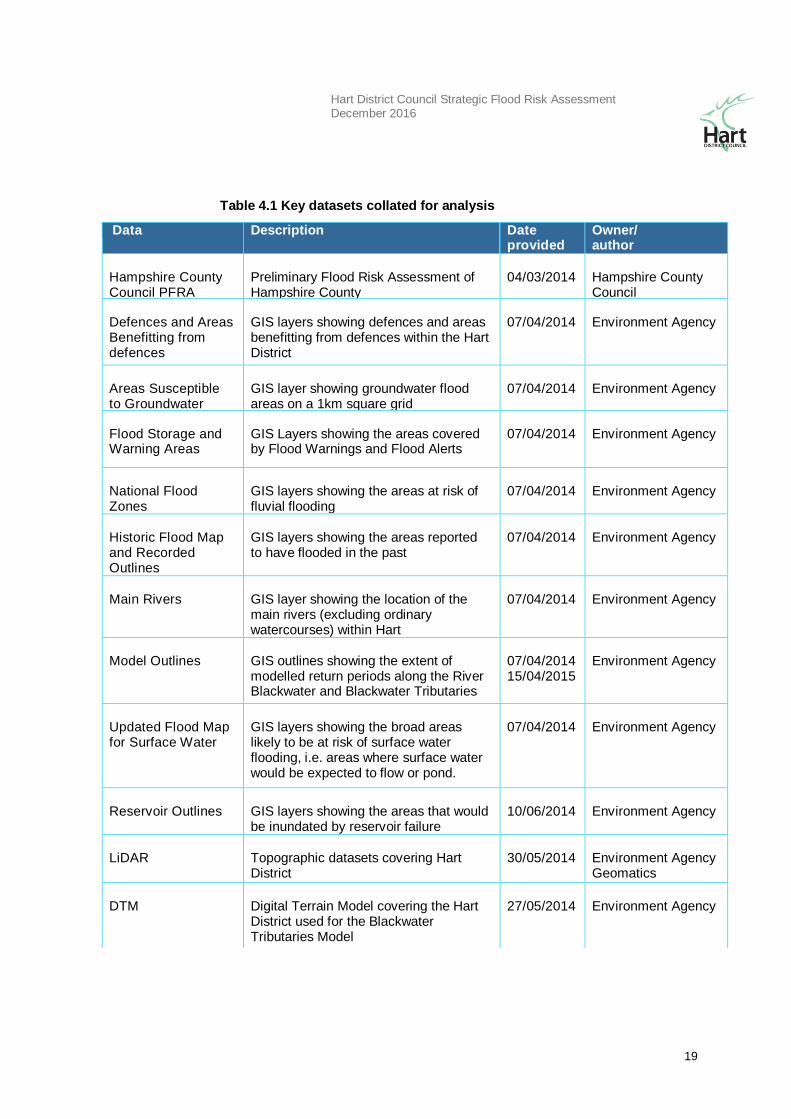
A record of all of the key data collected through the production of the Level 1 SFRA is presented in Table 4.1. This data has been collected following consultation with and input from the partnering local authorities and agencies. Following this, data processing was undertaken which included assessing historic records of flooding to determine the common sources of flooding. The SFRA datasets, including flood extents, surface water flood risk and groundwater flood risk, were clipped to the Hart District boundary and analysed to assess flood risk.
4.3 Stakeholders
The information used in this SFRA has been sourced from a variety of stakeholders including:
Hart District Council;
Hampshire County Council;
Environment Agency – the study area is within the Environment Agency Thames Area, which is responsible for the River Hart, Blackwater and Whitewater;
Basingstoke Canal Authority;
Thames Water – responsible for the management of surface water and foul water in the study area, and
British Geological Survey – geological data used to derive SuDS suitability maps and susceptibility to groundwater dataset.
Hart District Council Strategic Flood Risk Assessment December 2016
19
Table 4.1 Key datasets collated for analysis
Data Description Date provided
Owner/ author
Hampshire County Council PFRA
Preliminary Flood Risk Assessment of Hampshire County
04/03/2014
Hampshire County Council
Defences and Areas Benefitting from defences
GIS layers showing defences and areas benefitting from defences within the Hart District
07/04/2014
Environment Agency
Areas Susceptible to Groundwater Flooding
GIS layer showing groundwater flood areas on a 1km square grid
07/04/2014
Environment Agency
Flood Storage and Warning Areas
GIS Layers showing the areas covered by Flood Warnings and Flood Alerts
07/04/2014
Environment Agency
National Flood Zones
GIS layers showing the areas at risk of fluvial flooding
07/04/2014
Environment Agency
Historic Flood Map and Recorded Outlines
GIS layers showing the areas reported to have flooded in the past
07/04/2014
Environment Agency
Main Rivers
GIS layer showing the location of the main rivers (excluding ordinary watercourses) within Hart
07/04/2014
Environment Agency
Model Outlines
GIS outlines showing the extent of modelled return periods along the River Blackwater and Blackwater Tributaries
07/04/2014 15/04/2015
Environment Agency
Updated Flood Map for Surface Water
GIS layers showing the broad areas likely to be at risk of surface water flooding, i.e. areas where surface water would be expected to flow or pond.
07/04/2014
Environment Agency
Reservoir Outlines
GIS layers showing the areas that would be inundated by reservoir failure
10/06/2014
Environment Agency
LiDAR
Topographic datasets covering Hart District
30/05/2014
Environment Agency Geomatics
DTM
Digital Terrain Model covering the Hart District used for the Blackwater Tributaries Model
27/05/2014
Environment Agency
Hart District Council Strategic Flood Risk Assessment December 2016
20
4.4 Need for a Level 2 SFRA
Following the application of the Sequential Test by HDC, there may be an insufficient number of suitably available sites for development within areas identified to be at low risk of flooding and it may become necessary to consider the application of the Exception Test. Where this is necessary, the scope of the SFRA may need to be widened to a Level 2 assessment.
The increased scope of a Level 2 SFRA will need to consider the detailed nature of the flood characteristics within a Flood Zone including flood probability, flood depth, flood velocity, rate of onset of flooding and the duration of flooding. The scope of a Level 2 SFRA cannot fully be determined until the Sequential Test has been undertaken by HDC on all possible site allocations.
Communities at Risk Report
Report detailing the Communities at Risk within Hart
14/03/2014
Environment Agency
Historical Flood records/data
Information on incidents of flooding from various sources within the Hart District. Appendix A and B from Multi Agency Flood Group Meetings
12/06/2014
HDC
Mapping
25K and 50K Mapping of Hart District
30/06/2014
Emapsite HDC
Information on the Basingstoke Canal
GIS layers showing the Canal centreline and information on risk of breach
04/04/2014
Basingstoke Canal Authority
Groundwater Susceptibility and SuDS Summary Maps
GIS Layers showing the susceptibility to groundwater flooding within Hart and summary information relating to the suitability of SuDS across the District
08/04/2014
British Geological Society
DG5 Register
Records of sewer flooding within Hart
27/05/2014
Thames Water
Local Flood Risk Management Strategy
Hampshire County Council LFRMS Report
25/06/2014
Hampshire County Council
Hart District Council Strategic Flood Risk Assessment December 2016
21
5. Flooding From Rivers
5.1 Description
Flooding from rivers occurs when water levels rise higher than bank levels causing floodwater to spill across adjacent land (floodplain). The main reasons water levels rise in rivers are: • intense or prolonged rainfall causing runoff rates and flow to increase in rivers
exceeding the capacity of the channel. This can be exacerbated by wet antecedent conditions and where there are significant contributions of groundwater;
• constrictions in the river channel causing flood water to backup; • snow melt; • blockage of structures or the river channel causing flood water to backup; • high water levels and/or flood gates preventing discharge at the outlet of the river. The consequence of river flooding depends on how hazardous the flood waters are and what the receptor of flooding is. The hazard of river flood water is related to the depth and velocity, which depends on the: • magnitude flood flows; • size, shape and slope of the river channel; • width and roughness of the floodplain; and • types of structures that cross the channel. Flood hazard can vary greatly throughout catchments and even across floodplain areas. The most hazardous flows generally occur in steep catchments and towards the bottom of large catchments and closer to the river channel. Hazardous river flows can pose a significant risk to exposed people, property and infrastructure. Whilst low hazard flows are less of a risk to life, they can disrupt communities, require significant post- flood clean-up and can cause superficial and possibly structural damage to property.
5.2 Data Collection
Information on fluvial flooding in Hart was collected from Hart District Council and the Environment Agency in many different formats. Information has been collated by source and flood type and is presented within each of the following sections.
5.3 Historical Fluvial Flood Events
In Hart, fluvial flooding is often not well reported. Not all incidents have been reported or captured, meaning that the historical records may not accurately depict the quantity or impact of flooding.
Hart District Council Strategic Flood Risk Assessment December 2016
22
5.3.1 EA Historic Flood Map and Recorded Outlines
The Environment Agency Historic Flood Map (HFM) and Recorded Flood Outlines datasets were obtained to support this Level 1 SFRA. These datasets provide fluvial flood outlines for storms during July 2007, November 2000, October 1993, February 1990 and September 1968 and show fluvial flooding along most of the reaches of the main rivers in the Hart District. The Whitewater has significant historic flood extents all the way up to the village of North Warnborough next to the Basingstoke Canal. The River Hart has significant historic flood extents downstream of the Southampton to London railway along with patchy flooding upstream in Crondall and Dogmersfield. Flooding has been reported at Dogmersfield in November 2005, when the river flooded adjacent roads at Pilcot Bridge. Flooding was also reported along the Fleet Brook and tributaries. The Blackwater River has significant flood extents throughout the valley up to the Basingstoke Canal.
5.3.2 Hart District Council’s records of fluvial flooding
Historic records held by Hart District Council vary in quality and detail. The level of reporting varies across the district with some areas being better at reporting than others. Hart holds detailed historic records of flooding for May 1988, February 1990, November/December 2006, July 2007, December 2013/January 2014 and August 2015 although it is likely that there has been other flood events in Hart for which records are scantier. The analyses of the historic records within this SFRA are based on these 6 flood events due to the detail of the records.
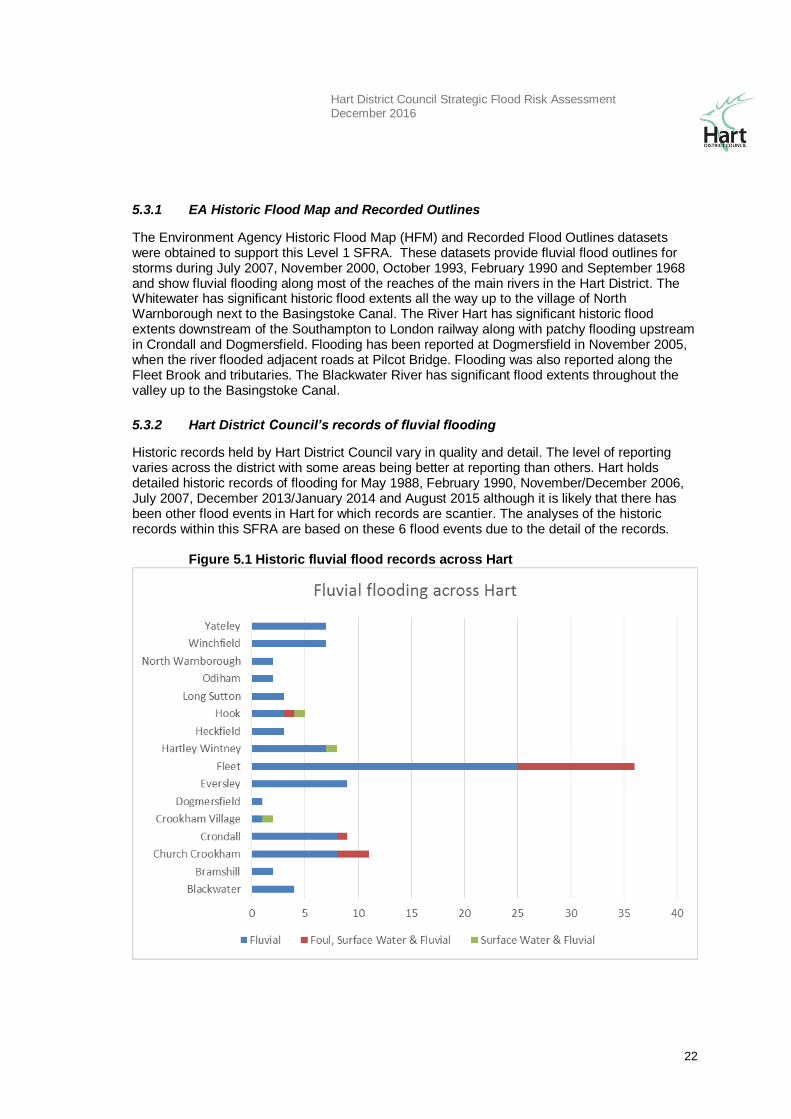
Figure 5.1 Historic fluvial flood records across Hart
Hart District Council Strategic Flood Risk Assessment December 2016
23
The above graph shows that the vast majority of fluvial flooding records (both ordinary watercourse and Main River flooding) have been reported in Fleet. A much lower number has been recorded in Hook, Yateley and Crondall. There are a number of locations (particularly Fleet and Church Crookham) where fluvial flooding has combined with other sources, particularly foul flooding.
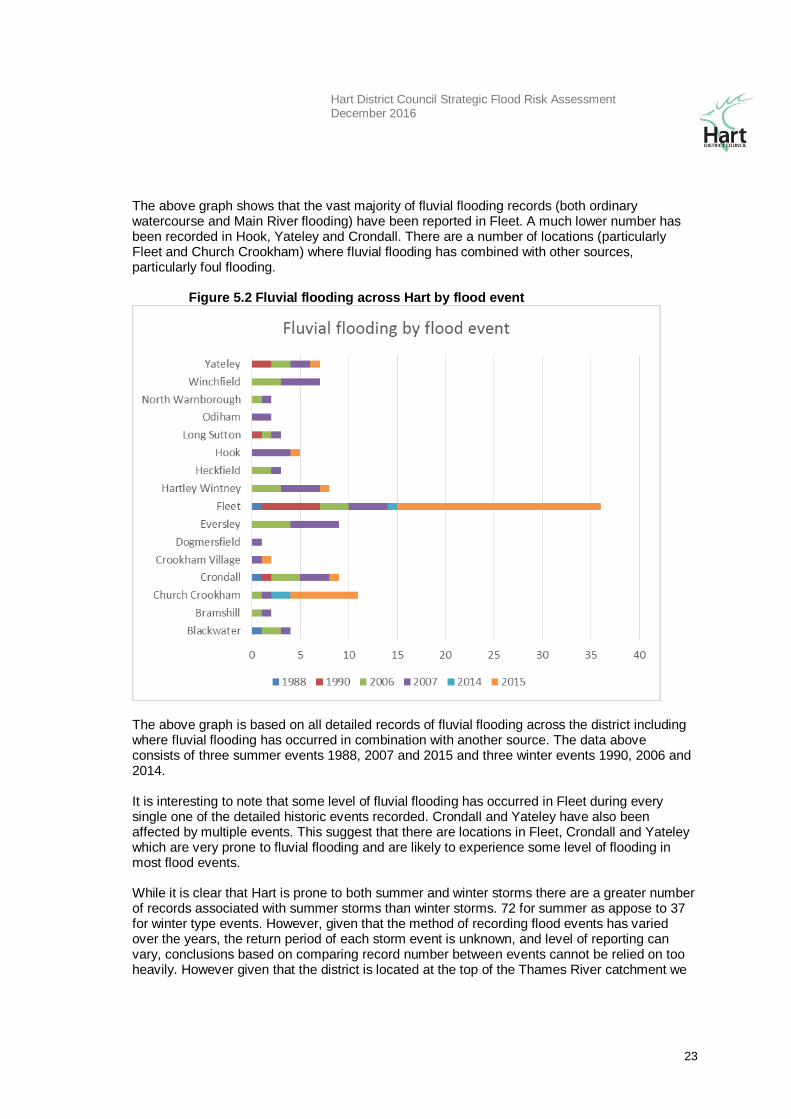
Figure 5.2 Fluvial flooding across Hart by flood event
The above graph is based on all detailed records of fluvial flooding across the district including where fluvial flooding has occurred in combination with another source. The data above consists of three summer events 1988, 2007 and 2015 and three winter events 1990, 2006 and 2014. It is interesting to note that some level of fluvial flooding has occurred in Fleet during every single one of the detailed historic events recorded. Crondall and Yateley have also been affected by multiple events. This suggest that there are locations in Fleet, Crondall and Yateley which are very prone to fluvial flooding and are likely to experience some level of flooding in most flood events. While it is clear that Hart is prone to both summer and winter storms there are a greater number of records associated with summer storms than winter storms. 72 for summer as appose to 37 for winter type events. However, given that the method of recording flood events has varied over the years, the return period of each storm event is unknown, and level of reporting can vary, conclusions based on comparing record number between events cannot be relied on too heavily. However given that the district is located at the top of the Thames River catchment we
Hart District Council Strategic Flood Risk Assessment December 2016
24
would expect Hart to be more prone to intense flashy summer type events which does come out in the data. For more details on historic flooding records please contact Hart District Council directly by emailing [email protected] .
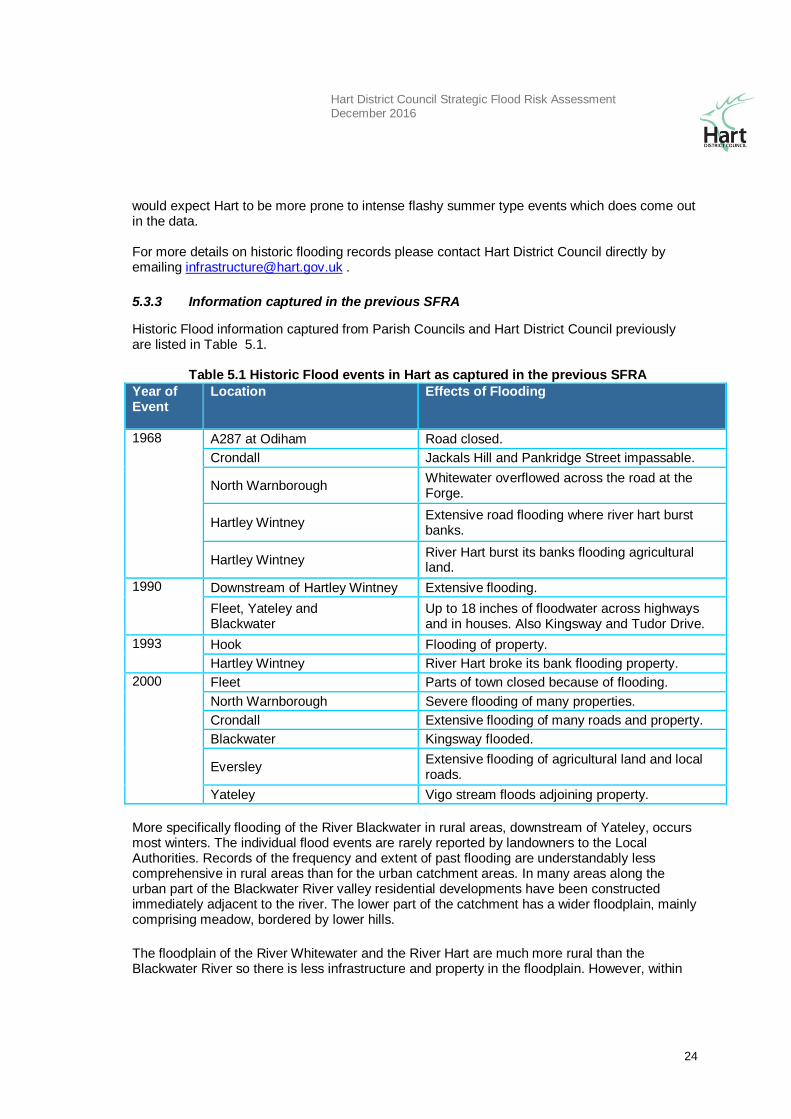
5.3.3 Information captured in the previous SFRA
Historic Flood information captured from Parish Councils and Hart District Council previously are listed in Table 5.1.
Table 5.1 Historic Flood events in Hart as captured in the previous SFRA
Year of Event
Location Effects of Flooding
1968 A287 at Odiham Road closed.
Crondall Jackals Hill and Pankridge Street impassable.
North Warnborough Whitewater overflowed across the road at the Forge.
Hartley Wintney Extensive road flooding where river hart burst banks.
Hartley Wintney River Hart burst its banks flooding agricultural land.
1990 Downstream of Hartley Wintney Extensive flooding.
Fleet, Yateley and Blackwater
Up to 18 inches of floodwater across highways and in houses. Also Kingsway and Tudor Drive.
1993 Hook Flooding of property.
Hartley Wintney River Hart broke its bank flooding property.
2000 Fleet Parts of town closed because of flooding.
North Warnborough Severe flooding of many properties.
Crondall Extensive flooding of many roads and property.
Blackwater Kingsway flooded.
Eversley Extensive flooding of agricultural land and local roads.
Yateley Vigo stream floods adjoining property.
More specifically flooding of the River Blackwater in rural areas, downstream of Yateley, occurs most winters. The individual flood events are rarely reported by landowners to the Local Authorities. Records of the frequency and extent of past flooding are understandably less comprehensive in rural areas than for the urban catchment areas. In many areas along the urban part of the Blackwater River valley residential developments have been constructed immediately adjacent to the river. The lower part of the catchment has a wider floodplain, mainly comprising meadow, bordered by lower hills.
The floodplain of the River Whitewater and the River Hart are much more rural than the Blackwater River so there is less infrastructure and property in the floodplain. However, within
Hart District Council Strategic Flood Risk Assessment December 2016
25
their catchments there are still notable locations of fluvial flood risk. Fleet, Crondall and Hartley Wintney are in the catchment of the River Hart and are some of the highest areas of fluvial flood risk in Hart. Hook and North Warnborough are in the Whitewater catchment and have areas that are very prone to fluvial flooding.
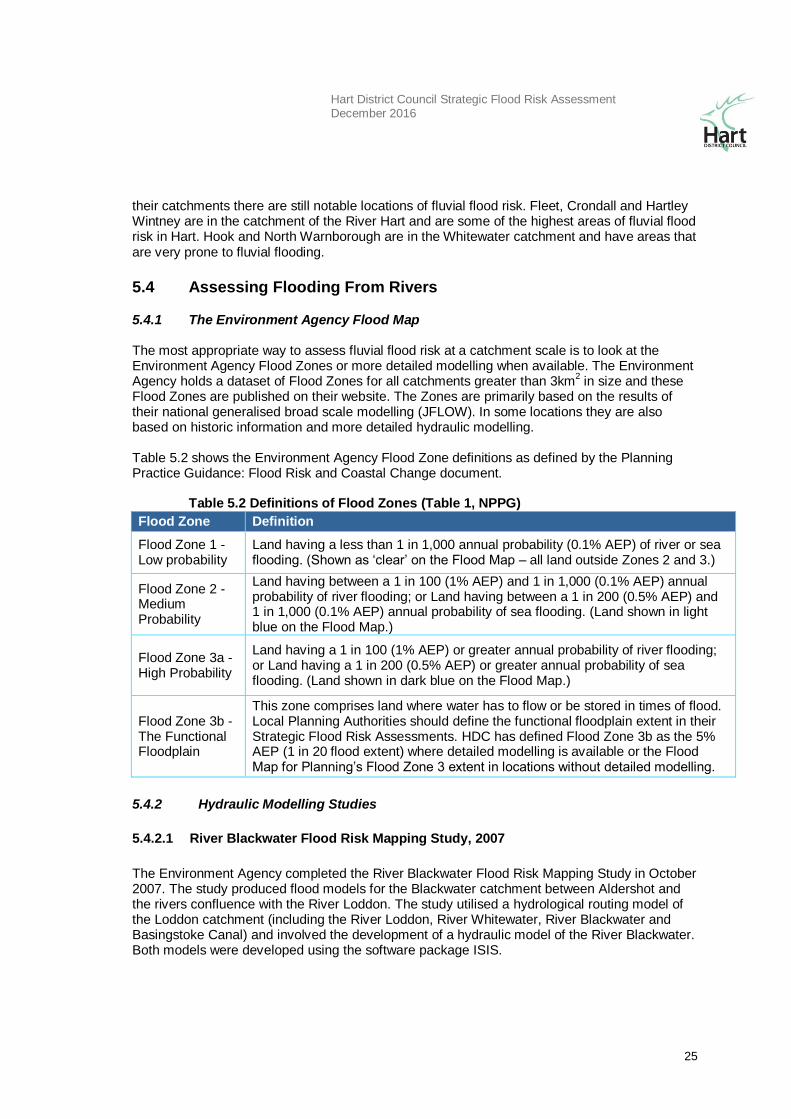
5.4 Assessing Flooding From Rivers
5.4.1 The Environment Agency Flood Map
The most appropriate way to assess fluvial flood risk at a catchment scale is to look at the Environment Agency Flood Zones or more detailed modelling when available. The Environment Agency holds a dataset of Flood Zones for all catchments greater than 3km
2 in size and these
Flood Zones are published on their website. The Zones are primarily based on the results of their national generalised broad scale modelling (JFLOW). In some locations they are also based on historic information and more detailed hydraulic modelling. Table 5.2 shows the Environment Agency Flood Zone definitions as defined by the Planning Practice Guidance: Flood Risk and Coastal Change document.
Table 5.2 Definitions of Flood Zones (Table 1, NPPG)
Flood Zone Definition
Flood Zone 1 - Low probability
Land having a less than 1 in 1,000 annual probability (0.1% AEP) of river or sea flooding. (Shown as ‘clear’ on the Flood Map – all land outside Zones 2 and 3.)
Flood Zone 2 - Medium Probability
Land having between a 1 in 100 (1% AEP) and 1 in 1,000 (0.1% AEP) annual probability of river flooding; or Land having between a 1 in 200 (0.5% AEP) and 1 in 1,000 (0.1% AEP) annual probability of sea flooding. (Land shown in light blue on the Flood Map.)
Flood Zone 3a - High Probability
Land having a 1 in 100 (1% AEP) or greater annual probability of river flooding; or Land having a 1 in 200 (0.5% AEP) or greater annual probability of sea flooding. (Land shown in dark blue on the Flood Map.)
Flood Zone 3b - The Functional Floodplain
This zone comprises land where water has to flow or be stored in times of flood. Local Planning Authorities should define the functional floodplain extent in their Strategic Flood Risk Assessments. HDC has defined Flood Zone 3b as the 5% AEP (1 in 20 flood extent) where detailed modelling is available or the Flood Map for Planning’s Flood Zone 3 extent in locations without detailed modelling.
5.4.2 5.4.2 Hydraulic Modelling Studies
5.4.2.1 River Blackwater Flood Risk Mapping Study, 2007
The Environment Agency completed the River Blackwater Flood Risk Mapping Study in October 2007. The study produced flood models for the Blackwater catchment between Aldershot and the rivers confluence with the River Loddon. The study utilised a hydrological routing model of the Loddon catchment (including the River Loddon, River Whitewater, River Blackwater and Basingstoke Canal) and involved the development of a hydraulic model of the River Blackwater. Both models were developed using the software package ISIS.
Hart District Council Strategic Flood Risk Assessment December 2016
26
The study produced 20%, 5%, 1% and 1% plus climate change flood extents for the undefended and defended case. The only structure considered a defence within the Blackwater model was the Cove Brook Flood Alleviation Scheme. The study did not fully assess the impacts of removing this defence. Cove Brook Flood Alleviation Scheme is outside the study area of the SFRA; however the scheme may have some influence on flooding along the Blackwater within the SFRA study area. The Environment Agency used the 1% undefended flood extents from the Blackwater Study to update Flood Zone 3 on the current Flood Map in 2008.
5.4.2.2 River Blackwater Model Update, 2009 (Capita)
The objective was to update the 2007 ISIS-TUFLOW model to incorporate the recommendations from the 2008 review and produce flood mapping within the study area. The model was built in order to:
Simulate the 13, 21 and 65 hour critical storm durations with the 20%, 5% 1%, 0.1% and the 1% climate change AEP design events (undefended).
Provide a set of maps showing the maximum flood extent based on a combination of the three storm durations for the following AEP events: 20%, 5%, 1%, 0.1%, and the 1% climate change (undefended), between Sandhurst and Swallowfield.
Provide depth, flow and velocity grids within the TUFLOW domain, between (NGR SU 74160 63550) and (NGR SU 84160 60780) based on a combination of the three storm durations for each of the design events.
The depth and velocity grids from this Study have been used to produce fluvial hazard maps along the River Blackwater in the Hart District.
5.4.2.3 River Blackwater Tributaries Modelling Study, 2012
The Environment Agency commissioned JBA Consulting to undertake a Flood Risk Mapping Study of a number of the River Blackwater Tributaries located within the towns of Yateley, Sandhurst and Frimley which span the counties of Berkshire, Hampshire and Surrey. ISIS-TUFLOW models of the modelled tributaries were constructed and used to produce flood extents for a range of return period events, the outputs of which will be used by the Environment Agency to update the Flood Map and in channel levels will be used to update NaFRA. The models were simulated for the following return period events 20% 5%, 1%, 0.1% AEP design events. In addition to this, climate change runs were required for the 100 year return period, whereby peak flows were increased by 20 per cent. Flow estimates for all models (aside from Model 1) were derived using JFlush, a method which is suited to small, urbanised, catchments. Model 1, being more rural, used the FEH Statistical method. Modelled flood outlines, maximum flood water depths, water levels, velocities and hazard grids have been produced; the outlines have been used to define the SFRA Flood Zones, as detailed in Table 5.2.
Hart District Council Strategic Flood Risk Assessment December 2016
27
5.5 Discussion of Fluvial Flooding in Hart
5.5.1 Environment Agency Flood Zones The Environment Agency ‘Flood Map for Planning (Rivers and Sea)’ provides information on the areas that would flood if there were no flood defences or buildings in the ‘natural’ floodplain. The ‘Flood Map for Planning (Rivers and Sea)’ dataset is available on the Environment Agency website (http://apps.environment-agency.gov.uk/wiyby/37837.aspx) and is the main reference for planning purposes as it contains Flood Zones 1, 2 and 3 which are referred to in the NPPF and presented in Table 5.2. The ‘Flood Map for Planning (Rivers and Sea)’ was first developed in 2004 using national generalised modelling (JFLOW) and is now routinely updated and revised using the results from the Environment Agency’s programme of catchment studies, entailing topographic surveys and hydrological and/or hydraulic modelling as well as previous flood events. It should be noted that a separate map is available on the Environment Agency website which is referred to as ‘Risk of Flooding from Rivers and Sea’. This map takes into account the presence of flood defences and so describes the actual chance of flooding, rather than the chance if there were no defences present. While flood defences reduce the level of risk they do not completely remove it as they can be overtopped or fail in extreme weather conditions, or if they are in poor condition. As a result the maps may show areas behind defences which still have some risk of flooding. This mapping has been made available by the Environment Agency as the primary method of communicating flood risk to members of the public, however for planning purposes the ‘Flood Map for Planning (Rivers and Sea); and associated Flood Zones remains the primary source of information.
Hart District Council Strategic Flood Risk Assessment December 2016
28
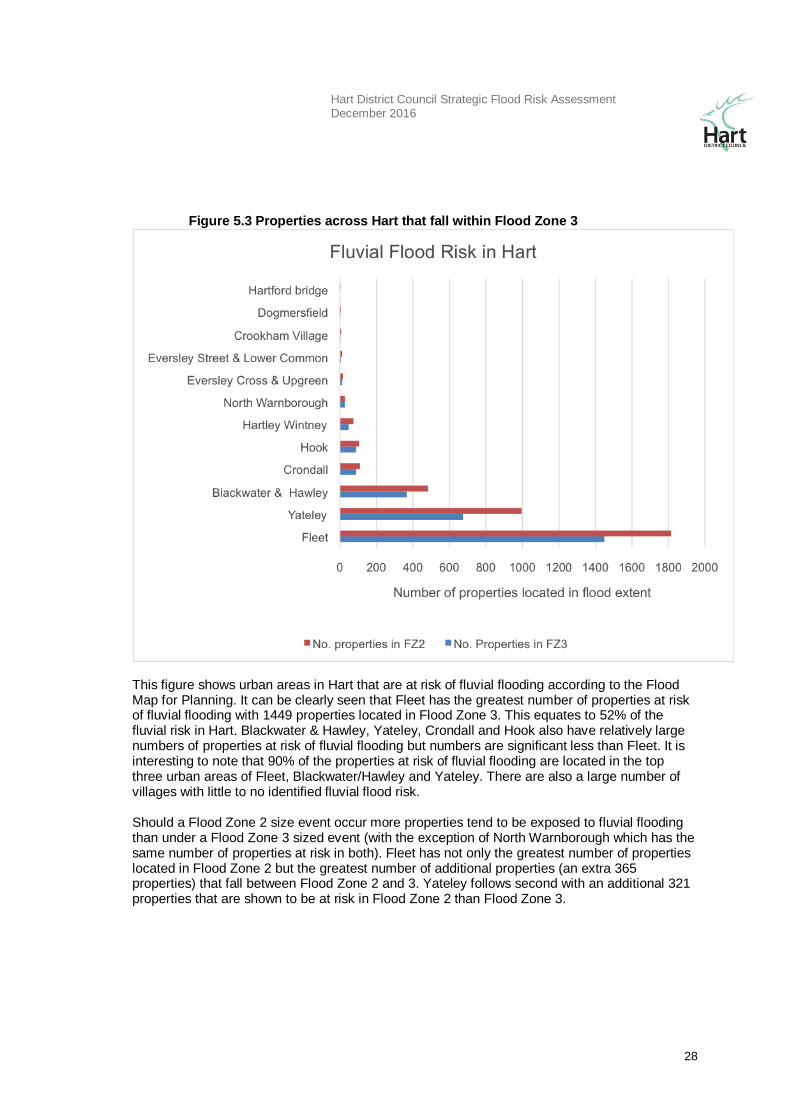
Figure 5.3 Properties across Hart that fall within Flood Zone 3
This figure shows urban areas in Hart that are at risk of fluvial flooding according to the Flood Map for Planning. It can be clearly seen that Fleet has the greatest number of properties at risk of fluvial flooding with 1449 properties located in Flood Zone 3. This equates to 52% of the fluvial risk in Hart. Blackwater & Hawley, Yateley, Crondall and Hook also have relatively large numbers of properties at risk of fluvial flooding but numbers are significant less than Fleet. It is interesting to note that 90% of the properties at risk of fluvial flooding are located in the top three urban areas of Fleet, Blackwater/Hawley and Yateley. There are also a large number of villages with little to no identified fluvial flood risk. Should a Flood Zone 2 size event occur more properties tend to be exposed to fluvial flooding than under a Flood Zone 3 sized event (with the exception of North Warnborough which has the same number of properties at risk in both). Fleet has not only the greatest number of properties located in Flood Zone 2 but the greatest number of additional properties (an extra 365 properties) that fall between Flood Zone 2 and 3. Yateley follows second with an additional 321 properties that are shown to be at risk in Flood Zone 2 than Flood Zone 3.
Hart District Council Strategic Flood Risk Assessment December 2016
29
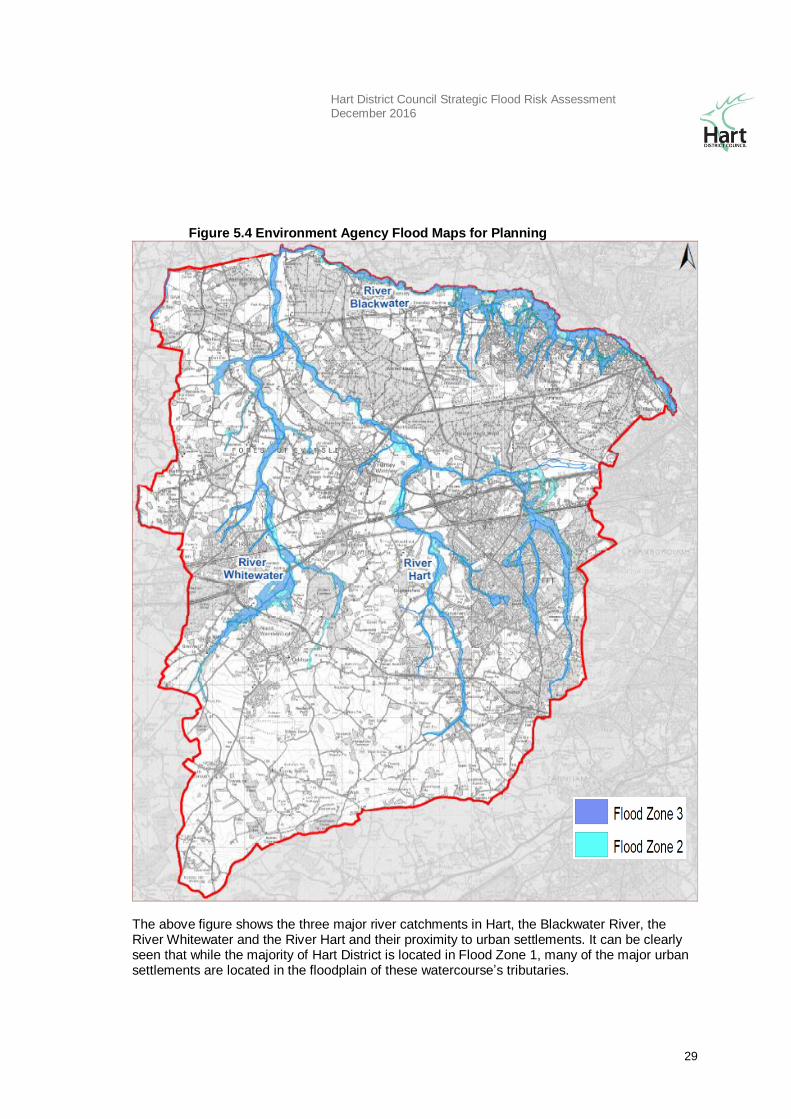
Figure 5.4 Environment Agency Flood Maps for Planning
The above figure shows the three major river catchments in Hart, the Blackwater River, the River Whitewater and the River Hart and their proximity to urban settlements. It can be clearly seen that while the majority of Hart District is located in Flood Zone 1, many of the major urban settlements are located in the floodplain of these watercourse’s tributaries.
Hart District Council Strategic Flood Risk Assessment December 2016
30
5.5.2 SFRA Flood Zones
5.5.2.1 Definition of Functional Floodplain: Flood Zone 3b
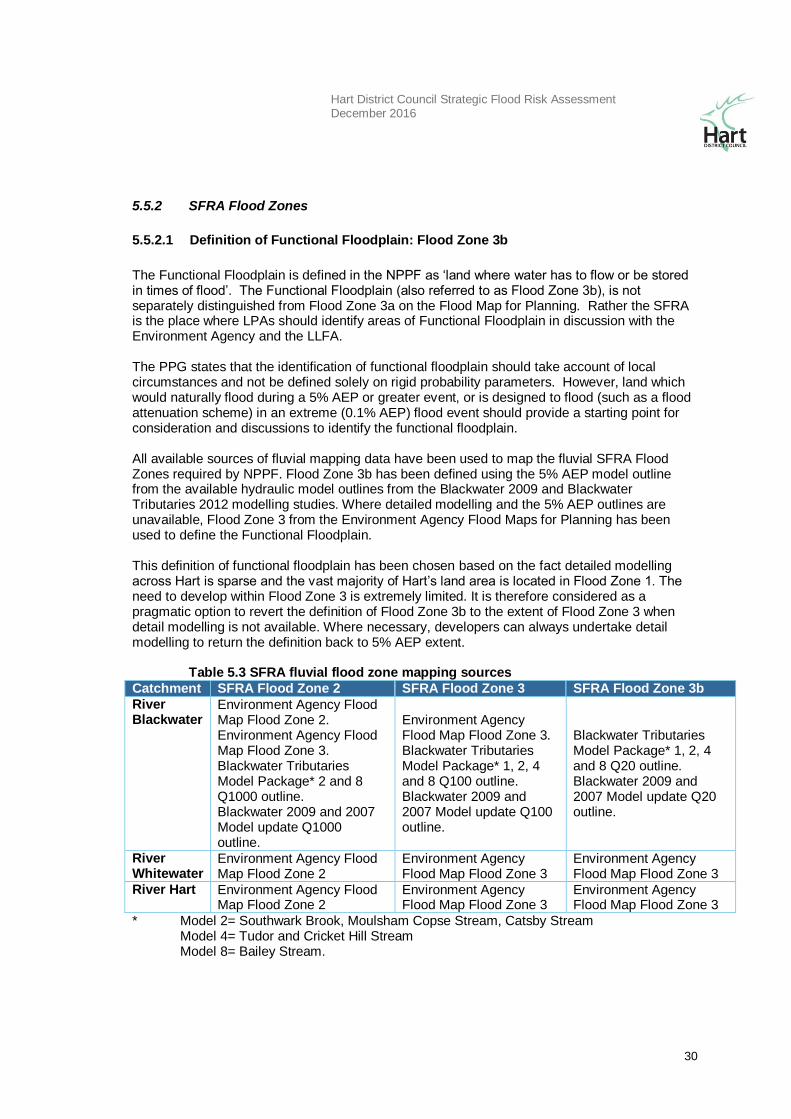
The Functional Floodplain is defined in the NPPF as ‘land where water has to flow or be stored in times of flood’. The Functional Floodplain (also referred to as Flood Zone 3b), is not separately distinguished from Flood Zone 3a on the Flood Map for Planning. Rather the SFRA is the place where LPAs should identify areas of Functional Floodplain in discussion with the Environment Agency and the LLFA. The PPG states that the identification of functional floodplain should take account of local circumstances and not be defined solely on rigid probability parameters. However, land which would naturally flood during a 5% AEP or greater event, or is designed to flood (such as a flood attenuation scheme) in an extreme (0.1% AEP) flood event should provide a starting point for consideration and discussions to identify the functional floodplain. All available sources of fluvial mapping data have been used to map the fluvial SFRA Flood Zones required by NPPF. Flood Zone 3b has been defined using the 5% AEP model outline from the available hydraulic model outlines from the Blackwater 2009 and Blackwater Tributaries 2012 modelling studies. Where detailed modelling and the 5% AEP outlines are unavailable, Flood Zone 3 from the Environment Agency Flood Maps for Planning has been used to define the Functional Floodplain. This definition of functional floodplain has been chosen based on the fact detailed modelling across Hart is sparse and the vast majority of Hart’s land area is located in Flood Zone 1. The need to develop within Flood Zone 3 is extremely limited. It is therefore considered as a pragmatic option to revert the definition of Flood Zone 3b to the extent of Flood Zone 3 when detail modelling is not available. Where necessary, developers can always undertake detail modelling to return the definition back to 5% AEP extent.
Table 5.3 SFRA fluvial flood zone mapping sources
Catchment SFRA Flood Zone 2 SFRA Flood Zone 3 SFRA Flood Zone 3b
River Blackwater
Environment Agency Flood Map Flood Zone 2. Environment Agency Flood Map Flood Zone 3. Blackwater Tributaries Model Package* 2 and 8 Q1000 outline. Blackwater 2009 and 2007 Model update Q1000 outline.
Environment Agency Flood Map Flood Zone 3. Blackwater Tributaries Model Package* 1, 2, 4 and 8 Q100 outline. Blackwater 2009 and 2007 Model update Q100 outline.
Blackwater Tributaries Model Package* 1, 2, 4 and 8 Q20 outline. Blackwater 2009 and 2007 Model update Q20 outline.
River Whitewater
Environment Agency Flood Map Flood Zone 2
Environment Agency Flood Map Flood Zone 3
Environment Agency Flood Map Flood Zone 3
River Hart Environment Agency Flood Map Flood Zone 2
Environment Agency Flood Map Flood Zone 3
Environment Agency Flood Map Flood Zone 3
* Model 2= Southwark Brook, Moulsham Copse Stream, Catsby Stream Model 4= Tudor and Cricket Hill Stream Model 8= Bailey Stream.
Hart District Council Strategic Flood Risk Assessment December 2016
31
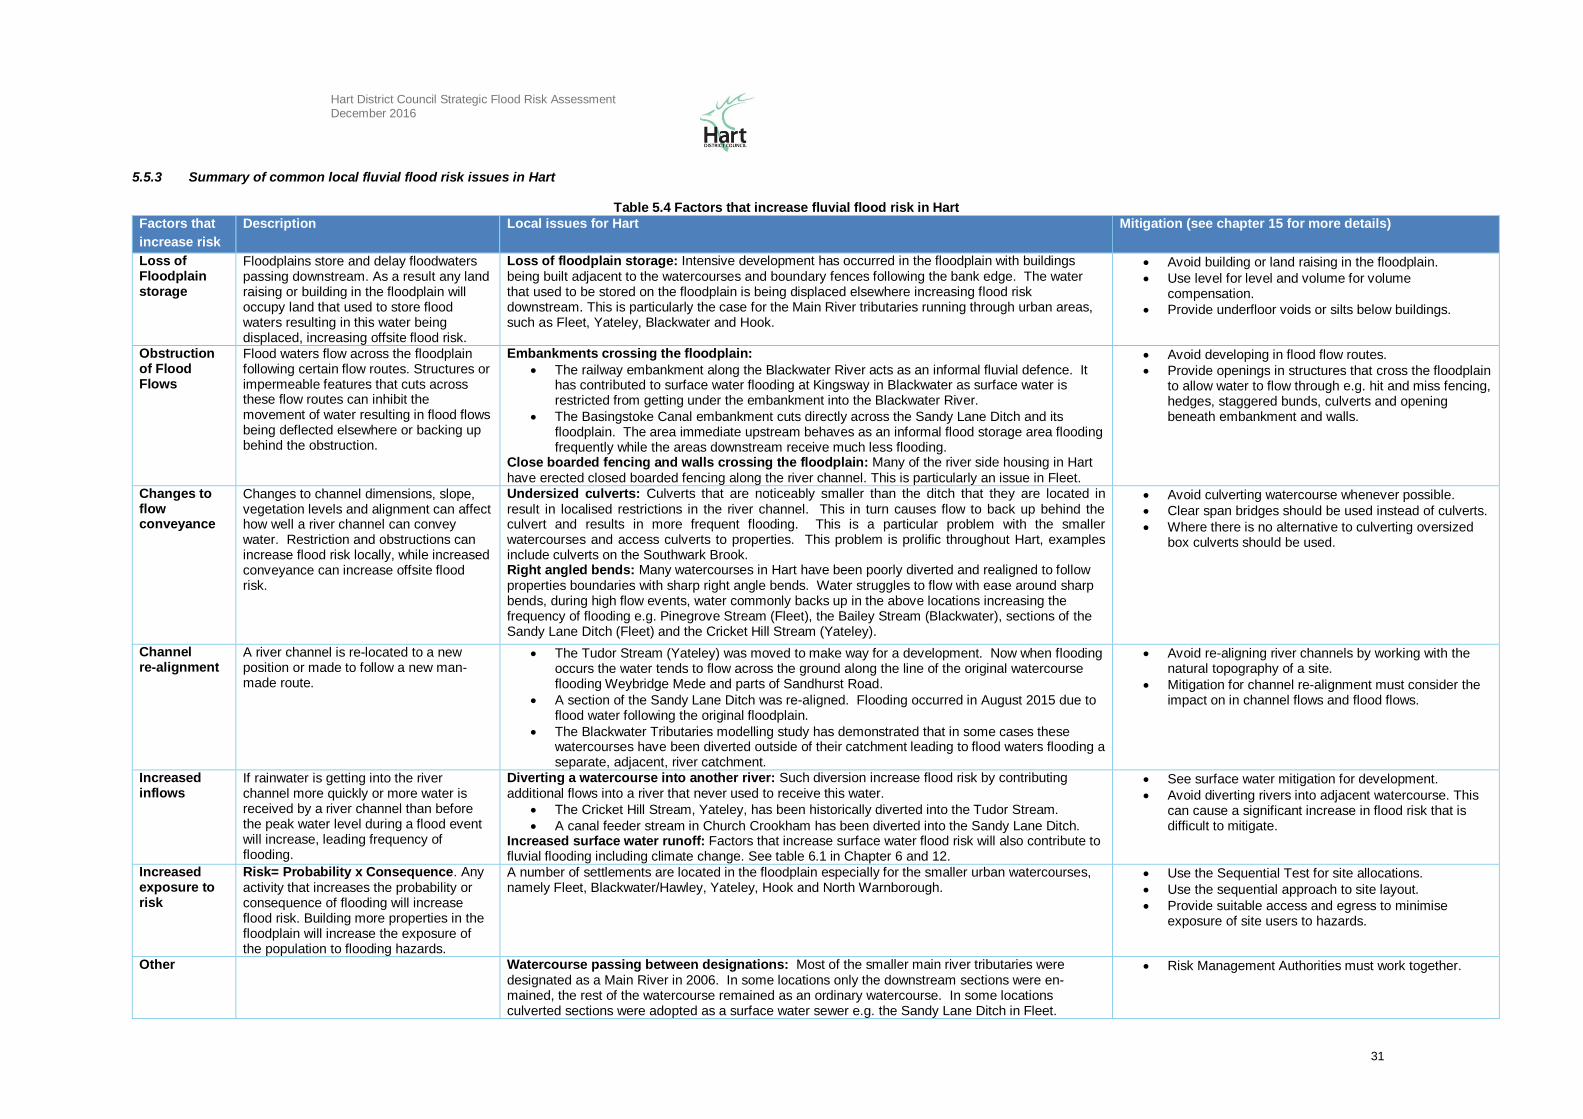
5.5.3 Summary of common local fluvial flood risk issues in Hart
Table 5.4 Factors that increase fluvial flood risk in Hart
Factors that
increase risk
Description Local issues for Hart Mitigation (see chapter 15 for more details)
Loss of Floodplain storage
Floodplains store and delay floodwaters passing downstream. As a result any land raising or building in the floodplain will occupy land that used to store flood waters resulting in this water being displaced, increasing offsite flood risk.
Loss of floodplain storage: Intensive development has occurred in the floodplain with buildings being built adjacent to the watercourses and boundary fences following the bank edge. The water that used to be stored on the floodplain is being displaced elsewhere increasing flood risk downstream. This is particularly the case for the Main River tributaries running through urban areas, such as Fleet, Yateley, Blackwater and Hook.
Avoid building or land raising in the floodplain.
Use level for level and volume for volume compensation.
Provide underfloor voids or silts below buildings.
Obstruction of Flood Flows
Flood waters flow across the floodplain following certain flow routes. Structures or impermeable features that cuts across these flow routes can inhibit the movement of water resulting in flood flows being deflected elsewhere or backing up behind the obstruction.
Embankments crossing the floodplain:
The railway embankment along the Blackwater River acts as an informal fluvial defence. It has contributed to surface water flooding at Kingsway in Blackwater as surface water is restricted from getting under the embankment into the Blackwater River.
The Basingstoke Canal embankment cuts directly across the Sandy Lane Ditch and its floodplain. The area immediate upstream behaves as an informal flood storage area flooding frequently while the areas downstream receive much less flooding.
Close boarded fencing and walls crossing the floodplain: Many of the river side housing in Hart have erected closed boarded fencing along the river channel. This is particularly an issue in Fleet.
Avoid developing in flood flow routes.
Provide openings in structures that cross the floodplain to allow water to flow through e.g. hit and miss fencing, hedges, staggered bunds, culverts and opening beneath embankment and walls.
Changes to flow conveyance
Changes to channel dimensions, slope, vegetation levels and alignment can affect how well a river channel can convey water. Restriction and obstructions can increase flood risk locally, while increased conveyance can increase offsite flood risk.
Undersized culverts: Culverts that are noticeably smaller than the ditch that they are located in result in localised restrictions in the river channel. This in turn causes flow to back up behind the culvert and results in more frequent flooding. This is a particular problem with the smaller watercourses and access culverts to properties. This problem is prolific throughout Hart, examples include culverts on the Southwark Brook. Right angled bends: Many watercourses in Hart have been poorly diverted and realigned to follow properties boundaries with sharp right angle bends. Water struggles to flow with ease around sharp bends, during high flow events, water commonly backs up in the above locations increasing the frequency of flooding e.g. Pinegrove Stream (Fleet), the Bailey Stream (Blackwater), sections of the Sandy Lane Ditch (Fleet) and the Cricket Hill Stream (Yateley).
Avoid culverting watercourse whenever possible.
Clear span bridges should be used instead of culverts.
Where there is no alternative to culverting oversized box culverts should be used.
Channel re-alignment
A river channel is re-located to a new position or made to follow a new man-made route.
The Tudor Stream (Yateley) was moved to make way for a development. Now when flooding occurs the water tends to flow across the ground along the line of the original watercourse flooding Weybridge Mede and parts of Sandhurst Road.
A section of the Sandy Lane Ditch was re-aligned. Flooding occurred in August 2015 due to flood water following the original floodplain.
The Blackwater Tributaries modelling study has demonstrated that in some cases these watercourses have been diverted outside of their catchment leading to flood waters flooding a separate, adjacent, river catchment.
Avoid re-aligning river channels by working with the natural topography of a site.
Mitigation for channel re-alignment must consider the impact on in channel flows and flood flows.
Increased inflows
If rainwater is getting into the river channel more quickly or more water is received by a river channel than before the peak water level during a flood event will increase, leading frequency of flooding.
Diverting a watercourse into another river: Such diversion increase flood risk by contributing additional flows into a river that never used to receive this water.
The Cricket Hill Stream, Yateley, has been historically diverted into the Tudor Stream.
A canal feeder stream in Church Crookham has been diverted into the Sandy Lane Ditch. Increased surface water runoff: Factors that increase surface water flood risk will also contribute to fluvial flooding including climate change. See table 6.1 in Chapter 6 and 12.
See surface water mitigation for development.
Avoid diverting rivers into adjacent watercourse. This can cause a significant increase in flood risk that is difficult to mitigate.
Increased exposure to risk
Risk= Probability x Consequence. Any activity that increases the probability or consequence of flooding will increase flood risk. Building more properties in the floodplain will increase the exposure of the population to flooding hazards.
A number of settlements are located in the floodplain especially for the smaller urban watercourses, namely Fleet, Blackwater/Hawley, Yateley, Hook and North Warnborough.
Use the Sequential Test for site allocations.
Use the sequential approach to site layout.
Provide suitable access and egress to minimise exposure of site users to hazards.
Other Watercourse passing between designations: Most of the smaller main river tributaries were designated as a Main River in 2006. In some locations only the downstream sections were en-mained, the rest of the watercourse remained as an ordinary watercourse. In some locations culverted sections were adopted as a surface water sewer e.g. the Sandy Lane Ditch in Fleet.
Risk Management Authorities must work together.
Hart District Council Strategic Flood Risk Assessment December 2016
32
5.6 Management of Fluvial Flooding in Hart
Flooding from rivers can be managed in a number of ways, including: • Avoidance - developing outside of the floodplain. • Prevention - walls and embankments used to exclude water from a site, improved
channel conveyance, pumping or flood storage areas used to attenuate/retain peak flood flows upstream.
• Management - flood resilient design, flood warning, evacuation and emergency planning, and flood awareness.
The most suitable type of flood management for a site depends on site specific conditions, the receptor of flooding and the type of flooding.
5.7 Planning Considerations
NPPF requires that decision makers use the SFRA to inform their knowledge of flooding, refine the information on the Flood Map and determine the variations in flood risk from all sources of flooding across and from their area. These should form the basis for preparing appropriate policies for flood risk management for these areas. Flooding from rivers is one of the most destructive forms of flooding in England and Wales. As such, areas liable to flood are usually more refined than other sources. A large amount of information can be obtained from local councils or Environment Agency staff, and/or National datasets, such as the Environment Agency Flood Zones. Any potential land use planning decisions should be made after consulting these sources. NPPF requires a precautionary approach to be undertaken when making land use planning decisions regarding flood risk. This is partly due to the considerable uncertainty surrounding flooding mechanisms and how flooding may respond to climate change. It is also due to the potentially devastating consequences of flooding to the people and property affected. Consideration also needs to be given to planning policies in adjacent local authorities as increased urbanisation along the Blackwater valley may increase flood risk in Hart if not managed appropriately.
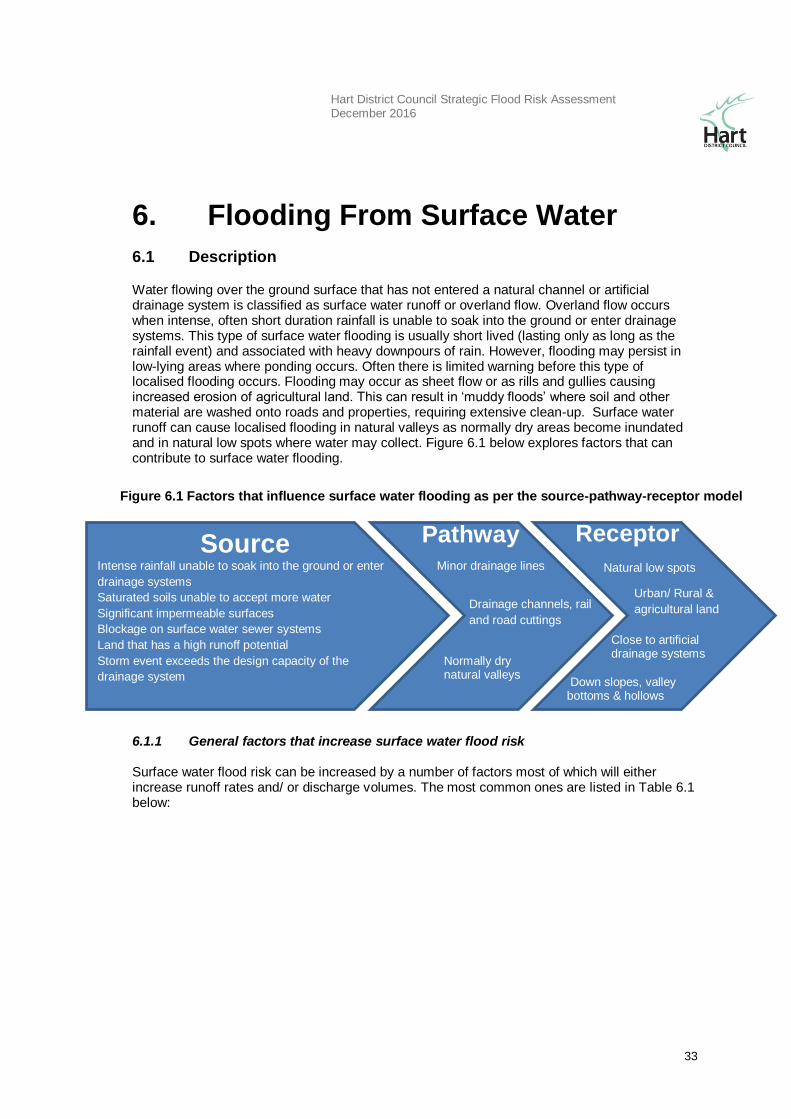
Hart District Council Strategic Flood Risk Assessment December 2016
33
6. Flooding From Surface Water
6.1 Description
Water flowing over the ground surface that has not entered a natural channel or artificial drainage system is classified as surface water runoff or overland flow. Overland flow occurs when intense, often short duration rainfall is unable to soak into the ground or enter drainage systems. This type of surface water flooding is usually short lived (lasting only as long as the rainfall event) and associated with heavy downpours of rain. However, flooding may persist in low-lying areas where ponding occurs. Often there is limited warning before this type of localised flooding occurs. Flooding may occur as sheet flow or as rills and gullies causing increased erosion of agricultural land. This can result in ‘muddy floods’ where soil and other material are washed onto roads and properties, requiring extensive clean-up. Surface water runoff can cause localised flooding in natural valleys as normally dry areas become inundated and in natural low spots where water may collect. Figure 6.1 below explores factors that can contribute to surface water flooding.
6.1.1 General factors that increase surface water flood risk Surface water flood risk can be increased by a number of factors most of which will either increase runoff rates and/ or discharge volumes. The most common ones are listed in Table 6.1 below:
Figure 6.1 Factors that influence surface water flooding as per the source-pathway-receptor model
Source
Intense rainfall unable to soak into the ground or enter
drainage systems
Saturated soils unable to accept more water
Significant impermeable surfaces
Blockage on surface water sewer systems
Land that has a high runoff potential
Storm event exceeds the design capacity of the
drainage system
Pathway Receptor
Minor drainage lines
Drainage channels, rail
and road cuttings
Normally dry natural valleys
Natural low spots
Urban/ Rural &
agricultural land
Close to artificial drainage systems
Down slopes, valley bottoms & hollows
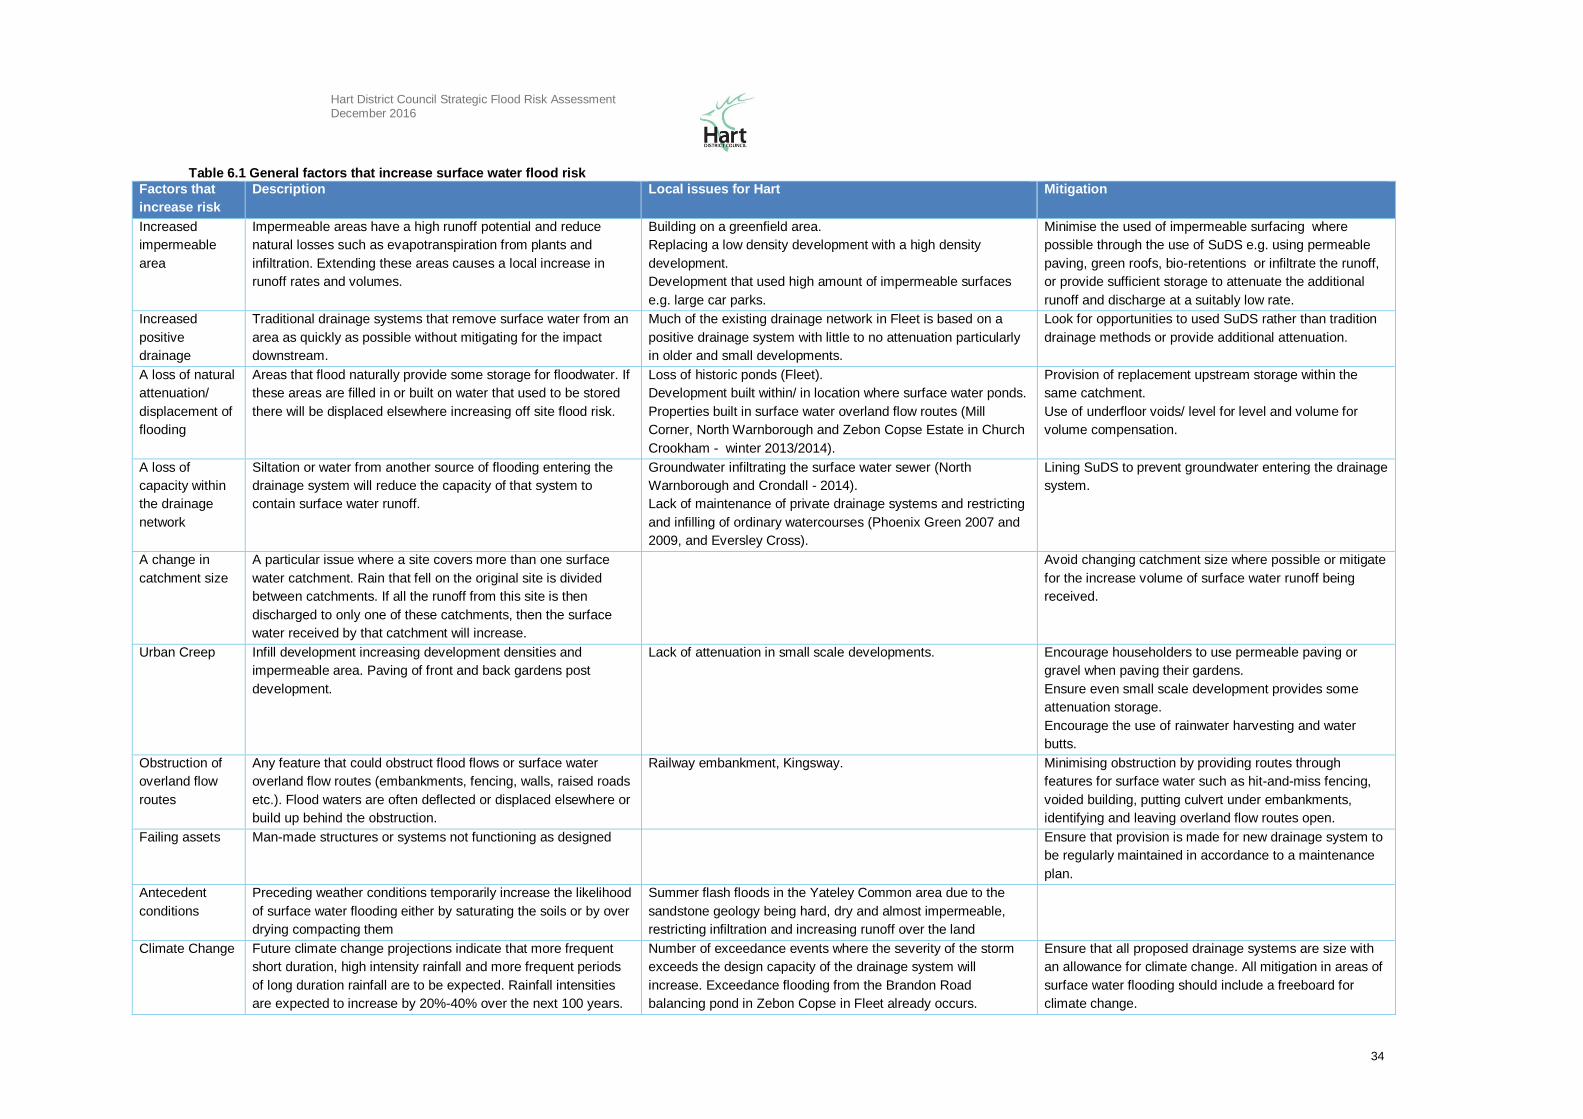
Hart District Council Strategic Flood Risk Assessment December 2016
34
Table 6.1 General factors that increase surface water flood risk
Factors that
increase risk
Description Local issues for Hart Mitigation
Increased
impermeable
area
Impermeable areas have a high runoff potential and reduce
natural losses such as evapotranspiration from plants and
infiltration. Extending these areas causes a local increase in
runoff rates and volumes.
Building on a greenfield area.
Replacing a low density development with a high density
development.
Development that used high amount of impermeable surfaces
e.g. large car parks.
Minimise the used of impermeable surfacing where
possible through the use of SuDS e.g. using permeable
paving, green roofs, bio-retentions or infiltrate the runoff,
or provide sufficient storage to attenuate the additional
runoff and discharge at a suitably low rate.
Increased
positive
drainage
Traditional drainage systems that remove surface water from an
area as quickly as possible without mitigating for the impact
downstream.
Much of the existing drainage network in Fleet is based on a
positive drainage system with little to no attenuation particularly
in older and small developments.
Look for opportunities to used SuDS rather than tradition
drainage methods or provide additional attenuation.
A loss of natural
attenuation/
displacement of
flooding
Areas that flood naturally provide some storage for floodwater. If
these areas are filled in or built on water that used to be stored
there will be displaced elsewhere increasing off site flood risk.
Loss of historic ponds (Fleet).
Development built within/ in location where surface water ponds.
Properties built in surface water overland flow routes (Mill
Corner, North Warnborough and Zebon Copse Estate in Church
Crookham - winter 2013/2014).
Provision of replacement upstream storage within the
same catchment.
Use of underfloor voids/ level for level and volume for
volume compensation.
A loss of
capacity within
the drainage
network
Siltation or water from another source of flooding entering the
drainage system will reduce the capacity of that system to
contain surface water runoff.
Groundwater infiltrating the surface water sewer (North
Warnborough and Crondall - 2014).
Lack of maintenance of private drainage systems and restricting
and infilling of ordinary watercourses (Phoenix Green 2007 and
2009, and Eversley Cross).
Lining SuDS to prevent groundwater entering the drainage
system.
A change in
catchment size
A particular issue where a site covers more than one surface
water catchment. Rain that fell on the original site is divided
between catchments. If all the runoff from this site is then
discharged to only one of these catchments, then the surface
water received by that catchment will increase.
Avoid changing catchment size where possible or mitigate
for the increase volume of surface water runoff being
received.
Urban Creep Infill development increasing development densities and
impermeable area. Paving of front and back gardens post
development.
Lack of attenuation in small scale developments.
Encourage householders to use permeable paving or
gravel when paving their gardens.
Ensure even small scale development provides some
attenuation storage.
Encourage the use of rainwater harvesting and water
butts.
Obstruction of
overland flow
routes
Any feature that could obstruct flood flows or surface water
overland flow routes (embankments, fencing, walls, raised roads
etc.). Flood waters are often deflected or displaced elsewhere or
build up behind the obstruction.
Railway embankment, Kingsway.
Minimising obstruction by providing routes through
features for surface water such as hit-and-miss fencing,
voided building, putting culvert under embankments,
identifying and leaving overland flow routes open.
Failing assets Man-made structures or systems not functioning as designed Ensure that provision is made for new drainage system to
be regularly maintained in accordance to a maintenance
plan.
Antecedent
conditions
Preceding weather conditions temporarily increase the likelihood
of surface water flooding either by saturating the soils or by over
drying compacting them
Summer flash floods in the Yateley Common area due to the
sandstone geology being hard, dry and almost impermeable,
restricting infiltration and increasing runoff over the land
Climate Change Future climate change projections indicate that more frequent
short duration, high intensity rainfall and more frequent periods
of long duration rainfall are to be expected. Rainfall intensities
are expected to increase by 20%-40% over the next 100 years.
Number of exceedance events where the severity of the storm
exceeds the design capacity of the drainage system will
increase. Exceedance flooding from the Brandon Road
balancing pond in Zebon Copse in Fleet already occurs.
Ensure that all proposed drainage systems are size with
an allowance for climate change. All mitigation in areas of
surface water flooding should include a freeboard for
climate change.

Hart District Council Strategic Flood Risk Assessment December 2016
35
Page intentionally blank
Hart District Council Strategic Flood Risk Assessment December 2016
36
6.2 Data Collection
Historic records of surface water flooding were obtained from Hart District Council and this was used in combination with the Environment Agency’s two surface water flood models: the Updated Flood Map for Surface Water (uFMfSW) and the Flood Map for Surface Water (FMfSW).
6.3 Historical Surface Water Flood Events
Across the study area surface water runoff is potentially an issue due to the impermeable soil and geology for a large section of the catchment. As there are significant areas of agriculture across the study area, particularly to the west, surface water flooding that may affect these areas is unlikely to be reported. It is worth noting that while historic records indicate when flooding has affected a location; they may not always correctly identify the source. It can be difficult to identify the cause of flooding when the water has travelled some distance from its source. The records of flooding therefore provide an indication of areas at risk, but the historic records often lacked a description of the mechanism of flooding and are generally limited to populated areas where incidents are reported.
6.3.1 Hart District Council’s records of surface water flooding
The quality and detail of records held by Hart District Council vary from event to event and across the district. However, the events with detailed records (May 1988, February 1990, November/ December 2006, July 2007 December 2013/January 2014 and August 2015) contain sufficient information to allow in depth analysis. The results can be seen below:
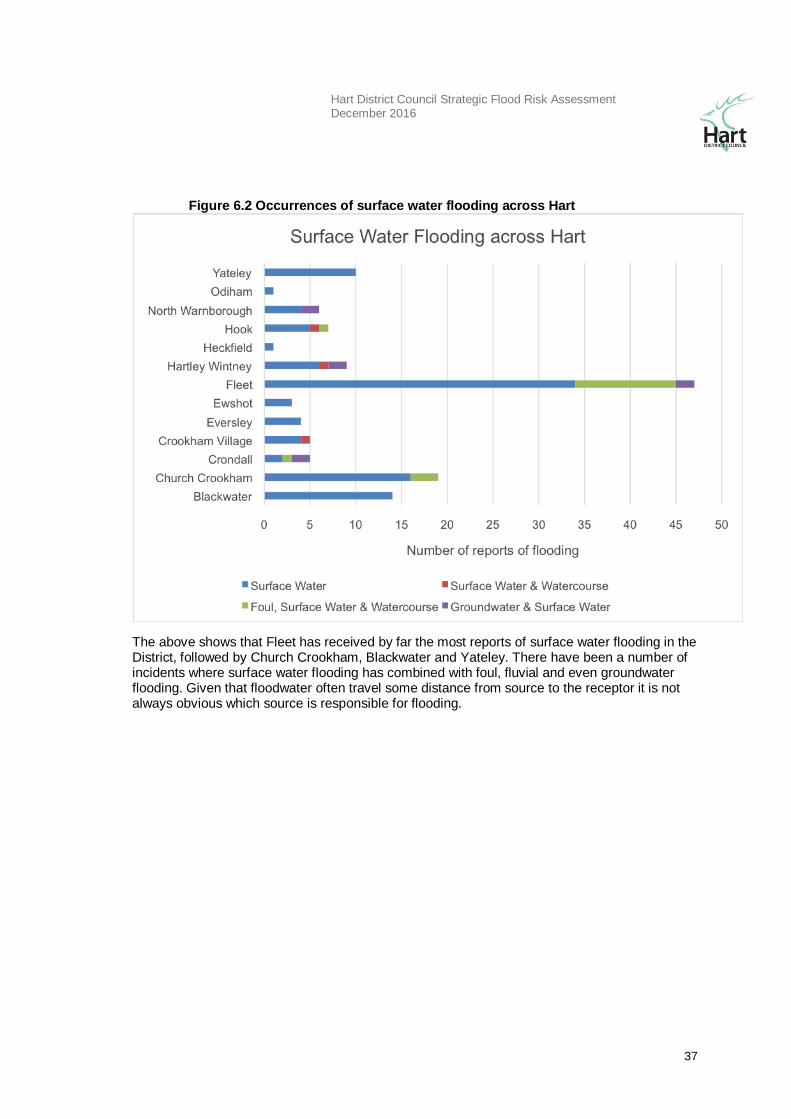
Hart District Council Strategic Flood Risk Assessment December 2016
37
Figure 6.2 Occurrences of surface water flooding across Hart
The above shows that Fleet has received by far the most reports of surface water flooding in the District, followed by Church Crookham, Blackwater and Yateley. There have been a number of incidents where surface water flooding has combined with foul, fluvial and even groundwater flooding. Given that floodwater often travel some distance from source to the receptor it is not always obvious which source is responsible for flooding.
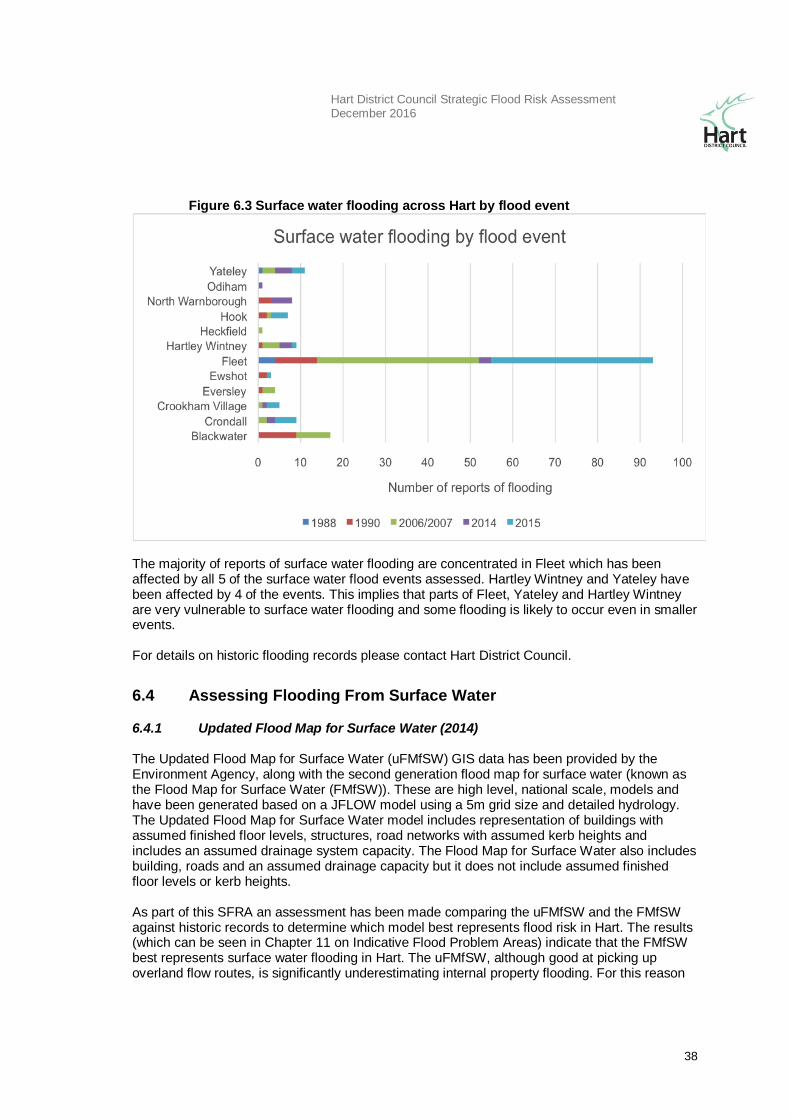
Hart District Council Strategic Flood Risk Assessment December 2016
38
Figure 6.3 Surface water flooding across Hart by flood event
The majority of reports of surface water flooding are concentrated in Fleet which has been affected by all 5 of the surface water flood events assessed. Hartley Wintney and Yateley have been affected by 4 of the events. This implies that parts of Fleet, Yateley and Hartley Wintney are very vulnerable to surface water flooding and some flooding is likely to occur even in smaller events. For details on historic flooding records please contact Hart District Council.
6.4 Assessing Flooding From Surface Water
6.4.1 6.4.1 Updated Flood Map for Surface Water (2014)
The Updated Flood Map for Surface Water (uFMfSW) GIS data has been provided by the Environment Agency, along with the second generation flood map for surface water (known as the Flood Map for Surface Water (FMfSW)). These are high level, national scale, models and have been generated based on a JFLOW model using a 5m grid size and detailed hydrology. The Updated Flood Map for Surface Water model includes representation of buildings with assumed finished floor levels, structures, road networks with assumed kerb heights and includes an assumed drainage system capacity. The Flood Map for Surface Water also includes building, roads and an assumed drainage capacity but it does not include assumed finished floor levels or kerb heights. As part of this SFRA an assessment has been made comparing the uFMfSW and the FMfSW against historic records to determine which model best represents flood risk in Hart. The results (which can be seen in Chapter 11 on Indicative Flood Problem Areas) indicate that the FMfSW best represents surface water flooding in Hart. The uFMfSW, although good at picking up overland flow routes, is significantly underestimating internal property flooding. For this reason
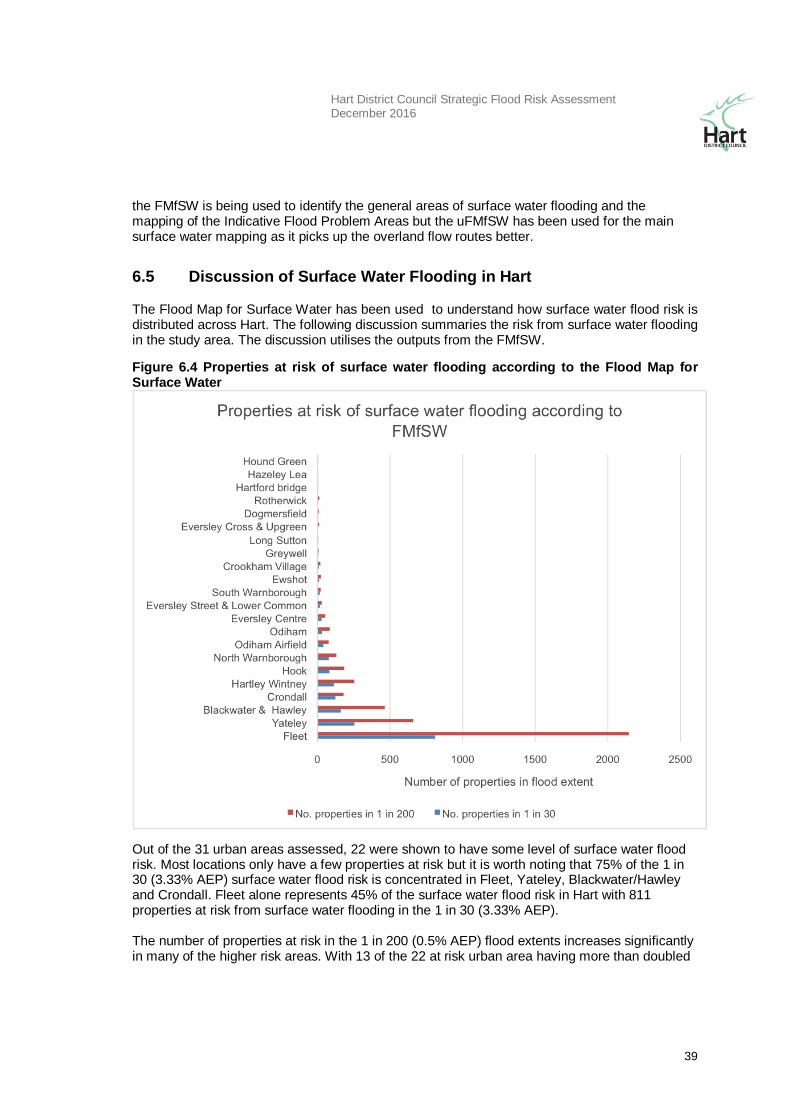
Hart District Council Strategic Flood Risk Assessment December 2016
39
the FMfSW is being used to identify the general areas of surface water flooding and the mapping of the Indicative Flood Problem Areas but the uFMfSW has been used for the main surface water mapping as it picks up the overland flow routes better.
6.5 Discussion of Surface Water Flooding in Hart
The Flood Map for Surface Water has been used to understand how surface water flood risk is distributed across Hart. The following discussion summaries the risk from surface water flooding in the study area. The discussion utilises the outputs from the FMfSW.
Figure 6.4 Properties at risk of surface water flooding according to the Flood Map for Surface Water
Out of the 31 urban areas assessed, 22 were shown to have some level of surface water flood risk. Most locations only have a few properties at risk but it is worth noting that 75% of the 1 in 30 (3.33% AEP) surface water flood risk is concentrated in Fleet, Yateley, Blackwater/Hawley and Crondall. Fleet alone represents 45% of the surface water flood risk in Hart with 811 properties at risk from surface water flooding in the 1 in 30 (3.33% AEP). The number of properties at risk in the 1 in 200 (0.5% AEP) flood extents increases significantly in many of the higher risk areas. With 13 of the 22 at risk urban area having more than doubled
Hart District Council Strategic Flood Risk Assessment December 2016
40
the number of properties at risk from surface water flooding in the 1 in 200 (0.5% AEP) compared to the 1 in 30 (3.33% AEP) extent.
6.5.1 The impact of surface water flood risk on other sources
Surface water flooding often contributes to other sources of flooding and in particular can directly increase the risk of fluvial and sewer flooding. For some of the smaller urban watercourses in Fleet, Blackwater, Yateley and Hook the majority of their catchments consists of intensive existing development with high surface water runoff rates. This is very likely to result in increased water levels within local watercourses compared to the natural catchment river levels. The careful management and mitigation of surface water flood risk may therefore have wider flood risk benefits for Hart.
6.6 Planning Considerations
A form of mitigation is Sustainable Drainage Systems (SuDS) which are softer engineering solutions designed to mimic natural drainage to manage surface water as close to its source as possible. The NPPF states that local planning authorities should further the use of SuDS by, amongst other things, adopting policies for incorporating SuDS requirements in local development documents. (Further guidance on SuDS is provided in Chapter 14.) It is important to consider the risk of surface water flooding when allocating development sites.
Hart District Council Strategic Flood Risk Assessment December 2016
41
7. Flooding From Sewers
7.1 Description
There are three types of sewer:
surface water sewers - which are design to drain away rainwater only;
foul sewers - deal with raw sewerage only, and
combined sewers - which are designed to take both foul and surface water.
There are very few designed combined sewers in Hart as most are designed to take foul or surface water only. Sewer flooding occurs when water backs up in the sewer until it emerges from manholes etc. With foul sewer flooding water may also emerge from internal household pipework including toilets, sinks and baths. Since surface water and foul sewerage are kept separate, in theory foul sewer flooding should only occur if there is a blockage in the foul sewer or if there is an asset failure such as the breakdown of a pumping station. In such instances flooding can be rapid and unpredictable. Flooding from a surface water sewer is expected if a storm event exceeds the capacity of the surface water system or there is a blockage. Flooding is often exacerbated by topography, as water from surcharged manholes will flow into low-lying land which may already be suffering from other types of flooding. With the exception of blockages on a foul sewer, most instances of foul flooding occur because water from another source is finding its way into the foul sewer. Foul sewer flooding is therefore often a secondary form of flooding that occurs because another form of flooding is already taking place. Whilst an area affected by a foul sewer flooding is often localised the quality of water can be poor. Flooding of combined or foul sewers can lead to contaminated water entering properties and nearby watercourses. This can directly impact river and groundwater quality and hence the ability of these areas to achieve the River Basin Management Plans objectives, which in turn feeds into the Water Framework Directive legislation.
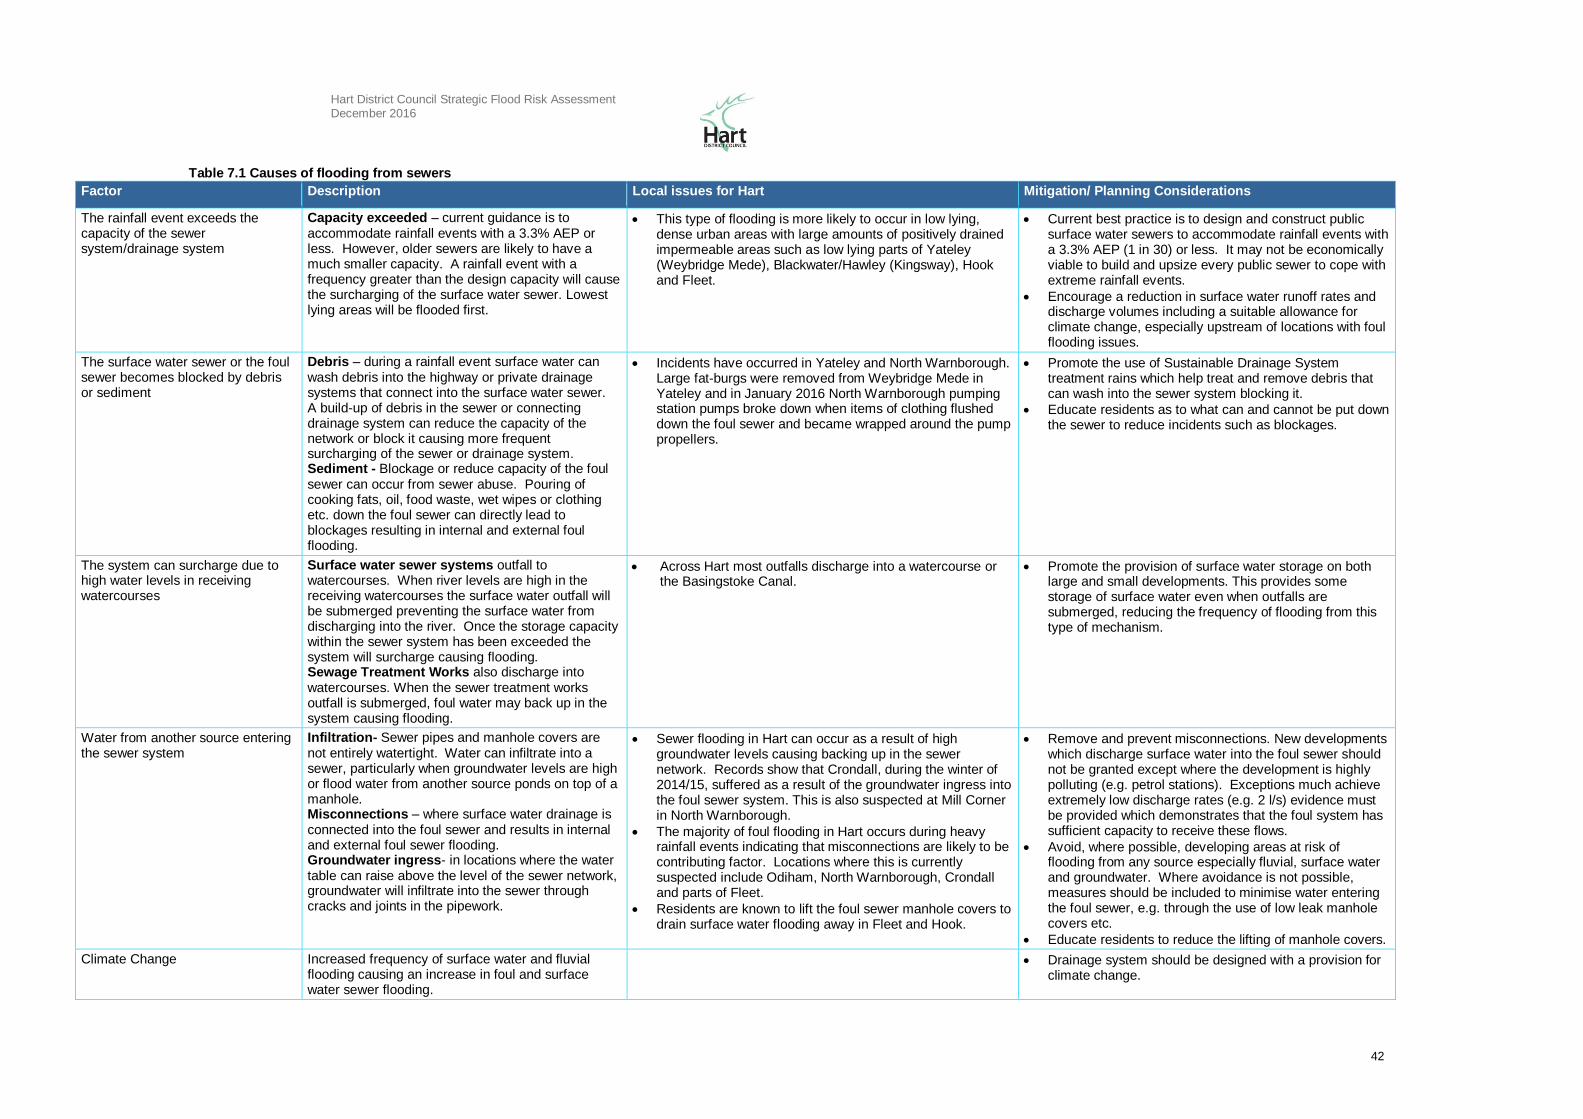
Hart District Council Strategic Flood Risk Assessment December 2016
42
Table 7.1 Causes of flooding from sewers
Factor Description Local issues for Hart Mitigation/ Planning Considerations
The rainfall event exceeds the capacity of the sewer system/drainage system
Capacity exceeded – current guidance is to accommodate rainfall events with a 3.3% AEP or less. However, older sewers are likely to have a much smaller capacity. A rainfall event with a frequency greater than the design capacity will cause the surcharging of the surface water sewer. Lowest lying areas will be flooded first.
This type of flooding is more likely to occur in low lying, dense urban areas with large amounts of positively drained impermeable areas such as low lying parts of Yateley (Weybridge Mede), Blackwater/Hawley (Kingsway), Hook and Fleet.
Current best practice is to design and construct public surface water sewers to accommodate rainfall events with a 3.3% AEP (1 in 30) or less. It may not be economically viable to build and upsize every public sewer to cope with extreme rainfall events.
Encourage a reduction in surface water runoff rates and discharge volumes including a suitable allowance for climate change, especially upstream of locations with foul flooding issues.
The surface water sewer or the foul sewer becomes blocked by debris or sediment
Debris – during a rainfall event surface water can wash debris into the highway or private drainage systems that connect into the surface water sewer. A build-up of debris in the sewer or connecting drainage system can reduce the capacity of the network or block it causing more frequent surcharging of the sewer or drainage system. Sediment - Blockage or reduce capacity of the foul sewer can occur from sewer abuse. Pouring of cooking fats, oil, food waste, wet wipes or clothing etc. down the foul sewer can directly lead to blockages resulting in internal and external foul flooding.
Incidents have occurred in Yateley and North Warnborough. Large fat-burgs were removed from Weybridge Mede in Yateley and in January 2016 North Warnborough pumping station pumps broke down when items of clothing flushed down the foul sewer and became wrapped around the pump propellers.
Promote the use of Sustainable Drainage System treatment rains which help treat and remove debris that can wash into the sewer system blocking it.
Educate residents as to what can and cannot be put down the sewer to reduce incidents such as blockages.
The system can surcharge due to high water levels in receiving watercourses
Surface water sewer systems outfall to watercourses. When river levels are high in the receiving watercourses the surface water outfall will be submerged preventing the surface water from discharging into the river. Once the storage capacity within the sewer system has been exceeded the system will surcharge causing flooding. Sewage Treatment Works also discharge into watercourses. When the sewer treatment works outfall is submerged, foul water may back up in the system causing flooding.
Across Hart most outfalls discharge into a watercourse or the Basingstoke Canal.
Promote the provision of surface water storage on both large and small developments. This provides some storage of surface water even when outfalls are submerged, reducing the frequency of flooding from this type of mechanism.
Water from another source entering the sewer system
Infiltration- Sewer pipes and manhole covers are not entirely watertight. Water can infiltrate into a sewer, particularly when groundwater levels are high or flood water from another source ponds on top of a manhole. Misconnections – where surface water drainage is connected into the foul sewer and results in internal and external foul sewer flooding. Groundwater ingress- in locations where the water table can raise above the level of the sewer network, groundwater will infiltrate into the sewer through cracks and joints in the pipework.
Sewer flooding in Hart can occur as a result of high groundwater levels causing backing up in the sewer network. Records show that Crondall, during the winter of 2014/15, suffered as a result of the groundwater ingress into the foul sewer system. This is also suspected at Mill Corner in North Warnborough.
The majority of foul flooding in Hart occurs during heavy rainfall events indicating that misconnections are likely to be contributing factor. Locations where this is currently suspected include Odiham, North Warnborough, Crondall and parts of Fleet.
Residents are known to lift the foul sewer manhole covers to drain surface water flooding away in Fleet and Hook.
Remove and prevent misconnections. New developments which discharge surface water into the foul sewer should not be granted except where the development is highly polluting (e.g. petrol stations). Exceptions much achieve extremely low discharge rates (e.g. 2 l/s) evidence must be provided which demonstrates that the foul system has sufficient capacity to receive these flows.
Avoid, where possible, developing areas at risk of flooding from any source especially fluvial, surface water and groundwater. Where avoidance is not possible, measures should be included to minimise water entering the foul sewer, e.g. through the use of low leak manhole covers etc.
Educate residents to reduce the lifting of manhole covers.
Climate Change Increased frequency of surface water and fluvial flooding causing an increase in foul and surface water sewer flooding.
Drainage system should be designed with a provision for climate change.
Hart District Council Strategic Flood Risk Assessment December 2016
43
7.2 Data Collection
All Water Companies have a statutory obligation to maintain a register of properties and areas which have reported records of flooding from the public sewerage system, and for Hart District area this is shown on the DG5 Flood Register provided by Thames Water. This includes records of all sewers that are deemed to be public and therefore maintained by the Water Company and will cover flooding from foul, combined and surface water sewers. The DG5 Flood Register includes levels of service indicators which aim to measure the frequency of actual flooding of properties and external areas from the public sewerage system by foul water, surface water or combined sewage. It should be noted that flooding from land drainage, highway drainage, rivers/watercourses and private sewers is not recorded within the register. In addition, the records do not account for the effect of any capital works designed to alleviate flooding. Hart District Council holds records of foul flooding where residents have reported this to the Council directly.
7.3 Historic Sewer Flooding
The data provided by Thames Water for use in this SFRA shows postcodes where properties are known to have experienced sewer flooding prior to June 2014. The DG5 Register holds records of 57 flood incidents resulting in internal property flooding, and 148 external flooding incidents, as shown in Figure 7.1 and Figure 7.2. The records indicate that more internal and external property flooding occurs during the larger scale flooding events (1 in 20 year recurrence probability). Whilst historic incidents of sewer flooding may indicate areas at higher risk than others, where the urban drainage system is maintained and where improvements have been completed, the risk may be significantly lowered making the historic occurrence of flooding an inadequate indicator of future problems. Data from Thames Water has been collated into postcode groupings. Figure 7.1 and Figure 7.2 below show the number of internal and external incidents recorded within Hart for different return periods.
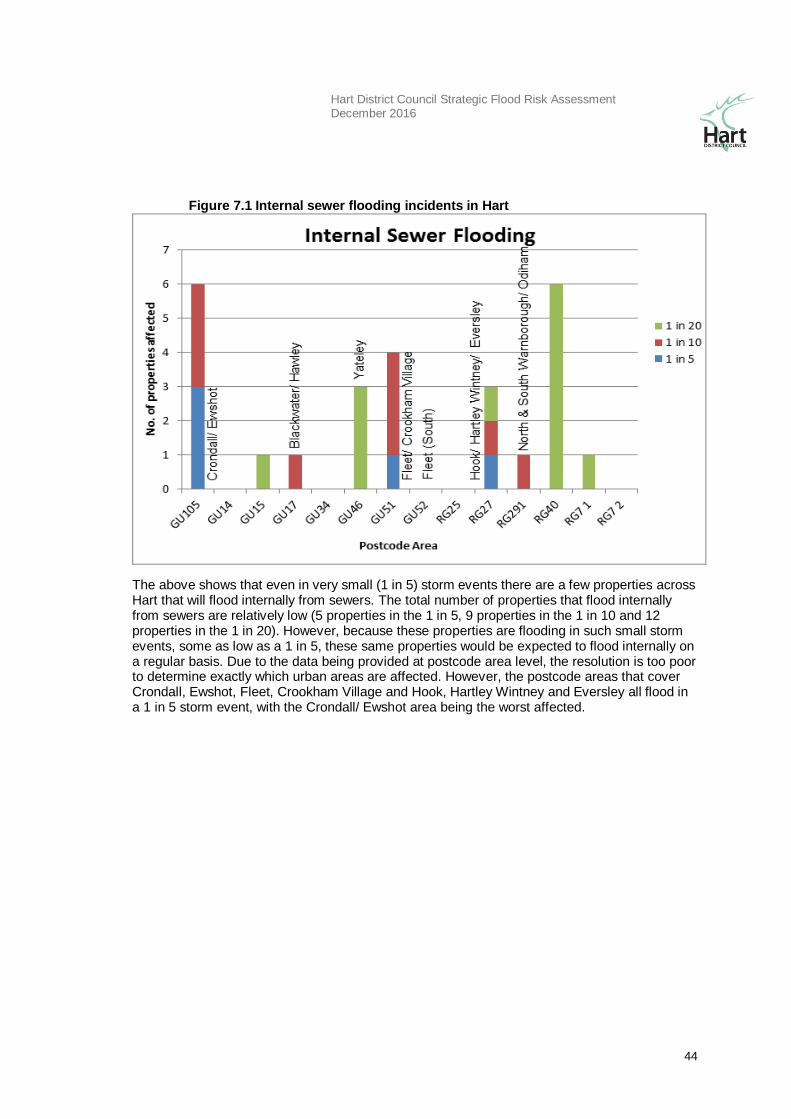
Hart District Council Strategic Flood Risk Assessment December 2016
44
Figure 7.1 Internal sewer flooding incidents in Hart
The above shows that even in very small (1 in 5) storm events there are a few properties across Hart that will flood internally from sewers. The total number of properties that flood internally from sewers are relatively low (5 properties in the 1 in 5, 9 properties in the 1 in 10 and 12 properties in the 1 in 20). However, because these properties are flooding in such small storm events, some as low as a 1 in 5, these same properties would be expected to flood internally on a regular basis. Due to the data being provided at postcode area level, the resolution is too poor to determine exactly which urban areas are affected. However, the postcode areas that cover Crondall, Ewshot, Fleet, Crookham Village and Hook, Hartley Wintney and Eversley all flood in a 1 in 5 storm event, with the Crondall/ Ewshot area being the worst affected.
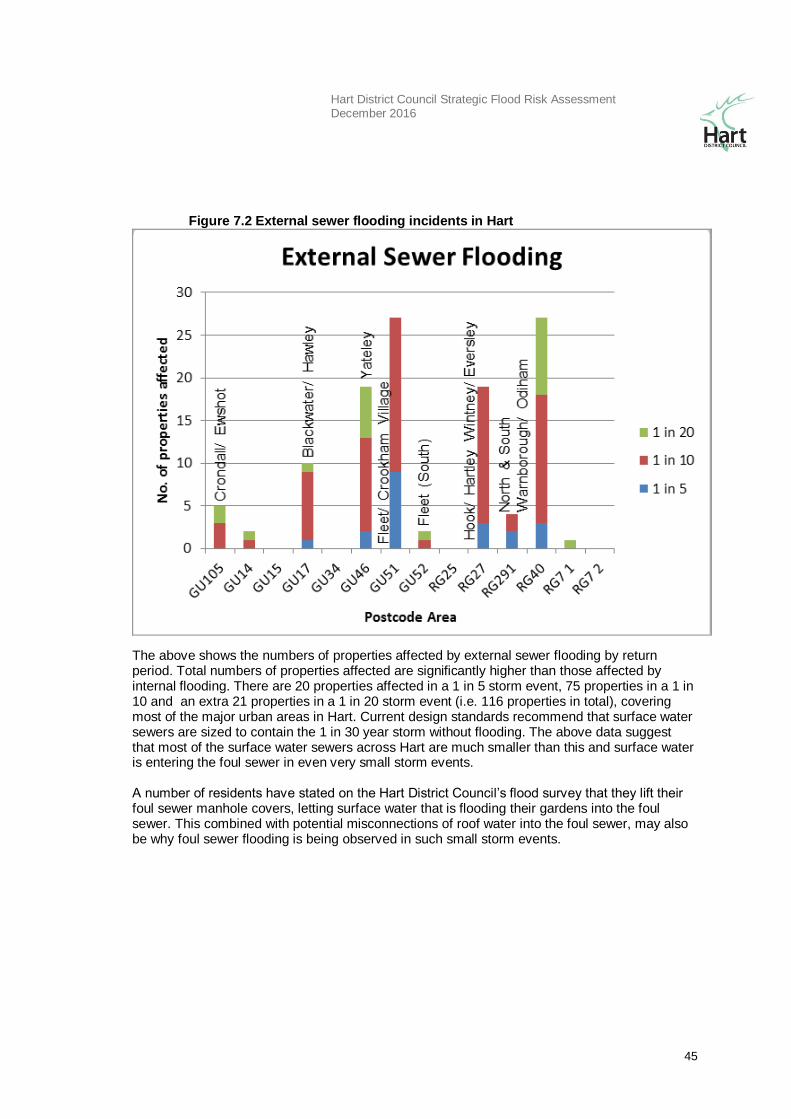
Hart District Council Strategic Flood Risk Assessment December 2016
45
Figure 7.2 External sewer flooding incidents in Hart
The above shows the numbers of properties affected by external sewer flooding by return period. Total numbers of properties affected are significantly higher than those affected by internal flooding. There are 20 properties affected in a 1 in 5 storm event, 75 properties in a 1 in 10 and an extra 21 properties in a 1 in 20 storm event (i.e. 116 properties in total), covering most of the major urban areas in Hart. Current design standards recommend that surface water sewers are sized to contain the 1 in 30 year storm without flooding. The above data suggest that most of the surface water sewers across Hart are much smaller than this and surface water is entering the foul sewer in even very small storm events. A number of residents have stated on the Hart District Council’s flood survey that they lift their foul sewer manhole covers, letting surface water that is flooding their gardens into the foul sewer. This combined with potential misconnections of roof water into the foul sewer, may also be why foul sewer flooding is being observed in such small storm events.
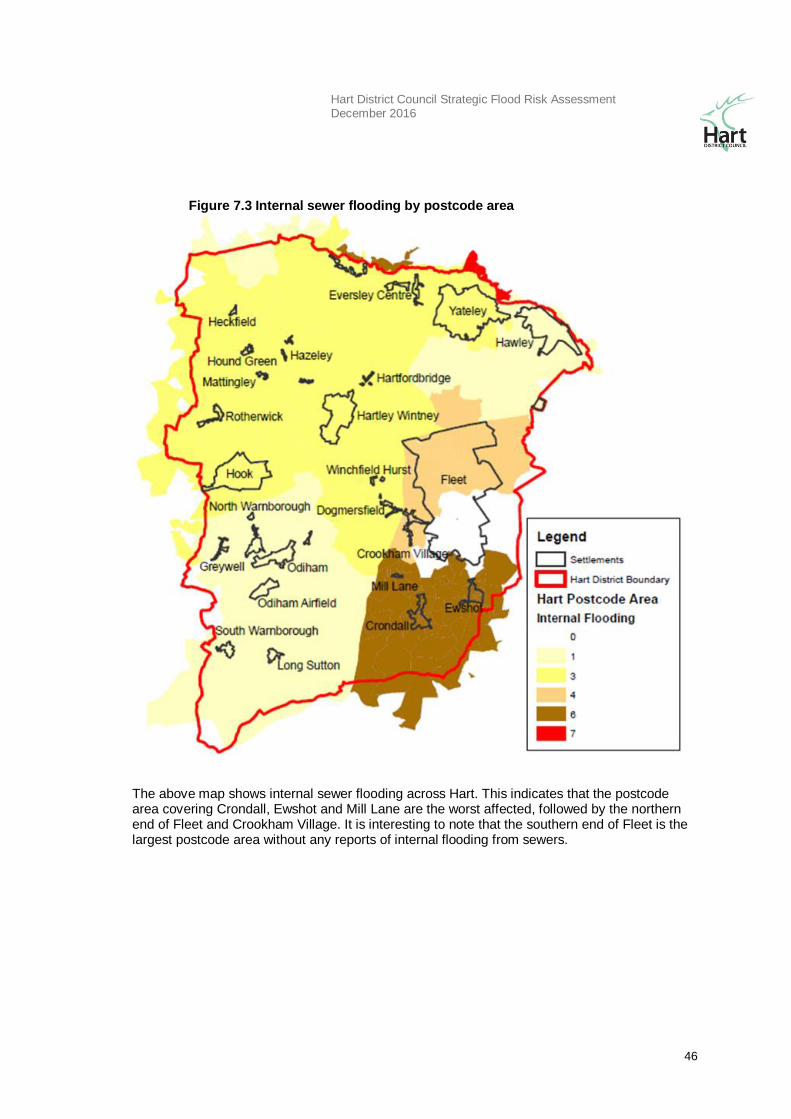
Hart District Council Strategic Flood Risk Assessment December 2016
46
Figure 7.3 Internal sewer flooding by postcode area
The above map shows internal sewer flooding across Hart. This indicates that the postcode area covering Crondall, Ewshot and Mill Lane are the worst affected, followed by the northern end of Fleet and Crookham Village. It is interesting to note that the southern end of Fleet is the largest postcode area without any reports of internal flooding from sewers.
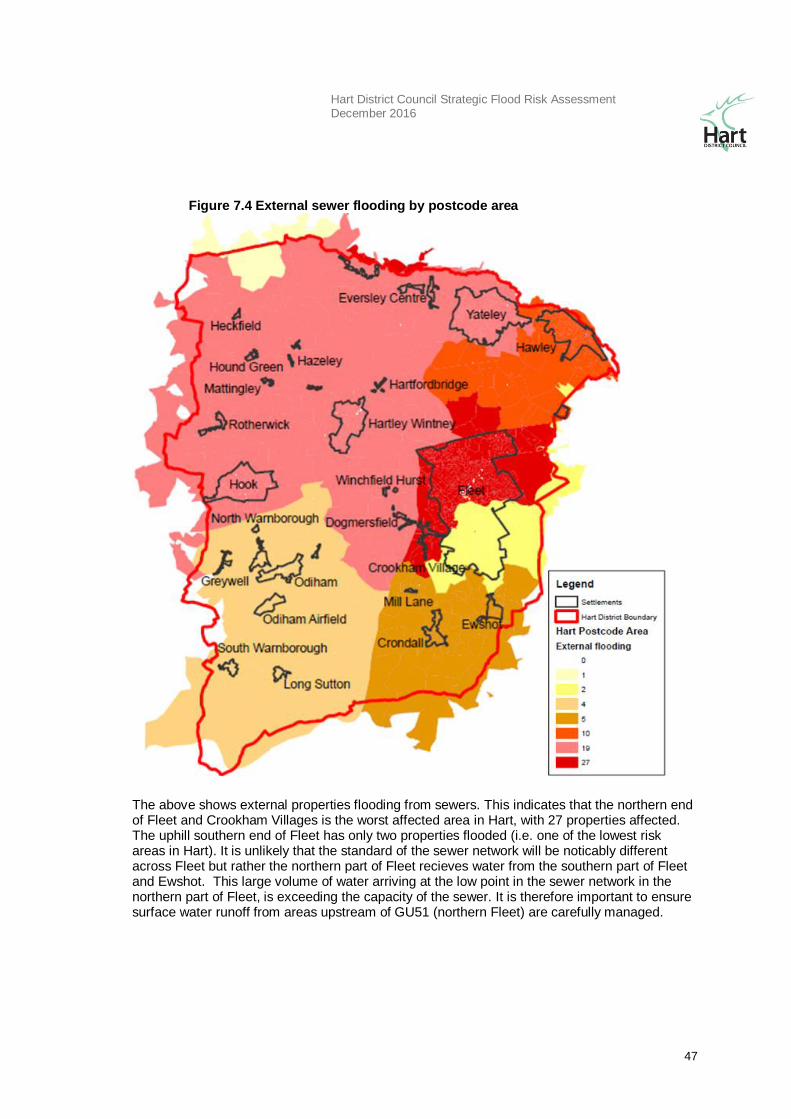
Hart District Council Strategic Flood Risk Assessment December 2016
47
Figure 7.4 External sewer flooding by postcode area
The above shows external properties flooding from sewers. This indicates that the northern end of Fleet and Crookham Villages is the worst affected area in Hart, with 27 properties affected. The uphill southern end of Fleet has only two properties flooded (i.e. one of the lowest risk areas in Hart). It is unlikely that the standard of the sewer network will be noticably different across Fleet but rather the northern part of Fleet recieves water from the southern part of Fleet and Ewshot. This large volume of water arriving at the low point in the sewer network in the northern part of Fleet, is exceeding the capacity of the sewer. It is therefore important to ensure surface water runoff from areas upstream of GU51 (northern Fleet) are carefully managed.
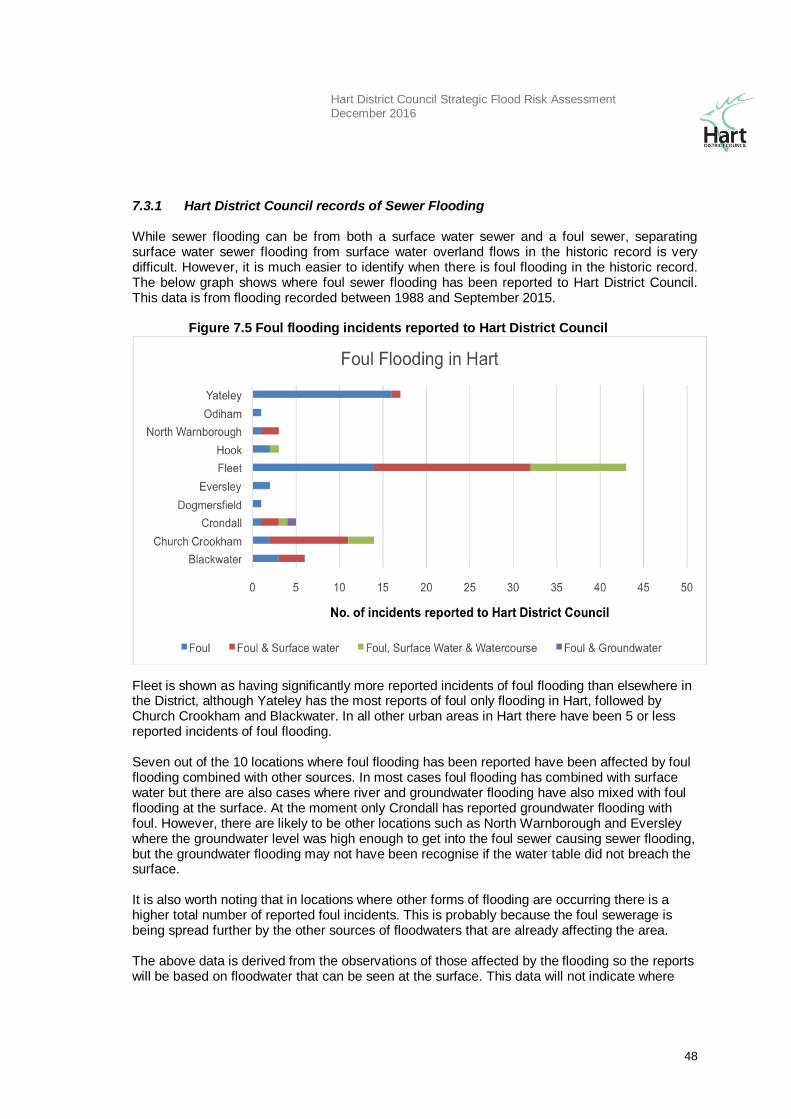
Hart District Council Strategic Flood Risk Assessment December 2016
48
7.3.1 Hart District Council records of Sewer Flooding While sewer flooding can be from both a surface water sewer and a foul sewer, separating surface water sewer flooding from surface water overland flows in the historic record is very difficult. However, it is much easier to identify when there is foul flooding in the historic record. The below graph shows where foul sewer flooding has been reported to Hart District Council. This data is from flooding recorded between 1988 and September 2015.
Figure 7.5 Foul flooding incidents reported to Hart District Council
Fleet is shown as having significantly more reported incidents of foul flooding than elsewhere in the District, although Yateley has the most reports of foul only flooding in Hart, followed by Church Crookham and Blackwater. In all other urban areas in Hart there have been 5 or less reported incidents of foul flooding. Seven out of the 10 locations where foul flooding has been reported have been affected by foul flooding combined with other sources. In most cases foul flooding has combined with surface water but there are also cases where river and groundwater flooding have also mixed with foul flooding at the surface. At the moment only Crondall has reported groundwater flooding with foul. However, there are likely to be other locations such as North Warnborough and Eversley where the groundwater level was high enough to get into the foul sewer causing sewer flooding, but the groundwater flooding may not have been recognise if the water table did not breach the surface. It is also worth noting that in locations where other forms of flooding are occurring there is a higher total number of reported foul incidents. This is probably because the foul sewerage is being spread further by the other sources of floodwaters that are already affecting the area. The above data is derived from the observations of those affected by the flooding so the reports will be based on floodwater that can be seen at the surface. This data will not indicate where
Hart District Council Strategic Flood Risk Assessment December 2016
49
groundwater, surface water or fluvial flooding is getting into the foul sewer and causing the foul sewer flooding.
7.4 Discussion of Sewer Flooding in Hart
The use of historic data to estimate the probability of sewer flooding is the most practical approach, however, it does not take account of possible future changes due to climate or future development. Historic results should also be viewed with caution as the sewer network is constantly being maintained, upgraded and improved. Thus flooding issues may be relatively short lived (<10 years). If identified by the Environment Agency or the water company as a major risk, sewer flooding will need to be assessed in greater detail in individual flood risk assessments. Flooding from sewers in urban areas can theoretically be managed with engineering works for any size event. However, such works are not always economically or environmentally sustainable. Improvements to urban drainage can also lead to rapid rainfall runoff into rivers, increasing flood risk downstream and potentially transporting contaminants. Since foul sewer flooding is primarily a secondary form of flooding, minimising the risk from other sources should help reduce foul sewer flooding. The NPPF recommends that Sustainable Drainage System (SuDS) designed to appropriately restrict surface water runoff are used to decrease the probability of flooding by limiting the peak demand on urban drainage infrastructure. All new developments, and wherever possible existing networks, are also advised to separate out foul drainage from surface water drainage to ensure that any flooding that does occur is not contaminated. In locations where groundwater flooding above and below the ground is likely, new sewers should be designed to minimise the ingress of groundwater into the sewer system. Mitigation and planning consideration advice to minimise surface water and foul sewer risk can be seen in table 7.1.
7.5 Planning Considerations The NPPF requires that consideration is given to all forms of flooding during the decision making process, assessments of flooding from sewers are therefore needed. A probabilistic approach requires the understanding of hydrological, hydraulic and structural engineering processes. These processes are highly variable at the local scale, thus a detailed assessment is required for individual proposed developments. As well as informing land use planning, flooding from sewers should be managed by the development control process. Further collation of all relevant data, such as sewer capacity, past events and consultation with water companies and operating authorities must be undertaken when preparing site specific flood risk assessments.
Hart District Council Strategic Flood Risk Assessment December 2016
50
8. Flooding From Groundwater
8.1 Description
Groundwater flooding is caused by the emergence of water originating from sub-surface permeable strata. A groundwater flood event results from a rise in groundwater level sufficient for the water table to intersect the ground surface and inundate low lying land. Groundwater floods may emerge from either point or diffuse locations. They tend to be long in duration developing over weeks or months and prevailing for days or weeks. There are many mechanisms associated with groundwater flooding, which are linked to high groundwater levels, and can be broadly classified as:
Direct contribution to channel flow.
Springs emerging at the surface.
Inundation of drainage infrastructure.
Inundation of low-lying property (basements). Groundwater levels rise and fall in response to rainfall patterns and distribution, with a time scale of months rather than days. The significance of this rise and fall for flooding depends largely on the type of rock it occurs in, i.e. how permeable to water the rock is and whether the water level comes close or meets the ground surface. An important feature of the southwest part of the study area is the permeable chalk, part of the North Downs. Compared to other aquifer units, Chalk is more vulnerable to groundwater flooding because of its geological formation. It contains many pores and fissures which can result in rapid rises in groundwater levels, which take a long time to recede. The likelihood of an area experiencing groundwater flooding can largely be determined by an analysis of the previous meteorological conditions and geological knowledge. This can be helped by the analysis of groundwater boreholes.
8.2 Causes of high groundwater levels
High groundwater levels can result from the combination of geological, hydrogeological, topographic and recharge phenomena and can mostly be associated with the seven mechanisms described in Table 8.1 below. Each has been described using the source-pathway-receptor model.
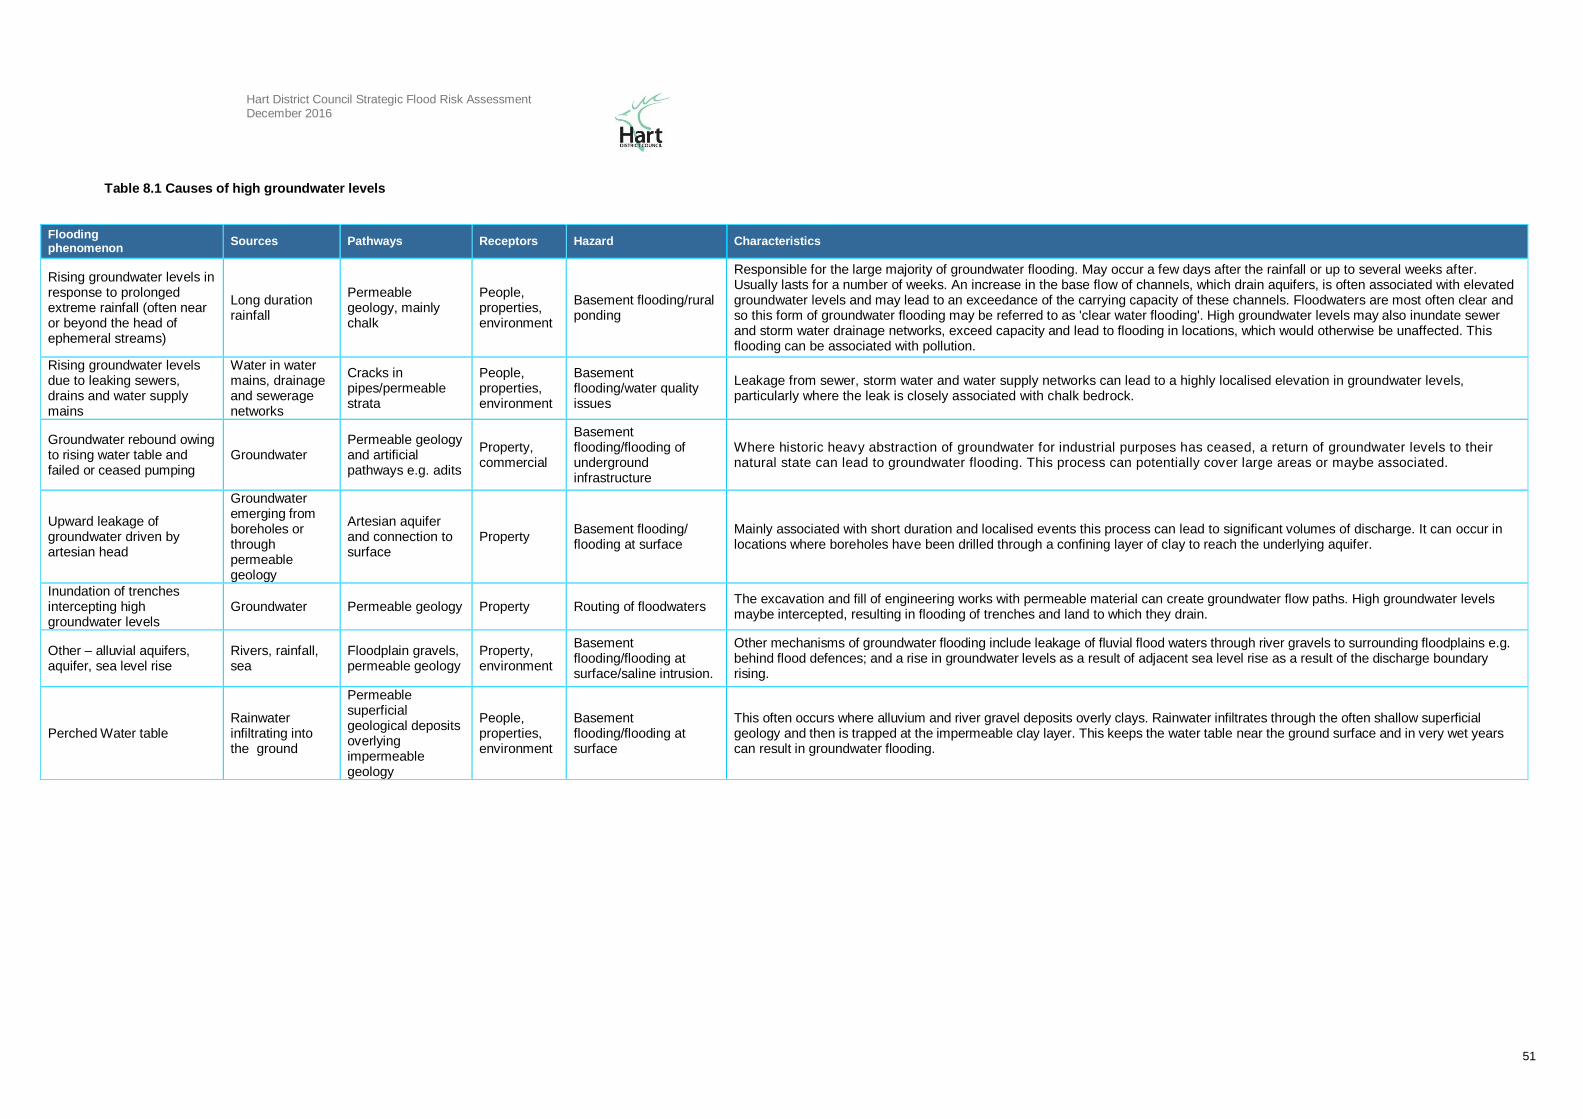
Hart District Council Strategic Flood Risk Assessment December 2016
51
Table 8.1 Causes of high groundwater levels
Flooding phenomenon
Sources Pathways Receptors Hazard Characteristics
Rising groundwater levels in response to prolonged extreme rainfall (often near or beyond the head of ephemeral streams)
Long duration rainfall
Permeable geology, mainly chalk
People, properties, environment
Basement flooding/rural ponding
Responsible for the large majority of groundwater flooding. May occur a few days after the rainfall or up to several weeks after. Usually lasts for a number of weeks. An increase in the base flow of channels, which drain aquifers, is often associated with elevated groundwater levels and may lead to an exceedance of the carrying capacity of these channels. Floodwaters are most often clear and so this form of groundwater flooding may be referred to as 'clear water flooding'. High groundwater levels may also inundate sewer and storm water drainage networks, exceed capacity and lead to flooding in locations, which would otherwise be unaffected. This flooding can be associated with pollution.
Rising groundwater levels due to leaking sewers, drains and water supply mains
Water in water mains, drainage and sewerage networks
Cracks in pipes/permeable strata
People, properties, environment
Basement flooding/water quality issues
Leakage from sewer, storm water and water supply networks can lead to a highly localised elevation in groundwater levels, particularly where the leak is closely associated with chalk bedrock.
Groundwater rebound owing to rising water table and failed or ceased pumping
Groundwater Permeable geology and artificial pathways e.g. adits
Property, commercial
Basement flooding/flooding of underground infrastructure
Where historic heavy abstraction of groundwater for industrial purposes has ceased, a return of groundwater levels to their natural state can lead to groundwater flooding. This process can potentially cover large areas or maybe associated.
Upward leakage of groundwater driven by artesian head
Groundwater emerging from boreholes or through permeable geology
Artesian aquifer and connection to surface
Property Basement flooding/ flooding at surface
Mainly associated with short duration and localised events this process can lead to significant volumes of discharge. It can occur in locations where boreholes have been drilled through a confining layer of clay to reach the underlying aquifer.
Inundation of trenches intercepting high groundwater levels
Groundwater Permeable geology Property Routing of floodwaters The excavation and fill of engineering works with permeable material can create groundwater flow paths. High groundwater levels maybe intercepted, resulting in flooding of trenches and land to which they drain.
Other – alluvial aquifers, aquifer, sea level rise
Rivers, rainfall, sea
Floodplain gravels, permeable geology
Property, environment
Basement flooding/flooding at surface/saline intrusion.
Other mechanisms of groundwater flooding include leakage of fluvial flood waters through river gravels to surrounding floodplains e.g. behind flood defences; and a rise in groundwater levels as a result of adjacent sea level rise as a result of the discharge boundary rising.
Perched Water table Rainwater infiltrating into the ground
Permeable superficial geological deposits overlying impermeable geology
People, properties, environment
Basement flooding/flooding at surface
This often occurs where alluvium and river gravel deposits overly clays. Rainwater infiltrates through the often shallow superficial geology and then is trapped at the impermeable clay layer. This keeps the water table near the ground surface and in very wet years can result in groundwater flooding.

Hart District Council Strategic Flood Risk Assessment December 2016
52
Page intentionally blank
Hart District Council Strategic Flood Risk Assessment December 2016
53
8.3 Impacts of groundwater flooding
The main impacts of groundwater flooding are:
Flooding of basements of buildings below ground level – in the mildest case this may involve seepage of small volumes through walls, temporary loss of services etc. In more extreme cases larger volumes may lead to the catastrophic loss of stored items and failure of structural integrity.
Overflowing of sewers and drains – surcharging of drainage networks can lead to overland flows causing significant but localised damage to property. Sewer surcharging can lead to inundation of property by polluted water. Note: it is complex to separate this flooding from other sources, notably surface water or sewer flooding.
Flooding of buried services or other assets below ground level – prolonged inundation of buried services can lead to interruption and disruption of supply.
Inundation of farmland, roads, commercial, residential and amenity areas – inundation of grassed areas can be inconvenient; however the inundation of hard-standing areas can lead to structural damage and the disruption of commercial activity. Inundation of agricultural land for long durations can have financial consequences.
Flooding of ground floors of buildings above ground level – can be disruptive and may result in structural damage. The long duration of flooding can outweigh the lead time which would otherwise reduce the overall level of damages.
Additionally groundwater flooding can cause a change in the structural properties of clay overlying chalk aquifers. This may cause costly damage to structures in the ground and the buildings that they support.
Groundwater flooding has always occurred. It generally occurs more slowly than river flooding and in specific locations. The rarity of groundwater flooding combined with the mobility of the population means that people often do not know there is a groundwater flood risk.
New developments are particularly at risk because little consideration is given to groundwater as a source of flooding in the planning process. The sparse frequency of groundwater flood events can contribute to poor decision-making. The economic and social costs of groundwater flooding are compounded by the relative long duration of events.
The nature and occurrence of groundwater flooding in England is highly variable. 1.7 million properties are vulnerable to groundwater flooding in England (Jacobs 2006). The occurrence of groundwater flooding is very local and often results from the interaction of very site specific factors, e.g. aquifer properties, topography, man-made structures etc.
In general terms groundwater flooding rarely poses a risk to life. However, groundwater flooding can be associated with significant damage to property
Hart District Council Strategic Flood Risk Assessment December 2016
54
8.4 Topography, geology and groundwater flooding
An important feature of the southwest part of the study area is the permeable chalk of part of the North Downs. Rainfall over this area is likely to predominantly soak into the ground and runoff rates are anticipated to be low. Where the water table intersects the surface, groundwater re-emerges from the chalk and feeds a number of the streams including the River Whitewater, Hart and Itchel Brook. Many of the streams flow all year providing a base flow for the rivers. This type of flow does not provide a significant risk of flooding. However, when the water table rises springs can emerge in places that are away from the main river channel and away from the “normal” spring line. This type of flooding can cause significant damage to property and infrastructure due to size and velocity of flows and the fact that they are often not confined in the river channel. It is also particularly difficult to protect against groundwater flooding. One particular issue linked with groundwater flooding in areas of chalk bedrock is the emergence of ‘winterbournes’. These are channels that run dry through the summer but become watercourses from the groundwater stored in the aquifer that is forced to the surface during winter. As they are dry in summer, and sometimes over a longer period dependant on rainfall levels throughout the year, they can be forgotten and poorly maintained giving rise to potential flooding problems when the water returns. They only occur in areas of chalk bedrock and as such are a key cause of groundwater flooding in Hampshire.
8.5 Data Collection
Information surrounding groundwater flooding has been collected from Hart District Council, Hampshire County Council, the Environment Agency and the British Geological Society.
8.5.1 Historic Groundwater Flooding Events The Environment Agency maintains a record of flooding incidents that are reported to them including those that are not considered to be a result of direct river flooding. These flood events are often groundwater related, but the actual source is not often verified. There are very few records of groundwater flooding in Hart due to lack of public reporting and poor data capture. Reports of groundwater flooding have occurred in the winter of 2000/2001 and the winter of 2013/2014. In both cases the winters were particularly wet. From this it can be ascertained that groundwater flooding is more likely to occur in the area following significant periods of rainfall, which results in an increase in the water table. The following areas were reported to be affected by groundwater flooding in the winter of 2000/2001: The upper catchment of the Whitewater (this affected fields not property), Yateley Library (the report in question suggested that groundwater emergence could be a problem in a number of places in Yateley) and South Warnborough. In the winter of 2013/2014 groundwater flooding was reported in North Warnborough, South Warnborough, Mattingley, Hartley Wintney, Fleet and Crondall.
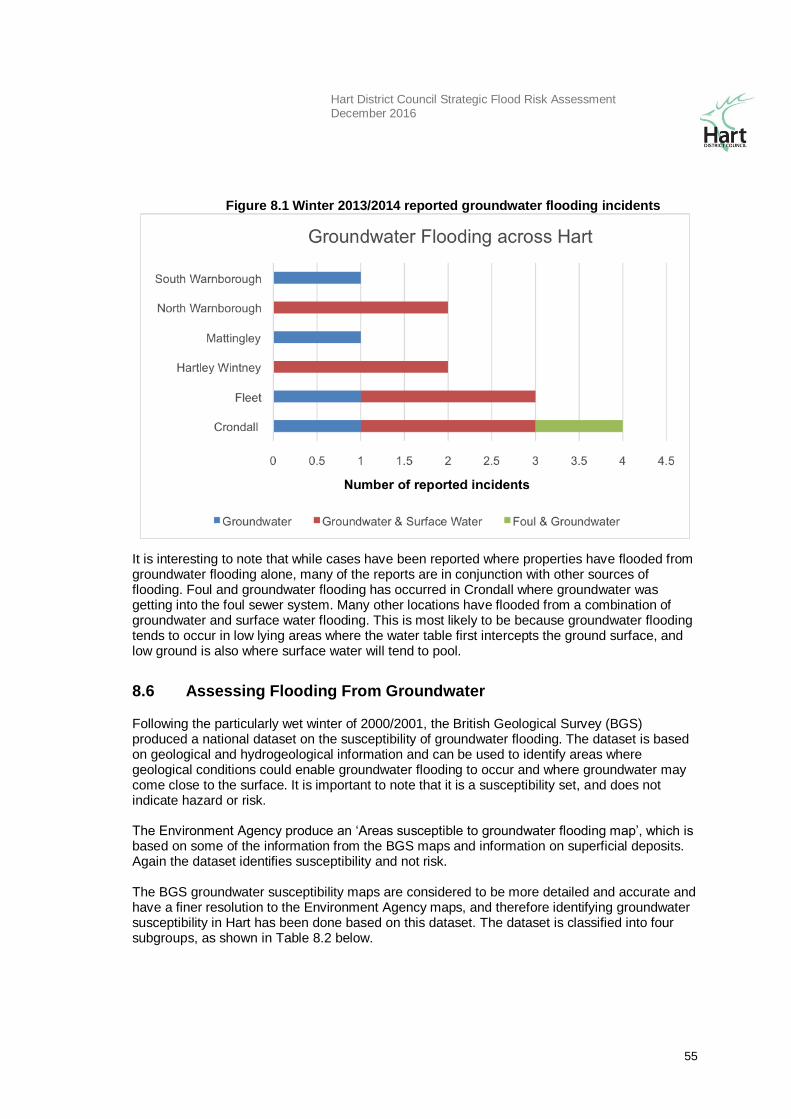
Hart District Council Strategic Flood Risk Assessment December 2016
55
Figure 8.1 Winter 2013/2014 reported groundwater flooding incidents
It is interesting to note that while cases have been reported where properties have flooded from groundwater flooding alone, many of the reports are in conjunction with other sources of flooding. Foul and groundwater flooding has occurred in Crondall where groundwater was getting into the foul sewer system. Many other locations have flooded from a combination of groundwater and surface water flooding. This is most likely to be because groundwater flooding tends to occur in low lying areas where the water table first intercepts the ground surface, and low ground is also where surface water will tend to pool.
8.6 Assessing Flooding From Groundwater
Following the particularly wet winter of 2000/2001, the British Geological Survey (BGS) produced a national dataset on the susceptibility of groundwater flooding. The dataset is based on geological and hydrogeological information and can be used to identify areas where geological conditions could enable groundwater flooding to occur and where groundwater may come close to the surface. It is important to note that it is a susceptibility set, and does not indicate hazard or risk. The Environment Agency produce an ‘Areas susceptible to groundwater flooding map’, which is based on some of the information from the BGS maps and information on superficial deposits. Again the dataset identifies susceptibility and not risk. The BGS groundwater susceptibility maps are considered to be more detailed and accurate and have a finer resolution to the Environment Agency maps, and therefore identifying groundwater susceptibility in Hart has been done based on this dataset. The dataset is classified into four subgroups, as shown in Table 8.2 below.
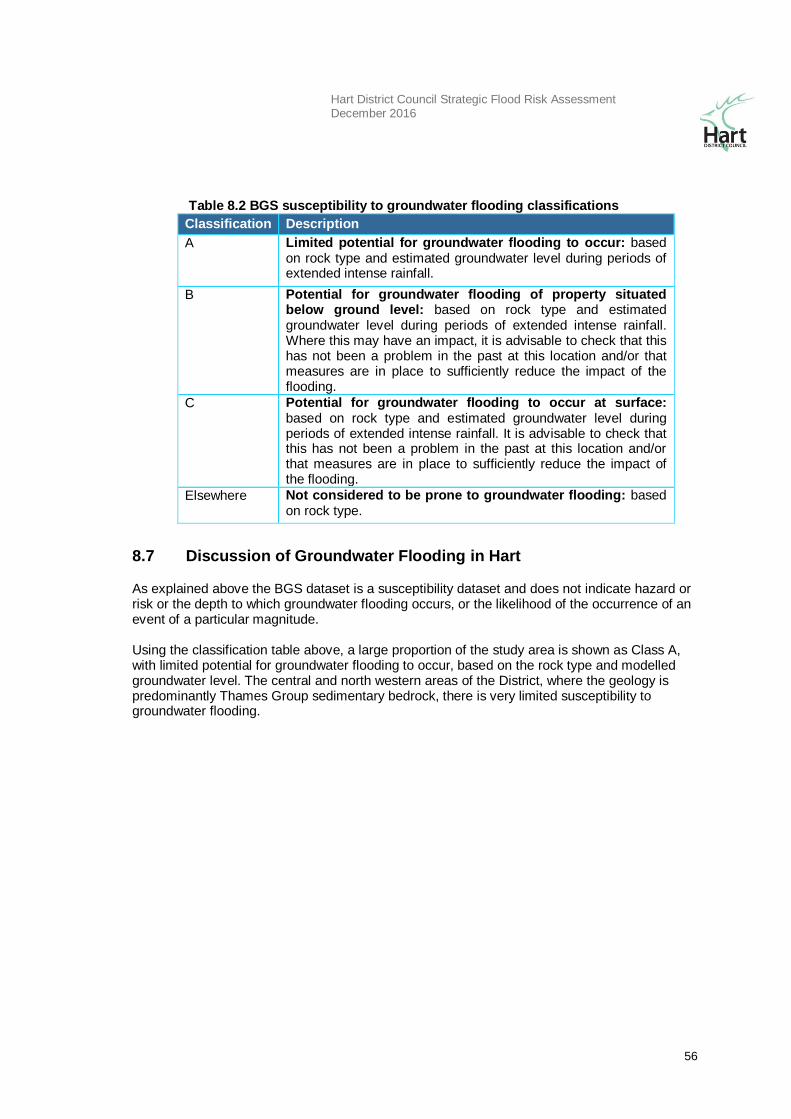
Hart District Council Strategic Flood Risk Assessment December 2016
56
Table 8.2 BGS susceptibility to groundwater flooding classifications
Classification Description
A Limited potential for groundwater flooding to occur: based on rock type and estimated groundwater level during periods of extended intense rainfall.
B Potential for groundwater flooding of property situated below ground level: based on rock type and estimated groundwater level during periods of extended intense rainfall. Where this may have an impact, it is advisable to check that this has not been a problem in the past at this location and/or that measures are in place to sufficiently reduce the impact of the flooding.
C Potential for groundwater flooding to occur at surface: based on rock type and estimated groundwater level during periods of extended intense rainfall. It is advisable to check that this has not been a problem in the past at this location and/or that measures are in place to sufficiently reduce the impact of the flooding.
Elsewhere Not considered to be prone to groundwater flooding: based on rock type.
8.7 Discussion of Groundwater Flooding in Hart
As explained above the BGS dataset is a susceptibility dataset and does not indicate hazard or risk or the depth to which groundwater flooding occurs, or the likelihood of the occurrence of an event of a particular magnitude. Using the classification table above, a large proportion of the study area is shown as Class A, with limited potential for groundwater flooding to occur, based on the rock type and modelled groundwater level. The central and north western areas of the District, where the geology is predominantly Thames Group sedimentary bedrock, there is very limited susceptibility to groundwater flooding.
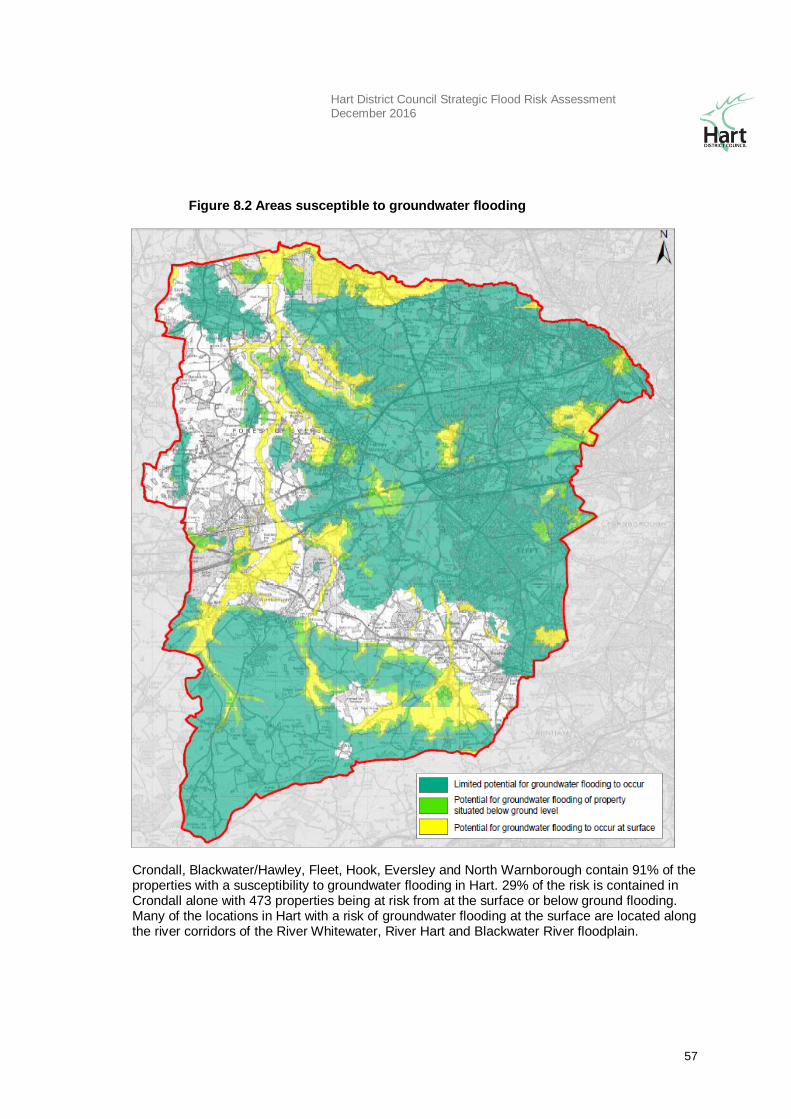
Hart District Council Strategic Flood Risk Assessment December 2016
57
Figure 8.2 Areas susceptible to groundwater flooding
Crondall, Blackwater/Hawley, Fleet, Hook, Eversley and North Warnborough contain 91% of the properties with a susceptibility to groundwater flooding in Hart. 29% of the risk is contained in Crondall alone with 473 properties being at risk from at the surface or below ground flooding. Many of the locations in Hart with a risk of groundwater flooding at the surface are located along the river corridors of the River Whitewater, River Hart and Blackwater River floodplain.
Hart District Council Strategic Flood Risk Assessment December 2016
58
The broad scale analysis in the SFRA has identified areas where there is potential for groundwater emergence and has therefore identified the areas where consideration should be given to groundwater flooding during detailed flood risk assessments.
8.8 Climate Change
There is currently no research specifically considering the impact of climate change on groundwater flooding. The mechanisms of flooding from aquifers are unlikely to be affected by climate change, however, if winter rainfall becomes more frequent and heavier, groundwater levels may increase. Higher winter recharge may however be balanced by lower recharge during the predicted hotter and drier summers.
8.9 Management of Groundwater Flooding in Hart
Groundwater flooding is often highly localised and complex. Management is highly dependent upon the characteristics of the specific situation and the costs associated with the management of groundwater flooding are highly variable. The implications of groundwater flooding should be considered and managed through development control and building design. Possible mitigation includes:
Improve conveyance of floodwater through and away from flood prone areas.
Raising property ground or floor levels.
Provide local protection for specific problem areas such as flood proofing properties (such as tanking or sealing of building basements).
Replacement and renewal of leaking sewers, drains and water supply reservoirs. Water companies have a programme to address leakage from infrastructure, so there is clear ownership of the potential source.
Use of groundwater interception systems to divert groundwater flows around below ground level obstructions.
Most options involve the management of groundwater levels. It is important to assess the impact of managing groundwater with regard to water resources and environmental designations. Likewise, placing a barrier to groundwater movement can shift groundwater flooding from one location to another or lead to high groundwater levels behind the obstruction. The appropriateness of infiltrating sustainable drainage techniques (SuDS) should also be questioned, where source protection zones are close by.
As the Lead Local Flood Authority, Hampshire County Council is responsible for coordinating groundwater flooding within the Hart District. The Environment Agency currently provides some data of known groundwater flooding incidents in the form of the Historic Flood Map. HDC and Hampshire CC will be increasingly responsible for collating groundwater information through the partnerships set out in the Hampshire LFRMS.
8.10 Planning Considerations
NPPF requires that decision makers use the SFRA to inform their knowledge of flooding across the area. These should form the basis for preparing appropriate policies for flood risk management. The propensity for groundwater flooding should be a material consideration when making land use allocation decisions.

Hart District Council Strategic Flood Risk Assessment December 2016
59
Groundwater flood risk should be investigated, identified, quantified and managed where possible by the flood risk assessment process. Assessments of groundwater flooding must therefore always be included in all levels of future flood risk assessments (FRAs). The susceptibility maps presented in this report are indicative and do not predict groundwater flooding. Thus further collation of all relevant data, such as spring flows, borehole water levels and recorded flood levels, past history and photographs of events and consultation with local residents should be undertaken when preparing site specific flood risk assessments. In particular, the factors that should be taken into account during these FRA are:
Areas liable to flood based on the best available information.
Extent, standard and effectiveness of existing flood defences (if present).
Likely rates of water level rise within the aquifer, and if possible, trigger levels for the onset of overland flow.
Quantities and velocities of overland flow.
Likely depth of flooding.
Likelihood of impacts to other areas.
Possible impacts of climate change.
Indicators that the site may be at risk from groundwater flooding include:
If the development site is near to the junction between geological strata of differing permeability.
If the development site is located at a similar level to nearby springs or stream headwaters.
If the development proposals include basements or excavation into the ground.
If the vegetation on the site suggests periodic water logging due to high groundwater levels.
If nearby recorded borehole levels reach those of the site ground levels.
If the FRA concludes that a more detailed assessment of groundwater flooding is required then it may be appropriate to undertake further hydrogeological monitoring and statistical analyses of recorded borehole water levels. It is important to consider the risk of groundwater flooding when allocating development sites, and also when applying the sequential test to windfall sites. However, the broad scale nature of the SFRA assessment does not enable a probability of groundwater flooding to be defined and as such the risk relative to river or surface water flooding is difficult to quantify. The SFRA does identify where groundwater flooding may be an issue and should therefore be considered in more detail.
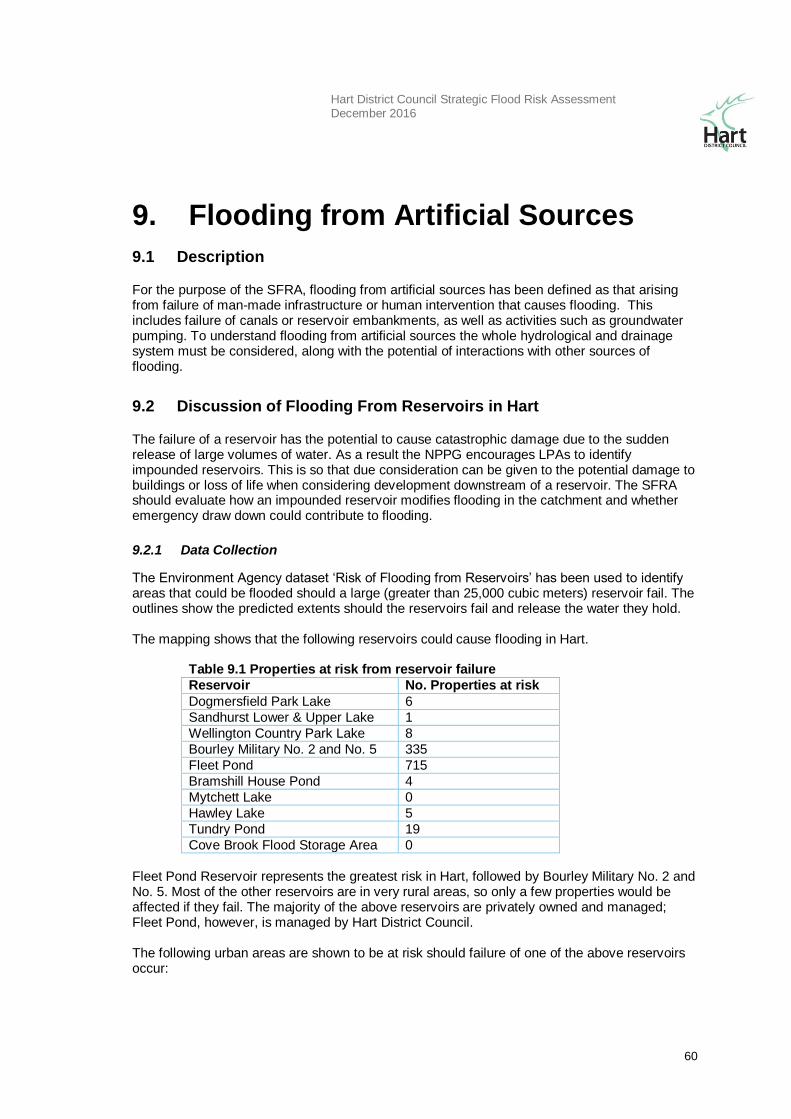
Hart District Council Strategic Flood Risk Assessment December 2016
60
9. Flooding from Artificial Sources
9.1 Description
For the purpose of the SFRA, flooding from artificial sources has been defined as that arising from failure of man-made infrastructure or human intervention that causes flooding. This includes failure of canals or reservoir embankments, as well as activities such as groundwater pumping. To understand flooding from artificial sources the whole hydrological and drainage system must be considered, along with the potential of interactions with other sources of flooding.
9.2 Discussion of Flooding From Reservoirs in Hart
The failure of a reservoir has the potential to cause catastrophic damage due to the sudden release of large volumes of water. As a result the NPPG encourages LPAs to identify impounded reservoirs. This is so that due consideration can be given to the potential damage to buildings or loss of life when considering development downstream of a reservoir. The SFRA should evaluate how an impounded reservoir modifies flooding in the catchment and whether emergency draw down could contribute to flooding.
9.2.1 Data Collection
The Environment Agency dataset ‘Risk of Flooding from Reservoirs’ has been used to identify areas that could be flooded should a large (greater than 25,000 cubic meters) reservoir fail. The outlines show the predicted extents should the reservoirs fail and release the water they hold. The mapping shows that the following reservoirs could cause flooding in Hart.
Table 9.1 Properties at risk from reservoir failure
Reservoir No. Properties at risk
Dogmersfield Park Lake 6
Sandhurst Lower & Upper Lake 1
Wellington Country Park Lake 8
Bourley Military No. 2 and No. 5 335
Fleet Pond 715
Bramshill House Pond 4
Mytchett Lake 0
Hawley Lake 5
Tundry Pond 19
Cove Brook Flood Storage Area 0
Fleet Pond Reservoir represents the greatest risk in Hart, followed by Bourley Military No. 2 and No. 5. Most of the other reservoirs are in very rural areas, so only a few properties would be affected if they fail. The majority of the above reservoirs are privately owned and managed; Fleet Pond, however, is managed by Hart District Council. The following urban areas are shown to be at risk should failure of one of the above reservoirs occur:
Hart District Council Strategic Flood Risk Assessment December 2016
61
Fleet – Parts of Church Crookham, Pond Tail and south of Cove Road wards (1050 properties at risk in Fleet)
Dogmersfield (17 properties at risk in Dogmersfield and the surrounding area) There are 1093 properties at risk in Hart as a whole (some properties are at risk from more than one reservoir) with 96% of the risk being located in Fleet. Fleet Pond Reservoir represents 65% of the risk. There are a number of other lakes and ponds within Hart, however, Fleet Pond has the greatest risk associated with it. In most cases should a reservoir in Hart fail, the flood waters will follow the floodplain. The vast majority of locations that could be affected by reservoir flooding tend to be rural farmlands and fields. It is important to consider reservoir flooding in the site allocations for the Local Plan to ensure that the risk of flooding from Reservoirs is not increased. Under the Reservoir Act 1975, all large reservoirs (greater than 25,000 cubic meters) must be inspected and supervised by reservoir panel engineers. The Environment Agency is the enforcement authority for the Reservoir Act 1975 to ensure that reservoirs are regularly inspected and essential safety work carried out. Hampshire County Council is responsible for working with the Local Resilience Forum to develop emergency plans for reservoir flooding. As such reservoirs are a carefully managed risk, where the consequence of failure could be severe, the probability of occurrence is considered low.
9.2.2 Fleet Pond Reservoir
Fleet Pond Reservoir falls under the jurisdiction of Hart District Council and is located within the urban area of Fleet. According to the Environment Agency’s reservoir maps, should Fleet Pond Reservoir fail 715 properties in Fleet downstream of the reservoir could be affected. It is therefore of the upmost importance to ensure that new development in Fleet will not detrimentally affect the reservoir.
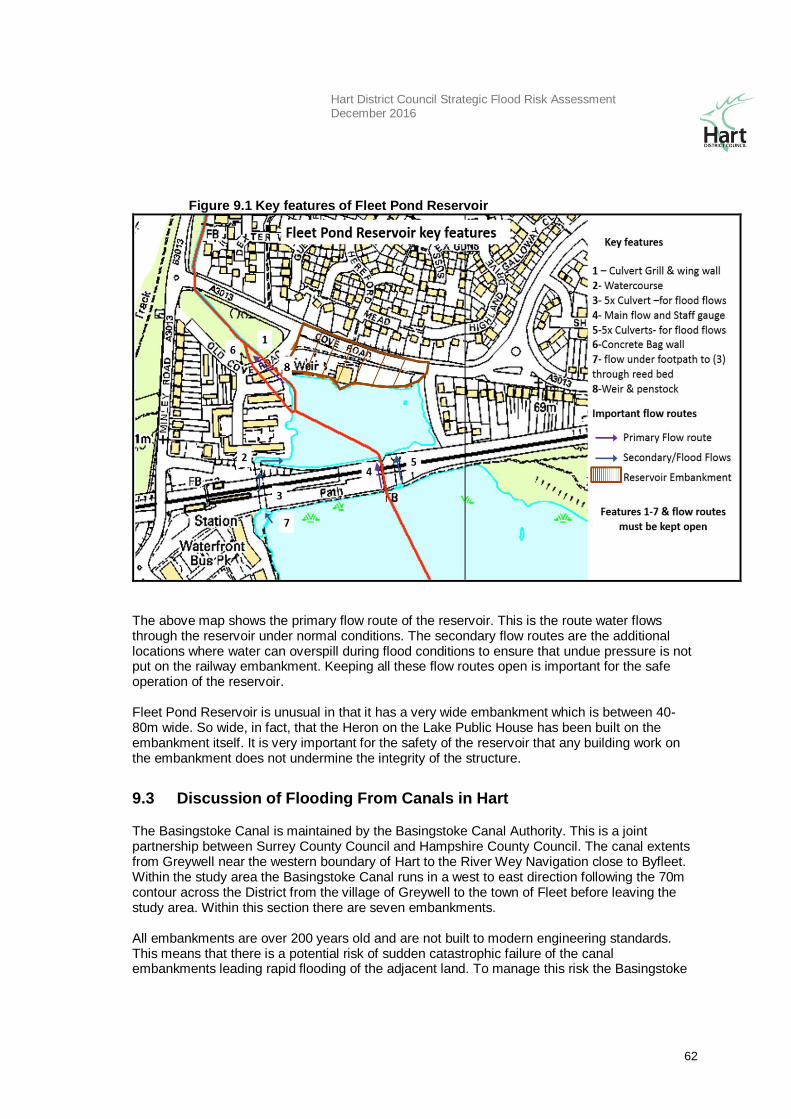
Hart District Council Strategic Flood Risk Assessment December 2016
62
Figure 9.1 Key features of Fleet Pond Reservoir
The above map shows the primary flow route of the reservoir. This is the route water flows through the reservoir under normal conditions. The secondary flow routes are the additional locations where water can overspill during flood conditions to ensure that undue pressure is not put on the railway embankment. Keeping all these flow routes open is important for the safe operation of the reservoir. Fleet Pond Reservoir is unusual in that it has a very wide embankment which is between 40-80m wide. So wide, in fact, that the Heron on the Lake Public House has been built on the embankment itself. It is very important for the safety of the reservoir that any building work on the embankment does not undermine the integrity of the structure.
9.3 Discussion of Flooding From Canals in Hart
The Basingstoke Canal is maintained by the Basingstoke Canal Authority. This is a joint partnership between Surrey County Council and Hampshire County Council. The canal extents from Greywell near the western boundary of Hart to the River Wey Navigation close to Byfleet. Within the study area the Basingstoke Canal runs in a west to east direction following the 70m contour across the District from the village of Greywell to the town of Fleet before leaving the study area. Within this section there are seven embankments. All embankments are over 200 years old and are not built to modern engineering standards. This means that there is a potential risk of sudden catastrophic failure of the canal embankments leading rapid flooding of the adjacent land. To manage this risk the Basingstoke
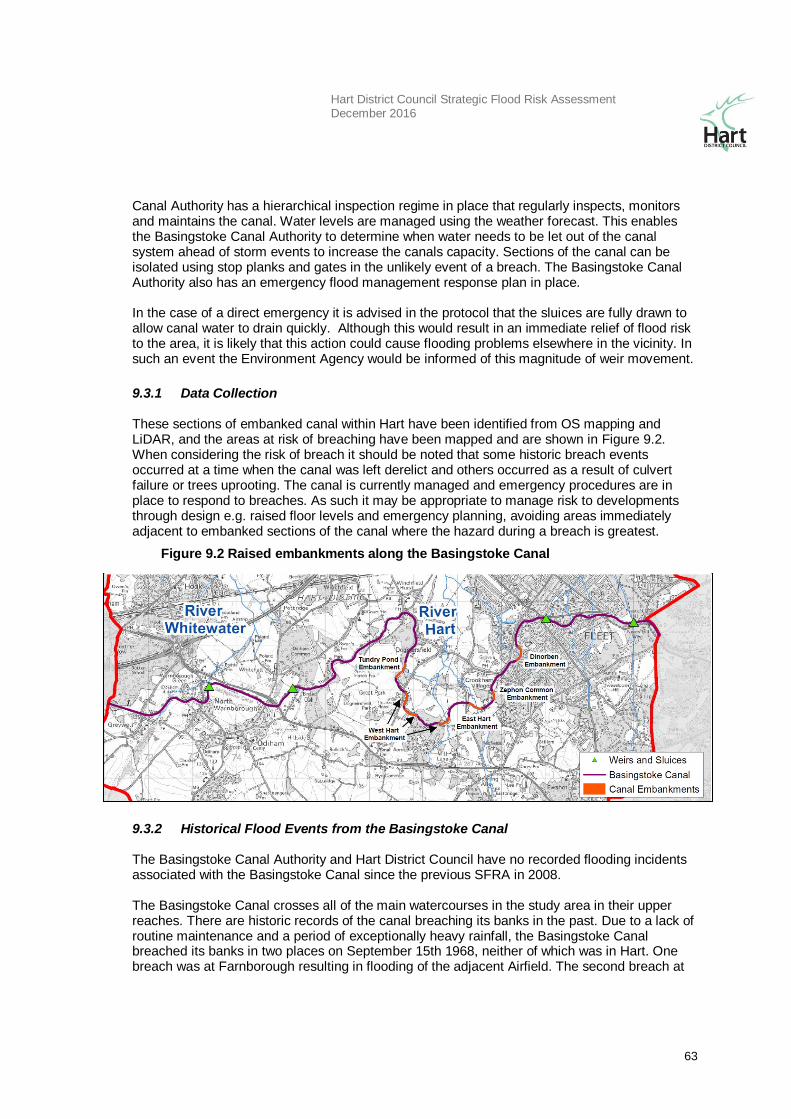
Hart District Council Strategic Flood Risk Assessment December 2016
63
Canal Authority has a hierarchical inspection regime in place that regularly inspects, monitors and maintains the canal. Water levels are managed using the weather forecast. This enables the Basingstoke Canal Authority to determine when water needs to be let out of the canal system ahead of storm events to increase the canals capacity. Sections of the canal can be isolated using stop planks and gates in the unlikely event of a breach. The Basingstoke Canal Authority also has an emergency flood management response plan in place. In the case of a direct emergency it is advised in the protocol that the sluices are fully drawn to allow canal water to drain quickly. Although this would result in an immediate relief of flood risk to the area, it is likely that this action could cause flooding problems elsewhere in the vicinity. In such an event the Environment Agency would be informed of this magnitude of weir movement.
9.3.1 Data Collection These sections of embanked canal within Hart have been identified from OS mapping and LiDAR, and the areas at risk of breaching have been mapped and are shown in Figure 9.2. When considering the risk of breach it should be noted that some historic breach events occurred at a time when the canal was left derelict and others occurred as a result of culvert failure or trees uprooting. The canal is currently managed and emergency procedures are in place to respond to breaches. As such it may be appropriate to manage risk to developments through design e.g. raised floor levels and emergency planning, avoiding areas immediately adjacent to embanked sections of the canal where the hazard during a breach is greatest.
9.3.2 Historical Flood Events from the Basingstoke Canal The Basingstoke Canal Authority and Hart District Council have no recorded flooding incidents associated with the Basingstoke Canal since the previous SFRA in 2008. The Basingstoke Canal crosses all of the main watercourses in the study area in their upper reaches. There are historic records of the canal breaching its banks in the past. Due to a lack of routine maintenance and a period of exceptionally heavy rainfall, the Basingstoke Canal breached its banks in two places on September 15th 1968, neither of which was in Hart. One breach was at Farnborough resulting in flooding of the adjacent Airfield. The second breach at
Figure 9.2 Raised embankments along the Basingstoke Canal
Hart District Council Strategic Flood Risk Assessment December 2016
64
Aldershot caused limited damage, but did leave a substantial opening in the Ash embankment at Rushmoor. The Ash embankment failed due to the roots of a fallen tree pulling up the bank. This was the last major breach of the Basingstoke Canal. If a similar breach occurred today the damage would potentially be much more severe. Heavy rain in June 2007 caused a box culvert to collapse under the canal at Double Bridge Farm, Dogmersfield. This resulted in a land slip and a breach across the flow path, but was quickly brought under control. No incidents of flooding from the canal have been recorded in Hart but there was a near miss incident in the winter of 2013/2014 when there was a land slide on the embanked section of the canal uphill of Dogmersfield. However, quick action by the Basingstoke Canal Authority avoided flooding.
9.4 Management of Flooding From Artificial Sources in Hart
Flooding from artificial sources can be managed through regular inspections of structural integrity, development of emergency procedures, development design and emergency escape routes. Ideally where possible, the areas of highest risk should be avoided during site allocations to prevent an increased exposure the risk.
9.5 Planning Considerations
Although the residual risk of a canal embankment breach is low, the consequence on the local area immediately adjacent to the canal, should a breach occur, could be significant. For this reason the site allocations should consider the risk of canal breach. Development adjacent to the canal embankments should be supported by a breach analysis and appropriate mitigation. The SFRA refines the information on the Flood Map and determines the variations in flood risk from all sources of flooding across their area. The information then should form the basis for preparing appropriate policies for flood risk management for these areas. The propensity for flooding from artificial sources should be a material consideration when making land use allocation decisions. Further collation of all relevant data, such as asset information, measured water levels, operating regimes, past history and photographs of events and consultation with operating authorities should be undertaken when preparing more detailed Flood Risk Assessments. More specifically, factors that should be taken into account during these detailed assessments are the:
area liable to flooding;
extent, standard and effectiveness of existing impoundment structures;
likely depth of flooding;
likelihood of impacts to other areas;
effects of climate change.
Local planning authorities currently consult with the Basingstoke Canal Authority and should continue to do so for future planning applications. The Basingstoke Canal Authority provides recommendations regarding the risks posed to developments by the canal. There is currently no

Hart District Council Strategic Flood Risk Assessment December 2016
65
agreed standard freeboard on floor levels and therefore it is recommended that development control policies are developed and requirements agreed for development sites at residual risk of flooding from canal breach. Any planning application on the Fleet Pond Reservoir embankment or in a location affecting a primary or secondary flow route of the reservoir must be reviewed and approved by the supervising engineer to ensure that the safe working of the reservoir is not compromised.
Hart District Council Strategic Flood Risk Assessment December 2016
66
10. Indicative Flood Problem Areas
10.1 Description
The NPPF advises that SFRAs should identify local areas of known flood risk to assist both decision makers and those carrying out site specific FRAs. For this reason Indicative Flood Problem Areas (IFPAs) have been identified to highlight specific areas in Hart that are believed to be at a high risk of flooding from surface water and groundwater. Ideally, new development should avoid these areas but where new development is unavoidable in an IFPA, development should include measures to minimise internal property damage and the displacement of flood waters. It is recommended that measures such as raised finished floor levels and/or flood resilient/resistant measures, under floor voids (where feasible), and avoiding basements in groundwater IFPAs are included in the development design. Indicative Flood Problem Areas in Hart can be viewed in the accompanying Volume 2 – Maps.
10.2 Data Collection
The following datasets have been used in the process of identifying IFPAs: The British Geological Survey (BGS) Susceptibility to Groundwater Flooding dataset, the Environment Agency’s Updated Flood Map for Surface Water (uFMfSW) and Flood Map for Surface Water (FMfSW) models and Hart District Council held historic records of surface water flooding.
10.1.1 10.2.1 Assessing best model extent for Indicative Flood Problem Areas
As the BGS Susceptibility to Groundwater Flooding dataset is the only relatively detailed groundwater model available at the time of writing the SFRA, the groundwater flooding at the surface layer has been used to identify groundwater IFPAs. However, as there are two surface water models available that cover Hart, the Flood Map for Surface Water (FMfSW) and the Updated Flood Map for Surface Water (uFMfSW), further assessment was required to determine which model best represent surface water flooding issues in Hart. Both are readily available, national scale, surface water models produced for the Environment Agency. Hart District Council has undertaken a detail assessment of both these models against historic flood records from five surface water flood events to determine which model best represents surface water flood risk in Hart. Hart District Council holds historic records (many at property level) from August 2015, January/ February 2014, July 2007, November/December 2006 and February 1990. In total Hart District Council holds 213 records of surface water flooding (both internal and external) across these five flood events. 72 of these records relate to internal flooding from surface water. Unfortunately the return period of each historic flood event is unknown but none of these events are thought to be very extreme. Rather more frequent and small scale in nature. The quality of the data will vary for each historic event as will the level of verification depending on who was the drainage engineer at the time and the circumstance of collection. Very few details exist on how these records were collected, however, 2014 records were definitely
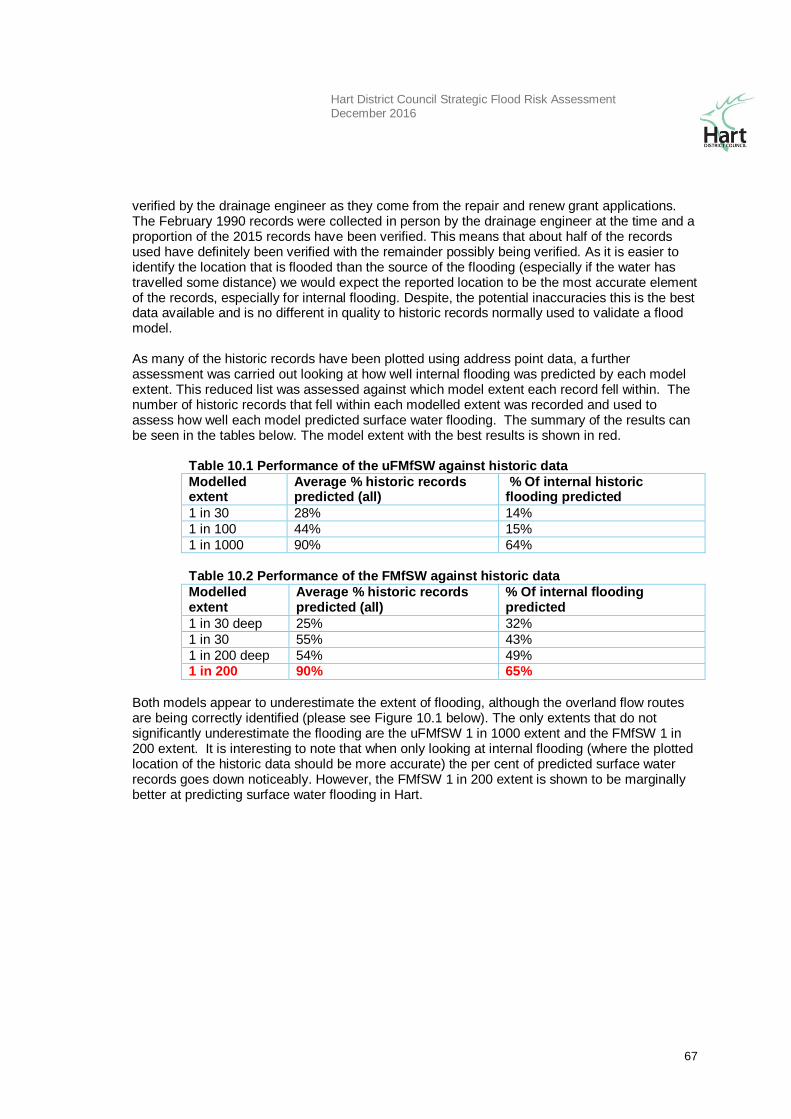
Hart District Council Strategic Flood Risk Assessment December 2016
67
verified by the drainage engineer as they come from the repair and renew grant applications. The February 1990 records were collected in person by the drainage engineer at the time and a proportion of the 2015 records have been verified. This means that about half of the records used have definitely been verified with the remainder possibly being verified. As it is easier to identify the location that is flooded than the source of the flooding (especially if the water has travelled some distance) we would expect the reported location to be the most accurate element of the records, especially for internal flooding. Despite, the potential inaccuracies this is the best data available and is no different in quality to historic records normally used to validate a flood model. As many of the historic records have been plotted using address point data, a further assessment was carried out looking at how well internal flooding was predicted by each model extent. This reduced list was assessed against which model extent each record fell within. The number of historic records that fell within each modelled extent was recorded and used to assess how well each model predicted surface water flooding. The summary of the results can be seen in the tables below. The model extent with the best results is shown in red.
Table 10.1 Performance of the uFMfSW against historic data
Modelled extent
Average % historic records predicted (all)
% Of internal historic flooding predicted
1 in 30 28% 14%
1 in 100 44% 15%
1 in 1000 90% 64%
Table 10.2 Performance of the FMfSW against historic data
Modelled extent
Average % historic records predicted (all)
% Of internal flooding predicted
1 in 30 deep 25% 32%
1 in 30 55% 43%
1 in 200 deep 54% 49% 1 in 200 90% 65%
Both models appear to underestimate the extent of flooding, although the overland flow routes are being correctly identified (please see Figure 10.1 below). The only extents that do not significantly underestimate the flooding are the uFMfSW 1 in 1000 extent and the FMfSW 1 in 200 extent. It is interesting to note that when only looking at internal flooding (where the plotted location of the historic data should be more accurate) the per cent of predicted surface water records goes down noticeably. However, the FMfSW 1 in 200 extent is shown to be marginally better at predicting surface water flooding in Hart.
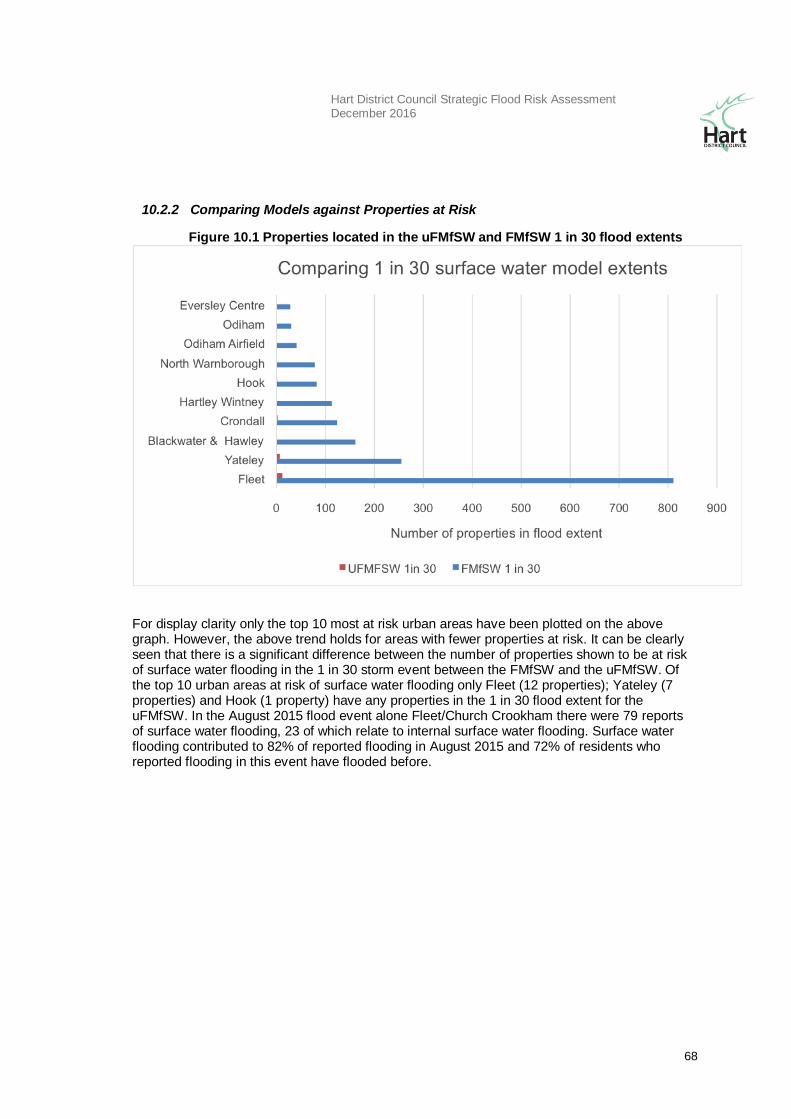
Hart District Council Strategic Flood Risk Assessment December 2016
68
10.1.2 10.2.2 Comparing Models against Properties at Risk
Figure 10.1 Properties located in the uFMfSW and FMfSW 1 in 30 flood extents
For display clarity only the top 10 most at risk urban areas have been plotted on the above graph. However, the above trend holds for areas with fewer properties at risk. It can be clearly seen that there is a significant difference between the number of properties shown to be at risk of surface water flooding in the 1 in 30 storm event between the FMfSW and the uFMfSW. Of the top 10 urban areas at risk of surface water flooding only Fleet (12 properties); Yateley (7 properties) and Hook (1 property) have any properties in the 1 in 30 flood extent for the uFMfSW. In the August 2015 flood event alone Fleet/Church Crookham there were 79 reports of surface water flooding, 23 of which relate to internal surface water flooding. Surface water flooding contributed to 82% of reported flooding in August 2015 and 72% of residents who reported flooding in this event have flooded before.
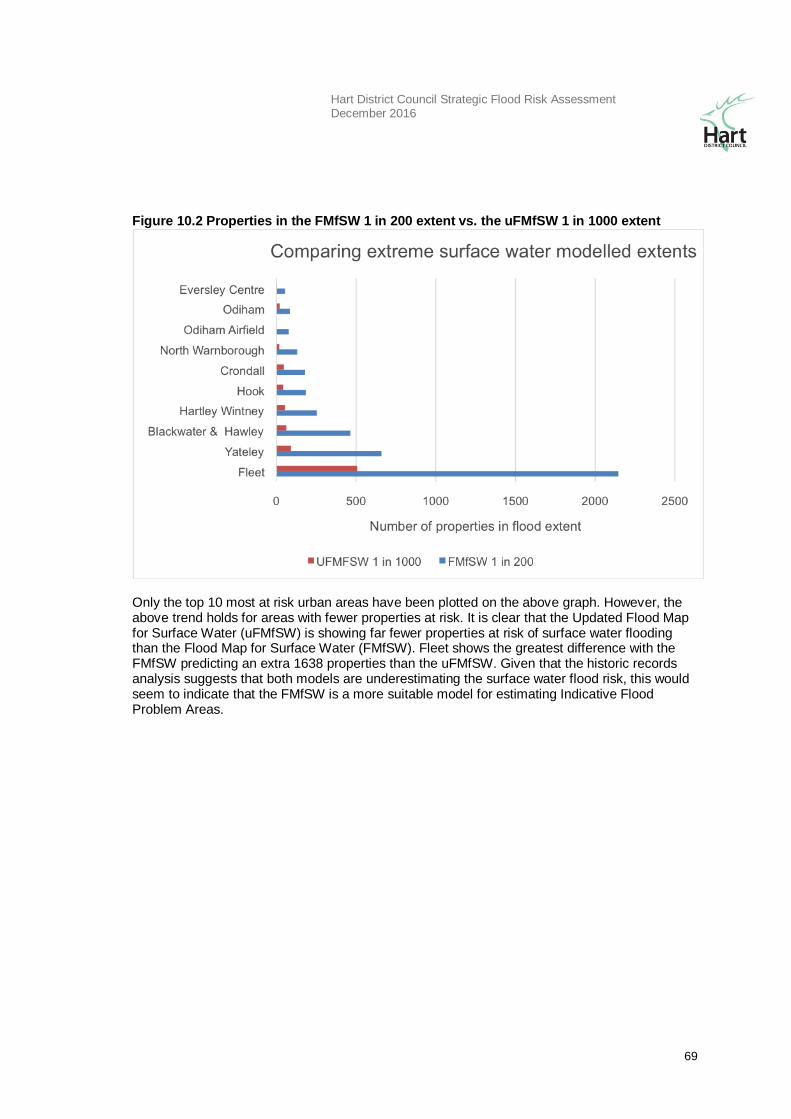
Hart District Council Strategic Flood Risk Assessment December 2016
69
Figure 10.2 Properties in the FMfSW 1 in 200 extent vs. the uFMfSW 1 in 1000 extent
Only the top 10 most at risk urban areas have been plotted on the above graph. However, the above trend holds for areas with fewer properties at risk. It is clear that the Updated Flood Map for Surface Water (uFMfSW) is showing far fewer properties at risk of surface water flooding than the Flood Map for Surface Water (FMfSW). Fleet shows the greatest difference with the FMfSW predicting an extra 1638 properties than the uFMfSW. Given that the historic records analysis suggests that both models are underestimating the surface water flood risk, this would seem to indicate that the FMfSW is a more suitable model for estimating Indicative Flood Problem Areas.
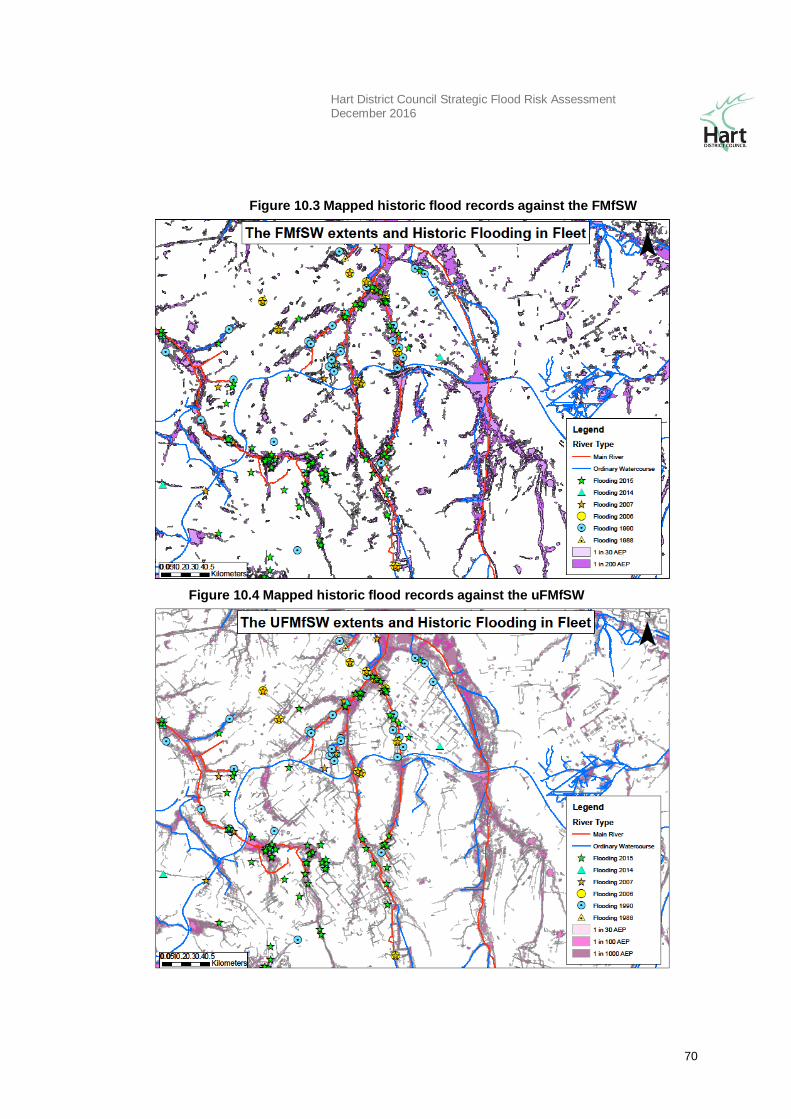
Hart District Council Strategic Flood Risk Assessment December 2016
70
Figure 10.3 Mapped historic flood records against the FMfSW
Figure 10.4 Mapped historic flood records against the uFMfSW
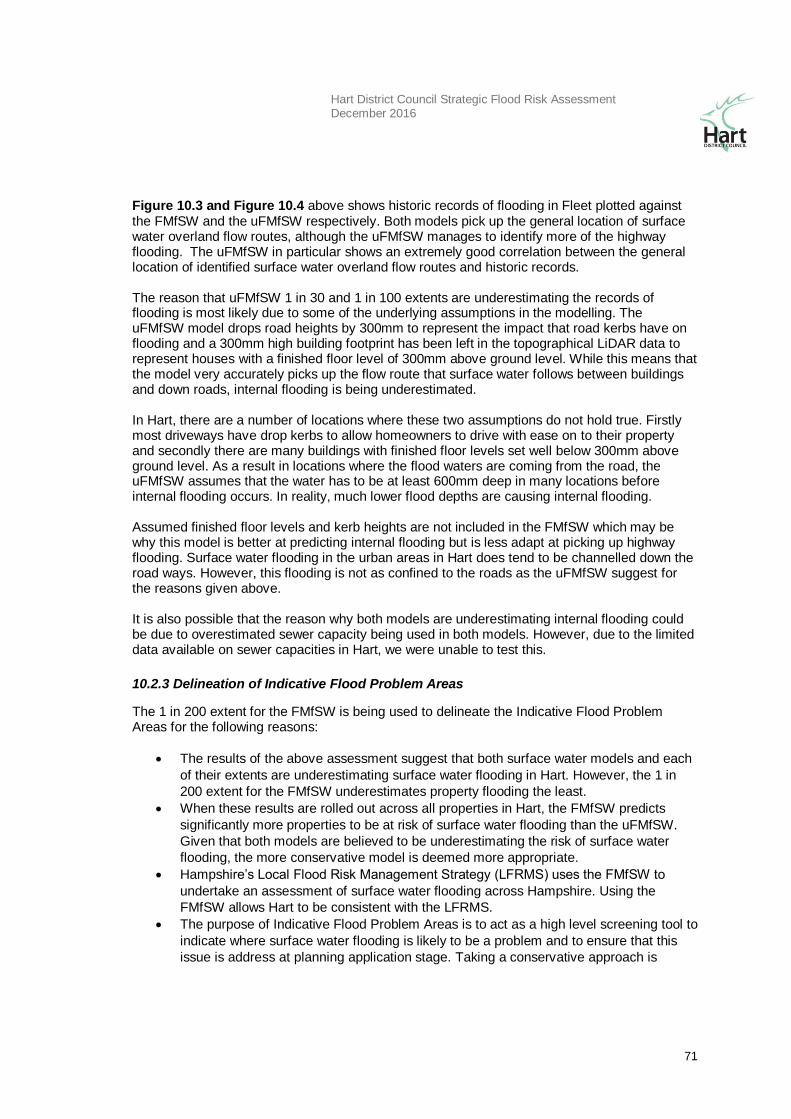
Hart District Council Strategic Flood Risk Assessment December 2016
71
Figure 10.3 and Figure 10.4 above shows historic records of flooding in Fleet plotted against the FMfSW and the uFMfSW respectively. Both models pick up the general location of surface water overland flow routes, although the uFMfSW manages to identify more of the highway flooding. The uFMfSW in particular shows an extremely good correlation between the general location of identified surface water overland flow routes and historic records. The reason that uFMfSW 1 in 30 and 1 in 100 extents are underestimating the records of flooding is most likely due to some of the underlying assumptions in the modelling. The uFMfSW model drops road heights by 300mm to represent the impact that road kerbs have on flooding and a 300mm high building footprint has been left in the topographical LiDAR data to represent houses with a finished floor level of 300mm above ground level. While this means that the model very accurately picks up the flow route that surface water follows between buildings and down roads, internal flooding is being underestimated. In Hart, there are a number of locations where these two assumptions do not hold true. Firstly most driveways have drop kerbs to allow homeowners to drive with ease on to their property and secondly there are many buildings with finished floor levels set well below 300mm above ground level. As a result in locations where the flood waters are coming from the road, the uFMfSW assumes that the water has to be at least 600mm deep in many locations before internal flooding occurs. In reality, much lower flood depths are causing internal flooding. Assumed finished floor levels and kerb heights are not included in the FMfSW which may be why this model is better at predicting internal flooding but is less adapt at picking up highway flooding. Surface water flooding in the urban areas in Hart does tend to be channelled down the road ways. However, this flooding is not as confined to the roads as the uFMfSW suggest for the reasons given above. It is also possible that the reason why both models are underestimating internal flooding could be due to overestimated sewer capacity being used in both models. However, due to the limited data available on sewer capacities in Hart, we were unable to test this.
10.1.3 10.2.3 Delineation of Indicative Flood Problem Areas
The 1 in 200 extent for the FMfSW is being used to delineate the Indicative Flood Problem Areas for the following reasons:
The results of the above assessment suggest that both surface water models and each
of their extents are underestimating surface water flooding in Hart. However, the 1 in
200 extent for the FMfSW underestimates property flooding the least.
When these results are rolled out across all properties in Hart, the FMfSW predicts
significantly more properties to be at risk of surface water flooding than the uFMfSW.
Given that both models are believed to be underestimating the risk of surface water
flooding, the more conservative model is deemed more appropriate.
Hampshire’s Local Flood Risk Management Strategy (LFRMS) uses the FMfSW to
undertake an assessment of surface water flooding across Hampshire. Using the
FMfSW allows Hart to be consistent with the LFRMS.
The purpose of Indicative Flood Problem Areas is to act as a high level screening tool to
indicate where surface water flooding is likely to be a problem and to ensure that this
issue is address at planning application stage. Taking a conservative approach is
Hart District Council Strategic Flood Risk Assessment December 2016
72
deemed appropriate for a screening tool as this can be challenged if necessary at
planning application stage with more locally detailed data.
The measures required protecting a property from internal flooding are not arduous on
developers and it is deemed more important to address internal flooding than risk
missing areas of potential high risk.
Please note that the uFMfSW is still deemed the best model at predicting the location of
overland flow routes, even though its flood extents are underestimated.
10.3 Planning Considerations
The Indicative Flood Problem Areas for surface water and groundwater flooding should be used to identify when a proposed development could be at risk of flooding from a local source of flooding. It is recommended that development is directed away from these areas where possible. If this is not possible for other overriding planning reasons then mitigation measure should be employed to minimise the likelihood of internal flooding and prevent (where possible) flood waters being displaced elsewhere. Measures could include raising finished floor levels, installing flood resilient and resistant measures, using underfloor voids (where feasible) and in larger (major) developments level for level compensation.
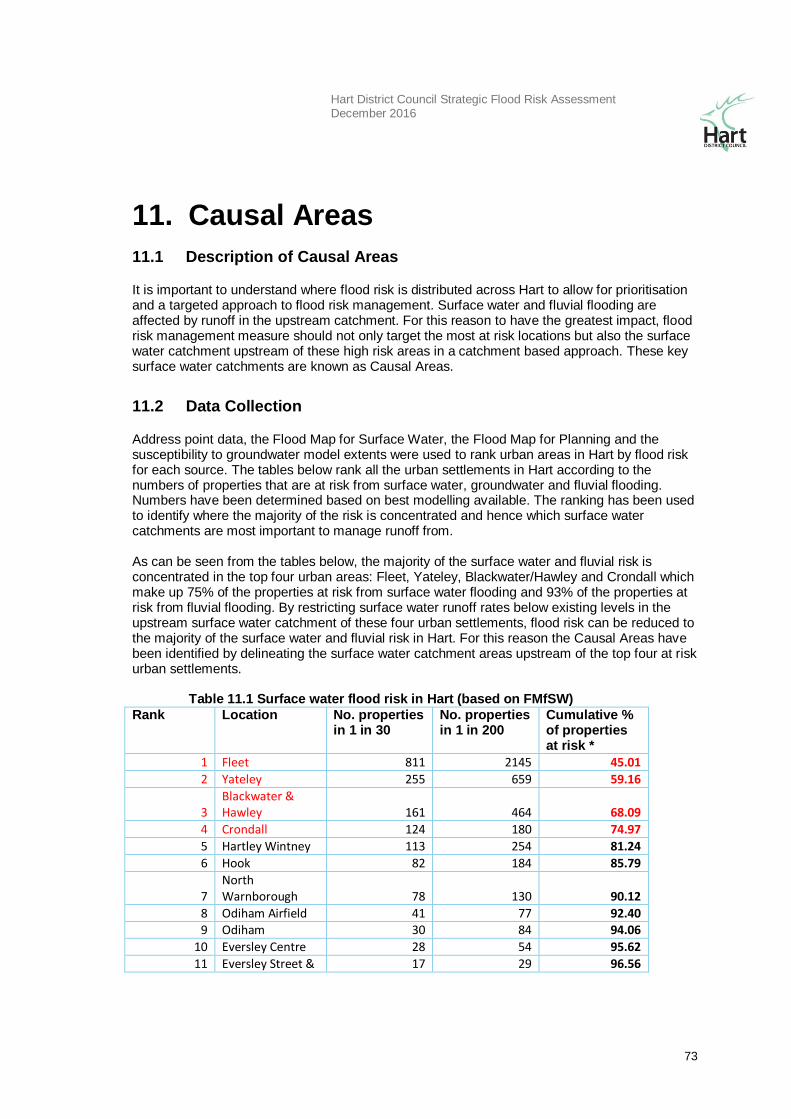
Hart District Council Strategic Flood Risk Assessment December 2016
73
11. Causal Areas
11.1 Description of Causal Areas
It is important to understand where flood risk is distributed across Hart to allow for prioritisation and a targeted approach to flood risk management. Surface water and fluvial flooding are affected by runoff in the upstream catchment. For this reason to have the greatest impact, flood risk management measure should not only target the most at risk locations but also the surface water catchment upstream of these high risk areas in a catchment based approach. These key surface water catchments are known as Causal Areas.
11.2 Data Collection
Address point data, the Flood Map for Surface Water, the Flood Map for Planning and the susceptibility to groundwater model extents were used to rank urban areas in Hart by flood risk for each source. The tables below rank all the urban settlements in Hart according to the numbers of properties that are at risk from surface water, groundwater and fluvial flooding. Numbers have been determined based on best modelling available. The ranking has been used to identify where the majority of the risk is concentrated and hence which surface water catchments are most important to manage runoff from. As can be seen from the tables below, the majority of the surface water and fluvial risk is concentrated in the top four urban areas: Fleet, Yateley, Blackwater/Hawley and Crondall which make up 75% of the properties at risk from surface water flooding and 93% of the properties at risk from fluvial flooding. By restricting surface water runoff rates below existing levels in the upstream surface water catchment of these four urban settlements, flood risk can be reduced to the majority of the surface water and fluvial risk in Hart. For this reason the Causal Areas have been identified by delineating the surface water catchment areas upstream of the top four at risk urban settlements.
Table 11.1 Surface water flood risk in Hart (based on FMfSW)
Rank Location No. properties in 1 in 30
No. properties in 1 in 200
Cumulative % of properties at risk *
1 Fleet 811 2145 45.01
2 Yateley 255 659 59.16
3 Blackwater & Hawley 161 464 68.09
4 Crondall 124 180 74.97
5 Hartley Wintney 113 254 81.24
6 Hook 82 184 85.79
7 North Warnborough 78 130 90.12
8 Odiham Airfield 41 77 92.40 9 Odiham 30 84 94.06
10 Eversley Centre 28 54 95.62
11 Eversley Street & 17 29 96.56
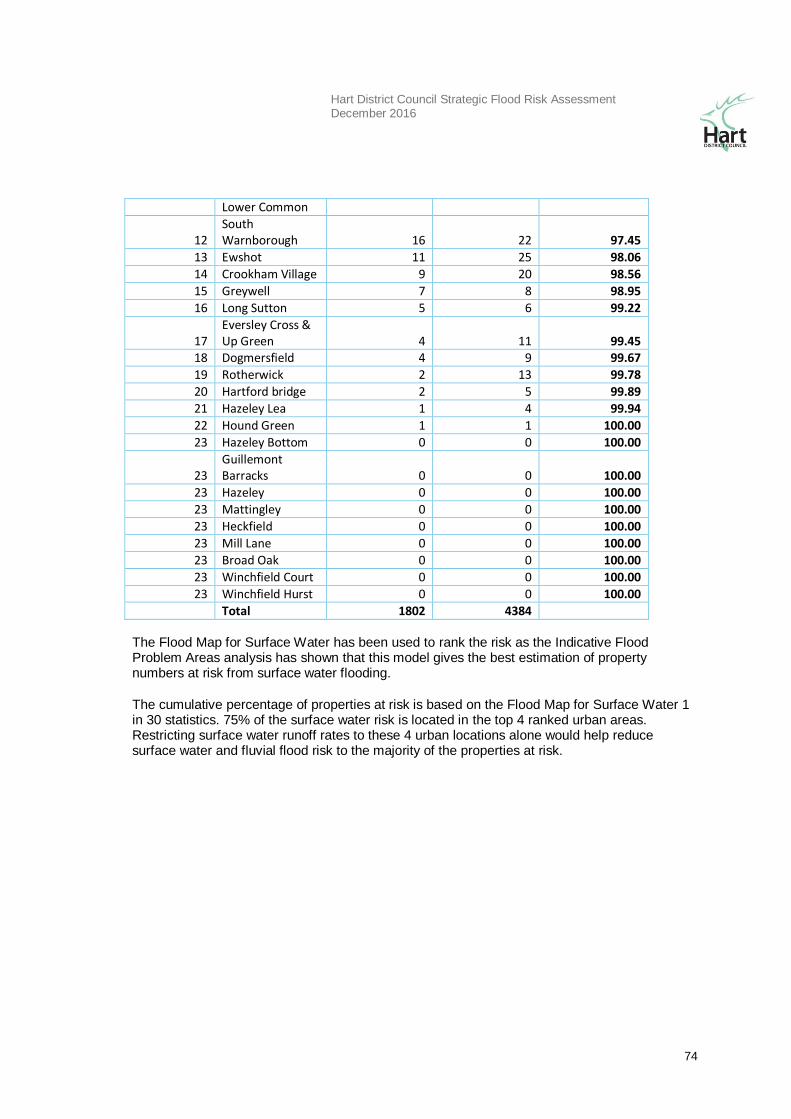
Hart District Council Strategic Flood Risk Assessment December 2016
74
Lower Common
12 South Warnborough 16 22 97.45
13 Ewshot 11 25 98.06
14 Crookham Village 9 20 98.56
15 Greywell 7 8 98.95
16 Long Sutton 5 6 99.22
17 Eversley Cross & Up Green 4 11 99.45
18 Dogmersfield 4 9 99.67
19 Rotherwick 2 13 99.78
20 Hartford bridge 2 5 99.89
21 Hazeley Lea 1 4 99.94
22 Hound Green 1 1 100.00
23 Hazeley Bottom 0 0 100.00
23 Guillemont Barracks 0 0 100.00
23 Hazeley 0 0 100.00
23 Mattingley 0 0 100.00
23 Heckfield 0 0 100.00
23 Mill Lane 0 0 100.00
23 Broad Oak 0 0 100.00
23 Winchfield Court 0 0 100.00
23 Winchfield Hurst 0 0 100.00
Total 1802 4384 The Flood Map for Surface Water has been used to rank the risk as the Indicative Flood Problem Areas analysis has shown that this model gives the best estimation of property numbers at risk from surface water flooding. The cumulative percentage of properties at risk is based on the Flood Map for Surface Water 1 in 30 statistics. 75% of the surface water risk is located in the top 4 ranked urban areas. Restricting surface water runoff rates to these 4 urban locations alone would help reduce surface water and fluvial flood risk to the majority of the properties at risk.
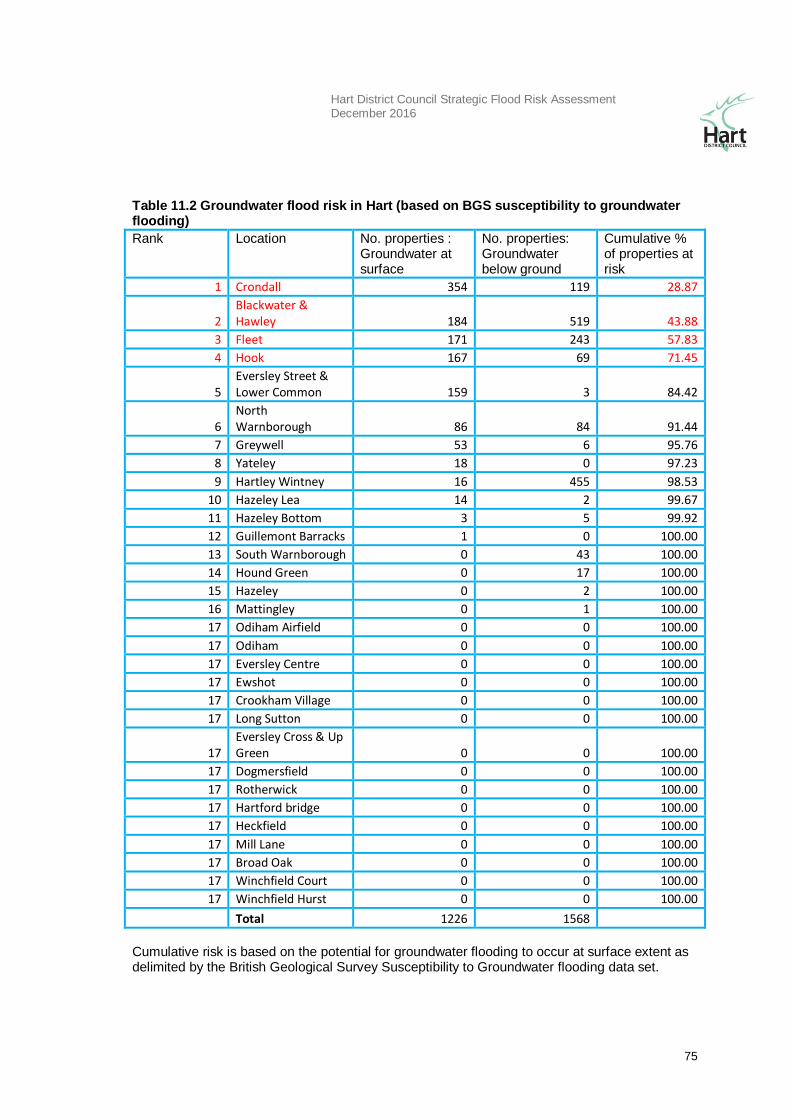
Hart District Council Strategic Flood Risk Assessment December 2016
75
Table 11.2 Groundwater flood risk in Hart (based on BGS susceptibility to groundwater flooding)
Rank Location No. properties : Groundwater at surface
No. properties: Groundwater below ground
Cumulative % of properties at risk
1 Crondall 354 119 28.87
2 Blackwater & Hawley 184 519 43.88
3 Fleet 171 243 57.83 4 Hook 167 69 71.45
5 Eversley Street & Lower Common 159 3 84.42
6 North Warnborough 86 84 91.44
7 Greywell 53 6 95.76 8 Yateley 18 0 97.23
9 Hartley Wintney 16 455 98.53 10 Hazeley Lea 14 2 99.67 11 Hazeley Bottom 3 5 99.92 12 Guillemont Barracks 1 0 100.00 13 South Warnborough 0 43 100.00 14 Hound Green 0 17 100.00 15 Hazeley 0 2 100.00 16 Mattingley 0 1 100.00 17 Odiham Airfield 0 0 100.00
17 Odiham 0 0 100.00 17 Eversley Centre 0 0 100.00 17 Ewshot 0 0 100.00 17 Crookham Village 0 0 100.00 17 Long Sutton 0 0 100.00
17 Eversley Cross & Up Green 0 0 100.00
17 Dogmersfield 0 0 100.00 17 Rotherwick 0 0 100.00 17 Hartford bridge 0 0 100.00 17 Heckfield 0 0 100.00
17 Mill Lane 0 0 100.00 17 Broad Oak 0 0 100.00 17 Winchfield Court 0 0 100.00 17 Winchfield Hurst 0 0 100.00
Total 1226 1568 Cumulative risk is based on the potential for groundwater flooding to occur at surface extent as delimited by the British Geological Survey Susceptibility to Groundwater flooding data set.
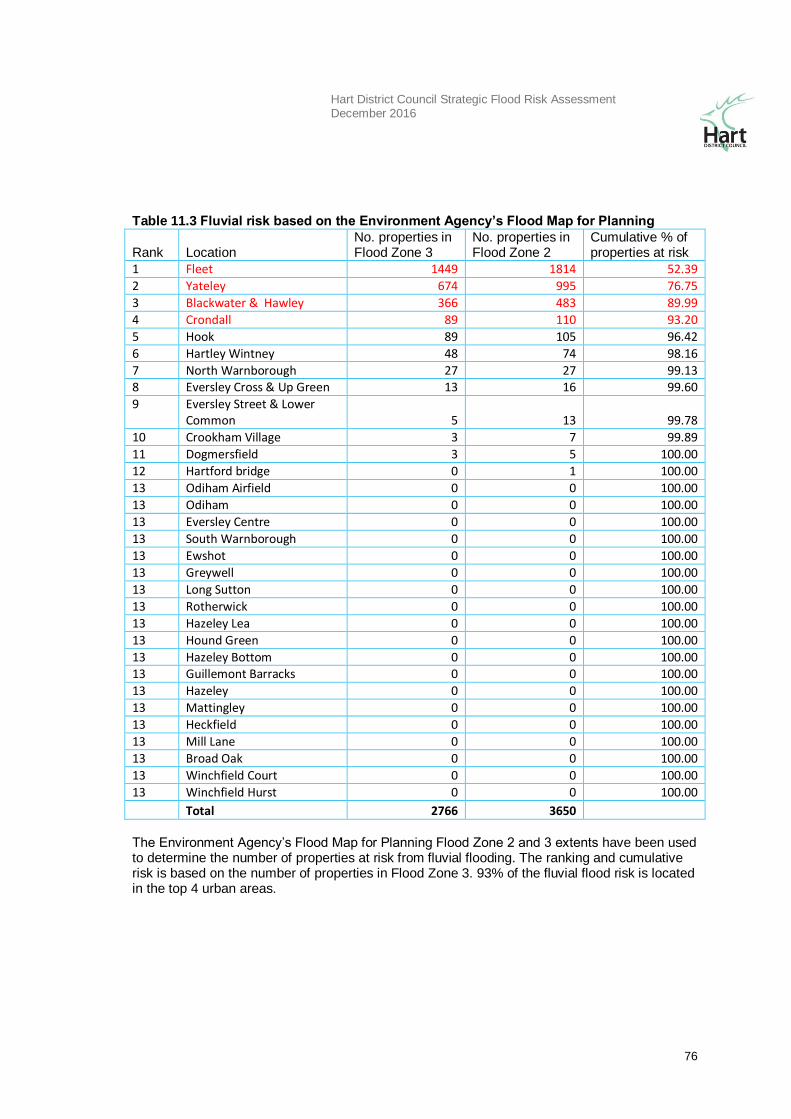
Hart District Council Strategic Flood Risk Assessment December 2016
76
Table 11.3 Fluvial risk based on the Environment Agency’s Flood Map for Planning
Rank Location
No. properties in Flood Zone 3
No. properties in Flood Zone 2
Cumulative % of properties at risk
1 Fleet 1449 1814 52.39 2 Yateley 674 995 76.75 3 Blackwater & Hawley 366 483 89.99 4 Crondall 89 110 93.20 5 Hook 89 105 96.42 6 Hartley Wintney 48 74 98.16 7 North Warnborough 27 27 99.13 8 Eversley Cross & Up Green 13 16 99.60 9 Eversley Street & Lower
Common 5 13 99.78 10 Crookham Village 3 7 99.89 11 Dogmersfield 3 5 100.00 12 Hartford bridge 0 1 100.00 13 Odiham Airfield 0 0 100.00 13 Odiham 0 0 100.00 13 Eversley Centre 0 0 100.00 13 South Warnborough 0 0 100.00 13 Ewshot 0 0 100.00 13 Greywell 0 0 100.00 13 Long Sutton 0 0 100.00 13 Rotherwick 0 0 100.00 13 Hazeley Lea 0 0 100.00 13 Hound Green 0 0 100.00 13 Hazeley Bottom 0 0 100.00 13 Guillemont Barracks 0 0 100.00 13 Hazeley 0 0 100.00 13 Mattingley 0 0 100.00 13 Heckfield 0 0 100.00 13 Mill Lane 0 0 100.00 13 Broad Oak 0 0 100.00 13 Winchfield Court 0 0 100.00 13 Winchfield Hurst 0 0 100.00 Total 2766 3650 The Environment Agency’s Flood Map for Planning Flood Zone 2 and 3 extents have been used to determine the number of properties at risk from fluvial flooding. The ranking and cumulative risk is based on the number of properties in Flood Zone 3. 93% of the fluvial flood risk is located in the top 4 urban areas.
Hart District Council Strategic Flood Risk Assessment December 2016
77
11.3 Planning Considerations
The top four urban areas at risk of surface water and fluvial flooding were the same: Fleet, Yateley, Blackwater/Hawley and Crondall. The surface water catchments for these four urban areas have been defined as Causal Areas. It is recommend that stricter management of surface water runoff is applied in these four Causal Areas as these areas will have the greatest impact on fluvial and surface water flood risk in Hart. This could include mitigation such as: all parking areas and hard surfacing (with the exception of the public highway) using permeable surfacing unless shown to be technically unviable. All brownfield development should be looking to provide a reduction in surface water runoff below existing levels. Minor new builds should be providing surface water storage and ensuring discharged rates are no higher than existing or where this is not possible due to blockage issues discharging at rates no higher than 5 l/s. All major developments are to incorporate a wide range of SuDS and demonstrate that they are fully compliant with the National SuDS Standards and latest climate change advice.
Hart District Council Strategic Flood Risk Assessment December 2016
78
12. Climate Change Allowances
12.1 Description
The National Planning Policy Framework (NPPF) and its associated Planning Practice Guidance (PPG) requires Local Plans to consider climate change mitigation and adaptation for factors such as flood risk, coastal change, water supply and changes to biodiversity and landscape. New development should be planned in a way to ensure that they do not become increasingly vulnerable to the impacts of climate change over their lifetime. In addition, where development has to be located in an area of flood risk, the proposed development must be able to demonstrate that it will be safe for its lifetime and does not increase flood risk elsewhere, and if possible, reduces flood risk overall in accordance with the Exception Test. According to the NPPF, flood risk issues that specifically should be considered in the Local Plan when considering climate change are:
Applying the Sequential Test and Exceptions Test (where applicable);
Safeguarding land that is required for current and future flood management;
Looking for opportunities with new development to reduce the causes and impact of
flooding; and
Identifying where the expected increase in flood risk under climate change could make
existing development unsustainable in the long term. The Local Plan should facilitate
the relocation of development, including housing, to more sustainable locations.
12.2 Environment Agency Best Practice Guidance
On the 19th February 2016 the Environment Agency updated its best practice guidance on
climate change allowances and how these should be applied to site specific Flood Risk Assessments and government funded flood alleviation schemes. This guidance is based on the UKCP09 data and findings as the best available, scientific, evidence to provide more representative climate change allowances for England and latest planning policy guidance. The ‘Flood Risk Assessments: Climate Change Allowances’ can be viewed at: https://www.gov.uk/guidance/flood-risk-assessments-climate-change-allowances Determining climate change projections is a complex science with associated significant uncertainties. This research indicates that the impacts of climate change are likely to vary across the country. Depending on the scenario used and the time period looked at, the variations can be significant. As a result the climate change allowances are represented as a range of possibilities with varying climate change impacts over time. To translate these findings into a practical approach for new development, the latest guidance ‘Flood Risk Assessments: Climate Change Allowances’ has taken the following approach:
Divided the climate change allowance over three timeframes: 2015-2039, 2040 -
2069 and 2070 – 2115.
Provide climate change allowances for each River Basin District. (Hart District
Council falls under the Thames River Basin District.)

Hart District Council Strategic Flood Risk Assessment December 2016
79
Separated the allowance by statistical likelihood into central, higher central,
upper end and High ++ scenarios. The central allowance is based on the 50th
percentile, the higher central on the 70th percentile and the upper end on the 90
th
percentile. A percentile is defined as the proportion of possible scenarios that are likely
to have a climate change allowance of less than the allowance being used. So the 70th
percentile means that 70% of the scenarios tested had a climate change allowance less
than the 70th percentile value while 30% of the scenarios had a value greater than this.
The High ++ scenario represents an increase in the climate change impact beyond the
likely range but within physical plausibility.
Used a risk based approach to applying the climate change allowances based on
the consequence of the development flooding. So the greater the consequence and
likelihood of a particular development flooding, the greater the climate change
allowance that should be applied to that development.
12.3 Applying Appropriate Climate Change Allowances in Hart
This Level 1 SFRA summarises the relevant advice and guidance for new development falling in the Hart District area. As Hart District falls in the Thames River Basin District the tables below relate to the Peak River Flows and Rainfall Intensities expected in the Thames region. This SFRA should not be used for development located outside of Hart District. It is important to ensure that the appropriate climate change allowances are applied for all developments at every stage of the planning process to ensure that the development is safe for its lifetime and does not increased the risk of flooding off site during its lifetime. The application of climate change allowances should be done in accordance with the latest Environment Agency guidelines (see appendix 1).
12.4 Determining Climate Change Allowances
To assist, this SFRA provides a step by step guide as follows: Step 1: Determine which Flood Zone the development site falls in. This is based on the greatest river flood risk within the site boundary. See Table 5.2 of the SFRA or Table 1 (Flood Zones) of the National Planning Practice Guidance. Step 2: Determine the developments flood risk vulnerability classification. See Table 13.1 of the SFRA or Table 2 (Flood Risk Vulnerability Classification) of the National Planning Practice Guidance. Step 3: Using Table 12.1 below determine with climate change allowance scenario applies to the development.
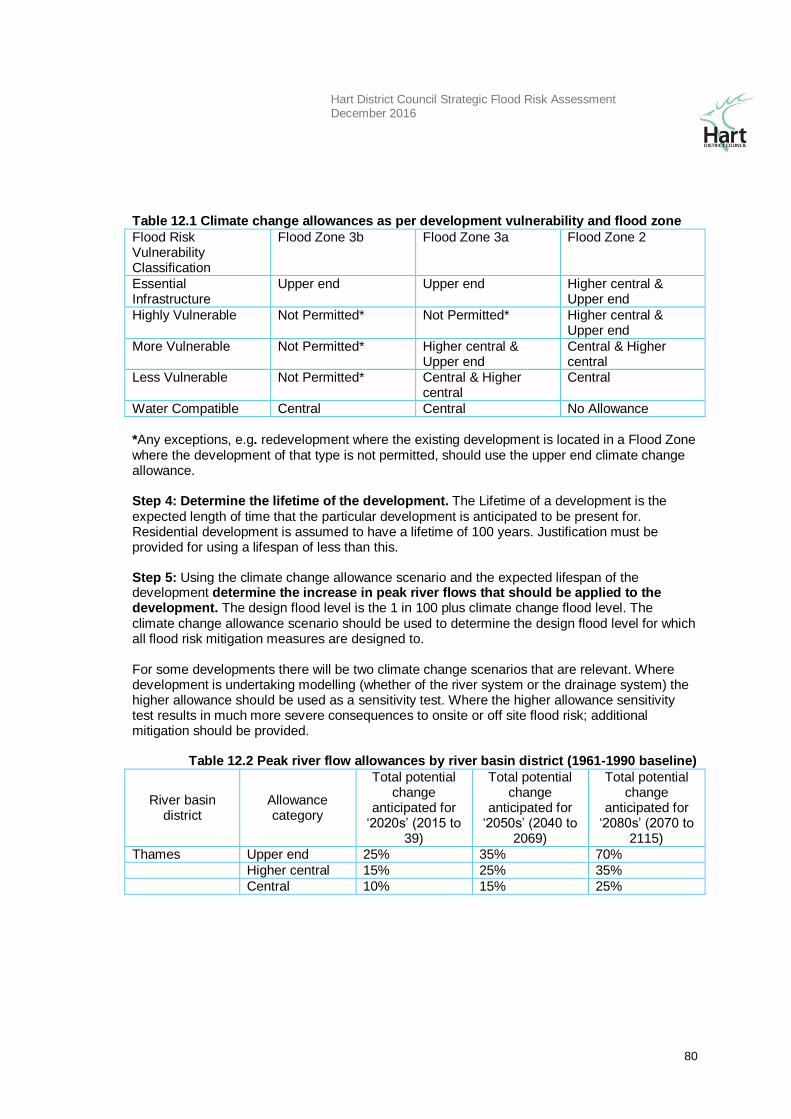
Hart District Council Strategic Flood Risk Assessment December 2016
80
Table 12.1 Climate change allowances as per development vulnerability and flood zone
Flood Risk Vulnerability Classification
Flood Zone 3b Flood Zone 3a Flood Zone 2
Essential Infrastructure
Upper end Upper end Higher central & Upper end
Highly Vulnerable Not Permitted* Not Permitted* Higher central & Upper end
More Vulnerable Not Permitted* Higher central & Upper end
Central & Higher central
Less Vulnerable Not Permitted* Central & Higher central
Central
Water Compatible Central Central No Allowance *Any exceptions, e.g. redevelopment where the existing development is located in a Flood Zone where the development of that type is not permitted, should use the upper end climate change allowance. Step 4: Determine the lifetime of the development. The Lifetime of a development is the expected length of time that the particular development is anticipated to be present for. Residential development is assumed to have a lifetime of 100 years. Justification must be provided for using a lifespan of less than this. Step 5: Using the climate change allowance scenario and the expected lifespan of the development determine the increase in peak river flows that should be applied to the development. The design flood level is the 1 in 100 plus climate change flood level. The climate change allowance scenario should be used to determine the design flood level for which all flood risk mitigation measures are designed to. For some developments there will be two climate change scenarios that are relevant. Where development is undertaking modelling (whether of the river system or the drainage system) the higher allowance should be used as a sensitivity test. Where the higher allowance sensitivity test results in much more severe consequences to onsite or off site flood risk; additional mitigation should be provided.
Table 12.2 Peak river flow allowances by river basin district (1961-1990 baseline)
River basin district
Allowance category
Total potential change
anticipated for ‘2020s’ (2015 to
39)
Total potential change
anticipated for ‘2050s’ (2040 to
2069)
Total potential change
anticipated for ‘2080s’ (2070 to
2115)
Thames Upper end 25% 35% 70%
Higher central 15% 25% 35%
Central 10% 15% 25%
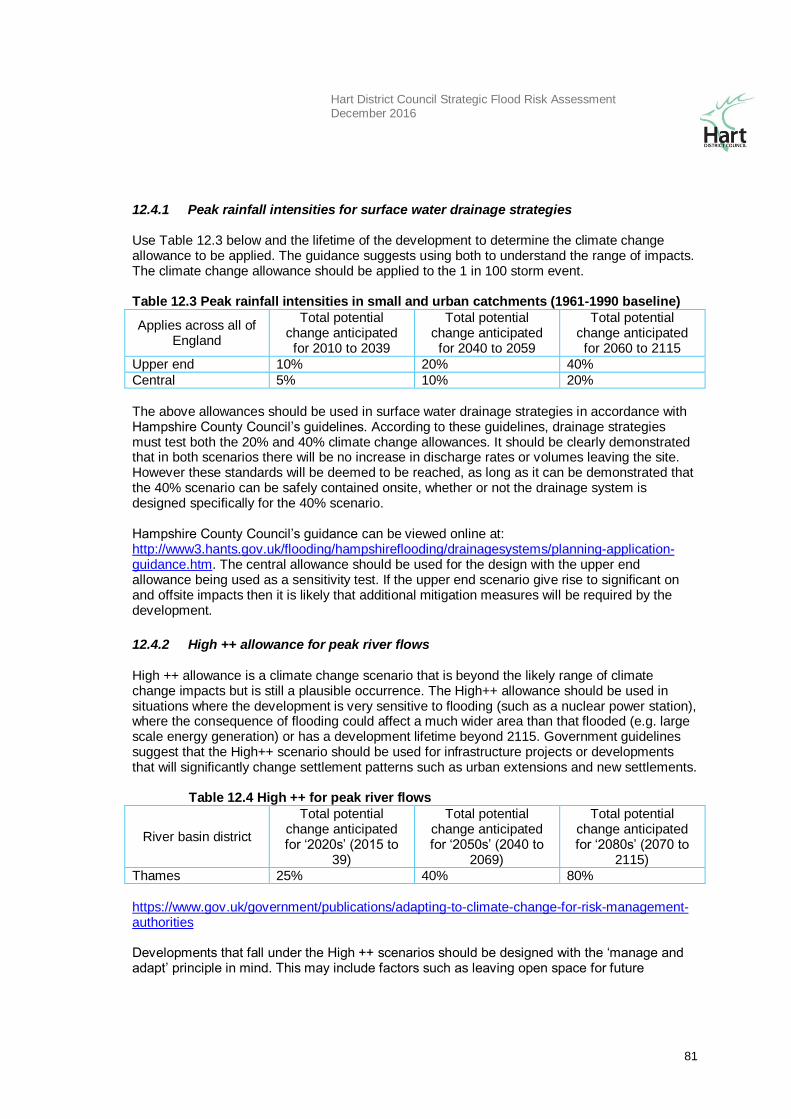
Hart District Council Strategic Flood Risk Assessment December 2016
81
12.4.1 Peak rainfall intensities for surface water drainage strategies Use Table 12.3 below and the lifetime of the development to determine the climate change allowance to be applied. The guidance suggests using both to understand the range of impacts. The climate change allowance should be applied to the 1 in 100 storm event. Table 12.3 Peak rainfall intensities in small and urban catchments (1961-1990 baseline)
Applies across all of England
Total potential change anticipated for 2010 to 2039
Total potential change anticipated for 2040 to 2059
Total potential change anticipated for 2060 to 2115
Upper end 10% 20% 40%
Central 5% 10% 20%
The above allowances should be used in surface water drainage strategies in accordance with Hampshire County Council’s guidelines. According to these guidelines, drainage strategies must test both the 20% and 40% climate change allowances. It should be clearly demonstrated that in both scenarios there will be no increase in discharge rates or volumes leaving the site. However these standards will be deemed to be reached, as long as it can be demonstrated that the 40% scenario can be safely contained onsite, whether or not the drainage system is designed specifically for the 40% scenario. Hampshire County Council’s guidance can be viewed online at: http://www3.hants.gov.uk/flooding/hampshireflooding/drainagesystems/planning-application-guidance.htm. The central allowance should be used for the design with the upper end allowance being used as a sensitivity test. If the upper end scenario give rise to significant on and offsite impacts then it is likely that additional mitigation measures will be required by the development.
12.4.2 High ++ allowance for peak river flows High ++ allowance is a climate change scenario that is beyond the likely range of climate change impacts but is still a plausible occurrence. The High++ allowance should be used in situations where the development is very sensitive to flooding (such as a nuclear power station), where the consequence of flooding could affect a much wider area than that flooded (e.g. large scale energy generation) or has a development lifetime beyond 2115. Government guidelines suggest that the High++ scenario should be used for infrastructure projects or developments that will significantly change settlement patterns such as urban extensions and new settlements.
Table 12.4 High ++ for peak river flows
River basin district
Total potential change anticipated for ‘2020s’ (2015 to
39)
Total potential change anticipated for ‘2050s’ (2040 to
2069)
Total potential change anticipated for ‘2080s’ (2070 to
2115)
Thames 25% 40% 80%
https://www.gov.uk/government/publications/adapting-to-climate-change-for-risk-management-authorities Developments that fall under the High ++ scenarios should be designed with the ‘manage and adapt’ principle in mind. This may include factors such as leaving open space for future
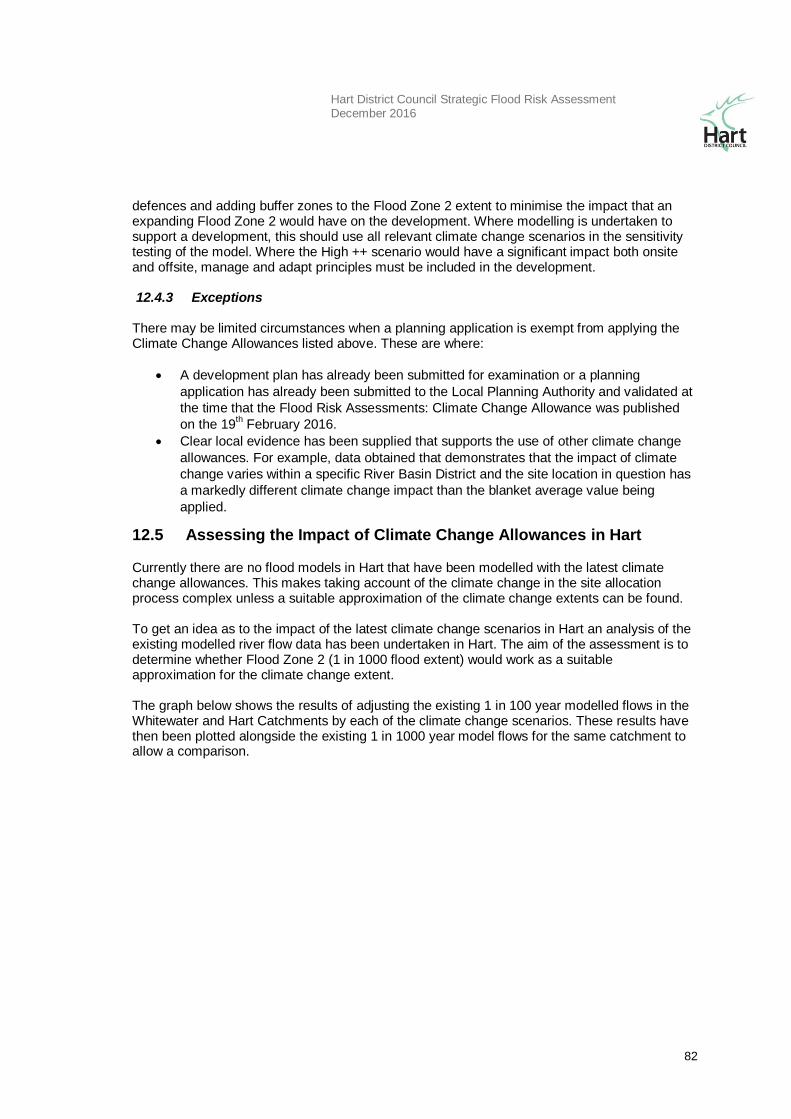
Hart District Council Strategic Flood Risk Assessment December 2016
82
defences and adding buffer zones to the Flood Zone 2 extent to minimise the impact that an expanding Flood Zone 2 would have on the development. Where modelling is undertaken to support a development, this should use all relevant climate change scenarios in the sensitivity testing of the model. Where the High ++ scenario would have a significant impact both onsite and offsite, manage and adapt principles must be included in the development. 12.4.3 Exceptions There may be limited circumstances when a planning application is exempt from applying the Climate Change Allowances listed above. These are where:
A development plan has already been submitted for examination or a planning
application has already been submitted to the Local Planning Authority and validated at
the time that the Flood Risk Assessments: Climate Change Allowance was published
on the 19th February 2016.
Clear local evidence has been supplied that supports the use of other climate change
allowances. For example, data obtained that demonstrates that the impact of climate
change varies within a specific River Basin District and the site location in question has
a markedly different climate change impact than the blanket average value being
applied.
12.5 Assessing the Impact of Climate Change Allowances in Hart
Currently there are no flood models in Hart that have been modelled with the latest climate change allowances. This makes taking account of the climate change in the site allocation process complex unless a suitable approximation of the climate change extents can be found. To get an idea as to the impact of the latest climate change scenarios in Hart an analysis of the existing modelled river flow data has been undertaken in Hart. The aim of the assessment is to determine whether Flood Zone 2 (1 in 1000 flood extent) would work as a suitable approximation for the climate change extent. The graph below shows the results of adjusting the existing 1 in 100 year modelled flows in the Whitewater and Hart Catchments by each of the climate change scenarios. These results have then been plotted alongside the existing 1 in 1000 year model flows for the same catchment to allow a comparison.
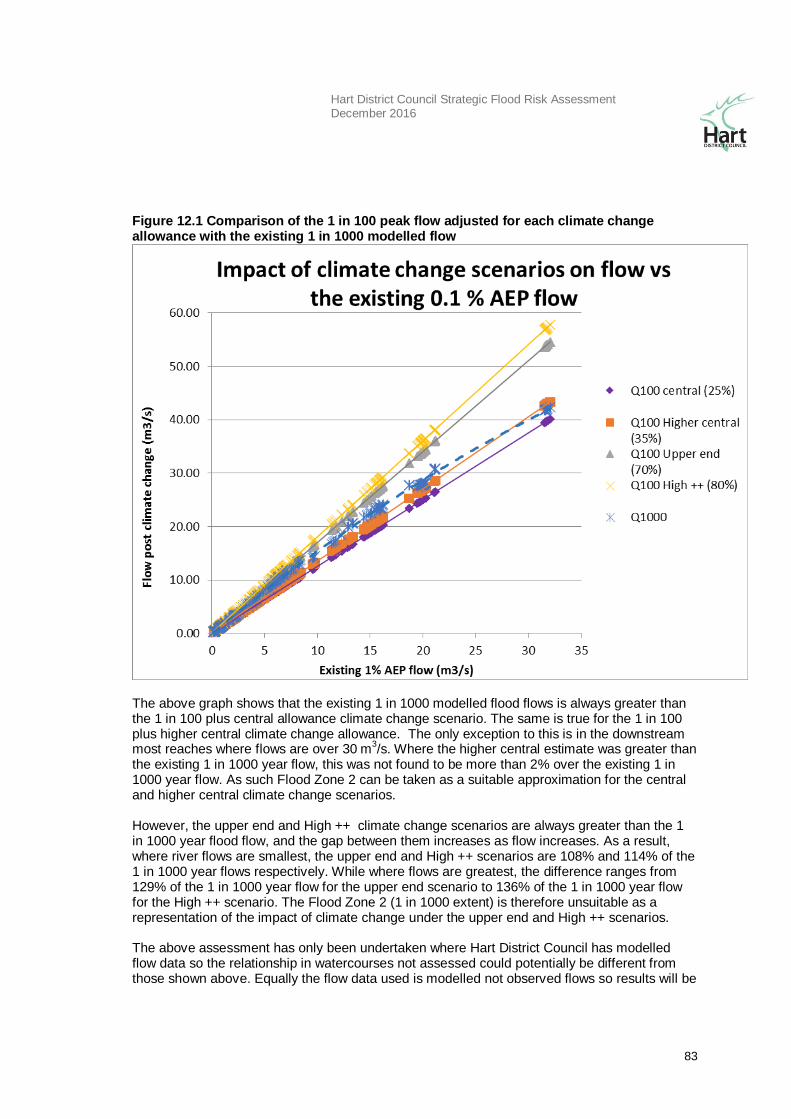
Hart District Council Strategic Flood Risk Assessment December 2016
83
Figure 12.1 Comparison of the 1 in 100 peak flow adjusted for each climate change allowance with the existing 1 in 1000 modelled flow
The above graph shows that the existing 1 in 1000 modelled flood flows is always greater than the 1 in 100 plus central allowance climate change scenario. The same is true for the 1 in 100 plus higher central climate change allowance. The only exception to this is in the downstream most reaches where flows are over 30 m
3/s. Where the higher central estimate was greater than
the existing 1 in 1000 year flow, this was not found to be more than 2% over the existing 1 in 1000 year flow. As such Flood Zone 2 can be taken as a suitable approximation for the central and higher central climate change scenarios. However, the upper end and High ++ climate change scenarios are always greater than the 1 in 1000 year flood flow, and the gap between them increases as flow increases. As a result, where river flows are smallest, the upper end and High ++ scenarios are 108% and 114% of the 1 in 1000 year flows respectively. While where flows are greatest, the difference ranges from 129% of the 1 in 1000 year flow for the upper end scenario to 136% of the 1 in 1000 year flow for the High ++ scenario. The Flood Zone 2 (1 in 1000 extent) is therefore unsuitable as a representation of the impact of climate change under the upper end and High ++ scenarios. The above assessment has only been undertaken where Hart District Council has modelled flow data so the relationship in watercourses not assessed could potentially be different from those shown above. Equally the flow data used is modelled not observed flows so results will be
Hart District Council Strategic Flood Risk Assessment December 2016
84
less accurate than if observed flows were used. As more appropriate data becomes available the ‘climate change extent’ used in the SFRA should be revised. The above assessment does indicate that Flood Zone 2 can be used, under certain circumstances, as a high level screening tool to help with site allocations and individual development. However, most planning applications are likely to need to undertake further assessment.
12.5.1 Implications for potential site allocations According to Table 12.1 above, the results of the flow analysis and Environment Agency National Guidance, sites wholly in Flood Zone 1 can still be treated as Flood Zone 1 in the site allocations work. Sites that are a combination of flood zones or are wholly within Flood Zone 2 or 3 have been addressed using Table 12.5 below for the best approximation for the climate change extent. Some sites contain a range of Flood Zones. If these sites pass the sequential test it is likely, depending on the development type, that they may trigger a Level 2 SFRA. If the vulnerable elements of the development (e.g. the housing) are allocated in a flood zone where the upper end allowance applies then detailed bespoke modelling will be expected as part of a Level 2 SFRA. Environment Agency National Guidance does not have a fluvial climate change allowance for more vulnerable development in Flood Zone 1. This means that if, during the Level 2 SFRA, the vulnerable elements can be located in Flood Zone 1 or where using the existing Flood Zone 2 extent is acceptable, bespoke modelling will not be needed to comply with the EA National Guidance on climate change. However, as the above results have shown, Flood Zone 2 is likely to be smaller than the Upper End and High ++ climate change scenario extents. So as a precaution, it is advised that detail modelling will only be avoided in cases where the built development is wholly located in Flood Zone 1 with a 10m buffer added to Flood Zone 2 extent and all Finished Floor Level within 100m of any form of flooding should be raised by 300mm above surrounding ground levels. Table 12.5 below defines the possible approaches to account for flood risk impacts due to climate change, in new development proposals:
Basic: Developers can add an allowance to the 'design flood' (i.e. 1% annual probability) peak levels to account for potential climate change impacts. The allowance should be derived and agreed locally by Environment Agency teams.
Intermediate: Developers can use existing modelled flood and flow data to construct a stage-discharge rating curve, which can be used to interpolate a flood level based on the required peak flow allowance to apply to the ‘design flood’ flow.
Detailed: Perform detailed hydraulic modelling, through either re-running Environment Agency hydraulic models (if available) or construction of a new model by the developer.
Site Allocations: Where a level 2 SFRA is triggered, if the site can follow a sequential approach to the layout and place all built development outside of Flood Zone 2 with a 10m buffer (with other residual risk measures), detailed modelling will not be needed. However, if built development is located in the Flood Zones then the need for modelling will be triggered in accordance with table 12.5 below. Any developments where the High ++ climate change scenarios applies will need to be accompanied by detailed modelling. For sites located wholly in Flood Zone 1, the Flood Zone 2 extent is sufficient to assess climate change in the site allocation and sequential test process.
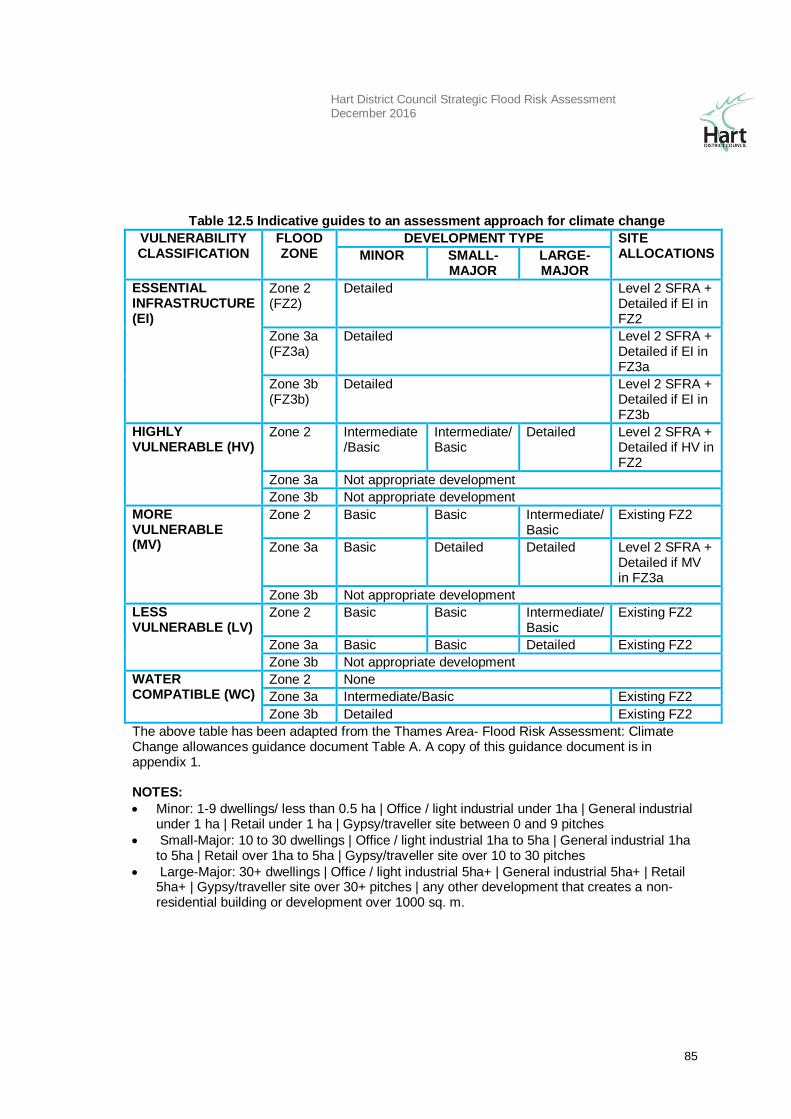
Hart District Council Strategic Flood Risk Assessment December 2016
85
Table 12.5 Indicative guides to an assessment approach for climate change
VULNERABILITY CLASSIFICATION
FLOOD ZONE
DEVELOPMENT TYPE SITE ALLOCATIONS MINOR SMALL-
MAJOR LARGE-MAJOR
ESSENTIAL INFRASTRUCTURE (EI)
Zone 2 (FZ2)
Detailed Level 2 SFRA + Detailed if EI in FZ2
Zone 3a (FZ3a)
Detailed Level 2 SFRA + Detailed if EI in FZ3a
Zone 3b (FZ3b)
Detailed Level 2 SFRA + Detailed if EI in FZ3b
HIGHLY VULNERABLE (HV)
Zone 2 Intermediate /Basic
Intermediate/ Basic
Detailed Level 2 SFRA + Detailed if HV in FZ2
Zone 3a Not appropriate development
Zone 3b Not appropriate development
MORE VULNERABLE (MV)
Zone 2 Basic Basic Intermediate/ Basic
Existing FZ2
Zone 3a Basic Detailed Detailed Level 2 SFRA + Detailed if MV in FZ3a
Zone 3b Not appropriate development
LESS VULNERABLE (LV)
Zone 2 Basic Basic Intermediate/ Basic
Existing FZ2
Zone 3a Basic Basic Detailed Existing FZ2
Zone 3b Not appropriate development
WATER COMPATIBLE (WC)
Zone 2 None
Zone 3a Intermediate/Basic Existing FZ2
Zone 3b Detailed Existing FZ2
The above table has been adapted from the Thames Area- Flood Risk Assessment: Climate Change allowances guidance document Table A. A copy of this guidance document is in appendix 1. NOTES:
Minor: 1-9 dwellings/ less than 0.5 ha | Office / light industrial under 1ha | General industrial under 1 ha | Retail under 1 ha | Gypsy/traveller site between 0 and 9 pitches
Small-Major: 10 to 30 dwellings | Office / light industrial 1ha to 5ha | General industrial 1ha to 5ha | Retail over 1ha to 5ha | Gypsy/traveller site over 10 to 30 pitches
Large-Major: 30+ dwellings | Office / light industrial 5ha+ | General industrial 5ha+ | Retail 5ha+ | Gypsy/traveller site over 30+ pitches | any other development that creates a non-residential building or development over 1000 sq. m.
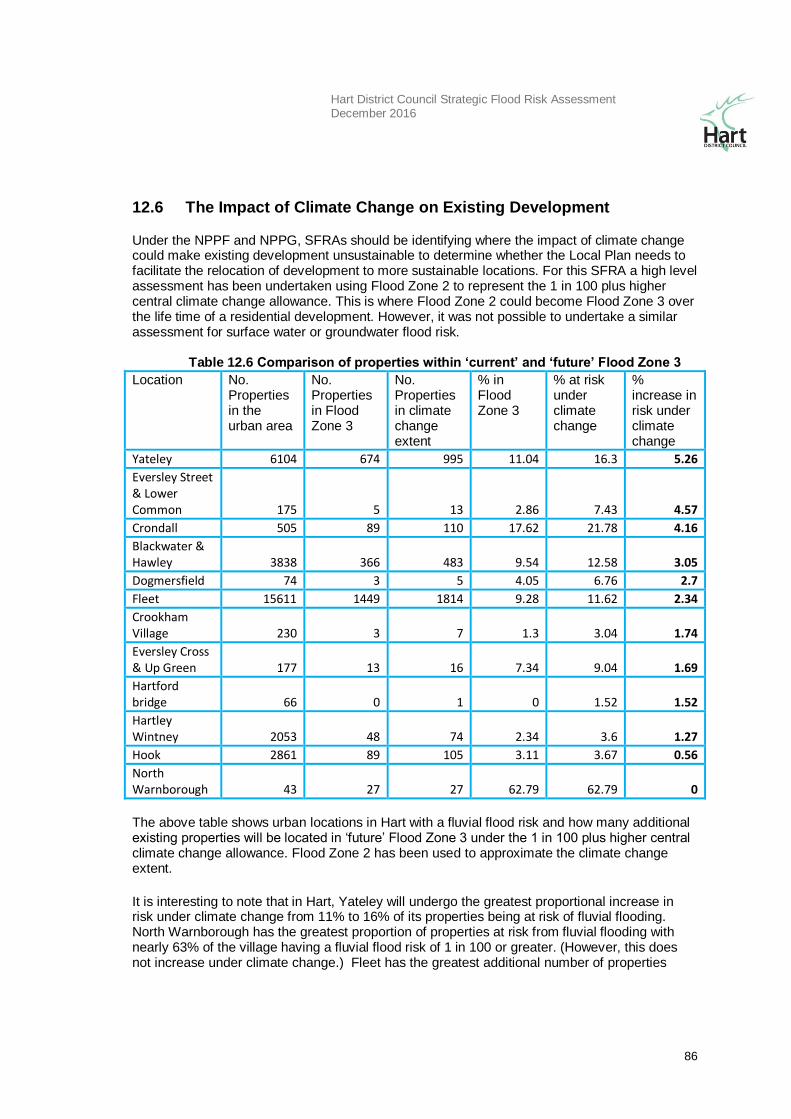
Hart District Council Strategic Flood Risk Assessment December 2016
86
12.6 The Impact of Climate Change on Existing Development
Under the NPPF and NPPG, SFRAs should be identifying where the impact of climate change could make existing development unsustainable to determine whether the Local Plan needs to facilitate the relocation of development to more sustainable locations. For this SFRA a high level assessment has been undertaken using Flood Zone 2 to represent the 1 in 100 plus higher central climate change allowance. This is where Flood Zone 2 could become Flood Zone 3 over the life time of a residential development. However, it was not possible to undertake a similar assessment for surface water or groundwater flood risk.
Table 12.6 Comparison of properties within ‘current’ and ‘future’ Flood Zone 3
Location No. Properties in the urban area
No. Properties in Flood Zone 3
No. Properties in climate change extent
% in Flood Zone 3
% at risk under climate change
% increase in risk under climate change
Yateley 6104 674 995 11.04 16.3 5.26 Eversley Street & Lower Common 175 5 13 2.86 7.43 4.57 Crondall 505 89 110 17.62 21.78 4.16 Blackwater & Hawley 3838 366 483 9.54 12.58 3.05 Dogmersfield 74 3 5 4.05 6.76 2.7 Fleet 15611 1449 1814 9.28 11.62 2.34 Crookham Village 230 3 7 1.3 3.04 1.74 Eversley Cross & Up Green 177 13 16 7.34 9.04 1.69 Hartford bridge 66 0 1 0 1.52 1.52 Hartley Wintney 2053 48 74 2.34 3.6 1.27 Hook 2861 89 105 3.11 3.67 0.56 North Warnborough 43 27 27 62.79 62.79 0 The above table shows urban locations in Hart with a fluvial flood risk and how many additional existing properties will be located in ‘future’ Flood Zone 3 under the 1 in 100 plus higher central climate change allowance. Flood Zone 2 has been used to approximate the climate change extent.
It is interesting to note that in Hart, Yateley will undergo the greatest proportional increase in risk under climate change from 11% to 16% of its properties being at risk of fluvial flooding. North Warnborough has the greatest proportion of properties at risk from fluvial flooding with nearly 63% of the village having a fluvial flood risk of 1 in 100 or greater. (However, this does not increase under climate change.) Fleet has the greatest additional number of properties
Hart District Council Strategic Flood Risk Assessment December 2016
87
being put at a high fluvial risk under climate change with 365 properties being added to ‘future Flood Zone 3’. This still only makes up 12% of the properties in Fleet. Given the above, there are no identified existing urban areas that are deemed to become unsustainable due to impact of climate change on fluvial flood risk. It was not possible to assess the impact of the upper end and High ++ scenarios or look at other sources of flooding, so the potential increase in risk could be higher than the numbers identified above. Given this, there may be other scenarios where existing urban areas become unsustainable under the impacts of climate change. If better data becomes available the above assessment should be revised.
Hart District Council Strategic Flood Risk Assessment December 2016
88
13. Guidance on application of the Sequential and Exception Tests
13.1 Sequential Test
The Sequential Test is designed to ensure that areas at little or no risk of flooding are developed in preference to areas at higher risk. This will help to avoid the development of sites that are inappropriate on flood risk grounds. Whereas the application of the Exception Test, where required, will ensure that new developments in flood risk areas will only occur where flood risk is clearly outweighed by other sustainability drivers. The Sequential Test is a risk based approach to determine the suitability of development according to flood risk from all sources of flooding. The NPPF requires LPAs to apply the Sequential Test at all stages of the planning process. All opportunities to locate new developments (except Water Compatible) in reasonably available areas of little or no flood risk should be explored, prior to any decision to locate them in areas of higher risk.
13.1.1 13.1.1 Applying the Sequential Test A LPA must demonstrate that it has considered a range of possible sites in conjunction with the Flood Zone and vulnerability information from the SFRA and applied the Sequential Test, and where necessary, the Exception Test, in the site allocation process. Figure 13.1 provides guidance for applying the Sequential Test that HDC should adopt in the allocation of sites as part of the preparation of the Local Plan. The Sequential Test should be undertaken by HDC and documented to ensure that the decision processes followed for the locating of a development are consistent and transparent.
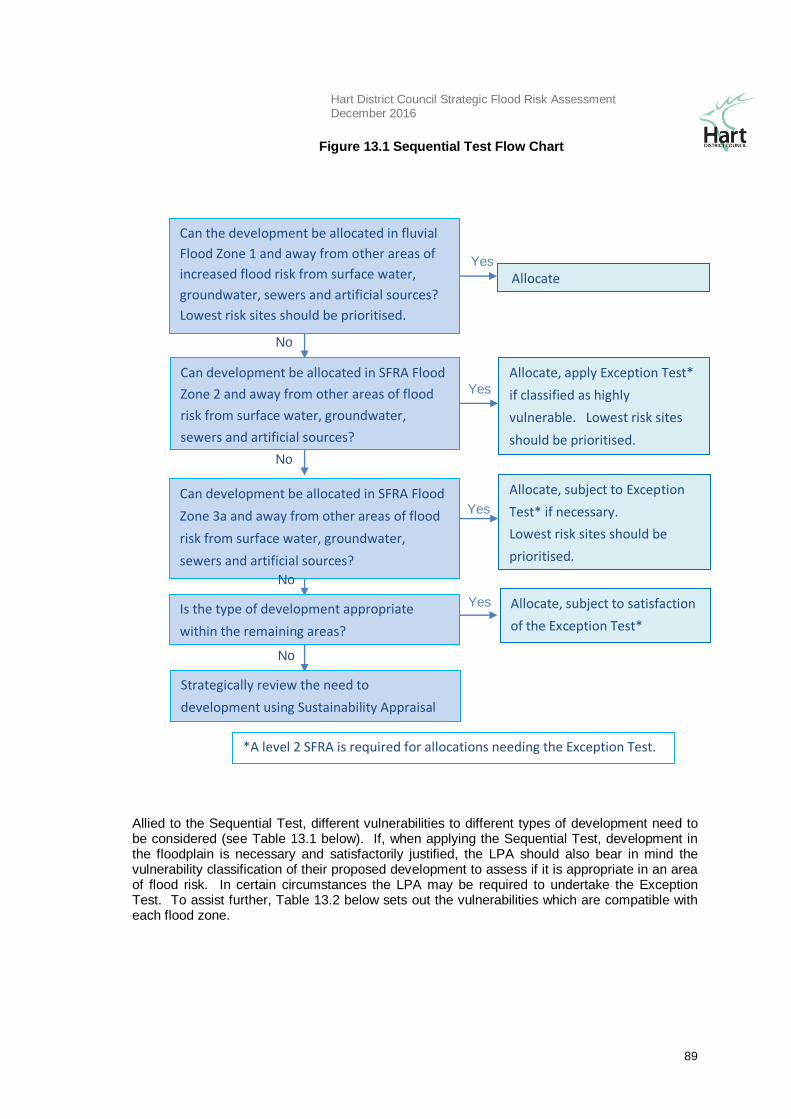
Hart District Council Strategic Flood Risk Assessment December 2016
89
Allied to the Sequential Test, different vulnerabilities to different types of development need to be considered (see Table 13.1 below). If, when applying the Sequential Test, development in the floodplain is necessary and satisfactorily justified, the LPA should also bear in mind the vulnerability classification of their proposed development to assess if it is appropriate in an area of flood risk. In certain circumstances the LPA may be required to undertake the Exception Test. To assist further, Table 13.2 below sets out the vulnerabilities which are compatible with each flood zone.
Figure 13.1 Sequential Test Flow Chart
Is the type of development appropriate
within the remaining areas?
Can the development be allocated in fluvial
Flood Zone 1 and away from other areas of
increased flood risk from surface water,
groundwater, sewers and artificial sources?
Lowest risk sites should be prioritised.
Can development be allocated in SFRA Flood
Zone 2 and away from other areas of flood
risk from surface water, groundwater,
sewers and artificial sources?
Can development be allocated in SFRA Flood
Zone 3a and away from other areas of flood
risk from surface water, groundwater,
sewers and artificial sources?
Strategically review the need to
development using Sustainability Appraisal
Allocate
Allocate, apply Exception Test*
if classified as highly
vulnerable. Lowest risk sites
should be prioritised.
Allocate, subject to Exception
Test* if necessary.
Lowest risk sites should be
prioritised.
Allocate, subject to satisfaction
of the Exception Test*
Yes
Yes
Yes
No
No
No
No
Yes
*A level 2 SFRA is required for allocations needing the Exception Test.
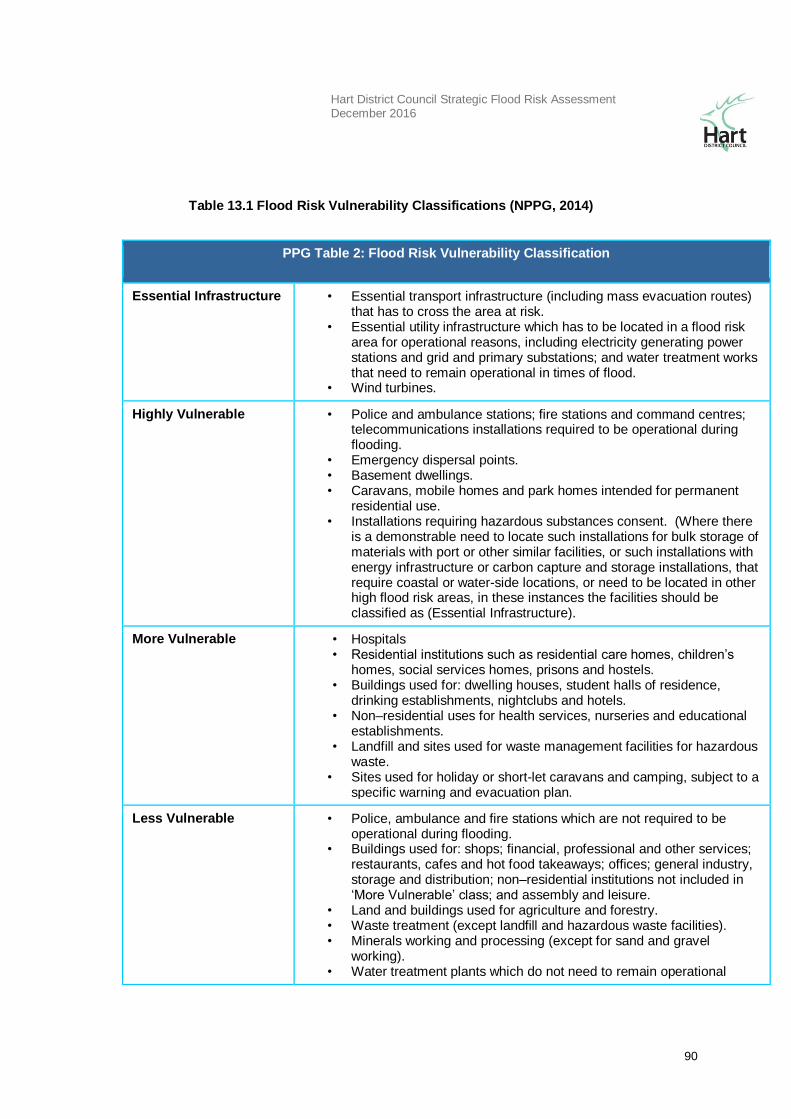
Hart District Council Strategic Flood Risk Assessment December 2016
90
Table 13.1 Flood Risk Vulnerability Classifications (NPPG, 2014)
PPG Table 2: Flood Risk Vulnerability Classification
Essential Infrastructure • Essential transport infrastructure (including mass evacuation routes) that has to cross the area at risk.
• Essential utility infrastructure which has to be located in a flood risk area for operational reasons, including electricity generating power stations and grid and primary substations; and water treatment works that need to remain operational in times of flood.
• Wind turbines.
Highly Vulnerable • Police and ambulance stations; fire stations and command centres; telecommunications installations required to be operational during flooding.
• Emergency dispersal points. • Basement dwellings. • Caravans, mobile homes and park homes intended for permanent
residential use. • Installations requiring hazardous substances consent. (Where there
is a demonstrable need to locate such installations for bulk storage of materials with port or other similar facilities, or such installations with energy infrastructure or carbon capture and storage installations, that require coastal or water-side locations, or need to be located in other high flood risk areas, in these instances the facilities should be classified as (Essential Infrastructure).
More Vulnerable • Hospitals • Residential institutions such as residential care homes, children’s
homes, social services homes, prisons and hostels. • Buildings used for: dwelling houses, student halls of residence,
drinking establishments, nightclubs and hotels. • Non–residential uses for health services, nurseries and educational
establishments. • Landfill and sites used for waste management facilities for hazardous
waste. • Sites used for holiday or short-let caravans and camping, subject to a
specific warning and evacuation plan.
Less Vulnerable • Police, ambulance and fire stations which are not required to be operational during flooding.
• Buildings used for: shops; financial, professional and other services; restaurants, cafes and hot food takeaways; offices; general industry, storage and distribution; non–residential institutions not included in ‘More Vulnerable’ class; and assembly and leisure.
• Land and buildings used for agriculture and forestry. • Waste treatment (except landfill and hazardous waste facilities). • Minerals working and processing (except for sand and gravel
working). • Water treatment plants which do not need to remain operational
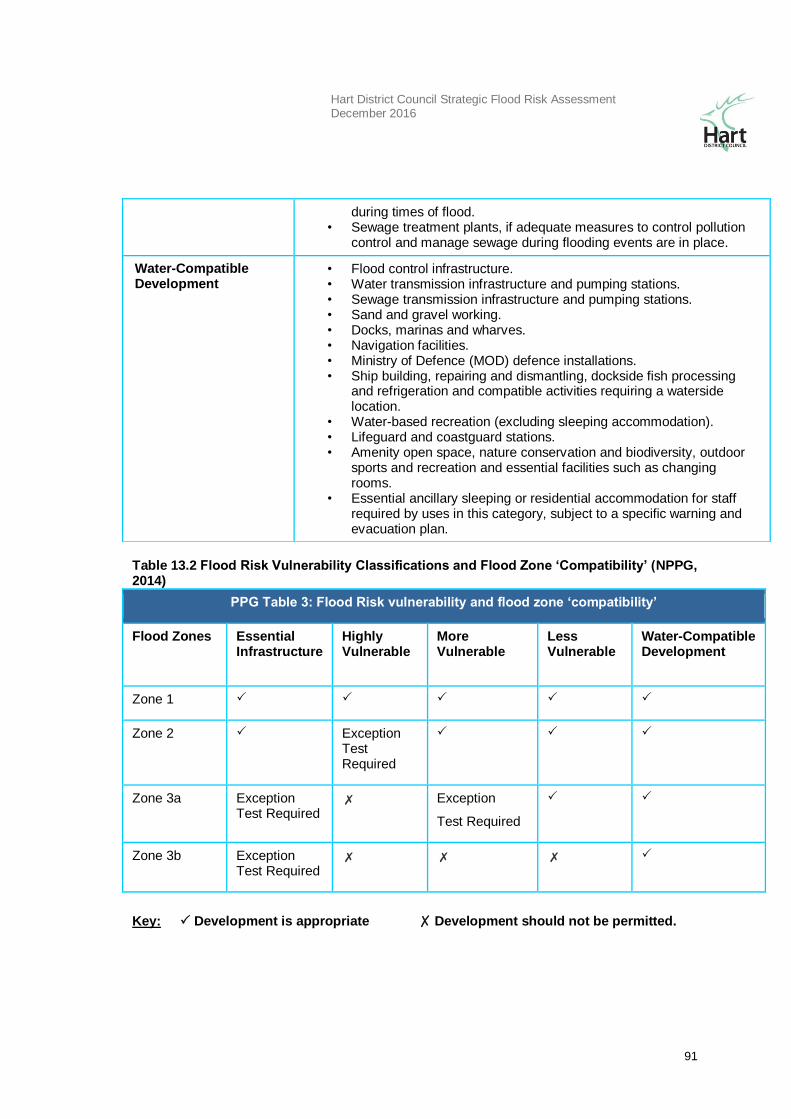
Hart District Council Strategic Flood Risk Assessment December 2016
91
Table 13.2 Flood Risk Vulnerability Classifications and Flood Zone ‘Compatibility’ (NPPG, 2014)
PPG Table 3: Flood Risk vulnerability and flood zone ‘compatibility’
Flood Zones Essential Infrastructure
Highly Vulnerable
More Vulnerable
Less Vulnerable
Water-Compatible Development
Zone 1
Zone 2 Exception Test Required
Zone 3a Exception Test Required
✗ Exception
Test Required
Zone 3b Exception Test Required
✗ ✗ ✗
Key: Development is appropriate ✗ Development should not be permitted.
during times of flood. • Sewage treatment plants, if adequate measures to control pollution
control and manage sewage during flooding events are in place.
Water-Compatible Development
• Flood control infrastructure. • Water transmission infrastructure and pumping stations. • Sewage transmission infrastructure and pumping stations. • Sand and gravel working. • Docks, marinas and wharves. • Navigation facilities. • Ministry of Defence (MOD) defence installations. • Ship building, repairing and dismantling, dockside fish processing
and refrigeration and compatible activities requiring a waterside location.
• Water-based recreation (excluding sleeping accommodation). • Lifeguard and coastguard stations. • Amenity open space, nature conservation and biodiversity, outdoor
sports and recreation and essential facilities such as changing rooms.
• Essential ancillary sleeping or residential accommodation for staff required by uses in this category, subject to a specific warning and evacuation plan.
Hart District Council Strategic Flood Risk Assessment December 2016
92
It is recognised that flood risk information must be considered alongside other spatial planning issues, HDC need to sequentially test all sites that have been put forward for consideration. This includes sites suggested through a ‘Call for Sites’, current records and sites in council ownership.
The NPPF acknowledges that some areas will (also) be at risk of flooding from sources other than fluvial. All sources must be considered when planning for new development including: flooding from land or surface water runoff; groundwater; sewers; and artificial sources. If a location is recorded as having experienced repeated flooding from the same source this should be acknowledged within the Sequential Test. The SFRA has identified five sources of flooding within the study area: rivers, surface water, sewers, groundwater and artificial water bodies (e.g. Basingstoke Canal). The NPPF places greatest emphasis on flooding from rivers, although surface water also presents a significant flood risk. There is potential for groundwater emergence, however, it is not possible to assess the exact probability of this occurring as part of a broad scale assessment. The SFRA has indicated the areas where there is greater potential for groundwater flooding to occur (Crondall, Yateley, and Whitewater Valley) to assist in the application of the Sequential Test. However, it may be appropriate for FRAs to complete more detailed groundwater analysis in areas identified as potentially at risk given the local nature of this source of flooding.
Sewer flooding has occurred historically, however, to some degree this can be managed through maintenance and improvement schemes. Flood risk from artificial sources such as the Basingstoke Canal and storage ponds, is considered a low residual risk that should be included in an assessment of sites, although it may not preclude a site from being developed.
13.1.2 Applying the Sequential Test for Planning Applications Individual planning applications will have to undertake the Sequential Test if part of the development site is located in Flood Zone 2 or 3. However, the Sequential Test can be deemed as already adequately demonstrated for such sites where:
The Sequential Test has already been undertaken and passed at that location for the same development type during the Local Plan site allocation process.
The development flood risk vulnerability can be shown to be compatible with the Flood Zone it is located in.
If the development in question does not meet the above criteria then further work on the Sequential Test should be undertaken in accordance with the Environment Agency’s ‘Demonstrating the Flood Risk Sequential Test for Planning Applications’ guidance document. The developer must provide sufficient evidence to enable the LPA, with the support of the Environment Agency, to be satisfied that the Sequential Test considerations have been met. Key issues to address when undertaking the Sequential Test are:
Defined the search area over which the Sequential test is being applied. If this is not the district area appropriate justification will be needed e.g. school catchment area or specific area of need identified in the Local Plan Policies.
Identify the source of reasonably available alternative sites e.g. Local Plan evidence base.
Hart District Council Strategic Flood Risk Assessment December 2016
93
State how a comparison of flood risk has been made between sites e.g. used SFRA mapping etc.
Apply the Sequential Test. Consider each available site and indicate whether the flood risk is higher or lower than the application site. Indicate whether the alternative options are a Local Plan allocation, the capacity and delivery constraints of the alternative sites.
Determine whether there are any reasonably available sites in areas with a lower risk of flooding that would be suitable for the type of development proposed.
Where necessary apply the Exception Test.
13.1.3 Sequential Test Exemptions The Sequential Test does not apply in the following circumstances:
Individual developments allocated and adopted in a Site Allocations Plan. Refer to paragraph 13.1.2 for further information.
Minor developments defined by the NPPF as: o Minor non-residential extensions with a footprint <250m
2
o Alterations to external appearance (does not increase the size of buildings) o Householder development within the curtilage of the existing dwellings. This
does not include a separate dwelling within the curtilage of the dwelling.
Change of use applications with the exception of changing to a caravan, camping or mobile home.
Development proposals within Flood Zone 1 (unless the SFRA indicate the site may have flooding issues now and in the future).
Redevelopment of existing properties e.g. replacement dwellings providing the following do not increase the number of dwellings or result in a net increase in built footprint. Please note that replacement dwellings will be expected to meet current best practice in flood risk management design.
13.2 Exception Test
The purpose of the Exception Test is to ensure that new development is only permitted in Flood Zone 2 and Flood Zone 3 where flood risk is clearly outweighed by other sustainability factors and where the development will be safe during its lifetime, considering climate change.
For the Exception Test to be passed:
It must be demonstrated that the development provides wider sustainability benefits to the community that outweigh flood risk, informed by the SFRA where one has been prepared; and
A site-specific Flood Risk Assessment must demonstrate that the development will be safe for its lifetime taking account of the vulnerability of its users, without increasing flood risk elsewhere, and, where possible, will reduce flood risk overall.
Both the above will have to be passed for development to be allocated or permitted.
When determining planning applications, HDC should ensure flood risk is not increased elsewhere and only consider development appropriate in areas at risk of flooding where, informed by a site-specific FRA following the Sequential Test, and if required the Exception Test, it can be demonstrated that:
Hart District Council Strategic Flood Risk Assessment December 2016
94
Within the site, the most vulnerable development is located in areas of lowest flood risk unless there are overriding reasons to prefer a different location, and
Development is appropriately flood resilient and resistant, including safe access and escape routes where required, and that any residual risk can be safely managed, including by emergency planning; and it gives priority to the use of SUDS.
There are a number of ways a new development can be made safe:
Avoiding flood risk by not developing in areas at risk from floods;
Substituting higher vulnerability land uses for lower vulnerability uses in higher flood risk locations and locating higher vulnerability uses in areas of lower risk on a strategic scale, or on a site basis;
Providing adequate flood risk management infrastructure which will be maintained for the lifetime of the development; and
Mitigating the potential impacts of flooding through design and resilient construction.
Figure 13.2 presents the process that should be followed by HDC in its application of the Exception Test under the NPPG.
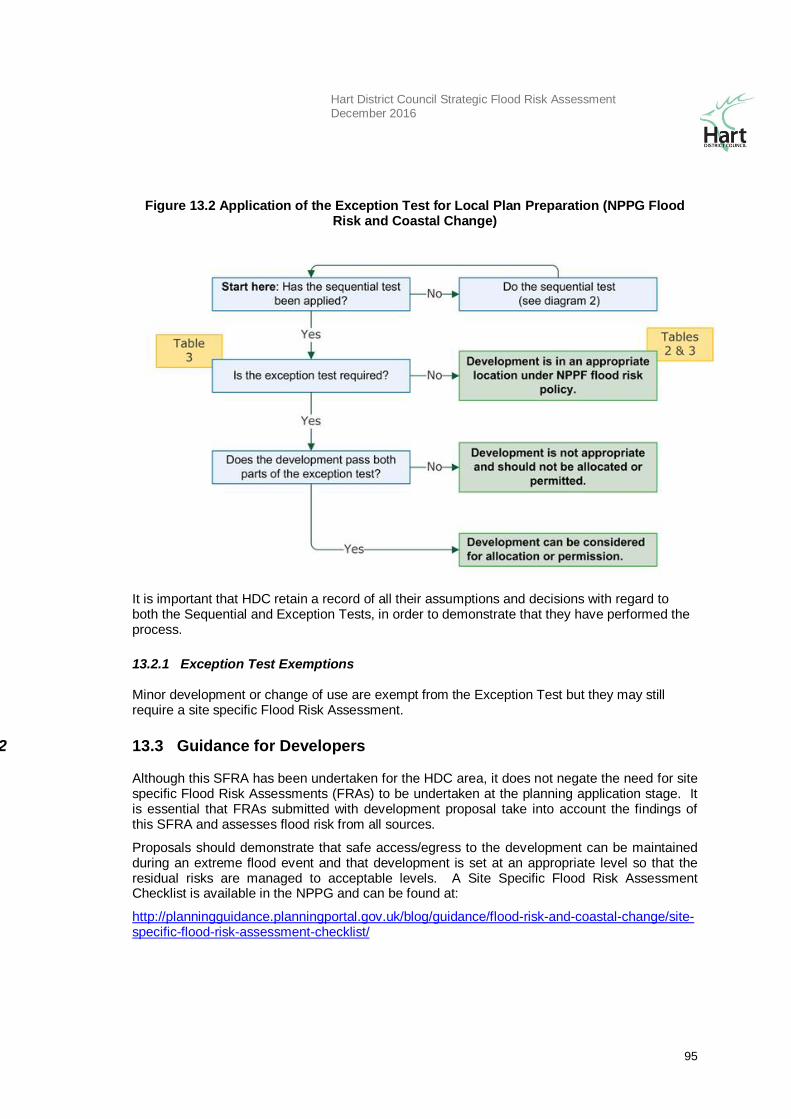
Hart District Council Strategic Flood Risk Assessment December 2016
95
Figure 13.2 Application of the Exception Test for Local Plan Preparation (NPPG Flood Risk and Coastal Change)
It is important that HDC retain a record of all their assumptions and decisions with regard to both the Sequential and Exception Tests, in order to demonstrate that they have performed the process.
13.2.1 13.2.1 Exception Test Exemptions Minor development or change of use are exempt from the Exception Test but they may still require a site specific Flood Risk Assessment.
13.2.2 13.3 Guidance for Developers Although this SFRA has been undertaken for the HDC area, it does not negate the need for site specific Flood Risk Assessments (FRAs) to be undertaken at the planning application stage. It is essential that FRAs submitted with development proposal take into account the findings of this SFRA and assesses flood risk from all sources.
Proposals should demonstrate that safe access/egress to the development can be maintained during an extreme flood event and that development is set at an appropriate level so that the residual risks are managed to acceptable levels. A Site Specific Flood Risk Assessment Checklist is available in the NPPG and can be found at:
http://planningguidance.planningportal.gov.uk/blog/guidance/flood-risk-and-coastal-change/site-specific-flood-risk-assessment-checklist/
Hart District Council Strategic Flood Risk Assessment December 2016
96
14. Site Specific FRA Guidance
14.1 Managing Flooding In New Development
This chapter sets out ways in which flood risk in Hart can be addressed, mitigated or avoided in order to manage flooding from all sources. The following measures should be considered with new development within Flood Zone 2 and 3 to ensure that the development will be safe from flooding and not increase flood risk offsite:
Sequential Test – developers in conjunction with the Local Authority should undertake the sequential test. This test determines if there are any reasonably available sites with a lower risk of flooding where the development could be accommodated. All sites in the Local Plan should have passed the sequential test. For further detail please see chapter 13.
Sequential Approach- laying out the development such that the elements most vulnerable to flooding from any sources are located in the areas of lowest risk. i.e. residential areas should be located where the risk is lowest and public open space where the risk is highest.
Preventing internal flooding – Finished Floor Levels should be set no lower than
300mm above the 1 in 100 plus climate change flood level. If this is not possible then flood resilient/ resistant measures should be installed up to the same design flood level. This approach will be expected to be used where internal flooding is possible from any source. For minor development (less than 10 houses) where the flooding is non-fluvial and the flood depth is not known, Finish Floor Levels should be raised by 600mm above ground level as a precaution.
Mitigating for the loss of floodplain storage- any part of the development that could result in the loss of floodplain storage (buildings, land raising etc.) should provide level for level and volume for volume floodplain compensation up to the 1 in 100 plus climate change flood levels. If this is not possible, then mitigation for buildings can be provided through the use of under floor voids. These should extend from ground level to the 1 in 100 plus climate change level. Openings should make up 20% of the width of the building on all sides. Although traditionally used to mitigate fluvial flood risk, these measures can be used to prevent displacement of flood water from any source.
Mitigating for the obstruction of flood flows- Any feature that could obstruct flood flows or surface water overland flow routes (embankments, fencing, walls, raised roads etc.) should minimise the obstruction of flood flows by providing an opening to allow water to flow through the structure, e.g. hit and miss fencing, provision of voids/culvert/pipes through the structure or using staggered bunds.
Provision of a safe route of access and egress – A safe route of access and egress should be provided from the door way of building to a location wholly outside of the 1 in 100 plus climate change fluvial flood extent in accordance with FD2320/TR2. The route must be on publically accessible land and have a hazard no higher than very low (see section 14.5). If this is not possible either due to a lack of detailed flood modelling or
Hart District Council Strategic Flood Risk Assessment December 2016
97
because the hazard is too great, an emergency flood plan must be provided for the site explaining how the risk to site users will be managed.
Demonstration that any changes to a local river channel will not increase flood risk –where a development involves altering a river channel in any way (e.g. channel diversion, upsizing the channel) the developer needs to demonstrate that the works will not increase offsite flood risk. This may require modelling.
Watercourse crossings- where possible watercourse crossings should be clear span bridges. Culverting should only be used for essential access, must be sized so as not to restrict the channel and should be as short as feasible. Ideally a 10m buffer should be left along main rivers and 5m buffer along ordinary watercourses to allow access for maintenance, to minimise the impact on flow conveyance and ecology.
Protecting against groundwater flooding- This is a long duration, very damaging
form of flooding and areas of known risk should be avoided if possible (sequential approach). Where unavoidable development in groundwater flood risk areas should avoid basements. Finished Floor Levels should be raised and appropriate forms of flood resistant/resilient measures should be included to minimise groundwater getting into properties. Options to channel and divert the flow of groundwater at the surface away from sensitive areas and dealing with “pinch points” where water is forced through a narrow corridor such as an existing culvert should be considered. Surface water drainage in these areas should be designed to cope with a high water table (e.g. impermeable lining). In ground structures, such as building foundations, can obstruct groundwater flows which can lead to higher risk of groundwater flooding uphill of these structures. It is strongly advised that developers employ a hydrogeologist when developing in areas at risk of groundwater flooding.
14.1.1 Further reading
CIRIA C624 o Chapter 2: Different forms of flooding o Chapters 5 & 6: Assessing the risk of flooding o Appendix 3: Mitigation measures
British Standard 8533:2011: Chapter 5 covers avoiding and substituting risk
FRA Guidance for New developments FD2320/TR2 Supplementary Note: covers access and egress arrangements
Environment Agency’s Flood Risk Assessments: Climate Change Allowances
14.2 Managing surface water runoff from new developments
To manage surface water runoff from the site the following measures should be considered:
No increase in surface water runoff rates and discharge volumes for all storm events up to the 1 in 100 plus climate change storm events.
No flooding from the surface water drainage system pipe network up to the 1 in 30 storm event. Any flooding between the 1 in 30 and 1 in 100 plus climate change storm event must be safely contained on site.
Hart District Council Strategic Flood Risk Assessment December 2016
98
Appropriately disposing of surface water. Surface water should be disposed of via infiltration (first priority), discharge to a watercourse (second priority) or discharge to a surface water sewer (if no other option is available). Discharge to a foul sewer is not acceptable. Whichever method of disposal is used must be shown to be viable.
Where infiltration is proposed, infiltration test in accordance to BRE365 should be submitted demonstrating that infiltration is viable. In particular this should show that infiltration rates are no lower than 1 x10 -6 m/s, groundwater is at least 1m below the base of any soakaways (to prevent groundwater ingress), no infiltration through contaminated land (to avoid mobilising contaminants) and no infiltration through made ground (infiltration rates vary significantly over short distances).
Where discharge volumes are increasing. Discharge volumes will increase where the impermeable area of a site is increasing, where the site drainage is changing from an infiltrating to an attenuating system or where the surface water catchment is being increased. To mitigate for an increase in discharge volumes, one of the following methods must be used:
o Infiltrate the extra volume o Discharge the existing runoff volumes at existing runoff rates and
trickle the extra runoff volume at 2 l/s/ha o Discharge all runoff from the site up to the 1 in 100 plus climate
change storm event at greenfield QBAR rates.
Half drain times should be less than 24 hours. To ensure that there is sufficient storage for any further rainfall the drainage system should be designed to half drain within 24 hours.
Avoid pipe blockage issues. Pipe blockage issues can arise where flow rates drop below 5 l/s as the flow rate will no longer hold any sediment particles in suspension risking pipes silting up over time. For flows between 2 l/s and 5 l/s a hydro-brake should be used to keep sediment suspended. Otherwise flows should not be restricted blow 5 l/s.
Sites should use a wide range of Sustainable Drainage Systems (SuDS) preferably in the form of a SuDS Treatment Train. SuDS devices are designed to mimic natural drainage process. They can be used to control water quality, quantity and provide amenity and biodiversity benefits. SuDS can be adapted to almost all situations we would expect all development to try an include SuDS. Ideally larger development should be linking together SuDS to form a treatment trains to maximum the removal of pollutants. Further details are given in the section on SuDS below.
14.2.1 Further reading
CIRIA C635 Designing for Exceedance in Urban Drainage – Good Practice (2006)
CIRIA C687 Planning for SuDS – Making it Happen (2010)
CIRIA C753 The SUDS Manual
CIRIA C698 Site Handbook for the Construction of SuDS (2007)
BRE 365
Hart District Council Strategic Flood Risk Assessment December 2016
99
Preliminary Rainfall Runoff Management Rev E
Communities and Local Government – Guidance on the Permeable Surfacing of Front Gardens (2008)
London Borough of Islington - Promoting Sustainable Drainage Systems (2013)
CIRIA C609 Sustainable Drainage Systems – Hydraulic, structural
14.3 The Sustainable Drainage System (SuDS) Approach
The Sustainable Drainage Systems (SuDS) are softer engineering solutions designed to mimic natural drainage to manage surface water as close to its source as possible. If used appropriately in new development, SuDS reduce flood risk, improve water quality, replenish groundwater and provide both visual amenity and wildlife habitat. The NPPG, which accompanies the NPPF, states that priority, should be given to the use of SuDS in new development.
SuDS practices should be designed taking the following criteria into consideration:
Water quantity
Water quality, and
Amenity/biodiversity
To achieve the above, the Interim Code of Practice for Sustainable Drainage Systems recommends the use of a SuDS Management Train which incorporates a chain of techniques were each component adds to the performance of the system as a whole. The Management Train approach consists of four stages:
Prevention good site design and upkeep to prevent runoff and pollution (e.g. limited paved areas, regular pavement sweeping)
Source control runoff control at/near to source (e.g. rainwater harvesting, green roofs, pervious pavements)
Site control water management from a multitude of catchments (e.g. route water from roofs, impermeable paved areas to one infiltration/holding site)
Regional control integrate runoff management from a number of sites (e.g. into a wetland).
A successful SuDS design should use a range of SuDS techniques tailored to address the pollution, flood risk and amenity needs of the site. They can even be retrofitted to existing development and can be adapted to fit majority of circumstances. SuDS can also be implemented as part of multi-functional places, enabling both the management of surface water and other uses like recreation within the same space. If used appropriately SuDS can be used to reduce surface water discharge rates, discharge volumes and improve water quality of runoff leaving a development site.
Hart District Council Strategic Flood Risk Assessment December 2016
100
14.3.1 SuDS Techniques
There are a wide range of SuDS techniques available for use throughout the four stages of the Management Train. Techniques available to manage the quantity of surface water typically operate in combination or solely on the basis of the following main principles:
Infiltration: The soaking of water into the ground. Where feasible this is the preferred approach as this mimics the natural hydrological process, recharges groundwater sources and feeds river base flows. Low infiltration rates, shallow groundwater and the risk of contaminating protected aquifers or local soils are factors that restrict the use of infiltration.
Detention/Attenuation: The slowing down of surface water runoff before being transferred off site. This is achieved by providing a storage volume with a restricted outflow. This reduced the peak runoff rate, discharging surface water over a longer duration.
Conveyance: The transfer of surface water flows from open location to another.
Water Harvesting: To capture and re-use surface water runoff on site e.g. for irrigation and domestic use (flushing toilets). Depending on the scale of development, they may not always be accepted for flood risk management purposes because the amount of storage available during a storm even cannot be guaranteed.
The SuDS Manual (C697)1 provides a summary of SuDS techniques and their suitability to meet
the three goals of sustainable drainage systems and their suitability within the stages of the Management Train. Table 14.1 presents a summary of a variety of SuDS techniques along with their suitability in achieving the goals of sustainability and their place within the Management Train.
1 CIRIA, The SUDS Manual (C697), March 2007
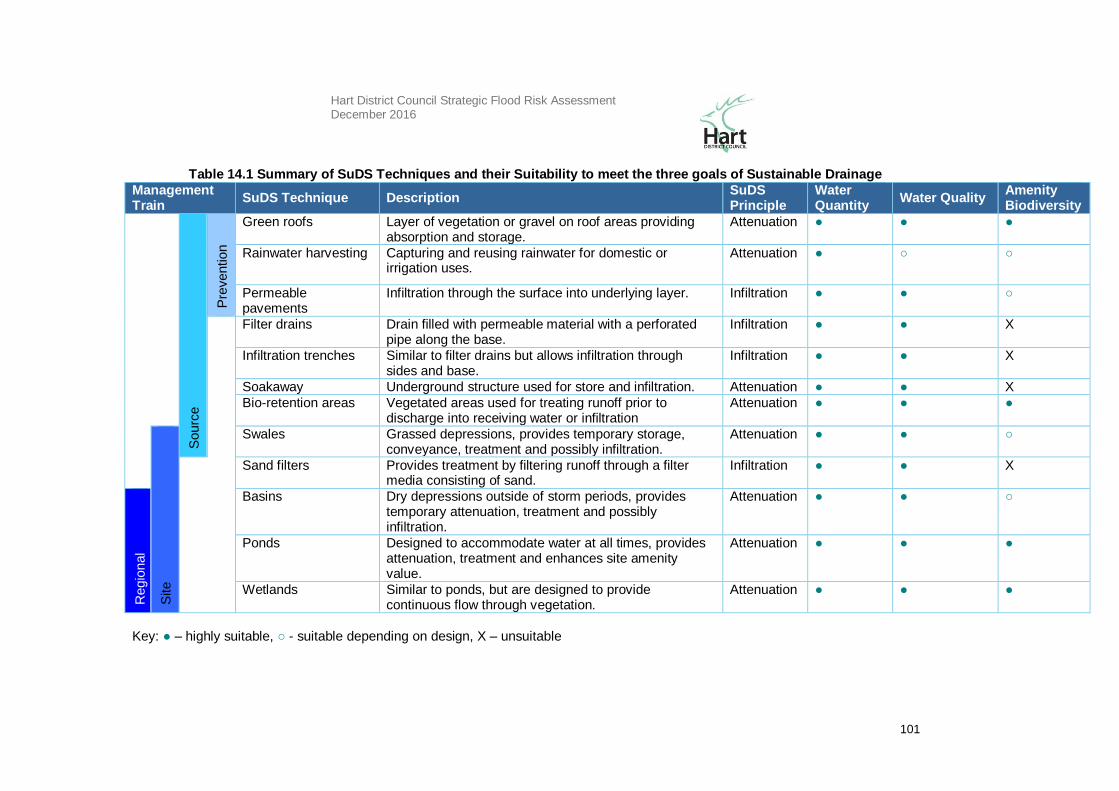
Hart District Council Strategic Flood Risk Assessment December 2016
101
Table 14.1 Summary of SuDS Techniques and their Suitability to meet the three goals of Sustainable Drainage
Management Train
SuDS Technique Description SuDS Principle
Water Quantity
Water Quality Amenity Biodiversity
Sourc
e
Pre
vention
Green roofs Layer of vegetation or gravel on roof areas providing absorption and storage.
Attenuation ● ● ●
Rainwater harvesting Capturing and reusing rainwater for domestic or irrigation uses.
Attenuation ● ○ ○
Permeable pavements
Infiltration through the surface into underlying layer. Infiltration ● ● ○
Filter drains Drain filled with permeable material with a perforated pipe along the base.
Infiltration ● ● X
Infiltration trenches Similar to filter drains but allows infiltration through sides and base.
Infiltration ● ● X
Soakaway Underground structure used for store and infiltration. Attenuation ● ● X
Bio-retention areas Vegetated areas used for treating runoff prior to discharge into receiving water or infiltration
Attenuation ● ● ●
Site
Swales Grassed depressions, provides temporary storage, conveyance, treatment and possibly infiltration.
Attenuation ● ● ○
Sand filters Provides treatment by filtering runoff through a filter media consisting of sand.
Infiltration ● ● X
Regio
nal
Basins Dry depressions outside of storm periods, provides temporary attenuation, treatment and possibly infiltration.
Attenuation ● ● ○
Ponds Designed to accommodate water at all times, provides attenuation, treatment and enhances site amenity value.
Attenuation ● ● ●
Wetlands Similar to ponds, but are designed to provide continuous flow through vegetation.
Attenuation ● ● ●
Key: ● – highly suitable, ○ - suitable depending on design, X – unsuitable
Hart District Council Strategic Flood Risk Assessment December 2016
102
14.3.2 National SuDS Standards
National Standards have been publish to be used alongside the NPPF and NPPG. These National Standards sets out the requirements for the design, construction, maintenance and operation of SuDS within a development. The key National Standards that relate to flood risk are listed below but developers should review these in their entirety to ensure that the proposed drainage strategy complies with the necessary requirements:
Peak Flow Control S2 For greenfield developments the peak runoff rate from the development to any highway drain, sewer or surface water body for the 1 in 1 year rainfall event and the 1 in 100 year rainfall event should never exceed the peak greenfield runoff rate for the same event. S3 For developments which were previously developed the peak runoff rate from the development to any drain, sewer or surface water body for the 1 in 1 year rainfall event and the 1 in 100 year rainfall event must be as close as reasonably practicable to the greenfield runoff rate from the development for the same rainfall event but should never exceed the rate of discharge from the development prior to redevelopment for that event. Volume Control S4 Where reasonably practicable, for greenfield development, the runoff volume from the development to any highway drain, sewer or surface water body in the 1 in 100 year, 6 hour rainfall event should never exceed the greenfield runoff volume for the same event. S5 Where reasonably practicable, for developments which have been previously developed, the runoff volume from the development to any highway drain, sewer or surface water body in the 1 in 100 year, 6 hour rainfall event must be constrained to a value as close as is reasonably practicable to the greenfield runoff volume for the same event, but should never exceed the runoff volume from the development site prior to redevelopment for that event. S6 Where it is not reasonably practicable to constrain the volume of runoff to any drain, sewer or surface water body in accordance with S4 or S5 above, the runoff volume must be discharged at a rate that does not adversely affect flood risk. Flood Risk within the Development S7 The drainage system must be designed so that, unless an area is designated to hold and/or convey water as part of the design, flooding does not occur on any part of the site for a 1 in 30 year rainfall event. S8 The drainage system must be designed so that, unless an area is designated to hold and/or convey water as part of the design, flooding does not occur during a 1 in 100 year rainfall event in any part of: a building (including a basement); or in any utility plant susceptible to water (e.g. pumping station or electricity substation) within the development. S9 The design of the site must ensure that, so far as is reasonably practicable, flows resulting from rainfall in excess of a 1 in 100 year rainfall event are managed in exceedance routes that minimise the risks to people and property.
14.3.3 SuDS Design
In terms of sustainability sites should look to dispose of their surface water first via infiltration then to a watercourse and if neither of these options are possible to a surface water sewer. The ability to infiltrate surface water can be affected by a number of factors:
The presence of Groundwater Source Protection Zones and potential contamination of a potable water source;
Hart District Council Strategic Flood Risk Assessment December 2016
103
The depth to groundwater table. There should be at least a 1m gap between the base of an infiltration device and the water table to ensure that the SuDS features are not full of groundwater in a wet winter.
The risk of causing solution features when infiltrating through chalk;
Restrictions on infiltration on contaminated land to prevent the spread of contamination;
Restricted area on development sites where housing densities are high or sites are very small. Soakaway should be located a minimum of 5m away from any building to ensure infiltrated water does not affect the building foundations. This may be difficult on small sites.
Geology/ Infiltration rates are too low. Infiltration rates are largely dependent on the underlying geology. Where infiltration is extremely slow (less than 1 x 10⁻⁶m/s), it will take a very long time for the drainage system to empty, putting the site at risk of flooding if further rainfall is received. For this reason best practice is to ensure that any surface water storage should half drain within 24 hours.
Infiltration and borehole tests in combination with the Environment Agency online map of groundwater protection zones should provide a good indication as to whether or not infiltration is likely to be viable for a particular site. Where infiltration cannot be used an attenuation based SuDS scheme should be devised.
It is worth noting that SuDS features are very adaptable and can generally be adjusted to fit most sites. For example check dams can be used on steeps sites to enable swales to be used. Infiltrating SuDS can be lined to prevent infiltration in contaminated areas while still storing and conveying runoff to the parts of the site where infiltration can occur.
SuDS should be considered at the earliest opportunity, ensuring that they are integrated within the site using as little land as possible, whilst creating multi-functional spaces that improve the amenity value of the property. Examples of multi-functional uses include:
Locating SuDS in planned green space or within a play area.
Swales can be located along the road network to accept street runoff,
Tree planters can be configured to accept runoff from roads and car parks and the use of rain gardens,
Bio retention techniques can be used to create ‘Green streets’ that improve the amenity of a property.
Large below-ground storage/infiltration practices can also be located beneath the street network or car parks. Pervious pavement materials are ideal for car parks and parking lay-bys.
14.3.4 Groundwater Source Protection Zones
The Environment Agency defines Groundwater Source Protection Zones (SPZs) around groundwater abstraction points. Source Protection Zones are defined to protect areas of groundwater that are used for potable supply, including public/private potable supply, (including mineral and bottled water) or for use in the production of commercial food and drinks. There are a number of different categories of Source Protection Zones: Zone 1(SPZ1) – is the inner zone, Zone 2 (SPZ2) - Outer Zone and Zone 3 (SPZ3) – total catchment and Zone 4 (SPZ4)–Special interest. SPZs are defined based on the time it takes for pollutants to reach an abstraction point. Depending on the nature of the proposed development and the location of the development site with regards to the SPZs, restrictions may be placed on the types of SuDS appropriate to certain areas. SPZ 1 is the most vulnerable to contamination and is most likely to influence the use of infiltration. There are only two locations in Hart that fall in SPZ1: near Mill Lane off the A287 near Crondall and in the area between Greywell and North Warnborough. Adjacent to these two SPZ1 areas are areas of SPZ 2 and 3
Hart District Council Strategic Flood Risk Assessment December 2016
104
Any restrictions imposed on the discharge of site generated runoff by the Environment Agency will be determined on a site by site basis using a risk based approach. SPZ for the study area can be assessed by reviewing the most up-to-date maps on the Environment Agency’s website
2.
14.3.5 Water Quality
Under the EU Water Framework Directive all member states are required to take steps to achieve Good Ecological Status or Good Ecological Potential of water bodies by 2015. To achieve this, discharges to watercourses draining development areas will require pre-treatment to remove oils and contaminants. Appropriately designed SuDS can assist developments to improve water quality discharges through passive treatment, whilst additionally providing ecological benefit to a development or local area.
14.3.6 Contaminated Land Previous site uses can leave a legacy of contamination that if inappropriately managed can cause damage to local water bodies. During the design of SuDS it is essential to have regard to the nature of potential ground contamination. Infiltration SuDS should not be used where a site is potentially contaminated. Sites may need to be remediated prior to agreement of surface water drainage plans. Particular restrictions may be placed on infiltration based SuDS, forcing consideration of attenuation based systems. Early discussion with the authority responsible for the receiving water body should be undertaken to establish the requirements of SuDS on contaminated sites.
14.3.7 High Development Densities Where developments are required to achieve high development densities it is essential that the requirement for SuDS and their constraints are identified early in the site master planning process. High development densities can restrict the land area available for surface water storage. If insufficient space is left on site to meet the requirements of the National Standards, it is unlikely that the site will gain planning permission. Early consideration of SuDS enables the drainage requirements to be integrated with the design, limiting the impact they have on developable area and development densities.
14.3.8 Maintenance of SuDS
To ensure that the drainage system works as designed for the lifetime of the development the long term, on-going maintenance of the system should be considered at the design phase. Many SuDS techniques rely upon vegetation and landscaping as the primary means of handling runoff. As such, the majority of SuDS techniques can be maintained as part of a typical landscape management process, which entails tasks like litter collection, grass cutting and visual inspection of any inlets or outlets to look for blockages. Where the responsibility for sections of a site (say public open space) will be transfer to a third party, the maintenance needs for any SuDS or drainage features on this land should be made clear to the recipient upfront. Ideally all sites should produce a SuDS maintenance plan at the detailed design stage so that those responsible for the on-going maintenance needs are aware of these requirements.
14.3.9 Use of infiltrating SuDS in Hart
The British Geological Society (BGS) produce a range of datasets which provide information surrounding the suitability of the ground for infiltration SuDS. This data has been obtained for the SFRA to provide a high level indication of where infiltrating SuDS are likely to be feasible in Hart.
2 http://maps.environment-agency.gov.uk/wiyby/wiybyController?x=531500.0&y=181500.0&topic=groundwater&ep=map&scale=5&location=London,%20City%20of%20London&lang=_e&layerGroups=default&distance=&textonly=off#x=538492&y=191964&lg=1,10,&scale=6
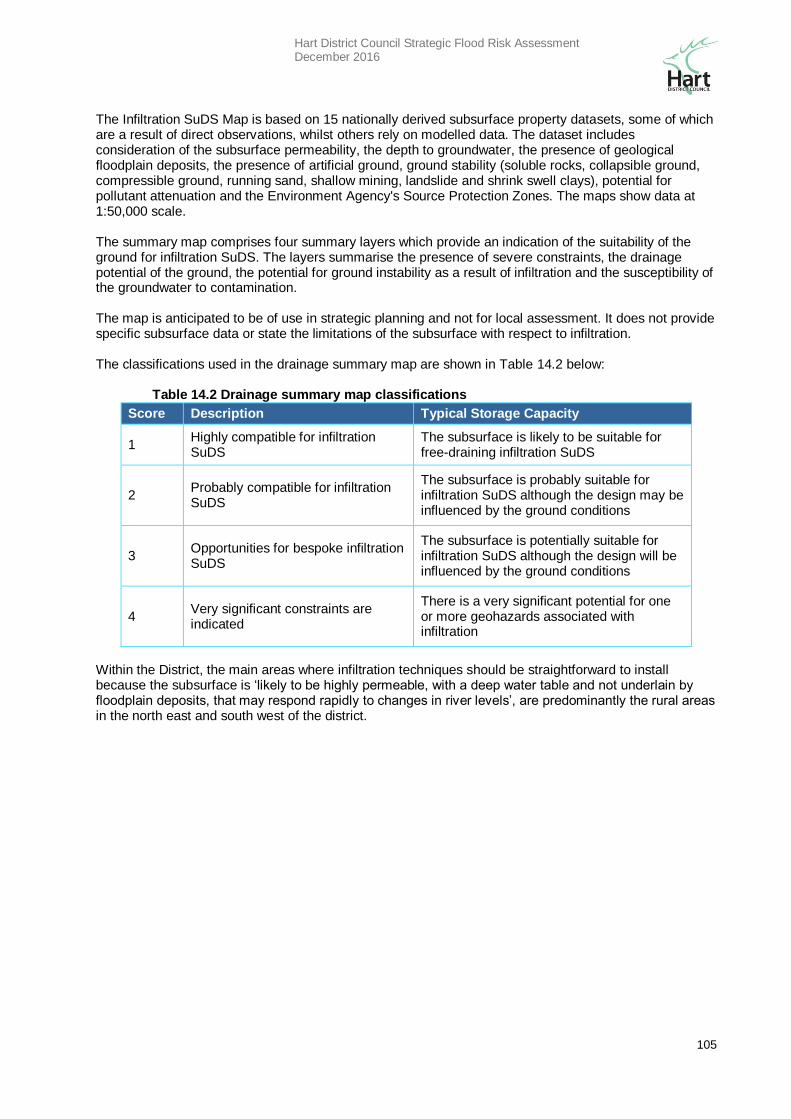
Hart District Council Strategic Flood Risk Assessment December 2016
105
The Infiltration SuDS Map is based on 15 nationally derived subsurface property datasets, some of which are a result of direct observations, whilst others rely on modelled data. The dataset includes consideration of the subsurface permeability, the depth to groundwater, the presence of geological floodplain deposits, the presence of artificial ground, ground stability (soluble rocks, collapsible ground, compressible ground, running sand, shallow mining, landslide and shrink swell clays), potential for pollutant attenuation and the Environment Agency's Source Protection Zones. The maps show data at 1:50,000 scale. The summary map comprises four summary layers which provide an indication of the suitability of the ground for infiltration SuDS. The layers summarise the presence of severe constraints, the drainage potential of the ground, the potential for ground instability as a result of infiltration and the susceptibility of the groundwater to contamination. The map is anticipated to be of use in strategic planning and not for local assessment. It does not provide specific subsurface data or state the limitations of the subsurface with respect to infiltration. The classifications used in the drainage summary map are shown in Table 14.2 below:
Table 14.2 Drainage summary map classifications
Score Description Typical Storage Capacity
1 Highly compatible for infiltration SuDS
The subsurface is likely to be suitable for free-draining infiltration SuDS
2 Probably compatible for infiltration SuDS
The subsurface is probably suitable for infiltration SuDS although the design may be influenced by the ground conditions
3 Opportunities for bespoke infiltration SuDS
The subsurface is potentially suitable for infiltration SuDS although the design will be influenced by the ground conditions
4 Very significant constraints are indicated
There is a very significant potential for one or more geohazards associated with infiltration
Within the District, the main areas where infiltration techniques should be straightforward to install because the subsurface is ‘likely to be highly permeable, with a deep water table and not underlain by floodplain deposits, that may respond rapidly to changes in river levels’, are predominantly the rural areas in the north east and south west of the district.
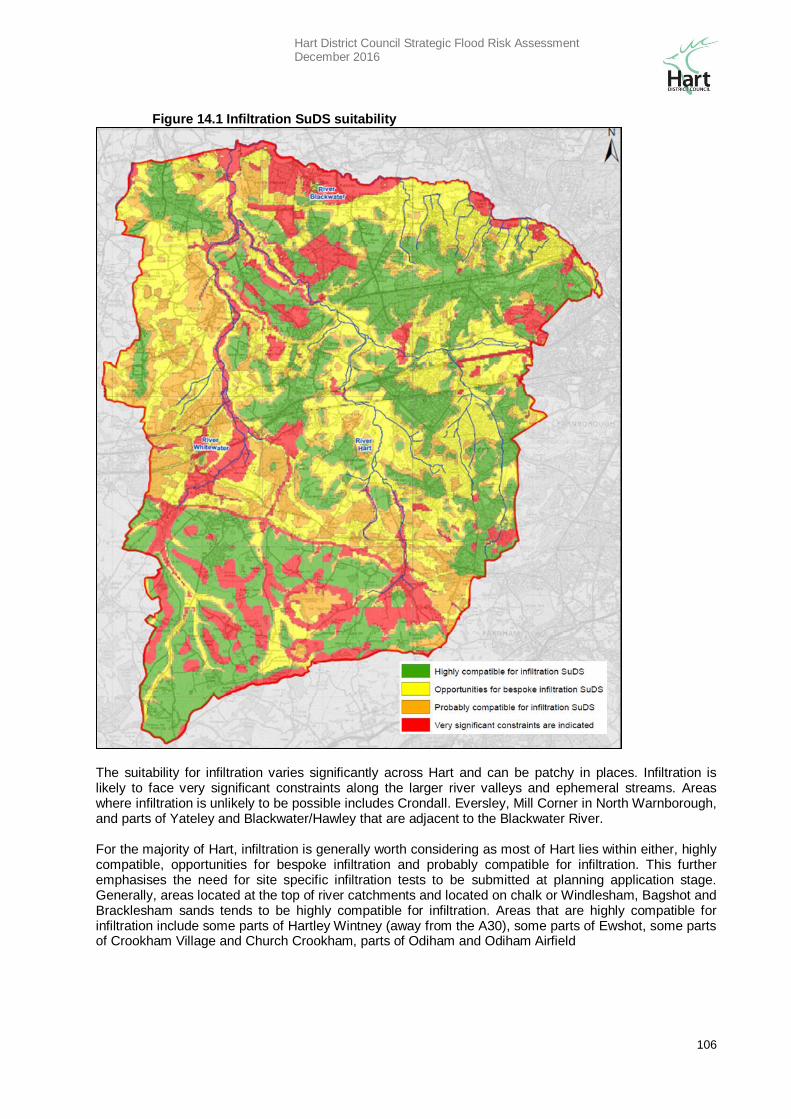
Hart District Council Strategic Flood Risk Assessment December 2016
106
Figure 14.1 Infiltration SuDS suitability
The suitability for infiltration varies significantly across Hart and can be patchy in places. Infiltration is likely to face very significant constraints along the larger river valleys and ephemeral streams. Areas where infiltration is unlikely to be possible includes Crondall. Eversley, Mill Corner in North Warnborough, and parts of Yateley and Blackwater/Hawley that are adjacent to the Blackwater River. For the majority of Hart, infiltration is generally worth considering as most of Hart lies within either, highly compatible, opportunities for bespoke infiltration and probably compatible for infiltration. This further emphasises the need for site specific infiltration tests to be submitted at planning application stage. Generally, areas located at the top of river catchments and located on chalk or Windlesham, Bagshot and Bracklesham sands tends to be highly compatible for infiltration. Areas that are highly compatible for infiltration include some parts of Hartley Wintney (away from the A30), some parts of Ewshot, some parts of Crookham Village and Church Crookham, parts of Odiham and Odiham Airfield
Hart District Council Strategic Flood Risk Assessment December 2016
107
14.3.10 Further Guidance on SuDS
CIRIA C635 Designing for Exceedance in Urban Drainage – Good Practice (2006)
CIRIA C644 Green Roofs (2007) provides guidance on the design, construction and management of green roofs plus biodiversity quick wins in the urban environment
CIRIA C687 Planning for SuDS – Making it Happen (2010)
CIRIA C697 The SUDS Manual (2007) – provides best practice guidance on the planning, design, construction, operation and maintenance of SuDS within developments
CIRIA C698 Site Handbook for the Construction of SuDS (2007)
BRE 365
DEFRA/Environment Agency Preliminary Rainfall Runoff Management Rev E – provides guidance on surface water drainage for the Environment Agency, LPAs and developers
Preliminary Rainfall Runoff Management Rev E
Communities and Local Government – Guidance on the Permeable Surfacing of Front Gardens (2008)
London Borough of Islington - Promoting Sustainable Drainage Systems (2013)
CIRIA C609 Sustainable Drainage Systems – Hydraulic, structural
Interim Code of Practice for Sustainable Drainage Systems, National SuDS working Group 2004
www.susdrain.org/
14.4 Flood Resistant and Resilient Design
There will be circumstances where Finished Floor Levels cannot be raised to the required design level to provide protection from internal flooding. This may be due to factors such as the development being a change of use or to allow disables access to a less vulnerable use. In such cases flood resilient and/or resistant measures should be investigated to determine whether these will provide a suitable alternative. Flood Resistant measures aim at preventing flood waters from entering a building (Water Exclusion Strategy). These used features such as flood doors, flood boards and air brick covers etc. to minimise water entering properties. These usually fall into two categories, structures such as flood boards that must be fitted immediately prior to flooding occurring and passive flood proofing that work without the need of human intervention. Flood resistant measures can only be used where flood depths are relatively shallow (less than 0.6m) as excluding water at greater depth than this can cause structural damage to buildings. Flood Resistant measures are best used where flooding is relatively shallow, short duration and, unless the measures are passive, the area is covered by a reliable flood warning system. Flood resilient measures allows flood waters to pass through the building (Water Entry Strategy) to prevent structural damage while minimising flood damage and allowing for rapid reoccupation of the building post flooding. Such measures include raising electrical sockets and white goods and the use of low permeable materials etc. These materials should also have good drying and cleaning properties. The diagram below indicates when flood resistant and flood resilient measures can be used in terms of flood depth.
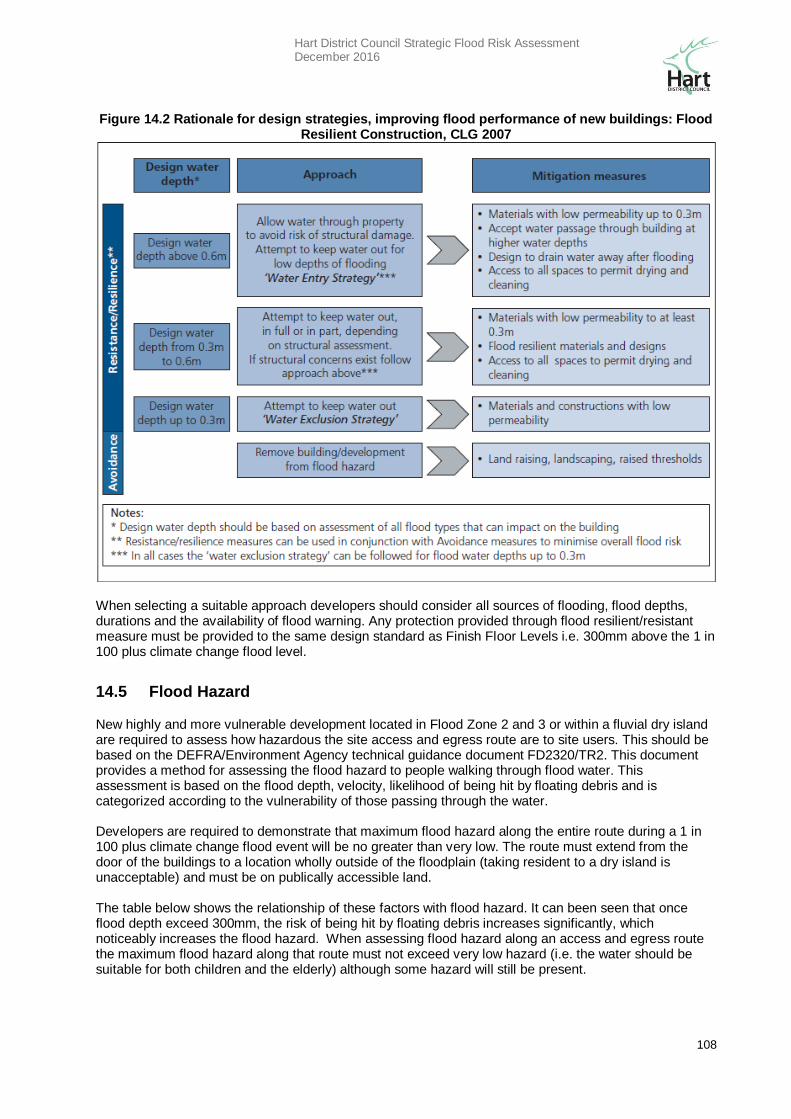
Hart District Council Strategic Flood Risk Assessment December 2016
108
Figure 14.2 Rationale for design strategies, improving flood performance of new buildings: Flood Resilient Construction, CLG 2007
When selecting a suitable approach developers should consider all sources of flooding, flood depths, durations and the availability of flood warning. Any protection provided through flood resilient/resistant measure must be provided to the same design standard as Finish Floor Levels i.e. 300mm above the 1 in 100 plus climate change flood level.
14.5 Flood Hazard
New highly and more vulnerable development located in Flood Zone 2 and 3 or within a fluvial dry island are required to assess how hazardous the site access and egress route are to site users. This should be based on the DEFRA/Environment Agency technical guidance document FD2320/TR2. This document provides a method for assessing the flood hazard to people walking through flood water. This assessment is based on the flood depth, velocity, likelihood of being hit by floating debris and is categorized according to the vulnerability of those passing through the water. Developers are required to demonstrate that maximum flood hazard along the entire route during a 1 in 100 plus climate change flood event will be no greater than very low. The route must extend from the door of the buildings to a location wholly outside of the floodplain (taking resident to a dry island is unacceptable) and must be on publically accessible land. The table below shows the relationship of these factors with flood hazard. It can been seen that once flood depth exceed 300mm, the risk of being hit by floating debris increases significantly, which noticeably increases the flood hazard. When assessing flood hazard along an access and egress route the maximum flood hazard along that route must not exceed very low hazard (i.e. the water should be suitable for both children and the elderly) although some hazard will still be present.
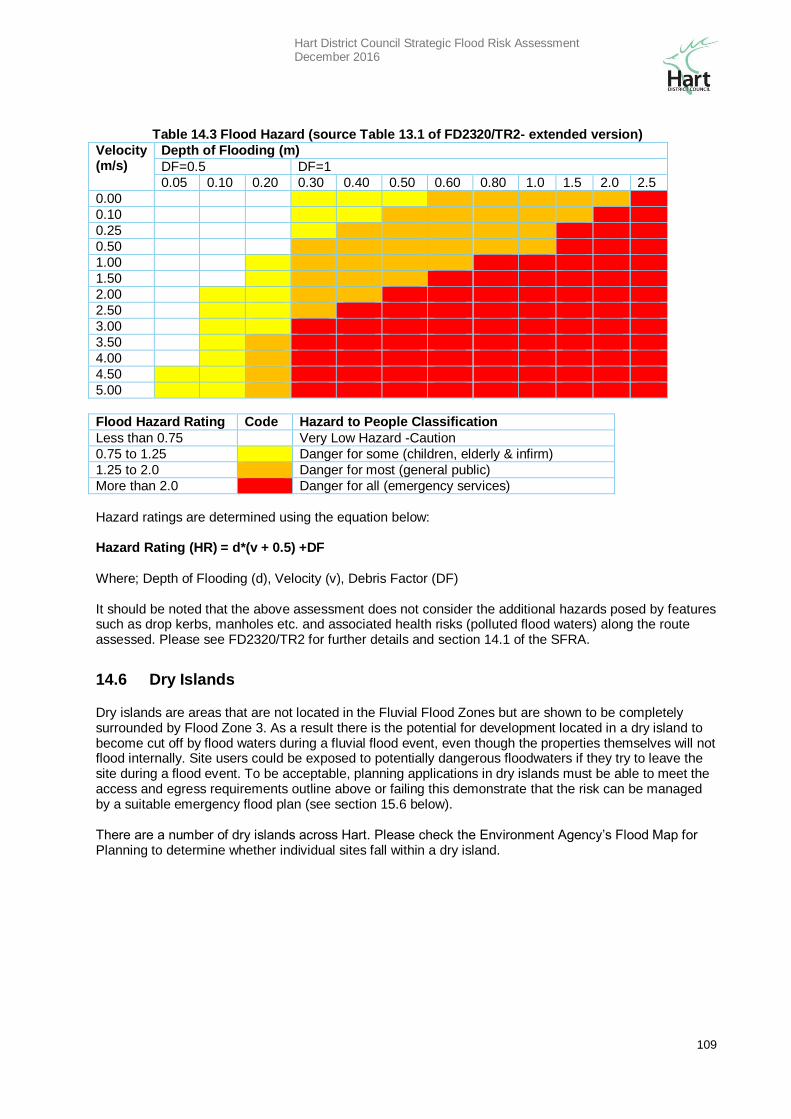
Hart District Council Strategic Flood Risk Assessment December 2016
109
Table 14.3 Flood Hazard (source Table 13.1 of FD2320/TR2- extended version)
Velocity (m/s)
Depth of Flooding (m)
DF=0.5 DF=1
0.05 0.10 0.20 0.30 0.40 0.50 0.60 0.80 1.0 1.5 2.0 2.5
0.00
0.10
0.25
0.50
1.00
1.50
2.00
2.50
3.00
3.50
4.00
4.50
5.00
Flood Hazard Rating Code Hazard to People Classification
Less than 0.75 Very Low Hazard -Caution
0.75 to 1.25 Danger for some (children, elderly & infirm)
1.25 to 2.0 Danger for most (general public)
More than 2.0 Danger for all (emergency services)
Hazard ratings are determined using the equation below: Hazard Rating (HR) = d*(v + 0.5) +DF Where; Depth of Flooding (d), Velocity (v), Debris Factor (DF) It should be noted that the above assessment does not consider the additional hazards posed by features such as drop kerbs, manholes etc. and associated health risks (polluted flood waters) along the route assessed. Please see FD2320/TR2 for further details and section 14.1 of the SFRA.
14.6 Dry Islands
Dry islands are areas that are not located in the Fluvial Flood Zones but are shown to be completely surrounded by Flood Zone 3. As a result there is the potential for development located in a dry island to become cut off by flood waters during a fluvial flood event, even though the properties themselves will not flood internally. Site users could be exposed to potentially dangerous floodwaters if they try to leave the site during a flood event. To be acceptable, planning applications in dry islands must be able to meet the access and egress requirements outline above or failing this demonstrate that the risk can be managed by a suitable emergency flood plan (see section 15.6 below). There are a number of dry islands across Hart. Please check the Environment Agency’s Flood Map for Planning to determine whether individual sites fall within a dry island.
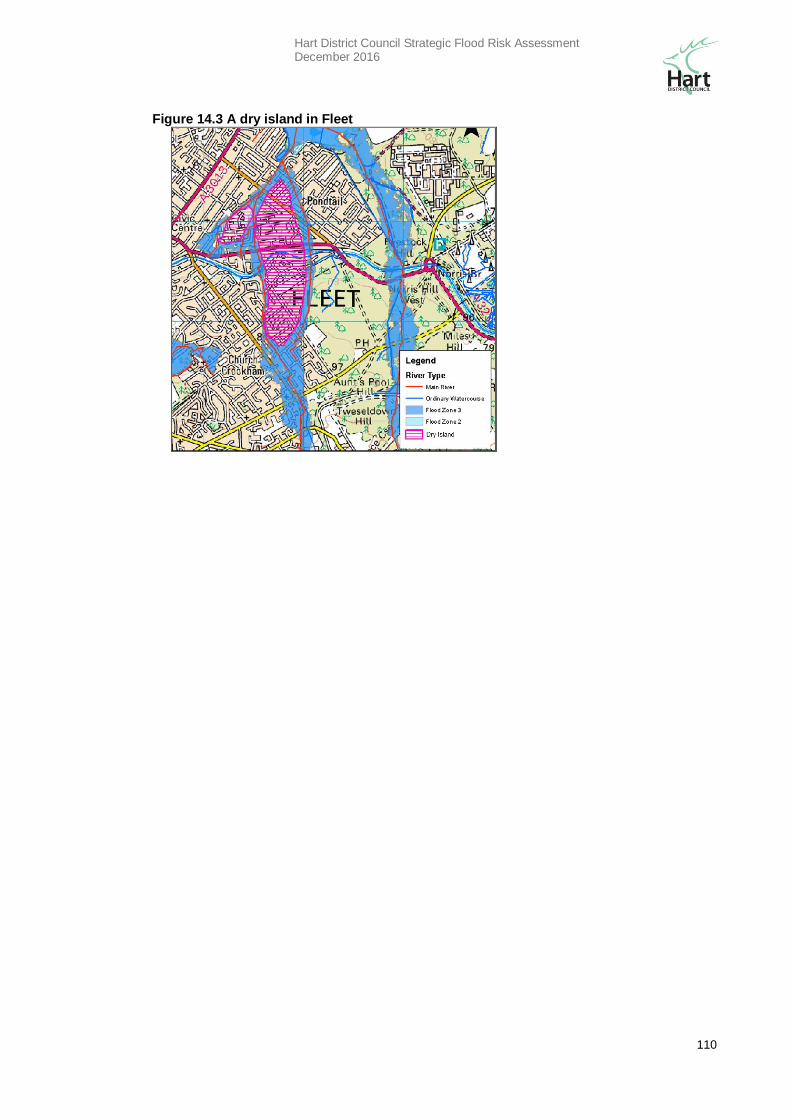
Hart District Council Strategic Flood Risk Assessment December 2016
110
Figure 14.3 A dry island in Fleet
Hart District Council Strategic Flood Risk Assessment December 2016
111
15. Emergency Planning & Flood Warning
15.1 Introduction
The NPPF states that the receipt of and response to warnings of floods is an essential element in the management of the residual risk of flooding. Thus it recognises that flood warning and emergency planning is a useful measure for managing flood risk from extreme events. In exceptional cases where land allocation within flood risk areas is unavoidable, new development should be designed so that flood warning complements other measures and minimises residual risk. It should not be the primary means of protection. Flood warning and evacuation procedures can reduce the risk of people being exposed to flood waters and minimise the consequences of flooding. However, due to the flashy nature of the rivers in Hart, and the lack of gauging and effective warning systems, the majority of the urban areas in Hart District are not covered by flood warning. Flood Warning is only available on sections of the River Hart, River Whitewater and Blackwater River and not the smaller urban tributaries from which most of the fluvial flood risk in Hart proceeds. It is therefore important that effective land use planning is controlled such that there is less dependency on the requirement for flood warning and alert systems.
15.2 Emergency Planning
Local Planning Authorities have a defined role in emergency planning. The role and responsibilities for emergency planning are set out by legislation following the implementation of the Civil Contingencies Act 2004. The Act defines the term 'emergency' as:
'an event or situation which threatens serious damage to human welfare’;
‘an event or situation which threatens serious damage to the environment, or war, or terrorism, which threatens serious damage to security'.
Hart District Council, as part of Hampshire County, has formed ‘The Hampshire Flood Response Group’ which includes all the agencies who have a part to play in the response to flooding incidents. The Flood Response Group has produced the ‘Hampshire Flood Plan’ that lays down a framework for the coordination of flood response work. This document incorporates the Environment Agency Major Incident Plan and the various warning techniques used in a flooding emergency. It also describes the roles and responsibilities of the emergency services, various departments within the respective councils, utility companies, Environment Agency, industrial companies and individual property owners. In the ‘Hampshire Flood Plan’ the Local Authorities have been identified to assume the role of co-ordinators of any inter-agency work to alleviate flooding problems. The County Flood Co-ordination Cell will collate all information from the public and all the agencies involved in the flood response maintaining lists of current flood warnings, road closures and details of flooded areas.
15.3 Flood Warning
The Environment Agency is the lead organisation on flood warning and its key responsibilities include direct remedial action to prevent and mitigate the effects of an incident, to provide specialist advice, to give warnings to those likely to be affected, to monitor the effects of an incident and to investigate its causes. This requires the EA, local authorities and the emergency services to work together to protect people and properties. When conditions suggest that a flood is likely, it is the responsibility of the EA to issue flood warnings to the Police, Fire and Rescue Service, to the relevant local authorities, to the public and to the flood wardens. Flood alerts and warning are disseminated via the Floodline Warnings Direct system which
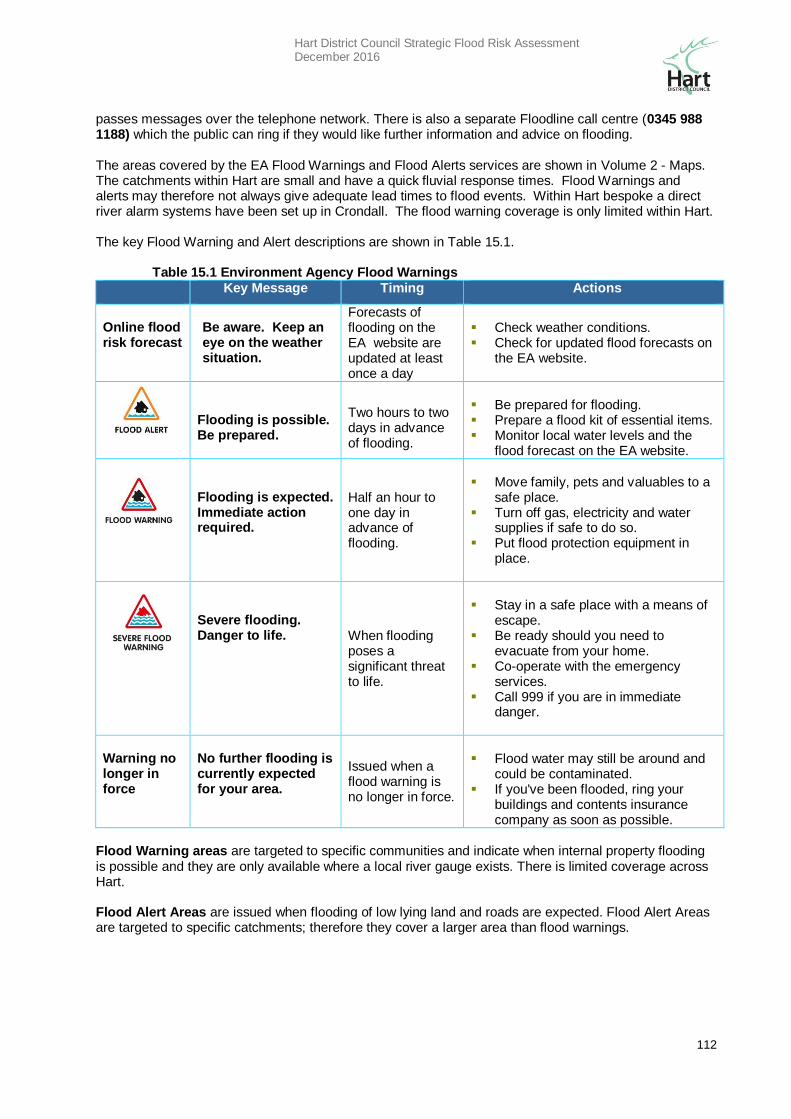
Hart District Council Strategic Flood Risk Assessment December 2016
112
passes messages over the telephone network. There is also a separate Floodline call centre (0345 988 1188) which the public can ring if they would like further information and advice on flooding. The areas covered by the EA Flood Warnings and Flood Alerts services are shown in Volume 2 - Maps. The catchments within Hart are small and have a quick fluvial response times. Flood Warnings and alerts may therefore not always give adequate lead times to flood events. Within Hart bespoke a direct river alarm systems have been set up in Crondall. The flood warning coverage is only limited within Hart. The key Flood Warning and Alert descriptions are shown in Table 15.1.
Table 15.1 Environment Agency Flood Warnings Key Message Timing Actions
Online flood risk forecast
Be aware. Keep an eye on the weather situation.
Forecasts of flooding on the EA website are updated at least once a day
Check weather conditions. Check for updated flood forecasts on
the EA website.
Flooding is possible. Be prepared.
Two hours to two days in advance of flooding.
Be prepared for flooding. Prepare a flood kit of essential items. Monitor local water levels and the
flood forecast on the EA website.
Flooding is expected. Immediate action required.
Half an hour to one day in advance of flooding.
Move family, pets and valuables to a
safe place. Turn off gas, electricity and water
supplies if safe to do so. Put flood protection equipment in
place.
Severe flooding. Danger to life.
When flooding poses a significant threat to life.
Stay in a safe place with a means of
escape. Be ready should you need to
evacuate from your home. Co-operate with the emergency
services. Call 999 if you are in immediate
danger.
Warning no longer in force
No further flooding is currently expected for your area.
Issued when a flood warning is no longer in force.
Flood water may still be around and
could be contaminated. If you've been flooded, ring your
buildings and contents insurance company as soon as possible.
Flood Warning areas are targeted to specific communities and indicate when internal property flooding is possible and they are only available where a local river gauge exists. There is limited coverage across Hart. Flood Alert Areas are issued when flooding of low lying land and roads are expected. Flood Alert Areas are targeted to specific catchments; therefore they cover a larger area than flood warnings.
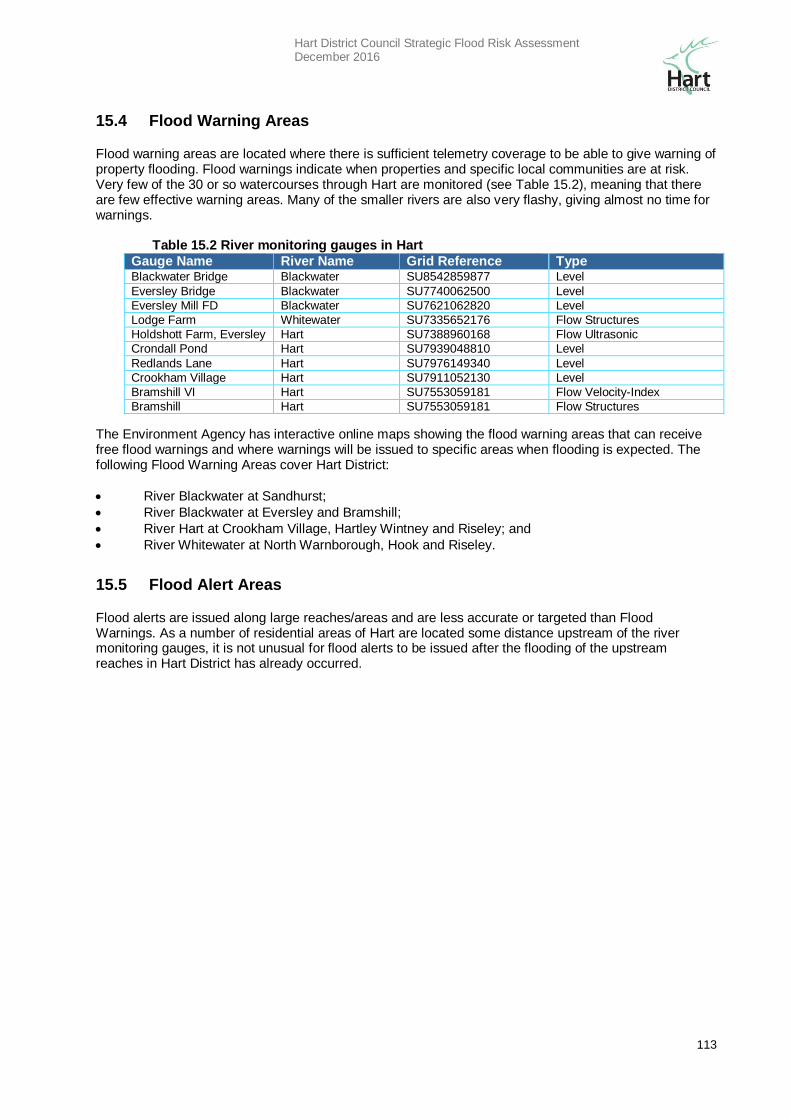
Hart District Council Strategic Flood Risk Assessment December 2016
113
15.4 Flood Warning Areas
Flood warning areas are located where there is sufficient telemetry coverage to be able to give warning of property flooding. Flood warnings indicate when properties and specific local communities are at risk. Very few of the 30 or so watercourses through Hart are monitored (see Table 15.2), meaning that there are few effective warning areas. Many of the smaller rivers are also very flashy, giving almost no time for warnings.
Table 15.2 River monitoring gauges in Hart
Gauge Name River Name Grid Reference Type Blackwater Bridge Blackwater SU8542859877 Level
Eversley Bridge Blackwater SU7740062500 Level
Eversley Mill FD Blackwater SU7621062820 Level
Lodge Farm Whitewater SU7335652176 Flow Structures
Holdshott Farm, Eversley Hart SU7388960168 Flow Ultrasonic
Crondall Pond Hart SU7939048810 Level
Redlands Lane Hart SU7976149340 Level
Crookham Village Hart SU7911052130 Level
Bramshill VI Hart SU7553059181 Flow Velocity-Index
Bramshill Hart SU7553059181 Flow Structures
The Environment Agency has interactive online maps showing the flood warning areas that can receive free flood warnings and where warnings will be issued to specific areas when flooding is expected. The following Flood Warning Areas cover Hart District:
River Blackwater at Sandhurst;
River Blackwater at Eversley and Bramshill;
River Hart at Crookham Village, Hartley Wintney and Riseley; and
River Whitewater at North Warnborough, Hook and Riseley.
15.5 Flood Alert Areas
Flood alerts are issued along large reaches/areas and are less accurate or targeted than Flood Warnings. As a number of residential areas of Hart are located some distance upstream of the river monitoring gauges, it is not unusual for flood alerts to be issued after the flooding of the upstream reaches in Hart District has already occurred.
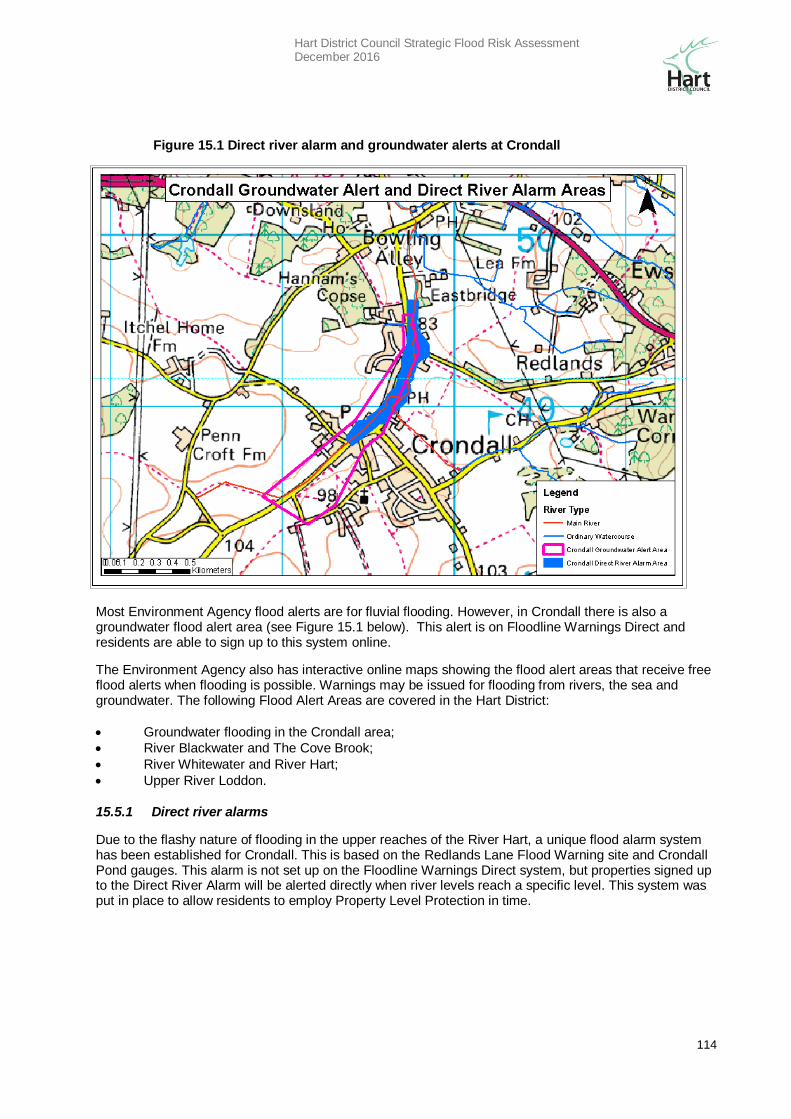
Hart District Council Strategic Flood Risk Assessment December 2016
114
Most Environment Agency flood alerts are for fluvial flooding. However, in Crondall there is also a groundwater flood alert area (see Figure 15.1 below). This alert is on Floodline Warnings Direct and residents are able to sign up to this system online.
The Environment Agency also has interactive online maps showing the flood alert areas that receive free flood alerts when flooding is possible. Warnings may be issued for flooding from rivers, the sea and groundwater. The following Flood Alert Areas are covered in the Hart District:
Groundwater flooding in the Crondall area;
River Blackwater and The Cove Brook;
River Whitewater and River Hart;
Upper River Loddon.
15.5.1 Direct river alarms
Due to the flashy nature of flooding in the upper reaches of the River Hart, a unique flood alarm system has been established for Crondall. This is based on the Redlands Lane Flood Warning site and Crondall Pond gauges. This alarm is not set up on the Floodline Warnings Direct system, but properties signed up to the Direct River Alarm will be alerted directly when river levels reach a specific level. This system was put in place to allow residents to employ Property Level Protection in time.
Figure 15.1 Direct river alarm and groundwater alerts at Crondall
Hart District Council Strategic Flood Risk Assessment December 2016
115
15.6 Using Emergency Flood Plans in Planning Applications
There may be occasions when it is appropriate for a development to use an emergency flood plan to help mitigate the flood risk to the site users. Developments which increase the more vulnerable or highly vulnerable units within the flood zones or on a dry island should provide a safe route of access and egress (See sections 15.1, 15.5 and 15.6 for more details). Where this has been assessed and shown as not possible, it may be possible to manage the risk to site users via a site specific emergency flood plan. Emergency flood plans may also be required on a discretionary basis by the LPA where surface water flooding is considered to pose a danger to site users.
Advice should be taken from Hart District Council and Hampshire County Council’s emergency planners before undertaking an emergency flood plan. To determine whether an emergency flood plan could be used to mitigate the risk to site users the Flood Risk Assessment must cover the following issues:
How flood warning is to be provided o Availability of existing warning systems o Rate of onset of flooding and available warning time o Duration of flooding o Method of flood warning dissemination
How will the impact of a flood event on site users be managed o Prior Evacuation:
Sites must be covered by flood warning (flood alerts are insufficient for this purpose) Have sufficient time to evacuate before the onset of flooding. Have an identified location to evacuate to Estimated duration that the site will be evacuated for
o Temporary Refuge Provision of a safe, dry location for site users to stay for the duration of the flooding. Ability to maintain key services during an event Vulnerability of occupants. Emergency Services should be able to access the site
during a flood event for non-flood risk related emergencies. Expected time taken to re-establish normal practices post flooding.
Due to the limited coverage of flood warning in Hart, prior evacuation is likely to only be possible in a few specific locations. In all cases, an assessment of access and egress routes must be undertaken first before emergency flood plans are considered. Please see sections 15.1 and 15.5 for more details.
Hart District Council Strategic Flood Risk Assessment December 2016
116
16. Defences and Asset Management
16.1 Introduction
A formal flood defence is a structure and or feature specifically constructed to manage or reduce flooding from a particular source. Flood defences are built to help reduce the occurrence and therefore consequences of flooding. Some structures provide flood benefits, however they are also built to manage low flows or are part of the overall infrastructure network. These assets can be owned, operated and maintained by the Environment Agency, Local Authorities, private business and/or local residents. In addition to formal flood defences, infrastructure such as major roads and railway lines, boundary walls and buildings can influence flood flows from a variety of sources. These types of structures are known as informal flood defences because they were built for non-flood risk related purposes but because of their location and type of construction happen to provide some local flood risk benefits.
16.2 Defences
There are 5 formal flood defences in Hart. These are all small scale providing localised flood alleviation to a few properties:
Beacon Hill Flood Storage Area (Fleet)- This is a Hart District Council owned asset consisting of an earth embankment and piped flow restriction on the Fleet Brook. This flood storage area protects Weldon Close and the top end of Reading Road South from fluvial flooding. Standard of protection is not known.
Royal Oak Valley Flood Storage Area (Yateley) - This is a Hart District Council owned asset consisting of a small earth embankment and piped flow restriction on the Tudor Stream in Yateley. Standard of protection is not known.
Church View interception ditch (Phoenix Green) - This is a Hart District Council owned asset consisting of surface water overland flow interception ditch and earth embankment. The standard of protection is not known.
York Lane interception ditch (Phoenix Green) - This is a Hart District Council owned asset consisting of a surface water overland flow interception ditch and a siphon under the A30 London Road. Standard of protection is estimated to be between a 1 in 30 and 1 in 100 storm event.
Burnside overflow culvert (Fleet) – This consist of an offline fixed crest weir and box culvert that diverts river flows during high flow events from the Canalside Stream at Burnside across Oakley Park into the Fleet Brook. The asset owner is unknown as is the standard of protection.
For all formal defence there is the residual risk of failure. Residual risk can arise if:
A flood event occurs that exceeds the design standard of the defence A failure occurs to the flood risk infrastructure e.g. an embankment breach, blockage of the
conveyance system or failure of operated equipment such as pumps. New development downstream of an existing flood defence should consider the impact on development should the residual risk of failure occur. No detailed assessment has been made of informal defences in Hart. There are likely to be any number of informal defences. A few of the most noticeable ones include the rail, motorway and canal embankments near Holt Copse, west of Potbridge Farm and along the length of the canal. There are also embankments around an offline balancing pond in Lea Springs. The standard of protection provided by these structures is currently unknown. Site specific Flood Risk Assessments should identify informal defence that could affect the site and consider the residual risk of failure. Any works in vicinity of an embanked road, canal, or railway or any other structure that acts as water retaining structures or informal flood storage should be assessed to ensure that flood risk is not increased.
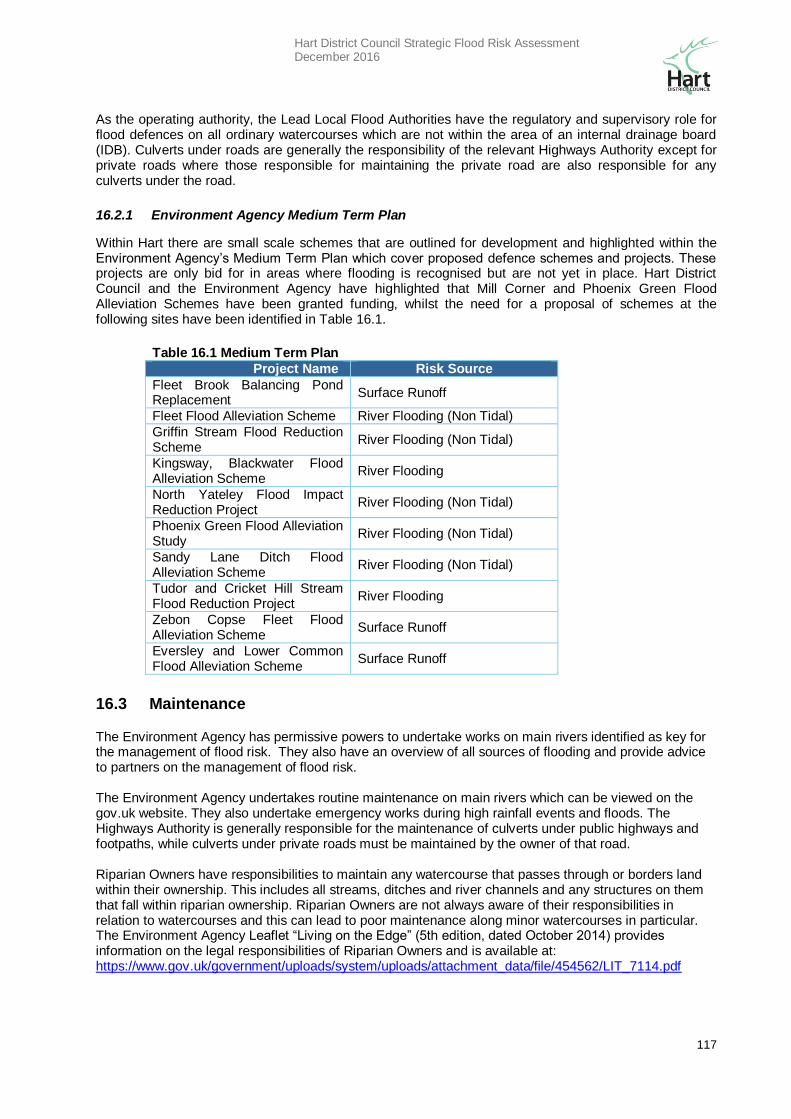
Hart District Council Strategic Flood Risk Assessment December 2016
117
As the operating authority, the Lead Local Flood Authorities have the regulatory and supervisory role for flood defences on all ordinary watercourses which are not within the area of an internal drainage board (IDB). Culverts under roads are generally the responsibility of the relevant Highways Authority except for private roads where those responsible for maintaining the private road are also responsible for any culverts under the road.
16.2.1 Environment Agency Medium Term Plan
Within Hart there are small scale schemes that are outlined for development and highlighted within the Environment Agency’s Medium Term Plan which cover proposed defence schemes and projects. These projects are only bid for in areas where flooding is recognised but are not yet in place. Hart District Council and the Environment Agency have highlighted that Mill Corner and Phoenix Green Flood Alleviation Schemes have been granted funding, whilst the need for a proposal of schemes at the following sites have been identified in Table 16.1.
Table 16.1 Medium Term Plan
Project Name Risk Source
Fleet Brook Balancing Pond Replacement
Surface Runoff
Fleet Flood Alleviation Scheme River Flooding (Non Tidal)
Griffin Stream Flood Reduction Scheme
River Flooding (Non Tidal)
Kingsway, Blackwater Flood Alleviation Scheme
River Flooding
North Yateley Flood Impact Reduction Project
River Flooding (Non Tidal)
Phoenix Green Flood Alleviation Study
River Flooding (Non Tidal)
Sandy Lane Ditch Flood Alleviation Scheme
River Flooding (Non Tidal)
Tudor and Cricket Hill Stream Flood Reduction Project
River Flooding
Zebon Copse Fleet Flood Alleviation Scheme
Surface Runoff
Eversley and Lower Common Flood Alleviation Scheme
Surface Runoff
16.3 Maintenance
The Environment Agency has permissive powers to undertake works on main rivers identified as key for the management of flood risk. They also have an overview of all sources of flooding and provide advice to partners on the management of flood risk. The Environment Agency undertakes routine maintenance on main rivers which can be viewed on the gov.uk website. They also undertake emergency works during high rainfall events and floods. The Highways Authority is generally responsible for the maintenance of culverts under public highways and footpaths, while culverts under private roads must be maintained by the owner of that road. Riparian Owners have responsibilities to maintain any watercourse that passes through or borders land within their ownership. This includes all streams, ditches and river channels and any structures on them that fall within riparian ownership. Riparian Owners are not always aware of their responsibilities in relation to watercourses and this can lead to poor maintenance along minor watercourses in particular. The Environment Agency Leaflet “Living on the Edge” (5th edition, dated October 2014) provides information on the legal responsibilities of Riparian Owners and is available at: https://www.gov.uk/government/uploads/system/uploads/attachment_data/file/454562/LIT_7114.pdf
Hart District Council Strategic Flood Risk Assessment December 2016
118
Hart District Council is responsible for maintaining watercourses on council owned land and flood defences built by HDC unless handed over to another authority or private owner. Hart District Council owned land is shown on their online mapping system: http://maps.hart.gov.uk/map/ui/ under land and property information. Some watercourse are located on Parish Council owned land and will fall to the parish to maintain these sections.
16.4 Works in or near a watercourse
A Flood Risk Activities Environmental Permit must be submitted to the Environment Agency if work is proposed:-
On, under or within 8m from a main river or main river flood defence, and/or Make changes to any structure that helps control floods.
Environmental Permit is required for works (excluding maintenance undertaken with hand held tools) in, over, under or within 8m of a Main River. For further details please see: https://www.gov.uk/guidance/flood-risk-activities-environmental-permits For all works on or near all other watercourse that are not main rivers, permission will be needed from the Lead Local Flood Authority and for works in an ordinary watercourse an Ordinary Watercourse Consent must be applied for. For further information refer to:- https://www.gov.uk/flood-defence-consent-england-wales http://www3.hants.gov.uk/flooding/watercourses.htm Riparian Owners have responsibilities to maintain any watercourse that passes through their land ownership. This includes all streams, ditches and river channels and any structures on them that fall within riparian ownership. Riparian Owners are not always aware of their responsibilities in relation to watercourses and this can lead to poor maintenance along minor watercourses in particular. The Environment Agency Leaflet “Living on the Edge” (4
th edition 2013) provides information on the legal
responsibilities of Riparian Owners and is available at:- https://www.gov.uk/government/uploads/system/uploads/attachment_data/file/297423/LIT_7114_c70612.pdf
Hart District Council Strategic Flood Risk Assessment December 2016
119
17. Summary and Recommendations
17.1 Site Allocation Process
The outputs from this Level 1 SFRA should be used as an evidence base from which to direct new development to areas of low flood risk (Flood Zone 1). Where development cannot be located in Flood Zone 1, the Council should use the flood maps to apply the Sequential Test to their remaining land use allocations. Where the need to apply the Exception Test is identified, due to there being an insufficient number of suitable and available sites for development within zones of lower flood risk, the scope of the SFRA may need to be widened to a Level 2 Assessment. The need for a Level 2 SFRA cannot be fully determined until the Council has applied the Sequential Test. It is recommended that as soon as the need for the Exception Test is established, a Level 2 SFRA is undertaken to provide timely input to the overall plan making process.
17.2 Council Policy
The Local Plan for Hart and supporting guidance documents should continue to include policies to:
Protect the functional floodplain from development;
Direct vulnerable development away from flood affected areas taking account of all sources of flooding;
Ensure all development is ‘safe’.
Promote the use of maintainable SuDS in all flood zones for both brownfield and greenfield sites; and
Reduce flood risk from all sources where possible.
The SFRA has identified areas at risk and makes the following key policy recommendations outlined in Table 17.1.
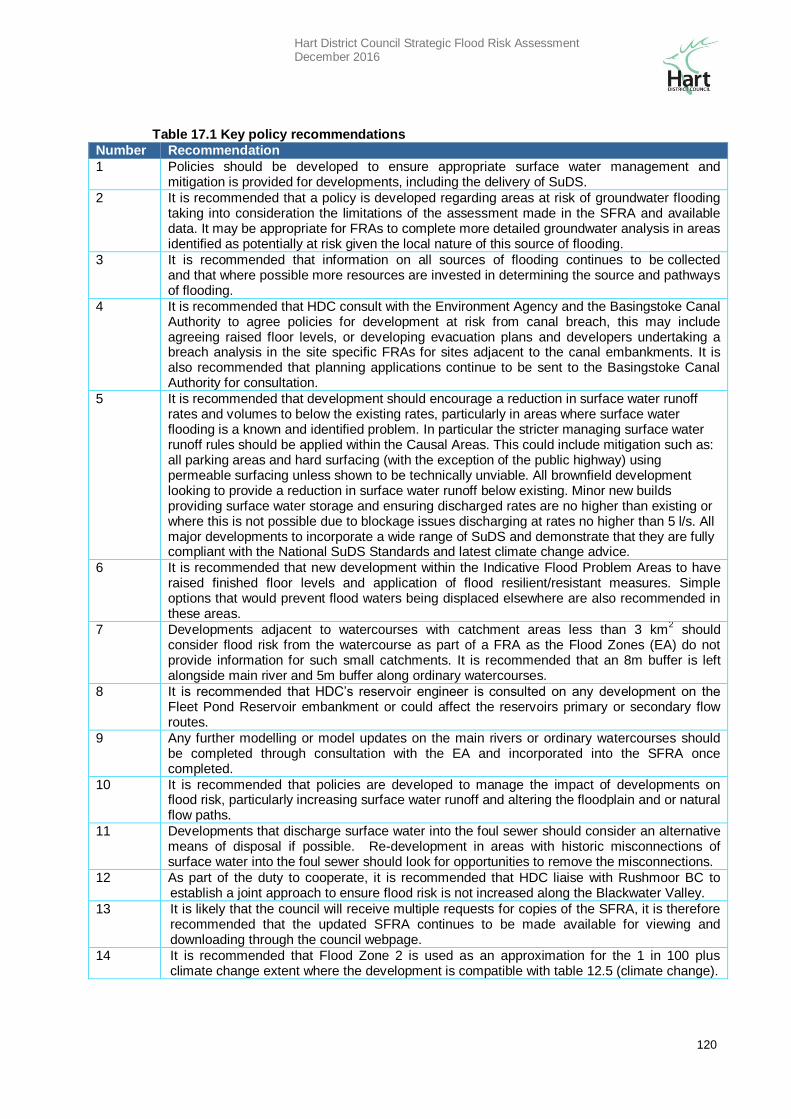
Hart District Council Strategic Flood Risk Assessment December 2016
120
Table 17.1 Key policy recommendations
Number Recommendation
1 Policies should be developed to ensure appropriate surface water management and mitigation is provided for developments, including the delivery of SuDS.
2 It is recommended that a policy is developed regarding areas at risk of groundwater flooding taking into consideration the limitations of the assessment made in the SFRA and available data. It may be appropriate for FRAs to complete more detailed groundwater analysis in areas identified as potentially at risk given the local nature of this source of flooding.
3 It is recommended that information on all sources of flooding continues to be collected and that where possible more resources are invested in determining the source and pathways of flooding.
4 It is recommended that HDC consult with the Environment Agency and the Basingstoke Canal Authority to agree policies for development at risk from canal breach, this may include agreeing raised floor levels, or developing evacuation plans and developers undertaking a breach analysis in the site specific FRAs for sites adjacent to the canal embankments. It is also recommended that planning applications continue to be sent to the Basingstoke Canal Authority for consultation.
5 It is recommended that development should encourage a reduction in surface water runoff rates and volumes to below the existing rates, particularly in areas where surface water flooding is a known and identified problem. In particular the stricter managing surface water runoff rules should be applied within the Causal Areas. This could include mitigation such as: all parking areas and hard surfacing (with the exception of the public highway) using permeable surfacing unless shown to be technically unviable. All brownfield development looking to provide a reduction in surface water runoff below existing. Minor new builds providing surface water storage and ensuring discharged rates are no higher than existing or where this is not possible due to blockage issues discharging at rates no higher than 5 l/s. All major developments to incorporate a wide range of SuDS and demonstrate that they are fully compliant with the National SuDS Standards and latest climate change advice.
6 It is recommended that new development within the Indicative Flood Problem Areas to have raised finished floor levels and application of flood resilient/resistant measures. Simple options that would prevent flood waters being displaced elsewhere are also recommended in these areas.
7 Developments adjacent to watercourses with catchment areas less than 3 km2 should
consider flood risk from the watercourse as part of a FRA as the Flood Zones (EA) do not provide information for such small catchments. It is recommended that an 8m buffer is left alongside main river and 5m buffer along ordinary watercourses.
8 It is recommended that HDC’s reservoir engineer is consulted on any development on the Fleet Pond Reservoir embankment or could affect the reservoirs primary or secondary flow routes.
9 Any further modelling or model updates on the main rivers or ordinary watercourses should be completed through consultation with the EA and incorporated into the SFRA once completed.
10 It is recommended that policies are developed to manage the impact of developments on flood risk, particularly increasing surface water runoff and altering the floodplain and or natural flow paths.
11 Developments that discharge surface water into the foul sewer should consider an alternative means of disposal if possible. Re-development in areas with historic misconnections of surface water into the foul sewer should look for opportunities to remove the misconnections.
12 As part of the duty to cooperate, it is recommended that HDC liaise with Rushmoor BC to establish a joint approach to ensure flood risk is not increased along the Blackwater Valley.
13 It is likely that the council will receive multiple requests for copies of the SFRA, it is therefore recommended that the updated SFRA continues to be made available for viewing and downloading through the council webpage.
14 It is recommended that Flood Zone 2 is used as an approximation for the 1 in 100 plus climate change extent where the development is compatible with table 12.5 (climate change).
Hart District Council Strategic Flood Risk Assessment December 2016
121
17.3 Emergency Planning
In light of this SFRA, it is recommended that the HDC and HCC’s Emergency Response Plans are reviewed and updated, if necessary, to take account of the findings and to ensure that they are informed by the most up-to-date flood risk information available. It is recommended that the Council works with the Environment Agency and Hampshire County Council to promote the awareness of flood risk, educate the public as to how they can best manage their risk and encourage communities to sign-up to the Environment Agency Flood Warning Service.
17.4 Future Updates of the SFRA
It is in the interest of HDC that the SFRA remains current and up-to-date. The Environment Agency review and update the Flood Map for Planning (Rivers and Sea) on a quarterly basis and a rolling programme of detailed flood risk mapping is underway. Any updates will be automatically forwarded to the Council for their reference. New information may influence future development management decisions within these areas. It is important, therefore, that the SFRA is adopted as a ‘living’ document and is reviewed regularly in light of emerging policy directives, flood risk datasets and an improving understand of flood risk within the District. Factors that would trigger an update to the Level 1 SFRA should be detailed within an addendum as follows:
The mapped extent of the flooding;
The date on which the event occurred;
The source of the flooding;
If known, the return period of the flood event – the likelihood of an event of the same magnitude occurring in any given year;
Any amendments to Flood Zone 2 and 3 carried out by the Environment Agency as a result of the flooding.
If there are any amendments to the NPPF or NNPPG since the released of the previous review, for example:
An amendment is made to the application of the Sequential or Exception Test;
An amendment is made to the definition of fluvial flood zones;
Land use vulnerability definitions, presented in the NPPG, are amended; and The approach to the management of SuDS is amended.
If the Environment Agency releases updates or amendments to their flood risk mapping and/or standing advice: If so,
Has any further detailed flood risk mapping been completed within the District, resulting in a change to the 20 year, 100 year or 1000 year flood outline? If this is the case, Flood Zone 3b, Flood Zone 3a, Flood Zone 3 with climate change and Flood Zone 2 should be re-mapped within the Level 2 SFRA;
If any other flood risk data is updated, such that the SFRA does not provide the most relevant and up-to-date information
Environment Agency standing advice is altered. Should this be the case, it is recommended that the Environment Agency is consulted.

Hart District Council Strategic Flood Risk Assessment December 2016
122
Page intentionally blank
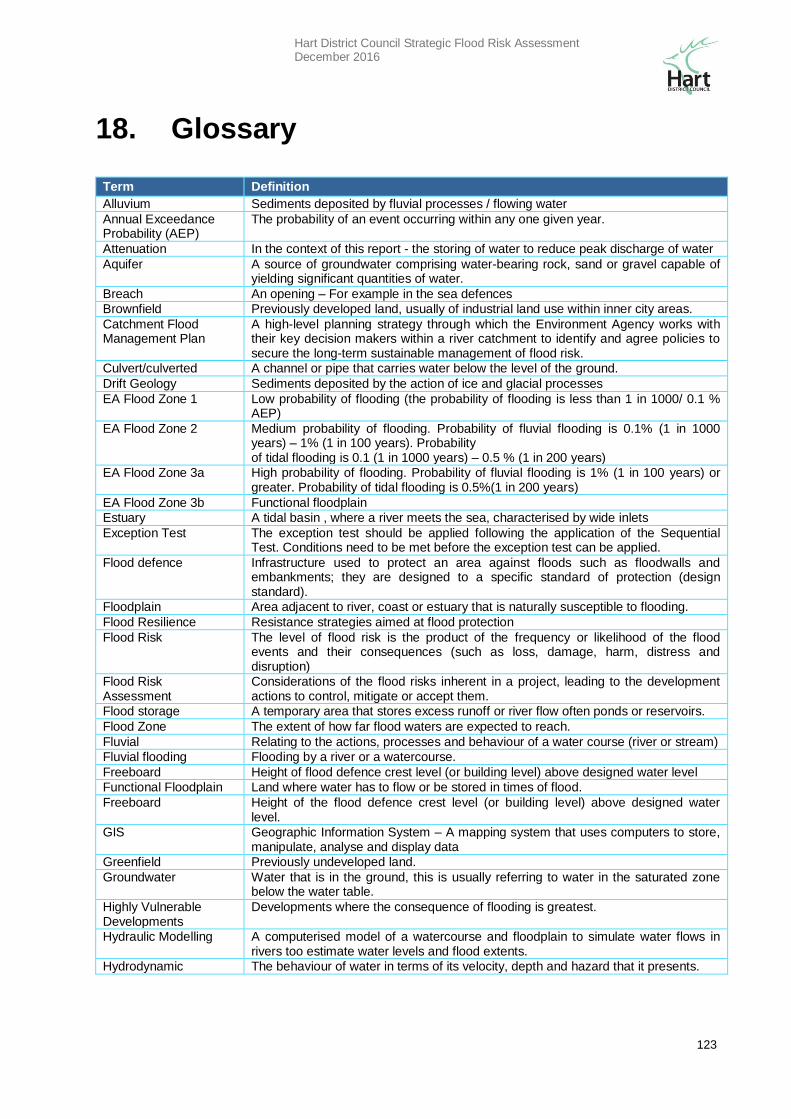
Hart District Council Strategic Flood Risk Assessment December 2016
123
18. Glossary
Term Definition
Alluvium Sediments deposited by fluvial processes / flowing water
Annual Exceedance Probability (AEP)
The probability of an event occurring within any one given year.
Attenuation In the context of this report - the storing of water to reduce peak discharge of water
Aquifer
A source of groundwater comprising water-bearing rock, sand or gravel capable of yielding significant quantities of water.
Breach An opening – For example in the sea defences
Brownfield Previously developed land, usually of industrial land use within inner city areas.
Catchment Flood Management Plan
A high-level planning strategy through which the Environment Agency works with their key decision makers within a river catchment to identify and agree policies to secure the long-term sustainable management of flood risk.
Culvert/culverted A channel or pipe that carries water below the level of the ground.
Drift Geology Sediments deposited by the action of ice and glacial processes
EA Flood Zone 1 Low probability of flooding (the probability of flooding is less than 1 in 1000/ 0.1 % AEP)
EA Flood Zone 2
Medium probability of flooding. Probability of fluvial flooding is 0.1% (1 in 1000 years) – 1% (1 in 100 years). Probability of tidal flooding is 0.1 (1 in 1000 years) – 0.5 % (1 in 200 years)
EA Flood Zone 3a
High probability of flooding. Probability of fluvial flooding is 1% (1 in 100 years) or greater. Probability of tidal flooding is 0.5%(1 in 200 years)
EA Flood Zone 3b Functional floodplain
Estuary A tidal basin , where a river meets the sea, characterised by wide inlets
Exception Test
The exception test should be applied following the application of the Sequential Test. Conditions need to be met before the exception test can be applied.
Flood defence
Infrastructure used to protect an area against floods such as floodwalls and embankments; they are designed to a specific standard of protection (design standard).
Floodplain Area adjacent to river, coast or estuary that is naturally susceptible to flooding.
Flood Resilience Resistance strategies aimed at flood protection
Flood Risk
The level of flood risk is the product of the frequency or likelihood of the flood events and their consequences (such as loss, damage, harm, distress and disruption)
Flood Risk Assessment
Considerations of the flood risks inherent in a project, leading to the development actions to control, mitigate or accept them.
Flood storage A temporary area that stores excess runoff or river flow often ponds or reservoirs.
Flood Zone The extent of how far flood waters are expected to reach.
Fluvial Relating to the actions, processes and behaviour of a water course (river or stream)
Fluvial flooding Flooding by a river or a watercourse.
Freeboard Height of flood defence crest level (or building level) above designed water level
Functional Floodplain Land where water has to flow or be stored in times of flood.
Freeboard Height of the flood defence crest level (or building level) above designed water level.
GIS Geographic Information System – A mapping system that uses computers to store, manipulate, analyse and display data
Greenfield Previously undeveloped land.
Groundwater
Water that is in the ground, this is usually referring to water in the saturated zone below the water table.
Highly Vulnerable Developments
Developments where the consequence of flooding is greatest.
Hydraulic Modelling
A computerised model of a watercourse and floodplain to simulate water flows in rivers too estimate water levels and flood extents.
Hydrodynamic The behaviour of water in terms of its velocity, depth and hazard that it presents.
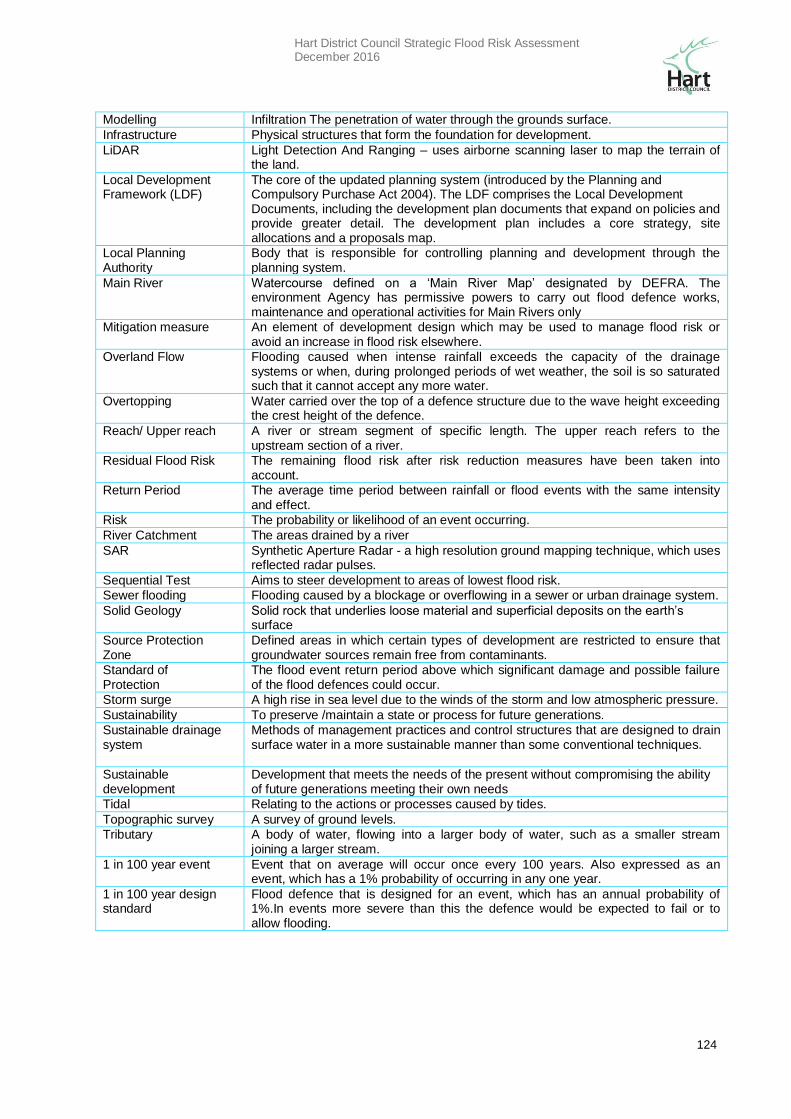
Hart District Council Strategic Flood Risk Assessment December 2016
124
Modelling Infiltration The penetration of water through the grounds surface.
Infrastructure Physical structures that form the foundation for development.
LiDAR Light Detection And Ranging – uses airborne scanning laser to map the terrain of the land.
Local Development Framework (LDF)
The core of the updated planning system (introduced by the Planning and Compulsory Purchase Act 2004). The LDF comprises the Local Development Documents, including the development plan documents that expand on policies and provide greater detail. The development plan includes a core strategy, site allocations and a proposals map.
Local Planning Authority
Body that is responsible for controlling planning and development through the planning system.
Main River Watercourse defined on a ‘Main River Map’ designated by DEFRA. The environment Agency has permissive powers to carry out flood defence works, maintenance and operational activities for Main Rivers only
Mitigation measure
An element of development design which may be used to manage flood risk or avoid an increase in flood risk elsewhere.
Overland Flow
Flooding caused when intense rainfall exceeds the capacity of the drainage systems or when, during prolonged periods of wet weather, the soil is so saturated such that it cannot accept any more water.
Overtopping
Water carried over the top of a defence structure due to the wave height exceeding the crest height of the defence.
Reach/ Upper reach A river or stream segment of specific length. The upper reach refers to the upstream section of a river.
Residual Flood Risk The remaining flood risk after risk reduction measures have been taken into account.
Return Period
The average time period between rainfall or flood events with the same intensity and effect.
Risk The probability or likelihood of an event occurring.
River Catchment The areas drained by a river
SAR
Synthetic Aperture Radar - a high resolution ground mapping technique, which uses reflected radar pulses.
Sequential Test Aims to steer development to areas of lowest flood risk.
Sewer flooding Flooding caused by a blockage or overflowing in a sewer or urban drainage system.
Solid Geology
Solid rock that underlies loose material and superficial deposits on the earth’s surface
Source Protection Zone
Defined areas in which certain types of development are restricted to ensure that groundwater sources remain free from contaminants.
Standard of Protection
The flood event return period above which significant damage and possible failure of the flood defences could occur.
Storm surge A high rise in sea level due to the winds of the storm and low atmospheric pressure.
Sustainability To preserve /maintain a state or process for future generations.
Sustainable drainage system
Methods of management practices and control structures that are designed to drain surface water in a more sustainable manner than some conventional techniques.
Sustainable development
Development that meets the needs of the present without compromising the ability of future generations meeting their own needs
Tidal Relating to the actions or processes caused by tides.
Topographic survey A survey of ground levels.
Tributary A body of water, flowing into a larger body of water, such as a smaller stream joining a larger stream.
1 in 100 year event Event that on average will occur once every 100 years. Also expressed as an event, which has a 1% probability of occurring in any one year.
1 in 100 year design standard
Flood defence that is designed for an event, which has an annual probability of 1%.In events more severe than this the defence would be expected to fail or to allow flooding.

Hart District Council Strategic Flood Risk Assessment December 2016
125
19. Appendix 1
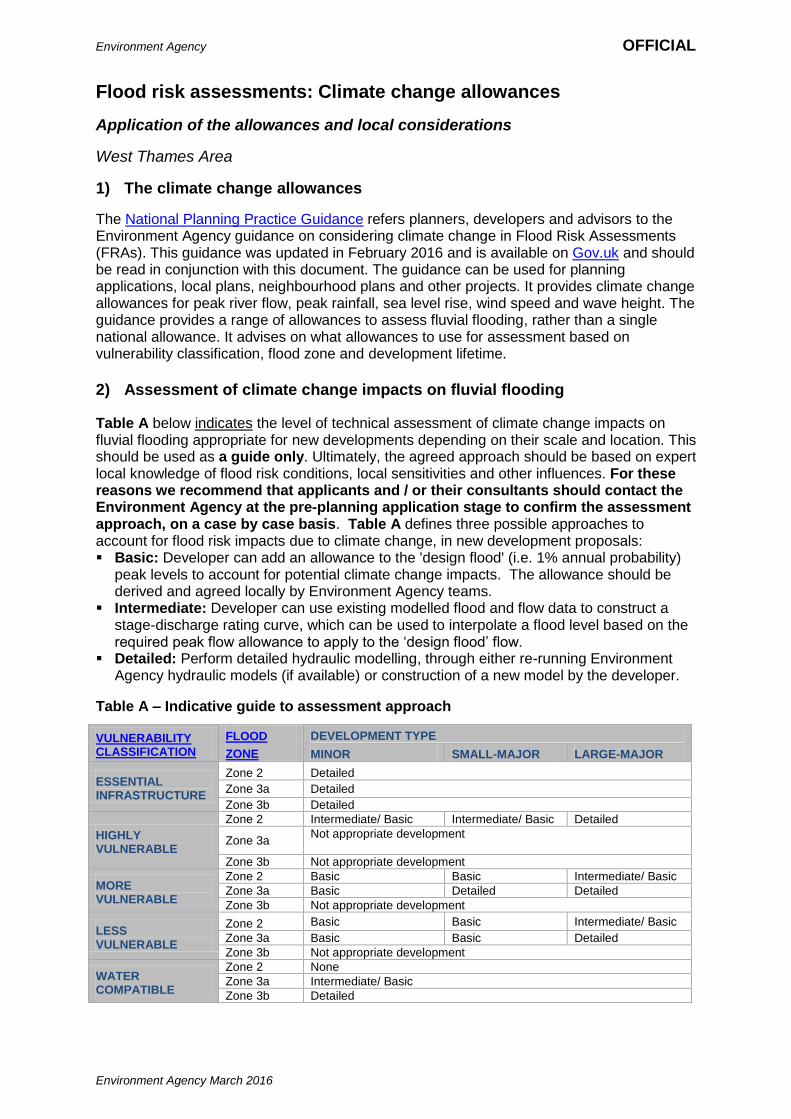
Environment Agency OFFICIAL
Environment Agency March 2016
Flood risk assessments: Climate change allowances
Application of the allowances and local considerations
West Thames Area
1) The climate change allowances
The National Planning Practice Guidance refers planners, developers and advisors to the Environment Agency guidance on considering climate change in Flood Risk Assessments (FRAs). This guidance was updated in February 2016 and is available on Gov.uk and should be read in conjunction with this document. The guidance can be used for planning applications, local plans, neighbourhood plans and other projects. It provides climate change allowances for peak river flow, peak rainfall, sea level rise, wind speed and wave height. The guidance provides a range of allowances to assess fluvial flooding, rather than a single national allowance. It advises on what allowances to use for assessment based on vulnerability classification, flood zone and development lifetime.
2) Assessment of climate change impacts on fluvial flooding
Table A below indicates the level of technical assessment of climate change impacts on fluvial flooding appropriate for new developments depending on their scale and location. This should be used as a guide only. Ultimately, the agreed approach should be based on expert local knowledge of flood risk conditions, local sensitivities and other influences. For these reasons we recommend that applicants and / or their consultants should contact the Environment Agency at the pre-planning application stage to confirm the assessment approach, on a case by case basis. Table A defines three possible approaches to account for flood risk impacts due to climate change, in new development proposals: Basic: Developer can add an allowance to the 'design flood' (i.e. 1% annual probability)
peak levels to account for potential climate change impacts. The allowance should be derived and agreed locally by Environment Agency teams.
Intermediate: Developer can use existing modelled flood and flow data to construct a stage-discharge rating curve, which can be used to interpolate a flood level based on the required peak flow allowance to apply to the ‘design flood’ flow.
Detailed: Perform detailed hydraulic modelling, through either re-running Environment Agency hydraulic models (if available) or construction of a new model by the developer.
Table A – Indicative guide to assessment approach
VULNERABILITY CLASSIFICATION
FLOOD
ZONE
DEVELOPMENT TYPE
MINOR SMALL-MAJOR LARGE-MAJOR
ESSENTIAL INFRASTRUCTURE
Zone 2 Detailed
Zone 3a Detailed
Zone 3b Detailed
HIGHLY VULNERABLE
Zone 2 Intermediate/ Basic Intermediate/ Basic Detailed
Zone 3a Not appropriate development
Zone 3b Not appropriate development
MORE VULNERABLE
Zone 2 Basic Basic Intermediate/ Basic
Zone 3a Basic Detailed Detailed
Zone 3b Not appropriate development
LESS VULNERABLE
Zone 2 Basic Basic Intermediate/ Basic
Zone 3a Basic Basic Detailed
Zone 3b Not appropriate development
WATER COMPATIBLE
Zone 2 None
Zone 3a Intermediate/ Basic
Zone 3b Detailed
Environment Agency OFFICIAL
Environment Agency March 2016
NOTES:
Minor: 1-9 dwellings/ less than 0.5 ha | Office / light industrial under 1ha | General industrial under 1 ha | Retail under 1 ha | Gypsy/traveller site between 0 and 9 pitches
Small-Major: 10 to 30 dwellings | Office / light industrial 1ha to 5ha | General industrial 1ha to 5ha | Retail over 1ha to 5ha | Gypsy/traveller site over 10 to 30 pitches
Large-Major: 30+ dwellings | Office / light industrial 5ha+ | General industrial 5ha+ | Retail 5ha+ | Gypsy/traveller site over 30+ pitches | any other development that creates a non residential building or development over 1000 sq m.
The assessment approach should be agreed with the Environment Agency as part of pre-planning application discussions to avoid abortive work.
3) Specific local considerations Where the Environment Agency and the applicant and / or their consultant has agreed that a ‘basic´ level of assessment is appropriate the figures in Table B below can be used as a allowance for potential climate change impacts on peak ‘design’ (i.e. 1% annual probability) fluvial flood level rather than undertaking detailed modelling. Table B – Local allowances for potential climate change impacts
Watercourse Central Higher Central Upper
Thames 500mm 700mm 1000mm
Use of these allowances will only be accepted after discussion with the Environment Agency.
4) Fluvial food risk mitigation Read the guidance on Gov.uk to find out which allowances to use to assess the impact of climate change on flood risk. For planning consultations where we are a statutory consultee and our Flood risk standing advice does not apply we use the following benchmarks to inform flood risk mitigation for different vulnerability classifications. These are a guide only. We strongly recommend you contact us at the pre-planning application stage to confirm this on a case by case basis. Please note you may be charged for this advice. For planning consultations where we are not a statutory consultee or our Flood risk Standing advice applies we recommend local planning authorities and developers use these benchmarks but we do not expect to be consulted.
For development classed as ‘Essential Infrastructure’ our benchmark for flood risk mitigation is for it to be designed to the ‘upper end’ climate change allowance for the epoch that most closely represents the lifetime of the development, including decommissioning.
For highly vulnerable in flood zone 2, the ‘higher central’ climate change allowance is our minimum benchmark for flood risk mitigation. In sensitive locations it may be necessary to use the upper end allowance.
For more vulnerable developments in flood zone 2, the ‘central’ climate change allowance is our minimum benchmark for flood risk mitigation, and in flood zone 3 the ‘higher central’ climate change allowance is our minimum benchmark for flood risk mitigation. In sensitive locations it may be necessary to use the higher central (in flood zone 2) and the upper end allowance (in flood zone 3).
Environment Agency OFFICIAL
Environment Agency March 2016
For water compatible or less vulnerable development (e.g. commercial), the ‘central’ climate change allowance for the epoch that most closely represents the lifetime of the development is our minimum benchmark for flood risk mitigation. In sensitive locations it may be necessary to use the higher central (particularly in flood zone 3) to inform built in resilience.
There may be circumstances where local evidence supports the use of other data or allowances. Where you think this is the case we may want to check this data and how you propose to use it.
