has supplemental funding helped nc counties? - public schools
TRANSCRIPT
Has supplemental Funding Helped north Carolina Counties?
By Carrie Cook, Holly Fowler and Ty Harris Project 2.2 / October 2008
PUBLIC SCHOOLS OF NORTH CAROLINA State Board of Education | Department of Public Instruction
F I N A N C I A L A N D B U S I N E S S S E R V I C E S I N T E R N S H I P P R O G R A M
intRoduCtionFor years, scholars have debated the merit of adding additional funding and resources for the disadvantaged student population. Still, the question remains whether or not supplemental funding increases have a direct impact on disadvantaged student performance? The Disadvantaged Student Supplemental Fund (DSSF) was established in 2004 to improve student performance in North Carolina. The initial 16 disadvantaged districts selected for funding were defined by high poverty, low student performance, and high teacher turnover. However, after the initial year of funding, the formula was changed to supplement funding across all North Carolina schools.
The purpose of this study is to analyze the original 16 DSSF district expenditures based on five funding streams—DSSF, Low Wealth, Small County, At-Risk, and Improving Student Accountability to determine what impact, if any, the disadvantaged population funding streams have on Level I and Level II student population.
BaCkgRoundBased on the Leandro court case in 1994, many discussions arose about the effect of supplemental funding in schools. In 2004, Governor Mike Easley and the North Carolina Board of Education, working in concert, initiated a pilot program known as the Disadvantaged Student Supplement Fund (DSSF) to improve the education of academically at-risk students. The pilot program provided $22.4 million to fund school improvements in 16 school districts in North Carolina during the 2004–2005 school year. The 16 original districts include: Edgecombe County, Elizabeth City/Pasquotank County, Franklin County, Halifax County, Hertford County, Hoke County, Hyde County, Lexington City, Montgomery County, Northampton County, Robeson County, Thomasville City, Vance County, Warren County, Washington County, and Weldon City.
The program continued in the 16 educationally disadvantaged districts in 2005–2006 with a slight funding increase. In 2006–2007, the North Carolina General Assembly appropriated $49.5 million for DSSF. While the formula was restructured to include all disadvantaged students in North Carolina schools, the original 16 districts were held harmless to their 2004–2005 funding allocation. (HSRA, 2007).
Funding for disadvantaged populations comes from several different allocation sources. Legislation passed in House Bill 1473 states, “the disadvantaged student supplemental funding plan shall detail how the funds shall be used in conjunction with all other supplemental funding such as Low-Wealth, Small County, At Risk Students Services/Alternative Schools, and Improving Student Accountability, to provide instructional support and other services that meet the educational needs of these students” (Session Law 2007-323; DPI Allotment Policy Guide).

PRogRessive tRends
Several schools have developed progressive programs to address the gap of educational services provided to disadvantaged students. While some schools have found initiatives that don’t require additional funds, other schools have used creative spending methods to find alternative solutions for these students. Overall, many schools are proactively developing strategies to ensure that disadvantaged students receive a sound basic education.
Across the nation, schools are working to close achievement gaps and improve student performance for disadvantaged populations. In the article, “Creating Excellent and Equitable Schools,” five California high schools were studied that have beaten the odds in supporting disadvantaged students. The schools have all proven to have significantly higher college attendance rates than the state average, in spite of their predominately low-income, minority student population (Darling-Hammond and Friedlander, 2008). One school, for example, combined a college-preparatory curriculum organized around social justice issues with highly personalized instruction and a strong advisory system. Students developed a passion for writing as a result of the school’s continual emphasis on inquiry and writing. Another school, Leadership High School, focuses on creating community leaders by infusing the values of critical thinking, effective communication, and personal and social responsibility throughout their college preparatory curriculum and portfolio assessments.
In another study, “Beating the Odds at Archer Elementary School,” teachers and administrators in Greensboro, NC have created a supportive school climate to assist disadvantaged students. This strategy has created a heightened sense of community in the school. The school has a shared culture that explores the value of learning that creates a shared responsibility for education. Another strategy implemented in the school is revising teacher lesson plans. Teachers have encouraged students to be more engaged in the classroom and the instructors use more student cooperation in lesson plans. Following these changes within the school, student involvement has become the norm at Archer Elementary
school. (David Stratham General Patterns and Particular Pictures: Lessons Learned from Reports from “Beating the Odds” Schools).
noRtH CaRolina PRogRessive tRends The five funding streams analyzed for this study are not the only funding sources utilized to target disadvantaged students in North Carolina. Other North Carolina programs that assist disadvantaged student populations include Early Education programs, Student Support Services, NC’s Alternative Learning programs, and NC Dropout Prevention programs. Under North Carolina’s No Child Left Behind Initiative, schools can receive supplemental funding for tutors to assist students. North Carolina is one of the five states participating in the No Child Left Behind Pilot Program. The pilot allows seven districts in North Carolina to receive supplemental education funding for economically disadvantaged students in the first school year, which was previously slated for the public school choice options in a first year sanction (DPI News Release 2006–2007; July 27. 2006).
Additionally, the DSSF pilot program allowed school districts flexibility regarding strategies they could use to address educational issues within the district. The Department of Public Instruction (DPI) was required to provide assistance and to monitor the program. As we approach our fifth year of funding for the original 16 DSSF districts, it becomes increasingly important to closely examine the impact of disadvantaged student supplemental funding.
data and metHodologyFor our study, we used expenditure data for five allotments which include DSSF, At-Risk/Alternative, Improving Student Accountability, Low Wealth, and Small County to track changes in patterns for a number of years. Additionally we tracked the percentage proficiency change in the 16 districts to provide a means of evaluation of the DSSF district expenditure patterns. Our expenditure groupings were selected by utilizing the “High School Resource Allocation Study” by Gary T. Henry of UNC Chapel Hill.
Expenditure groupings that were evaluated include:• regular instruction • special instruction • supplemental education services• student services• technology• professional development• other support services• transportation2
• school maintenance• food service• school leadership• administrative units.
The specific research questions in this study are as follows:• Since the inception of DSSF, has there been an
improvement in Level I and Level II student performance?• Was there a change in expenditure patterns after the
inception of DSSF funding?• If there has been a change in expenditure patterns,
which grouping(s) had the most impact?
Based on our expenditure groupings, we determined that the next step was to perform an analysis of the data to identify general trends by comparing changes in proficiency levels to changes in the five funding streams over a number of years. The last step was to analyze the data and determine which groupings had the largest positive impact on student proficiency variance.
aBout CategoRiCal FundingWe selected five specific categorical allotments (At-Risk Student Services, Improving Student Accountability, Low Wealth Supplemental, Small County Supplemental, and Disadvantaged Student Supplemental Funding) because these allotments are designed for (or can be used for) targeting populations of disadvantaged students. We selected the 16 specific school districts (commonly referred to as the Leandro districts) because these districts are fully funded (actually over funded based on the current formula) in the categorical allotment for Disadvantaged Student Supplemental Funding (DSSF). DSSF requires an action plan to be submitted that outlines how state funding will be coordinated to address the specific educational needs of a districts disadvantaged population. The funding and the plan have been in operation since 2004–2005 which enables us to examine several years of student performance results.
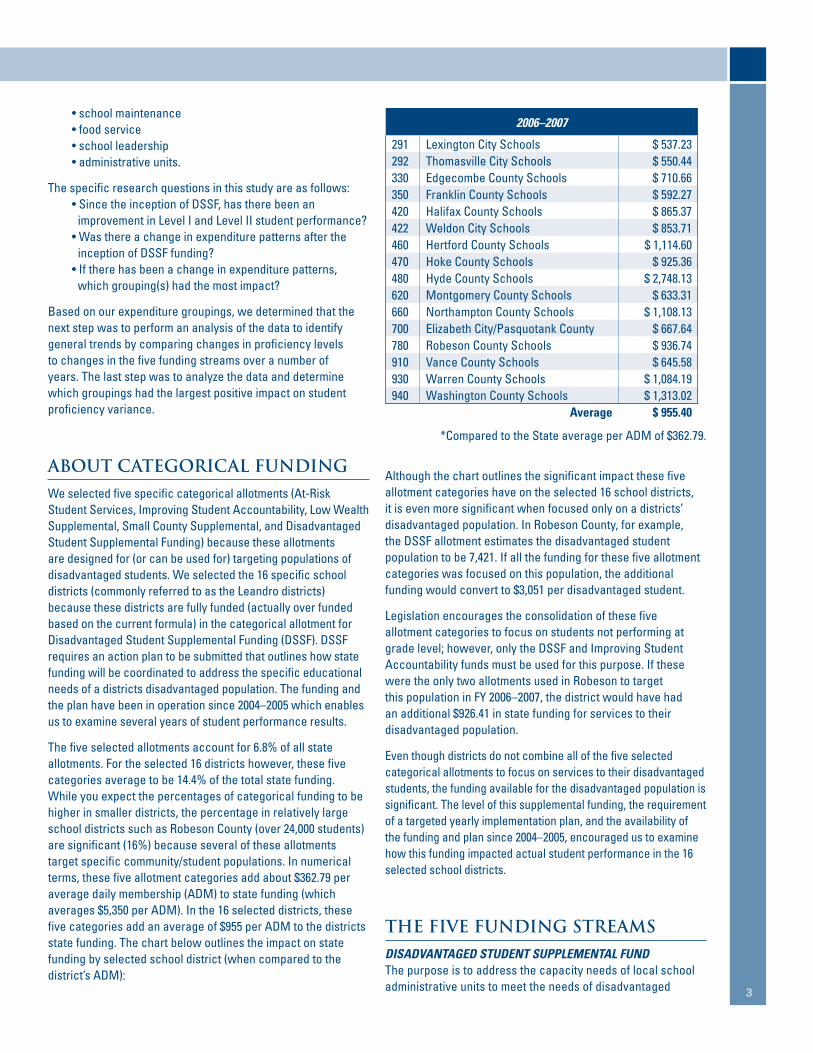
The five selected allotments account for 6.8% of all state allotments. For the selected 16 districts however, these five categories average to be 14.4% of the total state funding. While you expect the percentages of categorical funding to be higher in smaller districts, the percentage in relatively large school districts such as Robeson County (over 24,000 students) are significant (16%) because several of these allotments target specific community/student populations. In numerical terms, these five allotment categories add about $362.79 per average daily membership (ADM) to state funding (which averages $5,350 per ADM). In the 16 selected districts, these five categories add an average of $955 per ADM to the districts state funding. The chart below outlines the impact on state funding by selected school district (when compared to the district’s ADM):
2006–2007
291 Lexington City Schools $ 537.23 292 Thomasville City Schools $ 550.44 330 Edgecombe County Schools $ 710.66 350 Franklin County Schools $ 592.27 420 Halifax County Schools $ 865.37 422 Weldon City Schools $ 853.71 460 Hertford County Schools $ 1,114.60 470 Hoke County Schools $ 925.36 480 Hyde County Schools $ 2,748.13 620 Montgomery County Schools $ 633.31 660 Northampton County Schools $ 1,108.13 700 Elizabeth City/Pasquotank County $ 667.64 780 Robeson County Schools $ 936.74 910 Vance County Schools $ 645.58 930 Warren County Schools $ 1,084.19 940 Washington County Schools $ 1,313.02
Average $ 955.40
*Compared to the State average per ADM of $362.79.
Although the chart outlines the significant impact these five allotment categories have on the selected 16 school districts, it is even more significant when focused only on a districts’ disadvantaged population. In Robeson County, for example, the DSSF allotment estimates the disadvantaged student population to be 7,421. If all the funding for these five allotment categories was focused on this population, the additional funding would convert to $3,051 per disadvantaged student.
Legislation encourages the consolidation of these five allotment categories to focus on students not performing at grade level; however, only the DSSF and Improving Student Accountability funds must be used for this purpose. If these were the only two allotments used in Robeson to target this population in FY 2006–2007, the district would have had an additional $926.41 in state funding for services to their disadvantaged population.
Even though districts do not combine all of the five selected categorical allotments to focus on services to their disadvantaged students, the funding available for the disadvantaged population is significant. The level of this supplemental funding, the requirement of a targeted yearly implementation plan, and the availability of the funding and plan since 2004–2005, encouraged us to examine how this funding impacted actual student performance in the 16 selected school districts.
tHe Five Funding stReams disadvantaged student supplemental FundThe purpose is to address the capacity needs of local school administrative units to meet the needs of disadvantaged 3
students. These funds can be spent to provide instructional support or professional development; intensive in-school and/or after school remediation; diagnostic software and progress-monitoring tools; funds for teacher bonuses and supplements. A maximum of 35% of DSSF funds may be used for the purpose of funding teacher bonuses and supplements as stated by the State Board of Education (DPI Allotment Policy Guide).
low wealthThe purpose is to provide supplemental funds in counties that do not have the ability to generate local revenue to support public schools. Local boards of education are encouraged to use at least 25% of the funds received pursuant to this section to improve the academic performance of children who are performing at Level I or II on either reading or mathematics end-of-grade tests in grades 3–8 and children who are performing at Level I or II on the writing tests in grades 4 and 7.
small countyThe purpose is to provide additional funding to small county school systems with less than 4000 ADM.
at-Risk student seRvices/alteRnative FundThe purpose is to provide funding to identify students likely to drop out and to provide special alternative instructional programs for these at-risk students. The fund also provides funding for summer school instruction and transportation, remediation, alcohol and drug prevention, early intervention, safe schools, and preschool screening. These funds may not be used to supplant dropout prevention programs funded from other state or federal sources (DPI Allotment Policy Guide).
impRoving student accountabilityThe purpose is to improve the academic performance of students who are performing at Level I or II (below grade level). (DPI Allotment Policy Guide).
exPendituRe gRouPsWe consolidated the LEA expenditure data into 12 high level groupings. The groupings were the same used in the recently published in the High School Resource Allocation Study.
1. Regular Instruction: Reflects expenditures related to classroom instruction. Includes the salaries of classroom teachers and other costs (such as textbooks, supplies, etc.) related to specific course instruction. Although the percent changes by year, in FY 2006–2007, this expenditure grouping accounted for 43.8% of all expenditures in the selected categorical allotments (for the 16 selected school districts).
2. Special Instruction – supplemental education services: Reflects expenditures that are targeted towards students that require additional services. Remediation services (from teachers or tutors) and other costs associated with these
services. In FY 2006–2007, this expenditure grouping accounted for 19% of all expenditures in the selected categorical allotments (for the 16 selected school districts).
3. Supplemental Education Services (outside school day/year): Reflects expenditures associated with an Evening Academy or Saturday Academy. In FY 2006–2007, this expenditure grouping accounted for 0% of all expenditures in the selected categorical allotments (for the 16 selected school districts).
4. Student Services: Reflects expenditures related to guidance, social work, etc. In FY 2006–2007, this expenditure grouping accounted for 6% of all expenditures in the selected categorical allotments (for the 16 selected school districts).
5. Technology: Reflects expenditures for personnel, the purchase of equipment and software, and all supporting costs. In FY 2006–2007, this expenditure grouping accounted for 8.6% of all expenditures in the selected categorical allotments (for the 16 selected school districts).
6. Professional Development for Instruction: Reflects expenditures related to training programs for classroom and non-classroom teachers. In FY 2006–2007, this expenditure grouping accounted for 1.37% of all expenditures in the selected categorical allotments (for the 16 selected school districts).
7. Other Supporting Services (not directly related to pupil instruction): Reflects expenditures related to clerical support. In FY 2006–2007, this expenditure grouping accounted for 0.18% of all expenditures in the selected categorical allotments (for the 16 selected school districts).
8. Transportation: Reflects expenditures to transport students outside of the regular bus schedule (usually for remediation services). In FY 2006–2007, this expenditure grouping
4

accounted for 1.55% of all expenditures in the selected categorical allotments (for the 16 selected school districts).
9. School Maintenance: Reflects expenditures related to custodial support and other allowable building maintenance costs. In FY 2006–2007, this expenditure grouping accounted for 2.67% of all expenditures in the selected categorical allotments (for the 16 selected school districts).
10. Food Service: In FY 2006–2007, this expenditure grouping accounted for 0.02% of all expenditures in the selected categorical allotments (for the 16 selected school districts).
11. School Leadership: Reflects expenditures related to the salary and support of principals and assistant principals within a school. In FY 2006–2007, this expenditure grouping accounted for 11.85% of all expenditures in the selected categorical allotments (for the 16 selected school districts).
12. Administrative Unit: Costs not easily definable to the school level. Items such as advertising, sales tax or other purchase services. In FY 2006–2007, this expenditure grouping accounted for 4.76% of all expenditures in the selected categorical allotments (for the 16 selected school districts).
aBout student PeRFoRmanCeWe utilized school report card data to examine the annual changes (from FY 2001–2002 through FY 2006–2007) in student performance by utilizing four measures:
• End-of-Grade Reading composite score for each of the 16 selected local education agencies (LEAs). We compared each year to the base year of FY 2001–2002. This measure reflects the percent change in students in grades 3–8 who performed above grade level (proficient).
• End-of-Grade Math composite score for each of the 16 selected local education agencies (LEAs). We compared each year to the base year of FY 2001–2002. This measure reflects the percent change in students in grades 3–8 who performed above grade level (proficient).
• End-of-Grade Composite. This measure reflects the percent change in students in grades 3–8 who were above grade level in both reading and math.
• End-of-Course Composite. This measure reflects the percent change in students in grades 9–12 who were above grade level in all end-of-course test they took that fiscal year.
Each measure was compared to the state average change to determine how the school district performed relative to the State.
5

The 16 selected school districts, in general, had higher growth in the percentage of students proficient in reading in grades 3–8 than the average of the rest of the State. In fact, since 2001–2002, only two of the 16 selected districts did not exceed the state average growth percentage each year—Thomasville City and Halifax County. The following chart outlines how these 16 selected school districts improved in end of grade reading proficiency.
The 16 selected districts had mixed results in end-of-grade math proficiency. In fiscal years 2002–2003 through 2004–2005, the increase in grades 3–8 math proficient students for the 16 selected school districts exceeded the state growth percentages. The differences were not large; but, the trend was positive. In fiscal years 2005–2006 and 2006–2007, most of the 16 districts did not have proficiency growth that matched the state average. The following chart outlines how these 16 selected school districts improved in end-of-grade math proficiency.
The review of the EOG Composite and the EOC Composite also demonstrated that most of the 16 selected districts performed comparable to the state average. Although this was the general trend, several school districts consistently had higher proficiency growth than the state average. We decided to concentrate the expenditure analysis on the school districts that had the best proficiency changes (when compared to the state average). We also examined the expenditure data for a couple of districts whose proficiency change results were below the state average.
All DSSF Districts: EOC30.00%
20.00%
10.00%
0.00%
-10.00%
-30.00%
-20.00%
2001–2002 2002–2003 2003–2004 2004–2005 2005–2006 2006–2007
All DSSF Districts EOG20.00%
10.00%
15.00%
5.00%
-5.00%
0.00%
-10.00%
-15.00%
-30.00%
-20.00%
-25.00%
2001–2002 2002–2003 2003–2004 2004–2005 2005–2006 2006–2007
6
25.00%
2001–2002 2002–2003 2003–2004 2004–2005 2005–2006
20.00%
15.00%
10.00%
5.00%
-5.00%
0.00%
2006–2007
All DSSF Districts: Reading
20.00%
10.00%
0.00%
-10.00%
-20.00%
-40.00%
-30.00%
All DSSF Districts: Math
2001–2002 2002–2003 2003–2004 2004–2005 2005–2006 2006–2007
State ReadingLexington CityThomasville CityEdgecombe County Franklin CountyHalifax CountyWeldon CityHertford CountyHoke CountyHyde CountyMontgomery CountyNorthampton CountyElizabeth City/Pasquotank CountyRobeson CountyVance CountyWarren CountyWashington County

HigHest gRowtH vs. lowest gRowtHAfter analyzing the general performance trends of all 16 districts, we narrowed our focus to four LEAs—Thomasville City, Edgecombe County, Halifax County, and Weldon City. We chose two that grew significantly faster than the state average (Edgecombe County and Weldon City) and two that fell well below the state average growth percentage (Halifax County and Thomasville City). Using EOC and EOG composite scores, we compared each of the four district’s performance compared to the state average in the following categories:
• Expenditure patterns
• EOC Composite
• EOG Composite
• Math Composite
• Reading Composite
• African American Population
• White Population
• Male Population
• Female Population
lowest peRFoRming
thomasville city (292)COMPOsitEs ExPEndituREs*
Reading Math EOG EOC 1 2 4 5 6 11
2004–2005 better same same worse + - + -
2005–2006 same worse worse worse + -
2006–2007 same worse worse worse - + +
haliFax county (420)COMPOsitEs ExPEndituREs*
Reading Math EOG EOC 1 2 4 5 6 11
2004–2005 sam same same same + -
2005–2006 same worse worse same + -
2006–2007 worse worse worse better -
highest peRFoRming
edgecombe county (330) COMPOsitEs ExPEndituREs*
Reading Math EOG EOC 1 2 4 5 6 11
2004–2005 better better better better + - + -
2005–2006 better same same better - + +
2006–2007 better same same same - +
weldon city (422) COMPOsitEs ExPEndituREs*
Reading Math EOG EOC 1 2 4 5 6 11
2004–2005 better same better better + - +
2005–2006 better same better better
2006–2007 better worse better better - + + -
* Refer to Expenditures Group section on page 47

Four Counties: EOC30.00%
20.00%
10.00%
0.00%
-10.00%
-30.00%
-20.00%
2001–2002 2002–2003 2003–2004 2004–2005 2005–2006 2006–2007
Four Counties: EOG20.00%
10.00%
15.00%
5.00%
-5.00%
0.00%
-10.00%
-15.00%
-30.00%
-20.00%
-25.00%
2001–2002 2002–2003 2003–2004 2004–2005 2005–2006 2006–2007
Similarly to the prevailing trend found during the analysis of all 16 districts, these four counties demonstrated the most growth in composite Reading scores. Edgecombe County and Weldon City increased their proficient population significantly faster than the rest of the state in Reading while Halifax County and Thomasville
25.00%
2001–2002 2002–2003 2003–2004 2004–2005 2005–2006
20.00%
15.00%
10.00%
5.00%
-5.00%
0.00%
2006–2007
Four Counties: Reading
20.00%
10.00%
0.00%
-10.00%
-20.00%
-40.00%
-30.00%
Four Counties: Math
2001–2002 2002–2003 2003–2004 2004–2005 2005–2006 2006–2007
City either hovered around the state average or fell below the state average growth. Although none of these districts outperformed the rest of the state in math, Edgecombe County and Weldon City kept up with the state average while Halifax County and Thomasville City again
fell well below the rest of the state.
State ReadingThomasville CityEdgecombe County Halifax CountyWeldon City
8

African American EOC30.00%
20.00%
10.00%
0.00%
-10.00%
-30.00%
-20.00%
2001–2002 2002–2003 2003–2004 2004–2005 2005–2006 2006–2007
African American EOG20.00%
10.00%
15.00%
5.00%
-5.00%
0.00%
-10.00%
-15.00%
-30.00%
-20.00%
-25.00%
2001–2002 2002–2003 2003–2004 2004–2005 2005–2006 2006–2007
aFRican ameRican peRFoRmanceThe performance trends within the African American population mirror those found in the general population. Weldon City and Edgecombe County continued to either outperform the state or, at the very least, reflect the state average. Although Thomasville City was well below the state average percent increase in proficiency growth in the composite EOC scores, they ended up above the state average in their EOG composite growth in SY 2006–2007. Halifax County demonstrated significant growth in their EOC composite scores, ending up above the percent of state proficiency change. However, their percent EOG growth was well below the state average and the worst of all 16 districts.
White EOC
30.00%
20.00%
10.00%
40.00%
60.00%
50.00%
0.00%
-20.00%
-10.00%
2001–2002 2002–2003 2003–2004 2004–2005 2005–2006 2006–2007
White EOG
10.00%
15.00%
5.00%
-5.00%
0.00%
-10.00%
-15.00%
-30.00%
-20.00%
-25.00%
2001–2002 2002–2003 2003–2004 2004–2005 2005–2006 2006–2007
white population:Within the White population, Weldon City and Edgecombe County both had a higher percentage growth than the state average in EOC scores. Although both counties ended with a higher percentage growth in their proficient
population, Weldon City made significant improvement between SY 2006–2006 and SY 2006–2007 to put them above the state average. For both the EOC and EOG composite scores, Thomasville City and Halifax County had a much lower percentage growth than the state average.
State ReadingThomasville CityEdgecombe County Halifax CountyWeldon City
9
Male EOC30.00%
20.00%
10.00%
0.00%
-10.00%
-30.00%
-20.00%
2001–2002 2002–2003 2003–2004 2004–2005 2005–2006 2006–2007
Male EOG20.00%
10.00%
15.00%
5.00%
-5.00%
0.00%
-10.00%
-15.00%
-30.00%
-20.00%
-25.00%
2001–2002 2002–2003 2003–2004 2004–2005 2005–2006 2006–2007
Female EOC40.00%
30.00%
20.00%
10.00%
0.00%
-20.00%
-10.00%
2001–2002 2002–2003 2003–2004 2004–2005 2005–2006 2006–2007
Female EOG20.00%
10.00%
15.00%
5.00%
-5.00%
0.00%
-10.00%
-15.00%
-30.00%
-20.00%
-25.00%
2001–2002 2002–2003 2003–2004 2004–2005 2005–2006 2006–2007
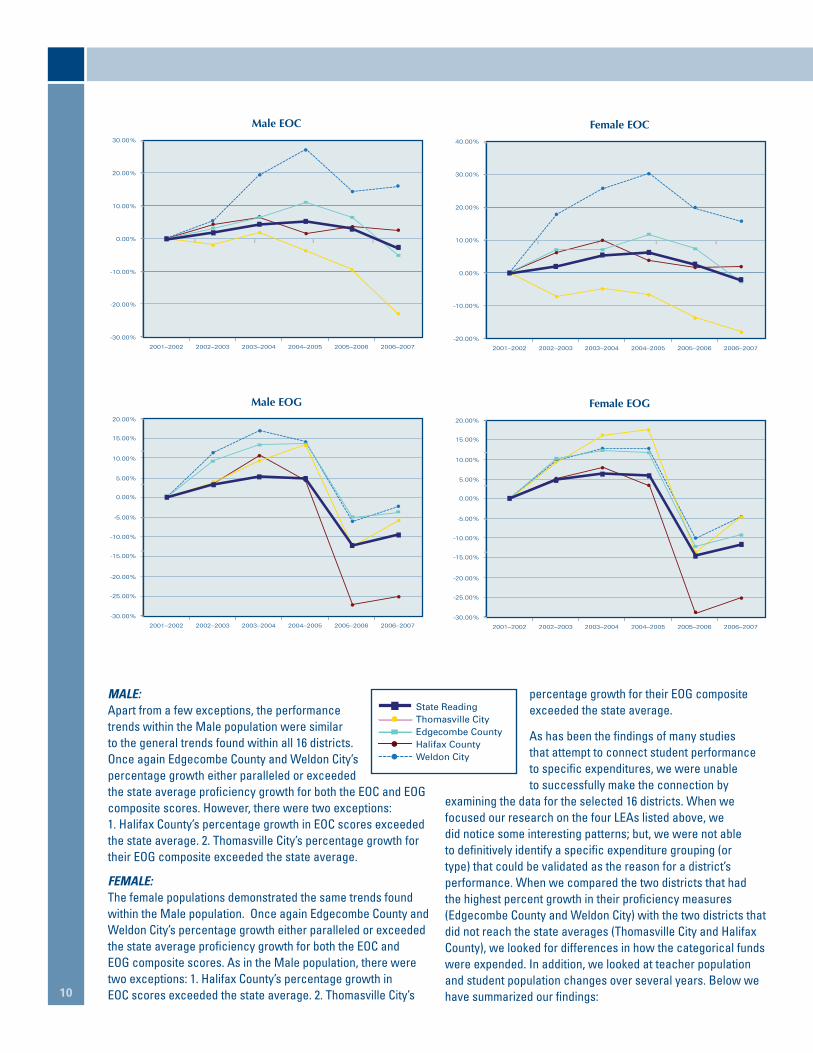
male:Apart from a few exceptions, the performance trends within the Male population were similar to the general trends found within all 16 districts. Once again Edgecombe County and Weldon City’s percentage growth either paralleled or exceeded the state average proficiency growth for both the EOC and EOG composite scores. However, there were two exceptions: 1. Halifax County’s percentage growth in EOC scores exceeded the state average. 2. Thomasville City’s percentage growth for their EOG composite exceeded the state average.
Female:The female populations demonstrated the same trends found within the Male population. Once again Edgecombe County and Weldon City’s percentage growth either paralleled or exceeded the state average proficiency growth for both the EOC and EOG composite scores. As in the Male population, there were two exceptions: 1. Halifax County’s percentage growth in EOC scores exceeded the state average. 2. Thomasville City’s
percentage growth for their EOG composite exceeded the state average.
As has been the findings of many studies that attempt to connect student performance to specific expenditures, we were unable to successfully make the connection by
examining the data for the selected 16 districts. When we focused our research on the four LEAs listed above, we did notice some interesting patterns; but, we were not able to definitively identify a specific expenditure grouping (or type) that could be validated as the reason for a district’s performance. When we compared the two districts that had the highest percent growth in their proficiency measures (Edgecombe County and Weldon City) with the two districts that did not reach the state averages (Thomasville City and Halifax County), we looked for differences in how the categorical funds were expended. In addition, we looked at teacher population and student population changes over several years. Below we have summarized our findings:
State ReadingThomasville CityEdgecombe County Halifax CountyWeldon City
10

geneRal inFoRmationEdgecombe County had a 0.26% decrease in their student population from FY 2003–2004 to FY 2006–2007 (7,610 in FY 2006–2007). In addition, the five selected categorical increased by $2,643,989 over this same period (an increase of $348.38 per student). Edgecombe County increased expenditures for regular classroom instruction, technology, and staff development in the selected categorical allotments over this time frame. They decreased funding for special instruction.
Weldon City had a 4.56% decrease in their student population from FY 2003–2004 to FY 2006–2007 (1,025 in FY 2006–2007). In addition, the five selected categorical increased by $364,252 over this same period (an increase of $378.10 per student). Weldon City increased expenditures for regular classroom instruction, technology, and student services over this time frame.
Thomasville City had a 4.7% increase in their student population from FY 2003–2004 to FY 2006–2007 (2,664 in FY 2006–2007). In addition, the five selected categorical increased by $876,585 over this same period (an increase of $305.49 per student). Thomasville City increased expenditures for regular classroom instruction, technology, and staff development in the selected categorical allotments over this time frame.
Halifax County had a 11.89% decrease in their student population from FY 2003–2004 to FY 2006–2007 (4,971 in FY 2006–2007). In addition, the five selected categorical increased by $1,902,382 over this same period (an increase of $440.10 per student). Halifax County increased expenditures for regular classroom instruction over this time frame. They decreased funding for special instruction.
teaCHing PoPulationAll four school districts increased spending on regular classroom instruction. The two districts that had the lowest percent growth in their proficiency measures (Thomasville and Halifax); however, had a negative growth in total classroom teachers. Both districts employed less locally paid classroom teachers (Thomasville went from 9 local teachers to 2 and Halifax went from 12.5 to 7). Thomasville employed less state classroom teachers even with the increased ADM and additional categorical funding focused on regular classroom instruction. On the other hand, the two districts that had the highest percent growth in their proficiency measures (Edgecombe County and Weldon City) did not decrease their locally paid classroom teachers (in fact they increased). The districts state paid classroom teaching population also remained stable or increased.
These differences indicate that some of the additional regular classroom instruction spending in Halifax and Thomasville replaced previous local funding for this purpose. It also could indicate that increasing classroom teachers had a positive
impact on student proficiency results. Unfortunately, the data available does not allow us to scientifically prove these observations.
exPendituRe diFFeRenCesWhile all four districts expended funds in a similar pattern, some differences did occur. Edgecombe and Weldon paid for someone to oversee their DSSF program. Halifax and Thomasville did not. Edgecombe County spent more resources on professional development than was outlined in their plan. Thomasville City spent less on professional development than was planned. Halifax and Weldon did not spend a lot of their resources on professional development. While we found patterns that indicated that a district’s increased expenditure in professional development reflected in improved proficiency, this could not be determined to be the definitive reason for the change.
We also noticed that some districts that established a plan and did not adjust the plan over time performed better. We also noticed that the reverse was true. To us, it is obvious that there 11
By Carrie Cook, Holly Fowler and Ty Harris The Financial and Business Services Area established the Research Intern Program in FY 2006–2007. The Program is designed to help build a quality research program within DPI to supplement and supply data for discussions related to procedural, process, and policy changes. The inaugural program includes five graduate students from four area universities. The intern program is managed by Jackson Miller (919) 807-3600 | [email protected]
NC DEPARTMENT OF PUBLIC INSTRUCTION : : June St. Clair Atkinson, Ed.D., State Superintendent : : 301 N. Wilmington Street : : Raleigh, NC 27601-2825 In compliance with federal law, NC Public Schools administers all state-operated educational programs, employment activities and admissions without discrimination because of race, religion, national or ethnic origin, color, age, military service, disability, or gender, except where exemption is appropriate and allowed by law.
Inquiries or complaints regarding discrimination issues should be directed to: Dr. Rebecca Garland, Associate State Superintendent/ Chief Academic Officer Academic Services and Instructional Support :: 6368 Mail Service Center, Raleigh, NC 27699-6368 :: Telephone: (919) 807-3200 :: Fax: (919) 807-4065
are answers within the data. We need to control the variables a little better and take the research to the districts. By partnering with the districts we should be able to better isolate which expenditure focus/change is best leading to increased student performance (and what is not working).
ConClusion and ReCommendationsSome taxpayer groups and other critics have opposed increased supplemental funding, particularly through tax hikes, arguing
that more money for schools only guarantees higher-paid teachers and administrators—not better student performance.
Our research indicates that supplemental funding is having a positive impact in some districts, whereas other districts are showing little or no change in End-of-Course and End-of-Gest Composite Scores. End-of-Course and End-of-Gest Composite Scores demonstrated that most of the 16 selected districts performed comparable to the state average. The 16 selected districts had higher growth in the percentage of students proficient in reading for grades 3–8 than the average for the rest of the state. There were mixed results in end-of-grade math proficiency.
Recommendations• DPI must hold districts accountable to their plans• If school districts fail to direct their resources to their
disadvantaged populations, consequences need to be indicated and implemented
• If a district does not outline what they are going to do, the plan should not be approved
• If a district does not perform as the plan indicates, DPI should implement a policy requiring that a certain percentage of funds be redirected towards specific staff development
For future research in this area, we recommend a further break down of funding streams in order to analyze more specific areas in which these funding expenditures have an influence on student proficiency levels. In addition, once trends are developed, further qualitative research is necessary to define what is being done in schools that are successful based on how they are spending their allotments. For instance, what does it mean to provide professional development for teachers? This can vary significantly from school to school. Once the numbers identify the trends, it is imperative to define what those numbers mean so that future policies can be assessed and implemented clearly for future resource allocation among disadvantaged student school districts.