has the carry trade worked in world bond markets
TRANSCRIPT
Has the Carry TradeWorked in World Bond Markets?
October 2008
11988 El Camino Real ❘ Suite 500 ❘ P.O. Box 919048 ❘ San Diego, CA 92191-9048 ❘ 858.755.0239 ❘ 800.237.7119 ❘ Fax 858.755.0916 ❘ www.brandes.com/institute
2
I. Introduction
The Brandes Institute, a division of Brandes Investment Partners, L.P., published Carrying On in 2006, a paper
that examined currency movements since the beginning of the floating exchange rate era in 1973 through June
2006. It documented an inefficiency that had provided the potential to improve investment returns by owning
higher interest-paying currencies.
We now test whether this anomaly is also present in the global fixed income markets by replacing the short-term
(3-month) interest rates examined in the earlier paper with 10-year maturity government bonds. For consistency,
we have also updated the currency and other data through 2007, but note that adding another 18 months of data to
the prior data covering 33½ years had only a minor impact on that study.
II. The Carry Trade
Since the advent of floating exchange rates in the early 1970’s, the currency “carry trade” has been a popular
technique for currency traders. By owning (or “going long”) a high interest rate currency, and funding the purchase
(or “going short”) in a low interest rate currency, there’s an interest rate difference that can be earned if the
exchange rate remains relatively the same. In the real world however, exchange rates rarely remain the same, so
the “carry trader” is speculating that while the trade is open, the lower interest rate currency won’t rise
significantly, and thus wipe out any gain (or more) from the interest rate difference. Because currency moves tend
to be significantly more volatile than interest rate changes, this risk can be high.
As a result, the “carry trade” technique is sometimes perceived as a gamble with a skewed potential pay-off. Most
of the time, the gains are expected to be small and steady (the interest rate differential). Other times, the result may
be a substantial loss (due to currency volatility). For a more detailed explanation and examination of the results
of the carry trade in the short-term (3 month) markets, readers are referred to Carrying On?, and for more
information and analysis of currencies since 1973, to Currencies and Hedging: the long-term Perspective, both by
the Brandes Institute.
III. Background and Assumptions
The data in this paper encompasses the modern era of free-floating currencies, which effectively commenced in
1973. The research is focused on large, liquid, high quality fixed income markets, specifically eight countries that
represent approximately 65% of the world’s government bond market capitalization as of September 30, 2007,
according to the Bank for International Settlements. These eight countries are referred to as the “Big 8” in this
work: United States, Canada, France, Germany, Switzerland, United Kingdom, Australia, and Japan. While the
data for this paper is based in U.S. dollars, the conclusions are valid for any currency base, as the gains from a
carry trade are based on the relative movements of two currencies, not on the actual return of the base currency,
whether dollars, yen, euro or any other.
The effect of the currency carry trade between two currencies can be calculated from the current interest rate
differential between the currencies, the time horizon of the holding period, and the relative movement of their
exchange rates over that time horizon. For some currencies, liquidity also may be a factor, but for the developed
markets, especially the Big 8, liquidity is typically not an issue.
When analyzing the equivalent carry trade for longer-term securities, the necessary elements of the calculation are
the income earned quarterly (if coupons are semi-annual, the payments are prorated for each quarter), the time
horizon of the holding period for rebalancing (which remains at a calendar quarter in this research), the relative
movement of their exchange rates over that time horizon, and any part of the total return in that period not
attributable to the coupon income. Quarterly income payments were calculated from the current yield, or then-
current yield-to-maturity, on a 10-year maturity government bond at par at the start of each quarter. In essence, the
current yield represents the prevailing coupon on a newly issued bond at par. Rebalancing costs are assumed to be
equal in each market, which we believe is a reasonable assumption for government bonds in major developed
countries. Given that this analysis focuses on relative rankings, this permits transaction costs to be excluded when
testing relative returns, although an investor’s aggregate returns would be reduced by transaction costs.
An underlying assumption is that all the Big 8 countries have had equally-credit-worthy government bond markets
(i.e., effectively zero default risk) and that relative country-specific credit risk is minimal. We believe this to be a
realistic assumption, and in fact, the one Big 8 country whose credit rating has been under pressure during the
period under study was Japan, one of the lowest yielding markets for much of this period.
Quarterly total return indices allowed the calculation of separate income and capital contributions to quarterly
return, as well as the ability to assume different levels of withholding tax for taxable investors in the base currency.
In this study, we have used the U.S. dollar as the base currency.
IV. Short-term Simulation
In Carrying On?, the research approach was based on ranking currencies each quarter based on the relative level
of their 3-month interest rates. Thus at the start of the measurement period (January 1, 1973), we placed the
currency with the lowest 3-month interest rate into “Rank 1,” the next lowest into “Rank 2,” and so on, until all
currencies were ranked. We then measured the average total return for the following quarter, comprised of the
interest rate earned and the exchange rate move against the base or measurement currency.
Currencies were re-ranked at the start of each successive quarter. Note that if relative interest rate levels had
changed by then, the ranking order of actual currencies might be different. By repeating this process for every
quarter in the full period studied, and then measuring the cumulative result of “Rank 1,” “Rank 2,” etc., we had
the results of a strategy simulation that could show what would have happened if we always had invested in the
lowest rank currency (lowest relative interest rates), the highest rank, or some combination in between.
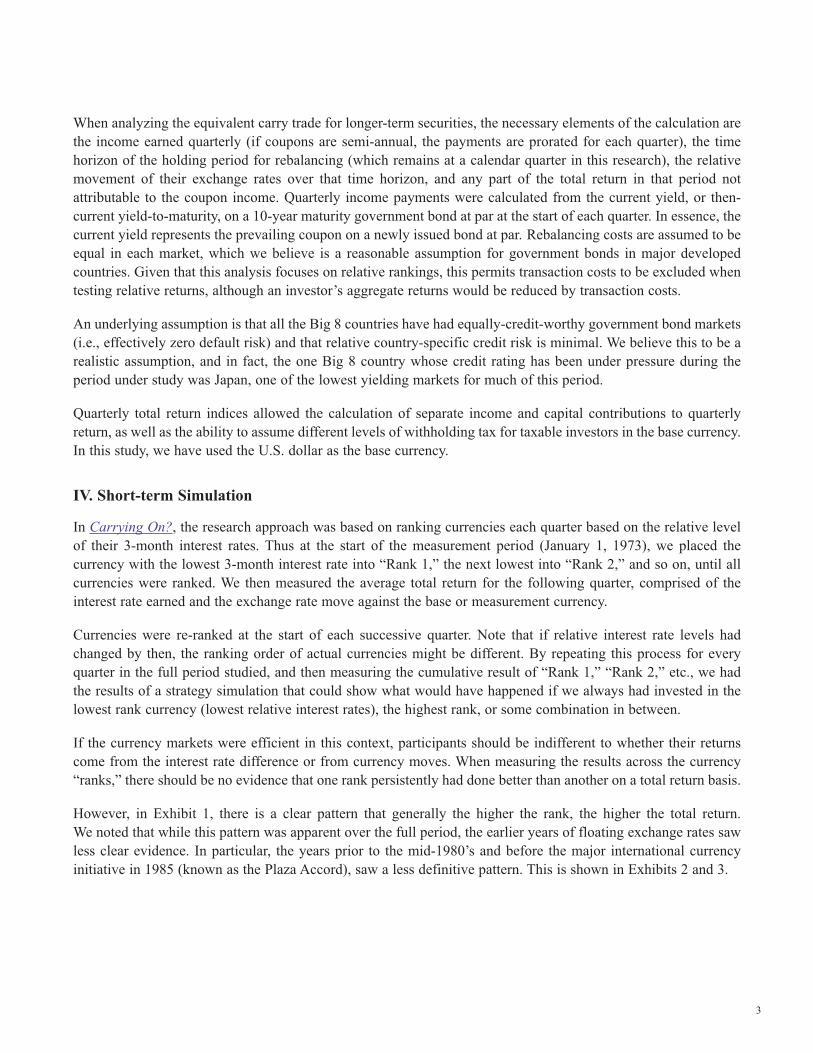
If the currency markets were efficient in this context, participants should be indifferent to whether their returns
come from the interest rate difference or from currency moves. When measuring the results across the currency
“ranks,” there should be no evidence that one rank persistently had done better than another on a total return basis.
However, in Exhibit 1, there is a clear pattern that generally the higher the rank, the higher the total return.
We noted that while this pattern was apparent over the full period, the earlier years of floating exchange rates saw
less clear evidence. In particular, the years prior to the mid-1980’s and before the major international currency
initiative in 1985 (known as the Plaza Accord), saw a less definitive pattern. This is shown in Exhibits 2 and 3.
3
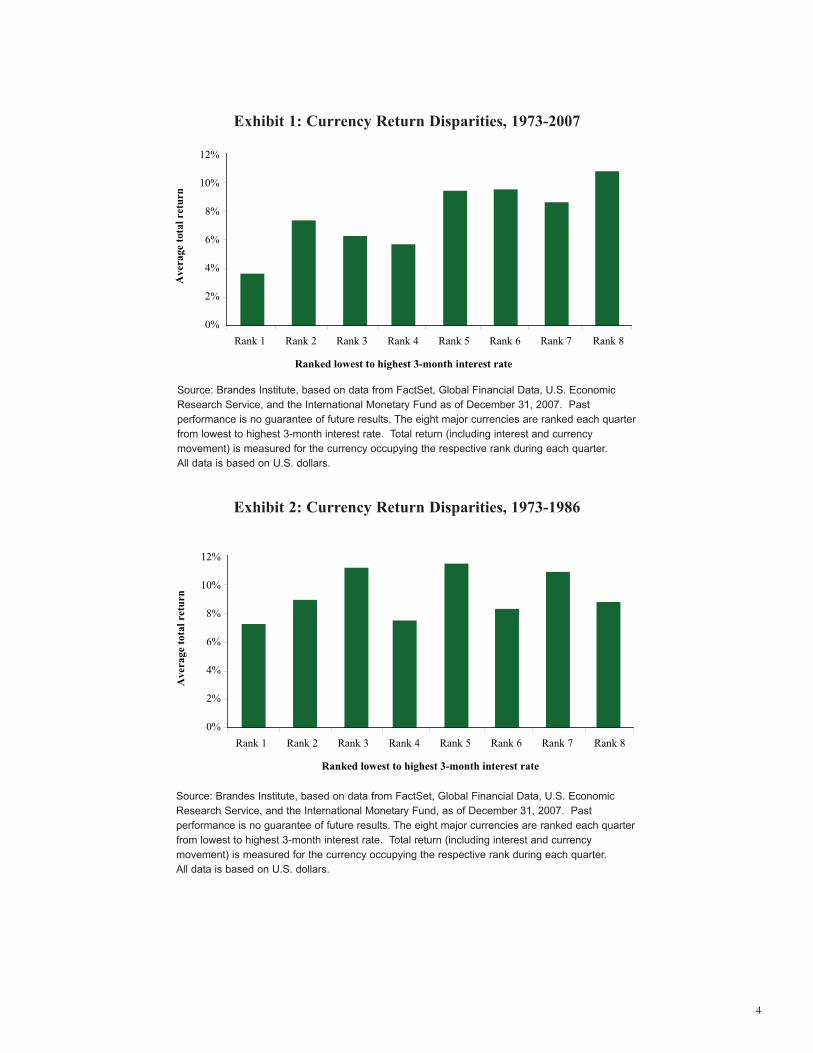
Exhibit 1: Currency Return Disparities, 1973-2007
Source: Brandes Institute, based on data from FactSet, Global Financial Data, U.S. Economic
Research Service, and the International Monetary Fund as of December 31, 2007. Past
performance is no guarantee of future results. The eight major currencies are ranked each quarter
from lowest to highest 3-month interest rate. Total return (including interest and currency
movement) is measured for the currency occupying the respective rank during each quarter.
All data is based on U.S. dollars.
Exhibit 2: Currency Return Disparities, 1973-1986
Source: Brandes Institute, based on data from FactSet, Global Financial Data, U.S. Economic
Research Service, and the International Monetary Fund, as of December 31, 2007. Past
performance is no guarantee of future results. The eight major currencies are ranked each quarter
from lowest to highest 3-month interest rate. Total return (including interest and currency
movement) is measured for the currency occupying the respective rank during each quarter.
All data is based on U.S. dollars.
4
Ranked lowest to highest 3-month interest rate
0%
4%
2%
6%
8%
10%
12%
Rank 1 Rank 2 Rank 3 Rank 4 Rank 5 Rank 6 Rank 7 Rank 8
Ave
rage
tota
l ret
urn
0%
4%
2%
6%
8%
10%
12%
Rank 1 Rank 2 Rank 3 Rank 4 Rank 5 Rank 6 Rank 7 Rank 8
Ranked lowest to highest 3-month interest rate
Ave
rage
tota
l ret
urn
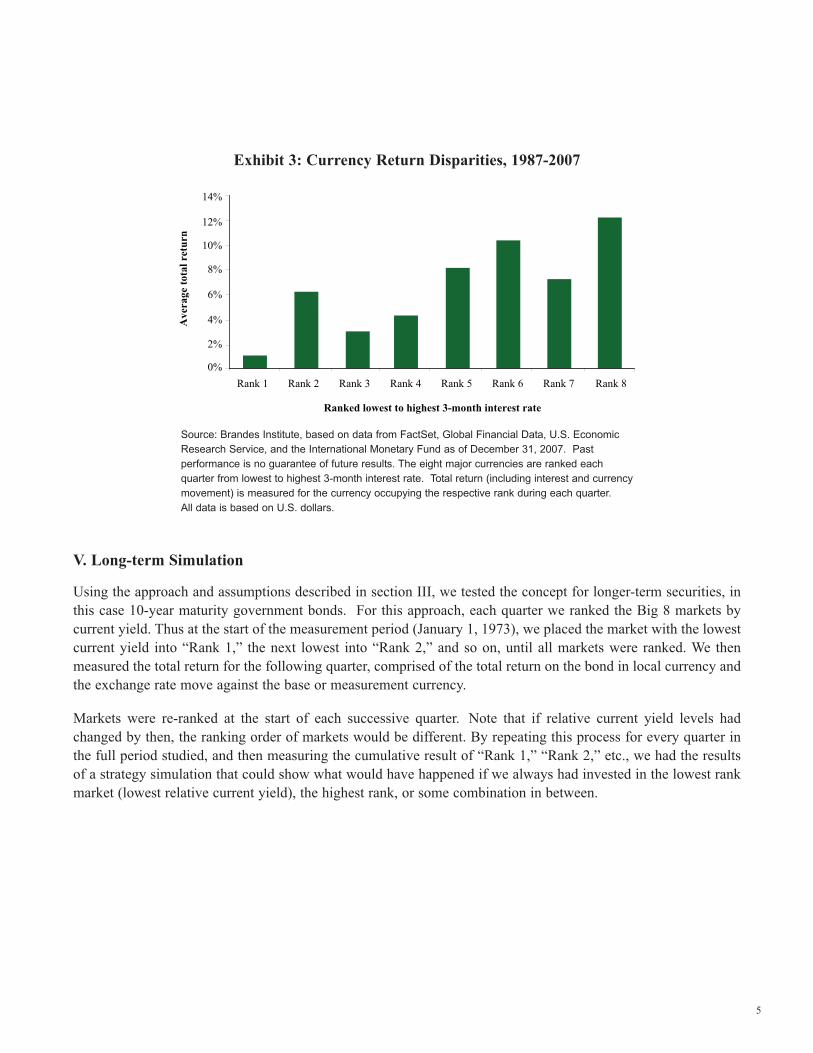
Exhibit 3: Currency Return Disparities, 1987-2007
Source: Brandes Institute, based on data from FactSet, Global Financial Data, U.S. Economic
Research Service, and the International Monetary Fund as of December 31, 2007. Past
performance is no guarantee of future results. The eight major currencies are ranked each
quarter from lowest to highest 3-month interest rate. Total return (including interest and currency
movement) is measured for the currency occupying the respective rank during each quarter.
All data is based on U.S. dollars.
V. Long-term Simulation
Using the approach and assumptions described in section III, we tested the concept for longer-term securities, in
this case 10-year maturity government bonds. For this approach, each quarter we ranked the Big 8 markets by
current yield. Thus at the start of the measurement period (January 1, 1973), we placed the market with the lowest
current yield into “Rank 1,” the next lowest into “Rank 2,” and so on, until all markets were ranked. We then
measured the total return for the following quarter, comprised of the total return on the bond in local currency and
the exchange rate move against the base or measurement currency.
Markets were re-ranked at the start of each successive quarter. Note that if relative current yield levels had
changed by then, the ranking order of markets would be different. By repeating this process for every quarter in
the full period studied, and then measuring the cumulative result of “Rank 1,” “Rank 2,” etc., we had the results
of a strategy simulation that could show what would have happened if we always had invested in the lowest rank
market (lowest relative current yield), the highest rank, or some combination in between.
5
0%
4%
2%
6%
8%
10%
12%
14%
Rank 1 Rank 2 Rank 3 Rank 4 Rank 5 Rank 6 Rank 7 Rank 8
Ranked lowest to highest 3-month interest rate
Ave
rage
tota
l ret
urn
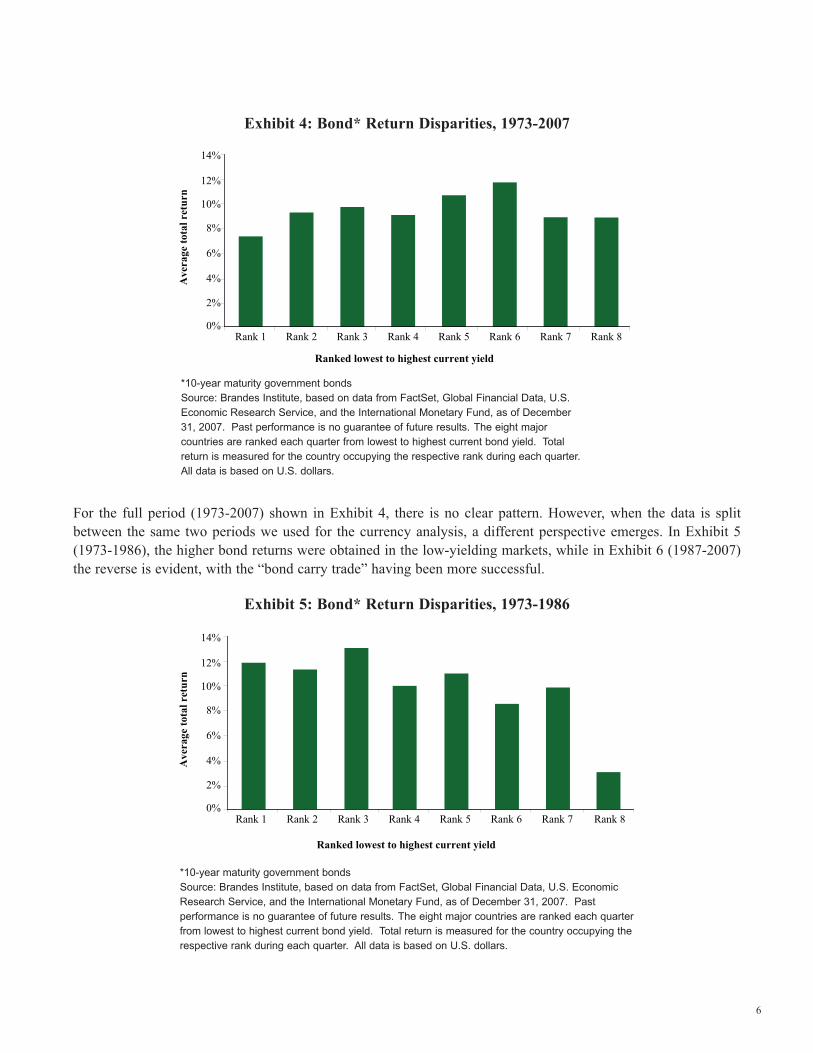
Exhibit 4: Bond* Return Disparities, 1973-2007
*10-year maturity government bonds
Source: Brandes Institute, based on data from FactSet, Global Financial Data, U.S.
Economic Research Service, and the International Monetary Fund, as of December
31, 2007. Past performance is no guarantee of future results. The eight major
countries are ranked each quarter from lowest to highest current bond yield. Total
return is measured for the country occupying the respective rank during each quarter.
All data is based on U.S. dollars.
For the full period (1973-2007) shown in Exhibit 4, there is no clear pattern. However, when the data is split
between the same two periods we used for the currency analysis, a different perspective emerges. In Exhibit 5
(1973-1986), the higher bond returns were obtained in the low-yielding markets, while in Exhibit 6 (1987-2007)
the reverse is evident, with the “bond carry trade” having been more successful.
Exhibit 5: Bond* Return Disparities, 1973-1986
*10-year maturity government bonds
Source: Brandes Institute, based on data from FactSet, Global Financial Data, U.S. Economic
Research Service, and the International Monetary Fund, as of December 31, 2007. Past
performance is no guarantee of future results. The eight major countries are ranked each quarter
from lowest to highest current bond yield. Total return is measured for the country occupying the
respective rank during each quarter. All data is based on U.S. dollars.
6
Ranked lowest to highest current yield
0%
4%
2%
6%
8%
10%
12%
14%
Rank 2Rank 1 Rank 3 Rank 4 Rank 5 Rank 6 Rank 7 Rank 8
Ave
rage
tota
l ret
urn
Ranked lowest to highest current yield
0%
4%
2%
6%
8%
10%
12%
14%
Rank 1 Rank 2 Rank 3 Rank 4 Rank 5 Rank 6 Rank 7 Rank 8
Ave
rage
tota
l ret
urn
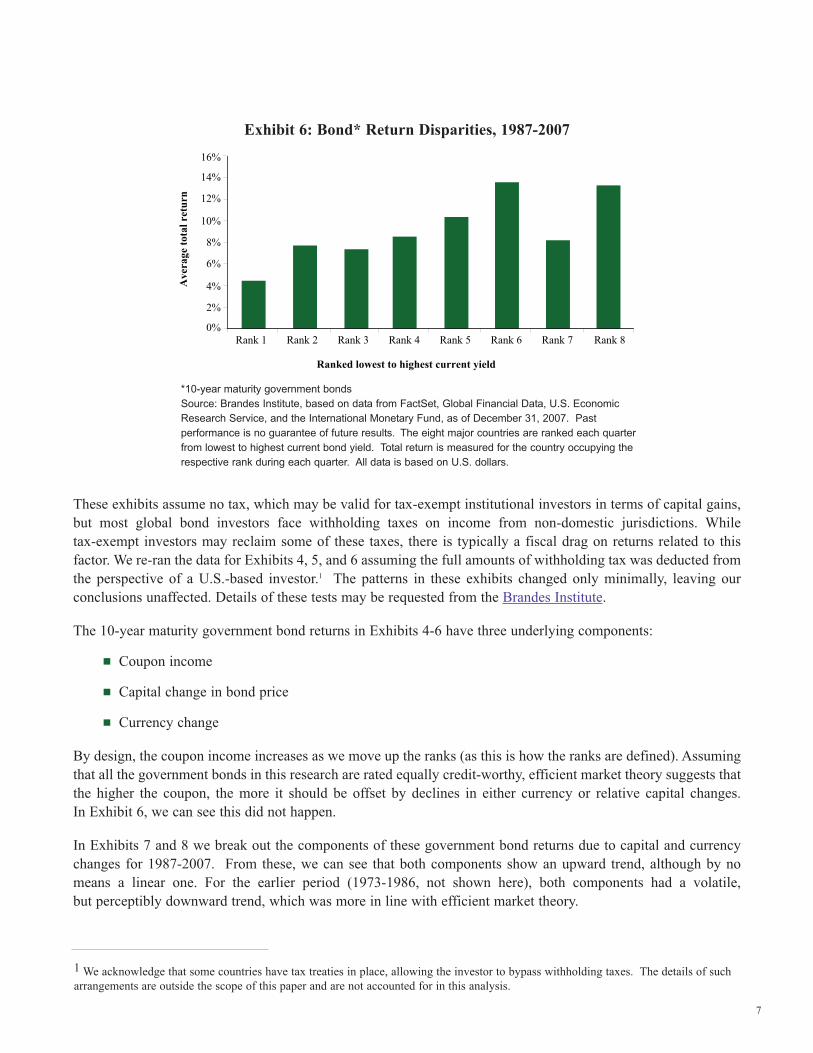
Exhibit 6: Bond* Return Disparities, 1987-2007
*10-year maturity government bonds
Source: Brandes Institute, based on data from FactSet, Global Financial Data, U.S. Economic
Research Service, and the International Monetary Fund, as of December 31, 2007. Past
performance is no guarantee of future results. The eight major countries are ranked each quarter
from lowest to highest current bond yield. Total return is measured for the country occupying the
respective rank during each quarter. All data is based on U.S. dollars.
These exhibits assume no tax, which may be valid for tax-exempt institutional investors in terms of capital gains,
but most global bond investors face withholding taxes on income from non-domestic jurisdictions. While
tax-exempt investors may reclaim some of these taxes, there is typically a fiscal drag on returns related to this
factor. We re-ran the data for Exhibits 4, 5, and 6 assuming the full amounts of withholding tax was deducted from
the perspective of a U.S.-based investor.1 The patterns in these exhibits changed only minimally, leaving our
conclusions unaffected. Details of these tests may be requested from the Brandes Institute.
The 10-year maturity government bond returns in Exhibits 4-6 have three underlying components:
▄ Coupon income
▄ Capital change in bond price
▄ Currency change
By design, the coupon income increases as we move up the ranks (as this is how the ranks are defined). Assuming
that all the government bonds in this research are rated equally credit-worthy, efficient market theory suggests that
the higher the coupon, the more it should be offset by declines in either currency or relative capital changes.
In Exhibit 6, we can see this did not happen.
In Exhibits 7 and 8 we break out the components of these government bond returns due to capital and currency
changes for 1987-2007. From these, we can see that both components show an upward trend, although by no
means a linear one. For the earlier period (1973-1986, not shown here), both components had a volatile,
but perceptibly downward trend, which was more in line with efficient market theory.
7
1 We acknowledge that some countries have tax treaties in place, allowing the investor to bypass withholding taxes. The details of such
arrangements are outside the scope of this paper and are not accounted for in this analysis.
Ranked lowest to highest current yield
0%
4%
2%
6%
8%
10%
12%
16%
14%
Rank 1 Rank 2 Rank 3 Rank 4 Rank 5 Rank 6 Rank 7 Rank 8
Ave
rage
tota
l ret
urn
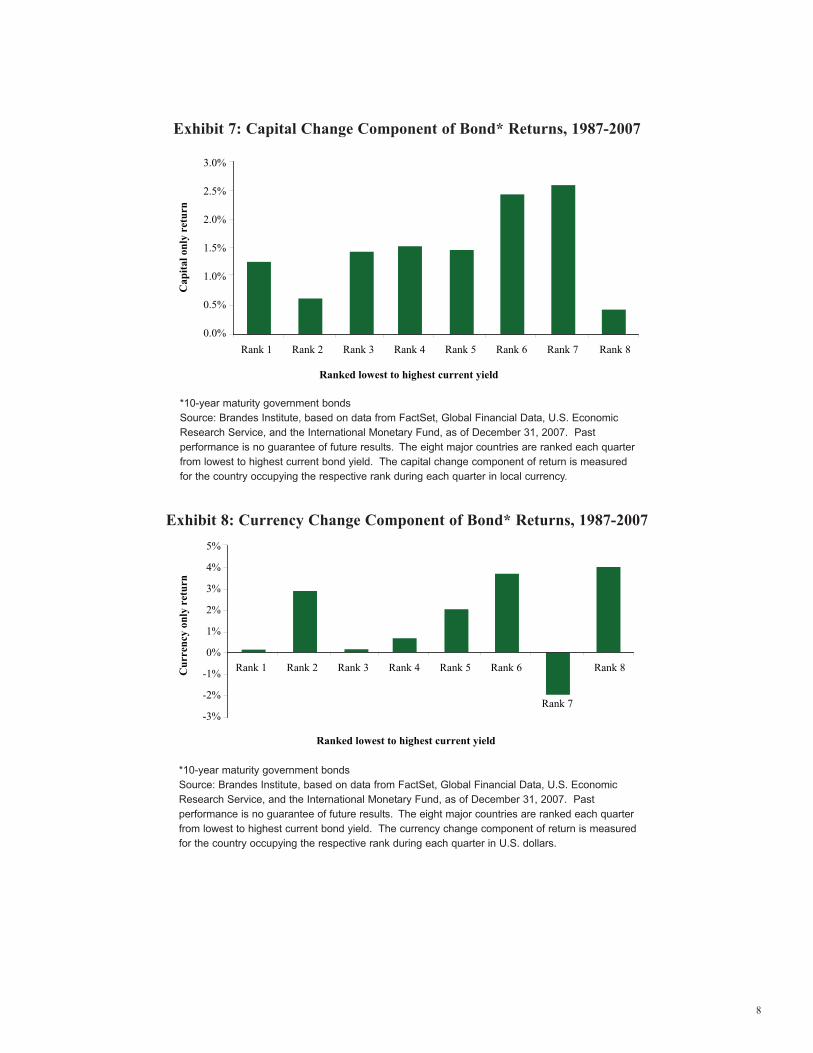
Exhibit 7: Capital Change Component of Bond* Returns, 1987-2007
*10-year maturity government bonds
Source: Brandes Institute, based on data from FactSet, Global Financial Data, U.S. Economic
Research Service, and the International Monetary Fund, as of December 31, 2007. Past
performance is no guarantee of future results. The eight major countries are ranked each quarter
from lowest to highest current bond yield. The capital change component of return is measured
for the country occupying the respective rank during each quarter in local currency.
Exhibit 8: Currency Change Component of Bond* Returns, 1987-2007
*10-year maturity government bonds
Source: Brandes Institute, based on data from FactSet, Global Financial Data, U.S. Economic
Research Service, and the International Monetary Fund, as of December 31, 2007. Past
performance is no guarantee of future results. The eight major countries are ranked each quarter
from lowest to highest current bond yield. The currency change component of return is measured
for the country occupying the respective rank during each quarter in U.S. dollars.
8
Ranked lowest to highest current yield
0.0%
0.5%
1.0%
1.5%
2.0%
3.0%
2.5%
Rank 1 Rank 2 Rank 3 Rank 4 Rank 5 Rank 6 Rank 7 Rank 8
Cap
ital o
nly
retu
rn
Ranked lowest to highest current yield
-3%
-1%
-2%
0%
1%
2%
5%
4%
3%
Rank 1 Rank 2 Rank 3 Rank 4 Rank 5 Rank 6
Rank 7
Rank 8Cur
renc
y on
ly r
etur
n
VI. Conclusions
This analysis suggests that a significant change occurred in the behavior of the world’s bond and currency markets
in the mid-1980s. A detailed economic analysis is beyond the scope of this research. However, it is worth noting
that during the earlier period (1973-1986) inflation was generally higher than in the last 20 years (1987-2007), and
higher-yielding currencies experienced more frequent instances of depreciation. Bond markets worldwide
experienced a long-term bull market starting in the early 1980s, with reduced volatility and less investor concern
over the fundamental attractions of bonds. In the context of this study, for example, the current yield spread
between the number one and number eight ranked countries averaged 8.5% in the 1973-1986 period, but this
dropped to 5.1% during 1987-2007.
To what extent was this change in conditions related to the observations in this research? In our view, it would be
dangerous to assume that the apparent inefficiencies of the 1987-2007 period will continue indefinitely. They may
indeed be characteristics of the more stable bond environment over the last two decades. On the other hand, the
existence of over 20 years of data that appears to contradict efficient market theory cannot be dismissed as
irrelevant in our view.
Economic conditions aside, what might lie behind this seemingly “irrational” market behavior?
1. Tax preferences make interest income less desirable than currency or capital gains.
As noted previously, taking in net foreign interest income could trigger withholding or income taxes for investors,
while any capital gains/losses in currency trades may attract a lower or zero tax rate. Hence the “market” might
demand an interest rate premium when finding its efficient equilibrium. While detailed tax implications are outside
the expertise and scope of this article, we note from our “stress-testing” of the data on different withholding tax
rates that while the tax impact may erode some of the carry trade advantage, we do not believe this is material, and
so we reject this theory.
2. Behavioral factors may be behind the inefficiency of the market.
We hypothesize that global currency and bond market participants implicitly interpreted a higher yielding
government bond to have a higher risk of depreciation, either from currency or bond price (or both). Until 1986,
this approach was consistent with market behavior. Higher current income in the 1973-1986 period was typically
offset by relative losses in currency and bond prices. As previously noted, this effect has not been apparent for
over 20 years. In essence, it seems that investors avoided the higher-yielding markets in the apparent belief that
those countries with low yields were safer, or more “comfortable” to own. This overpayment for “comfort” is a
behavioral anomaly with which value investors are well familiar, as it underpins the rationale for the Brandes
Institute findings of historical outperformance by value relative to glamour stocks (see Brandes Institute research:
Value vs. Glamour). We would argue that participants are likely to be reducing their potential returns when they
overpay for “comfort,” whether it be in owning glamour stocks, or as in the case of global government bonds,
low-yielding securities.
In conclusion, our goal in publishing this research is not to suggest that the “carry trade” effect will continue
indefinitely. The purpose is to demonstrate that behavioral anomalies can and do persist in the markets for extended
periods, not only in equities and currencies (as noted in our earlier work) but also in fixed income. By providing
these results and our comments, we encourage our readers to seek out future opportunities to apply behavioral and
valuation analysis to potentially benefit from supposedly “efficient” markets.
9
This material was prepared by the Brandes Institute, a division of Brandes Investment Partners®. It is intended for informational purposes only. It is not meant to be an offer, solicitation, or recommendation for any product or services.The foregoing reflects the thoughts and opinions of the Brandes Institute. Past performance is not a guarantee of futureresults. No investment plan or strategy can assure a profit or protect against loss.
International and emerging markets securities entail risk such as currency fluctuation and political instability. Unlike Treasurybonds and bills, stocks are not backed by the full faith and credit of the United States. Stock and bond prices will experiencemarket fluctuations. Please note that the value of government securities and bonds in general have an inverse relationshipto interest rates. Bonds carry the risk of default, or the risk that an issuer will be unable to make income or principalpayment. There is no assurance that private guarantors or insurers will meet their obligations. The credit quality of theinvestments in the portfolio is no guarantee of safety or stability of the portfolio.
Copyright© 2008 Brandes Investment Partners, L.P. ALL RIGHTS RESERVED. Brandes Investment Partners® is a registeredtrademark of Brandes Investment Partners, L.P. in the United States and Canada. Users agree not to copy, reproduce,distribute, publish, or in any way exploit this material, except that users may make a print copy for their own personal, non-commercial use. Brief passages from any article may be quoted with appropriate credit to the Brandes Institute. Longerpassages may be quoted only with prior written approval from the Brandes Institute. For more information about BrandesInstitute research projects, visit our website at www.brandes.com/institute.
101008