hat creek project -...
TRANSCRIPT

I
BRITISH COLUMBIA HYDRO AND POWER AUTHORITY
HAT CREEK PROJECT
Environmental Research and Technology Inc. - Air Quality ana Climatic Effects of the Proposed Hat Creek Project Report - Appendix F - The Influence of the Project on Trace Elements in the Ecosystem - April 1978.
ENVIRONMENTAL IMPACT STATEMENT REFERENCE NUMBER: 149

Document P-974-F-F July 1978
Prepared for British Columbia Hydro and Power Authority
Air quality and dimatic effects of the DroDosed
Hat Cregk pioject
Appen.dix F The influence of the project
Ion trace elernents in the ecosystem
2030 Alameda Padre Serra Santa Barbara, California 93 103
ENVIRONMENTAL RESEARCH a TECHNOLOGY. INC. CONCORD. MASS * LOS ANGELES * ATUNTA * SAN JUAN. P R. FORT COLLINS, CO. * WASHINGTON, D.C. * HOUSTON *CHICAGO
PRINTED IN U.S.A.

I
m .
I
I --
TABLE OF CONTENTS
List of Tables List of Figures
F1.0 INTRODUCTION
F3.D METHODOLOGY
F3.2 Sample Preparation F3.1 Sample Collection
F3.3 Sample Analysis (a) Spark Source Mass Spectrometry
( c ) Plasma Atomic Emission Spectroscopy (PES) (b) Atomic Absorption Spectrophotometry
( d ) Specific Ion I3ectrode Method F3.4 Data Analysis
F4.0 SOURCES OF TRACE ELEMENTS
F4.1 Leachable Source Materials F4.2 Cooling Tower Source Materials F4.3 Power Plan t Source Materials
( a ) Test Burns (b) Coal Analyses (c) Emissions
F5.0 RECEPTOR AND TRANSMISSION MEDIA ANAYSIS
F5.1 Receptor Analysis (a) Antimony (Sb) [b) Arsenic ( A s ) c ) Beryllium (Bel d ) Boron (B)
( f ) Chromium (Cr) ( e ) Cadmium (Cd)
(9) Cobalt (Co)
( i ) Fluorine (F) ( h ) Copper ( C U I
(j) Gallium (Ga) (k) Lead ( P b ) ( 1 ) L i t h i u m ( L i ) ( m ) Mercury (Hg) (n) Nickel (Ni) (0) Selenium (se) ( p ) Stront ium ( S r ) (4 ) Thallium ( T l ) ( r ) T i n (Sn)
1v . v i i
F1-1
F2-1
F3-1
F3-1 F3-6 F3-9 F3-10 F3-11 F3-2 F3-15 F3-15
F4-1
F4-1 F4-5 F4-5 F4-8 F4-26 F4-27
F5-1
F5-3
F5-5 F5-7 F5-12 F5-14 F5-18 F5-23 F5-29 F5-32 F5-39 F5-41
F5-53 F5-46
F5-63 F5-56
F5-67 F5-73
F5-77 F5-75
i

TABLE OF CONTENTS (Continued)
(s) Vanadium ( V ) ( t ) Z i n c (Zn) .(u) Zirconium (Zr)
F5.2 Transmission Media Analysis
F6.0 TRACE ELEMENT MOVEMENT AND ACCUMULATION
F6.1 Trace Elements o f Concern F6.2 P r inc ipa l Sources o f Trace Elements From the
Coal Mine and Power Plant (a) Coal Mine (b) Power Plant
Trace Elements (a) Arsenic (As) (b) Cadmium (Cd) (c) Chromium (Cr) ( 4 Copper (CUI (e) Fluorine (F) (f) 'Lead (Pb) (9) Mercury (Hg) ( h ) Vanadium ( V ) (1) Zinc ( Z n )
F6.3 Environmental Pathways and U l t i m a t e Fate o f
F6.4 S u m r y
F7.0 IMPACT ASSESSMENT
F7.1 Coal Mine (a) Coal, Overburden, and Waste Rock Leachates (b ) Fug i t i ve Oust
F7.2 Power Plant (a) Stack Emissions (b) Ash Basin (c) Cooling Tower Drift
F8.0 MITIGATION
F9.0 MONITOR1I:G PR0GW.t
F9.1 Source Monitoring F9.2 Receptor Monitoring
(a) Number and Location of Sampling Stat ions (b) .Receptors Sampled a t Each S i t e ( c ) Trace Elements Analyzed i n Each Receptor
E 5 2 F5-84 F5-91
F5-92
F6-1
F6-1
F6-3 F6-3 F6-6
F6-9 F6-10 F6-12 F6-15
F6-17 F6-17
F6-21 6 - 2 3 F6-26 F6-28 F6-30
F7-1
F7-1 F7-1 F7-2
F7-2 F7-2 F7-11 F7-13
F8-1
F9-1
F9-1 F9-2
F9-4 F9-3
F9-5
ii

TABLE OF CONTENTS (continued)
( e ) Sample Collection, Preparation and (d) Sampling Intensity
Analysis
F9.3 Other Reconmended Studies
F10. I GLOSSARY
F11.1 LITERATURE CITED
” F9-E
F9-11
F9-11
F10- 1
F11-1
ADDENDUM A Trace Element Concentration in Receptors-October 1976 FA- 1
i i i

LIST OF TABLES
TABLE F3-1
F3-2
F3-3
F3-4
-
F4- 1
F4-2
F4-3
F4-4
F4-5
F4-6
F4-7
F4-8
F4-9
F4-10
F4-11
F4-12
F4-13
F5-1
F5-2
F5-3
F5-4
Site character is t ics of terrestr ia l t race element sampling locations
Receptor materials collected a t each sampling location for trace. element analysis
Composition of f i sh and small mama1 samples subnitted for trace element analyses
Mean detection limits ( D L ) and lowest quantitatively determinable concentrations (LQO) for 20 trace elements by plasma atomic emission spectroscopy
(concentrations i n mg/kg)
trace elements in various mine and power p l a n t
Chemical characterist ics of cooling water and storage basins
Characteristics of various coal samples and CCRL cooling tower d r i f t
t e s t burn conditions Element concentrations (mg/kg or ppm) i n Hat Creek
coal and ash f r o m CCRL t e s t bruns Results and quality control checks using U.S. National
Bureau of Standards coal and f l y ash standards Mean concentrations (mg/kg or ppm) and coefficients
of variation ( C V ) f o r element concentrations
Operational conditions a t the Battle River Power Plant i n coal and ash from the CCRL t e s t burn
Trace element concentrations (mg/kg or ppm) i n diamond test burn using Hat Creek coal
mean coal dril l cores that collectively represent mine
Battle River test burn coals t o mine mean coal
elements (mg/kg)
three samples o f Hat Creek Coal
Creek Power P l a n t based on CCRL and Battle River t e s t b u r n analyses
detailed environmental review
receptor material collected d u r i n g October 1976
receptor material collected during October 1976
receptor material collected dur ing January and May 1977
Total extractable sal ts from various source materials
Potential amounts (metric tons) of water soluble
Trace element concentration ratios for CCRL and
Battle River test burn coal analyses for trace
Operating data for CCRL p i lo t test b u r n runs o n
Projected emissions of t race elements from the Hat
Characteristics of trace elements selected fo r
Average concentration (ppm) of Antimony ( S b ) i n
Average concentration (ppm) of Arsenic (As) in
Average concentration (ppm) o f Arsenic (As) in
PAGE - F3-3
F3-5
F3-a
F3-14
F4-2
F4-4
F4-6
F4-9
F4-13
F4-17
F4-19
F4-27
F4-29
F4-33
F4-38
F4-40
FJ-43
F5-2
FS-6
F5-8
F5-9
i v

W
m
I
I
I
..
1
F5-'11
F5-.12
F5- 13
F5- 14
F5-15
F5- 16
F5-17
F5-18
F5-19
F5-20
F5-21
F5- !?
F5- !3
F524
F5-25
F5,.26
F5-27
Average concentration (ppm) o f Beryllium (Be) in receptor mater,ial collected d u r i n g October 1976
Average concentration (ppm) o f Boron (B) i n receptor material collected during October 1976
Average concentration (ppm) o f Cadmium (Cd) in receptor mater.ia1 collected d u r i n g October 1976
Average concentration (ppm) o f Cadmium (Cd) in receptor mater- a1 collected during January and May 1977
Average Concentration (ppm) o f Chromium (Cr) i n
Average concentration (ppm) o f Chromium (Cr) i n receptor material collected d u r i n g October 1976
receptor material collected d u r i n g January and May 1977
receptor material collected during October 1976
receptor material collected during October 1976
and May 1977 receptor material collected d u r i n g Jaunary
receptor material collected d u r i n g October 1976
and May 1977 receptor material collected during January
Average concentration (ppm) o f Gallium (Ga) i n receptor material collected during October 1976
Average concentration (ppm) o f Lead ( P b ) i n receptor material collected during October 1976
Average concentration (ppm) o f Lead ( P b ) i n receptor material collected during January and May 1977
Average concentration (ppm) o f L i t h i u m (Li ) i n
Average concentratio? (ppm) o f Mercury (Hg) i n receptor materi,al collected d u r i n g October 1976
Average concentratio,? (ppm) o f Mercury (Hg) i n receptor materhl collected d u r i n g October 1976
receptor material collected during January and May 1977
Average concentration (ppm) o f Nickel (Ni) i n receptor material collected during October 1976
Average concentration (ppm) o f Selenium (Se) i n receptor material collected dur ing October 1976
Average concentration (ppm) o f Strontium (Sr) i n receptor material collected during October 1976
Average concentration (ppm) o f Thallium ( T l ) in receptor material collected durin October 1976
Average concentration (ppm) o f T i n (SnS in receptor material collected during October 1976
Average concentration (ppm) o f Vanadium ( V ) i n receptor materi:l collected during October 1976
Average concentration (ppm) o f Cobalt (Co) i n
Average concentratic'n (ppm) o f Copper ( C u ) i n
Average concentraticn (ppm) o f Copper (Cu) i n
Average concentration (ppm) o f Fluorine (F) i n
Average concentration (ppm) o f Fluorine ( F ) i n
PAGE - F5-13
F5-15
F5-19
F5-20
F5-24
F5-26
F5-30
F5-23
F5-35
F5-40
F5-41
F5-45
F5-47
F5-48
F5-54
F5-57
F5-58
F5-64
F5-68
F5-74
F5-7G
F5-78
F5-80
V

PAGE - TABLE - F5-28
F5-29
FS-30
Fj-31
F5-32
F6-1
F6-2
F7-1
F7-2
F7-3
F7-4
F7-5
F9-1
Average concentration (ppm) of Vanadium ( V ) i n
May 1977 receptor material collected d u r i n g January and
material collected dur ing October 1976
material collected d u r i n g January and May 1977
receptor material collected d u r i n g October 1976
collected i n h i g h volume samplers dur ing spring 1977
Soil characteristics i n the Hat Creek study area (October 1976)
Stream sediment characterist ics i n Hat Creek study area (October 1976)
Ratio of selected trace element emissions to SO2 '
Annual average a i r concentrations, deposition f l u x emissions
and soil concentration increases for selected trace elements w i t h i n different zones near t h e proposed Hat Creek power plant
trace elements assuming a l l elements are evenly deposited w i t h i n a. 25 !un radius of the stack
year) from the airborne releases of model 2000-
Projected annual increase (mg/kg) of selected trace N ( e ) power plants
draft cooling towers elements i n soi l due to d r i f t from ,two natural
Sample Sizes required to detect specified responses (50,100 and 200% of baseline levels) o f different receptors for several o f the trace elements of concern
Average concentration (ppm) of Zinc ( Z n ) i n receptor
Average concentration (ppm) of Zinc (Zn) i n receptor
Average concentration (ppm) o f Zirconium (Zr) i n
Results o f selected trace element analysis o f TSP
Projected soil concentration increases of selected
Maximum individual dose commitments (man rem per
F5-81
F5-85
F5-87
F5-93
F5-94
F6-5
F6-7
F7-4
F7-5
F7-10
F7 -1 2
F7-14
F9-8
v i

FIGJRES F3-1 F6- 1
"
F6-2
F6-3
F 6 4
F6- 5
F6- 5
F6- 7
F6-3
F6- 3
F7- 1
F7- 2
LIST OF FIGURES
- PAGE
Trace element sampling locations Poten t ia l pathways o f Arsenic (As) movements
Po ten t i a l pathways o f Cadmium (Cd) movement through Hat Creek ecosystem components
Po ten t i a l pathways o f Chromium (Cr) movement through Hat Creek ecosystem components
Po ten t i a l pathways o f Copper (Cu) movement through Hat Creek ecosystem components
Poten t ia l pathways o f F luor ine ( F ) movement through Hat Creek ecosystem components
Poten t ia l pathways of Lead (Pb) movement through Hat Creek ecosystem components
Poten t ia l pathways o f Mercury (Hg) movement through Hat Creek ecosystem components
Poten t ia l pathways o f Vanadium ( V ) movement through Hat Creek ecosystem components
Poten t ia l pathways of Z inc (Zn) movement through Hat Creek ecosystem components
Predicted annual .aver83ged trace element through Hat Creek ecosystem components
Predic ted annual s a l t d e p o s i t i o n i n kg/km /year concentrat ion zones
( l b lac re l yea r ) d'Je t o d r i f t from proposed ( two) na t iona l .d ra f t coo l ing towers
2
F3-2
F6-11
F6-13
F6-16
F6-18
F6-19
F6-22
F6-24
F6-27
F6-29
F7-8
F7-15
v i i

F1.0 INTRODUCTION
Environmental Research E Technology, Inc. (ERT) has completed th i s report under the Terms of Reference fo r Appendix E3 of the Detailed Environmental Studies for the Brit ish Columbia Hydro and Power Authority's Hat Creek Project. The primary objective of the project has been ttr
identify those trace elements in Hat Creek coals and source materials t h a t present a potential hazard t o Hat Creek and v ic in i ty ecosystems. Pursuant t o achieving this important objective project activities have focused on:
1. identifying which o f the major trace elements in source m t e r i a l s were a p t t o be transmitted t o biological systems and the potential for t race element enrichment in Hat Creek receptors;
2. ascertaining major s i t e s and modes of uptake and accumulation o f important trace elements in Hat Creek f lora and fauna and the role of t race elements in the normal functioning of ecosystem components;
3. determining to the extent permitted by the avaiTable in fo rma t ion , toxic (i.e., poisonous) concentrations, tolerance levels 2nd bioaccumulation factors of selected trace elements i n extant biological systems; and
4. developing a l i terature-derived trace element norm for compari- son w i t h existing environmental concentrations.
I -
I
D -
T h i s infonation provides a basis for t race element impact assessmert, re- commendations f o r m i t i g a t i o n measures, and development of a long-term monitor- ing program. For impact assessment, al l aspects o f the Hat Creek Project, including si te preparation, coal mining and transport , thermal power plant stack and cooling tower emissions, coal, overburden, and waste rock storage and solid waste disposal have been evaluated with reference t o trace elements.
The scope of the i t u d y has been limited to "trace elements, " defined as any elements in concentrations ranging from the lowest analytical detection l imi t t o 0.1% [lo00 mg/kg or parts per million ( p p m ) ] . Throuahout the study, the number of elements considered has been progressively reduced from most o f the elements i n the periodic table t o only those o f importance in an environmental assessment. This has been done in a ser ies of steps based on analysis o f trace elements in existing ecosystem components i n the vicini ty of the proposed s i te , analysis o f Hat Creek coal, coal ash and stack missions sampled during t e s t burns, and a l i t e r a tu re review of environmental pathways and potential trace element toxicity. In t h i s manner, the report focuses on those elements that are considered significant because o f their re la t ively h i g h concentrations i n source materials or waste products, their presence in existing Hat Creek receptors in greater than."nonnal" concentrations, and/or their identification i n the l i t e r a tu re as potentially toxic, subject to bioaccumulation, o r o f other environmental concern.
ERT has evaluated sources of trace elements by us ing information provided by B.C. Hydro, Ebasco'Services of Canada Limited, and other B.C. Hydro consultants. Solid, particulate sources including coal, overburden, ashes, and stack effluents have been direct ly sampled, especially by means of t e s t burns'conducted using Hat Creek coal. Liquids, including leachates and cooling water, have also been sampled and analyzed.
Easeline ecosystem trace element. concentrations have been established i n a three phase sampling programcovering fall 1976, and winter and spring 1977. The 1976 sampling was the most extensive and on these samples a broad element scan was conducted. Analyses o f winter and spring samples were for selected elements o f concern. A t se lected s i tes , samples o f surface water, stream sediment, soil , airborne particulates, and various species of vegetation and animal 1ife.were taken.
Seventy three elements were analyzed in the f irst phase of the study. Based on element concentration i n source and ecosystem materials, potential element toxici ty t o biological systems, and potential element

I
I ~~
m
I
I
r
L
L
D ~.
1 ~.
mobility th rough the environment, elements of most environmental concern were selected for additional study. Trace element impact was assessed from a superposition o f projected Hal: Creek contributions o f trace elements t o natural or existing concentrations. Use was made of ERT's predictions of tract! element atmospheric dispersion o f tall stack emissions. The diffusion mode'ing results are discussed ' n Appendix 6, Modeling Methodology. Also included in this report are discussions of possible mitigation and recom- mendiltions o f programs t o monitor the long term ef fec ts of trace elements emanating from project act ivi ty , . Conclusions derived from project effor ts are provided in Section F2.0.
The lack o f standard and universally accepted techniques for conducting comp'ex t race element studies must be recognized when evaluating methods and resu' ts presented in this report . Wherever possible, most comnonly recom- mended samplingzz8 and analytica1229'230y231 methods were used. Methods '
util .zed in this study are documented so tha t any future investigations i n th is area can duplicate study techniques and a r r i v e a t r e s u l t s t h a t can be compared to data presented in this report.
I
I
I
8
I
- I
toxic t o vegetation; gi%nerally non-toxic t o animals; concentrations in samp'led receptors compare favorably w i t h 1 i terature values.
3. Zinc - concentrated on f l y ash par t ic les ; high levels in coal, overburden, waste rock, and ash leachates; h i g h po- ten t ia l for bioaccumulation; moderately toxic t o vegetation; re la t ively non-toxic to birds and mmals; concentrations i n sampled receptors are similar t o levels reported i n the 1 i terature .
[nformation sumnarized above for the elements of concern together w i t h project technical design data and information supplied by other project ac- t i v i t i e s ( e .g . , a i r qua l i t y modeling) provided the basis for assessing the poten,:ial impact o f the project on natural trace element concentrations i n Hat Creek ecosystems. Projections of ground level concentrations of t race elements emanating from the power plant stack as provided by ERT's air quali ty model indicate that no appreciable increases in trace element concentrations i n biota will result.
l'ugitive dust emissions and cooling tower d r i f t w i l l be highly localized and w'ill not be important source!; of t race elements t o receptors in the Hat Creek area. Overburden, waste rock, and coal ash piles will contain large amoun::s of some trace elements, such as arsenic, copper and zinc, i n water solub'e forms. However, current technical design information indicate that elements will be mostly retained either within, or near, storage piles o r in seepage treated t o remove t race elements. 241
lladioactive elements (uranium, thorium, and the i r daughter products) will be em'itted along with other tract! elements from the power plant. Levels of uranium and thorium i n coal from Hat Creek are comparable t o amounts in typicill coal burned in the United States. 233 Based on predictive model s t u d i t s recently made i n the United States, radiation levels near a 2300 megawatt coal-fired power plant with 99.7% flyash removal are below U.S. guide' ines. 234

Provided that technical design infomation and data provided by the a i r qual i ty model are representative and barring any accidents o r natural catas- trophes, no significant - irnpact.on-local- .or xegional-ecosystemis - - . . . - expected . . -
. f rw release o f ^ t ~ a ~ e - ~ e r n e n t s , b y ~ - t h e HatLreek- project .

F2.0 SUMMRY
"race elements existing i n coals, overburden, and waste rock wi l l be released t o the environment d u r i n g coal m i n i n g and power aenerating o'Jera- tions of the Hat Creek Project. The primary objective of this study nas been t o identify, those trace elements whose concmtrations and dis t r ibut io: is in ecosy5,tem components may be poterltially affected by project activitie::. Analyris of source materials (coal, overburden, waste rock and ash di,:posal pile leachates, fugitive dust emissions, stack emissions from test burns, and projec.ted cooling tower d r i f t ) , determination of existing trace element concertrations in selected ecosystem receptors, and an extensive l i terature review of t race element ecology provided the information base for evaluating and selecting elements of major concern. Primary cr i ter ia for e l iminat ing a l l bLt 21 t race elements as being of concern t o the Hat Creek Projeci: were toxici ty potent ia l to plants and animals and potential for release anti rela- tivelq wide dis t r ibut ion from project act ivi t ies . Of these 21 trace elements, nine here ascertained t o be of greatest environmental concern i n loca'' eco- systens because of the i r re la t ive ly h i g h concentration i n source materials and their potential t o be highly mobile or readily accumulated i n receptors. These t race elements are arsenic, cadmium, chromium, copper, fluorine,, lead, mercury, vanadium, and zinc. Detailed and quantified discussions of these elements i n source and ecosystem materials are given in Sections F4.0, F5.0, F6.0, and F7.0. Qualitative sumary information for each element is presented below:
1. Arsenic - concentrated on f l y ash particles*; relatively h i g h levels i n Hat Creek coal, waste rock, overburden, and bottom ash leachates; high mobility in alkaline media ( i . e . , Hat Creek soils, water, and stream sediment); high potential for bioaccumulation; potentially very toxic t o plants and animals; exhibits relatively h i g h natural 1 eve1 s, as compared t o values reported in the 1 i t e ra ture , i n receptors sampled, especially soil, stream sediment and small mama1 s.
* Un1e:s qualified otherwise, fly ash includes both ash collected by precipi ta tors and ash emitted fpom the gas stack.

2. Cadmium - slightly concentrated on ffy ash particles; high bioaccumulation potential; moderate to high toxicity to plants and animals; natural concentrations are hioher than those reported in the literature for soil and stream sediment.
3. Chromium - concentrated on fly ash particles; moderate po- tential for bioaccumulation; relatively toxic to plants and animals; high concentration in fish and small mamal samples.
4. Copper - concentrated on fly ash particles; relatively high levels in coal, overburden, waste rock, and ash leachates; moderate potential for bioaccumulation; relatively toxic at high concentrations in biota; high concentrations in small m m l samples.
5. fluorine - relatively high levels in stack emissions; potential for bioaccumulation of airborne fluoride; gaseous fluorine cmpounds potentially very toxic to plants and animals; concentrations i n Hat Creek receptors are higher than values reported in the literature for some soil, stream sediment, and grass samples.
6. Lead - concentrated on fly ash particles; potential for bioaccumulation of airborne lead compounds; moderately toxic to plants and animals; concentrations are higher than literature values for water and small mamal samples.
7 . Mercury - emitted from stack primarily as a gas; high po- tential for bioaccumulation; certain mercuric compounds are very toxic to biota; concentrations are consistent with values in the literature for sampled receptors.
8. Vanadium - concentrated on fly ash particles; mobile in alkaline media; potential for bioaccumulation; moderately

F3.0 METHODOLOGY
8
I
I .
F3.1 Sample Collection
,Air TSP ( to t a l suspended pa'ticulates) samples were collected by B . C . Hydro using high volume sampler!;. Samples were obtained from four s i tes dur in ' 3 spring 1977 i n the Hat Creek area and submitted t o ERT for trace elemelt analyses (see Figure F3-'I).
:Samples of coal and coal ash from p i l o t t e s t burns were provided by Canad,ian Combustion Research Laboratories.245 A complete description of these samples i s given in Section F4.3., Coal, overburden, waste rock, and coal ash leachate samples were collected and leachate testing performed by Acrss Consu'l t an ts .
Iliotic and abiot ic samples fo r trace element analysis were collected from "ive t e r r e s t r i a l and four aquatic si tes d u r i n g October 1976, and January and May, 1977. Four of the f ive t e r res t r ia l s i tes were located within a 25 kilometer radius (range of local a i r qual i ty model) of the p l an t s i t e and the f i f th s i te (Ashcrof t ) was located just outside this radius. Aquatic !sites were 'ocated in Hat Creek and the Bonaparte River. Aquatic S i te 1 wa:; located on upper Hat Creek j u s t above the . proposed p l an t s i t e and the No. 1 coal deposit, ' b u t near overburden and waste rock storage areas. Aquatic Slte 2 was located on lower Hat Creek downstream from the proposed project. Both of these locations may be affected by the project. Sampling locations on the Bonaptirte River included Site 3 above Hat Creek and S i te 4 below Hat Creek. Except: fo r any deposition of pollutants from the Gas s tack, Si te 3 should n o t , be affected by project act ivi t ies . Other considerations i n sample s i t e location for both aquatic and te r res t r ia l s ta t ions were accessabili ty, preserce and ease o f sampling of desired receptor materials, and ava i lab i l i ty of surportive information a t the s i te (e .g . , a i r qua l i ty da ta ) . Ter res t r ia l and acuatic sample s i te locat ions are shown i n Figure F3-1. Ter res t r ia l s i te character is t ics are provided in Table F3-1,
Criteria considered in selecting receptor materials included: ( 1 ) representation of general classes of receptors i n the Hat Creek vicini ty ,
F3-1

0 TERRESTRIAL SITES 1 Pavillion Xountain 2 Lower Hat Creek 3 Arrowstone Creek 4 Cornwall Mountain 5 Ashcroft
0 AQUATIC SITES 1 Upper Hat Creek 2 Lower Hat Creek 3 Upper Bonaparte River 4 Lower Bonaparte River
0 HIGH VOLUME AIR SAMPLER
BRITISH COLUMBIA HYDRO AND POWER AUTHORITY
HAT CREEK PROJECT
OiTAiiiD ENviRONMtNfAL STUDIES
Figure F3-1. Trace Element Samplins Locations

1. Table F3-1
S i t e c h a r a c t e r i s t i c s o f t e r r c l s t r i a l t r a c e e l e m e n t s a m p l i n g l o c a t i o n s
- S i t e Number Name E leva t ion (m) Slope (degrees) Aspect -
1 Pavi 11 i o n Moun t a i n 2089 20-25 SE
2 Lower Hat Creek 750 <10 sw 3 Arrowstone Creek 1500 20 WSb!
4 Cornwall Mountain 2036 e10 NW
5 Ashcro f t 1250 10-20 u
F3-3

( 2 ) importance t o ecosystem structure and function (or indicator o f the accumulation of selected trace elements), ( 3 ) avai lab i l i ty , and (4 ) ease of sampling. Materials collected a t each sampling location and primary considerations for these selections are orovided in Table F3-2.
Although large mamnals and birds are important receptors o f trace ele- ments, habitats for these animals range over a wide area. Thus, impacts fmm the Hat Creek project on these high1.y mobile animals i s d i f f i c u l t t o monitor. Additionally, collection of a suff ic ient number o f samples t o de- fine trace element levels i n these animals i s d i f f i c u l t and potentially harm- ful to existing populations.
A t each aquatic and t e r r e s t r i a l s i t e , t h ree samples of each receptor '.were collected. Samples were collected d u r i n g fa l l , winter , and spring.
Shrubs, grasses, small mamals, and fish were n o t collected i n winter when plants and animals were generally less available and more d i f f i cu l t t o sam- ple. Sampling methodologies are discussed below for each receptor.
1. Water - Three samples were collected from midstream by submerging a I - l i t e r polypropylene bot t le just beneath the surface w i t h the mouth pointed upstream. Bottles had been acid-washed w i t h 10% ni t r ic acid. Samples were fixed w i t h 5 ml of 5 0 % nit r ic acid a t the time o f collection and appropriately labeled. Information provided on labels for water and all other samples included type of sampled materials, sample s i t e number and location, date of collection, and col lector(s) .
2. Soil and Stream Sediment - Samples o f soil and stream sediment were collected from tne t o p 5 cm of surface material w i t h an acid-washed stainless steel trowel. Three soil samples were randomly collected from an area of approximately 200 square meters a t each s i t e . Stream sediment samples were collected along a 10 meter stretch of the stream. Each sampled contained a b o u t 500 cc of material. Samples were double-bagged i n clean polyethylene containers and the label placed i n the outer bag t o avoid contact w i t h sampl e.
F3-4

1 Table F3-2
m Receptor materials collected at each sampling location
for t race element analysis
Habitat Type Receptors Sampled Primary Factor( s ) for Selection
Aquatic Water Important transmission media
Terrestrial
Streain sediment Important sink and transmission media
RainbIJw t rout ( S a h gairdneri) species and aquatic carnivore
Economically important game
Soil media Important sink and transmission
Shrub Wi 1 low ( S a l k )
Food source for browsers, abundant throughout study area, eas i ly sampled
Important food source to grazers ( i . e . , c a t t l e )
Grass Bunchgrass (Agropyron spicatwn)
Sedge (Carex sp.)* Only grass species available for col lect ion a t Si te 4 (Cornwall Mountain)
Lichen (Letlzaria v u l p i n a )
Known indicator of trace element pollution
Sma 1 'I mama1 s - deer mouse for predators Important omnivores, food base
(Peromyscus smdculatus)
- yellow pine chip- mu n k (httamias amoemcs)
.- montane vole (Microtus mantunus)
,I . .
* Only collected a t S i t e 4 (Cornw2,ll Mountain) m
ps

3. Vegetation - Above gruund ( w i t h i n 3 t o 5 CT from the soi l ) portions o f grasses and ends (aoproximately 30 an or less) of willow branches, including new stem and leaf 3rowth, were collected by cutting w i t h an acid-washed stainless steel knife. Lichens were hand picked from trees. Plastic disposable gloves were worn t o prevent contamination. 411 samples were randomly collected from an area o f approximately I00 square meters. Each sample contained 100 t o 200 grams o f material. Samples were double-bagged, labeled and cooled t o prevent decomposition. I
4. Small Mamnals - Small namals were collected by randomly placing - Sherman l i ve traps or snap traps baited w i t h oats and peanut butter throughout a 20 t o 30 hectare area a t each s i t e . Traps were checked daily and each animal collected was placed in a separate Uhirl-Pak, double-bagged, labeled and frozen.
"
L
5. Fish - Fish were collected by electro-shocking w i t h a "back- pack" shocker. All specimens were small (15 an or less ) rainbow trout and 3 t o 5 specimens comprised a s ingle repl icate a t each '
site. Approximately 500 t o 700 meters of stream were sampled a t each location. All fish collected were double-bagged, labeled, and frozen. Fish and small m m l s were shipped by air t o the laboratory in Fort Collins, Colorado stored in coolers packed - L
w i t h dry ice t o prevent decomposition of t issue.
"
I
& "
-.L
F3.2 Sampl e Preparation I
Although each receptor material required specific kinds o f .preparation, there were certain procedures that were comon t o a l l samples. Field t
identifications were confirmed upon receipt of samples and a l l samples, except water, were frozen u n t i l preparation. To minimize contamination, only s ta inless s teel , g lass or plastic utensils were used during preparation. Additional precautions included washing utensils w i t h 10% ni t r ic acid, rinsing w i t h dwineralized water between samples, and using polyethylene - gloves. Sample pulverization was done i n a Vir Tis "23" homogenizer run
L
F3-6 ...
1
"
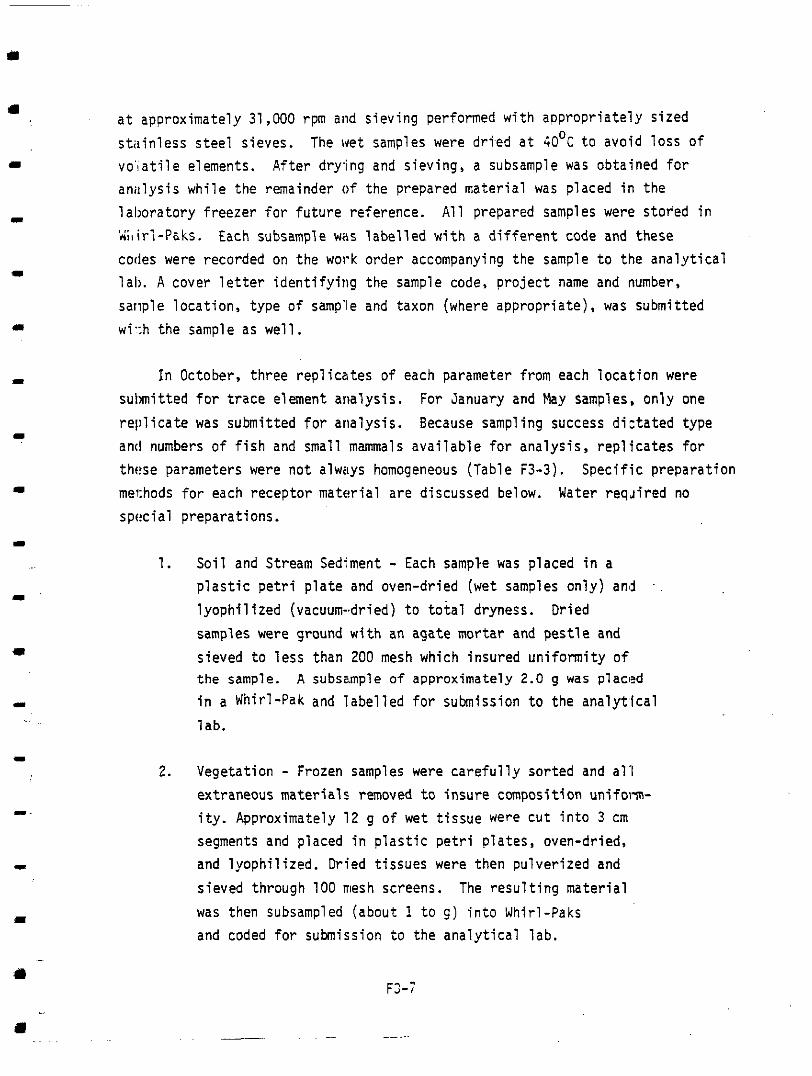
a t approximately 31,000 rpm and sieving performed w i t h appropriately sized stiiinless steel sieves. The wet samples were dr ied a t 30°C t o avoid loss of vo'iatile elements. After dry.ing and sieving, a subsample was obtained for aniilysis while the remainder of the prepared material was placed in the laboratory freezer for future reference. All prepared samples were stored in Lit-'i-P&s. Each subsample was labelled w i t h a d i f fe ren t code and these codes were recorded on the work order accompanying the sample t o the analytical lab. A cover le t te r ident i fy ing the sample code, project name and number, sariple location, type of samp'le and taxon (where appropriate), was submitted wi.:h the sample as well.
In October, three replicates of each parameter from each location were submitted for t race element analysis. For January and May samples, only one repl icate was submitted for analysis. Because sampling success dictated type and numbers of f i sh and small mammals available for analysis, replicates for these parameters were n o t alwilys homogeneous (Table F3-3). Specific preparation methods for each receptor material are discussed below. Water req'Jired no special preparations.
1. Soil and Stream Sediment - Each sample was placed in a p las t ic pe t r i p la te and oven-dried (wet samples only) an'd . .
lyophilized (vacuum-dried) to total dryness. Dried samples were ground w i t h an agate mortar and pestle and sieved t o less than 200 mesh which insured uniformity of the sample. A subsample of approximately 2.0 g was placl?d i n a Whirl-Pak and labelled for submission t o the analyt,ical lab.
2. Vegetation - Frozen samples were carefully sorted and a l l extraneous materials removed to insure composition uniform- i ty . Approximately 1 2 g of wet t i s sue were cut i n t o 3 cm segments and placed i n p las t ic petri plates, oven-dried, and lyophilized. Dried t issues were then pulverized and sieved th rough 100 niesh screens. The resulting material was then subsampled (about 1 t o g ) i n t o Whirl-Paks and coded for submission t o the analytical lab.
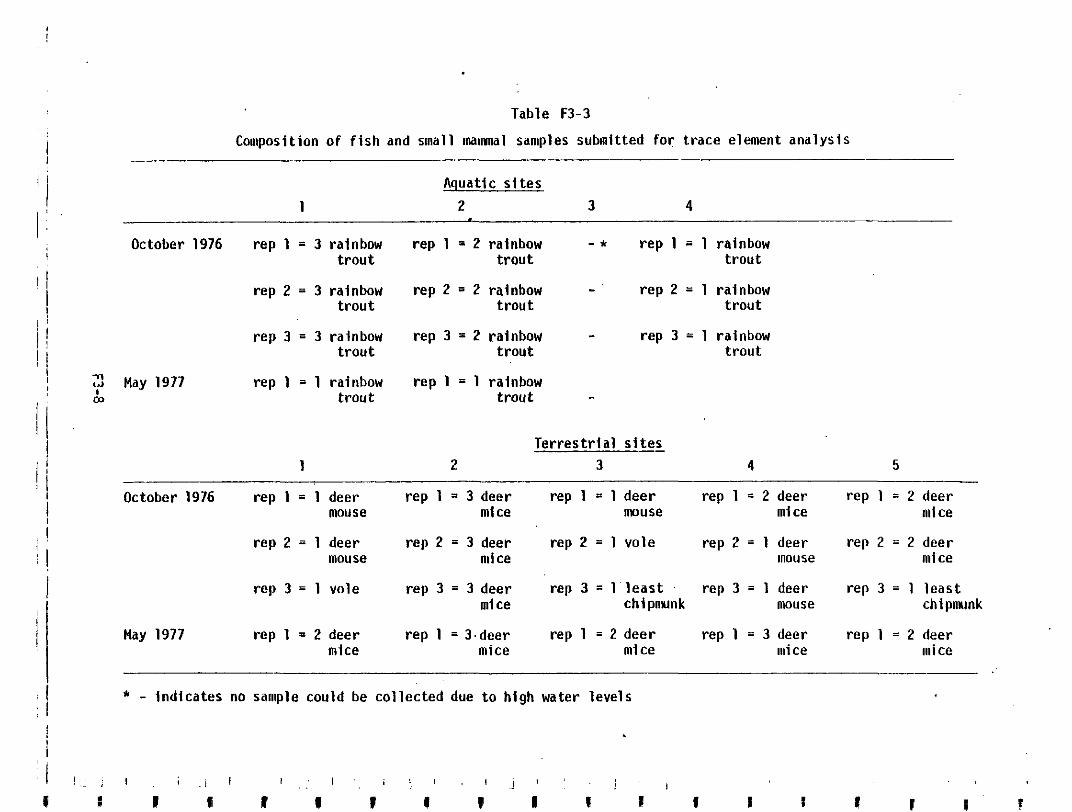
Table F3-3
I Composition o f f i s h and sma l l mama1 samples submitted for trace element analysis I
1 1 Aquat ic s i tes
1 2 3
October 1976 rep 1 = 3 rainbow rep 1 = 2 rainbow - * r e p 1 = 1 rainbow 1 : 4
I t r o u t t r o u t t r o u t
rep 2 = 3 rainbow rep 2 = 2 rainbow t r o u t t r o u t
- r e p 2 = 1 rainbow t r o u t
rep 3 = 3 rainbow rep 3 = 2 rainbow - rep 3 = 1 rainbow t r o u t t r o u t t r o u t
I 2 May 1977 rep 1 = 1 rainbow rep 1 = 1 rainbow I m t r o u t t r o u t I ,
-
1 T e r r e s t r i a l s i t e s
2 3 4 5
October 1976 rep 1 = 1 deer rep 1 = 3 deer rep 1 = 1 deer rep 1 = 2 deer rep 1 = 2 deer muse mice muse mice mice
rep 2 = 1 deer rep 2 = 3 deer rep 2 = 1 vo le rep 2 = 1 deer rep 2 = 2 deer mice mouse mice mouse
rep 3 = 1 vole rep 3 = 3 deer rep 3 = l ' l e a s t . rep 3 = 1 deer rep 3 = 1 l e a s t mice
May 1977 rep 1 = 2 deer mice
rep 1 = 3.deer mice
rep 1 = 2 deer mice
rep 1 = 3 deer mice
rep 1 = 2 deer mice
chipnwnk muse chipmunk
I ; j * - ind icates no sample could be co l l ec ted due t o h i g h water levels

I
I
3 . Small Mammals - Thawed animals were skinned (leaving m i l s and t a i l ) , g u t t e d t o remove any unassimilated trace element material, and then quarterec; t o increase surface area. Each anilnal was placed in a p l a s t i c petr i p l a t e and lyophilized t o a constant dry weight. I n most instances, composite .samples of a t 1e3st 3 specimens were macle before pulverization. After pulverizing, the composite sample was sieved th rough a 100 mesh scr?en and
subsampled (abou t 1 t o g ) f c r submission t o the analytical
lab.
4. Fish - A t l e a s t 30 g wet-weight was required for each 'sample. Due t o small s ize of fish collected in October 1976, e , i t i r e g u t t e d f i sh had t c l be used for t race element analysis. Longer f i sh were col1ecte:d in May 1977 and a square area of a.<ial musculature was rcimoved posterior t o the pelvic fins 011 bo th sides of each f i sh . The skin from this area was careflllly removed and chunks, of muscle cut into smaller pieces to f a c i l i t a t e drying. Samples were oven-dried and lyophilized t o complete dryness. Sieving was done th rough a 100 mesh screen a;id a subsample obtained fo r submission t o the analytical la!,.
F3.3 Sample Analysis
Spark source mass spectrometry, atomic absorption spectroph~~tometry, illasma atomic emission spectroscopy, and specif ic ion electrode techniques were employed t o analyze t h c ! various samples involved i n the B.C. Hydro trace element program. Thes,e methodologies were selected in order t o provide the most comprehensive coverage possible, accuracy, and {detection 'imits compatable with the elements of concern. A description 0.F each niethodology is presented below.
All samples collected in October 1976 were analyzed by sparlc source mass spectrometry except water, which was analyzed using plasma (emission spectroscopy. Since plasma emission spectroscopy i s a relativel:, new and
F3-9

not widely used analytical technique, i t was decided tha t January water sam- ples should be analyzed using mass spectrometry. Nass spectrcmetry gave very sat isfactory resul ts (see Section F4.3) when used t o analyze p i lo t t e s t burn coal and ash samples. Other January samples and a l l flay samples were analyzed for selected trace elements by atomic absorption spectroscopy.
( a ) 'Spark Source Mass Spectrometry
Analysis preparation began by subsampling materials and transferring the subsample to a porcelain dish. The sample was inserted into a cold muffle furnace and heated gradu'ally, w i t h occasional stirring, u n t i l the temperature reached 3OO0C (about an hour) and then 5OO0C ( 2 hours). Heating was continued u n t i l a l l carbonaceous material had disappeared. The resulting ash was removed, cooled and thoroughly ground i n a clean agate, mullite, or tungsten carbide mortar. The ash was re igni ted a t 75OoC f o r 1 hour, cooled rapidly, and imnediately weighed. Approximately 3 g o f material was needed for analysis.
Seventy elements were analyzed using spark source mass spectro- metry. Because o f i ts h i g h v o l a t i l i t y , mercury was measur,ed by f1,ameless atomic absorption spectrophotometry. Lead was a l so measured by atomic absorption because lead measurements by mass spectrometry are often inac- curate (Jacobs, personal communication). f luorine, another volati le element, was measured by specific ion electrode methods. Standards for quality control were prepared from certified reagent grade chemicals or h i g h purity metals.
For analysis, sample materials w i t h par t ic le s ize o f 200 mesh or less were mixed w i t h ultrapure graphite powder. A known amount of i n d i u m , also mixed into this powder, provided an internal reference standard. This powdered mixture was compacted i n a press to form a so l id pe l le t tha t was introduced i n t o the mass spectrometer. After a vacuum was applied, a 20 to 30 thousand kilovolt radio frequency was used to strip electrons from trace elements on the pellet . Elements were accelerated by an electromagnetic
F3-10
II
.-
c

f ie ld in a manner depending upon the i r mass t o charge ratio. Sensitive photoplates were used t o reccrd tracks of the elements as they pa!;sed through the electromagnetic field. Photoplates were then developed and a "just disappearing line" technique (visual estimation of length o f element l ines) was used t o calculate concentrations of various trace elements by comparison t o the indium reference lines. Detection limits for solid phase materiais, such as coal and ash, ranged from approximately 0.05 t o 0.1 mg/kp up t o 1000 mg/kq. Uncertainties of resu l t s i n the <1 t o 1 mq/kp concentration range were estimated t o be - 100:; whereas uncertaint ies a t the 100 mg/kg level were estimated t o be 250% of the reported concentration.
+
(b) Atomic AbsorDtion Soectrophotometry
Very often i t i s advantageous t o measure and monitor selected trace elements by the method of atomic absorption spectrophotometry. In general, t h i s method i s used t o provide more accurate d a t a on only specific: elements which are of importance.
The principles of atomic absorption spectroscopy are similar to other f l m e emission photometry techniques in t h a t a sample i s asp i ra ted in to a f l m e and atomized. Atomic absorption spectroscopy is general ly much more sensi t ive because i t depends on the measurement of f ree unexc:ited a t m s by absorption of l i gh t through the flame rather than the measurement of amount of l i g h t emitted which can be affected by overlapping and interferences by other atoms. In atomic absorption, because each metall ic elfment has i t s own charac te r i s t ic abso rp t ion wavelength, a source lamp composed of t ha t element i s ured, making the method re la t ive ly f ree of spectral or radiation interfel-ences. The amount of l i gh t absorbed in the flitme is therefore proportional t o the concentration of the element i n the sample. Sample preparations vary depending upon the form i n which i t i s col lec ted ( i . e . , animal t issue, p lant t issue, water, a i r p a r t i c l e s , e t c . ) . In general all preparations ult imately produce an acid solution containing d i so lved elements. This solution i s then aspirated in the atomic absorption instrument. The exact methodology for solution preparation utilized in th-s study is presented below.,
F3-11

Analytical preparations were in i t i a t ed w i t h the transfer of 1 . 0 g of sample to a 150 ml beaker. Ten ml o f water and 10 mg HN03 were then added. The beaker was covered w i t h a watch glass , placed on a shaking hot plate, and boiled until the volume o f the solution was reduced t o about 5 ml. The beaker was removed from the hot plate and the sides o f the beaker and l i d washed down w i t h about 20 mi water. The beaker was then placed on a steam bath and the contents digested for 1 hour. The contents of the beaker were transferred to a 50-1111 volumetric flask, cooled, and d i lu ted to volume w i t h water. The solids were allowed t o s e t t l e overnight. A portion of the clear sample solution was aspirated into the air-acetylene flame of the atomic absoration instrument using deuterium background correction. Analytical techniques specific to each receptor material are described below:
I
- 1.
2.
3 .
Soil and Stream Sediments - Materials were crushed by mortar and pestle and a 1 g subsample was transferred to a Pyrex beaker. Th i s sample was then dissolved w i t h a mixture of nitr ic, perchloric and hydrofluoric acids and the solution diluted to 50 ml w i t h deionized water. These samples and standard solutions, prepared by d i l u t i n g the pure metal s a l t i n an equivalent concentration o f the same mineral acids, were then aspirated into the atomic absorption u n i t .
-
Vegetation - From each ground sample, a subsample of 1 g was weighed into a Pyrex beaker. The organic matter was digested by a mixture of n i t r i c and perchloric acid a t low heat. When a l l the organic matter was removed, the acid solution was d i lu t ed t o 50 ml w i t h deionized water. Vegetation samples and standard solutions were then measured i n the atomic absorption u n i t .
Small M a m l s and Fish - Sample preparation for these materials was conducted i n the same manner as vegetation samples.
(c) Plasma Atomic Emission Spectroscopy (PES)
Plasma atomic emission spectroscopy (PES) provides multi-element -
determinations i n concentration ranges of greater than 100,000 m a / k p without adjustment, operator intervention or sample manipulation. Several widely
F3-12 ,

U
I
...
I
divsrse types of samples can be analyzed for multi-elements with se!nsitivit.y a t the ppb (par ts per bi l l ion) level . This technique i s a l so an improvement aver othzr techniques in t h a t PES i s v i r t u a l l y f r e e of chemical interferences. PES i s an inductively coupled argon plasma excitation for multi-element detzminations o f trace metals in solution. The basis of the methcld i s atomic emission promoted by coupling the sample, nebulized t o form an aerosol, w i t h h i g n temperature i n e r t argon gas produced by passage of argon through a power- ful radio-frequency field. Radiation from the plasma, defined by an entrance grating s l i t (60,000 grooves/in) t o the spectrometer, is dispersed by the grating and selected wavelengths. Photomultipliers (a separate one for each element) transduce and fingerprint elements of interest. Results are re- ported directly as concentration o f each element. Analyses of several ele- ments in the same aqueous so lu t ion a re a t ug/kg (ppb) levels for most with precisions of better than 31% t i t the 1 mg/kg (ppm) level on a short-term basis and greater than t2% over a three hour period.
The advantages of this Sy!jtm include low detection l imits, large l inear dynamic range and re la t ive freedom from matrix effects. The detection l imits for the 20 elements generally analyzed are presented in Table.F3-4. Detection limits are reported ,in pg/l (ppm) and represent the concentration of tha.: element necessary t o produce a signal twice the standard devia,tion of the bac,cground noise. Another useful approach, which is simil'ar t o the lower optimum concentration range reported for atomic absorption use, i s the lowest quantitative determinable concentration ( L Q D ) . The LQD i s defined as the amount of material necessary to produce a signal t h a t i s 10 times the standard dev,iation of the noise in the !system ( i . e . , 5 times the detection l imit) . The LQO for the 20 elements are also shown i n Table F3-4.
Sample preparation prior 'to PES analysis is identical t o that reported for atanic absorption. Subsamples of a t l e a s t 1 g or more from vegetation and animal tissue preparations and a t l ea s t 100 ml of aqueous solutions were digested by the a d d i t i o n of 3 rrl of concentrated nitric acid in a 'Griffin beaker. The beaker was covered with a ribbed watch glass and caref1Jlly hea.:ed t o dryness on a h o t plate. After cooling, an additional 3 m l o f con- cen,:rated ni t r ic acid were added and the beaker was heated t o a gentle boil.
F3-13
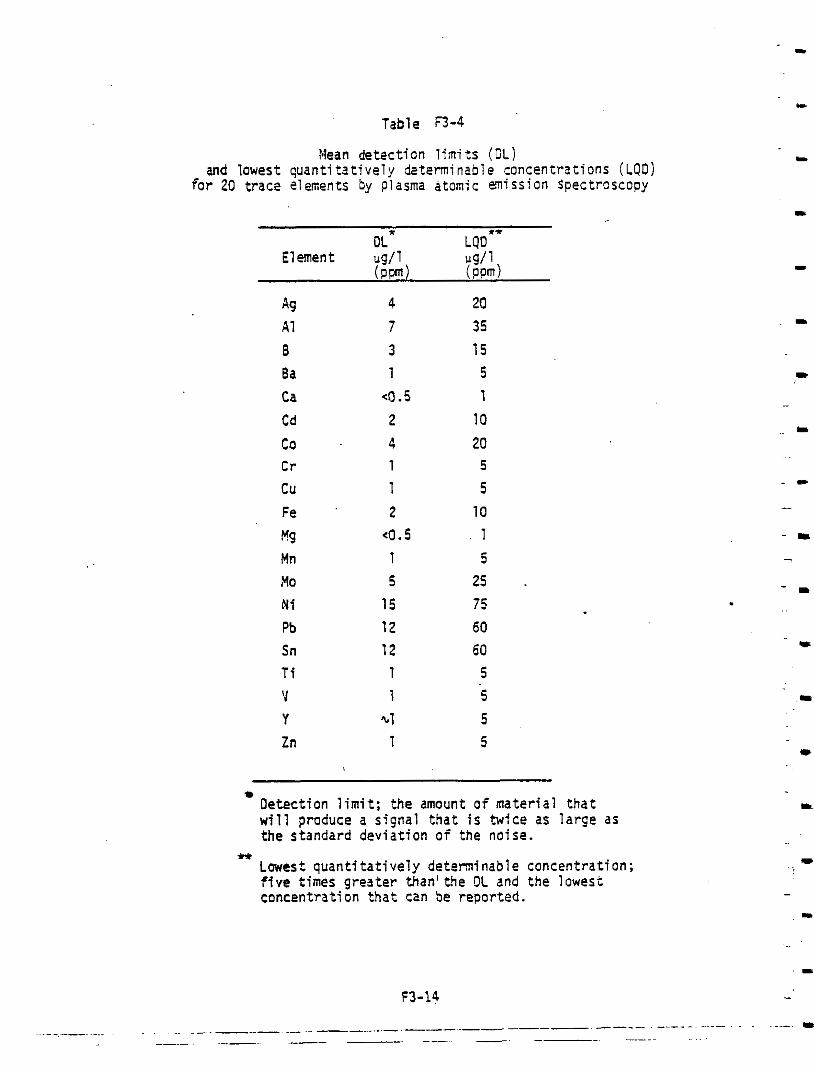
Table F3-4
and lowest quantitatively determinable concentrations (LQO) !-lean detection limits (DL)
for 20 trace elements 5y plasma atomic mission Spectroscopy
Ag A1 8 Ba Ca Cd
co Cr cu Fe M Mn Mo Ni Pb Sn T i v Y Zn
4 20 7 35 3 15 1 5
4 . 5 1 2 10 4 20 1 5 1 5 2 10
co.5 1 1 5 5 25 15 75 12 60 12 60 1 5 1 5
*.1 5 1 5
Oetection l imit ; the amount o f material that will produce a signal t h a t i s twice as larse as the standard devia t ion o f the noise.
Lowest quantitatively deteminable concentration; five times greater than ' the DL and the lowest concentration that can be reported.
*
I
. I I
t
I
F3-14 -

To the warm nitric acid mixture, 5 m l of 1:l hydrochloric acid was added while s t i r r i n g and the volume was increased with 100 m l of deionized water. The sample was then introduced i n t o the PES instrument for analysis. PreJared standard solutions were processed th rough the same procedures and analyzed along w i t h the other samples.
( d ) Specific Ion Electrode Method
Fluorine was de ten ined b,y a fluorine specific-ion electrode method. I n this procedure 0.25 g of sample were mixed in a zirconium crucible with a s lurry of MgO and MgN03. Thme mixture was dr ied a t llO°C and ther ashed i n it muffle furnace which was gradually raised t o 525OC. The ashec mixture was fused w i t h 1.0 g NaOH over an open burner with the zirconium crucible covered. The crucible and l i d were placed i n a plastic beaker, water was added t o dissolve the fused ma!js, and the solution was then f i l t e r ed i n to a 100 ml volumetric flask. The residue was washed with about 5 ml o f a 1% v/v solution of NaOH, diluted t o volume w i t h water and mixed. A 50 ml por- tiou of the sample solution via:; transferred t o a 100 ml volumetric flask, diluted to volume w i t h 1 - M am~nium c i t ra te so lu t ion and mixed. F i f ty mi l l i - l i t e r s of this solution were poured i n t o a p las t ic beaker and the potential was measured using the specific ion electrode and meter. In some cases, about 10 rI$nutes were required before a constant reading was obtained. The l imi t of determination of the method i s about 20 mg/kp.
F3.11 Data Analysis
Results of the analysis o f t race element concentrations in selected Hat Creek receptors were entered on magnetic cassette tapes under csntrol of i. special data base management program developed fo r a Hewlett-P,sckard 9830A calculator. All inputs were double-checked and verified before storing them on tape. Anal ysil; programs were generated tha t provid1.d means and estimates of the variation (i.e., standard error) for specif ic t race elerrents in each receptor a t a s i t e and over a l l s i t e s . As sample :size was low ( i . e . , 3) the calculated mean concentration and associated variance may n o t be truly indicative o f real popu1,ation trace element levels and ranges.
F3-15
.. ".

Nevertheless the sampling in tens i ty i s suf f ic ien t t o identify trace elements which, because Of higher than normal levels, warrant subsequent consideration. Furthermore, estimated iariances provide a reasonable basis for projecting sample sizes required t o detect desired levels of response of trace element concentration i n sampled material; information essential t o a sound monitor- ing program design (Section F9.0).
F3-16
I
F4.0 SOURCES OF TRACE ELEMENTS
Principal source materials of trace elements associated with the coal mine are coal, overburden, and waste rock. Coal burned in the powl?r plant results in various forms of ash and gaseous emissions t h a t are major sources of trace elements. Distribution of water-soluble trace elements i,? various source materials was determined by leachate tests on coal, overbur'ien, waste rock, and ashes. Analysis of t e s t b u r n samples provided means for determin- in!l trace element dis t r ibut ions from the input coal, o u t p u t ash f r m the bo.ilers, and emissions from the stack. Trace element.content of c1,oling tower
. d r i f t was also estimated.
F4.1 Leachable Source Materials
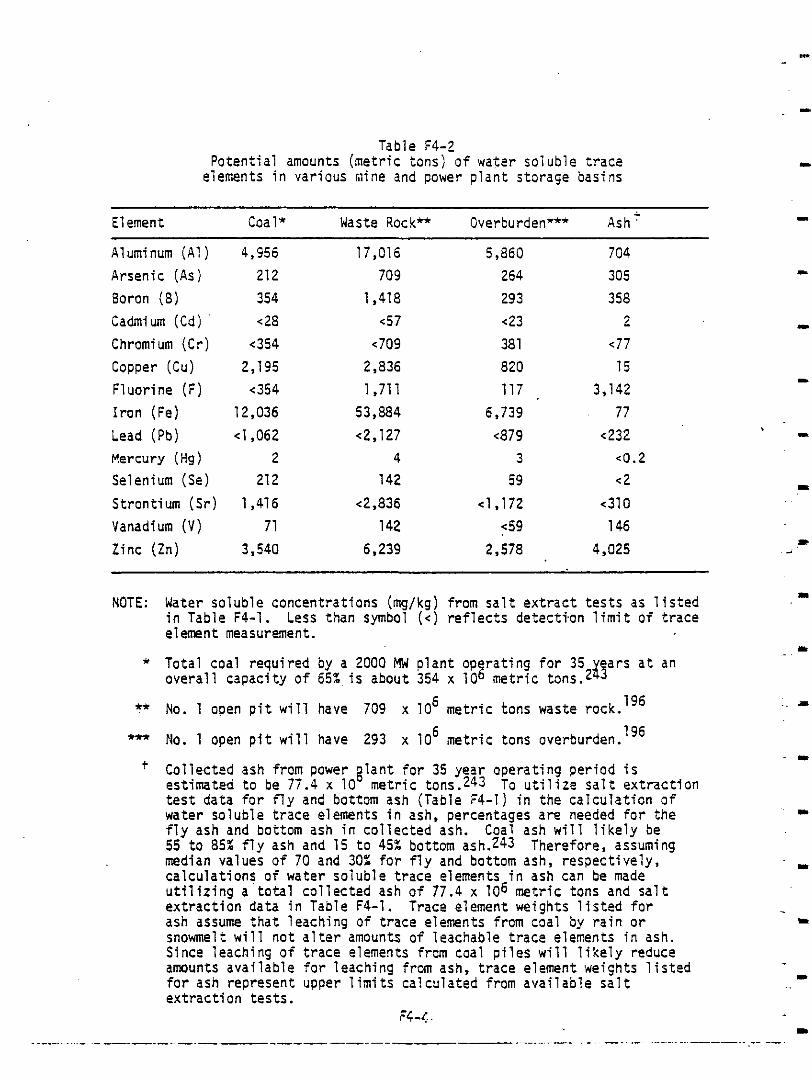
Overburden and waste rock from the mine and ash from the power plant will be placed in various above ground storage piles or basins where weatherinq and chemical reactions can dissolve various trace elements. To estimate amunts of water-soluble tract: elements contained in coal, overburden, waste ro:k, and ash, sa l t extract ion tes ts were performed on crushed tes t mater ia ls (Tible F~-I).'~' For those trace elements analyzed, arsenic ( A s ) , boron (B), chromium (Cr), copper ( C u ) , f luorine ( F ) , and zinc ( Z n ) had the highest colcentration i n the water extract. To estimate potential water-soluble weights of various trace elements t h a t would ex i s t i n overburden and waste rozk storage p i les , to ta l weights of materials t o be stored in these pilesIg6 were multiplied by water solul~le concentrations as listed i n Table F4-1. Results of these calculations (converted from mg t o metric tons) indicated thst several thousand metric tons of water-soluble trace elements 'will ex i s t i n these storage piles (Table F4-2). Since the relative amount of coal w i t h a particular heating value that will exist in the storage pile is not known and will l ikely vary with time, the averaoe value of extractable sal ts from sanples of coals A , 6 , and C (low, medium and high heating value, respectively) was calculated and i s assumed t o be representative of leachate from a storape pile containing all three typl?s of coal. Since fine and coarse tai l inns will be stored i n the same basin, ,average values for extractable sal ts from these

Table F4-1
Total extractable salts from various source materials ( conruntrat ions in n,g/kg)
* Coal Waete Rock Overburden Wash P l a n t T a i l i n g e
** *** t - 14
0 .6
1 .o <o .08
c1
6.2 <1
34
C 3
0.006
0.6
<4 0.2
10
24
1 .0
2 .o <o .08
<1
4 2 . 4
76
< 3
0.006
0 . 2
<4 0.2
8 . 8
I , I
I pH 7 . 2 7 .9
, I
A l k a l i n i t y ' I ( n s Coco3) 1560 1320
(Footnotes on following page)
20
0.9
1 .o 40.08
1 . 3
2 . 8
<0.4 23
< 3
0.01
0 . 2
c4
c 0 . 2
8 . 8
7 . 6
. 1020
18
0 . 2 1 . 1
0 . 0 3
< 1 . 2
2 . 1 9 .1
46
c 3
~ 0 . 0 0 3
0 .2
4 0 . 5
1 . 4
5 . 4
650
Ash++
El!-" Rot tom
10 7
4.3 3 .1
6 . 3 0 .7
0 . 0 2 0.06
<1 <1
0 . 2 0 . 2 55 J 1 1
< 3 < 3
<0.002 <0.001
<0.02 <0.01 < 4 <4
1 . 4 3 . 8
40 80
9 . 4 8 . 8
2600 1110

I L c I I I m b I Table F4-1
(LulrI llrur", ,,,n.,T..*,,r..,
NOTE: Amount o f e x t r a c t a b l e s a l t I n s o u r c e m a t e r i a l s was determined by ag i ta t ing 50 g o f crushed sample w i t h 250 ml of de ion ized water . The sample was then cent r i fuged and f i l t e r e d and the ex t rac t retained. An equtvalent volume o f deionized water was added t o t h e sample and the procedure repeated. The sample was washed a to ta l o f e i g h t t i m e s and analyses performed on the combined ext ract . Resul ts are mi l l ig rams ex&-qcted per k i logram of so l id . Tests were conducted by Acres Consultants, Vancouver, B.C.
* Average fo r t es ts on coal A ( low heat value), coa.1 B (medium heat value) and coal C (h igh heat ..!
" O l U C , . '
** Samples o f waste rock from the 1976 diamond d r i l l i n g p o ram were se lected by Dolmage, Campbell and Associates, Ltd. and composited f o r t e s t purposes. $47 Samples were composed of boulders, c lay sha le , m ixed de t r i ta ls and some sandstones.
*** Average f o r t e s t s on overburden from Bucket Auger Hole 76-1, "TR" samples TR-1 through TR-13. composite 0 ty491 feet and Bucket Auger Hole 76-13, "TR" samples TR-1 through TR-13, composite 0 t o 58 feet .
t Average f o r t e s t s on coarse t a i l i n g s f r o m 5 g a l l o n p a i l o f "Sample A-Shale" from B i r t l e y 2 & 9 s t s
tt F l y ash from composited samples f rom test runs 2.1, 4.1, 6.1 (prec ip i ta tor products) f rom burns on r a w coal A, B and C a t Canadian Combustion Research Laboratory.245 Bottom ash from same t e s t burns.
and f i n e t a i l i n g s f r o m 45 gal lon drum o f "Sample A-Thickener Sol ids" f rom Bir t ley tests.
k'otential amounts (metric tons) o f water soluble trace Table F4-2
elements in various mine and power plant storage basins
Element Coa 1 * Waste Rockn Overburden*** Ash'
Aluminum (Al) Arsenic (As) Boron ( a ) Cadmium (Cd) Chromium (Cr) Copper (Cu) F1 uori ne ( F ) Iron (Fe) Lead ( P b ) Mercury (Hg)
Selenium (Se) Strontium (Sr) Vanadium ( V ) Zinc ( Z n )
4,956 21 2 354 <2a
<354 2,195 <354
12,036 ~ 1 , 0 6 2
2 21 2
1,416 71
3,540
17,016 709
1,418 4 7
e709 2,836 1,711
53,884 ~ 2 , 1 2 7
4 142
4,836 142
6,239
5,860 264 293 <23 381 820 117
6,739 <a79
3 59
~ 1 , 1 7 2 4 9
2,578
704 305 358
2 c77 15
3,142 77
<232 c0.2 < 2
e310 146
4,025
NOTE: Water soluble concentrations (mg/kg) from sa l t ex t r ac t t e s t s a s l i s t ed in Table F4-1. Less than symbol ( e ) reflects de t ec t im limit of t race element measurement.
overall capacity of 65% i s about 354 x 10 i? metric tons. 2x5 * Total coal required by a 2000 Mw plant op ra t ing for 35 a r s a t an
?* No. 1 open p i t will have 709 x 10 metric tons waste rock.
** No. 1 open p i t will have 293 x 10 metric tons overburden.
6 196
6 196
Collected ash from power [ lant for 35 year operating period i s estimated to be 77.4 x 10 metric tons.243 To u t i l i ze sa l t ex t rac t ion test data for f l y and bottom ash (Table i4-1) i n the calculation o f water soluble trace elements i n ash, percentages are needed fo r the f l y ash and bottom ash i n collected ash. Coal ash will l ikely be 55 t o 85% f l y ash and 15 t o 45% bottom ash.243 Therefore, assuming median values of 70 and 30% f o r f l y and bottom ash, respectively, calculations of water soluble trace elements i n ash can be made u t i l i z i n g a t o t a l collected ash of 77.4 x 10⁶ metric tons and s a l t extraction data i n Table F4-1. Trace element weights l i s t ed for ash assume that leaching of t race elements from coal by rain o r
Since leaching of trace elements from coal pi les will l ike ly reduce snowmelt will not a l t e r amounts of leachable trace elements in ash.
amounts available for leaching from ash, trace element weights l i s t ed for ash represent upper l imits calculated from avai lab le sa l t extract ion tes ts .
FC-6
It
t-
I
.. II

materials were used and assumed t o be representative of leachate from waste basins containing these materials. Bottom and precipi ta ted f ly ash will be placed i n a storage basin where weatherina and chemical reactions can dis- solve various trace elements. Coal ash will l ikely be 55 t o 85% f l y ash and 15 t o 45% bottom ash.243 Median values of 70% f l y ash and 30% bottom ash were used as typical ash distributions for calculating amounts of water soluble trace elements in ash collected durina 35 years of p l a n t operation (Table F4-2).
F4.2 Cooling Tower Source Materials
A secondary and localized source of trace elements will be cooling tower d r i f t . As condenser cooling water is recycled, evaporation cause!; s a l t con- centrations t o increase in the circulating water. A small portiori of t h i s concentrated water i s car r ied t o areas near the cooling towers as winds dis- perse some of the water away from the towers. I t i s p red ic t ed t hz t Thompson River water, the source of cooling water for the power plant, will be con- centrated by a factor of about 14 as i t i s recycled throuah the coolina sy s tem. 242 Chemical character is t ics of Thompson River water and coolina tower d r i f t f o r a recirculation build-up fac tor of 14 are l i s ted i n Table F4-3. A value of 109 ppm was used for the concentration of dissolved solids i n river water. This value was obtained from a water quality study o f the Thompson River performed in 1975 by the Calgon Corporation. Studies performed by Environment Canada indicate t h a t levels o f total dissolved solids i n the r iver are general ly less t h a n t h i s value of 109 ppm. Thus, concentrations l i s t ed i n Table F4-3 represent likely worst-case trace element concentrations i r d r i f t based solely on evaporative water losses i n the cooling cycle. Ttese estimates do n o t include any contribution from corrosion inhibitors (e.g., chromates) or corrosion products (e.g., oxides of Cu and Zn). Predicted anlounts of various trace elements t h a t would be contained i n cooling d r i f t are a lso l is ted in Table F4-3.
F4.3 Power Plant Source Materials
Coal i s e s sen t i a l ly a colloidal suspension of noncombustible matter in a complex of both vo la t i le and nonvolatile organic compounds. Trace! elements
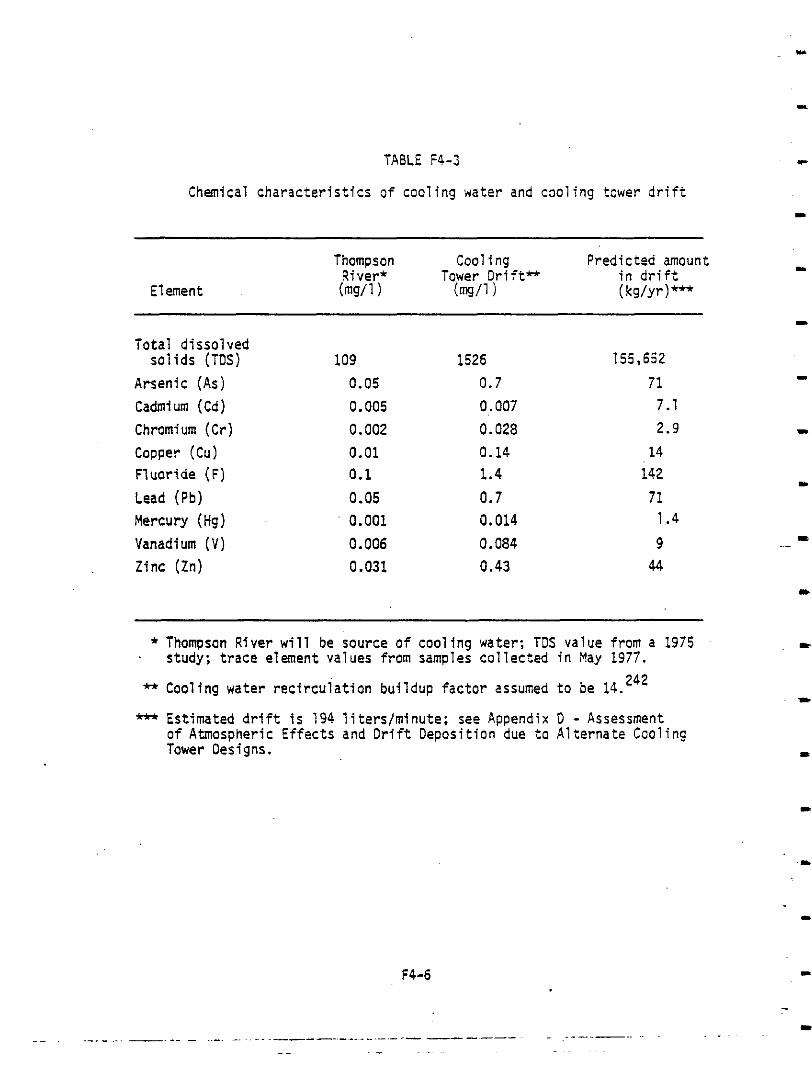
TABLE F4-3
Chemical characteristics of cooling water and cooling tower drift
Element
Thompson River*
Cool i ng Predicted amount
(mg/l) Tower Drift* in drift (mg/I) ( kg/yr 1 ***
I
Total dissolved solids (TDS)
Arsenic (As) Cadmi um (Cd ) Chromium (Cr) Copper (Cu) Fluoride (F)
Lead (Pb) Mercury (Hg) Vanadium (V) Zinc (Zn)
109 0.05 0.005 0.002 0.01 0.1 0.05 0.001 0.006 0.031
1526 0.7 0.007 0.028 0.14 1.4 0.7 0.014 0.084 0.43
155,652 71 7.1 2.9 14 142 71 1 ..4 9 44
* Thompson River will be source of cooling water; TDS value from a 1975 ' study; trace element values from samples collected in May 1977.
* Cooling water recirculation buildup factor assumed to be 14. 242 - Estimated drift Is 194 liters/minute; see Appendix D - Assessment of Atmospheric Effects and Drift Deposition due to Alternate Cooling Tower Designs.
F4-6

found in b o t h the noncombustible p o r t i o n , called ash, and the Orailnic Complex can be released t o the environment during power generating operations. The errissions of trace elements from the power plant are expected t o be specific t o the Hat Creek coal and the power plant design. In order t o es9mate emis- sions t o the atmosphere from the power plant a knowledge of coal, combustion and emission control, and operatin! character is t ics is necessary. From t h i s irformation a pathway o r estimated material balance of trace elements can be traced from the mine t o eventual stack emissions.
The t race element material balance cannot w i t h today's knowlt?dge be pre- dicted from theory alone. Too many variables are present in the ~~rocesses irvolved. Since empirical tests are also very necessary for engineering design of the power plant, B.C. Hydro expanded the already planned t e s t burns o f H a t Creek coal t o include trace element measurements.
Two t e s t burns have been conducted. The f i r s t , a p i l o t t e s t b u r n , was performed i n January 1977 by the Canadian Combustion Research Laboratory ( C C R L ) . 2 4 5 A small amount .of coal was obtained from the Hat Creel: mine s i t e ard was burned t o evaluate coal combustion character is t ics and t h o solid t race element residues. A complete material balance, equating trace element measured inputs with measured outputs, was n o t possible. This test did provide a preliminary set of f l y ash emission samples for trace element aralysis .
The second t race burn , conducted a t the Battle River power 'plant in Alberta, Canada i n August 1977, was designed t o be a ful l -scale test o f H a t Creek coal. 241 State-of-the-art trace element analysis o f em.issions were ircluded. Again because of engineering design of the t e s t power plant, a ccmplete material balance was n o t possible.
These two t e s t burns provide empirical data on the results 01' burn ing Hat Creek coal. Given additional data t o determine the representativeness o f ' the coal tested in comparison t o the expected mean coal for t h e Hat Creek pcwer Plant operations and t o scale the tested emissions t o the ful l -scale Hat Creek plant, reasonably reliable estimates of trace element eriissions can be obtained. This section will present that data and the result ing emission estimates.
F4-7

Because of the complexity of the calculations of projected emissions, the assumptions necessary t o simplify the analysis, the natural variability o f the parameters used and the small sample sizes, the presented calculated full- scale emissions are indeed estimates. I t i s n o t possible t o mathematically calculate the uncertainty in the emissions given i n this report , b u t the i r value for evaluating the Hat Creek Project can be determined (see ERT main report - Air Quality and Climatic Effects o f the Proposed Hat Creek Project) .
Throughout the analyses, conservatism in favor o f overpredicting emis- sions has been maintained. Where doubt--due t o analytical sensit ivity or design incompleteness, for example--has been encountered, the element of concern has been assumed t o be a part of the emission stream. Every e f for t has been taken t o simulate the Hat Creek power plant a t ful l continuous load as the worst case. The emissions are therefore expected t o be maxima.
The next three subsections will further describe the test bu rns , review the Hat Creek coal analyses and present the emission estimates, respectively.
(a) Test Burns
( i ) CCRL Test Burn ,
A t the direction of S.C. Hydro, CCRL conducted p i l o t scale tes t burns of the Hat Creek coal in January 1977.245 Samples of crushed coal, pulverized composite coal, furnace bottom ash, precipitator ash and f i l t e r samples o f f l y ash from the exit f lue gas from th i s t e s t were provided t o ERT
by B.C. Hydro for trace element analysis. 'Table F4-4 l is ts the character-
i s t i c s of test ooerations fo r which t race element samples vere included.
Samples from t e s t s 2 .2 , 4 .2 , 5.2, and 6 .2 were analyzed because 3% excess oxygen was a basic design feature of the planned boilers and type A , 9, and C Hat Creek coal would be represented along w i t h one sample of washed coal (S.C. Hydro, personal comnunication with M. Tennis). The samples have the following characteristics and significance t o trace element studies:
I
I
L
c
Ir
'L
I
...

Table F4-4 Characteristics o f various coal samples and CCRL t e s t burn conditions
.. - Test Number (heating value)* Drying Washing oxygen
Excess Coal type
I -
i . 2 A doubt e raw :I
I I.. 2 B twice raw :3
5,.2 B double washed :3
€8.2 C double raw :3 a
.I.
NOTE: Details of t he t e s t bu rn are provided i n CCRL report.245
il + Coal type A i s c lass i f ied as having low heat value, coal type B as medium heat value, and coal type C as h i g h heat value.
F4-9

- e,.
1. Crushed Coal - Coal was collected by bucket-auaer d r i l l i n g a t the Hat Creek mine and crushed. Samples collected represent raw feed coal, unprocessed, and w i t h o u t additives.
2.. Pulverized Composite Coal - Uithstanding the assumptions addressed l a t e r i n this report, elemental concentrations in the Hat CrePk coal can be determined from the composite coal samples, which re- present pulverized input coal t o the t e s t burn.
3. Furnace Bottom Ash - The ash samples are of unburned coal components t h a t f a l l t o the bottom o f the furnace. They have been collected from a sluice system and thus have been "washed" t o some extent. No samples of the wash liquor were available for analysis.
4. Electrostatic Precipitator Ash - These ash samples were collected by the plates o f the e lectrostat ic precipi ta tor . They represent the b u l k o f fine particulates t o be captured by the control system.
5. f l y Ash - Fi l te r papers mounted on a probe inserted in the exi t flue o f the precipitator were used ' to col lect f ly ash 'samples. Isokinetic conditions were maintained. The samples are thus com- posed o f suspended par t iculate f ly ash and are assumed t o represent the particulate matter that would be emitted by a power plant burning Hat Creek coal.
Sample Description
Samples were contained i n either standard Whirl-Pak containers o r On Millipore f i l t e r s w i t h appropriate plastic holders specific to the 0.45 Millipore f i l t e r s i z e . General physical descriptions o f samples selected for analysis are given below.
1. Crushed Coal - Crushed coal samples consisted of a fine black mixture. A subsample from each bag was ground by mortar and pestle for about 3 minutes. Approximately 10 a of this evenly
I

fine-ground material was sealed i n another Whirl-Pak anc. submitted fo r elemental analysis.
2. Composite Pulverized Coal - All samples appeared black in color and were very fine in particle size. Large sized particles were not found in pulverized coal samples, and as a consequence, no further crushing was deemed necessary. Subsamples consisting of approximately 30% of the total pulverized coal sample were sealed i n Whirl-Pak containers and submitted for elemental analysis.
3 . Furnace Bottom Ash - Solid unburned matter t h a t se t t led t o the bottom of the furnace was the most varied in composite par t ic le sizes. The consistency of the sample ranged from lumps approx- imately 1 cm in dialneter t o very fine particles. Color Of the material varied from a mostly l i gh t brown t o reddish. P. subsample ' of 30% of the original material was transferred t o a mortar and ground by pestle for approximately 5 minutes until the sample was of f a i r l y fine c h p s i t i o n . A subsample of approximately 10 g was sealed i n a Whirl-P,3k container and submitted for elemertal analysis.
4. Electrostatic Preci,pitator Ash - This material was a very f ine brown or black colorPd particle mixture. No additional gr inding was necessary and subsamples of approximately 30% of t h e ash were sealed in Whirl-Pak containers and submitted fo r elemental analysis.
5. Fly Ash - Particulates downstream from the e lectrostat ic precipi ta tor were collected on a Millipore f i l t e r which was placed i n a Milli- pore plast ic container af ter sampling. These samples contained very fine particles and i f the plastic container t o p was removed, air currents easily dispersed particles from the f i l t e r s . As a consequence, plastic containers were simply sealed as received and submitted fo r elemelltal analysis.
FS-11

E l ement Con centrati ons i n Coal and Ash
Results of elemental analyses fo r crushed coal, pulverized composite coal, furnace bottom ash, electrostatic precipitator ash and f l y ash are presented i n Table F4-5. To evaluate the accuracy of the mass spectrometry analysis, certif ied samples of coal and f l y ash from the United States National Bureau of Standards (NBS) were submitted t o the laboratory. Results o f t h i s quality assurance check for spark source mass spectrometry (SSMS) are l i s ted i n Table F4-6. NBS samples are not available for a l l of the elements l ikely t o be analyzed i n coal or f l y ash. Instead, the standards check i s u t i l i zed as a comparison of levels of accuracy among the different techniques which are used for specific elemental analyses. Since most scan techniques, such as mass spectrometry. are utilized i n a generally semi-quantitative mode, the analysis o f certified standards indicates the relative accuracy of individual element concentration measurements. As discussed i n Section F3.3(1) mercury, lead, and fluorine were analyzed by other rare quantitative analytical tech- niques. For other elements, Table F4-6 shows tha t the SSMS values are con- servative. that is, higher than the standards.
Since coal samples were collected for three ( 3 ) different heat values (coal A, B, and C ) , va r iab i l i ty in element concentrations among these samples was expected. This v a r i a b i l i t y i s s u m r i z e d i n Table F4-7 where mean values and coefficients of variation are l isted for coal and ash analyses of coal samples A, B, and C. The washed coal B sample would bias the estimates and was not included in this s ta t is t ical analysis . These averages and coefficients of variation are based on only one sample from each type, t ha t i s , there is no replication o f the samples. Variability in elemental concentrations among samples was also observed i n various ash types as well as coal. The increased var iab i l i ty of element concentrations i n ash material may be a resul t o f variable test bum operating conditions. d i f f icu l ty i n obtaining truly re- presentative samples from large volumes of ash, and sampling and analytical errors. Coefficients of variation range from near zero t o 1.18 (118%), b u t no pattern is discernible. Higher var iab i l i ty for a given element in the coal samples, f o r example, does not indicate a corresponding large coefficient of variation in the ash samples. With only one coal sample from each type per heat content, i t i s n o t possible t o statist ically dist inguish the thre?
FC-12

Table F4-5
Element concentrations (m(l/kq or ppm) in Hat Creek coal and ash. from CCRL test burns
" Element
. 0 .6 1 ' 0 . 6 < 0 , 4
LC sc bC UC
1 2 25 1 2 I 1 520 320 700 310
0.3 0 . 2 0 . 2 0.3
0 .3 0 . 5 20.5 0 . 4 2 1
6 6 2
4 2 I
c 0 . 1 0 . 7 0.7 0.6 - x K m KR NR NR NR
34 0 . 9 17 12
9 2 0 . 9 I
34 10 33 45 45.
34 61
-
7 66
6 6 30 40
7 IO
I I 2 I
V . 3 0 .6 0.6 V.4 0.5 0.7 0 . 5 n.7
180 100 18 2 2 u . 9 I I
24 I O 22 0 . 3
I 'I
a . 1 w . 1 W . I < O . I n . 4 0.5 0 .5 0 . 4
~
A
hC I
310 12
-
0 . 2
0 . 4 3 3
- <o.z K
NR 2 i
1 16
i l n .
44 9
I v . 5 v.4
I zn n . n
I 2 11. 7
< ( I . I
Pulver l led coo1
B wn - C "
kC 0 . 4 0 .7 I
&C K
I 2 0 350 310 2211
s 11.4 0 . 5 0 . 7
- <o.z 1 0 . 3 11.3 8 I
14 b
0 . 3 0 . 6 0 . 4 2 3
K sc EC
P"r,,:,ce Bottom Eleetrurtatlc rreclpltstor CamposIte FLY Ash
A " - - - - - - 0 WB C A B "B - C - A - B W B -. - C
rr: hC K Mc sc IC EC sc 0 . 7 ' 0 . 3 0 , 8 I 4 6 2 2 9
K Mc EC VC 16 20 9
EC sc 700 K sn! hc &C PC 0.7 I I 0 . 7 2 2 I I 0 . 2 v . 1 0 . 2 0.7
I 6 4 3 17 110 160 1211 62 140 820 300 250 blC PC PK 3C
- < 0 . 2 50.3 0 . 2 0 .3 z n . 9 I 9
0.4 n . u 0.8 2 3 14 20 n 4 3 70 63 22 I1
I
n . 8 . I U.4 3 b 8 5 5 S 36 20 68 I 7
5 0 . 2 511.1 n . 3 0.4 I 0.1 0 . 4 0 . 5 0 . 9 4 5
3 rc *: EK Hc sc w EC EC EC PC bC PC
2 I 9
I4 2RlI 3!1
II
4 0.9 I 2 ll,!l
51 69 NR NR
4 1 SO 4 2 '
120 340
1?n 88 45 30
2 11.5 2
4
0.1 1
34 IO 37
200
20 240
3 2 I
Nil 120 Ion 79 NR vn tm
7 4 8
270 400 250 65 BOO 76
60 92 91 790 510 290
n c o . 2 s 0 . 0 ' 0 . 2 2 2 .3 I

Elcnent II
lable F4-5
(Continued)
t, Crushed Coal Pulvcrlzcd Coal Purnacc 001
A I) "
0.6 2 0 . 4 0.9
ST0 ST0 XR NR
0 . 3 0 .2
40.1 (0.1 x YC
19 I2 1 23
4 9
0.1 0.1 tz 1.c
74 100 0.16 0.11 1 3
5 13 21
7
8 6 XU NR
co.1 S0.I
- WB
0.9 2
ta . sro 0 . 6
CO. I
8 tc
4 2
'0.1 Ec
50 0.13 1
7 24
6
' 0 . I NR
C - 0 .1 2
tin 0.4
'0.1
10 &E
4 7
0 . 2 tc
0.13 240
6
5 1.9
7
60 . I KR
s m
A a "
0.9 1 0.6 0.7
sTn STD NR Kn
0.7 ' 1
<O.l a.l >c IC
I5 7
13
5 18 6
0 . 2 0.2 &C EC
0.14 0.10 10 150
4 ' 3
7 27 21
6
I5 d
<O.l '0.1 NR NR
K I
0 . 3 < O . J
ST0 NR
u.4
t0.3
9 IC
3 I 7
-
'n. 3
61 Nc
0.08 4
13 3
5 NR -
4 . 3
C A n NII ""
3 2 2 0.6 2
2 I 1
NR NR NR NR
0.7 0 . 2 '0.1 0.2
<O.l <O.l <O.l < n . 1 tK &E ' EC IC
STD S'IU sTn sIn
1 3 31 31 40
9 13 46 30 3 . 1.1 7 4
0 . 2 n.2 0.2 0 .2
53 I!IU 250 110 '
uc &e tc EE
0.09 0.01 0.01 0 . 2 4 9 7 I 1
4 - 2 1 I 3 24 1(1 I5 27 40 8 16 I S 20
NR NR HR NR ~ n . 1 . ' n . ~ <O.I '0.1
" - C A b
2 3 . l
NR NR NR 2 3 2
. 0 . 2 2 srn STO STO
2
' 0 . 2 <0.4 '0.3
IC IC tc 0.1 0 .5 0.6
680 100 710
I 0 14 I 7
(13 84 140 I5 I4 13
21 20 35
<n.z <u.4 '0.3
0.03 1.1s 1 . 6 6
NR NU KR
- ne
2 0.8
ST0 NR
0 .6
' 0 . 2 EC
5 1 33 I 1
'0.1 IE
2.39 450
13
1s 250
35
<o.z NR
- C A D ' X "
3 3 2
I2 ' 0 . 2 6
NR NR KR l iR KR I 1 < 0 . 2 2
ST0 ST0 S10 STD ST0 0 . 6 1 . I 2 1
t0.1 <0.2. <0 .5 ' 0 . 1 < 0 . 5 tE WC kK tE .'E
61 24 40 110 110 66
3b 120 34 '120
41 15 8 24 8
'tC E T . tE IC .'e 0 . 5 0.1 0.1 ' 0 . 2 0.7
500 270 1.41 0.61 0.97 1.51 1.16
EE 360 !E
8 12 4 5 5 2 11
I 1 120 I10 550 330 220
13 30 20 6 0
30 27 120 92 62
'0.1 ' 0 . 2 ' 0 . 5 <0 .2 ' 0 . 5 NR NII . KR NR NU

Table F4-5
(Continued)
Ele-ent - * Crushed Coal Pulverlred Coal rurnacc Bottom electroststle Preclpltator Composite F I Y Ash -
C A D C A B 110 C A B WB . c L " B h'D - c ""
NB - _""" - __
- A
co.1 3
<O.l
< O . . l 25
6 2
0.9
50.1 EC
120 >K
LK < o . I ' 0 . I
<0.3 0 .2
3 0.1 I
by: <0.4
120 2
0 .6
-
-
- B
<o. 1 1
C O . I 10
4
EC 2
C0.3
EC
EK 4 0 . I CO. 1
'0.7 0.3
I 0.2 0 .9
FK
w . 1
a
- 110
< 2 -3 56
I
- h'B
<o. 1 3
e o . I 6
co. 1
3 4
FK 2
<0.3
bK
E l c a. I <O.l
< 0 . 8 0.3
5 < O . l 0 .9
FK
- 210
-
< 2 -3 49 <o. I
1 3 S '0.1 co.1 "3.1 '0.1 dO.1 (0.1 '7 17 9
'0.1 a . 1 <O.I
S IO
2 1 17
3
2 2 3 EK E ! C KC
<0.2 0.2 0.4 - 69 94 170 EK hK
>IC hK &IC <O.l < O . l <O.L - <0.4 50.2 <O.l
~0.6 0.4 tO .6 0.2 0.2 0.4
-4 3 -2
0 . 8 1 ' I 0 . 2 0 .1 0 . 2
1 81
1 1 73 220
I 0.9 I
( 0 . I 3
< o . 1 9
<o. I
3 3 2 EC
<o. I
MC
EK
<0.3
- 25
a . 1
n.3
- ll.6 3 11. I I
FC 11.9
79 2
11.9
12 <o. I a . 1 55 <O.l
I4 9
KK 9
0 . 2
340 EK
'0.1 7
<o. 2
I
I 4 I
11.2 O.!I
bK 0 . 9 7
IS0 2
-
5 <o. 1 go.1 17 <o. 1
'9 7
' 4 IC
<0.2
EK
- 240 110
<o. I to. I
u . 5 <n.4 17 0 . 2 0 . 4
'11.8 -5
I S 0 2
<o. I 5
<O. I I7 <o. I
11 5
>C 1
0. 2
350 . hK
32 <o. I <0.2
0.4 0.5
0. I 0.4
%C I 8
240 < I
-
I 11
co.2 *0.4 co.3 7 6 7
eo.2 ao.4 a.3 43 44 . 30 <o.z a . 4 a . 3
9 I 1 0.7 16 2 1 20 3 5 hK EK FK
4
4 . 3 0.9 0.6 -
320 360 560 EK )x: &K
120 EK &E < 0 . 2 <0.4 co.3 - 0 . 2 <0.4 <0.3
0.6 0.9 0 . 7 0 . 5 I < I
I I !I 30 0.1 0.4 0.4 2 s 3
~~
< I <: <I
340 380 EK 7 4 I 3
2 3 4
bK EK FK
eo.2 co.1 I 4 7
<0.2 ' <O.l 46 17 <0 .2 <O.l
6 6 39 34
I EK ~
4
0 . 2 50.3
EK EK 960 380 800 490
4 0 . 2 <0.1 <o.z <n.s
0.4 0.9
-5 <0.6 < O . B
-H
-
0 . 2 0.3 I 3
FK < I
FK
4 5 I
810 490 '1 3
11 <0.2 <0.2 s7 co. 2
I2 IS
EK 6
0.4
K
FC < 0 . 2 < 0 . 2
0.5 I 8 0 . 3 5
EK
4 2 0
< I
490 -4
2
<0 .5 c o . 2 c0.s 14 20 12
<0.5 < 0 . 2 <o.s 70 40 47 <0.5 '0.2 <0 .5
28 16 1 1 15 84 31 I S 8 16 EK EK EK 2 4 0.7
MC EK EK 940 EK, 380
I.K EK 530
< 0 . 5 r0.2 <o.s c o . 5 . ' 0 . 2 <0 .5
25 16 , I I 0 . 8 ' 0 . 2 0.6
*: Mc YE 3 '0 < 3 9 T6 -S
s ' 0 . 2 3 960 440 EK

. Table F4-5
I
I
i
, I
I
I
I
NOTE: MC indicates major component ( > 1000 mg/kg). NR indicates not reported (element cannot be reliably analyzed by mass spectrometry). ST0 indicates that known amount of this element was added to sample for standardization.
' r- c I
71 * A , B and C are sanlples o f coal designated as being of low, medium and high heating value, respectively.
n klB i s a washed sample o f coal B.

Table F4-6
Results o f quality control check using U.S. National Bureau o f Standards coal and f l y ash standards
Coal Fly Ash .-.- Elcmcnt @ * SSMS ** - NBS * =*f -
m
Aluminum Antimony Arsenic Barium B f y l l i u m
Bismuth Boron
Cadmium Bromine
Calcium
Carbon Cerium Cesiun Chlorine Chromium
Cobalt
Dysprosium Erbium Europium
Fluorine Cadol in im Gallium Germanium Gold
Hafnium Holmium Hydrogen Indium Iodine
Iridium Iron Lanthanum Lend Lithium
Magnesium Lutetium
Nungmcse
Molybdcnm
Wcodymium
Niohium Xickcl
Osmium Nitropcn
coppor
Ilcrcury
1.0 5 .9 t0 .6 6 .0 61 t6 67
1.5 (12) hlC 10
11
230
0.4 50 8.0
0.19t.03 0.7 C
NR
' 3.0 28
480 20.2'.5 61
( 6 ) 13 18k2 19
2.0 0.7 0.4
500 1.0
18
<0.2 1.0
2.0 1.0
NR sm . ~ . ~
2.0
<o. 2 Mc Mc
5059 18
60 5.0
<O. 3 IC
40+3 36
11 0.12i.02 0.1
15k1 1s 6.0
NR 11
<0.2
900 0. :'
8.0 1.45k0.06 0.8
IIC
KR
13122
170 17
160 150
150 24
6.0 3 . 0 2 . 0
200 4 . I)
95 14
SR STD
2.11
<0.:2 LK I20
70t4 58
~.
C400 .~
O.!j
493'7 EIC
490
36 O.14t.01 0. I4
9813 32
NR CO.:!
F4-17

Table F4-6
(Continued)
Element - Oxygen Palladium Phosphorus Platinum Potassium
Praseodynium Rhenium Rhodium Rubidium Ruthenium
Samarium Scandium Selenium Siticon Silver
Strontium Sodium
Sulfur Tantalum Tellurium
Tcrbim Thallium T h O r i U Q Thulium Tin .
Titanium . Tungsten Uranium
Ytterbiun Vanadium
Yttrium Zinc Zirconium
Coal NBS CTE *** ** - -
NR
w: a . 2
a . 2 bC
a . 2 2.0
C O . 2
CO.2 19
2.0 ~~
6.0 2.92.3 3.0
)K 140 Mc
(CO. 1) <0.2 c0.2
0.4
(3) O.S9*.03 . c0.s . 3.0
0.2 2.0
1.42.1 <2.0 64
. < l . O
c1.0
3828
3724 19 SS
NR <0.2 MC c0.2
eo. 2 1.0
>IC
11.62.2 2.0 7 . 0
21428 , 430 2.0
2lO*ZO 510 2.0
570
NOTE: Numerical values are i n mg/kg ( p p m ) . MC indicates major component ( TO00 mg/kg). NR indicates not reported (element cannot be re.liably analyzed by mass spectrometry). ST0 indicates t h a t known amount of this element was added to sample for standardization. ( ) Indicates that standard concentration i s given, b u t not
,
Concentrations in sample as ce r t i f i ed by ElBS ( U . S . National ce r t i f i ed by NBS.
Bureau of Standards). * Concentrations i n IiES sample a s analyzed w i t h spark source mass
spectrometry by CTE (Ccmercial Testing Laboratories, Inc.) laboratories.
F4-18 . ~ . ~ ~ - .~ -~ ." . .
"" ~ . .~~ . .
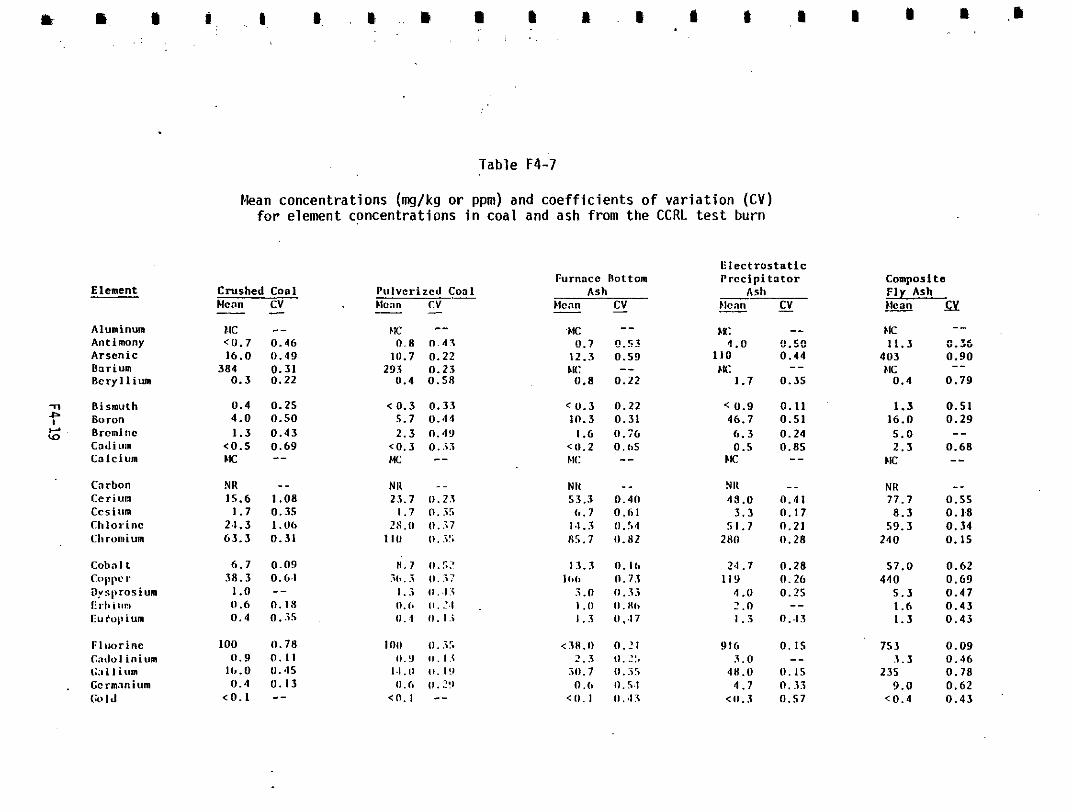
Table F4-7
Mean concentrations (mg/kg or ppm) and coefficients of variation ( C V ) for element concentrations i n coal and ash from the CCRL tes t burn
Element - Aluminum A n t i nony Arsenic Barium Beryllium
TI Bismuth f Boron t; . Brcmine
Codiwn Calcium
Crushed Coal Menn CV
1.K: "
1 6 . 0 0 .49 384
0 .3 0 .22 0 .31
0.4 0.25 4.0 0.50 1.3 0 .43
<0.5 0 . 6 9 MC
NH 15.6 1.08
1.7 0.35 2.1.3 1.06 6 3 . 3 0.31
3 8 . 3 0 . m 6 . 7 0.09
n .6 0 . 1 8 1.0 "
0.4 o . . ~
Ion n . 9 0 . 1 1
11.71)
~L
< n . 7 0.46
"
"
11P.O 0.45
< O . l "
0 . 4 0 . 1 3
Mcnn cv Pulverized Coal "
29s 11.23 10.7 0 . 2 2
0.4 o.sn < 0 . 3 0 . 3 3
5 .7 0 .14
c 0 . 3 n . . x 2.3 n . w
Mc
NII 23.7 11.21
2s .o 0 . 3 7 1.7 n..x
1 I11 11. i!.
,313 . .; I1 . .7 7 n . 7 ll .5:!
l . , i I I . . I . ; 11.1. II.:.I 0 . 4 11 .1 . ;
1011 1 l . . i 5
1.I.11 11. I!) I1.Y 0 . I.<
11.6 ( I .? ! l
"
"
(0.1 --
Furnace Bottom Ash
Mcnn - cv - ' M c
D.7 "53 12.3 0.50
0.8 0 . 2 2
"
hm: "
< 0 . 3 0 . 2 2 10.3 0 . 3 1
'11.2 O.h5 1.6 0 . i G
Ell:
N It
"
53.3 0 . 4 0 "
1.1.3 0 . 5 4 11.7 0.61
8 5 . 7 l l .82
13.3 0.11, 101, n . 7.3
.;.n o.s.5 1 . 1 1 ll.tll> 1.3 11.47
Electrostatic Prccinitator Comnosits I.1; Ash
hU:
110 hK:
?.!!
1 . 7
< 0.9 46 .7
6 . 3 0.5
LK:
NII 4 8 . 0
3 . 3 51 .7
2nn
7.1 .7 119
4 .n 2.n 1 . 3
916 3 . n
4x.n 4 . 7
< l l . 3
0 . 4 4 403
0.35 EIC "
0.4
0 .11 0.51 16.0
1.5
0 .24 5.0 0 . 8 5 2.3 " &IC
NH 72.7
0 . I7 8 . 3 n.21 11.28 210
59.3
0 . 2 8 5 7 . 0 0 . 2 6 0 . 2 5 5 . 3
1 . 6 O A 3 1.3
..
0 . 4 1
410
"
n. 15 753 " J . 3
9.0 c0.4
0. is 235 n. 53 n.57
"
n .< Y..."
0.90
0 . 7 9
0.51 0 . 2 9
"
0 . 6 8 "
"
"
0.55 0 . 1.8 0 . 3 4 0.15
0 . 6 2 0 . 6 9 0 . 4 7 0 . 4 3 0 . 4 3
0 . 0 9 0 . 5 6 0 . 7 8 0 . 6 2 0 . 4 3

Table F4-7
(Continued)
Crushed Coal
Wean CV "
1.5 0.53 0.7 0 . 3 8 " "
s m n.3 0.33
"
<0.1 "
Nc 13.7 0.35
3,7 0 . 1 6 13.0 0.67
0 .2 0 .5
"
hIC 138 0.65
0.1 0.19 3 . 7 0 . 5 7
5 .7 0 . 2 0 19.3 0 .37
7 . 0 0. 14
0.1 "
"
" "
"
e 0.1
do. I U:
"
"
453 a.b7 "
"
Pulvorimd Coal Furnace Bottom
Ash Moan 1.2 "
k i l n CV
1.6 0 . 7 3 0 . 6 0 . 0 9
I - 2.0 . "
" " "
1 .7 0 .35
Slll "
"
s'rn 0 . 3 0.22 w . 2 0 .35
"
< f l . l "
w: . -- 13.7 "
5 . 3 0.39 1n.7 0.62
0.1' "
m: 77 .7 0.112
I ) . I 0. 24 3 . 7 0 . 1 6
5 . 7 0.1'7 2 1 . 7 0 . 2 5
"
. 9 . 7 O . . l ? " "
c 0 . 1 "
Nc C 0 . I
4 1 . 0
32.7 9 . 7
0 . 2 N(:
356 0.0 H.7
1 6 . 3 4 1 . 7 17.3
< 0.1 "
0 . 4 3
0.24 0.39 0 . 4 1
"
"
0.61 a. 22 0 . 1 8
0 .25
0. I 9
0.13
11. t17
"
" " "
c 8 ) . I " i 0 . 1 0 . 4 3 630 0. I!)
.:11.1 "
' 830 n.21
CY: i 1 l . 2 0.35 MI:
"
" "
Electrostvtlc Precipitator
Ash
Wean cv 3 . 0 -- 2 .3 0 .25
- -
"
s'rn "
"
1.5 ' 0 .53
!E a . 3 0.57
4 0 . 0 0 . 4 8
107 31.7 0.50
0 . 6 5
0 .5 0.11 In:
4 i& 0 .71
"
-_
13 .0 0.35 1 . 5 0 .25
11.1 12.7 0.12
28 .3 0 .27 0 .25
< 0. 3 0~. 57
s n . 3 0.57
" "
" ..
M(: "
m: ;11.3 0 . 5 7
"
Compos1 to F l y Ash
Muan cv - 7 . 0 0.65 2 . 0 0.50
-
ST0 " "
"
1.0
<0.4 Mc
0 . 4 3
52.1 1.18 74.7 10.3
0 .43 0.39
0.6 0 . 4 1
0 . 5 6
2 8 . 0 0.59
34.3 0.69 298 0 . 7 8
6 0 . 7 0.67
< 0.4 0 . 4 3
"
"
ki: >75b
"
1 .o a. 38
" "
"
6 0 . 4 C 0 . 4 3 &IC
w
"
'0.4 . 0 . 4 3
"
"

Element
Praseodymium Rhenium Rhod i urn Rubidium KuLiwtnium
Samarium
Selcniurn Scandium
S i l i c o n T P 1 S i l v e r
Sodium Stront ium S u l f u r Tantalon Tel lur ium
T c 10i SUI
Tltorium I ~ t . ~ l l ~ u r n
Thu 1 i u!n T i n
Ti tan ium Tung2:Ien Urnniurn
Ytterbium ?nnodiorn
2
Crushed Coal
Mean cv "
1 . 7 0 . 6 9
< O . l "
0.1 -- 1 4 . 0 0 . 6 9
< U . I "
8 . 0 0 . 2 5 3 . 0 0 . 3 3
&IC 1 . 6 0 . 3 9
C 0 . 2 0.50
)IC 9 9 . 7 0 . 2 7 Mc
< 0 . 2 0 . 8 7
0 . 2 I ) . ? S < 0 . 5 0.s9
0 . 2 0 . 3 5 3 .7 0 .16
0.9 0.11
"
"
. : 0 . 1 "
"
MC < 1 . 1 0 .71
"
0.9 0 . 2 7
(Continued)
P u l v e r i z e d Coal
Mean CV "
3 . 0 , "
' < O . l "
< 0 . 1 "
11.7 0 . 4 0 < 0 . 1 . "
2 .7 0 .22
. 2 . 3 0 . 2 5 Mc 4 . 2 0 .65
&IC "
Nc c 0 . 1 "
c 0 . 2 0 . 5 0
9.0 0 . 8 0
"
96.s 0 . 7 5 "
< 11. 5 11. .'2 11.3 1 I . i . ; *
2 . 7 0 . 2 2 0.1 0 . 4 3 1 . 0 "
NC "
11.9 0. I &
124 0 . 6 7 2 . 0 "
0 . 9 0 . 8 6
Furnace Bottom Ash
Mean CY - - 7 . 3 0 .61
( 0 . 1 0 . 4 3 < O . l 0:43 3 8 . 3 0 .51
< O . l 0 . 4 3
H . 3 0.14
5 . 3 0 . 6 0 FK: < 0 . 2 0.25
Mc 300 0 . 1 9
79.0 0 .79 < I ) . 1 u . 4
1s.11 0 . 2 8
"
< o . 2 n . x
11.7 O.:S < 0 . 6 0 . 5 1 14.0 0 . 2 1
1 . 1 0 .74 0 . 2 0 . 2 5
Mi: < u . g n.11
"
6 . 3 0.18 223 0.46
2 .u "
E l e c t r o s t a t i c P r e c i p i t a t o r
Ash
Elcan cv
c o . 3 0 . 5 7 6 . 7 0.09
<0.3 0 . 5 7
<u.s 0.57 3 0 . 3 0 . 4 5
- -
2 7 . 7 0 . 2 6 5 . 9 0.87
4:3 0 . 1 3 bK: ' 0 . 6 0 . 5
416 hlc
0 . 3 0
< o . s u . 5 7
"
"
>n30 0 . 3 5
c 0 . 4 0 . 2 5
0 . 8 0 . 1 4 < u . 9 u . 1 2 15 .7 0 . 7 9 0 . 4 0 . 1 6 3 .7 0 . 3 1
cy: "
c 2 . 0 0 . 5 0
D623 7 . 3 0 . 6 7
3.5 0 . 1 7 0 . 5 3
Composite F l y Ash Ne"R - cv 1 2 . 3 0 .12 < 0.4 0 . 4 5 < 0 . 4 58 .0
0 . 4 3
< 0 . 4 0.20 0 . 4 3
17 .0 0 . 5 6 4 0 . 3 12 .3
0 . 7 7 0 . 4 5
EIC 1.0 0.82
"
w
>84 3 580 0 . 5 4
0 . 3 1 c 0 . 4 c 0 . 4
0 . 4 3 0 . 4 3
0.0 0 . 3 5 < 1 . 7 0 . 6 9 1 1 . 7 0 . 4 1
1 3 . 7 0 .6
0 . 7 5 0.41
M: q 2 . 3 0 . 4 9
> 8 2 3 6 . 0 0 . 4 4
0 . 3 5 3 .3 0 . 4 6
"
"

Table F4-7
(Continued)
r
Electrostatic Furnace Batto8 Prec ip i ta tor Co.posLto
Element Crushed Con1 Pulverized Coal Aah Ash P l y Ash
%M CV Monn CV . Ursn CY Moan " "
cv "
Mean CV - Yttrlua 16.3 0.42 Zinc 32.7 0.84 55.3 0 .70 61 .3 0.68 Zirconium 11.3 0 . 4 1 122 0.49 150 0.13
- 13.0 0.27
- - - 40.7 0.28 53.7 0.42 89.3 9.74
180 0 .24 623 0.48 403 0 .44 523 0.51
~ 'NOTE: Elemental concentrations in samples A , B and C (Table F4-5) were used to calculate means
I - i standard deviation to the mean and expresses the relative variability of an element's concentration included in th i s s ta t i s t ica l ana lys i s . The coefficient of variation i s the r a t io of the
I ' N and coefficients of variation for coal and ash material. The sample of washed coal B was not
, . among the three satnples. I I mean and the mean was then indicated as "less than" (<)'calculated value. For concentrations
For concentrations less t h a n the detection limit, the detection limit was used to calculate the
greater than 1000 ng/kg. 1000 mg/kg was used to calculate the nean and the mean was indicated as "greater t h a n " (.) calculated value.
NR = not reported.
I i '
** MC = greater than 1000 mg/kg.
, ,
I
1
m
a
I
...
types of coal used in the t e s t burn. For this reason, mean values are used irl subsequent discussions in this report. No weighting in the averaging by a coal characteristic (such a s by heating value) could be jus t i f ied .
Although sample var iab i l i ty could be relat ively high for some elements, a tsolute values obtained for trace element concentrations are qui te low. Thus, "true" concentrations are n o t l ike ly t o be dras t ica l ly d i f fz ren t (orders of magnitude) from average values calculated from analyti1:al measure- ments. As a consequence, the mean values utilized in the discussions of t h i s report r e p r s e n t an adequate baseline for impact analysis.
Since washing of coal cculd remove some elements, a port ion of sample B ma l was washed prior t o p i lo t t es t ing and elemental analysis was performed or resultant materials. Comparison of element values in washed and unwashed ccal samples (Table F4-5) indicates that washing does n o t affect concentrations of most elements in the coal. Apparent decreases of elemental concentrations ir the washed coal were n o t supported by decreases i n concentrations in the ashes. Differences between t race element concentrations in crushed coal and pLlverized coal are minor, and a s t a t i s t i c a l t-test indicated that differences a re n o t s t a t i s t i c a l l y s i g n i f i c a n t a t the 95% confidence level.
Based on resu l t s l i s ted i n Table F4-5, many elements are enriched' in e lectrostat ic precipi ta tor asll and in' f l y ash as compared t o coal and fuwace bottom ash. Several (elements such as As, Cu, F, Pb, Ni, Hg, and Zn ar: reported t o be either vaporized or converted t o vo la t i le compounds d u - i n g coal combustion. ""' 217 As the f lue gas proceeds up the s t x k , i t cools and these vaporized quantities begin condensing on the supfaces of par t ic les suspended i n the f lue gas. The model of Natusch e t a lU3 pos tu la tes t h a t since the ratio of surface area t o mass increases for sm,iller particles, concentrations o f absorbed elements are higher i n the ve:-y small par t ic les t h a t escape the precipitator.
In evaluating enrichment of an element in ash versus coal, i t must be reaembered t h a t 70 t o 75% of the original coal i s l o s t as non-ash combustion prllducts. Therefore, concentrations of noncombustible materials i n coal

would be increased by a factor of three t o four in the ash assuming a l l the non-cabustible material remained i n the ash. Examples of several element enrichments follow:
II
- 1. Niobium - Niobium (Nb) has a very h i g h melting p o i n t (245OC) and
i s n o t readily volati l ized d u r i n g combustion. Therefore, Nb should be retained in heavier ash particles, particularly in the furnace bottom ash. Niobium concentration i n coal is 8 ma/kg (average f o r crushed and pulverized raw coal samples), whereas in the furnace ash and precipitator ash, the average Nb content is 17 and 28 mg/kq respectively. Assuming a 30% ash content for the coal samples, coal ash would contain a calculated Nb content of 27 mg/kg i f a l l the Nb contained i n coal remains i n ash after combustion. Since this calculated ash value o f 27 mg/kg i s reasonably close t o measured concentrations of 17 and 28 mq/kg, i t i s concluded tha t Nb i s being retained i n collected ash.
2. MeKury - Since mercury (Hg) is a vo la t i le element, i ts concentration i n heavier ash pa r t i c l e s i s expected t o be low. Average Hg content i n raw coal i s 0.12 mg/kg. If Hg was equally distributed t o a l l ash materials, its concentration i n furnace bottom ash and precipitatpr ash should be abou t 0.4 mg/kg. Measured Hg concentrations i n furnace bottom ash (0.02 t o 0.03 mg/kg) are about a factor o f ten .lower than the calculated value of 0.4 mg/kg. However, Hg con- centrations i n e lectrostat ic precipi ta tor ash (1.15 t o 2.39 mg/kg) exceed not only the calculated "equal distribution" value of 0.4 mg/kg, b u t also values measured for f l y ash (0.61 t o 1.52 mg/kg). These comparisons o f Hg values in coal and various ashes indicated tha t Hg i s depleted i n heavier ash (furnace bottom), and enriched i n precipitator and f l y ash. Contrary t o expectation, lower concentrations o f Hg were measured in f ly ash (par t ic les tha t passed through the precipitator) than in electrostatic precipitator ash. Previous studies have show as much as 90% of the original Hg is emitted i n gaseous phase. 213, 214, 215, 216 Since any gaseous Hg would have escaped detection i n the test burning sample, a significant portion o f the original mercury may have been emitted i n the vapor phase.
~ . . ""
u
'"I
~~
- . R
.- I
."
*

P I
I
I
..
0
0
II
3. F luor ine - F luor ina ( F ) values i n coal average about 80 mg/kg (Table
F4-5). -If F was even ly d is t r ibu ted and r e t a i n e d i n c o a l ash, the
ca l cu la ted F content i n ash would be about 270 mgfkg fo r coa l having a 30% ash content. Measured F values (680 t o 10.30 mg/kg) i n p r e c i p i t a t o r ash and f l y ash ma te r ia l s were 3 t o 4 t,imes grea ter than this value. Therefore, considerable enrichment o f F has occurred
i n p r e c i p i t a t o r asti and f l y ash as compared to bo th coa l and furnace bottom ash. A d d i t i o n a l l y , some unknown percentage of F i n c o a l was l o s t as gaseous emiss ion du r ing t he p i l o t t es t .
The d i s t r i b u t i o n and coccent ra t ion o f elements among furnace bo.ttom ash, e l e c t r o s t a t i c p r e c i p i t a t o r ash and f l y ash appears t o be r e l a t e d t o t h e e x i t tempera tures dur ing the p i lo t tes t burn because o f t h e m e l t i n g and vaporiza- t i o n p o i n t s o f t h e elements. It i s probable that the more v o l a t i ' e elements were vaporized during combustion and condensing on f i n e f l y ash p a r t i c l e s o r were emit ted as gases and the re fo re escaped being sampled d u r i n g p i l o t t e s t burns. Taking the ash content o f t h e c o a l i n t o account, the composition o f furnace bottom ash and coal a r e similar f o r many elements. Therefore, some elements w i t h h i g h e r m e l t i n g and vapor izat ion po ints are probably not enr iched i n f i n e f l y ash p a r t i c u l a t e s b u t p o s s i b l y escape as gases.
Eased on CCRL tes t burn da ta , As, Cr, Cu, F, Ga, Pb, Mn, N i , S r , S, V, Zn, and Z r a r e the pr inc ipa l e lements enr iched in f l y ash t h a t would most 1 i k e l y be emi t ted by the power p lant .
( i i ) B a t t l e R i v e r t e s t b u r n
I
I*-
Q
m
Y
B.C. Hydro conducted a bglk H a t Creek coal sample tes t bu rn a t t h e B a t t l e 246 River Power P lan t o f A lbe r ta Dower, Ltd. between August 5th and 31st, 1977.
Ths Ba t t l e R ive r s ta t i on , nea'r Forestburg, Alberta, has a nominal c a p a c i t y o f
32 MW w i t h p r e c i p i t a t o r equipment similar t o t h a t of the proposed H a t Creek poNer p lant . Dur ing the test:;, spec ia l samples were c o l l e c t e d t o i n v e s t i g a t e th: emissions of selected trace elements. I n pa r t i cu la r , t he em iss ions o f p o t e n t i a l l y v o l a t i l e elements, arsenic, f luorine, mercury, and selsnium, were m e w r e d i n b o t h p a r t i c u l a t e and gaseous forms. The mon i to r ing was performed by Western Research and Development (WR&D), which has completed a separate and de,:ailed repor t fo r severa l t race e lements f r o m th i s s tudy . 246 Th,3t r e p o r t

describes the t e s t b u r n procedures i n a manner similar t o the description of the CCRL t e s t burn given in the previous section. The sampling described below i s a brief overview. Table F4-8 l ists the operating conditions for the six runs d u r i n g which trace elements samples were obtained by WR&O. This table also contains the element concentrations determined fo r various phases applicable t o the collection technique utilized for that element. For example, arsenic, f luorine, mercury, and selenium were measured i n b o t h the gaseous and solid emission stage whereas 17 elements, including the above four , were measured i n coal and ash stages. These concentrations and the tes t burn from which they were measured are presented i n Table F4-8.
The most important aspect o f the Battle River pow& p lan t t es t b u r n from trace element consideration is the specif ic sampling performed for gaseous emissions o f Hg, Se. As, and F. This was accomplished w i t h a standard sampling t ra in including particulate f i l ters and gaseous emission x r u b b e r s . Results from the CCRL p i l o t test bum d i d not enable experimental estimation o f elemental concentrations likely t o ex i s t i n t h e gaseous emission phase. Therefore. data from the ga t t l e River power p lan t t es t burns were used t o estirrate the ful l -scale emissions o f the porposed Hat Creek power plant.
246
( b ) Coal Analyses
The f i r s t s t e p i n estimating trace element emissions from the power plant i s t o determine a re7resentative coal t o be burned durina typical operations. The Hat Creek power plant is expected t o consume 42,600 metric tons of blended coal per day. Although the mine has natural variabil i ty of coal character is t ics , the mining, storage and feeds systems are expected t o produce a reasonably blended coal. Thus a composite sample of the ent i re coal deposit t o be mined i s of the most in te res t for predicting trace element emissions.
( i ) Mine Mean Coal
More than 200. core samples have been collected t o obtain material for a detailed analyses of the coal character is t ics . Eight holes were selected
z _.
c

Table F4-8 Operational conditions a t ::he Battle River Power P lan t t es t burn
using Hat Creek coal
.I
I '
r.
.. "
1
~~~~~ ~~~~
- Test date August 14 , 1977 August 20, 1977 August 21 , 1977 -
Coi!l f i r ing rate (kg/hr)
St;!ck gES flow ra t e (rn3/rnin)
Total particula e emissions (mg/m 5 ) Precipitation efi ' icienty (%)
Ernissjon concentrations* h/rn 1
Arsenic-solid
Boron
Chromi urn Cadmi urn
Copper
Fluorine-solid
Lead Mercury-solid
Manganese Molybdenum
Nickel Sel eni urn-sol i d
Strontium Vanadium Zinc
-gaseous
-gaseous
-gaseous
-gaseous
16,780
1,040
248
"
<0.0170 <0.0102
"
"
"
"
"
0.0093 "
"
"
"
"
"
"
"
"
"
"
25,170 27,160 15,100 22,630
2,710 2,740 1,550 2,410
140 209 22 126
99.65 99.52 39.92 99.72
-.. "
- ._ 0.0116 0.0173
<0.00118 0.00345 0.00140 0.00761 0.00333 0.01 31
"
- .. " - .. "
<0.0011 <0.0062 <0.0025 ~0.0093
<O.OC1161 0.00553 0.0350 0,1272
<O.OC1480 <0.0036 O.OC1452 0.0235
cO.OCI146 <0.0182 O.OC8151 0.0201
<O.OC118 0.00138 0.0752 0.0422
- .. "
- NOT.: Two t e s t s were performed on each date.
" D parameter not measlJred.
* Double entries include !solid value (upper entry) and gaseous value (lower entry) when both were measured. Single entry is solid value.

by B.C. Hydro as representative in spacing and depth. Composite samples were produced for each hole by taking a small, equal po r t ion from each three meters of the coal i n the core. These eight compositesamples were then analyzed f o r trace element content (Table F4-9). An arithmetic mean was calculated and these values, representative of the mine mean coal, are shown in the last column of Table F4-9.
( i i ) CCRL Coal Samples
A t the time o f the CCRL t e s t burn , coal was available i n suff ic ient quantity only from shallow bucket-auger dril l holes. Coal was separated by varying heat content i n three classes. Coal A was classif ied low heat value, coal B as medium heat value, and coal C as h i g h heat value. Ob- viously, such coal was not entirely representative of the coal deposit. Any conclusions drawn from the CCRL t e s t s must be adjusted by trace element differences i n mine mean coal and t e s t bu rn coal.
Although i t i s recognized that coal characteristics other than concentra- tions o f trace elements (such as ash or sulfur content) may have affected the trace element disposition during combustion, i t i s necessary t o assume that a simple l inear r e l a t i o n can be used. That is, coal from the tes t bu rn can be extrapolated.to an equivalent o f mine mean coal by multiplying any trace element concentration or quantity from the t es t b u y by the ra t io o f the mine mean coal t o the CCRL coal concentration of the particular element. In this manner, for example, a concentration of 100 mg/kg (ppm) would be simulated by taking i t s r a t i o t o that measured in CCRL coal, say 200, and using the resulting factor of 1/2 t o correct predictions made from CCRL data. Table F4-10 presents the mine mean coal and CCRL coal concentration and their r a t io fo r a l l analyzed trace elements.
( i i i ) Battle River Coal Samples
As i n the CCRL t e s t burn, the coal used i n the Battle River t e s t s i s n o t completely representative o f the whole coal deposit. In contrast t o the CCRL
t
,-
-c
"I
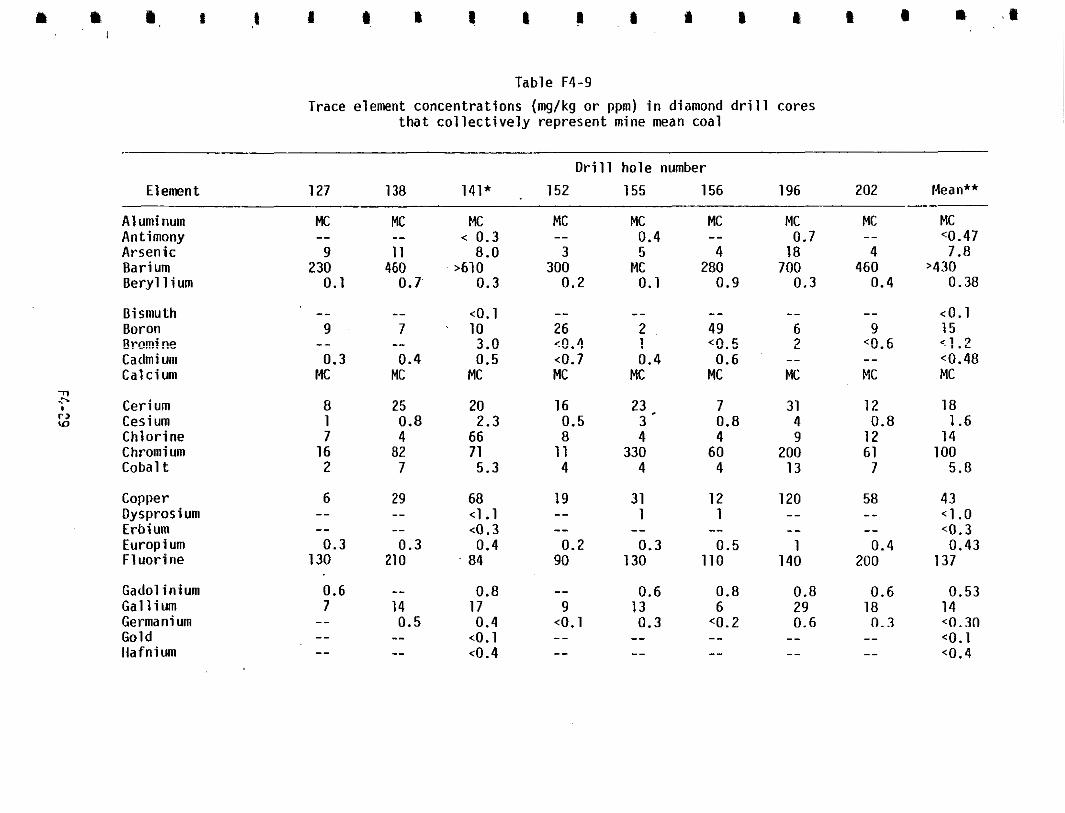
Table F4-9 Trace element concentrations (mg/kg or ppm) in diamond drill cores
that collectively represent mine mean coal
Drill hole number El emen t 127 138 141* , 152 155 156 196 202 Mean**
A1 umi num Mc MC Mc MC MC MC MC MC MC Antimony " " < 0.3 " 0.4 " 0.7 " C0.47 Arsenic 9 11 8.0 3 5 18 4 7.8
230 4
460 Barium >610 300 MC 280 700 460 ,430 Beryl 1 ium 0.1 0 . 7 0.3 0.2 0.1 0.9 0.3 0.4 0.38
Bismuth Boron nrcmi ne Cadmium Calcium
. I .- I Cerium W Cesium r>
Chromium Chlorine
Cobalt
Copper Dysprosium Erbium Europi um Fluorine
Gadolinium Gallium Germanium Go1 d Hafnium
"
9 7 , 10 <o. 1 "
26 " <0.1
2 49 6 9 15 7 n
0.3 -0.4
0.4 1
0.5 <O.F
<0.7 0.4 2 9.6 < ? .?
Mc MC MC 0.6
Mc MC MC MC MC MC
" " " "
" " ...e
" " <0.48
8 1
25 0.8
7 16
4
2 02 7
6 29 "
"
"
"
0.3 0.3 130 21 0
0.6 7 14
"
" 0.5 " "
" "
5.3 4 4
68 19 31 <1.1 " 1 <0.3 0.4 0.2 84 90
0 . 3 130
" "
0.8 0.6
0.4 <o. 1 0.3 17 9 13
<o. 1 ~0.4
"
"
"
"
"
7 0.8
60 4
4
12 1
0.5 "
110
0.8 6
<o. 2 "
"
31 4
200 9
13
120 "
"
140 1
0.8 29 0.6 "
"
12
12 0.8
61 7
58 "
"
0.4 200
0.6 18 0 . 3 "
"
18
100 14 1.6
5.8
43 <1 .o <O. 3
137 0.43
14 < n . m <o. 1 <0.4
0.53

Table F4-9 (Continued)
Orill hole number E l enlen t 127 138 141* 152 155 156 196 202 Mean**
Holmium I nd i UIII Iod ine
I r o n I r i d i u m
Lanthanum Lead L i th ium
Magnesium Lutet lunl
Manganese Mercury Molybdenum Neodynli um Nickel
Osuti um Niobium
Palladium Phosphorus Plat inum
Potassium
Rhenium Praesodyfnium
Rhodium Rubidium
ST0 ST0 STD <O. 5 "
ST0 0.4
STD 1
ST0 ST0 ST0 ~0 .63
-- " <0.4 " 0.2 < O . 3 0.3 " <0.03
Mc MC Mc MC MC MC MC Mc <0.1 MC
7 15 21 10 7 l a 7 14 6
24 12
60 6.7 4
63 7 6 <2
41 9
74 25 60 7 4 . 6
4 2
Mc Mc Mc (0.2 "
Mc MC MC Mc MC <O. 2 MC
270 36 >400 1 ao 120 27 340 220 0.09 0.19
<200 0.2
1 0.14
2 2.0 0.12 0.07 0.2
1 1 3 0.1 0.14
2 3 2
5 4.9
6.3 4
3 6 40 22 15 32 11 110
3 6 5 4.5 29 33
4 11 9.0 3 12 6 9 4 5.8 4 . 1 <o. 1
<O. 1
" " " "
"
" " <0.1 " " " " "
a " " " " " "
" " <o. 1 " " "
740 730 <o. 1
<910 160 400 30 MC MC 1500 <o. 1 " " "
Mc 1
Mc 3
Mc MC 14c 3.3
MC 2 3 3 3
Mc MC I b l C 2 2.6
<o. 1 " " " <o. 1 <o. 1 "
4 n 12 10 2 2 23 19 <o. 1 10
" "
" " " " " " "
" " " "
" " " "
" " " " " "

Table F4-9 (Continued)
Ori 11 hole number Element 127 138 141* 152 155 156 196 202 Mean**
Ruthenium Samarium Scandi um Selenium Si1 icon
Si 1 ver Socii um Strontium
n Sulfur I Tantalum +. w 4
Tellurium Terbium Thallium Thorium Thulium
Tin Titanium Tungsten Uranium Vanadium
Ytterbium Yttrlern Zinc Zirconium
" "
1 1
1 6
MC " <0.9
M€
IK " <O. 6
Mc 34 69 Fx: MC " "
"
0.2
2 <2
"
"
"
"
" "
830 MC
2 <2 32 110
" 0.6
" "
"
c .I
"
5 46 61
28 1 " 14
<o. 1 " 1 MC MC MC 98 57
MC
MC MC MC MC 62 42
<o. 1 -- "
<o. 1 0.3 " 0.2 0.3
<o. 1 "
<3.0 2 5 3 <o. 1 " "
0.8 0.4 1 0.0
"
"
" " "
" "
"
Mc MC MC MC <n. 1 " " "
"
5 7
MC <1
"
140 MC
MC "
"
0.3
3 "
"
1 MC "
400 2
". 2 8 6.8
2.1
" <1 .o MC MC
<0.4 '0.5 MC 110
MC
MC 76 MC
" <o. 1
0.3 <o. 1 '0.25
" <o. 1 3 '3.0 " <o. 1
"
"
MC <O. 76 MC
" <0.1
110 3
140 '2.3
" " <O. 3 ? r ... .^ 30 13 I L 9 zz I8 IU
19 26 8 35 47 13
54 40 50 57 110 61 60 25
~~

l l + I w N
Table F4-9 (Continued)
NOTE: Mc = major component (. 1000 mg/kg). " - - not detected. STD = internal analytical standard used fo r mass spectrometric analysis.
* Hole 141 i s the average of three subsamples. ** For mean values with a less than ( c ) sign. the element concentration in one or more coal samples was not
detected and the mean i s reported t o be less t h a n the mean value calculated for samples with detectable concentrations. The calculated mean i s thus higher than expected (conservative) whenever a not detected value occurred for one o r more d r i l l hole samples.
For mean values with a greater t h a n (> ) sign, the element concentration in one or more coal samples was reported as Mc and the mean i s reported to be greater than the mean value calculated for samples with masurable concentrations.

I I r Y t t i
a I 1 I s & IL
l a b l e k4-10 Trace eleolent concentrat ion rat ios for CCRL and Ba t t l e R ive r t es t bu rn
coa ls to m ine mean coal
~~~~ ~~ ~~~~~ ~ ~~ ~ ~~ ~
Average Average Ratio Mine .man , concentrat ion Rat io concentrat ion "C/
Element ( w / k g ) crushed coal (mg/kg) CCRL coal (mg/kg) River coa 1 i n CCRL r a w "C / i n B a t t l e R i v e r B a t t l e
A1 umi num Mc Mc "
Antimony ... "I..b 7.8 16.0 n;49 4 ;5 1.73 Barium 430 384 1.12 Beryl 1 i um 0.38 1.27 0.58 0.66 0.3
"
0.47 0.7 0.67 " "
"
f i r c o n i c
" "
'TI
I cJ c>
.- Bismuth 0.1 0.4 0.25 15 4.0 3.75 19.5 0.77
0.92 0.96 1.5 0.32
"
Boron Bromine 1.2 1.3 Cadmium 0.48 0.5 Calcium MC Mc Cer i um 18 15.6 1.15 Ces i um Chlor ine Chromium
0.58 1.58
Cobalt 5.8
"
" "
" " "
"
1.6 "
1.7 0.94 " "
14 24.3 100 63.3
" "
34.5 2.90 6.7 0.87 " "
Copper 43 Dysprosium 1 .o Erbi um 0.3 Europium Fluor ine
0.43 137
38.3 1 .o 0.6 0.4
101
1.12
0.50 1 .o
0.11 1.36
1IC <0.043* "
"
"
"
"
"
170 0.81

Table F4-10 (Continued)
Mine man concentration Average Average
Ratio Ratio
concentration MMC/ i n CCRL raw "C / i n Bat t le River Battle
crushed coal (mg/kg) CCRL coal (mw/kg) River coal
Element (mg/k9)
0 n I w x-
Gadol i n i u m Gal 1 i unI Germanium Gold Hafnium
Ilolmium Iodine Iridiunl
Lan thanunl Iron
Lead Lithium Lutetium Magnesium Manganese
Mercury Molybdenum Neodymium Nickel Niobium
14 0.53
0.30
0.4 0.1
0.63 0.03 0.1 Mc
14
6 . 6
0.02 NC
42
200
0.14 1.9 4.5
33 5.0
16.0 0.9
0.4 0.1 1.5
0.7 0.3 0.1 MC
13.7
3.7 13.0 0.2 Mc
1 38
0.1 3.7 5.7
19.3 7.0
O1 59 0. 88 0.75
0.27 1 .oo
0.90 0.10 1 .oo 1.02
1.78
0.10 3.23
1.45
1.40 0.51 0.79
0.03 1.71
"
"
12 "
"
"
MC
0.06 3.5 "
75 "
"
"
"
"
"
0.55 "
"
"
<O.?O*
2.33 0.54
0.44 "
"

Osmi urn Palladium Phosphorus Plat inum Potassium
Table F4-10
(Continued)
Praseodymium Rhenium
71 Rhodium I Rubidium c7 Ruthenium "- W
Samarium Scandium Selenium S i l i c o n S i l v e r
Sod i urn Stront ium
Tantalum S u l f u r
T e l l u l i u m
Terbium Thal l ium Thorium
T i n Thulium
0.1 0.1
0.1 MC
2.6 0.1 0.1
0.1
6.8 2.1
1 .o Mc 0.5
MC
MC 0.1 0.1
0.25 0.1 3.0 0.1 0.76
500
10
76
0.1 0.1
MC 0.1
453
Mine mean Average Average
concentrat ion Rat io concentrat ion MMC/ Rat io
Element (mg/kg) crushed coal (mg/kg) CCRL coa 1 (mg/ kg ) River coal i n CCRL r a w "C / i n B a t t l e R i v e r B a t t l e
1 .oo 1 .oo 1.10 "
1 .oo
"
-_ "
"
"
" "
" " "
0.1 1.7
14.0 0.1
0.1
3.0 8.0
MC 1.6
0.2
99.7 Mc
MC
0.2 0.1
0.2 0.5
0.2 3.7
0.9
1.53 1 .oo 1 .oo 0.71 1 .oo
0.70 0.85 0.63
2.50 "
"
0.76
0.50 1 .oo
0.20 1.25
0.81 0.50 0.84
"
" "
290 "
0.26 "
" "
" "
" "

Table F4-10 (Continued)
Average Mine mean concentration
in CCRL raw Ratio "c/
concentration "c/ in Battle River Battle
Average Ratio
E t enren t Cod1
(mg/kg) crushed Cod1 (nig/kg) CCRL coal (mg/kg) River
Titanium Tungsten Uranium Vanadiunl Ytterbi um
Yttrium Zinc
n a Zirconium
Mc 0.1 2 . 3
0 . 3 140
13 25 60
MC 1 . 1
85.7 2.3
0.9
16.3 32.7 7 2 . 3
0.09 1 .oo 1.63 265 0.33 " "
" " "
" "
8.0 0.29 0.53
0.80 0.76 0.83
" "
83.5 0.30 " "
NOTE: I N = mine mean coal, see Table F4-9 MC 5 major component (>lo00 ng/kg). -- = element was not measured.
* Calculated assuming Mc = 1000 mg/kg.
I
I
m
I
c3se, however, much larger samples, excavated by trenching, were shipped t o the Battle River plant. Table F4-11 gives results of analyses of' the Battle River coal for trace elements. Since all trace elements were not: measured dur ing each t e s t burn, the t race element extrapolation t o mine mean coal must be done only with the coal used for the appropriate tests. The correct analyses t o use have been underlined in Table F4-11 and their averages are presented in Table F4-10 which also includes the corresponding raltios t o mine mean coal.
( c ) Emissions
The f i r s t s t e p i n the estimation of fu l l - sca le power plant emissions i s t o scale the coal analyses t o a representative mine mean coal, as. was des- cribed i n the previous section. Secondly, estimated full-scale emissions of trace elements must be calculated. The procedure i s essent ia l ly the same for the two t e s t burns.
Emission measurements were carefully performed i n the Battle River
t e s t s , w i t h instrumentation specif ic t o gaseous and particulate emission
estimation than the earlier CCRL t e s t s . Because the coal f i r ing ra tes a id emission stream parameters were a l l measured, i t i s possible t o scale the coal f i r i ng r a t e t o tha t o f the Hat Creek plant, ad jus t the t race element con- centrations i n the coal by the aforementioned r a t io s , and thereby scale the emission measurements t o a ful l -scale power plant simulation. This i s a l so possible f o r the pi lot scale CCRL t e s t s , however, only the emission rates o f
solid trace elements can be scaled by coal concentrations and tot:al par t iculate na t t e r emitted.
These samples are considered t o be more reliable for emissions
( i ) CCRL Emissions
The primary purpose of analyses presented thus far has been t o determine the ult imate fate of trace elements i n coal consumed a t the power plant. In principle, any element introduced as p a r t of the coal t o the boilers o f the

Battl e Riv Table F4-11
er test burn coal analyses for trace elements (mg/kg)
Element Auaust 14, 1977 August 20, I977 Auaust 2 1 , 1977 Test Dates
Arsenic Beryl 1 ium
Cadmi um Boron
Chromi um
Copper F1 uori ne Lead Manganese Mercury
Molybdenum Nickel Selenium
Uranium Strontium
Vanadium Zinc
8 1 11 12 23 7 0.7 0.3 1 0.4
0.4 7 15 12 25
0.8 0.3 14
0.8 0.6 0.8 1 T 72 36 40 60 - - 41 28
1
140 420 100 120
530 180
MC 160
MC 250 84
13 11 9 20 96
13 BO 160 MG 66 140 MC
13
0.10 0.11 0.08 0.05 - 0.07
- - -
- -
- - - -
- -
0.06 -
- 4 4 4 4 29 6
3 11
4
2 1 19 7 13 - TO - TO
27 110 a4 110 170 350 730
4
2 6 6 5 10 6
- - - 79 240 120 65 160 370 41 41 46 38 . 71 - - 96
-
NOTE: TWO tests were performed on each date. Underlined concentrations
average value in coal was used for calculating ratio of mine mean indicate that element was measured in emissions for that test and
coal to Battle River coal (see Table F4-10).
MC = major component (> 1000 mg/kg).
Fr-3:
."
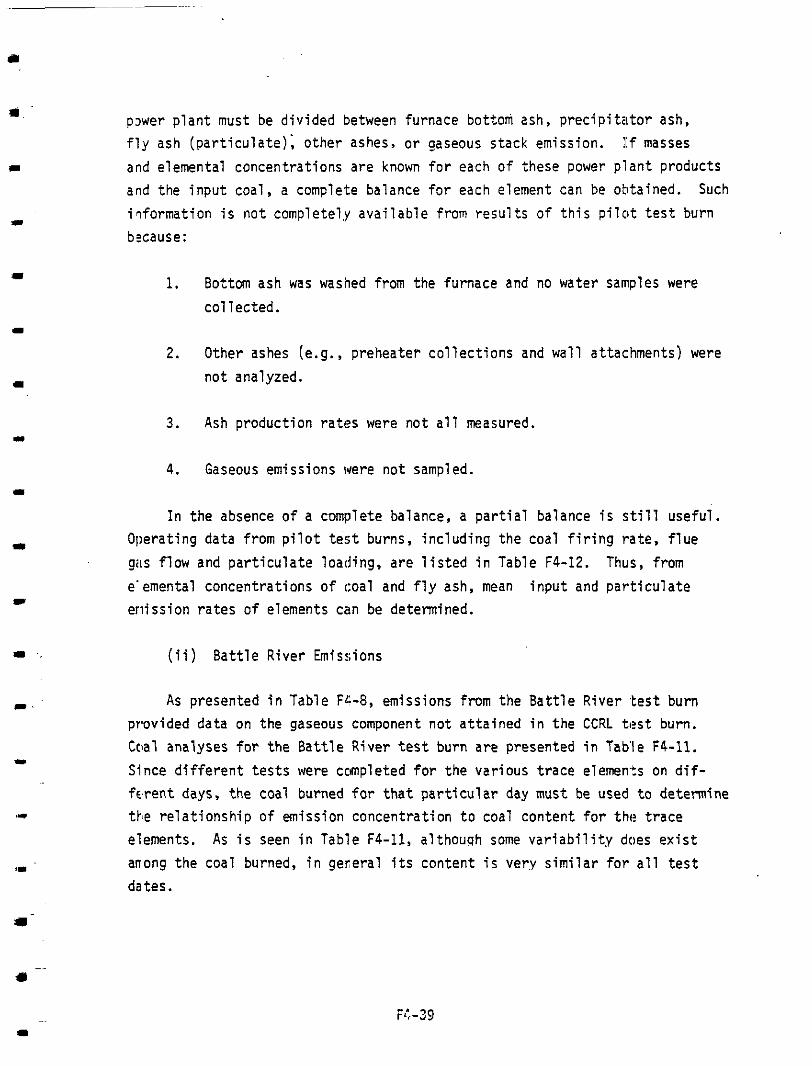
pDwer plant must be divided between furnace bottom ash, precipitator ash, f l y ash (particulate); other ashes, or Gaseous stack emission. l:f masses and elemental concentrations are known fo r each of these power plant products and the input coal, a complete balance for each element can be otrtained. Such i lformation is n o t complete1,y available from resul ts of t h i s p i l o t t e s t burn bxause:
1.
2.
3.
4.
Bottm ash was washed from the furnace and no water samples were collected.
Other ashes (e.g., preheater collections and wall attachments) were n o t analyzed.
Ash production rates were not a l l measured.
Gaseous emissions were not sampled.
In the absence of a complete balance, a par t ia l balance is s t i l l useful . Operating d a t a from p i lo t te!;t burns, including the coal f i r i n g ra te , f lue gas flow and particulate loading, are l isted i n Table F4-12. Thus, from e'emental concentrations of coal and f ly ash , mean i n p u t and par t iculate eriission rates of elements can be determined.
( i i ) B a t t l e River Emissions
As presented i n Table Fr.-8, emissions from the Battle River test burn provided data on the gaseous component not attained i n the CCRL t e s t burn. Coal analyses for the Battle River t e s t burn are presented in Table F4-11. Since different tes ts were ccmpleted fo r the various trace elements on d i f - ferent days, the coal burned for tha t par t icu lar day must be used t o determine t t ,e re la t ionship of emission concentration t o coal content for the trace elements. As i s seen in Table F4-11, a l t h o u g h some var iab i l i ty does ex i s t anong the coal burned, i n general i t s content i s very similar for a l l t e s t dates.
I

Operating data for CCRL pilot test burn runs on three samples of Hat Creek coal
F l y Ash Coal Charge llcat Flue Cas F l y A s h Fly Ash Emission Rate
number* T e s t Ita t e Content Eff ic iency Ita t 's bncting Enkission nate**aC 99.7% e f f . * * *
(kg/hr) (nu/ " I h dry) (9*), ______ [std I I I / I W ) ($:/std "_ n1 ) (g/l lr) (g/kr)
2 . 2 156 5542 9 6 . 2 5!)7 40.3 914 7 2 . 2
4 . 2 1 3 2 no30 9 2 . 0 696 1 1 . 6 64 6 2 4 . 2
___-
6 . 2 104 n720 94.0 561 8 . 1 6 275 13.8
Average 130 74 30 9'1 . 1 61n 2 0 . 0 61 2 3 6 . 7 -rl 0 1 4.. 0
*Coal used i n v a r i o u s tests descr ibed i n Table P4-4. Tests performed by CCRL. 245
* * D e f i n e d a s ( f l y a s h l o a d i n g ) x (gae f low) x (1 - e f f i c l e n c y ) .
***Assunled f u l l - s c a l e e l e c t r o s t a t i c p r e c i p i t a t o r e f f i c i e n c y ( C o n c e p t u a l D e s i g n R e p o r t ) . 232
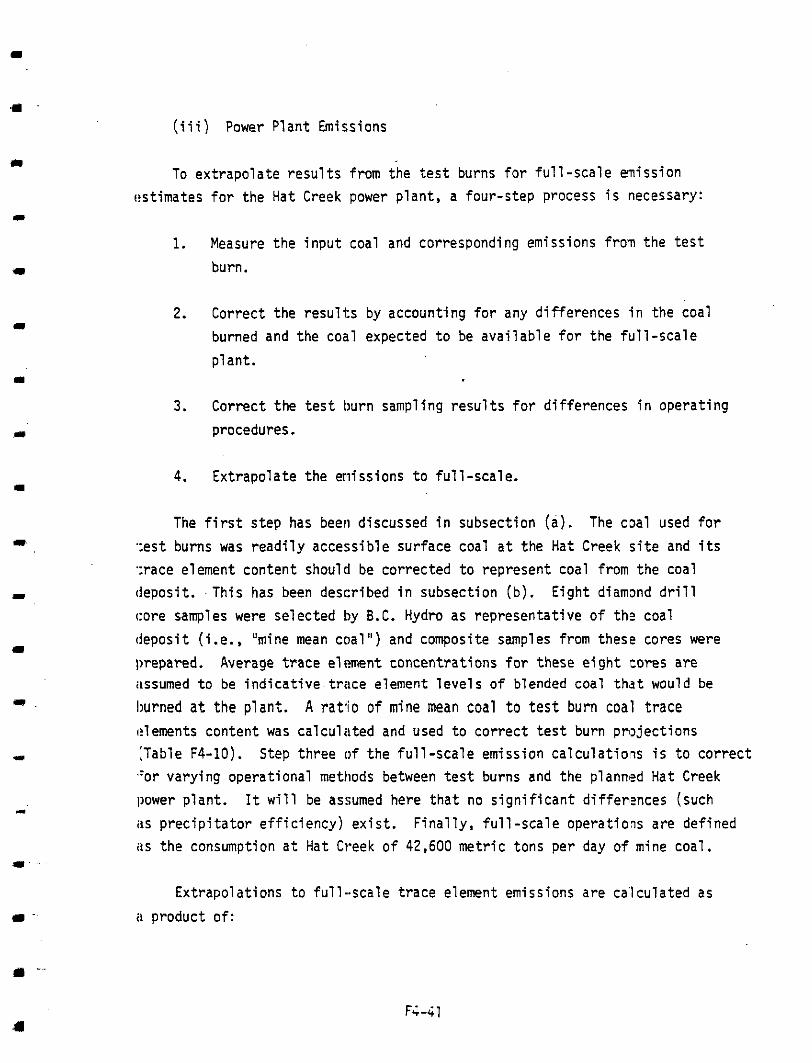
:. I
- I
I
I
I
I
I
II
1
( i i i ) Power Plant Emissions
To extrapolate resul ts from the tes t burns for fu l l - sca le miss ion estimates for the Hat Creek power plant, a four-step process i s necessary:
1. Measure the input coal and corresponding emissions from the t es t burn.
2. Correct the results by accounting for any differences in the coal burned and the coal expected t o be available for the full-scale plant.
3. Correct the t e s t burn samplfng results for differences in operating procedures.
4. Extrapolate the emissions t o full-scale.
The f i rs t step has been discussed i n subsection (a). The coal used fo r ':est burns was readily accessible surface coal a t the Hat Creek s i t e and i t s ':race element content should be corrected t o represent coal from the coal deposit. .This has been desc:ribed in subsection ( b ) . E i g h t diarnmd dril l core samples were selected by B.C. Hydro as representative of ths? coal deposit (i.e., "mine mean coal") and composite samples from these cores were prepared. Average t race elt?ment concentrations for these eight cores are assumed t o be indicat ive. t race element levels o f blended coal th8st would be burned a t the p l a n t . A rat'io o f mine mean coal t o t e s t burn coal trace elements content was calculated and used t o cor rec t t es t burn p r ~ ~ j e c t i o n s :Table F4-10). Step three of the full-scale emission calculations is t o correct "or varying operational methods between t e s t burns and the plann,?d Hat Creek power plant. I t will be assumed here that no significant differlmces (such {IS precipitator efficiency) exist . Finally, full-scale operatio,ns are defined i I S the consumption a t Hat Creek of 42,600 metric tons per day of mine coal.
Extrapolations t o ful l -scale t race element emissions are calculated as i~ product of:

1. Ratio of mine mean coal (MMC) t o t e s t b u r n coal concentrations,
2. Ratio of Hat Creek power plant coal f i r ing ra te (42,600 metric tons per day) t o t e s t b u r n coal f i r ing r a t e ,
3. Particulate or gaseous emission ra te from t e s t b u r n ,
4. Trace element concentration (particulate only) in test b u r n emissions. L
All of the i n p u t values are i n tab1 es in this chapter and are included or referenced i n Table F4-13. Emissions are given i n kg/day for b o t h extra- .. polations from the CCRL and Battle River test burns. The table footnotes again s m r i z e the mathematical calculations. L
Data from the Battle Creek power plant tes t burns were used t o project full-scale stack emissions o f various t race elements that are l ikely t o exist i n significant percentages a s gaseous forms in flue gas (Table F4-13). Several studies have indicated that as much as 90% of the available Hg in coal i s emitted as gaseous vapor. 213’214y215’216 Andren217 repor t s that nearly 13% of the Se i n coal i s emitted as gaseous vapor. Also, Klein e t a l . lg4 repor t s t ha t most Cl and Br i n coal are emitted from power plants as vapors. Some F escapes as a vapor, b u t the actual percentage i s d i f f i c u l t t o determine due t o problems in sampling (Klein, personal conmunication). In an EPA study conducted by Radian Corporationlg3 a t a coal-fired power olant w i t h pollution control measures similar to those proposed for the Hat Creek development, F emissions from the stack were estimated a t 8% o f the total F input. However, the portion of this 8% tha t was gaseous emission was n o t determined. Based on the Battle River power p l a n t t e s t bums, i t i s p r o - jected that four trace elements will have measurable gaseous phase emission from the Hat Creek power plant. These elements and the fraction of total stack emissions in the gaseous s ta te are: arsenic (62%), fluorine (94X), mercury (52%). and selenium (48%) (Table F4-13).
The emissions rates for mercury, selenium, and arsenic are a l l maximum values as detennined by Nestern Research & Development. 246 This resulted from the short test duration which did not allow suff ic ient sample t o be col-
, . ~ - - -

m m a 4 I; I J I a I m 8 1 I I I I r I
Projected emissions o f t r a c e elements from Hat Creek Power P lan t based on Table F4-13
CCRL and Bat t le River test burn analyses
Concentration i n Rat io f l y ash-CCRL Ra t io Gaseous t t To ta l t t t Sol i d
Power plant emissions (kg/day)
Element MMC/CCRL* (mg/kg)*** MMC/Battle River* CCRL*** Ba t t l e R ive r t Ba t t l e R ive r Ba t t l e R ive r
A1 umi num "" MC ""
Antimony 0.67 11.3 "" 0.0910 """
Arsenic 0.49 403 1.73 2.37 Bar i um 1.12 MC
6.45 10.7 17.2
Beryl 1 ium 1.27 0.4
""" """ "_ """
"_ """
"" """
""
""" "_ """
0.0061 ------ "_ """
Bismuth 0.25 1.3 ""
Boron Bromine 0.92 5.0 "_ Cadmium 0.96 2.3 Calcium "" MC ""
0.0039 ------ 0.0553 """ "_
"_ 3.75 16.0 0.77' 0.722 6.3 "_ 6.3,
"""
0.32 0.0266 0.35 "_ 0.35 """
n ,t ' I
""" """ "_ """
2 Cerium 1.15 Cesium 0.94 Chlor ine 0.58 Chromium 1.58 Cobalt 0.87
77.7 8.3 59.3 240 57
"" 1.07
0.414
""" "- ""
"""
0.0938 ------ _" ""
"""
""" "_ """
2.90 4.56 5.20 "" 0.596 """ _" """
"_ 5.20
Copper 1.12 440 Dysprosium 1.0 Erbium 0.50 Europium 0.11 F1 u o r i ne 1.36
5.3 1.6 1.3
753
~0.043 5.93 <0.15 "_ <0.15 "" 0.0637 ------
0.0096 ------ 0.0017 ------
""
"_ """ "_ """
""
0.81 12.3 18.7 "_ 262
"""
280.7
Gadol i n i urn 0.59 3.3 Gal l ium 0.88 235 Germanium 0.75 9.0 Gold 1.00 Hafnium 0.27 '
< 0.4 7.0
"" 0.0234 ------ "" 2.49 """
0.0812 ------ < 0.0048 ------ 0.0227 ------
_" """
""
"_ """
""
"_ """
""
"- """
"- """

Table F4-13 (Continued)
Concentration i n Ratio f l y ash-CCRL
Power plant emissiondkg/day)
Element MMC/CCRL* hn3/kq)*** MMC/Battle River* CCRL*** Battle Rivert Battle River Battle River Ratio Sol id Gaseoustt Totalttt
Holmium Hydrogen Indium lod i ne lridium
0.90 ""
0.10 1.00
""
2.0
STD 1.0
<0.4
"_ ""
""
""
""
""
0.0216 """
"""
"""
"""
0.0012 <0.0048
"""
"""
"""
"- "_ "_ "_ "_
"""
"""
"""
"""
"""
Iron MC Lanthanum 1.02 Lead
52.1 1.78
L i t h i u m 3.23 74.7
Lutetium 0.10 10.3
0.6
""
""
0.55 ""
""
""" """
0.639 1.60 4.36 0.400 """
0.000722 """
"""
"_ "- "_ "_ "_
"""
"""
4.36 """
"""
Magneslum "" MC Manganese 1.45 > 756
-a I
.%
I. Mercury 1.40 .+ . Molybdenum
1 .o Neodymium
0.51 0.79
28.0 34.3
""
<o. 2 2.33
e o . 54 ""
>13.2 """
0.0168 0.172 0.325
"""
<7.15 3.36 0.86
"""
"- "_ 3.71
-" "_
"""
~ 7 . 1 5
0.86 7.07
"""
Nickel Niobium . 0.83
1.71
Osmium 1 .oo Palladium Phosphorous 1.10
1 .oo
293 69.7 <0.4 <0.4
MC
0.44
""
""
""
""
6.03 0.695
<0.00481
2.49
<o.oo4a1 """
"""
"""
""" """
"_ "_ "_ "- "-
2.49 """
"_"_ """
"""
Platinum Potassium
1 .oo Praseodymium 1.53 Rhenium Rhod i um
1 .oo 1 .oo
""
<0.4
12.3 MC
~ 0 . 4 <0.4
""
""
""
""
""
<0.00481 """
0.226 """ """
"""
<0.00481 """
<0.00481 """
"_ "_ "_ "_ "_
"""
"""
"""
"""
"""

II I I 4 I 4 i I 4 m I I, L
Table F4-13 (Continued)
Concentrat ion i n Power p lan t emiss ions (kuday) Rat io Rat io So l id Gaseoust t To ta l t t t MMCKCRI * FlPmPnt W C / R a t t l e River* CCRL*** R a t t l e R i v e r t B a t t l e R ive r Ba t t l e R ive r
"
Rubidium 0.71 Ruthenium 1 .oo Samr i um Scandium
0.70 0.85
Selenium 0.63
58.0 <0.4 17.0 40.3 12.3
""
""
""
""
0.06
0.495 <O .00481
0.143 0.412 0.0932 0.172
"""
"""
"""
"""
"_ """ "_ """
"_ """ "_ 0.186
"""
0.331
S i 1 i c o n ""
S i 1 ver 2.50 Sod i urn Stront ium S u l f u r
0.76 ""
""
MC 1 .o MC
580 >e43
""
""
0.26 ""
""
"""
0.0301
5.30 """
"""
"""
"""
"""
0.953 """
"""
"""
"""
0.953 """
Tantalum n Te l lu r i um
1 .o 0.50
i? Thal l ium I Terbium
0.20 1.25
Thorium 0.81
... <0.4 <0.4
~ 1 . 7 0.8
11.7
""
""
""
""
""
<0.00481 """
<0.00240 0.0120
<0.00409 """
0.114
"""
"""
"""
"_ "_ "_ "_ "_
"""
"""
"""
"""
"""
Thul i urn T i n Ti tanium Tungsten Uranium
0.50 0.84
0.09 1 .oo
""
13.7 0.6
MC 4 . 3 6.0
""
""
""
""
""
0.00361 0.138
"""
"""
"""
"""
<0.00249 """
0.0722 """
_" "_ "_ "_ "-
"""
"""
"""
"""
"""
Vanadium Ytterbium
1.63 0.33
Yttrium 0.80 Zinc 0.76 Zirconium 0.83
4 2 3 3 .3
e!?. 3 623 523
""
""
""
0.30 ""
16.1 0.0131 0.859 5.69 5.22
"""
"""
"""
12.9 """
"_ "- "_ "- "_
"""
"""
"""
12.9 """
NOTE: Emissions simulated for 2,000 MW H a t Creek power p lan t burn ing 42,600 metr ic tons per day o f mine mean coal (MMC) w i t h no c o n t r o l o f gaseous emissions.
( footnotes on fo l lowing page)

Table F4-13 (Continued)
MC = major cmponent (~1000 mg/kg).
STD = internal analytical standard.
-- = not measured.
( less t h a n ) values for emissions reflect use of maximum MMC/Battle River r a t i o (see Table F4-10).
* From Table F4-10.
** From Table F4-7.
*** Calculated as:
- 42,600.000 kq/day Hat Creek coal 130 kg/hr X 24 hr/day ' ( the CCRL test burn coal f i r i ng r a t e from Table F4-12T
X 36.7 g/hr X 24 hr /day (the f l y ash emission r a t e from Table F4-12) ll
+ 1 .? 1000 g/kg n X. Column 1. the ratio MCC/CCRL
X Column 2, the concentration of the element i n CCRL f ly ash lo6 mg/kg
t Calculated as the average of two computations as follows for the two tests on the day corresponding to the element of concern, as in Table F4-8:
.42,6OO,OOO kq/day Hat Creek coal Battle River t e s t burn coal firing rate. kg/hr (Table F4-8) X 24 hr/day
X Battle River test burn par t iculate emission rate. m g / d (Table F4-8)
X Battle River test burn gas flow rate, m3/min (Table F4-8)
x 1440 nin/day X column 3. r a t i o MMC/Battle Rlver 106 mghg
X 100-99.7 (design precipitator efficiency) 100-precipitator efficiency (%, Table F4-8)

a li I 1 I I I L I I L i B~ I I I I! c m i # I
Table F4-13 (Continued)
tt Calculated a s the average o f two computations as fol lows for the two tests on the day corresponding t o t h e element of concern, as i n Table F4-8:
42,600,000 kglday Hat Creek coal Bat t le R iver tes t burn coa l f i r ing ra te , kg /hr (Tab le F4-8) X 24 h r lday
X B a t t l e R i v e r t e s t b u r n gaseous emission rate, mg/m3 (Table F4-8)
X B a t t l e R i v e r t e s t b u r n ga$ f low ra te , m3/min (Table F4-8)
x x column 3, r a t i o MMC/Battle River
ttt To ta l o f p rev ious twb columns, B a t t l e R i v e r p a r t i c u l a t e p l u s gaseous emissions.

lected for detection w i t h spark source mass spectrometry, therefore the minimum detectable l imit for the respective element was used as a conservative maximum. In the case of f7uorine sufficient sample was collected t o allow analysis w i t h i n the detectable range of the analytical techniaue used, and therefore, the reported emissions from the t e s t b u r n are subject t o normal analytical variation.
Emissions given i n Table F4-13 are the r e su l t of calculations performed using data from the Battle River t e s t burn as published. Some numbers d i f f e r f r o m previously calculated values, which have been referenced in other volumes of the ERT report "Air Qual i ty and Climatic Effects of the Hat Creek Project" t o which this report i s an appendix. The differences are judged insignificant to conclussions noted i n later chapters of t h i s appendix and i n other appendices t o the ERT report.
For trace elements measured i n bath t e s t burns, data from the Battle River power plant tes t burns projected higher full-scale stack emission rates for arsenic, boron, cadmium, chromium, fluorine, lead, mercury, molybdenum, selenium, and zinc than d i d data from the CCRL p i lo t t e s t burn. However, the CCRL p i lo t t e s t b u r n data drojected higher f u l l - k a l e stack emissions for copper, manganese, nickel, and strontium. In subsequent repor t sections t h a t evaluate the environmental dis t r ibut ion and impact of trace elements, the higher of the two projected emission rates was considered. Thus, environmental evaluation and impact assessment considered the worst- case condition based upon available data from two d i f fe ren t t es t burns.
(I
Lr

F5.0 RECEPTOR AND TRANSMISSION MEDIA ANALYSIS
The t race element composition of coal i s geochemically sim”1ar t o t h a t of the ear th‘s crust . Thus, coal contains almost a l l of the naturally oc- curring elements. A review of numerous published references (Section F11.0) on t race element ecology (including distribution of elements in coal, ash, s o i l , a i r , water and l iving organisms; toxicity potential o f trace elements; and mobility and accumulation character is t ics of trace elements) enabled the selection of t race elements most l ike ly to be o f environment.al importance a t the s i t e of a coal-fired power plant.
1
I n i t i a l l y , environmental samples (receptors) from the Hat Creek area #ere examined t o include all of the elements analyzed by the methodologies 3f spark source mass spectrsxcopy and plasma emission spectroscc’py. In both cases, concentrations for over 60 elements were obtained. From these snalyses, comnon elements nlxmally found i n re la t ive ly high concentrations in ecosystem materials and which are relatively nontoxic were eliminated from additional consideration. Typical elements in this group are aluminum (Al), calcium (Ca). iron (FI? ) , magnesium (Mg), and manganese (Mn). Simi- larly, those elements i n millute t o non-detectable quantities were also 2liminated from additional consideration. Typical elements i n t h i s group .we gold ( A u ) , holmium (Ho), palladium ( P d ) , and ytterbium (Yb). A complete l i s t ing of the elements ana’lyzed and their concentrations in receptor materi- (ils are presented i n Addenurn A t o this appendix report. From this l i s t , ,!1 elements (Table F5.1) we]-e selected f o r detailed environmental review. ‘These 21 elements, which arc the focus of discussion i n this report section, lave one or more of the fol’lowing character is t ics : re la t ively h i g h concen- trations in Hat Creek coal or ash; volatilized during coal combustion; po- t en t i a l ly most toxic t o Hat Creek receptors; present in re lat ively h i g h ‘concentrations i n Hat Creek sources or receptor materials as compared t o ,/slues reported by others in similar ecosystem materials; or regulated by governmental agencies (Table F5-1). Information for this selection process (came from l i t e r a t u r e source!: referenced i n Sections F4.0, F5.0, and F6.0, (ind from coal analyses and t e s t burn results presented in Section F4.0. lncluded i n the survey was the s ta tus as far as a par t icular e lenent’s I-egulatory s ta ture or propo!:ed standard level as promulgated by United States or Canadian authorities. Regulatory standards are described in the main

Table F5-1
Characteristics of trace elements selected for detailed environmental review I
High concentration
Volatilized High d u r i n g potential concentration Regulated
High II)
Element Symbol i n coal or ash combustion toxicity i n receptors guideline*
Antimony Arsenic Beryl 1 ium Boron Cadmium Chromium Cobalt Copper F1 uori ne
Gallium Lead L i t h i u m Mercury Nickel Selenium Strontium Thallium T i n Vanadium Zinc Zirconium
Sb As Be 3 Cd Cr co cu F Ga Pb L i
H9 Ni Se Sr T1 Sn v Zn Zr
X X
X
X X
X X X. X X
X
X X X X
X X X
X
X
X
X
X X X X X X
X X X
X X
X X X
X II
* See ERT m a i n report--Air Quality and Climatic Effects of the Proposed Hat Creek Project--and Appendix G-Epidemiology--for description of trace elements w i t h guideline levels that are regulated by governmental agencies. ._ II
.c
FS-;

1'
r-
I ~"
r
IiRT report--Air Quality and Climatic Effects of the Proposed Hat Creek Project--and in Appendix G-lfpidemiology.
Using factors presented in Table F5-1, t h e l i s t of 21 elements was reduced t o nine elements of most environmental concern. In general, i f itn element had checks in a t l ea s t t h ree of the f ive categories l is ted i n "able F5-1, the element was selected as being of most environmental concern. A s l igh t ly biased weighting was given t o three of the factors ( h i g h concen- ':ration in coal or ash, high potential toxicity, and existence of regulated guidelines) because these were considered most important for impact assess- nent. Using th i s se lec t ion c r i te r ion , Sb, Be, B , Co, Ga, L i , Ni, Se, S r , 7 , Sn, and Zr were eliminated from additional sampling i n the Hat Creek environs. Selenium, which .is toxic t o animals only i f their principal food source contains h i g h levels of the element (Section F5.1), was a borderline c!lement tha t was not studied fur ther because Se levels i n coal and stack ctmissions were low (Section F4.0). Nine elements, including As, Cd. Cr, Cu, F, Pb, Hg, V , and Zn, were selected as being of most environmental con- cern for the Hat Creek project. These nine elements were analyzed i n receptor materials coliected d u r i n g two subsequent samplings i n the Hat Creek area (Section F5.1). Environmental dis t r ibut ion and impact assessment for these elements are discussed i n Sections F6.0 and F7.0, respectively.
F'5.1 Receptor Analysis
Descriptions of sample!;, including type and s ize , are g iven i n Section f'3.0. Soil and water, although abiotic components, are important trace clement receptors and are included i n the subsequent discussion. Air i s the primary transmission medium of stack emissions and i s discussed in Section F5.2. To f a c i l i t a t e comparison of specific trace element concen- t ra t ions between s i t e s and among receptors, the discussion is organized by element. For each trace element, information gathered d u r i n g a comprehensive ' i t e r a t u r e review i s used to determine, when possible, the folloding parame- t e r s :
1. comparability w i t h "normal" concentrations i n other defined ecosystem components;
2. potential for enrichment in Hat Creek receptors;
F5-3

3. ro le i n normal functioning of ecosystem components;
4. major s i t e s and modes of uptake and accumulations; and
5. tolerance levels, toxic concentrations and toxic effects .
As d i f f e ren t t r ace elements have been subjected t o different kinds and in tens i t ies o f research, a disparate amount of l i t e r a t u r e e x i s t s f o r t h e various trace elements under consideration fcr the Hat Creek project. This is necessar i ly ref lected in the kinds and extent of information presented for each element; t h a t i s , not a l l the above information is provided fo r each element. 1n.following.discussions of t race element -levels, .concentrations measured .in..Hat Creek materials .are compared to . levels reported in-~other . studiev. In many cases, these other studies have compiled data from various geographical areas. Unless another explanation i s given, trace element levels used f o r comparison are from "natural" areas ( i .e. , not near an i n - dus t r i a l , min ing or other project development t h a t could contribute trace elements to. the local environment).
Except for water , samples collected in October 1976 were analyzed i n most de ta i l (73 elements measured in t r ipl icate samples) . Pr ior t o t race element analysis of receptor material collected d u r i n g January and May 1977, evaluation o f t race element levels i n source and receptor (October 1976) materials from the Hat Creek area provided a basis for determining trace eiernents o f major concern t o this project (See Section F5.0 for a discussion of select ion ra t ionale) . Important trace elements were ascertained t o be As, Cd, Cr, t u , .F, Pb, Hg, V , and Zn. These elements provided the focus for January and May 1977 sample analysis and results of these analyses are pre- sented and discussed i n this section. Concentrations* of certain elements, such as As and Cd, varied considerably among sampling periods. Factors contributing t o h i g h natural variability include physical and chemical hetero- geneity of sampled materials, changes in environmental factors such as soi l moisture, and changing quantit ies and ra tes of decomposing plant and animal material i n s o i l .
Concentrations of t race elements in solid materials are reported as par t s ' . per million (ppm) throughout this chapter. Values i n ppm, which i s a weight t o weight r a t i o and therefore a uni t less number, are numerically equivalent
water samples are also reported as ppm, wnich for freshwater is equivalent t o concentrations reported as mg/kg. Concentrations of trace elements in
t o mg/l.
F5-G.

z
L
I
I
I
m
( a ) Antimony (Sb)
Average concentrations of antimony ( S b j i n receptor 'materials collected dur ' ing October 1976 are presented in Table F5-2. A "<" ( less than) or " > ' I
(greater t h a n ) preceeding any mean value indicates the inclusion of a concen- tra':ion into the computation which was e i the r t o o low (e .g . , <0.001 ppm) o r t o o h igh (e.g., >400 ppm) for adequate estimation. by the analytical technique.
Natural concentrations of Sb i n Hat Creek receptors d u r i n g October 1976 were generally below 1 ppn with means ranging from <0.002 ppm (water, Site 2) t o :!.57 ppm (stream sediment, Site 4 ) i n aquatic samples and from 0.17 ppm (sh!-ub, S i t e 4 ) t o 1.40 ppm ( s o i l , S i t e 2 ) i n t e r r e s t r i a l samples. The highest concentration of Sb were found i n stream sediment and so i l samples. Variabil i ty, as indicated by standard error, was generally low for a l l samples.
The following concentrations have been presented i n the l i t e m t u r e a s representative of naturally occurring Sb l eve ls i n selected ecosystem com- ponents :
1. water - <0.00033 ppm 4
2. .soils - 20.43 ppm, Wyoming
3 . vegetation - 0.06 ppm
5
4 ~ 0 . 2 2 ppm, Wyoming
0.03-0.07 ppm, deer mice, Wyoming
5
4. animals - 0.14 ppm, mamalian t issue 4 5
While Hat Creek samples had slightly higher concentrations t h i m values re- por.:ed in the l i t e r a t u r e , Hat Creek Sb 1eve l s . a re f a r below those concentray t ions considered toxic. Bowen reports the results of laboratory experiments which indicate that the le thal dose of various chemical forms of Sb required to k i l l 20% o f the test population (LDZ0) of a var ie ty of mamnalian specimens r a g e s from about 20 t o 4000 ppm. Antimony is believed t o exe r t i t s t ox ic i ty by iicting as an antimetabolite and is oenerally considered as moderately tox'ic t o a l l organisms.
4
4
F5-5

nsuatlo ** v a t e r 0.003 0.001 <0.002 m . m 0.002 0.001 0.002 0.w1 Stream eedloent 1.33 0.33 0.53 0.03 0.91 0.03 c 1.51 > 0.12
Y l O h *.a < 0.m 5 0.00 0.17 > 0.03 0.11 > 0.03
-3J.0022 >0.0005
< 1.1'1 > 0.21
< 0.10 > 0.01
..

(b) Arsenic (As)
Average concentration of (arsenic (As) i n selected Hat Creek r,?ceptors col'lected during October 1976 are presented in Table F5-3. Arsenic concen- tra,:ions ranged from cO.OC? ppm in water t o 10.GO ppm (stream sediment, Site 1) i n aquatic samples; Arsenic levels in terrestrial samples rang1.d from 0.2:i ppm (grass , S i te 4 ) t o 3. ,33 ppm ( s o i l , S i t e 2 ) . Soil and sma'll mamnals gentral ly evidenced the highest concentrations at.each site. Except fo r sma'l mammals, samples from Si te 2 (Lower Hat Creek) had the highe'st As concentrations of all sites. 4rsenic concentrations i n samples collected dur ' :ng January and May 1977 (T'3ble FS-4) were generally higher than those col 'ected in October 1976, especially i n so i l and stream sediment.
Naturally occurring concentrations o f As as determined from the l i t e ra - turf! are given f o r a variety o f ecosystem components below:
1. water - 0.0004 ppm 4
2. s o i l s - 0.3-38 ppm, 2.5-4.6 ppm, Oregon 6
- 1-40 ppm - 6 ppm4 - e7 ppm, Wyoming - 5 Ppn 9
7
5
3. vegetation - 0.2 ppm4 - 0-10 ppm - 0.5 ppm 7
- 0.1-1.0 ppm. Wyoming
4. animals - ~ 0 . 2 qpm, highest i n mammalian hair ilnd
6
5
nai ls - c3 ppm, freshwater f i s h ' - ~ 0 . 4 5 ppm, deer mice, Wyoming 5
Arsenic- levels ' in small:mamnals-~collected duringOctoberJ9Zlj..and levels i n !;oils, stream.sediment and-small .mamnals sampled d u r i n g January and May 197?, appear,to be higher -than might be expected based-on Yalues reporled i n ':he l i t e r a tu re . Since the effects of high As in so i l s and streim sediment on t-ooted vegetation depend on the amount of soluble As and not total As, i t ' is d i f f i c u l t t o determine i f the natural As levels are presentl: , stressing
F5-7

nqllatlo * * water <o.w2 m.000 <0.002 >o.wo <0.002 m . m <0.002 m . m 3trc001 ncdlmollt 10.00 5.19 6 . 3 3 0.33 5.m 1.51 1.;1 1 .:o Plnh .I* 0.~13 > 0.07 0.57 > n.w 0.33 , 0.01
TorrwtTlol
so11 ,, . ii J J 0. .x; 3.33 2.37 3.00 1.51 5.00 0.50 3.61 0.61 I .01 0.72
SIVUb 0.50 ,> 0.15 0.91 > 0.52 < 0.37 > 0.03 0.64 > 0.12 c 0.17 > 0.07 < o . G o . > 0 . 1 1
GrUIS < o.-w > 9.21 4 1.n > 1.09 0.40 0.06 0 . 2 3 0.03 0 . ,, .: 7 0.05 < o.x > 0.23;
0.6) n. 12 1.57 - 0.72 I .20 0.40 U.91 0.05 n:/3 0.22 1 . O l 0.11 I . lC l lU , ,
S w l l momnl < 0.C3 > 0 . W 4 0.73 > 0.12 3.21 2.31 3.Gl 1.76 < U.71 Z IJ.O> < 1.05 3 C.61
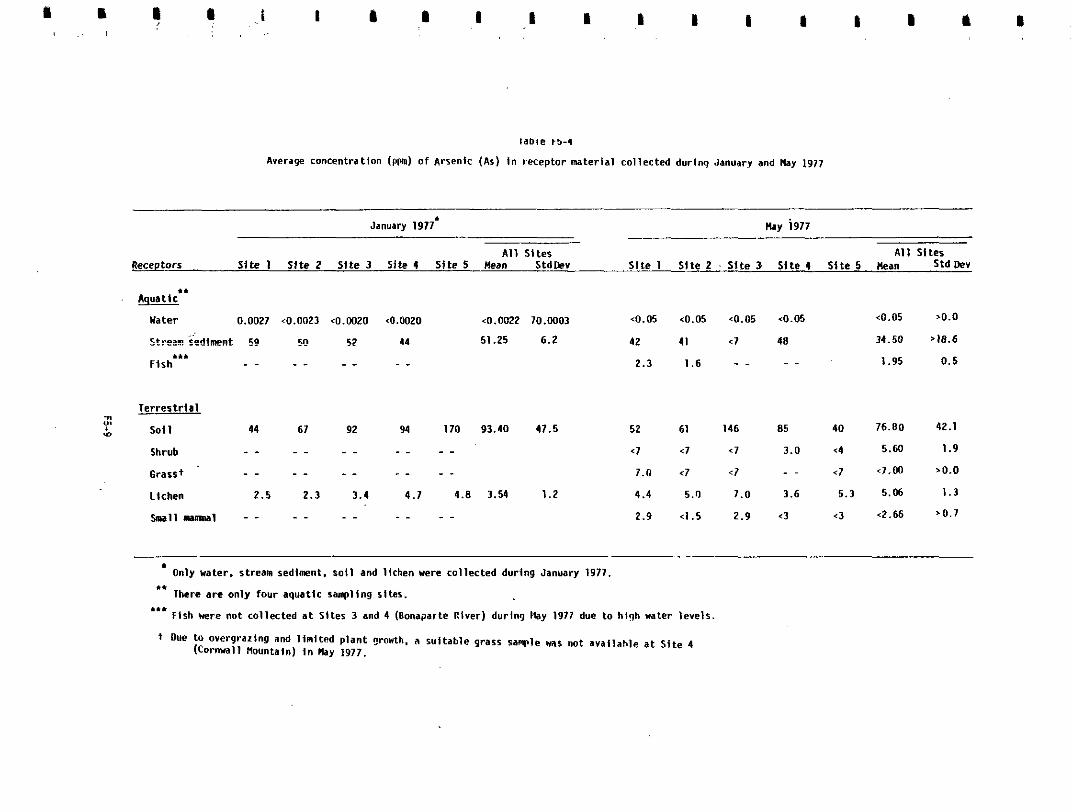
I a I I I I I 1 I I I m I
January 1977* b y i977
All S i t e s m o r s S i t e 1 Site 2 Site 3 Slte I S l t e 5 Mean Std l lev S i te 1 S i t e 2 . Site 3 S i t e 4 S i t e 5 M a n Std Dev
A1 1 S i tes
1.
Hater 0.0027 <0.0023 ~ 0 . 0 0 2 0 <0.0020 <0.0022 70.W03 <0.05 <0.05 <0.05 <0.05 <0.05 ,o.o Stre:?! ;&!E!?"? 59 10 52 44 51.25 6.2 42 41 .l 48 34.50 r l8 .6
Fish'** " " " " 2.3 1.6 " " 1.95 0 . 5
n am T e r r e s t r i a l
.n sol 1 44 61 92 94 170 93.40 17.5 52 61 146 85 4 0 76.80 42.1
Shrub " " " " " <l c7 3.0 <4 5.60 1.9
Grasst " " " _ _ _ _ 7.0 4 <7 " <7 < J . 0 0 ,o.o
Lichen 2 . 5 2.3 3.4 4 . 1 4.0 3.54 1.2 4.4 5.0 1.0 3.6 5.3 5.06 1 .3
snallamnal - - "
.
" _ _ " 2.9 <1.5 2.9 <3 <3 d . 6 6 '0.7
". Only water. stream sediment, r o i l and l ichen were co l lected dur ing January 1977.
There are on ly four aquatic sampling s i tes .
Fish Here not co l lected a t Si tes 3 and 4 (Bonaparte River) during Way 1977 due to h igh wa te r l eve l s ***
Oue to overgrazing and linitd p l a n t growth. a sui table grass sawle 1141 not a t Site (Cornwall Mountain) i n may 1977.

the vegetation. The As levels i n small mamnals, however, a r e f a r below these concentrations that are considered toxic. For example, Gough and Shacklette'' indicate a 96-hr LO5' for laboratory mice and r a t s a s 11.2 ppm arseni te (As ), the most toxic form of arsenic, and 112 ppm of arsenate +3
(As ), a less tox ic form. +5
... Arsenic i s not essential t o vegetation'" b u t i n low dose may stimulate
plant growth.8 Plants generally obtain As throug 'h the soi l and As i s known t o accumulate i n roots, especially i n t i p s of new roots. Arsenic usually does n o t accumulate i n tops of plants.6 Normally, most plants can to l e ra t e t o t a l As in soil ranging from 1-40 ppm, although some do well i n s o i l s containing much higher concentrations. For example, Douglas-fir (Pseudotsuga menziesii) growing i n so i l s in the v ic in i ty of heavy metal deposits have been found t o contain total As levels as high as 8,200 ppm. 11
Arsenic toxicity t o plants is considered severe," although toxicity depends on the concentration of soluble, not total As i n so i l s . The f ree element is not considered poisonous while many o f its compounds such as arseni te and arsenate forms are extremely lethal." Studies of old orchard s o i l s i n the Yakima Valley, Washington indicate that 3.4-9.5 ppm of readily soluble As i n the top 6 inches of soil caused unproductive conditions. Soluble As concentrations i n the soil greater than 2 ppm causes marked damage t o a l f a l f a and barley.'' The grea tes t tox ic e f fec t of As is directed at the seedl ing s tage of plants as h i g h soi l As concentrations arrest seed germination and reduce seed viability. 6
Since As does not usually accumulate in above ground portions of plants, animals generally do not accumulate As via ingestion of vegetation. Rather, water i s the most common transfer media causing As poisoni-ng i n man and animals, although toxicity under natural conditions i s unusual." As w i t h plants, compounds of As such as arseni te and arsenate, are much more tox ic t o animals than elemental As. Toxic doses for a variety of As compounds t o selected mamnals under laboratory conditions range from LDIO of 4 ppm for oral doses of arsenic tr ioxide (As 03) t o LDSO of 1,100 ppm for oral doses o f lead orthoarsenate (Pb As04). In addition, Gough and Shackiette $3 10
*
m
IL
L
Ir
I
c
II
II
Ir
F5-10

report t h a t 13 ppm of As i n water as As202 is toxic t o livestock, while 0.4-10 ppm i s t ox ic t o man. For aquatic organisms, Malacea14 s t a t e s t h a t minimum lethal concentrations of sodium arsenate (Na5As) are 100 ppm for b i t te r l ing and minnow, 160 ppln for carp and 5 ppm for W h n i a . Median tolerance l imits for minnows under laboratory conditions were found by Boschetti and McLoughlin’’ t o be 45 ppm for 24 hours, 29 ppm for 4.8 hours, and 27 ppm for 72 hours. Fifteen ppm causes no mortality to minnows. 15
Arsenic poisoning of domestic animals caused by point-source contaminators occurs mostly i n l a te sumer or fa11.l6 Early symptoms of As poisoning in mammals are abortion”, vmiting, diarrhea, th i rs t , emaciation and uncoordi- nation.16 Milk yield in cows can be reduced up t o 75% under extreme con- ditions.18 Lillie16 has documented milk production decreases of 1.2.5% with an 8% decrease in butterfat as a resu l t of As poisoning.
Pathological changes caused by As poisoning by ingestion or As dust inhalation include gastrointestinal and respiratory tract inflamnation, skin lesions, degeneration of body organs, hemorrhage and lung congestion. Baker2’ observes that even in cases of l igh t As contamination, the patho- logic effects are cumulative, i .e., the affected animal never recovers. Arsenic a lso has been shown tl2 be c a r ~ i n o g e n i c . ~ For example, f ish from th: Fox River system i n I l l i n a i s which contain h i g h As levels are found t o exhibit a greater frequency o,f tumors as compared t o unpolluted Canadian waters.*’ Borgono and Greibe!-22 note that prolonged consumption (12 years) of water high i n As (0.3 ppm) produced cutaneous lesions i n over 30% of the inqabitants o f a city in Chile.
19
In summary, As, depending on the chemical form and mode of intake, i s po,tentially very toxic to plants and animals. Compared to levels reported i n other studies referenced above, arsenic levels i n Hat Creek reccptors, especially i n s o i l , stream sediment and small mamnals, appear t o be h i g h . However, no apparent effects of these h i g h levels are presently evident in Ha,: Creek ecosystems.

( c ) Beryllium (Re)
Average concentrations of beryllium (Be) in selected Hat Creek recep- tors for October 1976 are presented i n Table F5-5. Averages ranged from 0.0005 ppm (water , Si te 3) t o 0.47 ppm (stream sediment, Site 1) for aquatic samples and from 0.10 ppm (shrub, Sites 2 and 5 ) t o 0.53 ppm ( s o i l , S i t e 1) for t e r res t r ia l mater ia l s . Stream sediment and soi l evidenced the highest levels of Be among aquatic and terrestr ia l samples , respect ively.
Naturally occurring levels o f Be in a var ie ty of ecosystem components, a s determined from the l i t e ra ture , a re given below:
1. water - ~0.001 ppm 4
2. soil - 0.1-40 ppm 4
- 6 ppm’
- 0.34-3.1 ppm, Wyoming 4
5
3. vegetation ’ - <0.1 ppm
4. animals - <0.0003-0.002 ppm, soft t issues 4
Based on comparison w i t h the above literature-derived values, Be. l eve l s i a . f i sh and smalLmammals~from Hat Creek environs-appear t o be s l igh t ly h igh . However, these seemingly high concentration’s may not be abnormal b u t ra ther an indication of the paucity of information i n t he l i t e r a tu re on normal Se concentrations in different ecosystem components.
Beryllium generally accumulates i n plant roots and leaves and i s con- sidered very toxic t o ~ e g e t a t i o n . ~ ~ Romney et a l .23 reports that v isual ’
symptoms o f Be tox ic i ty can be observed in the roots of bean plants growing in nutrient solution of 3-5 ppm Be. They also note that Be can become in jur ious to higher plants if roots come i n contact with Be concentration i n excess of 1 ppm in the soil (the highest Re level found i n Hat Creek s o i l s was 0.53 ppm a t S i t e 1, Pavillion Mountain).
For beans, Romney e t d 3 report t h a t visual symptoms of Be poisoning are first apparent in the roots o f seedlings. Roots turn brown w i t h i n 5 days and f a i l t o resume normal elongation. Stunting of plant foliage
Fi-i C
L

lpuatlc .* WatW 0.0012 0 . m 2 0.0012 0 .m1 0.0005 0.WW 0 . m .. 0 .m1 1
Stream eedlmmt c 0.47 > 0.27 0.10 0.00 0.10 0.00 0.27 0.17
Plsh *** c 0.20 > 0.00 c 0.17 > 0.03 C 0.17 > 0.03
. . . . 0 . m s 0.0007
c 0.23 > 0.08
< 0.w w 0.01
Terrestrial
s o i l 0.53 0.24 0.43 0.20 0.30 0.10 C 0.33 w 0.15 c 0.43 > 0.17 < 0.41 > 0.08
ShrUb < 0.13 , 0.03 c 0.10 Z 0.W c 0.17 -Z 0.07 0.17 > 0.03 c 0.10 > O.W < 0.13 > 0.m a w s < 0.17 > 0.03 < 0.23 > 0.03 < 0.20 w 0.00 < 0.17 > 0.03 C 0.20 > 0.00 C 0.19 > 0.01
LlOh!2" c 0.20 w 0.00 < 0.23 z 0.03 c 0.20 z 0.00 < 0.20 > 0.00 < 0.20 > 0.06 < 0.21 > 0.01
small m - d < 0.20 w 0.00 c 0.17 z 0.03 < 0.20 z 0.00 c 0.20 w 0.00 < 0.20 0.00 < 0.19 z 0.01

occurs w i t h i n 113 days, although normal foliage coloration is retained. Flowers mature e a r l i e r and fruits are less mature when harvested than i n the controls. Romney e t a l .23 ind ica te a l so tha t Be may inhib i t the normal function of plant phosphatase enzyme systems. -
c
Beryllium 1s also considered t o be very toxic t o animals. Toxic con- 4 -
centrations for several laboratory animals range from 80-146 ppm ( o r a l !
dose) for diffelaent Be Tarzwell and HendersonZ4 report a 96- hour ~c~~ of 11 ppm Be for fathead minnows i n a water of hardness 400 ppm. They suggest a safe concentration of 1.1 ppm Be for fathead minnows in water of simila? hardness. However, they emphasize t h a t 1.1 ppm i n water m
softer than 400 ppm CaCOq would most l i ke ly be toxic (Hat Creek and Bonaparte River averaged '0,0011 PPm' Be). Slonim and S1onimz5 report safe concentrations , m
a s between 0.011 Ppm (100 ppm hardness) and 1.1 ppm (400 ppm hardness) Be for the comnon guppy. "
-
I
Valkovic8 states tha t h i g h Be levels are correlated w i t h bone, breast and uterine cancsrs i n animals. Christensen and Lugenbyhl13 note that Be i = produces neoplastic effects i n pigs and is carcinogenic i n experimental animals when inhaled as beryllium fluoride. Maniloff, Coleman and Miller 26 1 i - r epor t t ha t Be i p capable of f i rmly attaching proteins t o cel l surfaces . As a resul t , cel ls are desensi t ized against the agglutinating action of I antibodies prepard against the bound protein species, thus, reducing the animal ' s res i s ta rw t o disease. 1
i =
I L
In sumary, Be is considered very toxic t o p l a n t s and animals. However, levels present ly found i n Hat Creek receptors are well bel.ow reported toxic . .
concentrations.
' I
1 / I
( d ) Boron ( B ) , I
Average con@ntrations of boron ( B ) i n selected Hat Creek receptors sampled d u r i n g October 1976 are provided in Table FS-6. Average B l eve ls ranged from 0.01: PPm (water, Site 3 ) t o 8.33 ppm (stream sediment, Si te 1)
LI
i n aquatic samplEj. Aquatic S i t e 1 (Upper Hat Creek) had the highest over- -

0.044 0.005 0.041 0.005 0.015 0.001
8.33 3.10 1.61 0.67 3.M) . 1.00
1 .w 1 .oli ' 1.03 0.49
6.33 0.67 15.00 6.00 3 .oo 1 .on 10.67 2 .Is5 11.67 0.80 46.67 13.20
2.67 0.67 3.00 1 .oo 2.33 0.33
1.57 0.43 1 .a, 1.11 2.51 0.98
0.40 0.12 0.73 0.22 0.37 0.07
0.023
6.67
0.97
11.67
16.67
5.00
1.03
1.23
0 .003
3.10
0.52
3.76
3.71
1.53
1 .M( 0.m
0.031
4 .91
I . i < . l
0.67 1.33 11.93
111.00 40.05 39.53
2.33 0.00 T, .Ol
2.21 0.93 2.01
1.10 0.45 1) . ' I 7
1 .m
12.47
0.45
0.37
0.20

all concentrations of B among sites, while stream sediment evidenced the highest B l eve ls among samples. Average B l eve l s i n t e r r e s t r i a l samples ranged from 0 . 3 7 ppm (small mammals, S i te 3 ) t o 111.00 ppm (shrub, S i t e 5 ) . Except for the re la t ive ly high concentration of B i n shrubs a t S i t e 3 (Arrowstone Creek) and S i t e 5 (kshcrof t ) , B levels d i d not dif fer markedly for spec i f ic mater ia l s among s i t e s .
Naturally occurring concentrations of boron found in selected eco- system components from other regions as determined from t h e l i t e r a t u r e , a r e summarized below:
1 . water
2. so i l
3 . vegetation
4. animals
0.013 ppm 0.010 ppm
10 ppm, range 2-100 ppm with highest levels found i n s a l ine and a l k a l i n e s o i Is 20-35 ppm, Wyoming
50 ppm4 120 ppm. f r u i t s of d i f fe ren t p lan ts 2550 ppm, legumes 7
1.5 ppm, cereal and hay
0.5 ppm 0.51-1 .O ppm, c.ow mi.lk
4
a
4 5
8
7
4 7
Except--.perhaps :for .B-levels in shrubs a t S i € e 3 . - ( A s h c r o f t ) , B";oncentrations in Hat Creek.samples ar_e.within.~the. range of-values ,reported i,n. s tudies re- ferenced above. Average 8 concentrations in Site 5 shrubs represents a n apparent anomaly, as i t i s n o t consistent w i t h 8 levels with other receptors a t this s i t e , e spec ia l ly in s o i l . The primary uptake of B by p lan ts i s t h r o u g h the s o i l and high B levels in soil should be ref lected in high con- centrations i n p lants . However, plants respond primarily t o so i l so lu t ion B independently of the amount of B absorbed by s o i l . Consequently, condi- t ions a f fec t ing equi l ibr ia between absorbed and soluble B are highly relevant t o consideration of plant uptake of B and p l a n t n ~ t r i t i o n . ~ ' The amount of B released and avai lable in soi l i s re la ted t o the nature of the B material in the soi l and type of weathering agent. Absorption by plants is highest i n sandy loam and loamy s o i l s and n o t in clay loam s o i l s .
. ~~ .. . .
6
I
L
. -
I..
F5-IC

a
I
a
- L..
Boron i s an essential element for plant and algae nutri t ion. I t plays air important role in organic translocation i n plants and plant growth re- g u l a t o r responses (essential t o the biosynthesis of auxins in plant meristems). Boron i s a l s o impor tan t t o p'iant enzymatic responses, cell division, cell mtlturation, nucleic acid metabolism, phenolic acid biosynthesis and l ignif ica- t.'on,and carbohydrate metabolism (affect ing cel l wall metabolism such as ptxtin synthesis of germinatfng pollen). 27
The difference between .required amounts of B and toxic amounts for ve- getation i s reportedly very small, commonly 1-2 ppm of soluble B i n so i l .
Kt,thnyZ7 reports that solution culture concentrations of 0.05-0.10 ppm are ordinar i ly safe and adequate fo r many plants, whereas concentrations of 0.50-1.0 ppm are frequently excessively high fo r B sensit ive plants. Some plants, however, can accumulate h i g h concentrations of B in fo l ia r t i s sue without any toxic effect . For example, KothnyZ7 notes that toxic symptoms a-e manifested i n corn leaf , t i ssue a t 25 ppm B b u t cotton leaf tissue can a8:cumulate 1,625 ppm B before toxic effects are observed.
Early stages of B exces!; i n vegetation are characterized by leaf - t ip y1:llowing. A t moderate t o acute stages, B toxici ty produces a progressive necrosis of the leaf beginning a t t h e t i p and/or margins as a chlorotic yellowing and f ina l ly spread'ing between the lateral veins between the widrib. Swelling of nodes, gumning a t internodes and bark-cracking are o,:her symptoms. 7
Boron has n o t been proven t o be essential t o animal nutrition. Boron i l l food is almost completely absorbed and excreted, largely i n thl? urine. When high B intake does occur, similar h i g h absorption and urinary excretion tilkes place, b u t toxic B levttls may be temporarily retained in thle t i ssues , e!;pecially i n the brain. 7
Boron levels o f 0.2-2.2 ppm in drinking water or 5300 ppm of Blday dry weight of diet is reported to be toxic t o lambs.'' Bowen report!; an LD50 01' 2000 ppm B fo r mice and t h a t an oral dose of 0.15 mg/day i s tox ic t o re.ts. Also he indicates that: 50 ppm t o lead fluroborate [Pb ( B F 4 l 2 1 ar'd/or thallium fluroborate (BF4 T1) a re tox ic to ra t s .
4
F5-17

In sumary, 8 i s moderately toxic t o plants and animals. Boron levels in Hat Creek receptors appear t o be f a r below those levels determined as toxic.
( e ) Cadmium ( C d )
Average concentrations of cadmium (Cd) in selected Hat Creek receptors collected during October 1076 are provided in Tzble F5-7. Average Cd levels ranged from 0.0018 ppm (water, Site 3) t o 0.47 ppm (stream sediment, S i te 4 ) i n aquatic samples. Cadmium levels i n stream sediment were s l ight ly higher a t s i t e s on the Bonaparte River (Sites 3 and 4 ) . For te r res t r ia l samples, average Cd levels ranged from 0.27 ppm (grass, Site 1) t o 1.13 ppm ( s o i l , Si te 4 ) . $oi l and shrub had the highest Cd concentration o f a l l samples, par t icular ly a t Si te 4 (Cornwall Mountain).
Concentration of Cd in selected receptors sampled during January and May 1977 are shown in Table F5-8. The results. suggest h igh seasonal variabi- l i t y i n stream sediment, soil and shrubs. Cadmium concentrations i n these receptors were higher i n January and May 1977 than i n October 1976.
Naturally occurring levels o f Cd i n a- variety o f ecosystem components from other regions are sumarired below:
1. water - 0.08 ppm
2. so i l s - 0.06 ppm
4
4
- 0.i~-02 ppm . 28
- 1.5 ppm, Wyoming 5
3. vegetation - 0.60 ppm 4
- 0.1-1.0 ppm; food plants'' - 0.16-1.9 ppm, Wyoming
4
5
4. animls - 0.50 ppm - 0.02-0.1 ppm (wet weight) fish i n
New York 28
- 0.04-0.14 ppm, deer mice, Wyoming 5
I
t
.. ' W
I
F5-TG

!
* * water 0.0032 0.0002 0.wm 0.m 0.0018 0 . m 0.0028 0.m
Stream eediment < 0.37 > 0.15 c 0.23 > 0.03 < 0.43 > 0.09 < 0.17 > 0.22
s lob *e* < 0.30 > 0.06 C 0.17 > 0.03 c 0.30 > 0.12
0.W27 O.Ow6 c 0.50 5 9.07
c 0.76 > 0.04
le*eot*ial
s o i l c 0.57 z 0.03 c 0.43 > 0.07 c 0.33 > 0.09 c 1.13 > 0.15 < 0.43 > 0.17 c O.rYl > 0.11
Shrub c 0.m > 0.15 < 0.33' > 0.07 c 0.M > 0 . t O c 0.83 > 0.09 < 0.47 > 0.09 c 0.56 > 0.07 crasa -~ c 0.21 1 0.03 c 0.33 z 0.03 c 0.30 1 0.06 c 0.30 > 0.12 c 0.37 > 0.03 < 0.31 5 0.03
Lichen < 0.33 > 0.03 c 0.40 > 0.06 < 0.33 > 0.03 C 0.30 > 0.00 c 0.33 > 0.03 C 0.34 > 0.02
Small olunn~al c 0.40 > 0.06 c 0.33 > 0.07 c 0.37 > 0.01 c 0.60 > 0.21 c 0.63 > 0.21 < 0.16 > 0.06


&dmjum-.concentmtions :~in-.soil- and-stream-sediment-recorded for January .. . .- 7".
a n d b y -1977 ..appear t o exceed -1evels"reported .9n' the -1 i t e r a tu re . However, no tox ic i ty t o vegetation growing on h i g h Cd substrate has ever been demons- trated under natural conditions." Cadmium concentrations in other Hat Creek materials are consistent with reported Cd levels except perhaps for small mammals which exhibited levels as high as 0.60 pprn on S i t e s 4 (Cornwall MoLntain) and 5 (Ashcroft) du:-ing October 1976. However, 0.60 pprn i s Well below the concentration known t o result in tOXiC.effeCtS.
Cadmium i s a non-essential element t o vegetation. 4'7 However, i t can be readily absorbed and consequently is detectable i n most plants,. Plants absorb Cd f r a so i l through root systems or from leaf surfaces thr,ough the stomata.
8
29
The general toxicity of ICd is moderate t o vegetation." I t 'is normally nor-toxic a t 1 ppm f o r land plants and 0.01 ppm for aquatic plants. Fleischer e t a1.28 reports t h i l t Cd levels i n contaminated so i l s a re o f ten well below concentrations required t o damage plants. Al1away3' indicates t h a t 3 ppm of Cd i n plant tissues are necessary t o depress growth. Primary e f f ec t s of Cd on vegetation include a reduction i n leaf t ranspirat ion and reduction i n net photosynthesis through a decrease in total chloroplasts. 32
Physical symptoms of the la t te r e f fec t inc lude fo l ia r ch loros is and necrosis. Adverse ef fec ts on ATP respiration and mitochondria funct ion have been ob- served a t 2 pprn Cd i n culture solution f o r corn.
8.30
33
Bryophytes may provide a sensit ive indication o f Cd pollution. A moss species, Rypmmi cupressifeme;!, has been used as an index of airborne Cd pollution i n Sweden. Normal Cd levels in this moss a re 0.7-1.2 ppm while contamination levels approach 7.5 ppm. A lichen. C t a d m aZpestris, is a l so an indicator of Cd p o l l u t i o n . Normal Cd levels are 0.1-0.2 pprn i n this species while the contaminated level i s a b o u t 1 ppm28 (Cd levels i n Hat Creek lichens were below 0.5 ppm).
Cadmium i s thought t o be non-essential to ani mal^.^' Animals a re ex- posed to Cd through ingestion' o f food and water and inhalation." Poison- ing of herbivorous animals via ingestion o f Cd i n plants is unlikely since the absorption of Cd f m the gas t ro in tes t ina l t rac t i s poor.28 However, mamls eliminate ingested Cd slowly and i t tends to accumulate in the l i v e r and kidney." Under such conditions Cd could exert a moderate t o high toxic effect on mmals3' although i t has been used as an antihelminthic drug i n swine and poultry a t concentrations ranging from 30-1,000 ppm i n the diet . 34
Goodman and Roberts35 report that grass contaminated by industrial pollution containing 9.9 ppm Cd i s lethal to horses, a sensitive species. They indicated that as much as 40 ppm Cd could be accumulated by grass from industrial pollution. In f ac t , Cd was' suspected of k i l l i n g a horse which contained 410 ppm of the element i n i t s kidney and 80 ppm i n its liver. 31
Underwood found tha t 45 ppm Cd i n the diet of r a t s fo r six months caused s l ight toxic symptoms. Bowen reports that a 500 ppm Cd per day d i e t is toxic to ra ts , whereas 1600 ppn per day is le tha l . Gough and Shacklette 10
note that a subtoxic level'of 5 ppm Cd i n the drinking water of rats given f o r 180-240 days produces systolic hypertension. Other investigations show that 30-60 ppm Cd i n the d i e t of sheep fo r 191 days reduces irowth and food intake.36 Toxic doses of Cd compounds to various laboratory animals range from an LDI2 of 250 ppm cadmium fluoborate [Cd (BF,),] t o an LOso of 72 ppm
cadmium oxide (Cd 0).
7 4
The primary toxic effect o f Cd on t e r r e s t r i a l animals i s i n h i b i t i o n of respiratory oxygen e~change .~ ' tlowever, the manifestation of Cd poisoning d i f f e r s w i t h dffferent routes of contamination. Inhalation of Cd produces primary pulmonary disorders16 w i t h approximately 40% inhaled Cd retained i n the animal.38 Chronic exposure t o Cd through the respiratory t ract produces emphysema i n experimental animals.'* Miller38 reports also that Cd increases e r ror i n ce l lu la r ONA replication i n chromosomes.
II
.-
_ i
. I
Low level Cd concentrations may severely affect the reproductive -. .. potential of mmalian populations through an increase i n embryonic mortality and/or decrease i n sperm ~ i a b i l i t y . ~ ' Schroeder and Mitchener4O showed - I t h a t 10 ppn Cd causes the loss of a mouse s t r a in w i t h i n two generations.
FS-22 -
Ir

rp
L
a
II
I
Another pathological effect caused by Cd i s an inhibit ion of: hemoglobin production resulting from Cd interference with incorporation o f iron i n t o h ~ n o g l o b i n . ~ ~ The symptoms of this are vir tual ly the same as iron deficient anemia. Hematocrit values decrease in a l l Cd-fed animals4* and may prove t~ be a sensi t ive indicator of Cd poisoning. Cadmium can also produce hmolysis,26 abnormal l iver ,43 kidneys44 and osteomalasia i n rats similar t~ tha t of Cd induced I ta i - I ta i d isease observed i n a Japanese fishing village population. 45
Cadmium appears t o be highly toxic t o aquatic organisms a t low concentra- tions, Carter and Cameron46 report that Cd was the most toxic t race element t 3 aquatic invertebrates. Dsvies and G 0 e t t 1 ~ ~ s t a t e t h a t Cd levels as low as 0.0015 ppm i n water could cause toxic effects on small rainbow trout . Axordingly, Cd could be of some concern t o Hat Creek and v ic in i ty f i sher ies a j Cd levels i n Hat Creek and Bonaparte River averaged 0.0013 PPI. More c'mservative estimates of Cd levels in water harmful t o rainbow t rout range f-om 0.003 t o 0.01 ppm. 47'48 Bilinski and Jonas4' report that 10 ppm o f Ct lC l2 i n rainbow trout gi l l . t i ssue i n h i b i t lactate oxidation by g i l l fflaments. Other e f fec ts of Cd toxici ty on f ishes include interruption of energy p"oduction by blocking oxygen uptake,50 muscle spasm'' and pathological cllanges i n the in tes t ina l t rac t , kidney and g i l l s . 52
In sumnary. existing Ccl levels i n certain Hat Creek receptors, such a s :oil and stream sediment, exceed concentrations reported i n stud.ies referenced ebove. Moreover, levels a t which Cd exerts toxic effects in vegetation are not h i g h a1 though many species are Cd tolerant and can accumulate Cd. However, l e tha l e f fec ts on some animals (i.e., horses) ingesting grass w i t h h igh Cd levels has been demonstrated near industrial sources.
I'
.. . II (,') Chromium (Cr)
s Average concentration 01' chromium (Cr) in selected Hat Creek receptor mc.terials collected d u r i n g 0c:tober 1976 are presented in Table F5,-9. Average Cr levels in aquatic samples ranged from about 0.01 ppm (water, -
I

I .
uatar. 0.0113 0.0010 0.0149
!ItTUBU 90dI.*)llt 61.61 in.% 261 .T3
:,("I, :.,. 11.H3 0.5') 2.61
O.Mo6 0.0101
1m.06 2113.33
0.M
39 i 65 530.00
0.33 9.M
2.33 3.61
2 . a 11.))
0.50 2 . M
0.0005 0.0123 0.0006
150.99 > 526.61 z 211.13
3.53 2.14
162.W 02.61 31 :ro 300.00
5.29 3.33 0.m 6.00
1.20 1.10 > 0.41 6.61
4.26 5.00 0.00 1.00
0.M I .M 1 .M 5.33
> 21111.75 z 1111.07
0.0121 0.0020
5.M ?.e5

Site 3) t o >526.67 ppm (stream sediment, S i t e 3 ) . Chromium concentrations were f a i r l y high in f i sh and stream sediment samples a t a l l s i t e s although t h e resu l t s were variable. Stream sediment levels increased progressively frcm S i t e 1 (upper Hat Creek) downstream t o S i t e 4 (lower Bonapartt! River). For terrestr ia l receptors , Cr levels ranged from 4.10 ppm (grass , Si te 4) t o 530.00 ppm (soil, Site 3). Soil contained the highest Cr concentration amc'ng receptors a t each s i t e b u t , as with stream sediment, data Wa!i highly var iable . Soi ls a t Site 3 (Arrowstone Creek) had the highest Cr levels of any s i t e f o r a l l three sampling periods.
Chromium concentration i n material collected during January and May 1977 are provided i n Table F5-10. As w i t h the results reported for As and Cd, Cr showed large var iabi l i ty among samp1ing.times. Hqwever, contrary to t h e , As and Cd temporal f luctuation, Cr concentrations appeared t o decrease i n receptors from October 1976 t o January and May 1977.
Concentrations o f Cr i n di f fe ren t ecosystem components, as derived from the l i te ra ture , a re suma.rized below:
1. r iver water - 2. municipal water - 3. so i l -
- 4. food vegetation -
- 5 . non-food vegetation -
6. land animals
0.001-0.010 ppm53
0.035
250 ppm as chromic oxide, !higher concentrations i n igneous ,rocks, shales and clays, and i n phosphorites 16-46 ppm. Wyoming 5
0.020-0.080 p p , human 0.59 ppm. hay
39-48 ppm, lower plants ( l ichens, grasses) 4.9-7.6 ppm, higher plants (trees, s h r ~ b s ) ~ 6.5-180 ppm, Wyoming 5
0.075 ppm4 0.02-0.33, deer mice, Wyom.ing
53
53 53
9
5
F5-25

I
Based.oa the.~bove,iilformation,. i t appears.-that Cr levels in fish and small ~..
. m a m l s .in the-v ic in i ty of--Mat Creek may be .high.tompared~.to daw reported .a . i r , ihe..above..studies. Chromium concentrations i n other Hat Creek receptors ar'e consistent w i t h Cr level's measured elsewhere.
There are different opinions on whether Cr i s an essent ia l (element t o vegetation. Chapman6 report:; t h a t the addition of Cr i n soi ls d l l f ic ient in Cr stimulates plant growth. He adds that Cr increases le t tuce growth a t 0.1 ppm and corn seedling growth a t 0.5 ppm. Chromium can also 'increase nitrogen f ixation i n peas although the physiological mechanisms itre poorly understood.6 On the other hand, NAS53 reports that Cr is non-essential t o v e ~ ~ e t a t i o n .
The tox ic i ty of Cr t o vegetation depends on i t s chemical form, solubi- l i ty and concentration. Chrcmium may interact synergis t ical ly w i t h Ni , Co and Mg i n so i l i n exerting i t ,s toxic effects. Chapman reports t h a t 8-16 ppn of Cr as chromic or chrcnate ion produces chlorosis on sugar beets i n salld culture. Chrmium (Cr ) a t concentrations between 0.03-64 ppm may i n h i b i t the growth of algae.53 Some bryophytes may a c t as an i o n exchanger anli accumulate large amounts of Cr without injury. For instance, i n the region of a Swedish ferro-alloy plant, the concentration of Cr i n the moss Bypmrm cupressiforine ranges as h i g h as 12,000 ppm compared w i t h a normal va'lue of 10 ppm. However, no damage to moss is reported.
6
+6
53
One or more specific organic Cr complexes (characterized by low molecular weight, water so lubi l i ty and heat stabil i ty) designated as the "g'lucose tolerance factor" seem to be physiologically active i n SJch a way as t o meet the c r i t e r i a f o r an essential element t o animals.53 I ts deficien- cy resu l t s i n impaired glucose metabolism due t o poor effectiveness of i n - su'iin. Chromium may also be involved i n serum cholesterol homeos,tasis. Underwood indicates that Cr i s necessary t o incorporate several (amino ac,ids into heart protein and t o enhance growth, especially i n males.
7
Non-dietary exposure from the environment v i a a i r and water ,furnish a significant proportion of CrC6 accumulated by animals. Highest concentra- t ions come from air .53 Chrmium in food i s generally poorly abso"bed by the GI t r a c t and i s excreted in urine (80%) a n d feces (20%). 53

Using low t racer doses of CrC12, NAS53 f o u n d that the uptake o f Cr i n r a t s was highest i n ovaries and spleen, followed by kidney, l i ve r , lung, heart, pancreas and brain i n decreasing order. NAS53 also notes that the distribution of the injected glucose tolerance factor i s different; liver accumulates the highest concentratjon followed by uterus, kidney, and bone.
The hexavalent form o f Cr i s more toxic than the t r iva len t because of i t s oxidizing potential and its easy penetration through biologic membranes. Concentrations o f Cr i n excess of 2.0 ppm are toxic i n enzyme and bacterial systems.53 A t 5 ppm i n drinking water, Cr+6 was found to accumulate i n r a t s , b u t i t caused no changes i n growth r a t e , food intake or bood chemistry. However, chronic toxicity has been observed i n several manmalian species' drinking water containing grea'ter than 5 ppm Crt6. Mixed dust containing 7 mg/m of Cr03 was shown to be fatal to laboratory mice aver a 10 day ex-
posure period and i s barely tolerated by ra t s . The same study53 reports 500 ppn of potassium chromate i n drinking water and 0.12% of zinc or potassium chromate i n feed were the maxim1 non-toxic concentrations to rats.
3
Klassen. Hasfurther and Young54 report that b l u e g i l l and several varieties of sunfish could survive for a month i n water containing 50 ppm of Cr . Rainbow trout are capable of accumulating Crf6 from water containing +6
as l i t t l e as 0.00l'ppn. A t a concentration of 0.01 ppm Cr4 and less, the uptake of Cr levels off af ter 10 days indicating excretion is equal to uptake. Uptake of Cr by fish i s .passive; the amount accumulated i s dependent on the concentration i n the water and the duration o f exposure.55 The amunt of Cr accumulated by fish is not a measure of the lethal dose. Some f i sh exposed to 5-10 ppm Cr survive for a limited time w i t h a to ta l body concentration of Cr f a r i n excess of t ha t accumulated by fish tha t d ie as a result of longer exposure to much lower levels. This may indicate that acute high-level exposure to Cr is less detrimental t o f ish than low level chronic exposure. Vinogradov reports that the maximum acceptable 9
chronic no-effect concentration of Crt6 i n water i s 0.2-0.35 ppm f o r rainbow and brook t rout (Hat Creek waters averaged less than 0.013 ppm Cr).
55
c
_.
" I
-. I
F5-?C

1
(I
m
111)
I
m
"
' I
I
Q ~.
. .
1
Symptoms of Cr poisoning in animals include neoplasms13 and marked i r - r i t a t i o n and corrosion of the GI tract. Vomiting, diarrhea, gastric and intest inal hemorrhage are ser'lous symptoms observed in dogs. Kidney lesions arc! the most comnon type of systemic damage i n all species.53 Schiffman and F r o d 6 found t h a t the hematocrit of trout undergo highly significant increase when the f ish are exposed t o . 2 0 ppm Cr.
In summary, Cr, based on information in the literature, Cr apl2ears t o be re 'a t ively toxic t o bo th plants and animals. Chromium levels in animals co' lected from Hat Creek environs are higher than values reported in other stl;dies referenced above. Values for other receptors are of the !same mag- nit.ude as levels reported i n t.hese studies. All Cr concentrations measured in Hat Creek mater ia ls are far below toxic levels.
(9) Cobalt (Co)
Average concentration' of cobalt (Co) in Hat Creek receptors sampled dur . ing October 1976 are provided in Table F5-11. Averages ranged .From O.ClO3 ppm (water, Sites 1 and 3) t o 22 ppm (stream sediment, S i t e 4) in aqLatic samples and from 0.20 ppm (grass , Si te 4) t o 21.33 ppm ( m i l , S i t e 3) i n t e r r e s t r i a l samples. As w i t h previous elements, Co was highest in str,eam sediment and soil samples. Trends i n Co concentration among s i t e s were n o t apparent for other sampled receptors.
Naturally occurring concentrat.ions of Co i n ecosystem components from different regions are sumarized below.
1. water - -
2. so i l s - - -
3. vegetation - - -
0.0009 ppm 4
0.0058 ppm8
8 Ppm4 1-40 ppm6 3.8-39 ppm, Wyoming
0.5 ppm4
PPm
5
6,8
0.26-2.6 ppm, Wyoming 5
F5-29

.* wotar ' 0.003 0.001 0.006 0.0011 0.003 0.001 0.004 O.Oo0 3 t r a m Bedlwnt 0.33 2.91 6.00 I .00 14.33 3.n1 22.00 4 .o( PISI, **I 0.31 0.15 < 0.30 2. 0 . a 0.31 0.03
0.004
12.61 0.0014
2.31
< 0 . 3 4 > 0 . U f

4. animals - 0.03 ppm 4
- 0.02-0.22 ppm7 - 0.02-0.33 ppm, deer mice, Wyoming 5
.Except-ior%naU mamals, ;rest11 t s d & -analysis-on Hat-Creek ,receptors w e s i ~ n i l a r - t o those-~concentra+ions-:~ported-;in-the.'Iiteratur.e-. Small mammals, chdracterized by h i g h Co l eve l s a t S i t e 4 (Cornwall Mounta in) and S i t e 5 (Ashcroft), exceeded levels reported i n studies referenced above.
Cobalt i s an essential e'lement for blue green algae, some bacteria seed 4 plcnts,and green algae because i t catalyzes enzyme activation for nitrogen.
However, present ly there is n o evidence tha t Co i s e s sen t i a l t o h'igher p l z n t s . 8
Bowen repor t s tha t Co i!; extremely toxic t o plants. Chapman found 4 6
t h a t small amounts o f Co i n solution cultures, sometimes as low as 0.1 ppm, prcduces toxic effects on many crop species. He adds, however, that natural- l y occurring excess o f Co i n soi ls is unl ikely as none yet have been reported. Symptoms of Co toxic i ty t o vegetation include depressed growth, chlorosis, necrosis and even death of plants. 6
Cobalt is essent ia l for ruminant vitamin B12 production and i s unique amcng trace elements i n this regard; i t is b iological ly act ive for. the higher animals only when incorporated in a vitamin.8 Underwood reports t h a t sheep and catt le require about 200 ng/day of Co. He adds t h a t the element may a l so be essential for non-ruminant:;.
7
Ingested Co i s poorly absorbed and is eliminated mainly i n the feces. 7
I t may accumulate i n the l i ve r , kidney,and bones o f animals. 4,7,8,10
' Concentration o f Co in body tissues that are non-toxic are: 2 . 4 ppm f o r r a t s , 10 ppm f o r dogs. and 3 i)pm fo r sheep." Underwood s t a t e s t h a t a dietary intake of 150 ppm of (10 can be tolerated by sheep fo r up t o 8 weeks. Gough and Shacklette'' found t h a t sheep could to l e ra t e 0.35% per day of Co i n t h e i r d i e t w i t h no i l l effect!;.
7
F5-31

Concentrations of Co tha t a r e considered toxic for selected organisms are sunmarized below.
1. c a t t l e - 1 ppm, body weight-
2. sheep - 4010 ppm, d ie t
10
7
- 300 ppm, body weight as a soluble sal t - 40-60 ppm, body weight
7 7
3 . r a t s - 701 ppm day, diet4
4. man - 670 ppmlday, d i e t 4
H e m 5 7 found that t race amounts of Co seemed t o stimulate growth o f aquatic organisms b u t he observed a toxic e f fec t on st ickleback f ish a t about 10 ppm.
Cobalt poisoning may cause a severely depressed appetite, weight loss, and anemia i n sheep, and has resulted i n polycythemia, reticulocytosis, and increased blood volume i n mice, rabbits, guinea p i g s , dogs, pigs, ducks. chickens and man.7 Petechial and ecchymotic hemorrhage i n the small intes- tine, fa t ty- inf i l t ra t ion. o f the l iver , s l ight pulmonary edema and congestion are other effects of Co toxicity i n manrmal~.~' Shabalina5' found t h a t non- toxic doses o f cobalt chloride i n the d i e t o f 2 year old rainbow t rout in -
'creases temperature tolerance by 1.6% and causes body f a t redistribution. Toxic doses may also produce grastrointestinal hemorrhages.
In sumnary, Co i s moderately to severely toxic to plants and animals. Cobalt concentration in ' sampled Hat Creek receptors appear to be similar t o
-values reported i n the literature as referenced i n the preceding discussion.
(h) Cop.per ( C u )
Average concentrations of copper (Cu) i n Hat Creek receptors collected d u r i n g October 1976 are shown i n Table F5-12. Averages ranged from 0.0028 ppm (water, S i t e 1) t o 49.00 ppm (stream sediment, Site 3 ) for aquatic samples. Although var iabi l i ty was h i g h , the Bonaparte River (Sites 3 and 4) had higher
II
.L
I
"
F5-32
" I
I

Average conrentration (ppn) of Copper (Cu) In receptor materials colleoted durlng Oatobcr 1976 Tabla P5-12
0.0028 0.0006 0.0098 0.011 0.0111 0.0085
26.61 3.71 25.33 9.49 49.00 16.50 33.61 7.54
4.61 0.30 4.33 0.61 4 . 0 0 1 .OO
0.0041 0.0012 33.61 0.0069 0.0041
5.26
I .33 0.44
40.33 21.17 50.33 11.26 31.61 20.19 34.33 12.00 65.00 52.56 41.13 11.03
100.00 90.00 31.33 13.53 14.33 3.04 10.61 1 .76 21 . 33 1.25 35. 53 17.16
5.33 1.15 13.61 4.40 , 6.33 2.85 4.61 0.00 6.67 u.33 1.33 1.28
12.00 1.51 9.61 4.26 0.61 0.00 16.33 4.70 32.73 9.33 15.x 10.67 41.67 11.61 2.40 111.61 164.11 23.61 12.11 13.33 1.08 50.20 33.51
3.26
:, See rlrat footnote In Table P5-2 for explanation 01 < and > ombola.
There -0 Only four equatlo s l u p l l r q aites, " ' No Ileh aould be colleotad at Site 3 .
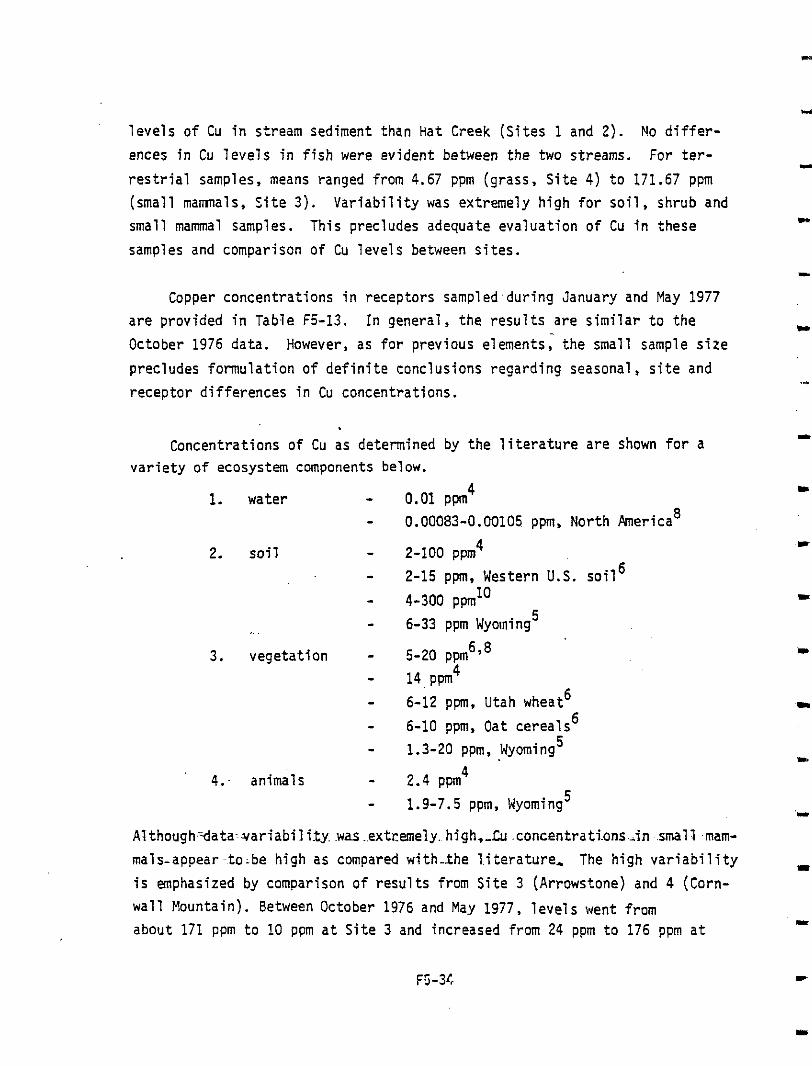
l eve ls of Cu i n stream sediment t h a n Hat Creek ( S i t e s 1 and 2). No d i f f e r - ences in Cu l eve l s i n f i sh were evident between the two streams. For t e r - r e s t r i a l samples, means ranged from 4.67 ppm (g ras s , S i t e 4) t o 171.67 ppm (small mamals, Site 3). Variabi l i ty was extremely h i g h for soi l , shrub and small mammal samples. This precludes adequate evaluation of Cu i n these samples and comparison of Cu levels between s i t e s .
Copper concentrations in receptors samp1ed.during January and May 1977 a re provided in Table F5-13. In general , the resul ts are s imilar to the October 1976 data. However, as for previous elements, the small sample s i z e precludes formulation of definite conclusions regarding seasonal, si te and receptor differences i n Cu concentrations.
Concentrations of Cu as determined by t h e l i t e r a t u r e a r e shown f o r a var ie ty of ecosystem components below.
1. water - -
2. so i l - - - -
,.
3. vegetation - - - - -
4.- animals - -
0.01 ppm 0.00083-0.00105 ppm, North h e r i c a
2-100 ppm 2-15 ppm, Western U.S. s o i l 6 4-300 ppml0 6-33 ppm Wyoming
5-20 ppm6*8
4 a
4
5
14. ppm4 6-12 ppm, Utah wheat 6
6-10 ppm, Oat cerea ls 1.3-20 ppm, Wyoming 5
2.4 ppm 1.9-7.5 ppm, Wyoming
6
4 5
A1 though~data:rar iabi l it.y. w a s ..extremely. high,-Lu .concentrati.ons A n .small -maw mals-appear to;be h i g h as compared with-ihe l . i terature, The h i g h v a r i a b i l i t y is emphasized by comparison of r e su l t s from S i t e 3 (Arrowstone) and 4 (Corn- wall Mountain). Between October 1976 and May 1977, l eve l s \vent from about 171 ppm t o 10 ppm a t S i t e 3 and increased from 24 ppm t o 176 ppm a t
F5-34
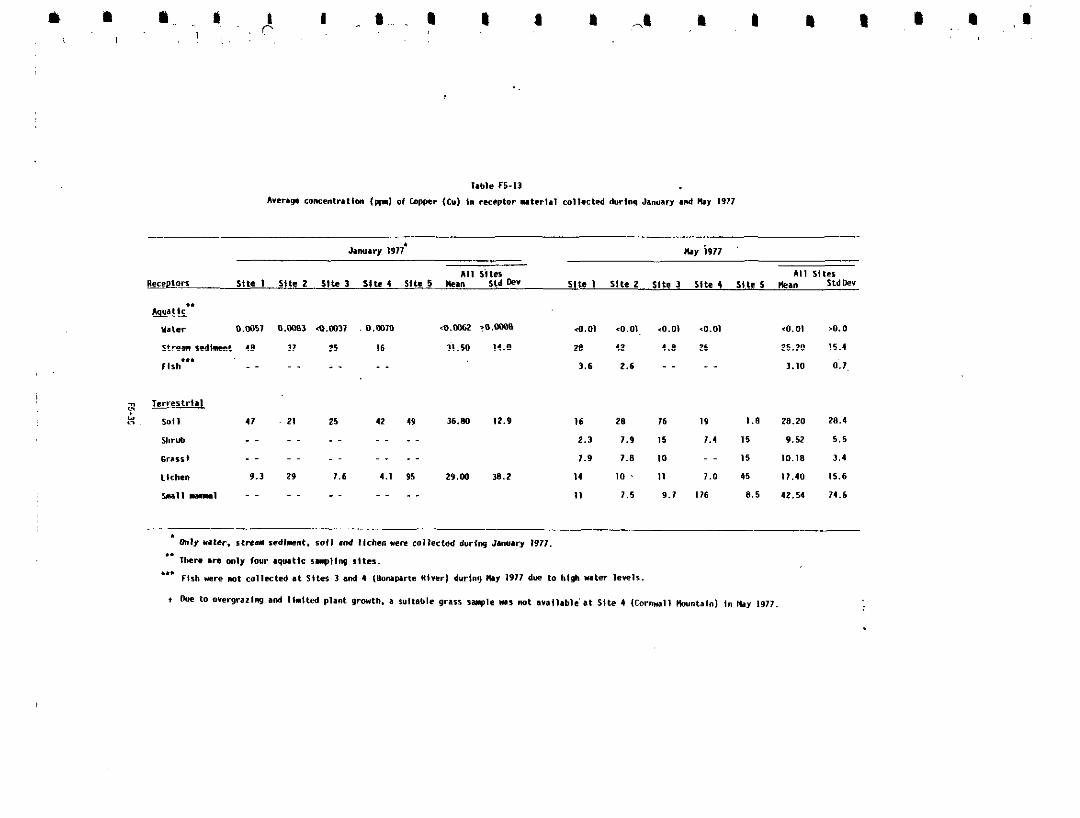
Tcrrertrlll <.
w , so11 I 1 . 21 25 I2 19 36.W 12.9 16 28 76 19 1.e ZB.ZO 20.4
Shrub " 2.3 7 . 9 I5 7.1 IS 9.52 5 . 5
G,d.lt " ~. " " 7 . 9 7 . 8 IO .. I5 10 .18 3.4
Llrhen 9.3 29 7 .6 1.1 95 z9.m 38.2 1k IO , 11 7.0 45 17 .40 15.6
W l l l r u l - - I 1 7 . 5 9 . 7 176 8.5 42.54 74.6
" " .. _ _ ..
" " " _ _
Si t e 4. The implications o f the h i g h Cu observed i n small mamnals are un- clear, although the literature as discussed below suggests that most animals can tolerate much higher concentrations of Cu.
Copper i s an essential element t o vegetation. 498910 I t i s a required
26 constituent o f numerous essential enzymes and proteins, an important example of which i s the cytochrome oxidase, the terminal oxidase in most plants. Peterson6' reports that Cu can be accumulated t o a certain extent by plants. Williams,61 however, indicates that the element tends t o remain in roots o f vascular plants making i t unavailable t o g raz ing herbivores. Several species of bryophytes ( i . e . , mosses and lichens) may serve as an indicator of plant exposure t o h i g h Cu levels. 4
Copper deficiencies i n agr icul tural soi ls are much more common than Cu ex- cesses; fer t i l izat ion w i t h Cu, especially on highly organic or sandy so i l s , is a comnon practice." Toxic symptoms i n plants may resu l t Prom approxim- ately 20 ppm in tissues6'* (shrubs sampled a t three different sl tes during October 1976 evidenced values higher than 20 ppm Cu). Copper toxici ty is governed by soi l pH. Chapman found that spinach and gladiolus do not dev- elop Cu t ox ic i ty a t so i l Cu concentrations of 93-130 ppm a t pH 4.5-4.7. Seedlings of same grass species such as grass ( A p s t i s sp.) have been shown t o develop a tolerance t o Cu over a 10 week period.@ Hemkes and Hartmen report that some grain species can accumulate u p t o 15 ppm Cu which may be a hazard t o grazing sheep.
6
63
Severe toxicity t o snapbeans may occur when tissue levels of Cu exceed 40 p p ~ n . ~ ~ A reduced yield may result in t i s sue Cu levels o f 20-30 ppm. Bell and Rickard6' in a laboratory study found tha t 0.5-50 ppm of copper acetate in cauliflower, lettuce, potato and carrot inhibi t the growth of these species. Chapman l i s t s a l f a l f a , clover, poppy, spinach, gladiolus, corn, bean and squash as species sensit ive t o Cu. Plant toxicity to Cu is usually manifested by foliar chlorosis caused by the interference o f exces- sive Cu w i t h iron metabolism.
64
6
10
"
,L
I
.. -
. .I
"

I)-
I
I
I
m
I i
.
* .
t
- 1. * 11 - 1.
'IC'
...
r'
Copper is also an essential element to animals. It is an irportant constituent of numerous enzymes and proteins ranging from hemocyanin, the oxygen carrier of numerous invertebrates, to cytochrome oxidase, the terminal enzime in the energy transport system of Copper is essential for the proper utilization of iron; ceruloplasmin, the blue Cu protein found in tile plasma of most vertebrates, directly affects the plasma iron levels. Copper also facilitates the mobilization of iron, particularly from the reticuloendothelial system, for the rapid biosynthesis of hemoglobin. Copper p'lays a significant role in ::he enzyme machinery necessary for the biosynthesis 0" proteins involved in the proper constitution of the connective, dermal and e'lastic tissues.26 Copper i:; also necessary for pigmentation maintenance for red blood cell formation, nolmal growth and reprod~ction.~ Underwood reports that sheep require 1 mg Cu per day, pigs need 6 ppm and most lab animals require 50 ppm per day to maintain normal physiological activities.
7
Copper is poorly absorbed from the small intestine in most mimnals. Most of the tu in blood is'bound to the Cu protein ceruloplasmin. A small fraction (about 5%) is loosely bound in albumin. It is the albumin-bound fraction of the serum t u that i s in rapid equilibrium with the Cu in the tissues and it is considered to be the transportable form of Cu i n the
Copper can also pass readily into red blood cells. Copper in the liver is accumulated within the cell membrane and is released for incorpora- tion into blood forming elements of various Cu-containing enzymes. Besides the liver, Cu may accumulate in the brain, adrenal gland, heart, intestine, kidney and stomach of mamnals. 4y7*8 In fish, liver and gills are the con- centrating organs.66 Copper excesses are usually eliminated in bile or urine. 7
Investigations of the effects of Cu smelter fly dust containing 2.5% Cu and a similar concentration of As203 indicates that animals as far away as 5 km from the plant are affecte,l.l8 Hmkes and Hart~nen~~ found that sheep grazing on either side and within 20 m of high tension copper tower lines bemne ill and die after conslming dry forage growing on soil containing Cu ex:esses. Toxic concentratio!is for a variety of animals are summarized below.
F5-37

1. pigs - 7425 ppm i n diet, severe toxicosis
2. r a t s - 2000 ppm day/diet, lethal
3. humans - 330-670 ppm day/diet, toxic
4. horses and sheep - 775 ppm, liver, toxic and
7
4
often lethalI8
5. sheep - 725 ppm o f CuSo4, 1 ethal
Gough and Shacklettel' note that when sheep graze on pastures o f normal Cu content b u t low i n Mo ( ~ 0 . 1 ppn), Cu accumulates i n their l iver . This ac- cumulation sometimes resu l t s i n chronic Cu poisoning, followed by death. Early chemical symptoms of Cu poisoning include conjunctivitis, stomach and intestinal catarrh, salivary secretion, miscarriage, emphysematose foet i , afterbirth retention,and reduction or complete stoppage o f m i l k production. Also, necropsy may reveal l i v e r enlargement. 18
Laboratory experiments on the effects of Cu and Zn on the eggs, fry, and fingerlings of Atlantlc salmon, brawn trout,and rainbow t rou t show tha t there is l i t t l e or no mortality durjng exposure for 21 days t o Cu concentrations of 0.04-0.06 ppm.68 Hazel and Meith6' found tha t Cu concentrations of 0.08 ppm do not noticeably affect the hatching success of chinook salmon eggs. MacKereth and Smyly" observed t h a t stone loach can survive in water contain- ing 0.2 ppm o r Tess o f Cu. Davies and Goett14' determined tha t Cu concentra- tions i n water o f 0.012-0.019 and 0.0095-0.0175 ppm have no e f f ec t on rainbow t r o u t and brook trout, respectively (Hat Creek waters averaged less than 0.0062 ppm Cu).
In general, 0.1 ppm of Cu in water is found to be fa ta l t o f ish. LC50 of Cu fo r rainbow t r o u t range from 0.056-0.15 ppm i n water depending on the hardness. 47'71. Hazel and Meith6' report t h a t 0.02-0.04 ppm Cu i n water i s
. acutely toxic to chinook salmon fry, Stone loach die w i t h i n 24 hours i n water containing 0.2 ppm or higher of C U . ~ ' Arthur and Leonard7' estab- lished a TLM (tolerance limit, median) for a variety o f aquatic invertebrate species as 0.006-0.012 ppm. General effects of Cu poisoning on aquatic' organism, particularly f ish, include renal and la tnral bone lesions, 73
increased corticosteroid ievels ,74 increased red blood cell production and h e m e t ~ c r i t , ~ ~ reduced natality,68 and increased blood pH. 76
I
I
II
..
'L
_i
L L
.." I
"I

"
9..
In sumnary, t u i s an essential element t o plants and animals and is mojerately toxic a t high concentrations. Except for small mammals, Cu con- cei t ra t ions in Hat Creek receptors are similar t o values reported i n the l i t e ra ture . Although Cu levels in small mamnals were high, they were f a r below toxic concentrations as reported in the l i t e ra ture .
( i ) Fluorine ( F )
Average concentrations 0.f fluorine ( F ) in Hat Creek receptors sampled during October 1976 are provided i n Table F5-14. Fluorine was no t measured in October water samples. Va'lues. in other aquatic samples ranged from 63.33 ppm ( f i sh , S i t e 4) t o 347.00 ppn (stream sediment, S i t e 4 ) . Soil and shrub had highest levels of F found in terrestr ia l mater ia ls . However, as w i t h Cu, r esu l t s were too variable t o permit a determination of significant: trends among s i t e s or between receptor materials.
Fluorine concentrations in receptor materials sampled d u r i n g January and May 1977 are provided i n Table F5-15. Fluorine levels, as w i t h previously discussed elements, were v a r h b l e i n seasonal samples. All materials sampled dur ing January 1977 were characterized by higher F concentrations than in October 1976 and grass and sane lichen samples were much higher i n May 1977 than i n October 1976. Fish and small mama1 samples decreased in F content from October 1976 t o May 1977.
Concentrations of naturally occurring F i n selected ecosystem components as determined from the l i t e ra ture a re shown below.
1. water - 1 Ppm
2. s o i l s - 200 ppn4
4
- 96-260 ppm, Wyoming 5
3. vegetation - 2-20 ppm a - 0.5-40 ppm - 20-700 ppm, Wyoming'
4
F5-39

202.00 83.11 72.33 26.61 156.61 11.64 Z 341.00 > 326.50
14.33 2% 31 145.00 13.65 63.33 3o.e
216.67 43.72 > 466.61 > 260.22 43.61 19.94 221.61 112.04 m.00 41.W > 201.5) > 63.M
263.33 78.81 110.67 19.00 10.00 31.32 > 706.61 > 293.33 115.00 31.15 > 254.11 > 81.66
29.00 12.49 24 .W 1.53 22.00 6.51 14.00 1.53 13.33
16.00
2.19
1.15 157.M 1$6.52
1'0.17 2.92
49.00 20.03 46.61 9.01 52 .00 34 .w 64.13
91.00 24.01 153.00 32.13 91.33 39.49 109.67 10.33 1w.00 17.06 1111.00 14 .OI 14.52

Janwry 1977' i 9 n
Receptors Site 1 Slte 2 Site 3 S l t e 4 S l t e 5 Mean Std Oev Slte I Sltr 2 Slta 3 Site 4 S l t c 5 wan Stdoer All Sltrr A I I S I t e l
a** uater n . m 1.813 o . 1 ~ 0.127 0.545 0.121 0.15 0.14 0.13 0.13 0.11 0.a
Stream r c d l r n t 455 450 5W 410 461.25 26.6 2MI 272 179 188 224.75 48.0
Fllh*** " .. " .. I 4 20 .. " 11.00 1.2
1errertrl.I
sol1 IO10 36 590 660 116 528.10 377.6 . 124 W 107 2 7 1 135 i86 .W 105.9
Shrub " " " " " 9.0 26 19 558 169 156.20 211.0
Gll*lf " .. " " " 63 1360 1600 - - 2770 1118.25 1110.1
Clcllm 555 I00 IO6 04 54 179.m 210.7 3N I1 21 21 204 118.20 145.2 . .
I . a l l m m a l - - .. " " " 68 21 20 83 60 51.00 27.8 1
" , , . I

4. animals - 150-500 ppm, mammalian s o f t t i s s u e - 1500 ppm, bones - 1-2.2 ppm, Wyoming
4 4
5
Fluorine. concentrations .in soils .andrstream sediments during-dariuary- 1977 and i.n grass .dur.ing May 397.7. exceeded the range .of concentrations reported in the l i t e r a tu re . Other F levels were n o t highly inconsistent wit6 the l i t e r a t u r e derived values.
Fluorine has n o t been proved essent ia l t o ~ e g e t a t i o n . ~ Most of the work on suscept ib i l i ty of vegetation t o airborne f luorides has used hydrogen f luoride (HF), as i t i s known t o be extremely toxic t o some species."' How- ever, the research which has been done on f luor ide (F2) , s i l i con te t ra f luor ide (SiF4)*, and f luoros i l ic ic ac id (H2SiF6) ind ica tes tha t each may be as toxic as HF. 223,224
Gaseous f luor ides a re absorbed through the leaf stomata and the plant cuticle. Given adequate moisture deposits of fluoride, s a l t s w i l l a l s o be absorbed b u t o n l y i n proportion t o their solubi l i ty .222 Once inside the l e a f , the f luor ide i s taken i n t o the transpirational stream and transported t o the leaf tips. and margins where i t i s known t o accumulate. 2253228 L i t t l e or no movement between individual leaves or between leaves and other organs has been observed. 229
Toxic e f f ec t s on plants (and animals) generally occur within a radius of 1.5-3 h around a stationary source emanating high leve ls of F.77 Gilbert notes F damage t o l i chens a t s i t e s up t o 10 km away from an aluminum smelter. He a lso s ta tes tha t there was a s ignif icant correlat ion between severi ty of damage, ra te o f F accumulation,and distance from the source. Agate e t a l . 218
reports that vegetation located wjthin a mile of an aluminum factory i n the direction of the prevailing wind was destroyed so completely that a layer of pea t was exposed. Furthermore, grazing sheep and ca t t l e exh ib i t ed s l i gh t symptoms of severe fluorosis. They note that ambient F concentration 200 yds from the factory averaged 0.22 mg/m and declined t o 0.042 mg/m a t a dis- tance of one mile.
78
3 3
F5-42
a
I
Chapman6 reports that the most tolerant plants t o F poisoning are usual- l y the best accumulators. He (cites as an example, buckwheat and Spanish moss whi8:h are used for surveying fluoride pollution and can accumulate u p t o 9,9110 and 2,418 ppm in fol iar t issue, respect ively. A general use threshold va l le for F concentration in t:ie atmosphere ranges from 0.007-0.10 ppm 79
altiough some very sensit ive mecies are affected by concentrations less than 0.011 ppm.80 McCune. Temple alqd Witherspoon'' established acceptatlle limits of i n the a i r a s 0.005-0.010 ppm fo r a 2 t o 4 hour peak concentration and 0.013-0.006 ppm fo r 30-60 day ,>eriods.
A polluted atmosphere provides the main source of toxic concentrations of F a'xumulated by plants. On rdre occasions toxic concentrations may be ab- sor>ed from acid Davidson and B l a k e m ~ r e , ~ ~ however, found no direct rel3tionship of airborne F and plant accumulation. After an equilibrium con- c e n t r a t i m i s reached, they note t h a t the plant does not accumulate additional F.
Only a few reliable sensitive indicator plants are reported for fluoride poisoning; Chinese and royal apricots, prune, corn, ponderosa pine, some c i t rus va r i e t i e s and a few species of white-flowered gladiol i . All of these may be damaged from exposure t o 1.0-5.0 ppb F for several days. A71 are l ike ly t o show injury when the i r F content equals 50 ppm or less. 21.9
Toxic effects of F include pollen growth i n h i b i t i o n and germiriation impairment, decreased f r u i t development, photosynthesis impairment, gradual decline of transpiration and untimely d e f ~ l i a t i o n . ~ ~ Foliar symptoms o f F poisoning are marginal necrosis and interveinal chlorosis. Species sensi t ive t o F include gladiolus and ponderosa pines. 6
Fluorine i s n o t essential t o animals b u t i t does promote sound. teeth. 6
However, t o o high a fluoride intake can cause dental defects characterized by modified shape, size, color, orientation and s t ructure of teeth (c l inical symptoms of fluorosis). ' Fluorine is rapidly and almost completely absorbed from the GI t r ac t . Absorbed F i s d i s t r ibu ted throughout the body csr the F i o n is re ta ined by bones and teeth where i t accumulates. Unabsorbed F i s excreted i n the urine.7 Herbivorous animals are exposed t o F prima.rily
F3-43
through forage. Chances of F transfer up the food chain are remote because of its affinity for calcium and its accumulatfon in bones, rhich absorb 96Z of the retained F.82 Underwood reports that sheep, cattle,and pigs can tolerate 80-100 ppm in food wihtout harmful effects. However, a study in Germany found that 40-60 ppm causes cattle to lose weight and may reduce milk production and retard growth.85 In domestic cattle and horses, skeletal concentrations ranging from 1,450 to over 8,000 ppm have been associated with fluorosis.
7
86
Mechanisms o f F toxicity include interference with calcium metabolism, enzymatic processes, normal cellular respiration,and the reduction of the im- mune biological response o f the animal to certain diseases.16 Physical symp- toms include dental defects, deformation of bones, ribs, and joints, and mineralization of tendons. 7 ,a7
In summary, F, particularly as the gas HF, i s potentially very toxic to plants and animals. While concentrations of F in Hat Creek receptors were higher than 1 iterature values for some soil, stream sediment, and grass sam- ples, the levels are well below those known to cause toxicity.
”
(j) Gallium (Ga)
Average concentrations of gallium (Ga) in Hat Creek receptors collected during October 1976 (water samples from January 1977) are shown in Table F5-16. Averages ranged from 0.0010 ppm (water, Sites 1, 2, and 3) to 29.35
ppn (stream sediment, Site 3 ) for aquatic samples and from 0.13 ppm (shrub, Sites 1 and 3 ) to 31.67 ppm (soil, Site 3 ) ?or terrestrial samples. Gallium concentrations were highest in stream sediments and soils for aquatic and terrestrial samples. respectively.
Concentrations o f Ea as determined from the literature provided for a variety of ecosystem canponents are presented below.
I. water - 0.001 ppm 4
2. soil - 0.4-300 ppm4 - 6.0-13;O ppm, Wyoming 5
I.
ML

0.0010 1 0 . O O W C 0.0010 > O.oOo0 0.0010 > 0.WW < 0.0013 > 0.0003
18.67 3.20 13.61 3.71 29.33 4 .e4 27.33 4.91
0.m > 11.60 < 0.35 > 0.15 < 0.43 > 0.13
c 0.0011 P '~.ooo1
2?.25 2.64
< 0.52 j. 0.20
21.67 3 . 3 3 13.61 0.33 31.61 16.23 25.33 12.14 11.67 5.36 12 .40 3.91
0.13 0.03 C 0.11 > 0.03 0.13 0.03 0.27 0.17 c 0.20 > 0.10 < 0.111 > u.M
. ,, 0.03 0.40 0.06 0.43 0.09 0.20 0.00 0.17 0.3'1 0.04 71
0.40 0.10 0.03 0.17 0.47 0.W 0.40 , :- 0.17
0.10 < 0.60 > 'J.21 < CI.5!, j _ Q.07
..I, 0.35 6.27 4 .M 1.33 0.33 6.67 4.67 0.07 0.17 3 .?? 1 . i l

3. vegetation - 0.06 ppm 4
- 0.3-4.8 ppm, Wyoming 5
4. animals - 0.04 ppm, dry mammalian t i s sues 4
- 0.75-1.5 ppm, deer mice, Wyoming 5
Al.though.fheLGa.,levels.dnnHat~.Creek samples exceed leve ls in f i sh and small mamals . reported in , the above studies, the paucity o f information in the l i terature precludes any valid conclusion concerning the potent ia l toxici ty o f Hat Creek Ga l eve ls .
Bowen reported t h a t Ga is non-essential for plants and animals. I t has 4
a low order of toxicity, al though i t can be moderately toxic to mammals i f injected intravenously. 4
( k ) Lead ( P b )
Average concentrations o f 1 ead i n selected Hat Creek receptor materials sampled d u r i n g October 1976 are provided in Table F5-17. Averages ranged from 0.0567 ppm (water , Si te 4) t o 4.67 ppm (stream sediments, S i t e s 3 and 4) for aquatic receptors. Within-site variabil i ty of Pb i n aquatic samples was low. Averages of Pb concentrations i n t e r r e s t r i a l ma te r i a l s ranged from 2.00 ppm (small mammal, Site 3) t o 53.33 ppm ( l ichen , S i te 2 ) . Excluding grass samples a t S i t e 2 (Lower Hat Creek) within-s i te data var iabi l i ty was a l s o low f o r t e r r e s t r i a l samples. Lead concentrations were h ighes t a t t e r - r e s t r i a l S i t e 2 (Lower Hat Creek) during October 1976. This s i t e i s i n c lose proximity t o a highway and the comparatively high Pb level could resul t a t l eas t in par t , from automobile emissions.
Lead concentrations in selected receptors collected d u r i n g January and May 1977 a re given in Table F5-18. Although Pb levels varied among samples, Pb does n o t appear to exhibit the high seasonal var iabi l i ty shown by previous- ly discussed elements. As i n October 1976, h i g h P b concentrations were ob- served in lichens a t t e r r e s t r i a l S i t e s 2 (lower Hat Creek) and 5 (Ashcroft).
?-
e
, c I
a*
t
. I I

** water
Stream sediment c
Fish **+ <
0.00667
4.33 >
2.00 z
10.00
5.61
4.00 z
29.33
2.61 5
0.0058 0.0700 0.0010 0.0633 0.0058 0.0561 0.0058
0.33 C 4.61 > 0.61 C 4.61 > 0.61 c 4.00 > 0.00
0.00 < 2.17 > 0.11 < 2.50 > 0.50
0.0641 0.0056
C 4.42 > 0.23
< 2.22 > 0.17
1.00 1.61 0.33 4.00 0.58 11.33 0.61 5.61 0.33 1.73 0.16
1.20 10.00 4.04 C 3.00 > 0.58 C 3.00 > 1.00 5.00 0.50 < 5.33 > 1.01
0.00 C 21.61 > 15.11 < 4.00 > 0.00 < 4.00 > 0.00 C 4.00 > 0.00 C 7.53 > 3.26
1 .I6 5T.33 6.01 11.61 1.61 14.61 2.13 36.61 4.63 50.33 4 .oo 0.61 c 2.50 z 0.29 C 2.00 z 0.00 10.33 > 6.44 < 8.50 > . 5.11 c 5.20 > 1.14
. .

I I
I I
I I i !
i i I I I I , I
I
i
I

Concentrations o f Pb i n !;elected ecosystem components as derived from the l i t e r a tu re a r e presented below:
1. water
2. soils
3. vegetation
4. animals
0.005 ppm 0.005 ppm
2-200 pprn (mostly unavailable) 0.05-5 ppm (available) 10 ppm, humus 16 ppm1'8; 8.9-58,ppm, Wyoming
0.4 ppm 2 . 7 ppm 3 ppm, dried pine needles 0.3-1.5 ppm, young pasture grass 10-40 ppm, mature pasture grass 7
7100 ppm, lead contaminated s o i l s 14-160, Wyoming 5
4 88
6 6
4 5
88 4
89 7
7
2 Ppm4 0.03 ppm 0.2-0.04 ppm, cows milk 0.02-0.07 ppm, deer mice, Wyoming
88 7
5
Lei"" . . ~ amFmp>pealuraPxeems-
rep&&- Lead concentrations in other receptor materials a r e consistent w i t h t h e l i t e ra ture .
Lead i s found i n a l l plants', although i t i s considered non-essential t o vegetation. 6'10 Although Pb accumulates markedly i n the soil , the accumula- t i o n i s vir tual ly permanent a!; i t i s not eas i ly leached out by ra infa l l or absorbed by plant roots. Pb generally enters plants th rough leaf ,;tomata and accumulates in the leaf, particularly leaf surfaces. 10'90'91 The rougher or more hairy the surface, the greater the accumulation. aelati,vely li-:tle translocation o f Pb takes place w i t h i n the plant.88 W i t h i n the leaf ce' I s , Pb seems t o be bound to poly-uronic acids of the cell wall. Organelles such as mitochondria, ch1orop:asts and nuclei often show high conc'zntrations of Pb. I n general, plant organs w h i c h show an intensive gas exchaige w i t h the atmosphere contain more lead than storage tissues. 90
F5-49

There are no reports of def in i te tox ic i ty symptoms i n p lants that qrew i n areas of natural enrichment of Pb only. Gough and Shacklette'' report t h a t Pb, Zn, and other heavy metals often occur together in mineralized o u t - crops; therefore, i t i s d i f f i c u l t t o associate observed toxicity symptoms i n p l an t s a t these s i t e s w i t h only Pb. Holl and HamppgO found, however, t ha t Pb content i n plants decreases w i t h increasing distance from a Pb emission source. They a l so found that, in general, plants which grow leeward t o a Pb source exhibit higher concentratiom o f the heavy metal than those growing on the windward side.
Many plants will to le ra te h i g h levels of Pb b u t others show retarded growth a t 10 ppm i n solution culture.8 No signif icant effect on plant growth o f grape, apple and orange seedlings were found a t soil concentrations u p t o 150-200 ppm (Hat Creek so i l s averaged less than 10 ppm Pb) . Some plants may absorb large amounts of Pb without exhibiting toxicity symptoms; concentrations in stems of certain shrubs may be as h i g h as 350 ppm Pb w i t h no visible adverse effects'' (Sampled Hat Creek vegetation averaged less t h a n 53 ppm P b ) . Leaves of corn growing 75 yards from a smelter were found t o contain 3200 ppm dry weight.88 Lettuce can accumulate over 2 ppm Pb (fresh washed weight) w i t h o u t showing toxic symptoms.92 Gough and Shacklette 10
found no toxicity symptoms i n cedar trees containing 2% Pb in ash.
6
Toxic concentrations of Pb t o various plant species are summarized below.
1. French beans - 2. sheep fescue -
3 . corn plants -
30 ppm lead sulfate, damaged plants
10 ppm Pb i n solution culture reduced root growth
20 ppm Pb i n nutrient solution, growth re- tarded when phosphate was deficient; 200 ppm Pb reduced growth regardless o f phosphate con- centration
10
10
10
Lead exerts i t s toxic effects on plants by increasing the stomatal re- sistance, thereby reducing the photosynthetic potential of the plant. 90,93 Lead ions also affect the process of photosynthesis by reducing Cn2 f i x a t i o n
F5-50

L
1
I
rl
m
a -
.I
-..
of isolated chloroplasts. Le8sd also inhibi ts the electron transport of photosystem I1 between the s i , te of primary electron donor and water oxidation. Lead may a f f ec t enzyme ac t iv i ty by blocking sulfhydryl groups of proteins and effecting a change of phosphate levels in l iving cel ls . 90
In animals, Pb may be taken in by inhalation, ingestion and dermal translocation, although i t i s considered a non-essential element. Ingested Pb i s poorly absorbed and is excreted mainly i n the feces. Alimentary absorption of water soluble Pb i s approximately 10% and food Pb i s approximately 5% i n man. Absorbed Pb enters the blood bound t o erythrocytes and plasma proteins and reaches the bones and sof t t i ssues . I t i s e l iminated via bi le i n t o the small intestine. Up t o a point, ingestion will equal excretion so retention is negligible. In sheep, i f l e s s than 3 ppm Pb (dry weight) i s ingested daily, none is re ta ined. Dr inking water containing 5 ppnl Pb resulted in Pb accumulation i n r a t s , b u t no deleterious effects on the rat: were otserved.
E ,10
7
Uptake of Pb from the lungs i s more complete as approximately 32% of inhaled Pb i s absorbed.88 Egan and 0'Cui1lg4 found that inhaled F'b resu l t s i r higher blood and tissue concentrations more quickly than do greater antounts obtained by ingestion. Lead i s highly concentrated on lung deposit- a t l e pa r t i c l e s of 0.5 um in diameter or less.8 As particle size decreases sclubility will increase; the proportion passing into the blood will in- crease w i t h respect t o the amount cleared from the lungs by phagoc:ytosis lqmph drainage.7 Absorption th rough the skin i s of importance only i n the c x e o f organic compounds of Pb, par t icular ly Pb alkyls and lead naphthenates. Arimals' tissue tha t may accumulate Pb are bone, l i ve r , kidney, muscle and h ~ i r . ~ ' ~ Gil ls , bones and kidneys show the highest accumulation i n f i sh . 95,96
7
The maximum safe value for portable water supply for animals i s 0.5 ppm.16 The World Health Organization drinking water standard i s 0.05 ppm. 88
Gclugh and Shacklette'' report t h a t Pbt2 concentrations of 0.5-0.8 ppm i n the blood are the threshold for acute Pb poisoning. The minimum cumulative fiital dose fo r cows i s 6-7 ppm body weight per day.94 Schmitt e t a1.97 s t a t e s t ha t young horses have a h i g h suscept ibi l i ty t o high Pb levels i n forage.

Toxic doses of Pb to animals are dependent upon the Pb compound ingested and the sensitivity of the animal affected (e.g., horses are more susceptible to Pb poisoning than are cattle).98 Horses grazing on contaminated hay are affected by a consumption rate of 2.4 ppm/day, while cattle are affected by 6-7 ppm/day.” Stoefenl” notes that 1 ppm/day Pb intake for cattle will produce effects in fetuses before physiological effects in adults can be recognized. Prenatal exposure to 0.34 ppm Pb levels in maternal sheep blood will affect lambs visua1ly.lo1 Egan and 0’Cui1lg4 report that the following blood Pb concentrations are fatal:
1. horse - 0.38 ppm
2. cattle - 0.4 ppm
3. dogs - 0.8 ppm
4. pigs - 1.2 ppm
Schroeder and Mitchner4’ indicate that 25 ppm of Pb will cause the loss of a mouse strain within two generations. Accumulation to 42 ppm Pb in the breast tissue and 168 ppm in the liver is reported to be fatal to pheasants. Del Bono and B~ggiani’~~ found that death occurs in wild ducks when blood levels of Pb exceed 6 ppm.
102
Symptoms of Pb poisoning in animals are derangement of the central nervous system, GI tract, musculature, and the nematopoetic system.” Dairy cows near a Pb source may show a very high incidence of milk fever, infertility, ovarian cysts, and osteopetrosis.*04 Tesinkl” reports that chronic exposure to Pb can also cause anemia and the degeneration of brain and nerve tissue. Christensen and Luginbyh13 state that lead nitrate is teratogenic in pregnant rats. Valkovic found Pb to be a renal carcinogen and a poison in animals and is correlated with mortality from kidney cancer, leukemia, lymphomas and stomach, intestinal and ovarian cancers.
8
Lead poisoning may account for a reduction in the resistance of mice, rats and chicks to bacterial infection by decreasing the numbers o f antibody forming cells. 881106y107 Lead also aggravates viral diseases. lo* Warren 109
reports a high correlation o f abnormally high Pb levels and multiple sclerosis.
9.
.
I
, .~ *.L
.!-
I
It
I
I

I
m
I
L
H N ~ adds tha t there i s a rela.tionship between incidence of swayback in lambs and the Pb content o f pastur? grass, and evidence also suggests t.hat Pb has an inhibi t ing effect on Cu metabolism.
There i s a great variat'ion among f ishes in the i r ab i l i t y t o to le ra te PI,. For example, goldfish seem t o be r e s i s t an t t o Pb poisoning probably because of abundant gi l l secret ion which washes away the film of coagulated mucus from the body and gil l! ; which would otherwise resu l t in anoxia.88 In general, 2.8 ppm" and 0.1-50 ppml0 of Pb in water are given as le thal t o f i s h (Hat Creek waters averaged l e s s than 0.05 ppm). Other investigations hiive revealed t h a t 0.1 ppm I!; le thal t o minnows,88 0.01-1.0 ppm (as lead c i lo r ide ) i s l e tha l t o Daphrrkzalo and 5 ppm is toxic to aquatic invertebrates. 110
Acute Pb poisoning of f i sh is characterized by the destruction of g i l l elithelium and inner organs .resulting in fish ~ u f f o c a t i o n . ~ ~ A lead concen- t ra t ion of 1.25 ppm i n water retards growth, increases mortality and delays s2xual maturity i n guppies. 111
To sumnarize, Pb i s moderately toxic t o plants and animals, although no tox ic i ty has been reported under natural conditions. Except fo r h i g h Pb llrvels i n water and small marmals, Pb concentration i n Hat Creek receptors al-e similar t o values reported i n studies referenced above. No Pb levels i n any receptor presently approach toxic concentrations.
( 1 ) Lithium ( L i )
Average concentration of lithium ( L i ) i n selected Hat Creek receptors collected during October 1976 (water samples from January 1977) are shown i n Table F5-19. Averages ranged from 0.0010 ppm (water, Site 3) t o 37.33 ppm (stream sediment, S i t e 1) f o r aquatic samples and from 0.10 ppm (shrubs, S i tes 2 and 3; small mammals, Si tes 1, 2 and 3) t o 31.33 ppm ( s o i l , S i t e 1). Stream sediments and s o i l s contained the highest levels of L i of all receptors sampled, although data variability was high for b o t h materials.
F5-53

*' ! l i l l C P *** < 0.0013 > 0.0005 0.0020 0 . m 6 < 0.0010 > 0.0000 < o.oo?o > o.ow6
s1rcnm DeclInellt 37,33 31.38 2.60 1.25 4 . 0 0 1.53 3.67 2.19
P l S b t < 0.10 > 0.00 < 0.10 > 0.00 < 0.13 > 0.03
< 0 . IMlG > o.ooo? 11.90 0335
< 0.11 i 0.01
- Tcl rsot r ln l .
S a i l 31.33 21 .oo 13.67 6.69 1.00 2.65 11.60 7.49 8.33 2.67 14.39 5.15
dl,L'"!, < 0.13 i 0.03 < 0.10 > 0.00 < 0.10 > 0.00 0.43 0.20 0.27 0.12 < 0.21 > 0.05
l;!'a3:1 < 0 . 1 4 > 0.06 < 0.27 > 0.03 0.20 > 0.00 11.17 > 0.03 0.17 > 0.03 c 0.19 > o.O:! l,lOl,<:,L 0.67 0.18 0.57 0.23 0.53 0.12 0.60 0.21 < 0.37 > 0.09 < 0.55 > 0.01
:;181i111 .Imr.u8iul i J . I O > 0.00 < 0.10 > 0.00 0.10 0.00 < 0.13 > 0.03 < 0 . 1 7 > 0.03 < 0.12 > 0.01
Naturally occurring levels of Li i n other ecosystem components, as de- t fmined from the l i t e r a tu re , a r e summarized below.
1.
2.
3.
4.
water - -
soil - - - -
vegetation - - - -
animals -
0.0011 ppm 0.002-0.003 ppm
30 ppm4 8-400 ppm6 5-136 ppm, North America 16-28 ppm, Wyoming
0.1 ppm 0.85 ppm, monocots 1.3 ppm, dicots 0.33 ppm, Wyoming 5
0.02 ppm 4
4 6
10 5
4 6
6
d
L i t h i u m i s a non-essential element fo r higher plants and animals. How- ever, i t is an essential trace element fo r some microorganisms. 10
The main influx o f Li t o plants i s from the soil through root systems ard Li i s known t o accumulate i n roots. However, to ta l Li in s o i l s i s not rElated t o i t s ava i l ab i l i t y t o plants. Li tox ic i ty is not known t o occur naturally except i n the case o f c i t rus .6 Many plants are tolerant: of h i g h L i levels i n the soil,112 although some crops are susceptible to i n j u r y when L i i s applied t o the soil i n the form of soluble salts. Acidification o f same neutral or alkaline soils h i g h i n L i also tends to produce Li toxici ty . 113
Lithium i s the most toxic of the alkali metal s a l t s t o vegetation. One study found L i s a l t s t o be toxic i n amounts greater than 30 ppm ard stimulat- i n g in amounts not exceeding 20 ppm i n soil (Hat Creek s o i l s averaged less than 15 ppm o f total Li) . Injur ious effects are produced on soybean, tomato , white mustard, hemp, sunflower, flax, vetch and corn i n decreasing degree by the addition o f 0.2% o f Li2S04 t o the complete nutrient solution in sand culture. Soil L i concentratisms of 16 ppm produce necrotic spots in leaves of potted avocado seedlings.6 Toxic effects o f Li poisoning in plants are mainly expressed in a r e d u c t i ~ ~ n of growth. Symptoms include leaf and t i p b u r n and chlorosis of the entire plant.
6
6

There are no reports of Li toxici ty t o animals under field conditions. In a laboratory study, lithium ( l i t h i u m carbonate and lithium chloride) pro- duced teratogenic effects i n pregnant r a t s . 13
I n summary, L i is moderately to severely toxic to plants and animals. I t i s non-essential t o plant and animal and no cases of natural L i poison::, have been reported. L i t h i u m concentration i n sampled Hat Creek receptors a re w i t h i n the range of values reported i n l i t e r a t u r e .
(m) Yercury (Hg) *
Average concentration of mercury (Hg) i n selected Hat Creek receptor materials collected during October 1976 are shown i n Table F5-20. Average Hg levels ranged from <0.0001 ppm (water , a l l s i tes ) to 0.16 (stream sediment, S i t e 1). Mercury levels i n stream sediment appeared to decrease progressive- l y downstream from S i t e 1 (Upper Hat Creek) t o S i te 4 (Lower Bonaoarte River). For terrestr ia l receptors , averages ranged from 0.02 ppm (small mammals, Sites 1, 2, 3 , and 4 ) t o 0.58 ppm ( l ichen , S i te 1). Highest observed - mercury levels were f o u n d in samples from S i t e 1 (Pavillion Mountain). Lichens had the highest Hg concentration of a l l materials a t each t e r r e s t r i a l L.
s i t e .
- =
Hercury levels i n receptors sampled d u r i n g January and May 1977 a re provided in Table F5-21. Mercury concentration appeared t o increase i n most receptors from October 1976 to January and May 1977. The increase was largest i n grass, small mama1 and f i s h samoles.
Concentrations o f Hg i n selected ecosystem components from different r p a i o n s , as derived from the l i terature, are presented below.
0.0008 ppm4
0.00004 ppmZ7 <0.0001 ppm, surface waters I14
4 . 0 0 2 ppm, all natural waters 0.0001-0.017 ppm, U.S. surface waters- 0.00005 ppm 0.00001 ppm 0.0005
114 1 l a
115 116
Fz-.:e
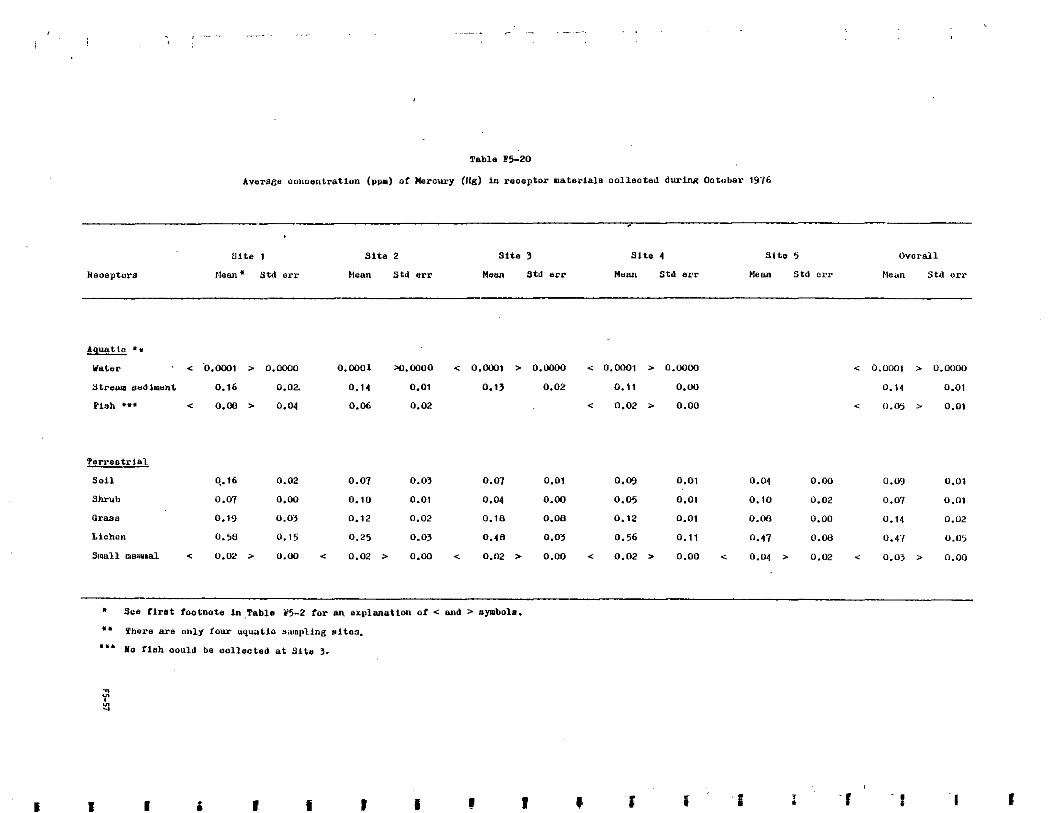
- ,
lquatlo 0.
water ' < '0.0001 > o.oo00 0.0001 w . m o < 0 . m 1 > 0.0000 c 0 . m 1 > 0.ww Streem Bedisant 0.16 0.02. 0.14 0.01 0.13 0.02 0.11 0.00
Plsh *f* < 0.08 > 0.04 0.06 0.02 < 0.02 > 0.00
< 0 . o w I > 0.woo 0.14 0.01
< 0.05 > 0.01
1erree.tr.ls1
so11 0.16 0.02 0.07 0.03 0.07 0.01 0.09 0.01 0.04 0.00 0.0 0.01
Shrub 0.07 0.00 0.10 0.01 0.04 0.00 0.05 0.01 0.10 0.02 0.07 0.01
a r w o 0.19 0.0') 0.12 0.02 0 . 1 s 0.08 0.12 0.01 0.00 0.00 0.14 0.02
LIChcu 0.5s 0.15 0.25 0.03 0.48 0.03 0.56 0.11 0.47 0.08 0.47 0.05
Small mnual c 0.02 > 0.00 c 0.02 > 0.00 c 0.02 > 0.00 < 0.02 > 0.00 c 0.04 > 0.02 < 0.03 > 0.00
E I 1 i 1 z I

I
P ' 1rrr.Strla
so11 0.3 0.1 0.2 0.2 0.1 0.18 0. I 0.19 0.09 0.07 0.15 0.13 0.13
Ihn*
0 . I _ _ _ . 0.19 0.41 0.27 0.29 0.52 0.34 0.1
6,.lIt _ _ 0.40 0.10 3 . 8 6 . - 0.71 1.32 1 . 7
L k h m 1.4 0.8 0.9 0.9 1.4 1.m 0.3 0.32 0.59 0.93 1.40 0.80 0.82 0.4
SUllUl " _ . 0.37 0.39 0.21 0.32 0.30 0.31 0.6
" _. " " " " "
" .~ "
I ' I

I
i
r
I I
2. soils
3.
4.
5. animals
0.03-0.8 ppm 0.030-0.5 ppm114 '
0.2 ppm, igneous rocks c0.200 ppm, limestone and sandstone 0.1-0.3 ppm 7
0.071 ppml0 cO.02 ppm, Wyoming
0.070-0.100 ppm 118
0.015 ppm
6
114 114
5
4,118
0.005-0.035 ppm, f rui ts , vegetables and cereal "- grains"'
<0.500114 0.010-0.200 ppmll9
0.500-3.5 ppm, h i g h Hg areas 114 0.08-0.12 ppm, Wyoming 5
0.045 ppm4 -#
0.02-0.18 ppm, fish' 0.11-1.13 ppm, fish 120 - " 0.44 ppm. fish, New York StateLz' . 0.05-0.07 ppm, deer mice, Wyoming 5
NaturaUy-accurring Hg.-31evels-in Hat-Creek-.receptnrs .are :simjlar-to"alueS reDorted:in--the:7iterature.
Mercury is non-essential for plants'' although plants will accumulate Hg i n seeds and roots.27 Mercury may also influence the absorption and t ransport of Ca, Zn and Cd.7 Soil-bound Hg is general ly not avai lable for plant uptake, although many plants have no barrier against uptake of gaseous Hg through the roots. 122 Furthermore, any effects upon vegetation caused by Hg may be masked or completely eliminated by the strongly antagonistic ac t ion of sulfur . 123
Mercury is not concentrated to a great extent, if a t a l l , in the tis- sues of most plants that grow in normal soi1s.lo Most higher vascular plants are remarkedly res i s tan t t o Hg poisoning a l t h o u g h they may accumulate
I
.L
LI

high concentrations of Hg i : i their t issues. For example, Labrador tea shows no toxicity symptoms w i t h 3.5 ppm Hg i n tissues." Levels as hi!!h as 140 ppm have been reported in t:ne freshwater a l g a i?iteZla. 118
L i t t l e information is ,available concerning Hg concentrations t h a t cause toxici ty i n higher plants. Bell and Rickard6' noted t h a t applications. of 0.5-50 ppm of HgC12 inhibi t growth of cauliflower, lettuce, p o t a t o and carrot. A t a HgC12 concentration of 3.5 ppm, chlorophyll synthesis is 98% inhibited and galactolipid synthesis is 50% inhibited in the unicellular alga Ankistrcdesmcs brawrtii. Significant inhibition of both syn::hesis processes is detected a t HgC12 levels less than 1.0 ppm. A 2.0 ppm level of methyl mercuric chloride inlTibits 98% of galactolipid synthesis. This Hg compound has a l so been shown t o specifically inhibit the galactosyltransferase ac t iv i ty in OugZenu chloroplasts. 124 Other investigations show c h a t 0.1 ppm Hg reduces phtosynthesis and growth of algae. 1259126 D' Itri118 reports tha t 0.027 ppm Hg (as HgC12) i s toxic t o Phaeoohctytm tricoimtum, CltZoreZZa sp. and C h ~ d o m o ~ s sp. a t concentrations greater than 0.9 ppm Hg. Phenylmercury acetate is toxic t o these three species a t concentrations as low as 0.00006 ppm. Toxicity i n ' b o t h inst,ances i s manifested as growth inhibitfon.
Mercury i s non-essenti'al t o animals.'' Route of entry of H g i n t o ter- r e s t r i a l animals f s by inge,stion and inhalation and i t accumu1atc:s in kidneys, l iver , ha i r , skin, nails,and lungs for mamals, as well as feathers for
and l iver . 128a129 Animals <excrete ingested Hg primarily in the feces and very l i t t l e i n urine.
In f i sh , h i g h lsavels of Hg may occur in spleen, musc'le, kidneys,
7
Bowen reports tha t coiisumption of 800 ppmlday Hg2+ in dry weight d ie t 4
i s lethal t o ra ts . Other investigators have found t h a t a cumulative consump- t i o n o f 24.7 mg of methylmercury i s , f a t a l t o ring-necked.pheasants with signs of poisoning occurring between I3'and 17 mg. 131 Egg production of pheasant hens i s impaired a t these latter: Hg levels as well. Al!;o phenyl- mercury and methylmercury ciin adversely effect hatchability; consumption of over 4 mg decreases hatchab,ility, while 16 mg methylmercury resul ts in ces- sation of egg p r o d u ~ t i o n . ~ ~ " Stoewsand e t al.13' found t h a t feeclino Japanese
..
.. .
-
."
".
- C."
..
quail 1-3 ppm HgC12 results in production of eggs w i t h thinned shells. Parkhurst and Thaxton13' discovered that young chickens, fed more than 250 ppm HgC12, show suppressed imnological responsiveness, decreased nutrition- al uptake, high r a t e of mortali ty, and increase in heart and adrenal gland weight and a decrease in liver, spleen and bursa weight. Stoewsand e t al .I3 ' report that egg shell thickness of quail diminished as the concentration of HgCl i n the diet increases from 1 t o 8.0 ppm Hg. Evans, Laties and W e i ~ s ' ~ ~ found that visual impairment is manifested in monkeys a f t e r sub- acute and chronic exposure t o methylmercury resulted in blood Hg concentration of 1-5 ppm. Toxic oral doses of mercury compounds t o laboratory animals range from an LOSO of 18 ppm for HgO t o an LOso of 388 fo r HgN03.
Mercury vapors can be toxic to mamnals especially i n poorly ventilated areas. Symptoms include coughing, dyspena, nasal discharge, hemorrhage and loss of appetite. Pathological change includes nephrosis, deaeneration i n l i ve r and lungs, hypocardia and skin damage. Behavioral patterns can also be affected. a , ~
Valkovic reports that metall ic and ionic Hg generally has a lower t o x i - c i t y than organic Hg compounds. Organic Hg i s accumulated in the body and attacks the nervous system. This form can penetrate the blood barr ier easi ly whereas inorganic Hg is excreted. 134 When symptoms of poisoning by Hg com-
8
Mercury has adverse effects on mamalian reproduction as i t i s transmit- ted transplacentally t o developing fetuses. Pregnant females fed organic Hg may exhibit reduced l i t t e r s i z e and/or weight, morphological lesions and damage t o the fetus 's central nervous system. Inhalation of Hg may produce the same symptoms a f t e r a short exposure period. 137
Huckabee and B l a y l ~ c k ' ~ ~ n o t e - t h a t a s much as 50% Of Hg emitted from coal combustion may f ind i t s way to aquat ic systems where 99% accumulates i n sediments. With regard t o the toxicity o f inorganic Hg as the mercuric ion. short term studies have indicated that concentrations of about 1 ppm are f a t a l t o f ish. For long term exposures of 10 days or more, Ha levels as low
F5-CI

is 0.010-0.020 ppm have been shown t o be fatal . 0 'I tr i1l8 report: that 0.010 and 0.020 ppn of mercury are fatal t o Phczinies i n 80-92 da,ys and 19- 32 days, respectively. Lesperance13' reports a toxic concentratim for Ha i ~ s low as 0.001 ppm.
0'Itri1l8 also reports that the lowest concentration of HgC12 tha t i s ,fatal t o brook trout within 24 hours i s 12.5 ppm. He notes that 10 ppm of IHgC12 k i l l rainbow t r o u t i n 15 minutes. The minimum lethal threshold for l i t t e r l i n g i s 0.04 ppm, 0.05 ppm for gudgeon, 0.3 ppm for carp, 0.02 ppm f o r lninnows and 0.03-0.15 ppm for Daphnia. 14*118 Steelhead t rout fry and 3 inch 3lueback salmon are able t o survive i n 10 ppm of pyridye mercuric acetate for one hour w i t h no toxic effect. Bioassay tes t s (120 hours) conducted on minnows (Nebropis sp) show that minimum lethal concentrations o f pyridyl nercuric acetate, pyridyl mercuric chloride, phenyl mercuric acetate, and ethyl mercuric phosphate arc! 0.15, 0.040, 0.20, and 0.8 ppm respe,ctively. Ethyl mercuric pho'sphate concentrations of 0.125 ppm are toxic t c rainbow trout in one hour. 118
McIntyrel4 reports that concentrations of methyl mercuric c!lloride !greater than or equal t o 1 ppn reduce sperm viab i l i ty i n rainbow trout. IHinton, Kendall and Koenig14' note t h a t 15 ppm Hg a l t e r g i l l stru1:ture in (channel catfish and 0.67 ppm a l t e r g i l l ce l l s of channel catfish. Birge e t 8i1.39 found that methyl or inorganic Hg a t a concentration of 0.01 ppm Jroduces 100% mortal 'ity i n rainbow trout anbryos (Hat Creek waters averaqed less than 0.0001 ppm Hg).
The acute toxic action of mercuric ions on fish results from damage to the g i l l tissues and the formation of a film of coagulated mcus t h a t f i l l s the interlameller spaces and prevents the noma1 movement of the g i l l f i l a - ments. Therefore, the necessary contact between the gi l l t i ssues and the water is interrupted and the gaseous exchange i s impeded t o such an extent that f ish die from asphyxiation. Mercuric ion also inhibits the active up- take of sodium i n t o the g i l l s of g o l d f i s h and thereby causes an increased Na loss from the fish. Since freshwater fish are hypertonic, they must continual- ly dispose of the water they absorb osmotically and replace the salts that are lost by diffusion as well as excretion. Accordingly, toxic effects
F5-62

could r e su l t i n f i sh due t o impaired osmoregulation and excretion. Chronic sublethal effects t o f i sh from Hg poisoning include tumorigenesis, I
reduced swimming function, enzyme inhibit ion and reduced na ta l i ty . Fish from the highly polluted Fox River I l l i no i s System (Hg, Pb , A s , tolulene, e tc . ) a re found t o exhibit a greater frequency of tumors than f i s h i n unpolluted water.21 Lindahl and Sch~anbon l~~ r epor t t ha t dec rease in resistence t o tumors i s found t o be linearly correlated t o the amount of Hg per u n i t net weight of muscle in fish. McIntyreld0 notes tha t sexual development of f i sh was arrested a t levels as low as 0.00025 ppm Hg.
118
Lr
I
In summary, the e f f ec t of Hg on plant and animals, especially aquatic organisms have been well documented i n the l i t e r a tu re . Hg i s a non-essential element to plants and animals and certain chemical forms can be very toxic. Concentrations of Hg in Hat Creek receptors appear t o be of the same magnitude as levels reported i n studies referenced above.
(n) Nickel ( N i )
Average concentrations of nickel ( N i ) i n sampled Hat Creek receptors collected d u r i n g October 1976 are provided i n Table F5-22. For aquatic samples, averages ranged from 0.0070 ppm (water, Site 4) t o 156.33 ppm (stream sediment, Si te 3) . Values i n f i sh ranged from about 1 t o 4 ppm. Nickel concentrations in the Bonaparte River (S i tes 3 and 4) were higher than levels measured in Hat Creek (Si tes 1 and 2). In t e r r e s t r i a l samples, Ni concentrations ranged from 1.35 ppm (grass , Si te 3) t o 60 ppm ( s o i l , Si tes 2 and 3) . Although data var iabi l i ty was h i g h , soil contained the highest Ni levels for terrestr ia l mater ia ls sampled in October 1976.
Naturally occurring concentrations of N i in a variety of ecosystem com- ponents, as determined from the l i t e r a tu re , a r e shown below.
1. water - 0.01 ppm 4
- 0.0048 ppm, tap water supplied i n U.S. - 0.01-5.77 ppm, surface water in Ontario - 0.05 ppm, tap water in Ontario143
143 143
F5-63

I !
I
I4UQtlO ** l a t o r 0 . W 3 O . M O 6 0.0163 0.0145 0.000 0.Wl.j 0.0070 o.oOc0
Y t r a s r s e d m n t 32.00 11.19 29.33 5.70 156.33 15.17 110.3> 36.70
?IS11 * e * 4.w 2.w 0.93 0.03 3.61 1.20
"arrcntl'inl
s o u 42.33 7.31 60.a) 30.45 6o.w 30.45 36.33 13.78 29.00 6.13 45.59 0.51
SW"h 2.67 0.33 9.33 5.33 10.67 5.04 5.33 0.W 12.61 4 .06 U.1) > .I3 craao 3.W 0.50 9.00 1.53 1.35 0.65 < 2.13 > 2.15 1 .M 1.w < 4.02 > 0.oG
LlEllC9" 3.33 0.80 4.61 1.20 6.03 2.00 6.61 1.33 6.3> 1 .61 5.10 0.65
Small -1 3.67 1 .&a3 3.00 0.50 < 1.00 > 1.W 9.00 1.00 4.39 1.20 < 4.m z 1.36

2. s o i l s - 5-500 ppm - 16-5,000 ppm
4 6,143 - - 9.8-26 ppm, Wyoming 5
3. vegetation - 0.05-5 ppm 143
- 3 ppm6 - 4-134 ppm, grasses and oats - 250-6,000 ppm, p1,ants on serpent ine soi ls - 0.15-0.35 ppm, t u b e r s , f r r i t s and g r a i n - 0.96-35 ppm, Wyoming
4
143 143
7 5
4. animals - 0.8 ppm - 0.03-0.10 ppm, cow’s m i l k - 0.02-4.5 ppm 144
- 0.07-0.39 ppm, deer mice, Wyoming
7
5
Other~than-for-the.possibl~_e~e_x_c_qe~.o~~f_Ni;,~e~el szi.n_.smal l..mam!als .Joncep- t rat i~ns--of-~idn~Slat- ,Creek.;recepto~s..a~e~:c-o.~s- ist~ntwith. the range.-of values reported,in. . the.-l i terature.
-. .
Nickel i s not essential t o plants. Nickel enters the plant primarily t h r o u g h the root system and is translocated i n the xylem and deposited i n the 1 eaves. 6,.145
Generally, N i concentrations above 50 ppm i n plants are toxic, although plants endemic t o serpentine soils my contain up t o 6,100 ppm143 (Sampled Hat Creek vegetation generally contained less than 13 ppm o f Ni). Actual concentrations of Ni which reduce yields are: 60 ppm in oat grain (500 ppm i n s o i l ) , 28 ppm i n oat straw and 44 pprn i n a l f a l f a . Nickel is r e l a t ive ly toxic t o many crops: 8 ppm of Ni i n culture solution kil ls barley quickly; 0.5 ppm and 2 ppm produces chlorosis in buckwheat and ben, respectively. 6
Excess N i generally produces a chlorosis that is usually described as resembling the symptoms of iron deficiency. W i t h cereals , the chlorosis is the fonn of white or of yellow and green s t i p p l i n g ; i n the case of the dico- tyledon, i t is mottling. In cases where toxici ty is severe , the chlorosis i s followed by necrosis and death of the plant. In general, symptoms of Ni excess are like those of iron deficiency in so many plants that symptoms
6
F5-C5

alone are of l i t t l e use i n determining toxicity. Leaf chemical analysis provides the only sure means of detecting excessive Ni i n soils. Nevertheless, accumulator plants that can provide an indication of plant exposure to h i g h N i levels include birch tree:; and conifers. 6
Nickel may be essential to animals. I t activates several eni:yme sys- tems although these act ivi t ies are not specif ic to Ni. I t i s always present i n RNA and may help maintain the configuration o f the protein molecule. Nickel may also play a part .in melanin pigmentation and is also esisential to hepatic metabolism i n chicks., 7,143
Nickel enters animals v':a ingestion and inhalation. Ingestet Ni is P3orlY absorbed and excreted mostly i n the feces. I t may accuyla.te i n the 1 JngS. 146
Nickel i s relatively nontoxic t o animals. Dogs and cats can to le ra te daily doses of 4-12 ppm 0f.N.i f o r 200 days w i t h no i l l effects. Nickel carbonate, nickel soaps,and nickel catalyst administered i n the diet of young r a t s a t 250, 500, and ::.G€lO ppm fo r 8 weeks do not have any significant e f fec t on their growth rate. Mfce c a n to le ra te 5 ppm nickel aceta.te i n their d r i n k i n g water over their l i fe t ime although mice fed 1,600 ppm nickel acetate show a reduction in growth and lowered food consumption. Young chicks fed on diets containing Ni (as either sulfate or the acetate) show significantly decreased growth r a t e s a t 700 ppm N i and above. 7
Mamals appear t o have a mechanism to prevent accumulation o f Ni from intestinal absorption and, thus. reduce toxicity. Gough and Shacklette report that Ni sa l t s i r r i t a t e t he mucosal l i n i n g of the g u t more t.han they cause inherent poisoning. Acute toxicity o f nickel carbonyl'may derive i n part fran inhibition of ATP uti l ization. Also, nickel carbonyl may produce a metabolic block a t the level of messenger RNA.143
10
Major symptoms o f acute Ni toxicity consist of hyperglycemia and gastro- intest inal and central nervous system disorders. Kidney abnormalities have developed i n calves fed NiCOCI. Nickel chloride fed t o young male rabbits decreases liver glycogen, inc:reases muscle glycogen and produces prolonged
. -.
"
F5-GG

hypoglycemia a f t e r a galactose dose. Nitrogen retention i s reduced in chicken feed containing more than 500 ppm Ni as the sulfate or acetate. Nickel dust, nickel sub-sulfide (Ni3S2), N i O , nickel carbonyl and nickel bicyclopentadiene are carcinogenic in experimental animals after inhalation although there is no evidence o f carcinogenicity after oral exposure. 143
In summary, Ni i s a non-essential element t o vegetation b u t is essential t o certain physiological functions in animals. I t i s less toxic to animals than to vegetation. Nickel levels i n Hat Creek receptors are well below previously reported toxic concentrations.
( 0 ) Selenium (Se)
Average concentrations of selenium (Se) i n selected Hat Creek receptors collected during October 1976 (water samples from January 1977) are shown i n
Table F5-23. Averages ranged from 0.002 ppm (water, Site 2 ) t o 2.83 ppm (stream sediment, S i t e 1) for aquatic samples and from 0.030 ppm (shrub, S i t e 2) t o 6.67 ppm (grass , Si te 5 ) for terrestrial materials. Concentrations were highest i n stream sediment for aquatic materials and grass and soi l for t e r r e s t r i a l samples.
Concentrations of Se i n selected ecosystem components, as derived from the l i terature, are discussed below.
1.
2.
3.
water - - -
s o i l s - - - -
lake sediment -
0.0002 ppm4 0.00011-0.00035 ppm, seven U.S. r ivers 0.00032 ppm, polluted river
27 27
0 . 2 ppn6 0.1-6 ppm, Saskatchewan and Manitoba 0.01 ppm 0.1-0.8 ppm, Wyoming
0.5 ppm, Lake Michigan
6 9
5
147

I .
I9UQtlC *. !later 9.. < .0.0021 > O.ooO3 <, 0.0020 > 0.- , < 0.0323 > 0.0033 C 0.W23 > O.ooo7
Streom sedl .ent 2.03 1.30 < 1.13 > 0.41 1.61 0.67 2.53
Y l S b t
1 .30 < 0.10 > 0.15 U.61 > 0.11 < 0.79 > 0.21
TOrrC3trlnl
so11 2.97 z 2.02 2 . m 1 .w 2.33 0.88 < 1.21 > 0.71 2.33 0 . 3 3 C 2.10 > 0 . 4 4
areas C 2.23 > 1 . 3 0 2.30 > 0.10 < 3.33 > 1.33 c 0.93 > 0.54 < 6.67 > 2.33 < 3.09 > 0.74
Llollen < 1 . 4 0.41 < 1.41 > , 0 . 5 3 < 1.11 Z 0.43 < 0.61 > 0 . 4 < 1 . 1 0 > 0.45 C 1.W z 0.17
Sanll m-1 0.57 0.03 < 0.61 > 0.16 < 0.81 > 0.03 < 0.17 > 0.19 < 0.m > 0.12 c 0.69 > 0.06
Shrub < 0.40 0.15 0.30 > 0.00 .: 0.43 Z 0.19 0.40 0.06 c 0.43 > 0 .05 < 0.19 > 0.01
! ' I

4. vegetztion - 0.2 ppm 4
- 3-4 ppm, Alberta, Saskatchewan and Manitoba 6 - 0.05-0.24 ppm, algae 27 - 0.02-0.26 ppm, forages i n U.S. 27 - 0.13-0.70 ppm, Wyoming 5
5. animals - 1.7 ppm - 0.1-0.35 ppm, animal blood - 0.08-0.22 ppm, deer mice, Wyoming - 0.049-0.067 ppm, cow milk i n Oregon
4 8
5 7
Selenium:.in water::and"stream ~sedimFnfF~.froin Hat'CF<eK 2nd the- Bo-naparte River are.:slightly-highhr ' than .values- ceported.~in-the-I.jteratut-e. Concentrations o f Se i n other receptors are consistent w i t h Se levels reported for s imi la r ecosystem components.
! Selenium is non-essential to plants i n general b u t i s e s sen t i a l t o a
! stimulate plant growth. The absorption and accumulation of Se by plants
! few.angiosperms. 4'10 Chapman 6 reports tha t a t low concentrations, Se may
depends upon the concentration and d i s t r ibu t ion of Se i n the soil , the chemical nature o f Se seasonal variation i n r a i n f a l l , plant species, s tage of growth (young plants accumulate more Se per u n i t o f dry matter than old ones), physiological condition of the plant and presence of other soi l com- ponents such as col loids (soi l col loids f i x Se and reduce toxic i ty o f Se i n so i l ) , ava i lab le su l fur , p ro te ins and amino acids. Variation in the Se
! '
,
! content of plants seem t o exceed tha t of nearly every other trace element as I the quantity absorbed may vary from traces t o 15,000 ppm. Accordingly, a
general Se toxicity level cannot be given for plants .
Astragalus spp. and Conops- i s spp. thrive on s o i l s which contain high leve ls of Se. Valkovic' indicates that i t i s not uncomon fo r these plants t o accumulate 10,000 ppm of Se. LakinI4* s t a t e s t h a t certain species of AstragaZus u t i l i z e Se i n an amino acid peculiar to these species. Chapman 6
reports that corn grown in culture solutions containing 5 ppm of seleni te o r organic selenium accumulates 200 and 1,000 ppm Se, respectively.
Fi-69

Although no generalized threshold value of Se exists for various plants, toxic concentrations for chrysanthemum, sargho, tomato and wheat range from 101-1350 ppm in leaf fo l ia r t i s sues . In Ireland, Se toxicity symptoms occur t o plants growing on soils containing Se levels of 30-325 ppm, as compared t o less than 2 ppm in adjoin ' :ng healthy areas (Hat Creet so i l s averaged less than 3 ppm Se).
6
Excessive Se comnonly produces a snow-white border chlorosis of the leaves of cereal plants. Less severe injury is indicated by stunting of the plants. A progressive diminution of chlorosis is apparent i n successive leaves as wheat plants grow ':o maturity. A pinkish coloration i n se leni te injured roots accompanies snow-white chlorosis of wheat leaves. A garlic- l ike odor emanates from some of the more highly seleniferous forage plants i n range areas. As a diagnostic criterion, the odor is quite spec:ific. 6
Plants belonging to the Compositae, Cruclferae. and Papihonac:eae families, cr genuses AstragcrZus, C o ~ p n i s , Stunleya, XyZorrhiza, Aster, and X . t r i p k accumulate Se i n large amoun::s and apparently require i t for healthy g r ~ w t h . ~ ' ~ 7'hese plants are important in locating and mapping seleniferous areas, since they thrive only on so i l s whfch contain Se. The.Se content of an indicator Flant fran a seleniferous so.il also provides a quantitative index of the - capacity of these soils t o produce vegetation toxic t o herbivores.6 A lichen, P m e Z i a chtormhrcu, has been suggested as a monitor p l a r l t f o r Se emission from power plants. 149
Selenium i s an essentia'l element for animals. I t can replace! vitamin E end occurs in a few amino ac'ids and many proteins. Se i s necessary for en iml growth and fo r f e r t i 1 , i t y . I t i s required t o prevent white muscle ciisease i n lambs, calves and fowl and hepatosis dietetica i n pigs. Selenium plromotes growth, improves fe!-t i l i ty, and reduces postnatal losses i n sheep. A dietary intake of 0.1 ppm ,For sheep and ca t t l e i s su f f i c i en t t o prevent Se ceficiency. Elemental Se is poorly absorbed b u t inorganic salts of Se such 2s selenate, selenite, and salenium'knalogs of cystine and methior,ine are absorbed much better.' Kothny2' indicates t h a t Se i s required a t 0.040 ppm i n animal diets.

Selenium compounds are inhaled through the lungs in dust or fumes, ab- sorbed through the skin or ingested." Selenium is rapidly and efficiently absorbed with the duodenum being the main absorption site. Selenium is eli- minated at first rapidly and then slowly. It is excreted in feces and urine and expired; the amounts and proportions being dependent upon the level and form o f intake. 7 3
The tolerance level of animals to different levels o f Se is determined by the chemical forms in which it occurs.8 Selenium levels of 3-4 ppm in feed is not adverse to hens and eggs, although 5 ppm reduces hatchability. Chapman reports that Se poisoning may occur when an animal consumes feed containing 5-40 ppm o f Se for several days or weeks (0.6 ppm in feed is not toxic>to sheep in 15 month^).^ Kothny2' states that Se is toxic to most animals at a concentration of 4 ppm in feed. Rats and dogs are chronically poisoned after ingestion' of 5-10 ppm Se; at 20 ppm of Se in food, animals may refuse to eat and death occurs. Young pigs fed 10-15 ppm Se may develop selenosis in 2-3 weeks. Selenium concentrations of 8 ppm in sheep diets may result in food consumption and body weight reductions after 5-6 months o f treatment and 16 ppm can eventually result in death. The minimum toxic level for grazing livestock is 5 ppm.
6
7
Soil containing more than 0.5 ppm is potentially dangerous to livestock. These soils can produce herbage containing 4-5 ppm Se or more. (Sampled Hat Creek soils contained less than 3 ppm Se although sampled vegetation exhibited Se levels as high as 7 ppm). Depending on the nature o f the diet (i . e . , protein and sulfate content), 3-4 ppm Se may accumulate in tissue and eventually produce toxic ~ymptoms.~ Sauchell iI5O reports that as 1 ittle as 1 ppm Se in the soil permits the growth' of wheat but when the same grain (containing 8- 10 ppm Se) is fed t o rats it retards growth and kills them after a few weeks.
Chronic poisoning o f livestock could result from daily ingestion of cereals and grasses containing 5-20 ppm Se." (Se in Hat Creek grasses ranged from about 2-7 ppm). Underwood states that "a dietary intake of 0.1 7
ppm (in dry feeds) provides a satisfactory margin o f safety against any dietary variable or environmental stress likely to be encountered by grazing sheep and cattle".
F5-71
*
IC
.-
L

Lethal threshold for rainbow t rou t i s 3.1-10.4 ppm in water w i t h 30-36 ppm hardness and temperature of 9-1Z°C. The maximum acceptable toxicant concentration (MATC),'the level of no chronic effect, is 0.04-0.08 ppm over a 12 month exposure period in water hardness of 20 ppm4' (Hat Creek waters averaged less than 0.0023 ppm Se).
There are marked variations between and within animal species i n the i r response to Se a t what may be considered toxic levels.1° Chronic :;e poison- ing is characterized by dullness and lack of v i t a l i t y ; emaciation and rough- ness of coat; loss of hair from mane and t a i l of horses and body of pigs; sareness and sloughing of hoofs; s t i f fness and lameness due t o joint erosion in long bones; heart atrophy; cirrhosis o f the liver; and anemia. Acute Se poisoning is characterized by blindness, abdominal pain, salivation, g r a t i n g of the teeth,and a degree of paralysis. Respiration is impaired and t h i s i s
. . often the cause o f death. Death may also ensue from starvation and t h i r s t because the lameness and pain .fm hoofs are so severe as t o prevent the animal from moving about t o eat and drink. This appljes t o horses,, ca t t l e , ard pigs. Sheep show loss of appetite and weight loss only. In ruts and dcgs, food consumption i s deci-eased together w i t h anemia. and cirrhosis o f
the l iver . This occurs i n conjunction w i t h microcytic, hypochronic anemia. Chicks exhibit reduced food intake and growth ra te and hens show decreased esg production w i t h low hatchability, and often deformed embryos. Embryonal development i s impaired by Se in rats, pigs, sheep, cattle,and horses. 7
In sumnary, Se tends to iiccumulate i n plants and animals, although tcxici ty t o the former appear:; t o be uncmon. Animals appear t o he more susceptible t o Se poisoning, especially livestock feeding on vegeta.tion growing on seleniferous soils,. While Se levels i n Hat Creek receptors appear t o be comparable w i t h 'literature values, concentrations in soils and grasses a t ce r t a in s i t e s suggest's potential hazard t o herbivores. However, m a l l mamnals, the only herbivore sampled, exhibited Se levels well below those considered toxic.
F5-72

(p) Strontium (Sr)
Average concentrations (ppm) of strontium (Sr) in selected Hat Creek receptors collected during October 1976 are given in Table F5-24. Yeans ranged from 0.172 ppm (water, Site 3) to 653.33 ppm (stream sediment, Site 3) for aquatic samples and from 13.33 ppm (grass, Site 4) to 566.67 ppm (soil, Site 3) for terrestrial samples. Strontium concentrations were high- est in soil and shrubs for terrestrial materials sampled and in stream sedi- ment for aquatic samples.
Naturally occurring concentrations of Sr in a variety of ecosystem com- ponents, as derived from the literature, are shown below.
1.
2.
3.
4.
water - soils -
- vegetation -
- -
animals - - -
0.08 ppm
50-. ,000 ppm 480-740 ppm, Wyoming
26 ppm4 1-200 ppm 6-150 ppm, Wyoming
14 ppm4 0.01-0.5 ppm 0.73-2.2 ppm, deer mice, Wyoming
4
4 5
a 5
8 5
Except :forAsrnaW..marm”ls. and:.fish,-+hich..appear--to-have-:higher-than expected- levels nf.~Sr._concentra~ions-of-Sr”i~-in Hat;Cre~k11e2ep_t_o_~~.~e~_emarkably. dieferent-thani7ev~lsrfound~celsewhere-
Valkovic notes that Sr is non-essential to plant and animals, although 4
a Bowen states that Sr may be essential as a structural element in lower animals. Bowen also reports that Sr is scarcely toxic to vegetation unless calcium i s absent. Experimentally determined toxic doses for laboratory mice and rats range from 123-958 ppm. 13
4
Chronic Sr poisoning may be manifested as esophageal cancer in humans. 151
Strontium can also inhibit mineralization of newly formed bone tissue. Strontium poisoning causes morphological changes in the cardiovascular,
152
F5-72

** :later 0.292 0.004 0.322 0.021 0.112 0.001 0.204
stroe. sediment > 5w.m z 224.80 340.03 110.00 > 653.33 , 211.53 523.33
PlOl, 1.. 90.61 cam 22.00 4.93 28.61
Tew.?striol
3011 483.33 226.00 233.33 43.33 z 566.61 z 221.47 206.67
Shrn:, 26.33 1.76 101.67 29.20 B1.w 1.51 44.33 0113. 19.00 2.52 45.67 10 .0 19.00 5.00 13.33 i.lclm? 14.33 5.90 29.00 12.66 46.00 8.96 19.03
S;lSll Rvnal 50.67 24.67 34.67 6.36 42.17 21.0) 15.17
0.012
43.33
7 .Gq
0 .240
> 519.1'1 >
49.70
54.07 400.0') 115.11 z 370.00 >
11.04 273.33 63.33 106.53
1 .a6 2 1 . 3 5 n.25 2.1 .IT/
6.66 23.67 4 .'I1 26.n0
7.30 34 .>3 l(l.93 35. IO
0.071
'1n.n ?6.4U
69.65
26.37
I .I2
1 .?9
6.111
? -.
I I

hematopoietic and ner'jous systems, i n respiratory organs, l iver, kidneys, and i t a f f e c t s metabolism i n general. 153 Stront ium as the n i t r a t e or chloride has a pronounced i r r i t a t i n g e f f e c t on the skin and a mild i r r i t a t i n g e f f e c t on mucous membranes of the eye. As the hydroxide, Sr has a marked e f f e c t on the eye. 154
In summary, S r l eve ls i n environmental samples collected near Hat Creek a re n o t g rea t ly d i f fe ren t from values reported a t other locations in the l i t e r a tu re c i t ed above. Levels of this relatively non-toxic element were a l so below concentrat ions l ikely to be detrimental to ecosystem components.
(4) Thallium (TI)
Average concentrations o f thallium ( T l ) i n Hat Creek receptors col lected dur ing October 1976 (water samples from January 1977) are shown i n Table F5- 25. Averages ranged from 0.0010 ppm (water, Sites 1, 2 , and 3) t o 0.30 ppm (stream sediment, Sites 3 and 4 ) for aquatic samples and from 0.10 ppm (shrub, S i tes 2 and 5) t o 0.50 ppm ( s o i l , S i t e 2) f o r t e r r e s t r i a l samples. Soi l and stream sediment evidenced the highest concentrations of T1 i n sampled receptors for t e r res t r ia l and aquatic systems, respectively. Data v a r i a b i l i t y was low and l i t t l e d i f f e r e n c e i n T1 leve ls was apparent between s i t e s .
Concentrations of Tl as determined from the l i t e r a tu re for d i f f e r e n t eco- system components are shown below.
1. water - O.OOOOI ppm4
2. so i l - 0.1 ppm
3. vegetation - 2-100 ppm, ash of t rees and shrubs i n Rocky
4
Mountain region 10
- 1 ppm, spinach and rye 4
10
4. animals - 20.4 ppm
-Thallium--concentrations-in-)lat-Xreeklrsceptors :am ... of-:a -similar-ma?nitude as levels reported i n studies referenced above.
I i
L
F5-75

i i 1 I Y, m i
I
Anlmtlo " * uatcr f * * < b.oolo w 0 . m < o.mlo z 0.m00 c 0.0010 w 0.0000 < 0.0013 z 0.W)
:itreon Llodlmnt < 0.21 W 0.01) c 0.20 i. 0.00 < 0.30 W 0.06 < 0.30 5 0.10
Fleh i < 0.20 > 0.00 < 0.11 > 0.03 c 0.11 W 0.03
< 0.00lI > o.ooo1 < 0.n z 0.03
c 0.18 z 0.01
TBrrOStrlQ1
so11 < 0.30 w 0.00 c 0.50 z 0.25 c 0.20 w . 0.06 -z 0.2l w 0.03 c 0.n > 0.0) < 0.31 w 0.05
Shrwb < 0.13 > 0.03 < 0.10 > 0.00 < 0.11 W 0.01 < 0.11 > 0.03 < 0.10 > 0.00 < 0.13 > 0.02
Ol'BBB c 0.11 z 0.03 c 0.23 r 0.03 c 0.20 w 0.W c 0.11 z 0.0) < 0.20 > 0.00 c U.19 > 0.01
Llchsn < 0.20 z 0.00 c 0.23 z 0.03 c 0.20 w 0.00 < 0.20 z 0.00 c 0.20 > 0.06 < 0.21 r 0.01
S m 1 1 zwmd c 0.20 W 0.00 .z 0.17 > 0.0) < 0.20 w 0.00 < 0.20 w 0.m < 0.20 z 0.00 < 0.19 > 0.01
1 1 J

Thallium is non-essential for plant and animals.'' Thallium r ich soi l provides poor substrate for vegetation. Thallium concentrations in ash 'of I
herbaceous plants from a region in Yugoslavia noted fo r high levels of T1 i n so i l s ranged from 10 t o 17,000 ppm in a variety of species.10y155 McMurtrey and Robinson113 report that T1 compounds have been widely used for controll ing rodent and predators because o f the extremely tox ic effects of these compounds. They add t ha t when poisoned ba i t i s sca t te red on the s o i l , i t s e f f e c t s persist for several years.
I
I
Toxic concentrations of Tl t o a variety of animals range from 0.8 ppm t o 50 ppm per day when administered orally. Bowen reports that 750 ppmlday of Tl in the d i e t i s l e tha l t o rats.
4
Experiments of the toxic i ty of T1 t o f i sh and other aquatic organisms show that concentrations causing damage within 3 days are: 10-15 ppm f o r rainbow trout , 60 ppm for perch, 40-60 ppm for loach, 204 ppm for Daphnia, and 4 ppm for Gmrmrmzts. Z i t k o e t a l? es t imate an incipient lethal level a t a b o u t 0.03 ppm t o coho salmon in water w i t h a hardness of 14 ppm. Concentrations o f 0.015 ppm, however, appear t o be safe (Hat Creek waters averaged less than 0.0011 ppm T l ) .
In sumnary, T1 levels in Hat Creek receptors are not unusually different from values reported i n other studies and are below levels considered as being toxic to ecosystem components.
Average concentrations of t i n (Sn) for selected Hat Creek receptors sampled during October 1976 are shown in Table F5-26. Averages ranged from 0.0437 ppm (water, Site 3 ) t o 646.67 ppm (stream sediment, S i t e 3 ) . Stream sediments evidenced re la t ive ly h i g h concentrations at both S i t e 1 (Upper Hat Creek) and S i t e 3 (Upper Bonaparte River). Oata var iab i l i ty was h i g h for stream sediments a t a l l s i t e s . Average o f Sn i n t e r r e s t r i a l samples ranqed from 10.33 ppm (grass , S i te 1) t o 883.33 ppm (shrub, Site 2 ) . Shrubs, lichens and small mamals contained the highest concentration of Sn over a l l s i t e s . There appeared t o be no consistent trends among Sn w i t h i n receptors a t each s i te , although the h i g h data var iabi l i ty may have obscured any real trends.
F5-77

I
!
I I
I
I
!
I '
i
< 0.0723 > 0.0023
> 561.51 5 ?61.03
c 0.20 > 11.00
> 931.33 > 351.33
> 345.00 > 321.61
10.33 4.9u
> 1m.61 > 31?.27
16.00 21.59
.z 0.0731 > 0.0023
49.61 22.81
< 0.21 r 0.01
21.33 1 4 . 4 4
> en3.33 > 116.61
131.33 65.30
51.00 34.53
50.33 28.03
< 0.0431 S 0.0012 .z 0.0561 > 0.0031
> 616.61 > 191.95 111.67 09.34
3.61 1.61
23.3) 9.91 5.53 2.60 55.111 25.10 > 115.20 > 65.ti2
61 .33 33.22 > 39fl.6'1 Z 305.32 21i.Yj 22.34 z 112.13 r I l > . W
31.02 29.50 23.61 1 1 . 4 1 161.33 1119.10 11.54 32 .GI
> 351.00 , 323.35 301.61 193.91 239.00 131.IM > 2 6 5 . 9 > 91.56
> 305.13 > 310.13 > 312.00 > 329.05 117.00 146.19 > 200.13 > 19.15

Concentrations of t i n in selected xosystem receptors as deterwined from the l i terature are presented below:
1. water - 0.00004 ppm4
2. s o i l s - 2-200 ppm, strongly absorbed by humus 4
- 0.40-1.5 ppm, Wyoming 5
3. vegetation - 0.3 ppm, highe: i n l ichens 4
- 0.85-24 ppm, Wyoming 5
4. animals - 0.15 ppm 4
- 0.16 ppm, Wyoming 5 I
A.-large-anol~ly,.exists .between.~t . -Creek.~n~evels ;and, th~se~ .~ .o~te~-~n;th~ L
, l i terature. - A possible explanation for extremely h i g h l eve ls of Sn in biolo- gical samples ( i n f a c t , Sn concentrations i n receptors are the highest of a l l I
elements considered i n this study) i s sample contamination. However, a l l aspects of sample preparation and analysis were rechecked and no possible Sn sources were discovered. The fac t tha t Sn was h i g h i n a number of d i f f e ren t kinds of receptors which were collected by d i f fe ren t too ls and techniques seems t o preclude contamination d u r i n g sample collection as well . The a l t e rna t ive . explanation then is tha t Sn i s naturally h i g h i n Hat Creek receptors.
-
m
Little information concerning the toxic effects of Sn on bio t ic systems i s available i n the l i t e ra ture . Bowen reports that t i n is very toxic to plants and green algae and is moderately toxic to mammals (gaseous t i n hydride i s very toxic). Experimentally determined toxic oral doses for various laboratory animals range from 40-1200 ppm. Toxic e f fec ts of Sn on animals include general circulatory disturbance, extensive pulmonary hemorrhage and CNS edema. Rabbits given 20 ppm/day oral ly o f dibutyl t i n chloride " - experience a decrease i n peripheral rbc's. depressed weight gain and mild gastroenter i t is . Tin a l so a f fec ts the l iver , kidney and spleen. 158 Toxic concentrations of Sn also affect the nervous system15g and may cause growth retardation and decreased food uti l ization efficiency.
4 IL
-
I
160 - In s u m r y , Sn values in Hat Creek receptors were 10 t o 1000 times higher
than values reported elsewhere. The cause of these comparably h i g h levels is I
not known; however, any detrimental effects of these Sn levels were not apparent.
5 7 9 t

I
I
I
. ~ ~ ~ ~ . . ~ CqUllrlU *. water '0.0058 0.0018 0.0063 0.0021 0.0033 0.mol 0.0059
stroIIL1 .edl!mnt 56.33 <, 11.72 lV4.00 113.00 109.00 106.60 106.61
Ylsh *** 0.91 0.55 1.23 0.88 0.27
Tsrrestrlal
3011 305.61 124.14 217.61 100.04 316.61 107.45 194.00
S1W"Z 0.27 0.03 < 0.11 > 0.03 0.43 0.23 0.37
Grnno 0.k3 0.09 1.60 0.70 0.21 w 0.m 0.00
Ilcl,e" 2.33 0.33 6.00 2.00 1.61 1.20 3.00
9111111 rounal 0.33 0.03 0.21 0.07 C 0.23 W 0.03 0.20
0:0035
39 .w 0.03
0.0059 > 0.001)
I44 .oo 38.25
0.02 0.33
125.04 253.W I5B.W L.97.GU 51 . 05.5 0.12 0.27 0.WJ < 0.W > 0.05 0.60 0.67 0.24 < 0.75 > o.m 0.W 2.33 0 . 3 3 3 . 4 1 0.55
o.m < 0.20 > 0.00 < n.24 o m

I
Table F5-28
Average concentrat ion (plan) of Vanadium (V) i n receptor mater ia l co l lec ted dur ing January and Hay 1977
. January 1977 nay i977
~
All Si tes Receptors Si te 1 S i t e 2 S i t e 3 S i t e 4 S i t e 5 Hem Std Dev S i t e 1 S i t e 2 S i t e 3 S i t e 4 S i t e 5 Hean Stdoev
111 1 Si tes -
.*
Mater 0.0020 4.0010 0.0023 4.0020 '0.0018 >0.0002 0.007 0.009 0.006 dl .005
Stream sediment 51 62 71 63 61.75 8.22 52 61 73 74
f ish*** " " " " 0 . 3 0.4 " .. 0.35 0.07
'0.007 .O.WZ
65.00 18.5
n 7 T e r r e s t r i a l 2
Sol 1 45 63 81 113 122 84.80 32.61 40 45 107 65 39 59.20 28.7
Shrub " " 0.2 ' 0 . 3 '0.4 0.6 '0.4 4.38 .0.2
Grass'f " " " " " 0.9 '0.4 4.7 " 4 . 7 '0.68 a . 2
Lichen 1.5 3.9 3.5 ' 2.9 2.6 2.88 0.92 1.4 3.7 3 . 0 2.5 1.7 2.46 0.9
swllma.IM1 - - " 0 . 3 4 . 1 5 0.2 0 .3 <0 .3 4 . 2 5 .o. 7
" " "
" " "
Only water, stream sediment, soil and l i c h e n were co l l ec ted du r ing January 1977. *. ... There a r e o n l y f o u r r q u a t l c sunpling sites.
Flsh were n o t c o l l e c t e d a t S l t e s 3 and 4 (0onaparte River) dur ing Hay I977 due to h igh water leve ls .
t Due to Overgraz lnq and l i m i t e d o l a n t qrowth, a sui table qrass sample YOS n o t a v a i l a b l e i t S l t e 4 (Cornwall Hountajn) in by 1977,
F I I I 1 I I I I 1 i E i
Iwerage concentrations of vanadium ( V ) i n selected Hat Creek receptors sampled during October 1976 are given i n Table F5-27. Averages ranged from 0.003:1 ppm (water, Si te 3 ) t o 189.00 ppm (stream sediment, Site 3 ) for aquat ic samples and from 0.17 ppm (shrub, Site 2) t o 386.67 ppm ( s o i l . S i t e 1) f o r terre! ; t r ia l samples. Vanadium concentrations were qui te high in stream sedi- ment ,md soi l mater ia ls a t a l l s i tes , a l though the high var iabi l i ty i n these samples precludes adequate evaluation of trends or differences between s i t e s . Within-s i te var iabi l i ty i n other receptors appears acceptable.
Janadium leve ls i n receptors collected dur ing January and May 1977 a r e provijed i n Table F5-28. Soil a.nd stream sediment V concentrations decreased substmtial ly in January and Ma; 1977 samples. Other receptors sampled i n 1977 exhibited V levels s imilar to October 1976 concentrations.
Naturally occurring concentrations of V in selected ecosystem components as determined from the l i t e r a tu re , a r e shown below.
2 .
2.
3.
4.
water - so i l -
- -
vegetation - - -
animals - -
0..001 ppm 4
6 3-500 ppm 100 ppm, humus in a lka l i so i l s 16-59 ppm, Wyoming
0.27-4.2 ppm
1.6 ppm 0.18-8.9 ppm, Wyoming
0.15 ppm4 0.01-0.59 ppm
4 5
6 4
5
5
Vanac.ium,~.ev~els ...o bserved in;-)iat.Xreek receptors- are consiitent .with”those -* levels-repor-ted.in-ihe.~literatuw. *
Vanadium is generally non-m?ssential for higher plants and most h igher animtls, although i t i s reported t o be a beneficial trace element f u r some f u n g i , algae, bacteria, chicks and ra t s . 4g6y8’10 Chapman 6 reports ,that V play:. a role i n enzyme activation in nitrogen f ixation by so i l microorganisms
F542

and may replace molybdenum as an essential element required by some N2- fixing bacteria. In animals, the highest concentrations of V a r e seen in hair and bone. 4
There are no reports of either tox ic i ty or deficiency of V t o plants under field conditions.6 Gough and Shacklette" note that some food plants may accumulate h i g h levels of V without exhibiting toxicity symptoms as i s shown by the following data: snap bean, 600 ppm (maximum found in ash); cabbage, 50 ppm; tomato f r u i t s , 30 ppm; and asparagus, 30 ppm.
Scharrer and Schropp16' found V t o be toxic to germinating seeds, b u t was *even more toxic t o p l a n t s a t l a t e r growth stages. Chiu16' reports that 500 ppm of V i n culture solution is toxic both t o roots and tops of barley. Injury to barley may be produced when 1 mg o f V , as vanadium chlor ide, i s added t o solution and sand cultures. Chapman6 notes that 10 ppm of V added as calcium vanadate t o a sandy so i l resu l t s in decreased growth of orange seedl ings; a t 150 ppm of V a l l p lants died. In all cases seedling leaves had l e s s than 1 ppm V.
Chapman suggests that V tox ic i ty may be indicated by 2 ppm V ( d r y weight basis) i n the tops of pea or soybean plants. He concludes tha t con- centrations greater than 0.5 ppm i n nutrient solutions are toxic t o plants, and that additions of the element t o s o i l s has produced toxici ty t o a variety of crop p lan ts . Schroeder, Balassa and T i p t ~ n ' ~ ~ report tha t as soluble V the following solution concentrations are slightly toxic: 10-20 ppm for soy- beans, 26 ppm for beets, 40 ppm for barley, 20 ppm fo r wheat, and 22 ppm for oats.
6
Vanadium is a relatively non-toxic metal t o animals and man." Underwood 7
reports that chicks can to le ra te 20-35 ppm. Humans fed 4.5 mg V/day fo r 16 months suffer no apparent t 0 x i ~ i t y . I ~ ~ Experiments w i t h ammonium vanadyl t a r t a ra t e given ora l ly t o s ix subjects for six to ten week produces no toxic effects other than some cramps and diarrhea at the larger dose levels. 7
F5-83

Valkovic repor t s tha t 2:5 ppm sodium 'vanadate produces toxic symptoms i n 8
ra , ts , 30 ppm calcium vanadate depresses weight g a i n and 200 ppm r e su l t s in h i i g h mortality. Schroeder et. al.164 states that 160 ppm in the d i e t of rats ov'?r a period i s l e tha l due t o gas t ro in t e s t ina l i r r i t a t ion . Bowen4 reports t h 8 3 t 50 ppm V+5 (vanadate) per day dry weight d i e t i s t ox ic t o r e t s and 150 ppln i s l e t h a l . Underwood indicates that 25 ppm i s t ox ic t o rat!;, whereas 50 ppln causes diarrhea and increased mortality. He notes as well tha t g rea te r t h m 20 ppm V i n the diet resul ts in growth depression in chicks.. Toxic e f f ec t s o f V intake include diarrhea, enzyme system dysfunction, growth d e ~ r e s s i o n and i r r i t a t i o n t o the lungs when inhaled. '9'' I t i s general ly ac- c e ~ t e d t h a t a large fraction of particles approximately 0.5 mn or smaller in d i 'meter can be deposited in lungs. Since particles less than 0..5 m n , contain t h ' ? highest percentages of V , the element poses an inhalation thveat. The V in la lat ion threat increases w i t h decreasing aerosol size.
7
27,165
In sumnary. V is generally non-essential t o higher plants and animals. I t is moderately toxic to v.egetation, although no reports of e i t he r V toxi- c i t y or deficiency t o plants under f i e l d conditions have been reported. Vanadium is generally non-toxic to animals. Levels of V i n Hat Creek re- ceptors are similar t o l i terature der ived values .
..
( t ) Zinc ( Z n )
Average concentrations o f zinc ( Z n ) i n selected Hat Creek rsceptors sampled d u r i n g October 1976 {are shown i n Table F5-29. Average ZIT concentrations ranged from 0.0098 ppm (water, Site 3 ) t o 94.33 ppm ( f i s h , S i t e 2) for aquat ic szmples. Concentrations of :Zn i n f i sh and stream sediment over ,311 s i t e s wwe similar, although within-site va r i ab i l i t y was h i g h for bo th aquatic and tc : r res t r ia l receptors . Stream sediment showed higher concentrations of Zn i n tt 'e Bonaparte River (Sites 3 and 4) than i n Hat Creek (S i tes 1 a'qd 2 ) . For t w r e s t r i a l samples, average:; ranged from 14.00 ppm (grass , S i te 3 ) t o 383.33 p ~ m (shrub. S i t e 5 ) . O f t e rees t r ia l receptors , Zn levels were highest i n strubs although within-site variabil i ty was h i g h f o r a l l samples.
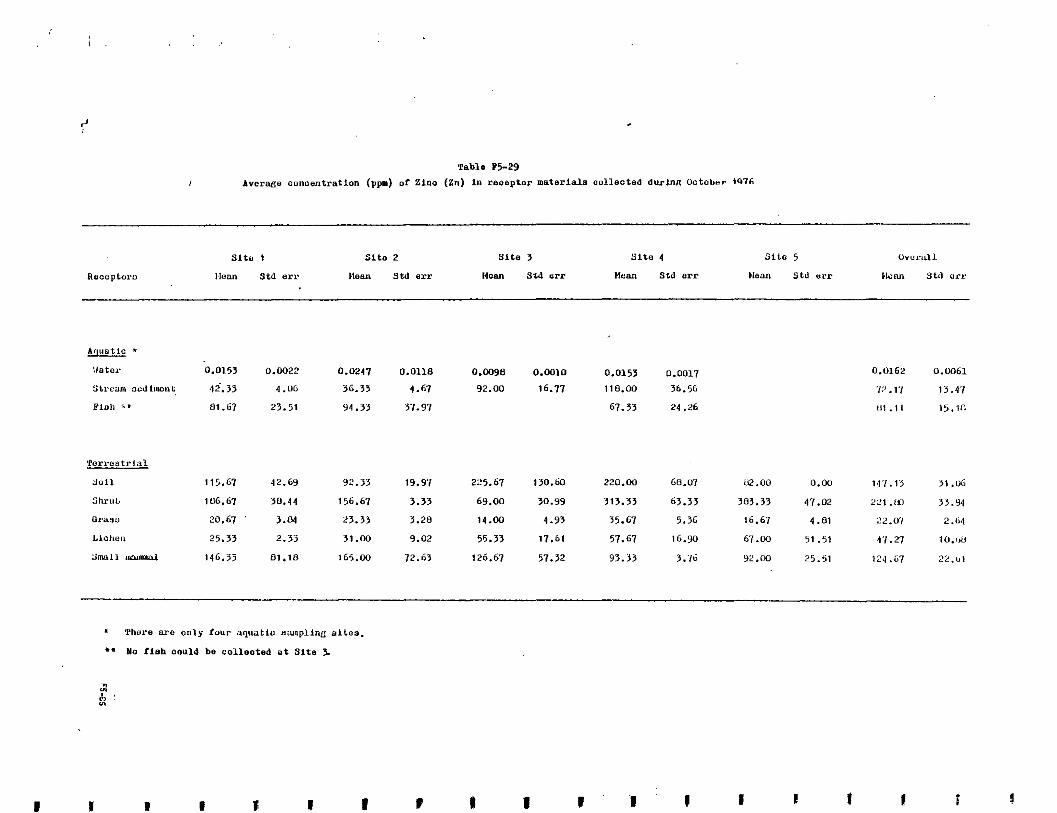
I
Table F5-29
Average conoentratlon (ppm) or U n o (2") In reosptor materiala aolleoted durJna Octobnr 1476
a. :later 0.0153 0.0022 0.0241 0.0118 0.0098 0.0010
S t P C a m "EdIII.,IL 4i.33 4 .V6 36.33 4.6'1 92.00 16.77 118.00 36.56 0.0153 0.0017
Plob i* 01.67 23.51 94.33 57.91 67.33 24.26
0.0162 0.0061
'I:! . VI 13.47
I11 . 1 1 15.1C
'rCrro3trtal
S V l l 115.67 42.69 92.13 19.91 225.67 130.60 220.00 68.07 u.00 0.00 1.11.13 31.06
SlU'Ub 106.67 30.44 156.67 3.33 69.00 30.99 313.33 63.33 383.33 47.m 221 .w 33.94
OI.h9D 20.67 ' 3 .W 2 3 . 3 3 3.28 14.00 4.93 35.67 5.36 16.67 4.81 22.07 2.64
LlCl iC, , 25.33 2.33 31.03 9.02 55.33 11.61 51.67 16.90 6 1 .w 21 .51 4.1. 27 10.1,u
3nwll llvulvlwl 146.33 81.18 165.00 12.63 126.67 57.32 93.33 3.16 9 2 .in3 25.51 12'1 .&7 22.111
I II I I E 1 1 1 f 1 1 I

Zinc concentrations in receptors collected during January and May 1977 a re given i n Table F5-30. Except for l ichens there were no large ‘changes in Zn leve ls a t C i t e s 2 (lower Hat Creek), 3 (Arrowstone Ridge) and 4 (Cornwall Mountain) from October 1976 t o January 1977. Zinc leve ls a t S i tes 1 (Pavi l - liori Mountain) and 5 (Ashcroft) were low dur ing January. Lichen col lected dur?ng May 1977 were s imilar t o the i r October 1976 Zn levels .
Naturally occurring concentrations i n d i f fe ren t ecosystem con,ponents, as detmnined from the l i terature are presented below:
1.
2.
3 .
4.
0.01 ppm 0-215 ppm, North American rivers166
10-300 ppm, surface soi l 50 ppm4; 44 ppm”; 40-84 ppm, Wyoming 5
100 ppm4 25-150 ppm 8,lO
28-74 ppm, pine needles 1-10, 200 ppm 20 ppm, many plants 6-88 ppm, Wyoming
160 ppm4 28-45 ppm, p i g 7
26-49 ppm, deer mice, Wyoming
4
6
a9 6
6 5
5
I
!

& I ., I .""_._a_. .-...*.. I . .
5011 155 119 IM 66 56 99.20 40.23 197 123 193 128 0.3 128.26 79.6
*rub " " " " " 61 160 82 135 105 109.20 38.9
Gr.Sl* - _ - _ " " " 34 25 43 " 32 33.50 7.1
L iChCl '0.5 3% 3.0 1uI <0.5 ,160.4 r223.21 25 35 10 75 37 12.10 19.1
IYI1"l " _ _ " " " 91 0.2 71 I15 99 81.84 53.0

Vegetation species that may provide a sensit ive indication of h i g h Zn levels in the soil may be found in the Caryophyllaceae, Compositae, Crucife- rae , Gramineae, Phymbaginaceae, Rutaceae and Violaceae families. Gough and Shacklettel ' report that a good indication of Zn mineral outcrops i s t he presence o f luxuriantly growing ragweed (hbros ia sp.; family Compositae) when other vegetation is stunted.
Gough and Shacklette'' note that 12.5% to ta l Zn i n the soi l wi l l s tunt most vegetation. Chapman reports that amounts greater than 400 ppm in dry matter may indicate a Zn excess, although the concentration varies w i t h species. Chapman6 adds that toxicity occurs a t 1700-7500 ppm of Zn i n leaves o f oats, while toxicity levels range from 526-1489 ppm and 200-300 ppm for tomatoes and oranges, respectively. For cowpeas and corn, toxic levels as reported by Chapman6, a r e 500 lbs/A and 700 lbs/A, respectively. They emphasize that the toxicity will vary w i t h the type of s o i l , b e i n g most toxic i n sandy s o i l and least toxic i n clay loamy so i l . In some New York peat soi ls i t is .
found that toxic concentrations o f Zn to vegetable crops such as carrots , spinach and l e t tuce ranged from 0.43 to 10.16%.6
6
Weaver and Brock16' found t h a t under laboratory conditions, plant growth is inhibited at concentrations of 0.5-50 ppn o f 2nCl2. Kusaka, Maekawa and
s t a t e t h a t the yield o f turnips growing under laboratory conditions i s decreased by 30% w i t h 200 ppm o f Zn i n s o i l . Excess Zn i n soil often pro- duces plant chlorosis by in te r fe r ing w i t h required i ron uptake.
Zinc has been implicated i n a reduction of the dehydrogenase activity and the microbial nitrogen mineralization process i n s o i l . 168 This i n turn may i n h i b i t the growth of some important de t r i t u s microorganism. 171 Zinc e f fec ts on so i l can have serious implications when considering that even a sl ight decrease i n s o i l Zn content can mediate nutrient cycling and tha t Zn contamination of soils appears t o be v i r tua l ly permanent. 172
I :
In regard t o animals, Zn is e s sen t i i l f o r growth, bone growth, wound healing, reproduction, carbohydrate metabolism and learninq behavior.' I t i s required for the production, activity and structure of many enzymes, and
.c
"

i.: i s involved i n RNA and protein s y n t h e s i ~ . ~ ~ ~ * ~ ~ Underwood reports t h a t riits need a t l e a s t 60 ppm Zn.lday, pigs 100 ppm/day, poultry 35 ppmlday and ruminants 18-33 ppmiday.
7
Animals are exposed t o :!n t h rough a i r , water and food.8 Zinc absorption occurs mainly i n the small in tes t ine and i s excreted in the feces. Zinc can a'iso be eliminated in sweat. Absorbed Zn i s slow t o be taken u p by bones or tile CNS, b u t once bound, i t I-emains so fo r long periods of time; Zn in hair i:; never recovered by the body. Zinc may combine w i t h plasma proteins and w . i t h the intracellular protelns of blood ce l l s t o form a plasma zinc pool. P''asma zinc is d is t r ibuted th roughou t the body's soft t issues and is eliminated. Accumulator organs include eye choroid, prostate, bone, kidney and feathers, a:; well as blood (especially red bood c e l l s ) , and snake venom. 4,7,26
Zinc i s r e l a t ive ly non-::oxic t o birds and mammals and a wide margin of silfety exists between normal intakes and those l ikely to produce deleterious e.'fects. Rats, pigs, poultry, sheep and catt le exhibit considerable tolerance to h i g h intakes of Z n , the extent of the tolerance depending upon the composi- t ' : on of the basal diet , particularly i t s content of minerals known t o a f fec t ZII absorption and u t i l i za t ion , such as Cu, Fe.and Cd.7 Gough and Shacklette 10
rc?por$ tha t rats w i t h dietary intakes of 2500 ppm Zn , weanling pigs with d.ietary intake of 1000 ppm Zrr , s t eers fed a d i e t of 500 ppm or less of Z n , and chickens fed 1200-1400 ppm of Zn evidence no i l l e f f e c t s .
. Underwood' reports that 5000 ppm zinc chloride fed t o rats depresses
growth and produces severe mortality i n young animals. Ingestion o f 5000- 10,000 ppm ZnC03 produces severe anemia in young rats i n a d d i t i o n t o subnonnal gvowth, anorexia,and death ai: 10,000 ppm. Female rats fed 4000 p11m Zn resorb fctuses. Zinc concentrations of 4000-8000 ppm cause h i g h mortali.ty i n weanli,nq p'gs. Levels of 3000 ppm cause growth and appetite depression i n chickens. For lambs, Underwood reportr; t h a t 1500 ppm zinc oxide causes dep'ressed feed cc~nsumption, 1000 ppm decreases feed efficiency and increased mintsral block cansumption, 900 ppm causes reduced weight gain and lowered feed cfficiency, and 1700 ppm induces depraved appetites as characterized by excesjive mineral arid s a l t block consumption and wood chewing.
7
F5-29

Janda173 found that the LDSO of zinc phosphate ( Z n 3 P 2 ) t o pheasants and partridges (determined under f ie ld condi t ions) i s 8-27 ppm. He reports also t h a t consumption o f small doses may cause severe disorders of the blood, nervous system, l i v e r and kidneys. Gasaway and Buss174 s t a t e t h a t under laboratory conditions 3000-12,000 ppm of ZnC03 i n food is toxic t o mallard ducks. Toxic effects include reduction i n pancreas and gonads r e l a t ive t o body weight and an increase i n the r a t i o of adrenals and kidneys t o body weight. Extreme anemia occurs after 45 days and death generally results a f t e r 60 days. =
Valkovic reports that the hazard t o lungs could be serious due t o the tendency of Zn t o concentrate i n lung t i s sue w i t h decreasing particle size. Inhalation could lead t o fever and depression. Lebetseder et al. 175 note t h a t another non-specific symptom associated w i t h Zn inhalat ion is a s ign i - ficant reduction i n dairy cow m i l k production o f about 0.64 l/animal/day.
8 - c
I
Valee176 reports that 4 ppm of Zn bound t o serum albumin produces las- situde, decreased tendon ref lexes , blood enterit is , diarrhea,and pausis of I
hind legs. Furthermore, he notes that 1 ppm Zn decreases the leucocyte count i n dogs which may decrease resistance t o disease.
- - Long term tox ic i ty t e s t s w i t h rainbow trout i n water.with hardness of 26
ppm indicate a maximum allowable tolerance concentration (MATC) between 0.36-0.71 ppm (eggs not exposed) and between 0.14-0.26 ppm (eggs exposed) (Hat Creek water averaged l e s s than 0.02 ppm Zn). In hard water, the MATC i s - s l igh t ly lowered. MATC for fathead minnows is between 0.03-0.18 ppm i n water w i t h hardness of 203 mg/l.
L
177 I
Davies and Goett14’ report that a lethal threshold (lowest concentration tha t k i l led f i sh) for rainbow t rout is between 0.24-7.21 ppm depending on water hardness, water temperature,and fish s ize . Sprague and R a n ~ s e y l ~ ~ found that the lethal threshold of mixing Cu and Zn as their su l fa tes i n water of - I hardness of 14 mg/l was 0.42 ppm t o salmon fry. Spraguel” reports that the lethal threshold for young Atlantic salmon i n soft water is 0.6 ppm. Grande experimented w i t h f r y i n the yolk sac stage of Atlantic salmon, brown t r o u t and rainbow t rout and found there was l i t t l e or no mortali ty d u r i n g exposure
.-
68 ‘I -
F.5-90 - m

m
I
I
f o r 21 days t o concentrations u p t o 0.5-1.0 ppm of Zn. Sprague, Elson a n d
Saclnders18' report t h a t many aquatic insect larvae, including Diptern sp., can to le ra te Zn concentratiom up t o 60 ppm.
In summary, zinc i s an essential element to most plants and animals. Zinc i s moderately toxic t o vegetation and r e l a t ive ly non-toxic t o birds and marlmals. For t h e most pa r t Z n concentrations i n sampled Hat Creek receptors wa!; similar t o values reported i n the l i t e ra ture .
(u) Zirconium (Zr)
Average concentrations o f Zirconium (Zr) i n Hat Creek receptors are shown i n Table F5-31. Averages ranged from 0.0017 ppm (water, Site 1) t o 15;'.00 ppm (stream sediment, Si te 3) for aquat ic mater ia ls and from 0.33 ppm (shrub, Sites 1. 2, 4; grass, Site 4) t o 385 ppm ( s o i l , Site 4) for ter- re:;trial samples. As w i t h most trace elements surveyed, Zr concentrations were highest i n stream sediment and soil samples. With respect t o stream sediment, Zr levels were higher i n the Bonaparte River (S i tes 3 and 4 ) than i n Hat Creek (S i tes 1 and 2).
"Naturally" occurring concentrations of Zr i n a variety of ecosystems, a s determined by the l i terature , are presented below.
1. water - 0.003-0.8 ppm
2. so i l - 50-1000 ppm
4
4
- 1200-3300 ppm, Wyoming 5
3. vegetation - 0.64-20 ppm 4
- 6.1-88 ppm, Wyoming 5
4. animals - 0.3-5 ppm 4
- 0.3-0.99 ppm, deer mice, Wyoming 5
,Zr .concentratjons~n.Slat-&-esk~-receptors .are within -the range.of,.values re- po*ted- in ' thc?l i terature~ -
F5-91

,nsuatto *. water .** c n.0020 > 0 . w 0 . m ~ o.mw 0.0021 0 .m3 0.0023 O.WO3
strasi. 3 B d h " t 86.31 37.09 71.33 16.33 151.00 62.07 121.00 31.37
Yhh I 0.67 0.18 c 0.60 > 0.21 c 0.47 > 0.09
*erl..Bltrlal
so11 103.67 21.53 16.00 22.40 155.33 107.34 > 305.03 > 300.40 60.61 11.04 > 156.13 > 63.35
stvull 0 . 3 3 0.07 0.33 0.09 ' 0.50 0.11 0.33 0.09 0.63 0.15 0.43 0.06
O r U m 0.63 0.09 0.87 0.13 0.80 0.12 0.33 0.09 1.50 0.16 0.#5 0.11
Liohon 2.33 0.61 26.61 22.61 3.67 0.88 >.61 0.67 1.67 ' 0.67 7.64 4.61
$Lull1 .-1 3.33 0.u1 2.67 0.31 2.33 0.33 C 5.33 > 2.40 1.33 0.33 .c 3.00 > 0.51

I-
r -
Zirconium i s only moderately toxic t o vegetation and i s poorly absorbed. 4
Zirconium i s of low toxici ty t o animals. 4y8 Toxic doses t o a variety of laboratory animals range from 98-3500 ppm for different chemical compounds of Zr I
13
F5.2 Transmission Media Analysis
Air is the primary medium of transport of trace elements i n fugi t ive dust and stack emissions and 's the focus of this report section. Soil and water, secondary transmission media f o r trace elements i n air that in tercept Hat Creek substr'ates and primary media for material storage and disposal pi 'e leachates were discussed in Section F5.1. Biota important i n the trans- port of certain trace elements via the food chain were also discussed i n the provious section.
Air samplers were n o t ins ta l led and operational until spring 1977. Re- s u ' t s of selected trace element analysis of to ta l suspended par t iculates (TSP) collected in h i g h vol simples during spring 1977 are presented in Table F5-32. Highest trace element concentrations in a i r were observed a t S i t e 1 (Cache Creek) and S i t e 3 (B.C. Hydro Hat Creek Office). Both of these s i tes arc? proximal t o moderate t o heavy vehicular t raff ic and associated hipher d u s t (TSP) levels. Copper and lead evidenced the highest levels i n samples from each s i t e .
Concentrations of selected trace elements in air as reported i n the l i t e ra ture a re l i s ted below.
As - <0.00001 ppm/m3 Cd - Not Repx-ted Cr - 0.00001 ppm/m3, nonurban areas cu - <O.OZ p,3/m34
4
53
Pb - 0.0005 - 0.2 pg/m 34 1 8 8
Hg - 0.03 - 50 pg/m
V - <0.001 pg /m3
Zn - ~ 0 . 0 7 pg/m
3118 4
,700
F5-93

3 ‘0.002 ro.OaZ**
3 ‘0 .001 r o . 0 0 1
3 ‘0.001 .O.M06
3 0.18 0.11
3 0.05 0.06
I ‘o.mI r0.0
3 0.034 0.001
3 ‘0.001 rO.0
1 ‘0.002 r0.001 2
3 ‘ 0 . m >o.o 2
3 ‘0.001 ro.0 2
3 0.06 0.03 2
3 ‘0.003 rO.0 2
3 ‘0.001 .o.o 2
3 .o.m . O . o M I 2
3 ‘0.001’ ro.0 2
<0.005
‘0.“
‘0.002
0.16
0.06
*O.MI
ro.005 2 <0.002
ro.0 2 ‘0.“
.O.OMl 2 ‘0.001
0.16 2 0.08
0.m 1 -0.003
.o.o 2 ‘0.001
0.0 2 ‘0.002
>o.o 2 ‘0.001
.0.001
.o.o r 0 . O
0.06
m . 0
,o.o >0.003
.o.o
1

Concentr~~~ons-cf~-eatrovi-~~~ements~nWar~'treek~~..bebw.;leue~s.;re- p o r t e d - i n r t h e ~ ~ - i t e r a t u r e : t h a t i s , Hat Creek a i r i s r e l a t i v e l y clean. Lack of large population centers a n d heavy industr ia l development a re perhaps the primary factors for the low levels of trace elements in sampled Hat Creek a i r .
Q
I
.I' .
F6.0 TRACE ELEMENT MOVEMENT AND ACCUNULATION
Trace elements naturally existing i n coal, overburden and waste rock will be released t o the environment during coal mining and power generating opera- t.ions. Based on t race element concentrations in various source materials in t.he Hat Creek area and d i f fe ren t biogeochemical characterist ics for various t.race elements, certain trac:e elements were selected for additional discussion i n t h i s report. This section discusses the major sources and processes that will release these trace elements t o the environment and the most probable paths t h a t these elements will take through loca l a i r , so i l and ,dater media. F. schematic chart is used to summarize the flow pathways. Processes such as element recycling, direct absorption of airborne trace elements by plant or animal t i s sue , and interchange between aquatic and t e r r e s t r i a l s,ystems are not explicit ly depicted in these! charts. These processes do occur, b u t are even less understood than t race element t ransfer from a i r t o soi l and water with subsequent accumulation of elements i n biological organisms. Also. indicated pathways represent only most. l ike ly environmental routes fo r eacl7 element based c n known source of media ( a i r , s o i l , water) character is t ics in the Hat Creek area. Numerically ranked flows do n o t indicate mass transmission rates of the element, b u t qua l i ta t ive ly ra te the most l ike ly pathways for element movement through the environment. Fcr example, the flow of As from gas stack t o a i r and from bottom sediments t o aquatic organisms are both described as major pathways. However, the mass transport of As e x i t i n g the stack t o the atmosphere wil l far exceed the mass transport o f As from bottom sediments t o aquat ic organisms. Therefore, the primary purpose of these charts is to provide a graphical sumnary Of t race element movement subsequent t o release t o the environment.
fy6.1 Trace Elements Of Concxrn
Using a process described in Section F5.0, nine trace elemelits were selected as being of most environmental concern. Trace elements selected include those that have beer; studied i n suf f ic ien t de ta i l t o define their Fotential environmental dist,ribution, toxicity, bioaccumulation potential a n d other ecological charact,eristics. A brief description of these elements follows:
FG-1

1. Arsenic - concentrated on f l y ash particles; estimated emission from gas stack is about 17 kg/day; concentration in leachates from coal, overburden, Waste rock, and ash materials range from about 1 t o 4 mg/kg; a rsen ic i s mobile in alkaline media; has a h i g h potential for bioaccumulation; i s r e l a t ive ly t ox ic . *.e
-
2. Cadmium - slightTy concentrated on f l y ash p a r t i c l e s ; i t has no known micro-nutrient value t o e i ther plants or animals; has a h i g h bioaccumulation potential; i s moderately toxic.
3 . Chromium - concentrated on f l y ash particles; estimated emis- sion from gas stack i s about 5 kg/day; concentration i n leachates from coal overburden, waste rock, and ash materials range from 0.1 t o 1.3 mg/kg; most forms o f element can be oxidized t o the toxic hexavalent state; moderate potential for bioaccumulation.
4. Copper - concentrated on f l y ash particles; estimated emission from gas stack is about 6 kg/day; concentration in leachates f r a coal, overburden, waste rock, and ash materials range from 0.2 t o about 6 mg/kg; copper has moderate potential for bioaccumul- a t ion; more toxic t o vegetation than to animals.
5., Fluorine - concentrated on f l y ash particles; estimated emission from gas stack i s about 280 kg/day; concentration in leachates from coal, overburden, waste rock, and ash materials range from 0 .4 t o 55 mg/kg; potential for bioaccumulation of airborne f luorides; gaseous. forms relat ively toxic .
‘6. Lead - concentrated on f l y ash particles; estimated emission from gas stack i s about 4 kg/day; potential for bioaccumulation o f
airborne lead compounds; re la t ively toxic .
. 7 . Mercury - major fract ion af mercury i n coal emitted from gas stack i n vapor phase; estimated stack emission i s about 7 kg/day; h i g h potential for bioaccumulation; relatively toxic.
t
IC
...
F6-2
a.
9.
Vanadium - estimated emission from gas stack i s about 16 kglday; concentrat ion i n leachates from ash range from about 1 t o 4 mg/kg:; mobi le i n a l k a l i n e media; p o t e n t i a l f o r bioaccumulation; moderately toxic.
Zinc - concentrated on f l y ash par t i c les ; es t imated emiss ion from gas s tack i s about 13 kg/day; concentrat ion i n leachates
from coal, overburden, waste rock, and ash mater ia ls range from about 10 t o 20 mg/kg; high potent ia l for b ioaccumulat ion;
moderately toxic.
F6.2 Pr inc ipa l Sources O f Trace Elements From The Coal Mine And ''ower P lan t
The p r i n c i p a l mechanisms t h a t may r e s u l t i n m o b i l i z a t i o n o f , t r a c e elements t c the environment are exposure of mine-associated materials (coal ore,
overburden and waste rock) t o sur face eros ional forces, emiss ion o f f ine p a r t i c u l a t e s and gases from the power p lant s tack, and leaching o f t race e le- ments from power p l a n t waste mater ia ls (pr imar i ly bot tom and f l y ash, and b o i l e r and cool ing tower blowdown) placed i n storage basins or pi ' ;es. Trace elements will also be t ranspor ted to the loca l env i ronment as cool ing tower d r i f t i s deposited on land and washed i n t o s t reams dur ing ra in fa l l .
Top s o i l , overburden and waste rock will be s to red i n s tockp i l es . The s i ze and na tu re o f t hese p i l es will c o n t i n u a l l y change as both mining and re -
clamation progress. Much o f t h e m a t e r i a l i n t h e s e p i l e s will be f r e s h l y exposed to var ious sur face s t resses o r uses (e.g. , surface erosioml forces an3 r e c l a m a t i o n e f f o r t s ) f o r t h e f i r s t time.
Trace element concentrations i n soils, overburden and waste rock often va-y due to loca l d i f fe rences in m inera logy and erosional h istory. Weather ing o f r o c k s n o t o n l y r e s u l t s i n ,Formation o f more s tab le minera l compounds, bu t
F&-3

8"
a lso converts trace elements into more mobile fort%. Surface and 'near surface deposits, which have long been exposed t o weathering, may have a much lower content of potentially mobile trace elements than deeper overburden and waste rock. Therefore, as once-buried overburden and waste rock are exposed t o weathering, certain trace elements may be mobilized into other sectors of the ecosystem. To estimate potential amounts of water-soluble trace elements i n
various source materials, leachate tests were performed on Hat Creek coa l , I
waste rock, and overburden as well as upon various source materials related t o power p l an t ac t iv i t i e s . The r e su l t s o f t hese t e s t s were discussed in Sec- I
t i o n F4.1 and sumarized in Table F4.1. Concentrations of A1 and Fe, elements commonly found in levels exceeding trace amounts in most s o i l s and rocks, are included in Table F4-1 for comparison t o concentrations of comon trace elements. Concentrations of As, C u , and Zn are relat 'ively h igh in Hat Creek coal, waste rock and overburden leachate compared t o concentrations o f such common elements .-
as A1 and Fe.
- .1
-
z
The mobility (exchangeability or ava i l ab i l i t y ) o f a par t icu lar t race -~
element i n . s o i l s i s o f t e n ' r e l a t e d t o s o i l a l k a l i n i t y and cation exchange capacity ( C E C ) . Most trace elements that can form basic oxides (Cd, Co, Cu, Ni, Zn, e tc . ) a r e much mare mobile in acid soil than i n basic soil. Other trace elements that can form acid oxides (As. No, Se-and V ) a r e f a i r l y mobile in alkaline soils. A few trace elements (Pb and Be) form extremely insoluble compounds (metal carbonates and hydroxides) and are very imobile IIIV
under most soil conditions. Soils w i t h high cation exchange capac i t ies , such as montmorillonite clays or peaty soil, also retain trace .elements. I
Therefore, trace elements in soils w i t h h i g h cation exchange. capaci t ies are re la t ive ly imobi le ; however, the elements are available for uptake by plants growing on these soi ls . Soi ls , overburden and waste rock from the Hat Creek coal mine are moderately or strongly alkaline w i t h pH values ranging from nearly neutral t o basic (Tables F6-1 and F4-1). So i l s a l so have moderate CEC's and organic content and can be characterized as loamy sand t o sandy loam (Table -F6-1). Soils at higher elevations i n the study area, such as Sites 1 . = and 4. have higher CEC's and organic contents than soils at lower elevations i n the Hat Creek valley. Therefore, many trace elements naturally occurring in stockpiles o f s o i l s , overburden or waste rock should remain re la t ive ly
. ~~
I
-
'I
"
-
-
I -
I -
c
- I
F6-4

Table F6-1
s o i l c h a r a c t e r i s t i c s i n H a t Creek study area (October 1976)
T e r r e s t r i a l CEC** Organic Locat ion * pH (meq/1009) Ma te r ia l (%) Texture
S i t e 1 6.7 45 23
S i t e 2 8.0 14 8
I . , 24 4
S i t e 4 6 .7 55 25
S i t e 5 7.3 17 3
c:+ - 2 . . I C s 4
7 1
Loamy sand
Loamy sand
i u m y sd~~ci io Sdllciy ioa ln
Sandy loam
Sandy loam
* See Figure F3-1 fo r loca t ion o f sampl ing s i tes . ** Cat ion exchange capaci ty

imnobile. However, certain elements such as As and V a r e f a i r l y mobile in a lka l ine so i l s and also appear t o exist in comparatively h i g h concentra- 3"
tions i n s o i l , coal or overburden found i n the Hat Creek region (Sections 4 and 5 ) . These elements could therefore be o f special environmental signi'fi- - cance in the Hat Creek area.
Similar factors control the solubili ty o f trace elements i n both so i l and water. Many trace elements form insoluble carbonates or hydroxides in basic water and prec ip i ta te o u t of solution. Many elements are complexed or adsorbed on f ine c lay par t ic les or on organic materials commonly found in streams. As w i t h soi ls , water and stream sediments (Table F6-2) i n the Hat m.
Creek area are basic. Therefore, those elements o f environmental concern in s o i l s should also be of concern in waters. L
.1
n*
In addition to stockpiles o f waste rock and overburden, other potential sources o f trace elements associated w i t h the mine include leaching of t race elements from the following: (1) exposed rock and coal seams i n the p i t ,
( 2 ) coal stockpiles a t the plant, and (3 ) crushed coal as i t is washed d u r i n g processing. Trace element concentrations i n leachate from coal and wash plant ta i l ings were l i s t e d i n Table F4-1. Fugi t ive coal d u s t from crushing, pulverizing and conveying operations may also be an additional source o f trace elements t o both aquatic and t e r r e s t r i a l environments. Most t race elements i n coal exist as insoluble organic complexes or inorganic compounds (e.g. , sulf ides o f As, Cd, Co, Cu, Pb, Hg, N i , Se, and Zn, and carbonates of Fe). However, insoluble carbonates can be solubilized as bicarbonates in the presence o f carbon dioxide, which is invariably contained in rainwater, and poorly soluble sulfides can be oxidized to water soluble sulfates if suf- ficient aeration occurs. Therefore, even t h o u g h trace elements in coal mostly e x i s t i n very insoluble and imob i l e forms, comcn surface weathering actions (oxidation and r a i n f a l l ) can change these immobile t race element forms into canpounds that are water soluble and available for uptake by biological com- ponents o f the environment. .. ..-
~I - ( b ) Power Plant
m*
The burning of processed coal i n the power plant will result i n emissions -
of fine Part iculates and gases from the stack and accumulations of large amounts I -

Table F6-2
stream sediment character is t ics in Hat Creek study area (October 1976)
Aquatic CEC* Location* pH (meqI100g) Material ( X ) Texture
Organic
S i t e 1 7 . 8 28 13 Sandy losm
S i t e 2 8 . 0 18 13 Sandy loam
S i t e 3 8.0 14 2 Sandy
S i t e 4 8.0 12 3 Sandy
* See Figure d3-1 for l o c a t i o n of sampling Sites.
Cation exchange capacity. **

i l
of waste ash in storaae basins. The particulates', gases and ashes will all contain a var ie ty of t race e lenents that can be transferred t o other components .-
of the environment.
Trace elements in coal are not partitioned equally among a l l combustion products. Certain ccmpounds that are suff ic ient ly volat i l ized during combus- t i o n exi t the s tack e i ther in the gaseous phase or recondensed o n the surface of f ine f ly ash par t icu la tes . Mercury is typically considered t o be the most vo la t i l e . t r ace element i n coal and 90% or more o f the original Hg content of the coal often exits the plant v i a the stack, primarily in the gas phase. Several potentially toxic trace elements are concentrated on small o u t l e t f l y ash par t ic les ( typical ly less than 10 microns in diameter) in comparison to prec ip i ta ted f ly ash or slag. Arsenic, Se, Cd, Cu, Pb, Mo, Se, T1 and Zn can concentrate on surfaces of small f l y ash par t ic les and e x i t the plant w i t h these small particles as they pass through particulate collection devices. Chromium, F, Ni and V appear t o be associated with precipitated f l y ash, b u t varying quantities o f these environmentally important elements exit the plant through the stack.
193,194
3.. 194
193
Results of test burns o f Hat Creek coal samples have previously been presented and discussed ( S e c t i o n F4.3). Elements most l ike ly t o be enriched i n f l y ash or gaseous emissions from the power plant are As. Cr, Cu , F, Pb. Hg, V and Zn.
These elements will ult imately be deposited t o the t e r res t r ia l or aquatic environment. Small par t ic les containing the e lements wil l e i ther set t le o u t d i r ec t ly o r be washed o u t of the atmosphere by r a in fa l l . Most of the gaseous Hg that leaves the stack will be adsorbed on atmospheric particulate matter. Amspher i c Hg, b o t h par t icu la te and gaseous, usually returns to the ear th i n r a in fa l l . However, near industrial sources of atmospheric Hg that are located in regions Of low annual r a i n f a l l , more Hg will be locally deposited by dry f a l lou t than by r a i n f a l l . l g 5
Even though concentrations of many elements are enriched in stack gas emissions, the re la t ive ly low f l y ash emission r a t e means t h a t the absolute
m.
F G Z

amount o f most elements that a r e r e t a i n e d i n c o l l e c t e d ashes will a r e a t l y exceed the amount ex i t ing f rom the s tack. The env i ronmenta l d is t r ibu t ion o f the t race e lement f ract icn that i s contained i n bottom and p r e c i p i t a t e d f l y ash can be c o n t r o l l e d t o a much grea ter ex ten t than the f rac , t ion tha t ex i ts the p lan t f rom the s tack . However, s a l t e x t r a c t i o n t e s t s on f ly and bottom ash ind i ca te t ha t re la t i ve l y h igh concen t ra t i ons o f As, V and Zn can be leached f rom these precipi tated ashes (Table F4-1). Ashes wi‘I1 be.placed i n s torage p i les, and proper design, construction and maintenance of these basins will prevent seepage o f t r a c e elements i n to su r face and groundwaters or wind-caused d i s p e r s i o n o f ash from the basins onto neighboring lands.
Various maintenance and c l e a n i n g a c t i v i t i e s i n t h e p l a n t may requ i re
l a rge amounts o f chemical products that contain toxic e lements. Corrosion and s z a l e i n h i b i t o r s used for c leaning operat ions o f ten conta in chronlates, and c ~ r r o s i o n p r o d u c t s o f t e n c o n t a i n s o l u b l e s a l t s o f Cu and Zn. These compounds
will leave the p lant in cool ing tower , condenser and b o i l e r blowclowns t h a t will be routed to waste basins. As w i t h ash basins, proper design, construc- t i o n and maintenance o f these e f f luent bas ins will prevent m igra t ion o f any t-ace elements t o ne ighbor in ’g ter rest r ia l or aquat ic env i ronments.
Drift from cool ing towers will conta in those s a l t s n a t u r a l l y e x i s t i n g i n makeup water, but .at conclwtrat ions h igher by a f a c t o r o f 14 due t o r e - c , i rcu la t ion . *4‘ The minera l content o f the Thompson River ( the potent ia l source 0” cool ing tower makeup wate!?) i s very low, usual ly 70 t o 100 mg/l t o t a l d.issolved s 0 1 i d s . l ~ ~ Cooling tower d r i f t w i l l ’ b e a secondary and more
l o c a l i z e d source o f t r a c e element contamination compared t o coal combustion, m,ine s p o i l p i l e s and waste storage basins. Trace element concentrations i n Thompson River water near Ashcroft and predicted t race element concentrat ions ill c o o l i n g t o w e r d r i f t were ‘ l i s ted i n Tab le F4-3.
Flj.3 Environmental Pathways And Ul t imate Fate Of Trace Elements
D i f f e ren t env i ronmen ta l d i s t r i bu t i ons and f a t e s will l i k e l y o c c u r f o r var ious e lements that are re leased by mining o r power p l a n t a c t i v i t i e s .
F6-9

Certain elements may remain imobilized in their original state with little or no change occurring in their natural form or distribution. Other'elements will be incorporated into collected power plant wastes and stored in waste basins where elemental migration can be controlled. Certain elements will be m r e widely distributed through the environment with increased potential for I
toxicity or bioaccumulation effects. Environmental pathways and fates for various elements are discussed below. -
L
.-
(a) Arsenic (As)
Due to its comparatively high concentration in Hat Creek overburden, coal and fly ash l.Tables F4-1 ana F4-12) as well as its rnobiljty in alkaline soils, As may have environmental 'significance in the Hat Creek area. Potential pathways of As in the Hat Creek area subsequent to project development are sunarized in Figure FS-1. This schematic flow diagram indicates that As will be distributed to a variety o f ecosystem components. Arsenic from mine spoils or from airborne particulates that fall out on the land may form soluble As compounds that can migrate into plants. especially if suitable complexing~ agents (e.g., low molecular weight organic acids) are present. However, the entry o f any mobile trace element into plants fs determined by interacting factors' that include accumulator properties of the particular plant species, electrolyte concentration in the soil solution and climatology o f the region. B0hn197 reported that many trace elements, including As, that are emitted from industrial sources tend to accumulate in soils with only small proportions being absorbed by plants. Various oxides of iron and manganese are nearly ubiquitous in soils and stream sediments,' and these oxides apparently act as sinks of many trace elements. In semi-arid regions where soil moisture is low, migration through soils and diffusion into plants of even soluble trace elements are limited.
Both soil and stream sediment microorganisms have enzymes capable of inter- converting oxidation states of trace elements. An aerobic microorganism can reduce and methylate inorganic As compounds to give dimethyarsine and trimethylarsine, both extremely toxic compounds. These volatile compounds .
I!
.- I
I

-
Terrestrial
F i shes
1
Rooted aquat ic p l a n t s a n d d e t r i - tus (bottom sed- iment! f eed ing organisms Zooplankton
I Major pathway or s i n k
3 Minor pathway or s i n k 4 Unknown s i g n i f i c a n c e
C.__..C"_ 2 Secondary pathway or s i n k ""L L'.G_s
u
u u m ad rl 4
Dispe r s ion ou t o f + 01 0 P
t h e b a s i n on " 2 s u p e r f i n e p a r t i - cles or a s gaseous compounds l i
4 Air "t
S o i l
A 1
Groundwater
Sink - adsorbed on hy- d rous meta l , , ' ox ides i n s o i l
1 Overburden , was te rock , ash bas in
emiss ions and o ther was te s torage bas in l e a c h a t e
Figure F6-1. P o t e n t i a l pathways of Arsenic ( A s ) movement through Hat Creek ecosystem components

c*
.-
are rapidly oxidized to less toxic substances, su'ch as methylated arsenic acids. Alkylarsenic compounds can be absorbed by aquatic organisms, so ...e
potential pathways do ex i s t fo r As t ransfer through the food chain. 199
In sumary, most of the t e r res t r ia l ly based As ( A s in mine or power plant spoil or waste piles and As from stack emissions that is deposited o n land) wil l l ikely be confined t o narrow zones around deposi t ion s i tes (e .g . , waste rock pi les or areas o f maximum land deposition of stack emitted arsenic). A portion o f this As may undergo any of the following: (1) oxidation t o vo la t i l e As compounds tha t will excape t o the atmosphere; ( 2 ) accumulation in roots of plants that grow i n deposi t ional s i tes ; and ( 3 ) leaching into surface waters or into near-surface groundwaters. Any As contained in airborne particulates that reach surface waters i n the Hat Creek areas will mostly be adsorbed by organic compounds or iron oxides i n bot tom sediments, which are basic and have moderate cation'exchange capacities (Table' FE-2 ) . Other studies have reported accumulations of As i n rooted aquatic plants and benthic organisms, both o f which u t i l i z e sediments for nutritional sources. 2oo P r i n - cipal mechanisms for potentiai transport of As o u t of the imnediate s i t e a r ea a re d i s t a n t ae r i a l dispersion o f superfine stack particles or gaseous compounds and methylation w i t h subsequent biotic uptake of As aquatic organisms.
(b) Cadmium (Cd)
Cadmium will be released to the environment chiefly by emission of f ine par t ic les from the stack. Figure F6-2 is a schematic flow diagram tha t sum- marizes the relative significance of Cd movement th rough Hat Creek ecosystem components a f t e r p ro j ec t development begins. Although th i s t r ace element i s never beneficial t o plants o r animals, 4'7'201 i t i s commonly accumulated in bio t ic components o f both t e r r e s t r i a l and aquatic systems. Cadmium ions are readily adsorbed by clay minerals, especially i n a lka l ine so i l s . Using radio- isotope techniques t o t race Cd through the environment, Van Hook e t a l . found that only mall percentages (less than 7%) of Cd f a l l o u t on land are in- corporated i n l iving vegetation, and t h a t vegetation growing on a lka l ine so i l s adsorb less Cd than vegetation growing on neutral or ac id i c so i l . Other elements
202
I
I
L
F6-12

z - KEY :
1 Major pathway or sink
2 Secondary pathway or sin1 : p a r pat>,i-w.ay or
4 Unknown significance
Figure F6-2. Potential pathways of Cadmium (Cd) movement through Hat Creek ecosystem components

appear t o affect the physiological abil i ty o f p l a n t s t o uptake Cd. For example, selenium significantly reduces the amounts o f Cd adsorbed by vegetation whereas Zn enhances Cd uptake."' High Pb concentrations in so i l may increase bo th the plant Cd concentration and total Cd uptake. '03 The an tagonis t ic e f fec t o f Se
and Zn on Cd uptake by p l an t s i s l i ke ly due t o complex physiochemical and biochemical interactions between the elements. Since Se, Zn and Pb will be deposited on so i l s as components o f particulates emitted from the gas stack, the combined influence of these three elements on Cd uptake by plants in the Hat Creek a rea i s not oredictable.
Since most of the Cd deposited on t e r r e s t r i a l systems remains in surface s o i l s , l i t t e r and de t r i t u s , Cd i s most avai lable t o animals whose food base i s l i t t e r or de t r i t u s . '02 Cadmium 'is rapidly accumulated by animals, b u t tissue levels reach steady states as body intake and excretion of Cd equi l i - brate. Values f o r Cd half- l ives i n animals range from 7 days f o r insects t o 100 days for birds and predacious arthropods. Therefore, animals have biological mechanisms for returning Cd t o , as well as removing i t from, the environment.
Van Hook e t a1 .202 found that only 4% of the Cd applied to an experimental ecosystem was transported t o the aquatic portion o f the system, and 75% o f t h i s Cd was contained i n sediments. All types of aquatic organisms (rooted and non- rooted plants, algae and f i sh ) a r e known to accumulate Cd. 2oo~202 However; since Cd is not methylated in aquatic systems,19g i t s accumulation in aquatic organisms and mobility through aquatic food chains are less than compounds such as Hg.
-
In the Hat Creek area, Cd contained i n overburden and waste rock piles should remain i m b i l i z e d through adsorption on inorganic mineral complexes. Only limited uptake by vegetation isOexpected. Principal animal uptake of Cd will be by invertebrates, such as worms and some insects, that feed upon soi l detri tus containing Cd deposited w i t h atmospheric fly ash fallout. Ceposition of s tack par t ic les on surface waters and surface runoff containing suspended sediment will be the main sources of Cd t o aquatic systems in the Hat Creek area. Most of this Cd will remain associated w i t h stream sediment i n the immediate
'e
IC
I t
R
It
..
FG-IC

a-ea where deposit ion occurred. Aquatic organisms i n t h i s a r e a will l i k e l y m i n t a i n steady state concentrat ions (some equi l ibr ium concentrat ion determined b,y uptake and e x c r e t i o n r a t e s ) o f Cd.
( c ) Chromium ( C r )
Chromium can e x i s t i n s e v e r a l d i f f e r e n t o x i d a t i o n s t a t e s i n n a t u r a l e n v i r o n -
mgnts and m o b i l i t y o f each o x i d a t i o n s t a t e i s d i f f e r e n t . F i g u r e F6-3 summarizes t l e r e l a t i v e l y w i d e d i s t r i b u t i o n t h a t may charac ter ize C r movemerit through Hat
Creek ecosystems f o l l o w i n g p r o j e c t s t a r t - u p . I n s o i l s , C r usual ly occurs as chromic oxide ( f3 ox ida t i on s ta te ) , an amphoteric oxide ( i .e., propert ies o f b l t h an a c i d i c and bas ic ox ide) tha t can form somewhat mobile compounds i n b3s ic so i l s . Ox ida t ion o f chromic ox ides resu l ts in hexava len t C:r s a l t s (rhromates) that can pene t ra te b io log i ca l membranes r e l a t i v e l y e a . s i l y . Chromium u ~ t a k e by p l a n t s comnonly occurs, especially i f s o i l s c o n t a i n r a t h e r h i g h Cr c lncent ra t ions . *04 However, no ev idence that C r i s necessary f o r p l a n t n u t r i - t i o n e x i s t s . Animals do r e q l i r e smal l amounts o f Cr f o r metabolism, so absorp- t i o n and e x c r e t i o n o f Cr by animals i s d o c ~ m e n t e d . ~ ~ Due t o t h e r a t h e r u b i q u i - t l u s d i s t r i b u t i o n o f Cr i n nature, pathways and s i n k s . f o r Cr released by the H 3 t Creek p r o j e c t a r e d i f f i c u l t t o p r e d i c t . B o t h m i n i n g and power p l a n t opera- t i o n s will l i k e l y be s i g n i f i c a n t sources o f C r t o t h e l o c a l environment. Any f r e s h l y exposed Cr minera ls in overburden and waste rock may be c x i d i z e d t o p lan t -ava i l ab le chromates. Leachate tes ts i nd i ca te t ha t t he wa te r so lub le f r a c t i o n o f C r m i n e r a l s i n o v e r b u r d e n i s 1.3 mg/kg (Table F4-1). Chromium csmpounds may be emitted frola the gas s t a c k a t r a t e s o f about 5 kg/day (Table F4-13). Once these compounds are deposited on land or water , they may become
a v a i l a b l e f o r b i o t i c uptake, especial ly i f ox ida t ion to hexava len t Cr occurs. As will occur wi th several other t race elements, a l a r g e p o r t i o n o f t h e Cr released by mining o r power p lant operat ions will l i k e l y be adsorbed on hydrous metal oxides i n s o i l and stream sediment. 198
F5-15
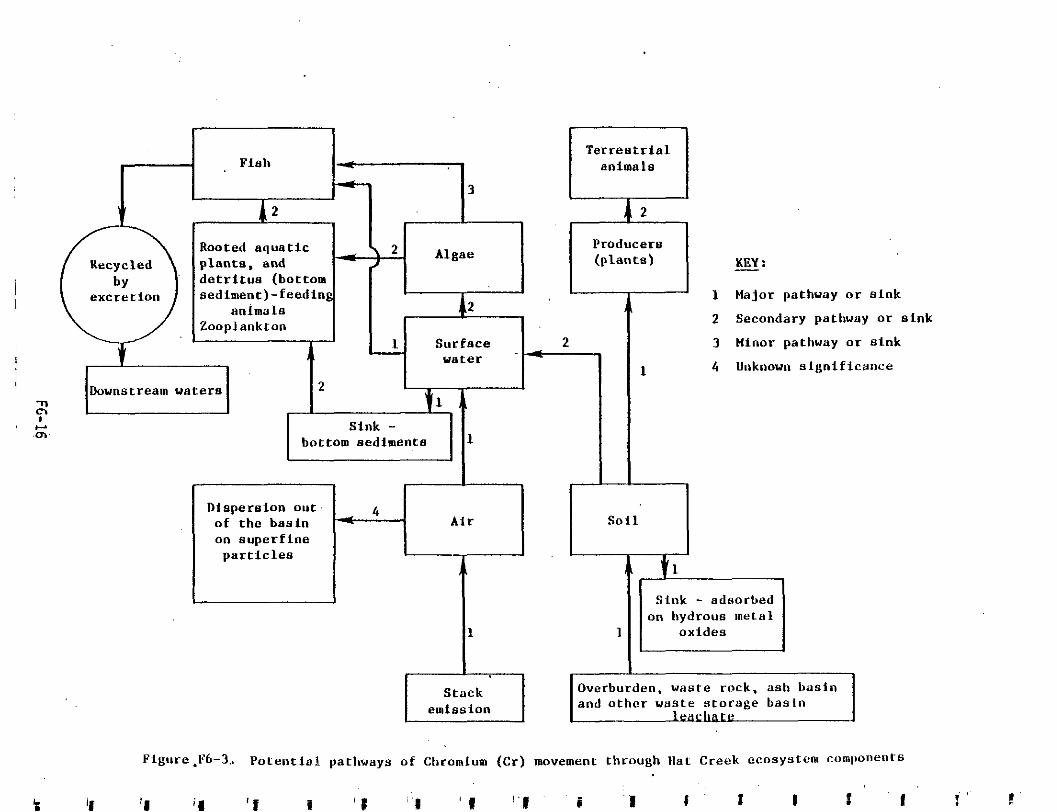
F i s h "
f- 3 I
Rooted aquat ic -3-p, sediment)-feeding
Algae
2
1 S u r f a c e ii -
wate r
n e,
c I
1 1
.m Sink -
bot tom sed iments 1 I ' I
I - r
D i s p e r s i o n o u t . 4 o f t h e b a s i n o n s u p e r f i n e
Air
p a r t i c l e s h i
I1
i , 2 1 Producers ( I p
I I
- KEY :
1 Major pathway or s i n k
2 Secondary pathway or s i n k
3 Minor pathway or s i n k
4 Unknown s i g n i f i c a n c e
S ink - adsorbed on hydrous metal
o x i d e s
Overburden. waste rock. ash basin a n d o t h e r w a s t e s t o r a g e b a s l n emis s ion

Varying concentrations ( 3 t o 6 mg/kg) of Cu can be leached from coal, overburden and waste rock from the Hat Creek valley (Table F4-1). Figure F6-4 summarizes the potential distribution of Cu among various Hat Creek ecosystem components subsequent t o project start-up. Test burns of coal samples indicate t h a t a b o u t G kglday of Cu may be emitted from the gas stacks a t the power plant (Table F4-13). However, Bohn reports t h a t Cu i s one of the most highly soil- adsorbed t race elements and is nearly unavailable t o plants. Soil holds Cu best a t pH value between 7 and 8 which is the general range of p H conditions of sampled Hat Creek soils (Table F5-1). In alkaline water, Cu ions rapidly precipi ta te as carbonates or hydroxides. However, Cu i s a funct,ional cons- t i t uen t o f most c e l l s , and Cu uptake mechanisms must therefore exis t for plants and animals. Copper concentrations in algae may be 1000 t o 5000 times as great as the concentrations occurring i n the surrounding water. ' 0 5 Various t i s sues , especial ly l iver , in f ish accumulate Cu d u r i n g long-term exposure (several heeks) t o various concentrat,ions of dissolved Cu. '06 In animals, cu i s mostly excreted and absorbed only h'ith diff icul ty across g u t walls. Any Cu t ha t i s absorbed by animals tends to accumulate in so f t t i s sue organs.
1 97
6
4
In sumnary, most of the Cu released by mining and power p lan t ac t iv i t ies in the Hat Creek area will be t ied up in local soils and stream ,sediments. 5ome Cu accumulation will likely occur in lower plants, such as 'lichens, that are d i rec t ly exposed t o f l y ash fallout. Aquatic algae apparently can accum- t ; late Cu even when surrounding concentrations in water are low, ;o.certain ? q u a t i c organisms may exhibit elevated concentrations o f Cu.
1 e) Fluorine (F)
Fluorine usually exists in concentrations of several parts per million (ppm) i n soils. plants and animals, and is, therefore, a:tually riot a "trace element". The l ikely dis t r ibut ion o f fluorine in the Hat Creek environs after project start-up is i l lustrated in Figure F6-5. ,Assuming i , n average F content in Hat Creek coal of 137 mg/kg (Table F4-9) and a c.oal firTng rate of 42,600 metric tons lday , about 6 metric tonslday of
FG-17

I F i s h I
n I m
. m c
T e r r e s t r i a l an ima l s
I , D i s p e r s i o n o u t o f t h e b a s h 4 Air o n s u p e r f l n c
p a r t i c l e s
-
I Producers ( p l a n t s ) I Producers ( p l a n t s )
- KEY: +- KEY: I 1 Major pathway or s i n k
I 2
2
Rooted aquat ic 2
p l a n t s a n d 4 '
d e t r i t u s ( b o t t o m Algae
~ sed lmen t l - f eed ing
Zooplankton 1 an ima l s 2 -
3 - 2 Secondary pathway or s i n k water
3 Minor pathway or s i n k
4 Unknown s i g n i f i c a n c e bot tom sed iments 3
I ,
1
I
- L
S t a c k emission
S o i l
S ink - adsorbed on hydrous metal
o x i d e s
Overburden, waste rock, ash b a s i n .
l e a c h a t e and o t h e r w a s t e s t o r a g e b a a i n
F igu re Fb-4. Potent ia l pa thways o f Copper (Cu) movement through I lat Creek ecosystem crmpownta
' i I ' E i f l i ' 1 I I : # 1 ' 1 5 -I i ' i f ~I ! I '

- KEY :
1 Major pathway or sink
2 Secrlnciarv pathway U K sink
3 Minor pAtllway or sink
4 Unknown s i g n i f i c a n c e 2
1
D l I
Overburden, waste rock, ash bas in and other waste s t o r a g e b a s i l ,
l e a c h a t e Stack
e m i s s i o n
Figure P6-5. Potent ia l pathways of Fluorine (F) movement through Hat Creek ecosystem components

F will enter the plant boilers. Test burns of Hat Creek coal (Section F4.3) indicate that about 230 kg/day of F will be m i t t e d from the stack. ?he chemical makeup (i .e. , percentages o f hydrofluoric acid, s i l icof luorides , and other gaseous or sol id f luorine compounds) o f th i s to ta l f luor ine enanision i s not known. Studies a t o t h e r power plants lg3 indicate that about 8% of F input t o the boi lers passes e lectrostat ic precipi ta tors (99% par t icu la te removal) and is emitted from the stack as ei ther gaseous compounds or as compounds absorbed on f l y ash par t ic les . I f 8% of the total F in coal i s emitted from the s tack a t the Hat Creek power plant , f luorine emissions would be about 480 kg/day. Gaseous f luorine compounds emitted from the stack can be accumulated by vegetative species. Oue to the reac t iv i ty of many gaseous f luorine compounds, reaction w i t h airborne pa r t i cu la t e s i s l i ke ly . Thus, as wil l l ikely occur with many t race e le- ments, par t icu la te F deposited on s o i l s will be mostly unavailable for plant uptake. The amount of F absorbed from so i l by plants is usually not related t o F content of the soil. ' ?he primary F inactivation mecha- nism in soils is formation of insoluble calcium fluoride, especially in f a i r ly a lka l ine so i l s . However, certain plants possess unique a b i l i t i e s f o r absorbing much greater quant i t ies o f an element, such a s F, ' than other plants growing on the same Therefore, individual plant charac te r i s t ics a re l ike ly more important in determining plant uptake of F than the F concentration in the s o i l . Lower plants , such as 1 ichens, t ha t do n o t have root systems can accumulate F that i s deposi ted on t h e i r ce l l membranes from a i r p o l l u t i o n ~ o u . r c e s . ~ ~ Airborne F compounds can also be absorbed by plant leaves and accumulated in p l a n t chloroplasts. 32
Fluorine compounds diffuse easily across g u t walls o f animals and are readily incorporated into growing bones. Most of the F t h a t i s not in- corporated into hard body t issue is excreted by animals. ?he inso lubi l i ty of calcium fluoride greatly l imits the amount of soluble F existing in hard waters. Therefore, F entering surface waters will l ikely precipitate and subsequently become incorporated i n t o biot ic t issue of organisms tha t obtain n u t r i t i o n from bottom sediments.
.r
m
L
IC
Fi-20
In summary, the most significant source of f louri ne from the urc mosed p-oject will be gaseous emissions from the stack. Gaseous fluor'ine compounds a"e reactive and will undergo chemical reactions .with airborne particulates. Some o f the gaseous fluorine will be absorbed by vegetation, b u t much of t!ie fluorine will be absorbed by soi l and water, primarily in the. form of ci%lcium fluoride.
( f ) Lead ( P b )
Since Pb concentrations in emitted fly ash are enriched in comparison to both bottom and precipi ta tor ash (Section F4,.3), some Pb, est:mated t o be allout 4 kg/day (Table F4-13), will be emitted from the stack. As with CU, PI) i s highly adsorbed by soi'ls and i s n o t easi ly uptaken by p lan t s or leached from so i l s . The l imited distribution of Pb i s depicted by sche- mitic flows in Figure F6-6. Any Pb absorbed by plants from s o i l s remains mostly in p l a n t roots, and i!; thus unavailable to grazing animals. How- e'fer, plant leaves can adsorb Pb from atmospheric aerosols.88 Similar a'mospheric uptake of Pb i s iilSO observed fo r lower plants l ike masses and lichens. In addition t o insolubi l i ty of many Pb compounds and imnobil- iiration i n soils, another factor l imitinq biotic transport of Pb i s i t s inabi l i ty t o be methylated. '!" 'Lead ingested by animals i s not readi ly tvansported across g u t walls, and only a small fraction o f the Pb taken ill by animals i s s tored i n bones. Any Pb reaching alkaline surface waters i l l the Hat Creek area will exist almost entirely in colloidal or precipi- tated forms. This bound Pb Icould be slowly incorporated into organisms tha t u t i l i ze bottom sediment!; for nutrition sources. Once Pb has been incorporated into various organo-lead compounds or complexes, i t s mobility through the food chain is l ikely increased.
In sumary, Pb distribution will l ikely be limited due t o thse ir lsolubili ty of Pb compounds. However, vegetation can accumulate almospheric Pb compounds, thus, increasing the potential mobility of Ptl through the food cha in .
F6-21

Pi sh 3 T e r r e s t r i a l
animals * 2 3
7
Rooted aquat ic \ 2 plants . and
Producers ( p l a n t s ) 1 Algae
d e t r i t u s ( b o t t o m sedimencl-feeding I
an lma l s Zooplankton 1
3 A 1- S u r f a c e
2 t , water
Sink - bot tom sed iments 3 3
____ e . 6 . . l i c h e n s
- - 4 - - Air S o i l
L A 1 Sink - adsorbed
on hydrous metal - 1 1 o x i d e s
D i s p e r s i o n o u t o f t h e b a s i n o n s u p e r f i n e
p a r t i c l e s
3
1
KEY: - 1 Major pathway or s i n k
2 Secondary pathway or s i n k
3 Minor pathway or s i n k
4 Unknown s i g n i f i c a n c e
S t a c k Overburden. waste rock , ash b a a l n
l e a c h a t e emis s ion and o t h e r waste s t o r a g e b a s i n
F igu re F6-6. Poten t ia l pa thways o f Lead (Ph) movement through Hat Creek ecosystem components
1 % r g ' 4 I ; , I . # ' 1 rri i t : # : # I : ' I 1 c f I : ' f f

-
The Principal source of Hg from m i n i n g and power p lan t ac t iv i t ies i n the Hat Creek area will be stack gas emission as only very ]OW concentrations (0.001 to 0.01 W k g ) Of Hg ex i s t i n leachate from coal, overburden or haste rock (Section F4.1). I t i s estimated that Hg emissions from the Power Plant Will be about 7 !=&!/day (Table F4-13). While i n the gas phase,
H3 l i ke ly undergoes many reactions w i t h other trace organic and inorganic cmpounds i n the stack emission. Eventually, these Ha compounds a re adsorbed onto a i r par t icu la tes and are deposited on land and water environments. I t i s a l so l i ke ly t h a t some gaseous Hg i s adsorbed direct ly onto terrestr ia l organic matter and clays. Once deposited on land and water, Hg c:ompounds undergo many reactions that contribute to both the wide distribution and bio- accunulation of Hg i n the environment. Figure F6-7 sumarizes the wide distribution and bioaccumulation potential of Hg i n the Hat Creek: environ- ment subsequent t o power plant start-up. Microorganisms can interconvert various inorganic forms of Hg. Aerobic bacteria can solubilize mercuric sulfide, a very insoluble compound, by oxidizing the su l f ide to su l fa te . Bacteria can also convert ionic mercury and methylmercury to metal l ic mercury, a conversion tha t can be regarded a s a detoxification mechanism because elemental Hg can be vaporized back to the atmosphere.
The mercuric ion (Hg+*) appears t o be the most important and prevalent f o rm of ionic Hg i n the environment.' Mercuric ion i s usually required before the biological mercury methylation reaction will proceed."" A t low tg contamination levels, dimethylmercury i s apparently the ultimate product c f the methylation process, whereas monomethylmercury i s primarily produced i f l a rge amounts of Hg are entering a particular environment. A:kaline environments appear t o favor the formation of dimethylmercury, a vo la t i l e compound tha t can escape frcm the system by evaporation. Howevel-, acid rystems favor the formation of monomethylmercury, which i s less vola t i le than cimethylmercury and therefore more avai lable for biot ic uptake. 1:L8
Bohnlg7 reports that Hg deposited on s o i l s i n typical industrial and' Lrban areas i s imnobilized a n d only small proportions of the soil-absorbed

0) m I Iu 0.
- 2 -
F i s h T e r r e n t r i a l animals -
.c. 1
1 L
2
Rooted aqua t i c 2 p l a n t s , a n d
sediment)-feeding d e t r i t u s ( b o t t o m
Algae
Zooplankton 1 Major pathway or s i n k
Producers ( p l a n t s )
1 KEY:
an tmnl s -
I \
1 S u r f a c e - 3 j 8 w a t e r
2 Secondary pathway or s i n k
3 Minor pathway or s i n k
4 Unknown n t g n i f i c a n c e
.-= ,1
1 2 A -
Sink - bottom sediments 2 1
11 Dtnpern ion ou t 4
2 o f t h e b a s i n
-t S o i l Air on nupe r f ine 1 "
p a r t i c l e s or an gas i I, 1
Sink - adsorbed o n o r g a n i c m a t t e r
2 a n d c l a y m i n e r a l s
. 1
Stack I 1 Overburden, waste rock. as11 b a s i n
l e a c h a t e emis s ion and o the r waste s t o r a g e b a s i n
F6-7.. Potent ia l pathways of Mercury (Hg) movement through Hat Creek ecosystem components
L
* -
a
II
m
rl
a
I
Hg i s absorbed by plants. Crganic matter, especially materials ~COntainina organic sulfur, strongly absorb ionic Hg. '08 Clay and sand have a lower Hg adsorptivity than organic matter. Methylmercury u s u a l l y has 'lower a t t rac t ion t h a n ionic Ha t o so i l a n d sediment adsorbents. Even .though adsorp- tion mechanisms are effect ive i n imobi l iz ing b o t h inorganic and organic Hg in soi ls , cer ta in plants such as barley, oats, and r ice can absorb Hg from aerial portions of the plant. '18 However, information on Hg uptake by t e r - res t r ia l p lants and the i r subsequent contribution t o Hg burdens i n consumer animals i s n o t as well documented as i s Hg transfer in aquatic systems.
Mercury and i t s compounds have an a f f in i ty for thiol (sulfur containing) qroups tha t a re found in biological protein structures. Since organic mer- cur ia ls (e .g . , monomethylme!-cury) are strongly complexed by these proteins, bioaccumulation of Hg i s a widespread 'phenomenon. The h i g h concentration of llg i n some animals (e.g., fish and fish-eating birds) i s , in part , due t o the f ac t 1;hat these animals are a t t h e end of a food chain where each step of the chain s i g n i f i c a n t l y accumulates H!J. For example, certain benthic macroinvertebrates may accumulate Hg from the stream sediment they ingest. A certain species of f i sh may then feed almost-exclusively on these macroinvertebrates, and t h u s will intake abnormally large amounts of organic Hg just because of specialized feeding babits. Animals do have mec:hanisms for excreting Hg from the i r :systems. b u t crganic Hg compounds are degraded only slowly by animals. For example, the ha l f - l i fe of various organic Hg compounds in trout varfes from four months t o one year. 201
In sumnary, the Hg released t o the environment by act ivi t ies of the Hat Creek project will be distributed widely through many environmental components. Distant transport outside t h e s i t e area may be important due t o the volat i le nature of elemental Hg and many o f i t s compounds. Much of the Hg deposited near the s i t e w i l l l i ke ly be adsorbed by soils or stream sediment. However, a pwtion of the Hg released t o the environment will l ikely undergc, various bio- ciemical transformations that will increase the biotic distribution of Hg. The b s i c c h a r a c t e r i s t i c (pH o f 7 or higher) of surface waters i n the Hat Creek drainage should limit the a m w n t of methylmercury avai lable for t8iot ic uptake
F6-25

by aquatic organisms. However, any methylation o f Hg in streams may be of importance, since predator fish species, such as locally existing salmon and trout, apparently have h i g h potent ia ls f o r accumulating Hg. 118
(h) Vanadium ( V )
Vanadium compounds are widely dispersed in nature and usually do not accumulate in particular ores. Therefore, V i s consi.dered a rare element even though i t s to ta l conten t i n the earth 's crust is l ikely higher than tha t of copper. The most c o m n forms of V i n nature are vanadium pentoxide (V205) and associated salts (vanadates) o f metavanadic acid (HV03). Vanadium compounds are soluble i n a lkal ine media and, therefore, available t o plants growing in bas ic so i l s . Many plants, including grazing crops such as clover and a l f a l f a , may accumulate any V deposited O i l basic soi ls i l l the Hat Creek area. Any V ingested by animals is readily absorbed across the g u t wall-and stored f o r short periods in the l iver. 4
Vanadium s a l t s can be ca r r i ed ' t o l oca l s t r eam i n surface runoff. Many V sal ts are water soluble , especial ly i n basic waters. Soluble vanadate salts can be u t i l i zed by algae and subsequent transfer of V along the aquatic food chain may occur. For example, Hutchinson2" reports that several species o f rooted aquatic plants accumulate V. As w i t h many other rare elements, V i s adsorbed on hydrous metal oxide^,^" a process that is l i ke ly very important for reducing the ava i l ab i l i t y o f V and other trace elements t o biological or- gani sm .
Vanadium l iberated by mining and power generat ing act ivi t ies i n the Hat Creek area will be associated w i t h precipi ta ted f ly ash and with stack emissions'estimated t o be about 16 kg/day (Table F4-13). Although moderately high concentrations (about'50 t o 400 ppm) of V were observed in coal and soil (Table F4-9 and F5-25) only very low amounts of leachable V were observed i n coal , overburden and waste rock samples (Table F4-1). The re- la t ive ly mobile charac te r i s t ics of V in alkaline media i s depicted in Figure F6-8. A portion (about 1-4 mg/kg) of the V associated w i t h precipi ta ted f ly and bottom ash can be leached from the ash (Table F4-1) ,
L
..
F G - X

r I
I 3
--"Fl Fish Ter res t r ia l animals
A 2
Rooted aquatic plants , and de t r i t u s (bottom sediment) - feeding animals
C:,.vFnrn
Transport down- stream as soluble
vanadates bottom sediments
KEY:
i Fiajor paiitway UI sink
2 Secondary pathway or s ink 3 Minor pathway or s i n k 4 Unknown significance
-
1
m *?- I
I of the basin Dispersion out
pa r t i c l e s on superfine
adsorbed on hy- Sink -
1 drous lnetal ". "Aides in soil
I I Stark I 1 Overburden, waste rock. ash basi.n I I emissions I I and other waste storage basin
- lrarhate I
Figure F6-8. Potent ia l pathways of Vanadium (V) mvement through Hat Creek ecosystem components

indicat ing that a potential pathway ex i s t s fo r mi.gration of V compounds from ash storage basins if seepage and drainage are not carefully con- t ro l led . Any V associated w i t h f i ne f l y ash particles emitted from the power p l a n t will be deposited on t e r r e s t r i a l and aquatic environments. Oue t o the a1 kal ine character is t ic of s o i l s and waters in the Hat Creek area, a portion of t h i s V will exist in a water soluble form avai lable for biot ic .uptake. An unknown, b u t l i ke ly major, portion of the V deposited on loca l so i l s and waters will be absorbed on clay minerals and thus excluded from incorporation into biotic systems.
In sumnary, the general solubili ty of V compounds in alkaline media indicates that V will be widely distributed in Hat Creek environs. Some V wi l l l ikely be accumulated by vegetation, b u t accumulation in animals .is not expected.
( i ) Zinc ( Z n )
Zinc, as predicted for such elements as Pb, Cd and Cu , should also be r e l a t ive ly imnobile in basic soils. However, s a l t ex t r ac t ion t e s t s on coal , overburden and waste rock samples from Hat Creek valley indicated t h a t about 10 mg Zn could be leached per kg o f materials. Therfore, Zn may be re l a t ive ly mobile t race element in the Hat Creek area. The wide d is t r ibu t ion and bioaccumulation potential for Zn in the Hat Creek area subsequent to p ro jec t s ta r tup i s summarized in Figure F6-9. Many plants , ranging from lichens to leaf-bearing crops, have a high a f f i n i t y f o r Zn and accumulate the element i n concentrations much higher than those o f other trace elements. 4181204 Zinc i s an essential element t o plants and their a b i l i t y t o accumulate Zn varies widely among species. Climatic conditions, soil moisture and l ight are also important environmental factors influening Zn uptake by plants. Zinc is a lso required by animals b u t is only s l ight ly absorbed across g u t walls.4 Many cel ls 'and enzymes require Zn for proper function, and the l iver , brain and bones are accumulators of Zn. ..
c
m
Ir
L

a m a I t i I i
2
Rooted a q u a t i c . p l a n t s , and d e t r i t u s ( b o t t o m sediment)- feeding an imals iooplankton
- 1
Fish 2
-
T e r r e s t r i a l an ima l s
Algae Producers ( p l a n t s )
2
Sur face
I’ Sink -
bottom sediments
K E Y : - . I 1 Major pathway or s i n k
2 Secondary pathway or s i n k
3 Minor p a t h w y or s i n k
4 Unknown s i g n i f i c a n c e
I r I I
Dispers ion ou t 4 of t h e b a s i n on s u p e r f i n e
p a r t i c l e s
1 -rr A i r s o i l
I L 1
on hydrous metal Sink - adsorbed
ox ides
Overburden, waste rock, ash basin and o t h e r w a s t e s t o r a g e b a s i n
l e a c h a t e emission
Figure F6-9. Potent ia l pathways of Zinc (Zn) movement through Hat Creek ecosystem components

As w i t h plants , many animals accumulate Zn i n concentrations often com- parable w i t h those of Fe and usually much higher than those o f other t race elements. 4y2'0 For example, Zn concentrations in some aquat ic shel l f ish may be several thousand t ims greater than concentrations in the surrounding en- vironment. '11 Apparently, a large portion o f th i s Zn is derived from plankton on which the shel l f ish feed,*l l thus indicat ing that Zn i s accumulated in each step of the food chain.
A major reservoir for Zn in soil and water i s f i n e hydrous metal oxides that occur in clay minerals. lg8 Adsorption of Zn on these oxides and precipi- ta t ion of insoluble Zn compounds, such as zinc carbonate, in basic media a re principal factors that reduce Zn mobility in the environment. Also, Zn cannot be methylated in the environment, a fac t tha t wi l l l imi t its potential mobiiity t h r o u g h biotic systems relative to. elements such as As or Hg. 199
Since a portion of the Zn l iberated during coal combustion i s adsorbed on fine f l y ash par t ic les t ha t escape from the stack (Zn emissions from the stack may be about 13 kg/day; Table F4-13), .. Zn will be broadly deposited on land ana water environments i n the Hat Creek area. Although most of this Zn wiTl l i ke ly be adsorbed on hydrous metal oxides i n so i l or stream sediment, the affinity of many organisms for Zn ind ica tes tha t b io t ic systems will a lso be important accu- mulators of Zn. Zinc compounds contained i n bottom and precipi ta ted f ly ash appear t o be fairly water soluble as leaching tests indicated that 40 t o 80 mg Zn could be extracted by water from 1 kg ash. However, ash storage basins will be designed and constructed to avoid migration o f Zn from the basins i n t o surrounding environments .241
FG.4 Summary
Several sources of trace elements exist at coal mines and coal-fired power generating plants. Principal sources of trace elements from the Hat Creek project will l i ke ly be overburden and waste rock p i l e s , ash and blowdown storage basins and emissions of f l y ash and gases from 'she stack. Secondary sources will include fugi t ive dust and cooling tower d r i f t . The dis t r ibut ion
FG-30
of a t race element i s dependent on both the nature of the source material and mobil i ty of the par t icular element in air , soi l and water media. For example, an element t h a t i s highly insoluble in basic media and is associated with pre- c ip i ta ted f ly ash or bottom ash will be narrowly dis t r ibuted in t h t ? Hat Creek environment, whereas, an element t h a t i s soluble in basic media and is associated with airborne fly ash will be m r e widely distributed.
Due to in te rac t ing and changing environmental conditions, actual distribution, mobility and bioaccumulation o f many elements cannot be clearly definable as e i the r h i g h or low. Only detailed studies could quantify elemental distribution a f t ? r coal mining and power generat ing act ivi t ies begin. However, empirical c lass i f icat ion of t race elements in to high or low distributional groups can be mad? based on exis t ing information. The following classification i s therefore useful as a quali tative indicator of which elements will likely be of greatest environmental concern i n local ecosystems i n the Hat Creek area:
1 , Wide distribution/hig#I mobility/moderate bioaccumulation potential : F. 2 . Wide distribution/low mobility/high bioaccumulation potent:ial: Cd, C u ,
Pb, Zn.
Hg, V.
3. Wide dis t r ibut ion/high m b i l i t y / h i g h bioaccumulation potential: As. Cr,
F€-31'

F7.0 IMPACT ASSESSMENT
Assessment of potential impacts o f trace elements emanating from Hat Creek p ro jec t ac t iv i t i e s i s a two-step process. Foremost and primary i s an accurate determination, based on available technical design information and source d a t a , of the potentit.1 contribution of mine and plant construction and cperat ion act ivi t ies t o existing natural trace element levels in Hat Creek t io t a . For trace elements whose concentrations and mass balance are expected t o be altered by the Hat Creek project, information on existing ratural levels, tolerance levels, toxic concentrations and toxic effects i s used t o determine the pot:ential for significant ecological impact. This information was provided i n Section F5.0 for trace elements of major concern a n d i s in tegra ted here for those elements whose influx may a f f ec t the in tegr i ty of Hat Creek and v ic in i ty ecosystems. The focus of this sect ion t.hen is ' to evaluate each project-associated trace element source in regard t.o i t s contribution t o natural trace element burdens. Sources considered are leaching of overburden and waste rock pi les . fugi t ive dus t elnission from coal mine operation, stack missions, leaching o f ash pi les , and cooling tower c r i f t .
F'7.1 Coal Mine
( a ) Coal, Overburden, and Waste Rock Leachates
Leaching of trace elements from piles of overburden, waste rock. and coal would be the principal mechanism by which trace elements could be released f'rom storage piles t o the surrounding environment. Predicted water soluble amounts of various elements i n overburden, waste rock, and coal ,me given in l 'able F4-2. These predicted amounts were based on sa l t ex t rac t i sm tes t s performed on crushed samples., and l ikely represent maximum amounts of t race Elements t ha t can be experimentally extracted by deionized water. Therefore, amounts o f elements l is ted in Table F4-2 represent the available pool of elements that could be leached from storage areas containing the to ta l amount
F7-1

of material placed i n them during a 35 year operating period. Several tons of water soluble trace elements will exist i n these storage areas. Of special environmental concern a re As (about 1200 metric tons o f soluble ma te r i a l ) , B (about 2100 metric tons o f so luble mater ia l ) , Ha (about 9 metric tons o f so luble mater ia l ) , and Zn (about 12,000 metric tons o f soluble material) . Arsenic and B a re r e l a t ive ly mobile i n a lka l ine so i l and water environments such as ex is t in the Hat Creek area. However, current design plans indicate that trace elements will be retained i n or near stor- age p i l e s or remved from pile runoff or seepage by treatment processes. 241
(b) Fugi t ive Dust
Fugitive dust resu l t ing from coal extract ion and t r a n s p o r t a c t i v i t i e s will be comprised o f natural soil, overburden and waste rock mater ia ls . Trace element concentrations in these materials often vary because o f local differences i n mineralogy and erosional history. Surface and near surface deposits, which have long been exposed to weathering., may-have a much lower content of potentially mobile trace elements than deeper overburden and waste rack.. As these la t ter mater ia ls are exposed to weather ing, cer ta in t race '
elements may be mobilized into other sectors of the ecosystem. Table F4-2 presented concentrations o f water-soluble trace elements i n waste rock and overburden material . Comparison o f these resu l t s t o to ta l l eve ls of t r ace elements i n Hat Creek soi ls (Sect ion F5.0) shows tha t so i l s con ta in much higher t r ace element concentrations. Given the l imited local d is t r ibut ion of fug i t ive d u s t emission and the general ly low concentration of water-soluble trace elements i n dus t as compared t o natural levels i n Hat Creek s o i l s , i t i s an t ic ipa ted tha t fug i t ive dus t emission wi l l no t s ign i f icant ly a l te r ex is t ing t race element balances o r accumulation i n Hat Creek receptors.
F7.2 Power Plant
( a ) Stack Emissions
Certain t race e lements that are .suff ic ient ly volat i l ized during coal combustion will ex i t the s tack e i ther i n the gaseous phase or recondensed
L
"
Ir
It

on the surface of f ine f l y ash particulates. As discussed in Sections F5.0 and F6.0, t race elements of most environmental concern tha t a re a l so l ike ly t o be enriched in f l y ash or gaseous emissions from the proposed Hai: Creek power p l a n t are As, Cd, Cr, Cu, F, Pb, Hg, V and Zn . These elements will ultimately be deposited on the terrestrial and/or aquatic environment, with potential impact on the natural trace element balance in Hat Creek biologic- al receptors.
Various project design al ternates were considered in a i r qua l i t y modeling and these are fully discussed in ERT's main report. Also discussed in the main report are uncertainties involved w i t h model results. Results of air quali ty modeling of stack effluents provide a basis for predicting concemtra- t i o n s of selected trace elements emanating from the proposed power plant that k i l l in te rcept Hat Creek ground and water surfaces. Model calcu!ations were performed in two parts. A steady-state di.ffusion model, calibrated t o the atmosphere of the Hat Creek valley using local meteorological data for 1975, assessed the potential effects on air qual i ty for a radial distance of 25 km from the stack (see the ERT main report - Air Qual i ty and C1imat':c Effects of the Proposed Hat Creek Project and Appendix B - Modeling Methodology f o r de ta i l s of air quality modeling). Although no chemistry was incorporated i n the local model, predicted ambient a i r concentrations o f t race elements can be calculated by d i v i d i n g t race element emission rates by SO,, emission rates . The result ing ratios are reported in Table F7-1 and ca lcu la ted a i r concentrations of t race elements a re l i s ted i n Table F7-2. Assuming a t race element deposition velocity of 0.1 cm/sec, deposition f l u x (pg/m2/sec) equals the product o f t race element ambient concentration (SO2 ambient con- centration x r a t io ) and 0.1 an/sec (deposition velocity). 244 Aswming'that t race element interceptions at soil surfaces (deposit ion f l u x ) penetrate r o deeper than 5 cm and remain imnobile, a bas i s i s provided for predicting average annual increases in soil trace element levels that could result from plant operation (Table F7-2).
1.
Annual average local SO2 concentrations are shown in Figure F7-1 w i t h coded isopleths replacing numerical concentrations. Coded isopleths indicate areas predicted t o have certain air concentrations of trace elements. Con- centrations and element concentration increases in soils associated w i t h
1 F7-3

Table F7-1
Ratio o f se lec ted t race element emission t o SO2 emission
Projected stack emission
Trace element ra te (kglday) Element t o SO2 r a t i o
Arsenic
Cadmium
Chromium
Copper
F1 uori ne
Lead
Mercury
Vanadim
21 nc
17.2
0.35
5.20
5.93 . 281
4.36
7.07
16.1
12.9
5.30 X
1.08 x 10-6
1.60 X 10⁻⁵
1.83 X
8.65 X
1.34 X
2.18 X
4.86 X
3.97 X IO-^
NOTE: Uncontrolled SO2 emission estimated t o be 324,768 kglday burn ing 0.45% su l fu r coa l a t coa l - f i r i ng r a t e of 42,600 metric tonslday (see ERT's main report). Trace element emissions listed in Table F4-13. Highest emission projected by using either CCRL or - Bat t le River tes t data was used (Table F4-13); t h u s , wor.st-case conditions (highest emissions) based on t es t da ta p ro jec t ions were - used for imDact assessment.
.-
-

lable b / - Z
for selected trace elements within different zones near the proposed Hat Creek power plant Annual average air concentrations, deposition flux and soil concentration increases
Ambient trace Projected soil Isopleth Ambient element level Deposition concentration
Trace element Code* SO2 level (p9/m3)** (pg/m3)***
Arsenic (As) A 5 3 X 9.5 1.4 X B 3 2 X 6.3 9.0 X
flux (ug/m2/yr)t increase (mg/kg/yr)tt
C 1 6 X loT5 1.9 2.7 X 0 0.1 6 X 0.2 2.9 x
n “4 I m Cadmium (Cd) A 5 5 x 0.16 2.3 x 10⁻⁶
B 3 3 x.lo-6 0.09 1.3 x C 1 1 x 10⁻⁶ 0.03 4.3 X
D 0.1 1 X 0.003 4.3 x
Chromium (Cr) A 5 8 X 2.5 3.5 X B 3 6 X 1.9 2.7 X
C 1 2 X 0.6 8.6 X 0 0.1 2 x 0.06 8.6 X
Copper (CUI A 5 9 X 2.8 4.0 X B 3 5 X 1.6 2.3 X C 1 2 X 0.6 8.6 X 0 0.1 2 x 0.06 8.6 X

Table F7-2 (Continued)
Ambient trace Isopleth
Projected soil Ambient element level
Trace element Code* SO2 level (pg/m3)** (pg/m3)*** Deposition
flux (vg/m2/yr)t concentration increase (mg/kg/yr)tt
Fluorine (F) A 5 4 X 126 B 3 3 X 95 C 1 9 X 28 D 0.1 9 X 2.8
1.8 X lob3 1.4 X
4.0 X 4.0 X
Lead (Pb) A 5 7 X 2.2 3.1 X B 3 4 X 1.3 1 . 9 X C 1 1 X 0 .3 4.3 x D 0.1 1 x 0.03 4.3 X
3 I m
Mercury (Hg)
Vanadium (V)
5 3 1 0.1
5 3 1 0.1
I X 7 X 2 X 2 x
2 X 1 X 5 X 5 x
3.2 2.2 0.6 0.06
6.3 3 . 2 1.6 0.2
4.6 X
3.1 X
8.6 X loT6 8.6 X 10”
9.0 X 4.6 X 2.3 X 2.9 X

Table F7-2 (Continued)
Isopleth Ambient trace
Ambient Projected soil
element level Deposition concentration Trace element Code* SO, level (ugh3)** (ug/m3)*** flux (ug/m*/yr)t increase (mg/kg/yr)tl
Zinc (Zn) A 5 2 X 6.3 9.0 X B 3 1 X 3.2 4.6 X C 1 4 X 1.2 1.7 X c 0.1 4 x ?9-6 O . ? I.? :: :0-6
-4 n I U
* See Figure F7-1 for corresponding isopleths.
** SO, concentration (annual average) with 1200 ft. stack and no SO2 removal (see the ERT main report for details of model).
*** Trace element concentration (annual average) = SO, level X element to SO, emission ratio (Table F7-1).
t Deposition flux (pg/m2/yr) = ambient trace element level X 3.15 X 10⁴ m/yr (deposition velocity, see text).
tt Assumes element mixes with top 5 cm of soil and soil bulk density = 1.4 g/cc.
Then, soil concentration increase per year = depositional flux X 1 m2 + (0.05 m3 X lo6 cc/m3 X 1.4 g/cc) = ug/7 X lo4 g = mg/7 X lo4 kg. Therefore, soil increase (mg/kg/yr) = deposition flux f 7 X 10⁴.
Calculation based on power plant operating at full capacity for 365 dayslyear (hypothetical worst-case for trace element impact assessment).

I 1 I I I I I f
I " X = maximum = 4700 kg/kr+/Year (42 lb/acre/year)
SCALE- 1:SO.OOO. l o .1#.1.1.., I z a
oymrl ormru- 100 I s m _I__
Y
BRITISH COLUMBIA HYDRO AND POWER AUTHORITY
HAT CREEK PROJECT
DETAILED ENVIRONMENTAL STUDIES
Figure F7-2. Predicted Annual Salt De- position in kg/km2/year
from Proposed (Two) :.atural (lb/acre/year) Due t o Drift
Draft Cooling Towers
r

these isopleths are presented in Table F7-2. Although t race element dis t r ibu- t ions are no t l ike ly t o correspond exactly t o the SO2 dist r ibut ion, the results reported in Figure F7-1 and Table F7-2 nevertheless provide an estimate of projected average annual ground level concentrations :'or t race e lmen t s of concern. Trace element distribution as predicted by the model i n j i ca t e t h a t depositional amounts of trace elements on local ecosystems will be low. For example, the mod,el predicts t h a t f luorine, the trace element having the highest deposition f l u x , would only be enriched in soil i n the highest depositional zones by about 0.002 mg/kg/yr (about 1 mg/kg every 500 yews ) .
To further investigate levels of trace elements t h a t m i g h t be deposited on local ecosystems, a calculation was made tha t assumes t h a t a l l t r a c e elements i n stack emissions would be evenly deposited and retained within a 2 5 km rad ius of the stack. Such an assumption l ikely projects wlx-st case increases in soil concentration o f selected trace elements. Concentrations generated by th i s model are l is ted in Table F7-3 and represent hypothetical resu l t s t h a t would occur i f no long range dispersion of stack emis!;ion occurred and all trace elements in stack emissions were deposited evenly w i t h i n a 25 km r ad ia l area around the stack. Additionally, i t was assumed that these conditions would exist continually for one year under fu l l operat- ing capacity (42,600 metric tons/day coal f i r i n g r a t e ) . Under 'these condi- t ions (which are not l ikely to occur i n t he project environment even under the worst meteorological conditions, i n the case of extreme washout from heavy rain o r snowfall, or under maximum annual average l o a d fac tors ) , a response i n trace element 1eve:ls i n so i l would not be detectable for most elements. However, a 0.7 mg/kg annual increase in soil fluorine content migtt be measurable. Plants nctrmally accumulate only small amounts of f lucr ine from soi l and there i s l i t t l e r e l a t i o n s h i p between the concentra- tion of f luorine i n the soil ard i n the plant. 237 Therefore, plant!; in the Hat Creek area would not l ikely accumulate fluorine from so i l s in l eve ls tha t would be detrimental t o the plant. As discussed in Section F5. ,0 , fluorine levels in grass samples collected from the study area in 1976 and 1977 varied from about 20 t o 1500 mg/kg, indicating t h a t f luorine accumulation i n p lan ts founi in the Hat Creek environs already varies widely.
F7-9

Table F7-3
Projected soil concentration increases o f selected trace elements assuming a l l elements are evenly deposited w i t h i n a 25 km rad ius of the stack
Projected stack Projected stack Projected soil
Element emission rate (kg/day)*
emission rate ( kg/yr )**
concentration increase (mg/kg/yr)-
. Arsenic (As) 17.2 6,278 0.05
Cadmi um (Cd) 0.35 128 0.001
Chromium (Cr) 5.20 1,898 0.01
Copper ( C u ) 5.93 2,164 0.02
F1 uori ne ( F ) 281 102,565 ’ 0.7
Lead ( P b ) 4 :36 1,591 0.01
Mercury (Hg ) 7.07 2,581 0.02
Vanadium ( V ) 16.1 5 ,a77 0.04
Zinc (Zn) 12.9 4,709 0.03
Highest emjssion projected by using either CCRL or Bat t le River test data was used (Table’F4-13); t h u s , worst-case conditions (highest emissions) based on test data projections were used for impact assess- ment.
H: Assumes plant operating a t fu l l capacity (42,600 metric tons/day coal .firing r a t e ) f o r 365 days/year (hypothetical worst-case for t race element impact assessment). - Assumes that all deposited elements will remain i n residence in t o p 5 cm of so i l and t h a t neither uptake by vegetation nor erosion of so i l
Then weight of soi l in a cvlinder w i t h 25 krn radius and 5 crn heioht = t o watershed drainages will occur. Assume soi l bulk density = 1 .4 g/cc.
137.4 X 10⁹ kg. (25 X i 03m)2~X 0.05 m X k 1.4 g/cc X lo6 cc/m3 = 137.4 X 10’2 =
F7-10

..
Airborne fluorine compounds can be detrimental t o susceptible vegetation. The National Academy of Science reported that a 30-day average a i r concentra- t i o l of gaseous fluoride of abou t 0.5 pg/m may be the threshold for causing f o l i a r damage t o susceptible vegetation. 222 Doze-response relationships for different plants indicate t h a t fol iar in jury t o susceptible veqetation occJr a t fluorine levels of 5 t o 10 pg/m for one-day exposures. another study, foliar damage was observed when susceptible plants were expxed to 5 . 5 ug/m fluorine for 40 hours. 239 Maximum 24-hour ground level flux-ine concentration predicted within 25 km of the Hat Creek power plant would be about 0.4 ug/m (Tab182 5-12 i n the ERT main repor t ) . Suct short- tenn (24-hour maximum) levels ,are less than values reported t o cause damage t o susceptible vegetation.
3
3 238 In
2
3
In addition t o non-radioactive trace elements, coal also contains small quantit ies o f uranium isotopes, thorium, and'their daughter products t h a t are released d u r i n g coal cabu:;tion. A recent predictive model study233 can be used t o calculate maximum hllman doses from both i n h a l a t i o n and ingestion patltways near a 200-MW (e) coal-fired power plant burning coal containing 1 m!;/kg uranium and 2 mg/kg thorium and w i t h 99.7% precipitator efficiency (Table R-4). Predicted doses are all less than guideline values for pro- t ec3on of human health. 234 S'ince uranium and thorium content i n cJal (Table F4-!)), design particulate collection efficiency, and design size of the Hat Creek power plant are very similar t o conditions assumed in this predictive model, radioactive dose commitments near the Hat Creek project are expected t o be similar t o those calculated by the model ( i , e . , l e s s than U.S. guideline values for protection of human health). However, because env.'ronmental effects of long-term (35 years) exposure of ecosystem components t o 'ow level radiation that m i g h t ex i s t near coal-fired power plants are largely undocumented, any radiological irnpacts t o ecosystem compone'lts near the proposed Hat Creek power plant cannot be estimated.
203
( b ) Ash Basin
Except for volat i le t race elements such as Hg, the greatest amounts of trace elements i n coal will be contained i n bottom and collected fly ash.
F7-11

Table F7-4
Maximum individual dose comnitments (man rem per year) from the airborne releases of model 2000-MW(e) power plants
Organ Predicted dose* Gui del i ne**
Whole body
Bone
Lungs
Thyroid
Kidneys
Liver
Spleen
1.1 5
70.9 15
1.1 15
1.1 15
2.0 15
1.4 15
1.6 15
* Predicted values for 2000-MW(e) power plant with 99.74, removal of fly ash.233
** 'Guidelines from U.S. Code o f Federal Regulations, 10 CFR 50.234
F7-12

"
L.
The water soluble amounts of trace elements estimated t o be contained i n collected ash f o r a 35 year pl3nt operating period are listed i n Table F4-2.
Weiqhts of water soluble elements in the ash basin or coal pi le are pro- jec,:ed t o be mostly less than 'combined weights of water soluble elements i n was':e rock and overburden pile,;. Current design plans indicate t h a t t race elefaents will be retained i n o!* near storage basins or removed from basin seepage by treatment processes. ,
241
(c) Cooling Tower Drif t
A secondary and localized source of trace elements associated w i t h power p l a n t operation will be cooling tower d r i f t . I t i s predicted t h a t Thompson River water, the source of cooling water, will be concentrated by a factor of 14 as i t i s recycled throuptl the cooling system. 242 A small portion o f the concentrated circulating water (about 0.008%) will be carrieli t o areas near the cooling tower a s winds disperse some of the water away from the tower. Table F4-3 presented the predicted amount (kg /y r ) o f selected trace elements that will be contained i n cooling tower d r i f t . Information i n Table F4-3 and the predicted salt deposition due t o drift from various cooling tower designs provides the basis for a model that predicts soil concentration increases (mg/kg) of trace elements in various salt depositional zones. The model makes the same assumption concerning the f a t e of elements i n the soi l as described in Section F7.2(a). The r a t i o of t race element concentrations t o TDS ( s a l t ) concentration i n d r i f t is used t o determine trace element: deposi- tion rates in various depositional zones ( the model assumes trace elements have similar deposition as TDS) t h a t would occur fo r two natural d r a f t towers (prei'erred cooling tower design'!43). Projected increases in soil concentra- t ions of trace elements i n various salt deposition zones f o r two natlJra1 draft: cooling towers are presented i n Table F7-5. Areal extension of these depositional zones are presented on Fiaure F7-2. Salt deposition associated w i t h other cooling tower designs, are discussed i n Appendix D, Assessment o f Atmospheric Effects and Drift: Deposition Due t o Alternate Cooling Tower, Desions.
For two natura l d r a f t coo1,ing towers, maximum salt deoosit ion (4,700 ka/krl /yr) is predicted t o occur a t a point about one kilometer east from the 2
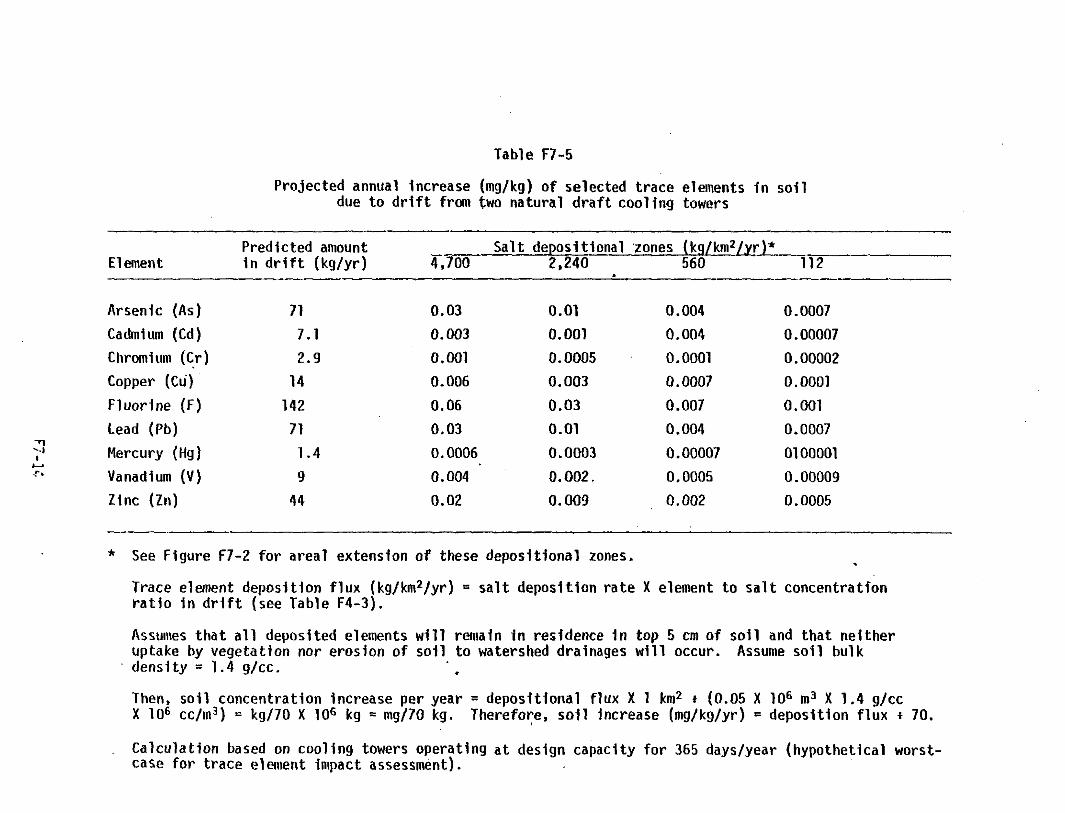
Table F7-5
Projected annual increase (mg/kg) of selected t race elements i n soil due t o d r i f t from two na tura l draf t cool ing towers
Element Predicted amount in d r i f t ( kg /y r ) 4,700 2,240 560 112
S a l t depositional 'zones (kg/km2/yr)*
Arsenic (As) Cadmium (Cd) Chromium (Cr) Copper ( C u ) Fluorine ( F ) Lead (Pb) Mercury (Hg) Vanadium ( V ) Zinc (zn)
71 7.1 2.9
14 142 71
1.4 9
44
0.03 0.003 0.001 0.006 0.06 0.03 0.0006 0.004 0.02
0.01 0.001 0.0005 0.003 0.03 0.01 0.0003 0.002. 0.009
0.004 0.004 0,0001 0.0007 0.007 0.004 0.00007 0.0005 0.002
0.0007 0.00007 0.00002 0.0001 0.001 0.0007 0100001 0.00009 0.0005
* See Flgure F7-2 for areal extension of these deposit ional zones.
Trace element deposition flux (kg/km2/yr) = sa l t deposi t ion ra te X element to sal t concentrat ion r a t i o i n d r i f t (see Table F4-3).
Assumes t h a t a l l deposited elements will remain i n residence in top 5 cm of s o i l and tha t ne i ther
density = 1 . 4 g/cc. uptake by vegetation nor erosion of s o i l t o watershed drainages will occur. Assume so i l bulk
Then, soil concentration increase per year = depositional flux X 1 km2 * (0.05 X lo6 m3 X 1.4 g/cc X lo6 cc/mj) = kg/70 X lo6 kg = mg/70 kg. Therefore, soil increase (mg/kg/yr) = deposit ion f lux t 70.
Calculation based on cooling towers operating a t design capacity for 365 dayslyear (hypothetical worst- case for trace element impact assessment).

"
X = maximum = 4700 kg/kn?/year (42 lb/scre/year)
SCALE- I : 50,000.
ODllM m m * - 100 -Elm5 - BRITISH COLUMBIA
HYDRO AND POWER AUTHORITY HAT CREEK PROJECT
DETAILED ENVIRONMENTAL STUDIES
Figure F7-2. Predicted Annual Salt Oe- position i n kg/km2/year
from Proposed (Two) :.atural (lblacrelyear) Due to Drift
Draft Cooling Towers
-. . .

m i
I
L
I
r . ~.
towers (Figure F7-2). Even (at this point of maximum s a l t deposit:ion, trace e'lement increase i n soil is ]predicted t o be no areater than 0.06 mg/kg/yr fo r any one trace element. 1ncrl:ases in the 2,240 kg/km /yr salt deposit ion ztmes (Figure F7-2) would be 0.03 mg/kg/yr or l e s s for any one trace element. Milximum increase (0.06 mg/kg/yr) is predicted for f luorine. Based on existing levels of f luorine in soils (about 200 mg/kg; see Section F5.0) from the Hat Creek region, coolinn tower d r i f t would cause a 0.03% anrlual increase i i ex is t ing so i l f luor ine lwels a t the p o i n t o f maximum sal t deposi t ion. Such small increases would nm>t be detectable and ef fec ts t o ecosystem com- plmnts czused by trace elemnts in cooling tower d r i f t a r e n o t a.nticipated. As mentioned previously, the area of maximum salt deposit ion for two n,itural draft cooling towers i s a b o u t one kilometer east from the towers. Tlis area is within isopleth code D (see Figure F7-1 and Table F7"2), a zone a.-ound the power plant where t race element deposition from stack emissions i s yo jec t ed t o be very low. For example, i n t h i s zone, increases i n soi l f luorine levels due t o deposition of stack emissions are projected t o be 0.00004 mglkglyr. Therefore, cumulative effects due t o t race element de- position from cooling towers and stack emissions are not anticipated.
2
F7-16

1'8.0 MITIGATION
m
As discussed in Section F7.0, release of t race elements from coal mining and e l ec t r i c power generat ing act ivi t ies of the Hat Creek pro jec t i s not expected t o be detrimental to t e r r e s t r i a l or aquatic ecosystems. Since no detrimental impacts are predicted, the implementation of current design and operating specifications for the mine and power plant should adequately miti- gate any environmental impac.: t h a t might be caused by trace elements. Proper design and construction of overburden, waste rock, and ash storage piles will prevent migration of t race elements f r m these piles t o ground or surface waters. 241 Pollution contro'l, devices installed a t the power plant should remove most of t he f l y ash particulates (99.7%) released (r ring coal com- bustion. 243 Gaseous and par5culate trace elements that pass through the pollution control devices and that are emitted frm the gas stack were deter- m.'ned t o ex is t in amounts t h i i t will not be detrimental t o ecosystem components.
Cooling towers, by vir tue of the re la t ively low concentration of t race e'ements i n cooling water make-up t h a t will be takewfrom the Thompson River and the extremely limited distribution of s a l t d r i f t , w i l l n o t be a s ign i f i - cant source of t race element:; t o t e r r e s t r i a l and aquatic ecosystems.
F8-1

F9.0 YONITORING PROGRAM -1
m
1)
m
1
J ..
-:
a ..
I t was established in Section F7.0 t ha t , barring any accidents or natural catastrophes, provided available technical information was reason- ably accurate, minimal, i f an,y, environmental impact of trace elements emnating from mine or plant construction activit ies or operations is anticipated. However, given the wide d i s t r i b u t i o n , h i g h mobility and h i g h bi3accumulation and toxicity potentials of some trace elements i n Hat Creek source materials and the uncertainties of the trace element dispersion model, a sampling program i s proposed t o monitor and verify predic:tions of no signif icant impact. Such a program would be designed t o increcse sc i en t i f i c confidence in our understanding of t race element impacts and woJld provide quant i ta t ive, s ta t is t ical ly val id d a t a for evaluating any imacts associated with the H a t Creek Project. To ensure t h a t tra.ce e lment inf lux from pro jec t ac t iv i t ies a re indeed minimized by tec,hnical design features, source as well as receptor materials are proposed for monitoring.
F9.1 Source Monitoring
The sources of t race elelnents associated w i t h the Hat Creek Project are l e x h a t e s from coal storage, 'waste overburden, waste rock, ... and a s h disposal piles, fugi t ive dust emissions, stack emissions and cooling tower d r i f t . Of thsse. stack emissions are o f primary concern because trace elements i n st3ck emission are widely distributed and the most insidious trace elements i n coal are frequently concentrated i n f l y ash (Section. F9.2). Accordingly, t h ? source monitori.ng program will focus on ascertaining the kinds and am3unts of trace elements pot'entially entering Hat Creek ecosystems via stack emissions. The receptor monitoring program design (Section F9.2) incorporates features for assessing effects of other sources on existing Hat Creek t race el ement burdens.
Specialized sampling and analytical techniques are required ~ I I determine t h , ? environmentally important character is t ics of atmospheric emissions generated by coal combustion. In addit,ion, several criteria are necessarily imposed on an:/ proposed stack emission sampling technique. These include:
1. Sampling must comp1e::ely capture both par t iculate and gaseous emissions.
F9-1

2. Volatiles (e.g., Ha, As, and F) must be sampled by special absorbers. 3 . Samples must not be contaminated by collection or analysis techniques. 4. Trace elements of concern should be quantified as a function of
par t ic le s ize s ince the environmental e f fec ts o f these emissions are a function of particle size; i .e. , the most toxic of trace elements are frequently emitted as a vapor o r condensed into submicron par- t i c l e s .
Meeting the l a s t c r i t e r ion i s especially challenging since the sample must be fractionated by s i z e y e t enough material must be avai lable i n each size category for subsequent analysis.
The recent interest in trace elements from coal-fired generating stations has promoted advances i n the technology for sizing and characterizing the size f ract ions of stack emissions. A h i g h volume sampling t r a in which separates par t iculate mat ter into size classes by a series o f cyclones and a back-up f i l t e r and captures volatiles (such as Hg vapor) in specific absorbing solutions has been recently developed for in situ stack smpling o f trace elements. I t is recmended that se lected t race element quantification of stack emissions be conducted semiannually dur ing the f i r s t 5 years of plant operation t o provide an adequate data base for monitoring trace elements i n stack emissions. Sampling intensity could be reevaluated after 5 years and adjusted to a level comnensurate with the potential hazard associated w i t h t race elements i n stack emissions.
F9:2 Receptor Monitoring
The specific questions t o be addressed by a receptor monitoring proqram design are:
1. Does the concentration of a spec i f ic t race element i n a specific re- ceptor a t a s p e c i f i c s i t e show a response ( i .e. . increase) after plant operation comnces, and if so
2. IS that response due t o t race element i n f l u x from pro jec t ac t iv i t ies?
c
II
The first question can be addressed by comparing operational trace element
F9-2
rn
... .

'I
I
data with pre-operational baseline data. A s ta t i s t ica l ly s ign i f icant d i f fe rence ir these data would indicate a response b u t would n o t identify the source of t t e response; that is , is t h e response due t o natural variation o r plant and mine ac t iv i t i e s? The use of control sites outside the projected zone of in- fluence should allow the identification of natural variation contributions t o observed responses and thus permit the identification of man-induced impacts. The question then becomes: is the difference between trace element levels a t the control and monitoring sites after plant operation greater than the dif- ferences between control and monitoring sites before plant operation? Note that the question considers that natural differences may ex is t between primary (potent ia l ly impacted) and control si tes b u t assumes that environntental factors affecting natural trace element considerations a t bo th si tes are the sane. Thus, a change in the difference between trace element concentrations a t primary and
control s i tes ( i .e . , levels of selected trace elements increase at: a greater r a t e a t t he primary s i t e than in the control si te) would indicate a project- related response. To rephrase the question as a null hypothesis t:hat is amenable and appropriate to statist ical testing techniques:
H,: There i s no difference between concentrations of a specif ic t race element a t a specific primary and control site before and d u r i n g Hat Creek facil i ty construction and operation activities.
The s t a t i s t i c a l model u:sed t o t e s t t h i s hypothesis i s known as the two-factor analysis of variance design model. 212 This model permits the comparison of data between two different types of si tes (control and primary) and obtained a t two different times (before and during operation). Experi- mental design considerations for collecting data applicable t o the stated hypothesis, appropriate t o the two-factor design model and comnenr ,urate with the needs of the Hat Creek project, include number and 1ocat.ion o f sampling locations, receptors samples a t each location, trace elements analyzed in each receptor and sampling intensity.
( a ) Number and Location of Sampling Stations
Terrestrial sampling locations are selected t o monitor trace elements emanating from the major potential trace element sources of the Hat Creek project. These major sources are 1 ) leachates from coal, overburden and waste
.I-
# F9-3

rock storage and bottom ash piles; 2) fugi t ive d u s t emissions; 3) cooling tower drift ; and 4 ) stack emissions. Provided adequate samples can be obtained a t each se l ec t ed s i t e , testing of the hypothesis does not require a large number of sampling s i t e s ; t h a t i s , comparisons need only be made between a primary s i t e and a control site. Accordingly, i t i s proposed t h a t primary sites be established in areas of highest projected impact o f each of the above sources (e.g., for stack emission, a primary s i t e would be established i n an area receiving the highest yearly depositional f lux of t race elements). Two control sites located outside of the zone of influence would be su f f i c i en t t o ident i fy existing natural variation. Exis t ing t e r res t r ia l sites 4 (Cornwall Mountain) and 5 (Ashcroft) would be used t o monitor stack emissions and t o serve as a control, respectivelv (Figure F3-1). Location o f si te 2 (Lower Hat Creek) may be amenable t o monitoring both fugitive dust and stack emissions. An additional s i t e would be established near the mine and disposal sites t o monitor leachates and f u g i t i v e d u s t and another control si te would be located outside the primary zone of p ro jec t influence.
The major potential source o f t r ace elements t o aquatic systems i n the area ( i .e. , streams and r ivers ) wi l l be leachate frm material storage and disposal piles. Accordingly, establishment of a sampling s t a t ion on Hat Creek below where any leachate would enter the stream would be s u f f i c i e n t t o ascer ta in the extent of trace element impact from these sources. A s t a t ion on Hat Creek above storage and disposal piles would serve as a control. An- t i c ipa t ion of this monitoring program objective was a primary c r i t e r ion fo r locating existing aquatic’sampling stptions on Hat Creek and these would be used during monitoring activities (Figure F3-1).
It
L
( b ) Receptors Sampled a t Each S i t e
Important considerations i n selecting receptors t o be studied w i t h i n a rigorous monitoring program desion are their amenability t o sampling and a b i l i t y t o provide s t a t i s t i c a l l y sound data ( i . e . , low within-site v a r i a b i l i t y ) . Amenability t o sampling constraints include avai labi l i ty of receptors a t a l l s i t e s and ease of sample col lect ion and preparation. These cr i te r ia genera l ly preclude highly mobile animals from such a sampling program. Moreover, animals
.I - F9-4
I

.I
I
r
im
Ere exposed t o t race elements via a number of routes (e.g., ingelstion, inhalation and absorp t ion) a n d frequently from a number of sources. This resu l t s i n a naturally high variation of trace elements; variation that is d i f f i c u l t t o quantify. By focusing monitoring efforts on vegetation and rajor abiotic receptors such as water, soil and stream sediment, a suf- f i c i en t d a t a base can be obtained t o evaluate effects of mining and power plant act ivi t ies in the Hat Creek area. Furthermore, since the primary intake of trace elements by animals i s v i a the food chain ( in i t i a t ing , of course, with producers), trace element investigations on veget.ation will provide a basis for postulating impacts t o animals. Accordingly, the following receptors that were sampled in the init ial baseline program are proposed for use in monitoring program:
Terrestrial : Aquatic: Soil Water Grass (bunchgrass) Stream sediment Shrub (Sa2i.z sp.) Lichens
Lichens would n o t be sampled a t the ' leachate impact s i te s ince they do not have a soil-based roo t system and would be exposed t o t race elements primarily via absorption on foliar surfaces.
( c ) Trace Elements Analyzed i n Each Receptor
Several t race elements have been identified in previous sections as being of concern because o f the i r re la t ive ly h i g h concentration i n source materials, wide d i s t r ibu t ion , high mobility, and high bioaccumulation and toxic potential in Hat Creek ecosystems. These elements provide the logical focus for a monitoring program and include:
Arsenic Cadmi urn Copper Fluorine Lead Mercury
F9-5

Vanadium Zinc
Monitoring Of other trace. elements, especially d u r i n g early phases of Project Operation, would provide added de ta i l t o the monitoring program. Recornended additional trace elements for monitoring include bornn (water solubleelement t h a t can reach relatively h i g h concentrations in ash basins) , se lenium (his tor ical ly , th is element has received much a t ten t ion a t foss i l fue l Power p l an t s ) , and t i n (abnormally high values were measured i n Hat Creek soi ls , vegetat ion, and animals, see section F5.1.)
I t i s anticipated that any contribution to natural trace element loads in the Hat Creek area from project act ivi t ies wil l be f irst reflected in and perhaps limited t o an increase in levels of the above elements. Accordingly, focusing monitoring efforts on these few, se lec t elements can provide an e f f i c i en t program for evaluating the effect of the Hat Creek project On
trace elements in the Hat Creek environment.
( d l Sampling Intensi ty
. .
The primary c r i te r ion l"n determining sampling intensity i s t h e number of samples required t o identify. a response for a par t icu lar t race element in a specific receptor w i t h a desired amount of confidence., There are three aspects of addressing this cr i ter ion that meri t a t tent ion: 1) what increase in trace element concentrations in receptors due t o the Hat Creek p r o j e c t i s i t impor- t a n t t o detect ; 2) how important is i t t o avoid saying that an increase has occurred when i t actua'lly has no t ( s t a t i s t i ca l Type I e r r o r ) ; 3 ) how important is i t t o avoid saying that an increase has not occurred when i t actual ly has ( s t a t i s t i c a l Type I1 error'). Given the potent ia l toxici ty of trace elements and the degree o f public concern over trace elements, min imiz ing Type 11 e r r o r is o f special concern.
Determining a desired detection l imit for a concentration of a given t race element should logically derive frtm an evaluation of natural trace element levels and determination of potential tolerance and toxic concentrations for receptors o f a given trace element. While information on natural trace element levels is avai lable , s i te-specif ic data on tolerance and toxic con-
F9-E

centrations are not . Accordingly, identification of detection l imits for different trace elements and receptors is a subjective determination based on avai lable l i terature . ':able F9-1 sumnarizes the sample s ize needed t o detect specified responses (50 t o 200% o f baseline levels) of different receptors for some of the trace elements of concern. Sample s izes were determined by testing interactions in the two factor analysis of variance model. 212 Calculation of these sample sizes uti l izes estimates of existing within-site variabil i ty as determined from the October 1976 data. For a l l detection limits, Type I error ( u = 0.05) and Type I1 error ( 8 = 0.05) are minimized.
Sample s izes for most receptors are quite large even t o s t a t i s t i c a l l y detect concentration changes as large as 50%. However, these sample s ize determinations may n o t be tiighly reliable since the estimation of within- s i t e v a r i a b i l i t y was based on a sample s ize of only three replicates. Since an adequate sample siz.e i s germane t o accurate hypothesis testing, i t i s recomended tha t a one-time sampling program be conducted during which 10 repl icate samples of each'receptor are collected a t each o f the primary and control monitoring sites and concentrations o f the aforementioned trace elements are estimated. Cc'mensurate w i t h this sampling program, an infor- mation search would be conducted t o determine desired detection l imits for each t race element in each receptor. This information search w11 u t i l i z e published information and interviews w i t h knowledgeable researchers. The resu l t s of the sampling program and l i terature search would d ic ta te sample sizes applicable t o testing the stated hypothesis and appropriate t o the needs o f the Hat Creek Project.
Subsequent t o establis,hment of re l iab le sample s izes and desired de- tect ion l imits , ' a two-year pre-operational monitoring program i!; suggested with sampling t o be conducted semi-annually, most likely during spring and f a l l . Sampling during eactl season i s precluded by wintertime conditions (burial of s i t e s under snohr, icing of streams, inaccessibility of some sampling locat ions, e tc . ) . Commencing w i t h project construction activit ies, an operational monitoring program requiring spring and f a l l sampling each year would be recomended t.o provide data for comparison with preoperational conditions. Sampling in t e r s i ty could be modified d u r i n g early !stages of
F9-7

.
0.M2
4.87
6 . M
0.W 0.66
1 .as I .01
O.MI 3.70
0.43 2.37
0.06 0.67 2.29
I 3 5 18 I 4
3
6 3 5 2
90 8 24
4
24 7
8 3 01 21 7
zn
20s. 7s 0.01
247.01 4.40 4.69
1.60 7.71
295.20 Z?8.81
4.85 2.61 4.10 I .91
0 . W M 6 3
51 1s 46
S
I 3 61
5 I7 6
I 8 6 1 I 6 16
6 3
6 1

lM.00 139.15 297.60 218.25 0.10 0.22 0.15 0.14
1.47 0.25 0.00
1.90
0.002 O.aX)3
15 1
5 2 2
1
4 1 1 2
2
13
2
8 5 ' 3
2
I7 2
6 3
44 29 9 29 9
4
4 52 I4 11
5
7 6 1
3 2
3 2 2
12- 5


the monitoring program. Results should determine' if the Hat Creek Project i s having any effect on t race element levels in Hat Creek ecosystems.
l e ) Sample Collection, Preparation and Analysis
Sample collection and preparation should u t i l i ze the methodologies o u t - 'lined in Section F3.0. Sample analyses would be performed using atomic ab- :sorption techniques (also dl?fined in Section F3.0).
F9.3 Other Recomnended Studies
Interpretation of t race element monitoring data can be complicated by existing na tu ra l stress conditions on Hat Creek biota. Not only can natural s t ress resu l t in receptors being more susceptible t o t race element injury, i t c,m a l s o cause symptoms tha t can be wrongly at t r ibuted t o trace elements from project act ivi t ies . Moreover, effects of plant operation, such as SO2 emissions, ciin s t r e s s Hat Creek ecosysttm and potentially reduce certain receptors ' re- s.istence t o trace element actmulation and damage. 240 Vegetation stress analyses provide a useful too l for evaluating, a myriad of potential ecological impacts from coal-fired power plant operation and present an additional means fo r identifying the cause of any response i n Hat Creek t race element burdens: Comparison of stress before a n d a f t e r opera t ion of the power p l a n t could support 01' help repudiate various damage claims which are a t t r ibuted t o power plant ac t iv i t i e s .
Color infrared imagery (CIR) of habitats within the projected primary zone of influence of the Hat Creek Project would provide the most obvious in- terpretable indications of vegetation stress. Healthy vegetation shows as red ( the mesophyll layers of a broad leaf reflect near-infrared wavelengths), wt,ile stressed vegetation gives a brown t o s teely blue image. Evaluation of vegetation conditions from the aerial photographs (CIR) could be correlated with a i r qua l i ty data by superimposing air qual i ty isopleths on CIR imagery. Areas i n which vegetation stress or damage corresponded t o areas receiving potentially maximum levels o f pollutants ( i .e . , SO2. trace elements) could then be ident i f ied.

F10.0 GLOSSARY
I
1
m
a -
*
Adjiitive Toxicity - the total toxicity of a mixture; equal t o the sum of the individual toxicities.
A l b u m i n - simple, heat-coagulable, water-soluble proteins t h a t Occur i n blood plasma or serum, muscle, egg whites, m i l k and other p l a n t and animal t issues and f lu ids .
An,,xia - a condition of subnormal blood oxygenation result ing i n permanent damage.
Antagonism - a decrease i n the toxicity o f one element due t o interaction with another element.
Antihelminthic - any drug used t o worm animals.
Antimetabolite - a substance that replaces or inhibi ts the ut i l izat ion of a metabol i te .
ATP - adenosine triphosphate; a chemical species present in cellular systems that supplies energy for many biochemical cellular processes by undergoing enzymatic hydrolysis t o ADP or free P groups.
Atrophy - a decrease in s ize of a body par t or t issue.
Auxins - an organic substance capable i n low concentrations of prclmoting elonga-
Bioaccumulation - the ab i l i t y of an organism t o concentrate elements present in
t i o n of plant shoots and controlling other specific growth effects .
the environment throughout i t s 1 i fetime.
Bioconcentration - the abi l i ty of an organism or population of organisms of the same t r o p h i c level t o concentrate a substance from an aquatic: system.
Biomagnification - a term used when a substance i s found t o exist in successively greater quantit ies at higher trophic levels in ecosystem fooc chains.
Blood Barrier Gap - the single cell barrier between internal blood circulation and external a i r c i rculat ion i n the respiratory tract of an crganism.
Bone Marrow Hyperplasia - a proliferation i n the cell types making up bone marrow.
Cctarrh - i n f l a m t i o n of a ~ I U C O U S membrane especially i n the upper respiratory t r ac t .
Ct,lorosis - a diseased condit.ion of plants marked by yellowing or blanching.
Cirrhosis - f ibrosis of the l iver w i t h hardening caused by excess'ive formation of connective tissue follohled by contraction.
F10-1

Concentration Factor - the r a t i o of the concentration of a material i n a biological species to the concentration o f the mter ia l in water o r in the preceeding link of the food chain.
Conjunctivitis - inflammation o f the mucous membrane that i s associated w i t h the eye.
Corticosteroid - any of various adrenal-cortex steroids.
Cutaneous - o f , re la t ing t o , o r a f fec t ing the sk in .
Cytochrome Oxidase - an iron-porphyrin enzyme important in cell respiration because of i t s abi l i ty to catalyze the oxidat ion o f reduced cytochrome C i n the presence o f oxygen.
Dyspnea - d i f f i c u l t or labored breathing.
Ecchymotic hemorrhage - the escape of blood into the t issues from a ruptured hlnnd vasspl.
Emphysematose foe t i - a fletus delivered dead of emphysema.
Endemic - disease res t r ic ted to a l oca l i t y o r region.
Epigenetic - those elements, introduced into the coal seams during the coali- fication process.
Epithelium - the membranous ce l lu l a r tissue covering a free surface or l ining a tubal cavity o f an animal to enclose and protect the underlying organs.
Erythrocyte - the r e d blood c e l l .
Gill Lamellae - the respiratory organ in fish.
Half Retention Time - the tire i t takes for half of the absorbed element t o be eliminated from the organism.
Hematocrit - the ra t io of volume of packed red blood c e l l s t o volume of whole blood.
Hematopoetic system - responsible for the formation of blood c e l l s i n the l iving body.
Hemoglobin - an iron containing, conjugated protein, respiratory pigment occurring in the red blood c e l l s of ver tebrates ,
Hemolysis - the dis integrat ion of red blood c e l l s w i t h
Hepatic - i n association w i t h the l iver .
Hyperglycemia - abnormal increase of blood sugar.
Hypertonic - having a higher osmotic pressure than the the net movement of solvents o u t of the membrane.
F10-2
l iberat ion of hemoglobin.
surrounding medium causing
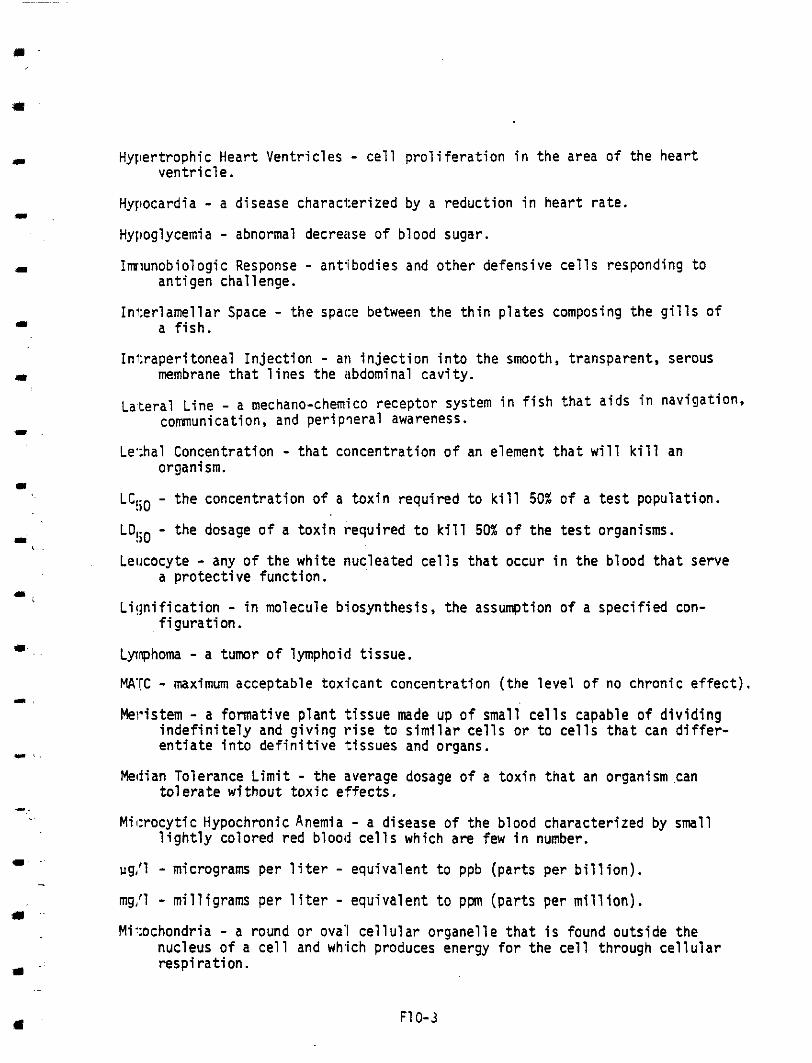
(I
i I
- i
m
-:
( I . ..
Hypertrophic Heart Ventricles - cell proliferation in the area of the heart ventricle.
Hyllocardia - a disease characterized by a reduction in heart ra te .
Hypoglycemia - abnormal decrease of blood sugar.
Imlunobiologic Response - antibodies and other defensive cells responding t o antigen challenge.
Interlamellar Space - the space between the thin plates composing the g i l l s of a f i sh .
Intraperitoneal Injection - an injection into the smooth, transparent, serous
Lateral Line - a mechano-chemico receptor system in f ish that a ids i n n a v i g a t i o n *
membrane t h a t l ines the abdominal cavity.
comunication, and peripqeral awareness.
Le';hal Concentration - that concentration of an element t h a t wi l l k i l l an organism.
LC!io - the concentration of a toxin required to kill 50% of a test population.
LD!iO - the dosage of a toxin required t o k i l l 50% o f the test organisms.
Leucocyte - any of the white nucleated cells that occur in the blood tha t serve a protective function.
Liqnification - in molecule biosynthesis, the assumption of a specified con- figuration.
Lymphoma - a tumor of lymphoid t issue.
MA'rC - maximum acceptable toxicant concentration (the level o f no chronic effect) .
Meristem - a formative plant tissue made up o f small ce l l s capable of dividing
en t ia te i n t o definitive ,tissues and organs. indefini te ly and giving r i s e t o s imilar cel ls or t o ce l l s t ha t can d i f fe r -
Median Tolerance Limit - the average dosage of a t o x i n t ha t an organism .can tolerate without toxic effects.
Microcytic Hypochronic Anemia - a disease of the blood characterized by s ~ l l lightly colored red blood ce l l s which are few in number.
ug,'l - micrograms per l i t e r - equivalent t o ppb (parts per b i l l i on ) .
mg,'l - milligrams per l i t e r - equivalent t o ppn (parts per mil l ion) .
Mi:ochondria - a round or ova'l ce l lu la r o rganel le tha t i s found outside the nucleus of a cel l and wh.ich produces energy for the cel l through ce l lu la r respiration.
I F10-3

Natality - b i r t h ra te .
Necrosis - localized death o f l i v i n g t i s sue .
Neoplasm - a new growth o f tissue serving no physiologic function.
Nephrosis - the death of l i v i n g kidney t issue.
Organelles - a special ized cel lular par t (as a mitochondrion) t h a t i s analogous t o an organ.
a semipermeable membrane o f solvents from a solute t o a solution depending on molar concentration and absolute temperature.
Osmregulation - the regulation o f the pressure produced by the diffusion through
Osteomalasia - a disease characterized by softening'of the bones i n the adul t and equivalent to r ickets i n the imnature.
Osteopetrosis - a disease o f t h e bone characterized by exceptional hardening of the bone tissue.
Pectin - a water-soluble substance which binds adjacent cell walls in plants.
Petechial Hemorrhage - a minute hemorrhagic spot appearing i n the 'skin or mucous membrane.
Phagocytosis - the engulfing and destruction o f particulate .matter by leucocytes i n the blood and surrounding tissue.
Plasma Cortisol - the concentration o f corticosteroids (e.g. , adrenalin) i n the blood plasma.
culating r e d blood c e l l s . Polycythemia - a condition marked by an abnormal increase. in the number of c i r -
Reticulocytosis - a reduction i n the number and type o f re t iculocytes (a wii te blood cel l ) c i rculat ing in the blood.
Reticuloendothelial System - a diffuse system of ce l l s t ha t comprises a l l of the phagocytic cells of the body except the circulating leucocytes.
Small Lymphocytes - a type o f white blood c e l l .
Stomata - small openings i n the surface of leaves that allow gaseous exchange of O2 and C02.
t ranspirat ion i n a plant surface. Stomatal Resistence - the aperture of the stomate opening to allow more or less
Synergism - an increase in the toxicity of a mixture o f elements such tha t i t i s g rea t e r than the sum of the individual toxici t ies .
Syngenetic - coal minerals which are associated w i t h the origin from the original plant material.
t
. . b
F10-4

Teratogenic - tending to cause developmental malfomations and monstrosities.
Testicuiar Hypoplasia - a cel l decrease ( in s ize or number) i n the testes.
TDS0 - a toxic dose which a f fec ts 50% of the organisms tes ted.
TDl 0 - the lowest published toxic dose of an element t o an organism.
TLI” - median tolerance limit.
Toric Concentration - that concentration of an element which has adverse effects upon an organism.
Tritce Element Symbols A1 - aluminum Sb - antimony As - arsenic Ba - barium Be - beryl 1 ium Bi - bismuth B - boron Br - bromine Cd - cadmium Ca - calcium C - carbon Ce - cerium
C1 - chlorine Cs - cesium
Cr - chromium Co - cobalt Cu - copper Dy - dysprosium Er - erbium F - f luorine Gd - gadolinium Ga - gallium Ge - germanium
Ho - holmium Hf - hafnium AU - gold
, -
H - hydrogen I n - indium I - iodine I r - iridium
La - Lanthanum Fe - iron
Pb - lead L i - lithium Mg - magnesium Hg - mercury Mo - molybdenum Nd - neodymium Ni - nickel Nb - niobium
Os - osmium N - nitrogen
0- oxygen Pd - pal 1 adium P - phosphorus P t - platinum K - potassium Pr - praseodymium Ra - radium Rn - radon Re - rhenium
Rh - rhodium
Sm - samarium Rb - rubidium
Se - selenium Sc - scandium
Si - s i l icon Ag - silver
Sr - strontium Na - sodium
Ta - tantalum S - sulfur
Te - tellurium Tb - terbiu:m T1 - thallium Th - thorium Tm. - thul i u m Sn - t i n
. T i - titanium W - tungsten U - uranium V - vanadiuln Yb - ytterbium Y - yttrium Zn - zinc Zr - zirconium
Turmrigenesis - production or the tendency towards production of tumors.
Wiud Rose - the pattern of aerial distribution of elements emitted from a point source.
F10-3

F11 .O LITERATURE CITE0
I
1 . Ruch, R . R . , H.J. Gluskoter and N.F. Sh imp . 1973. Occurrence and distri- bution of potent ia l ly volat i le t race elements i n coal. State Geological Survey Environmental Geological Notes 61 .
2. Abernathy, R . F . , M.J. Peterson, and F.H. Gibson. 1969. Spectrochemical analysis of coal ash for trace elements. United States Burearl of Mines Rep. Investigations 7281.
3. Natusch, D.F.S., J . R . Wallace and C . A . Evans, J r . 1974. Toxic trace elements: preferential concentration i n respirable particles. Science 183~202-204.
4 . Bowen, H.J.M. 1966. Trace elements i n biochemistry. Academic Press, London and New York.
5. Ecology Consultants, Inc. 1975. Final ecological report for the pro- posed Missouri Basin power project. Prepared for Missouri Basin Power Project. Basin Electric 'ewer Cooperative, Bismarck. North Da.kota. 3 vols.
6 . Chapman, H . D . (Ed). 1966. Diagnostic c r i t e r i a fo r p l an t s and s o i l s . University o f California, Riverside, Division of Agricultural Sciences.
7 . Undenrood, E.J. 1971. . TI-ace elements i n human and animal nutri t ion. New Academic Press, N e w York.
8. Valkovic, V . 1975. Trace element analysis. Halsted Press. N e w York. 229pp.
9 . Vinogradov, A . P . 1959. Geochemistry of ra re and dispersed chemical elements i n so i l s ( i n Russian). N e w York Consultants Bureau, Inc.
10. Gough, P . and H.T. Shacklette. 1976. Toxicity of selected elements t o
Western Energy Regions, T h i r d Annual Progress Report, July 1975. Appendix p lan ts , animals, and man .. an outline. I n : Geochemical Surve,y of the
IV United States Department of the Inter ior , Geological Survey.
11. Warren, H . V . , R . E . Oelavault and J . Barakso. 1968. The arsenic content of Douglas f i r as a Guide to some gold, silver, and base metal deposits. Canadian Mining and Metal'urgical Bulletin, July, p.860-866.
12. Vandecaveye, S.C., G . Y . Homer and C.X. Keaton. 1936. Unpr0d:Jctiveness of certain orchard soils as related to lead arsenate spray acc:Jmulations. Soil Science 42:203-215.
13. Christensen, H . E . and T.T. Luginbyhl (eds). 1975. Registry 0.f toxic effects of chemical substances. United States Department of Health, Education, and Welfare, Public Health Service, Center for Disease Control
14. Malacea, I . 1966. Contributions t o knowledse on the toxic effects of cyanides, ammonia, mercury, ana arsenic on some sDecies of fish and daphnia. Studii .Prot.Epur.Apel .EN. 7:751-792.

15.
16.
17.
18..
19.
20.
21.
22.
23.
24.
25.
26.
27.
28.
29.
Boschetti,. X . M . and T.E. McLoughlin. 1957. Toxicity of sodium arseni te t o minnows. Sanitalk 5(4):14-18.
L i l l i e , R.J. 1970. Air pollutants affecting the performance of domestic animals. United States Department of Agriculture, Handbook 1380.
Schroeder, H.A. and J . J . Balassa. 1966. Abnormal trace metals i n man - arsenic. Journal of Chronic Diseases 19:85-106.
Bischoff, 0 . and F . Haun. 1939. Poisoning of domestic animals through copper and arsenic containing f ly dus t . 0eut.Tieraeztl .Wochenschr. 17(28):442-447.
Masek, J . and K. Hais. 1965. The influence of industrial exhalations.
E n t r o l and Uti l izat ion of Sulfur Dioxide and Fly Ash From the Flue Gases In.: Preprints of Zechoslovak Reports, International Symposium on the
of Large Thermal Power Plants . Libl ice House of Sc ien t i f i c Workers. p.201-206.
Baker, O.H. 111. 1973. Mercury:Uptake by the goldfish from low concentrations i n water and i t s t i s sue d i s t r i b u t i o n . NTIS PB-227 462.
Brown, E . R . , J . J . Hazdra, L. Keith, 1. Greenspan and J.B.G. Kwapinski.
t o nonpolluted Canadian water. Cancer Research 33(2):189-198. 1973. Frequency of fish tumors found in a polluted watershed as compared
Borgono, J.M. and R. Greiber. 1971. Epidemiological study of arsenicsm in the c i t y of Antofagasta. In: Ilemphill, D.O. (ed) Trace Substances i n Environmental Health: Proceedings 5 t h Annual Conference Missouri University, p.13-24.
Romney, E.!., J.O. Childess and G.V. Alexander. .1962. Beryllium and the growth of bush beans. Science 135:786.
Tarzwell, C.M. and C . Henderson. 1960. Toxicity of l e s s common metals t o f ishes . Industr ia l Wastes 5:12.
Slonim, C . B . and A.R. Slonim. 1973. Effect of water hardness on the tolerance of the guppy t o beryll ium sulfate. Bulletin of Environmental Contamination and Toxicology 10:295.
!,laniloff, J., J . R . Coleman and M.W. Miller (eds). 1970. Effects of metals on cells, subcellular elements and macromolecules. Charles C . Thomas, Spr ingf ie ld , I l l ino is .
Chemical Society, Washington, O.C. Kothny, E . L . (ed). 1973. Trace elements in the environment. American
Fleischer, X . , A.F. Sarofim, O.W. Fasset t , P. Hammond, H.T. Shacklette, I.C.T. Nisbet and S. Epstein. 1974. Environmental impact of.cadmium: a review by the panel on hazardous substances. Environmental Health Perspectives 1 7 , p.253-323.
Munshower, F.F. 1972. Cadmium compartmentalization and cycling in a grassland ecosystem i n the Deer Lodge Valley, Montana. Ph.0 . Thesis, Missoula, Montana. 114 p p .
Fll-2
c
IL
*c
.-
1 1
"
Ir
L
II
m
I

30.
31.
32.
33.
34.
35.
36.
37.
38.
39.
Hutchinson, T.C. and H . Czyrska. 1972. Cadmium and z i n c toxicity and synergism to f loat ing aquat ic plants . ' Water Pollution Research i n Canada 7: 59-65.
Allaway, W . H . 1968. Agronomic controls over the environmental cycling of trace elements. I n : Norman, A . G . (ed).Advances i n Agronomy V . 20, New York, Academic Przs , p.235-274.
Bazzaz, F.A., G . L . Rolfe, and R . W . Carlson. 1974. Effect of c:admium on photosynthesis and transpiration o f excised leaves of corn and sunflower. Physiolgia Plantarum 32:373-376.
The uptake and some physiological effects of cadmium on corn. Proceedings Koeppe, D . E . , R.J. Miller, R.A. Root, J .E. Bittell and C . Malone. 1974.
o f the 1st Annual NSF Trace Contaminants Conference. NSF, Washington, O . C .
Stecher, P.G. (ed). 1968. The merck index, 8th E d i t i o n . Merc:k and Co., Inc. Rahway, New Jersey. 1713pp.
metals i n the a i r . Nature 5(5301):287-292. Goodman, G.T. and T.M. Roberts. 1971. Plants and s o i l s as indicators of
Doyle, J . J . , W.H. Pfander, S.E. tirebing and J.O. Piercer. 1972:. Effects of dietary cadmium on growth and tissue levels i n sheep. In : Hemphill, 0.0. (&) . Trace Substances i n Environmental Health: Proceedirlgs Yissouri University 6 t h Annual Conference, p.181-1S6.
Mustafa, M . G . and C . E . Cross. 1670. Effects of cadmium i o n or metabolism of l u n g ce l l s . Preprint. International Union of Air Pollutior Prevention Associations. 42pp.
Mlller, H.M. 1971. Metals focus shifts t o cadmium. Environmental Science and Technology 5(9):754-755.
Birge. W.J., J . J . Just , A . Westerman and A . O . Rose. 1974. Sensit ivity of vertebrate embryos t o heavy metals as a c r i te r ion of water quality. Phase I . NTIS PB232-075.
40. Schroeder, H.A. and M . Mitchener. 1971. Toxic effects of trace elements on the reproduction of mice and rats. Archives of Environmental Health 23(2):102-106.
41. Wagner, S.L. 1972. Arsenic and cadmium i n the knvironment. In : Heavy Metals i n the Environment. Proceedings a t a Seminar Conducted'F Oregon State University, Corvallis, Oregon State University Water Resources Research Insti tute Report Seminar WR 016.73. p.45-47.
42. Jul ian, J . 1977. O u t west they ta lked about cadmium. Environmental Science and Technology 11 ( 4 ) : 336-337.
43. Spehar, R . 1974. Cadmium and zinc toxicity to JordaneZla f loridae. N . S . Thesis. University of Minnesota, O u l u t h .
Fll-3

44 *
45.
46.
47.
48.
49.
59.
51.
52.
53.
54.
5 5 .
56.
57.
t o the fathead minnow (BhephazSs promezas). Pickering, Q.H. and M.H. Gast. 1972. Acute
Board of Canada 29:1099.
and chronic toxicity of cadmium Journal of Fisheries Research
Eaton, J.G.. 1974. Chronic cadmium tox ic i ty t o b luegi l l (Levomis macro- chirus rafinesque). Trans American Fisheries Society 103(4):729-735.
Carter , J.W. and I.L. Cameron. 1973. Toxicity bioassays of heavy metals i n water using Tetrahymena pyrifomris. Water Research 7:951-961.
Davies, P.H. and J.P. Goet t l , J r . 1976. Aquatic l i f e - water quali ty
water. Colorado Division o f Wildlife for Water quality Standards recomnendations f o r heavy metal and other inorganic toxicants i n fresh
Revision Comnittee.
Bal l , I.R. 1967. The tox ic i ty of cadmium t o rainbow t rou t . Water Research 1:805-806.
Bilinskf, E. and R.E.E. Jonas. 1973. Effects of cadmium and copper on the oxidation of lactate by rainbow t r o u t ( S a h o gairdneri) gil ls . Journal o f Fisheries Research Board o f Canada 30 (10):1553-1558.
Hil t ibran, R.C. 1971. Effects of cadmium, zinc, manganese and calcium on oxygen and phosphate metabolism of bluegill l iver mitochondria. Journal o f the Water Pollution Control Federation 43(5):818-823.
McIntyre, J.P. 1973a. Effects of metals on f e r t i l i z a t i o n and development i n fish. In: Heavy Metals i n the Environment. Proceedings a t a Seminar conductedTy Oregon State University, Corvall is , Water Resources Research I n s t i t u t e Report Seminar WR 016.73.
. . , . .
Gardner, G . R . and P.P. Yevich. 1970. Histological and hematological responses of an e s tua r ine t e l eos t t o cadmium. Journal o f the Fisheries Research Board of Canada 27:2185-2196.
Nationel Academy o f Science. 1974. Comnittee on biological effects o f atmospheric pollutants. Medical and biological effects o f environmental pol lutants - chromium. FIAS, Washington, D . C .
hexavalent chromium t o sunfish and bluegills. Proceedings 4 t h Industr ia l Klassen, C.W., W.A. Hasfurther and M.K. Young. 1948. The tox ic i ty of
Waste Conference. Purdue University Extension Service 68:229-237.
chromium by trout, Journal of the Water Pollution Control Federation From, P.O. and R.H. Stokes. 1962. Assimilation and metabolism of
34:1151-1155.
Schiffman, R.H. and P.O. From. 1959. Chromium induced changes i n the blood of rainbow t rou t ( S a h o gairdneri). Sewage and Industr ia l Wastes 31 :205-211.
H e m , J.D. 1967. Study and in te rpre ta t ion of the chemical charac te r i s t ics of natural waters. U.S. Geological Survey, Water-Supply Paper No. 1473, United States Department of In te r ior .
Fll -4
Ir
L
I
I
m

58. Becker, D . E . and S.E. S m i t h . 1951. The levels o f cobalt tolerance in yearling sheep. Journal of Animal Science 10:266-271.
59. Shabalina, A.A. 1968, Effects o f cobalt chloride on physiological indices in rainbow trout (.?aZmo nedeus gibbons). Problems o f Ichthyology 8(5):741-747.
60. Peterson, P.J. 1971. Usual accumulations o f elements by plants and animals. Science Progress. Oxford 59(236):505-526.
61. Williams, J.H. 1975. Use of sewage study on agricultural l a n d and the e f fec ts of metals on crops. Water Pollution Control 74(6):635-644.
62. Wu, L. and A . D . Bradshaw. 1972. Aerial pollution and the rapid evolu t ion of copper tolerance. Nature 238(5360):167-169.
63. Hemkes, O.J. and J . Hartmarl. 1973. Copper content i n grass and soi l under copper high-tension Ifnes. Tijdschr. Diergeneesk 98(9):466-49,3.
64. Walsh, L . M . , W . H . Erhardt and H . D . Seibel. 1972. Copper tox ic i ty i n snapbeans (PhaseoZus v u t g m i s ) . Journal o f Environmental Qual i ty l (2) : 197-200.
65. Bell, D . E . and W . H . Rickartl. 1974. Environmental impact monitoring of
west Laboratories, Battelle Boulevard, Richland, Washington. nuclear power plants part 7 , t e r r e s t r i a l ecology. Battelle Pac.ific North-
66. Brungs, W.A., E.N. Leonard and J.M. McKim. 1973. Acute and long-term
o f the Fisheries Research Eioard of Canada 30:583-586. accumulation of copper by t.he brown bullhead, Ictuturus nebutosts. Journal
67. Sharman, J.R. 1969. Laboratory confirmation of acute copper poisoning. New Zealand Veterinary Journal ?7:67-69.
68. Grande, M. 1967. Effect o f copper and zinc on salmonid fishes., Pro- ceedings 3rd International Conference Water Pollution Research, Munich 1966. 1~96-111.
69. Hazel, C . R . and S .J . Meith. 1970. Bioassay o f k i n g salmon eggz. and sac f r y i n copper solutions. California Fish and Game 56:121-124.
70. Mackereth, F.J. and W.J.P. Smyly. 1951. Toxicity of copper i n solution to . .
the stone loach. Nature 168:1130.
71. Brown, V.M. 1968. The calculation of the acute toxicity of mixtures of poisons to rainbow trout . Water Research 2:723-733.
72. Arthur, J.W. and E . N . Leonard. 1970. Effects o f copper on ~amm- ?seudoZimnaeus, %sa in tegm and Ccmpetomu deciswn i n soft water. Journal of the Fisheries Research Board o f Canada 27:1277-1283.
73. Eisler, R. and G.R. Gardner. 1973. Acute tox ic i ty t o an estuar ine te leost ~f mixtures o f cadmium, copDer and zinc salts . Journal of Fish Biology 5: 131-142.
F11-5

74. Donaldson, E.M. and H.Y. Dye. 1975. Corticosteroid concentrations i n sockeye salmon (Oncorhywhus nerka) exposed t o low concentrations of copper. Journal of the Fisheries Research Board of Canada 32:533-539.
75. McKim, J.M., G.M. Christensen and E.P. H u n t . 1970. Changes i n the!.blood of brook t rou t (Satvelimcs fontimlis) after short-term and long-term exposure to copper. Journal of Fisheries Research Board o f Canada 27(10):1883-1889.
76. Se l l e r s , Jr . , C.M., A .G. Heath and M.L. Bass. 1975. The e f f e c t of sublethal concentrations of copper and zinc on vent i la tory ac t iv i ty , blood oxygen and pH i n rainbow t rou t ( S Q ~ O goir&&). Water Research 9:401-408.
77. Paluch, J . and I . Schalenkowa. 1969. Air pollution by f luorine i n Poland and i t s tox ic e f fec t ,on humans, animals and plants. Natutw. Reihe. 19(5): 489-492.
78. Gilbert, O.L. 1973. The effects of airborne fluoride. In: Air Pollution and Lichens. B.W. Ferry, M.S. Baddeley and O . L . HawkswortF(eds). University o f Toronto Press.
79 . Yarnazoe, F . 1970. Effects of hydrogen f luoride on plants ( in Japanese). Journal of Pollution Control 6(7):515-520.
80. Monden, M.Y., Y. Yumiba and A. Tamaka. 1971. Plant damage by a i r pollution (in Japanese). Journal o f Japan Society Safety Engineering 10(4):189-196.
81. HcCune, D . C . , P.J. Temple, and A.M. Witherspoon. 1974. Acceptable limits for air p o l l u t i o n i n dosage and vegetation effects - fluoride. Proceedings 67th Air Pollution Control Association, Paper 74-226.
' 82. Treshow, M . 1971. Fluorides as a i r pollutants affecting plants. Annual Review of Phytopathology 9:21-44.
83. Davidson, A.W. and J. Blakemore. 1976. Factors determining fluoride
Kansfield (ed). CambridgeTniversity Press, Cambridge, London, New York, accumulation i n forage. In: Effects of a i r po l lu t ions on plants. T.A.
Melbourne.
84. Suketa, Y . and T . Yamamoto. 1974. Effect of atmospheric fluoride on plant metabolism. (in Japanese). Journal of Pollution Control 7(5): 427-434.
85. Oaessler, H.G. and S. Boerti tz. 1971. Effects o f a i r po l lu t an t s on agricultural products ( i n German). Biol. Zentralbl. 90(5):611-619.
86. Groth 111, E . 1975. Fluoride pollution. Environment 177(3):29-38.
87. Trautwein, K. and C. Kopp. 1968. Effects of f luorine on c a t t l e under experimental and pract ical condi t ions. Tieraer t t l . Umsch. 22(1):7-8.
88. Waldron, H.A. and 0. Stofen. 1974. Subclinical lead poisoning. Academic Press, New York.
L
L
w
k
1
m
c
Fl l -6
P
~.

1
89.
90.
91.
92.
93.
94.
95.
96.
97
98.
99.
100.
101.
102.
103.
Kerin, 0. 1971. Delimitation of industrial emissions by means Of plant analysis. Protectio Vitae 16(5):201-202.
Holl, W . and B . Hampp. 1975. Lead i n plants. Residue Review 54:79-111.
Bolter, E . , 0. Hemphill, t l . Wixson, 0. Butherus and R . Chen. 1972. Geo- chemical and vegetation studies of trace substances from lead melting. Trace Substances and Environmental Health Proceedings. University Missouri 6 t h Annual Conference, Columbia, Llissouri.
Bovay, E . 1971. Lead deposits on vegetation growing along highways traveled by automobiles. ( i n French) Bull. Eidgenoess Gesuudlieitsamtes Beilaye B. 3:lOl-117.
Bazzaz, F.A., G . L . Rolfe m d P . Windle. 1974. Differing sensit ivity of corn and soybean photosynthesis and transpiration to lead contamination. Journal of Environmental Quality 3(2):156-158.
mining area contaminated w i t h galena. Veterinary Record 86:72B-738. Egan, D.A. and T. O ' C u i l l . 1970. Cumulative lead poisoning in horses i n a
Kariya, T., H . Haga, Y . Haga and K. Kimura. 1969. Studies on the post- mortem identification of the pollutant i n fish k i l l ed by water pollutants - acute lead poisoning. Bulletin of the Japanese Society f o r S d e n t i f i c Fisheries 35:1167-1171.
Haider, G . 1964. Heavy metal toxicity t o f ish. 1. Lead poi!;oning of rainbow trout and i t s symptoms. Zeitschrift Fur Angewandte Zoologie 51: 347-368.
Saville. 1971. Lead po i son ing i n horses. Archives of Environmental Schmitt, N . , G . Brown, E.1.. Devlin, A.A. Larson, E . D . McCausland and J . M .
Health 23:185-197.
Liegeois, F., J . Derivaux and A. Depelchin. 1961. Lead poisoning i n animals ( i n French). Ann. Med. Veterinare 105:57-81.
Aronson, A . L . 1971. Biologic effects o f lead i n domestic animals. Journal of the Washington Academy of Science 61(2):110-113.
Stoefen, 0. 1969. Lead-induced fe ta l a l te ra t ions i n grazing ca t t l e . ( i n German) Zuchthygiene 4(4):169-173.
Carson, T.L., G.A. Vangelder, G . C . Karas and W.B. Buck. 1974. Slowed learning i n lambs prenatally exposed t o lead. Archives of Environmental Health 29(3):154-156.
w i l d pheasant. Californir Fish a n d Game. Hunter, B.F. and N . R . Merton. 1965. Occurrence of lead poisoning i n a
Del Bono, G. and S . Sivier i Buggiani. 1971. Toxicological re!;earch on ducks experimentally intoxicated by lead. Atti. Sco. I t a l . Sc.i. Vet. 25:358-361.
F11-7
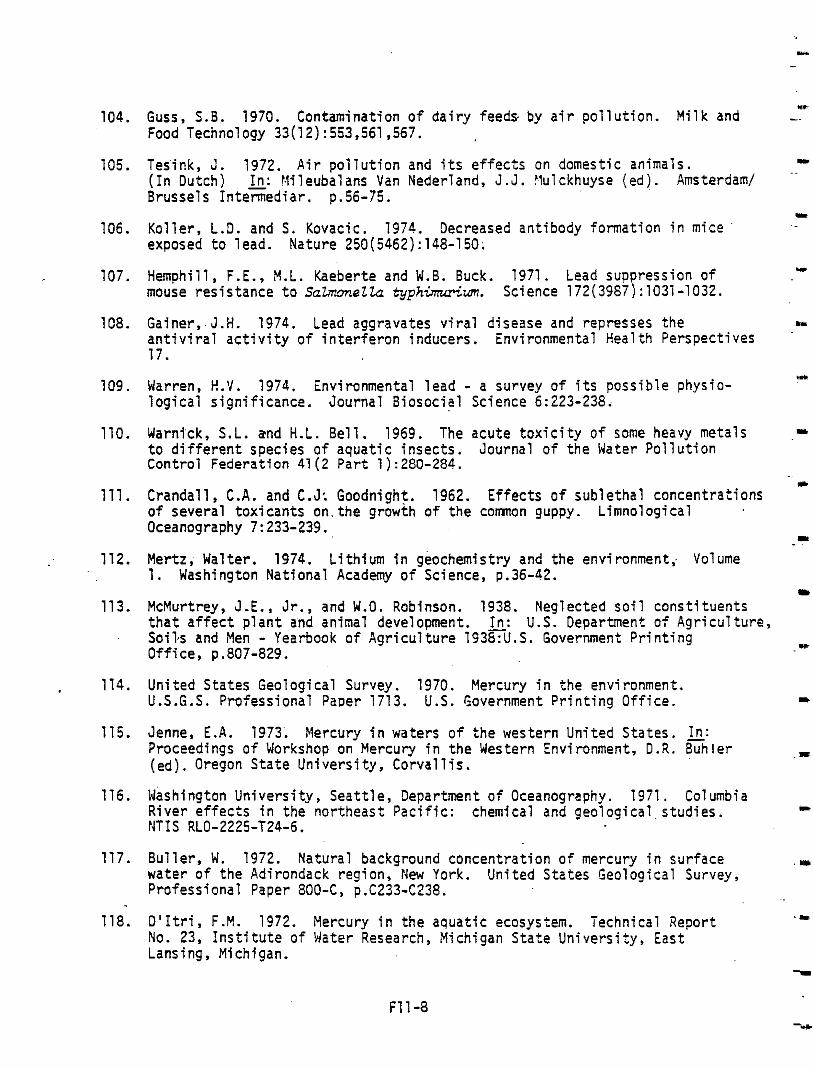
104. Guss. S.B. 1970. Contamination o f d a i r y f e e d s b y a i r p o l l u t i o n . M i l k and Food Technology 33(12):553,561,567.
105. Tesink, J. 1972. Air p o l l u t i o n and i t s e f f e c t s on domestic animals. ( I n Dutch) In: Mi leubalans Van Nederland, J . J . Yulckhuyse (ed). Amsterdam/ B r u s s e l s I n t e x e d i a r . p. 56-75.
106. Kol ler , L.D. and S. Kovacic. 1974. Decreased an t ibody fo rmat ion in m ice exposed t o lead. Nature 250(5462):148-150;
107. Hemphil l , F.E., M.L. Kaeberte and W.B. Buck. 1971. Lead suppression of mouse r e s i s t a n c e t o SaZmoneZta typhimurium. Science 172(3967):1031-1032.
108. Gainer,.J.H. 1974. Lead aggravates v i r a l d i s e a s e and represses the a n t i v i r a l a c t i v i t y o f i n t e r f e r o n i n d u c e r s . E n v i r o n m e n t a l H e a l t h P e r s p e c t i v e s 17.
109. Warren, H.V. 1974. Environmental lead - a survey o f i t s poss ib le phys io- log ica l s ign i f i cance. Journa l B iosoc ia l Sc ience 6:223-236,
110. Warnick, S.L. and H.L. B e l l . 1969. The a c u t e t o x i c i t y o f some heavy metals t o d i f f e r e n t s p e c i e s o f a q u a t i c i n s e c t s . J o u r n a l o f t h e Water P o l l u t i o n Control Federat ion 41 (2 P a r t 1 ) :280-284.
111. Crandal l , C.A. and C.J: Goodnight. 1962. E f fec ts o f subletha l concentrat ions o f severa l tox icants on. the growth o f the comnon guppy. Limnological Oceanography 7:233-239.
112. Mertz, Walter. 1974. L i t h i u m i n g e o c h e m i s t r y and the environment; Volume 1. Washington National Academy o f Science, p.36-42.
113. McMurtrey, J.E., Jr . , and W.O. Robinson. 1938. Neglected s o i l c o n s t i t u e n t s t h a t a f f e c t p l a n t and animal development. I n : U.S. Department o f A g r i c u l t u r e , Soi1.s and Men - Yearbook o f A g r i c u l t u r e 1 9 3 r U . S . Government P r i n t i n g O f f i ce , p.807-829.
114. United States Geological Survey. 1970. Mercury i n t h e environment. U.S.G.S. Professional Paper 1713. U.S. Government P r i n t i n g O f f i c e .
115. Jenne, E.A. 1973. Mercury i n waters o f the western Uni ted States. k: Proceedings o f Workshop on Mercury i n t h e Western Environment, D . R . Buhler (ed). Oregon S t a t e U n i v e r s i t y , C o r v a l l i s .
116. Washington un ivers i ty , Seat t le , Depar tment o f Oceanography. 1971. Columbia
NTIS RLO-2225-T24-6. R ive r e f fec ts i n t he no r theas t Pac i f i c : chemica l and geologica1,s tud ies.
117. B u l l e r , W. 1972. Natural background concentrat ion o f mercury i n sur face water o f the Adi rondack reg ion, New York. United States Geological Survey, Professional Paper 600-C, p.C233-C238.
118. D'Itri, F.M. 1972. Mercury i n t h e a q u a t i c ecosystem. Technical Report No. 23, I n s t i t u t e o f Water Research, Mich igan State Univers i ty , East Lansing, Michigan.
"
.*
...
L
1
I
z
. m
-c
Fl l -8

a
1
1
119.
120.
121.
122.
123.
1'24.
125.
126.
127.
I l l ino is University. 1971. Environmental p o l l u t i o n by lead alid other metals. Illinois University, Graduate College, Urbana, I l l i no i s .
Sumer, A . K . , J.G. Saha and Y . W . Lee. 1972. Mercury residues i n f i sh from Saskatchewan waters w i t h and without known sources o f pollution. Pesticides Honitoring Journal 6(2):122-125.
Boulton, P. and L.J. Hetling. 1972. A s ta t i s t ica l ana lys i s o f the mercury content o f fresh water fish in New York Sta te . New York State Department of Environmental Conservation, Albany. Environmental Quality Research and Development U n i t .
atmosphere or from the substrate, Chemosphere 1:55-60. Huckabee, J.W. 'and S.A. Janzen. 1975. Yercury i n moss: derived from the
Chemistry 22:122-127. Dieman, W.T. 1970. On the action of mercury on vegetable l i f e . Analytical
Matson, R.S., G.S. Mustoe and S.B. Chang. 1972. Mercury inhihition on lipid biosynthesis i n freshwater algae. Environmental Science and Tech- nology 6(2):158-160.
Harriss, R .C . , 0.6. White and R.B. Macfarlane. 1970. Mercury compounds reduce photosynthesis by plankton. Science 170:736-737.
Hannan; P.J. and C . Patouillet . 1972. Effect of mercury on algal growth ra tes . Biotechnology and Bioengineering 14:93-101.
Nuzzi, R. 1972. Toxicity of mercury to phytoplankton. Nature 237(5349): 38-39.
128. Wojtalik, T.4. 1971. Accumulation of mercury and i ts compounds - 1970 l i t e r a tu re review - water oollution. Water Pollution Control Federation Journal 43(6):1280-1292.
129. Garcia, J.D. 1973. A study of mercurials i n the Elephant Butte Reservoir ecosystem. Ph.D. Dissertation, New Mexico University, Albuquerque, N e w Mexico. NTIS PB 227-458.
130. Adam, W.J. and H.H. Prince. 1972. Survival and reproduction of ring- necked pheasants consuming two mercurial fungicides. h: Environmental Mercury Contamination, Ann Arbor Science Publishers, Inc. p.306-317.
131. Stoewsand, G.S., J.L. Anderson, W . H . Gutenmann, C . A . Bache and D.J. Lisk. 1971. Eggshell t h i n n i n g in Japanese quail fed mercuric chloride. Science 171(4001):1030-l031.
132. Parkhurst, C . R . and P . Thaxton. 1973. Toxicity o f mercury to young chickens, e f fec t on growth and morta'lity. Poultry Science 52(1):273-276.
133. Evans, H . L . , V . G . Laties and 8. k'eiss. 1976. Behavioral effects of methylmercurv. Proceedings of the 1 s t Annual NSF Trace Contami,iants Conference. National Science Foundation,. !Jashington, D . C .
P "
F l l - 9

1
134.
135.
136.
137.
138.
139.
140.
141.
142.
143.
144.
145.
146.
147.
148.
Aulerich, R . J ., R. K. Ringer and S. Iwamoto. mercury on mink . Archives of Environmental 2(1):43-61.
197,4. Effects of dietary Contamination and Toxicology
Dean, R.B. Feb. 20-23, 1972. The case against mercury. NTIS PB-213 692.
Charbonneau, S.M., I.C. Munro, E.A. Nera, R.F. Willies, and T. Kuiper- Goodman. 1974. Subacute tox ic i ty of methylmercury i n the adul t cat . Toxicology and Applied Pharmacology 27(3):569-581.
and effects. In: Mercury in the Environment. Chemical Rubber Company Skerfving, S. 1972. Organic mercury compounds - re lat ion between exposure
Press, p .141-1a .
Huckabee, J.W. and B.G. Blaylock. 1974. Microcosm studies on the t ransfer of mercury, cadmium and selenium from t e r r e s t r i a l t o aquatic ecosystems. Eithth Annual Conference of the Trace Substances in Environmental Health Proceedi ngs , p. 21 9-222.
Lesperance, L.W. 1971. Mercury pol lut ion: Interest i n i t now on the upswing. Water and Wastes Engineering, Jan. 1971, p.A-13.
McIntyre, J.D. 1973b. Toxicity of methyl mercury for s teelhead t rout
99. sperm. Bulletin of Environmental Contamination and Toxicology 9(2):98-
H i n t o n , O.F., M.W. Kendall and J.C. Koenig. 1973. Enzyme and tissue a l te ra t ions in fishes: A measure of water quality. University of Kentucky Water Resources Research I n s t i t u t e Research Report 168.
Lindahl, P.E . and E.S. Schwanbon. 1971. A method for the detection and quantitative estimation of sublethal poisoning i n l i v i n g fish. Oikos 22(2):210-214.
National Academy o f Science. 7975. Committee on medical and biological e f fec ts of environmental pollutants - nickel. NAS, Washington, D . C .
Schroeder, H.A. , J.J. Balassa and I.H. Tipton. 1962. Abnormal t race elements i n man - nickel . J . Chron. Dis. 15:51-65.
T i f f in , L.O. 1971. Translocation o f nickel i n xylem exudate of plants . Plant Physiol. 48:273-277.
LLoyd, R . 1965. Factors which a f f ec t the tolerance of f ish t o heavy metal
United Statei-Department o f Health, Education and Welfare, August 13-17, poisoning. In: Biological Problems in Water Pollution, Third Seminar,
1962. Public Health Service 999-WP-25, 181-186.
Copeland, R. 1970. Selenium: the unknown pollutant. Limnos 3(4):7-9.
Lakin, H.W. 1972. Selenium accumulation in so i l s and i ts absorpt ion by plants and animals. &: Cannon, H . L . and H.C. Hopps, (eds) Geochemical Environment i n Relation t o Health and Disease: Geological Society of America Special Paper 140:45-53.
Fll-10

149.
150.
151.
152.
153.
154.
155.
156.
157
158.
159.
Gough, L . P . and J.A. Erdrrian. 1976. Elements i n lichen near the Dave
United States Department of the Interior, Geological Survey. Johnson power plant. Geochemical Survey of the Western Energy Regions.
Sauchelli, V . 1969. Trace elements i n agriculture. N e w York, Van Nostrand Reinhold Co. 248pp.
Nemenko, B . A . , M.K. Moldakuiova and S.N. Zorina. 1976. Incidence o f esophageal cancer i n the Guryev oblast depending on the mineral composition of the d r i n k i n g water. Vopr Onkal (Leningrad) 22(9):75-76.
Witkowska, 0. 1975. The e f f ec t of stable strontium i n young and adult rabbit bones. Acta Physiol Pol 26(4):407-418.
Zyuzyukin, Y . V . 1974. Toxic properties o f inhaled strontium nitrate. GIG Sanit 8:99-100.
Zyuzyukin, Y . U . and T.A. Milushkina. 1973. Local e f f ec t o f . s.trontium compounds. GIG Sanit 38(12):100-101.
Zyka, V. 1972. Thallium i n plants from Alsar. Sbornick Geologickych Ved. Ted Geochem. 10:91-95.
Zitko, V., W.V. Carson and W.G. Carson. 1975. Thallium: ocwrrence i n
and Toxicology 13(1):23-30. the environment and tox ic i ty t o fish. Bulletin o f Environment,al Contamination
Schwarz, K. 1974. New essential trace elements (Sn,V,F,Si): progress report and outlook. In: Hoekstra, W.G. (Ed) . Trace Element Metabolism i n Animals - 2. University Park.Press, Baltimore. p.358-361.
Wakashin, K. 1975. Experimental studies on the toxicity of organic t i n
Medical College 33(4):573-596. compounds: morphology of the butyl-tin intoxication. Journal Tokyo
Akad Nauk Turkm SSR Ser Biol Nauk 1:93-94. Charyev, O.G. 1975. Effsect of t r ie thyl t i n chloride on animals. Izv
160. Seinen, W . and M.I. Willems. 1976. Toxicity of organo t i n ccmpounds. Atrophy of thymus and thymus dependent lymphoid t i s sue i n r a t s fed di-n-octyl t i n chloride. Toxicology and Applied Pharmacology 35(1):63-75.
161. Scharrer, K. and W . Schro’Jp. 1935. “Uber die wirking des vanadium auf k u l turp flanzen.” Pflanze~~ernahr. Dung. Bodenk. 37:196-202.
162. C h i u , T . F . 1953. The effect of vanadium application on paddy rice. Agriculture Research (Formosa), 4(2):48-59.
163. Cannon, H . L . 1963. The biogeochemistry of vanadium. Soil Science 96(3): 196-204.
164. Schroeder, H . A . , J . J . Balassa and I.H. T i p t o n . 1963. Abnormal trace metals i n man - vanadium. Journal of Chronic Diseases 16:1047-1071.
F11-11

165. Lee, R . E . , S.S. Goranson, R.E. Enrione and G.B. Morgan. 1972. National air surveil lance cascade impact network. Size.dis t r ibut ion measure- ments of t r ace metal components. Environmental Science and Technology 6:1025.
166. Durum, W.H. and J . Haffty. 1963. Geochium. Cosmochim. Acta 27:l.
167. Patterson, M.R. , J.B. Mankin and A.A. Brooks. 1974. Overview of a uni f ied transport model. Proceedings o f the First Annual NSF Trace Con- taminants Conference. National Science Foundation, Washington, D . C .
168. Ernst, W . 1972. Zinc and cadmium pol lut ion of soi ls and plants i n the v i c in i ty of a zinc smelting plant. (in German). Bert. 9eut. Bot. Ges. 85(70):295-300.
169.
170.
171.
172.
173.
174.
175.
176.
177.
Weaver, T . and 0. Brock. 1972. Ecological e f f ec t s of weather modification effects of s i l v e r n i t r a t e on plant growth. Proc. Mont. Acad. Sci. 32:27-30.
Kusaka, S . , M. Maekawa and S. Sono. 1971. Toxicit ies of heavy-metals on crops. Toxicities of excess zinc, nickel, chromium, and titanium on t u r n i p plant. Hyogo Kenritsu Nogyo Shikenjo Kenkyu Hokoku 18:71-74.
Jordan, M.J. and M.P. Lechevalier. 1975. Effects of z inc smelter emission on forest soi l microf lora 21(11):1855-1865.
Environmental P o l l u t i o n . 3:17-24. Purves, 0 . 1972. Consequences o f t r ace element contamination o f s o i l s .
Janda, J . 1972. Toxicity of zinc phosphide t o pheasants and partridges and i t s decomposition under natural conditions. Sci. Agr. Bohomeslov 4(4) : 307-31 6.
Gasaway, W.C. and 1.0. Buss. 1972. Zinc tox ic i ty i n the mallard duck. Journal of Wildlife Management 36(4):1107-1717.
Lebetseder, J . , !I. Shalicky, A . H . Said, A. Kment, E. Galwischng and G. Schlerka. 1972. Investigations of toxic effects i n c a t t l e from hay harvested on smoke damaged f i e l d . ( i n German), Erzmetall 23(10):498-505.
Valee, B.L. 1959. Biochemistry, physiology and pathology of zinc. Physiological Reviews 39:443-490.
PimepkaZes promeZas rafinesque. Transactions of the American Fisheries Brungs, W.A. 1969. Chronic tox ic i ty of zinc to the fathead minnow,
Society 98:272-279.
178. Sprague, J.B. and B.A. Ramsey. 1965. Lethal levels of mixed copper-zinc solutions for juvenile salmon. Journal of the Fisheries Research Board of Canada 22(2):425-432.
179. Sprague, J.B. 1964. Lethal concentrations of copper and z inc for young Atlant ic salmon. Journal o f the Fisheries Research Board of Canada 21: 17-26.
180. Sprague, J.B., P .F . Elson and R . L . Saunders. 1965. Sublethal copper-zinc pollution i n a salmon river - a f i e l d and laboratory study. Second Inter- national Conference on Water Pollution Research, Tokyo 1964 1:61-82 and 99-102.
I
”
r
- ”
I
”
II
c
L
.C
Fll-12 .c

181. De L . G . Solbe, J.F. 1974.. The toxicity of z inc sulfate to minbow t rout in very hard water. Water Research 8:389-391.
182. Lloyd, R. 1961. Effect of dissolved oxygen concentrations on the toxicity of several poisons t o rainbow trout (Scimo gairdner i ) . Journiil of Experi- mental Biology 38:447-455.
183. Nehring, R . B . and J.P. Goettl. 1974. Acute tox ic i ty of a zinc-polluted stream t o four species o f salmonids. Bulletin of Environmental Contamination and Toxicology 12(4):464-469.
184. Herbert, D . W . M . and D.S. Shurben. 1963. A preliminary study of the effect of physical activity on the resistance of rainbow t rou t t o t w c l poisons. Annals of Applied Biology 52:321-326.
185. Brown, V.M. and R . A . Dalton. 1970. The acute lethal t o x i c i t y t o rainbow t r o u t o f mixtures of copper, phenol, zinc and nickel. Journal of Fish Biology 2:211-216.
186. Skidmore, J.F. 1964. Toxicity of zinc compounds to aquatic animals. Quarterly Review o f Biology.
187. Sinley, J.R., J.P. Goettl, Jr . and P.H. Davies. 1974. The e f fec ts of zinc on rainbow trout i n hard imd s o f t water. Bulletin of Environmental Con- tamination and Toxicology 12(2):193-201,
188. Eaton, J.G. 1973. Chron.ic toxicity o f a copper, cadmium and zinc mixture t o the fathead minnow (PimephaZes promeks rafinesque). Water Research , 7: 1723-1 736.
189. Screenivasan, A. and R.S. Raj. 1963. Toxicity o f zinc t o fish. Current Science 32:363.
190. Whitley, L.S. 1968. The resistance o f tubificid worms t o three comnon pol lu tan ts . Hydrobiologita 32:193-203.
191. Dorfman, P . and W . R . Whitworth. 1969. Effects o f fluctuations of lead, temperature and dissolved oxygen on the growth o f brook trout. Journal Fisheries Research Board o f Canada 26:2493-2501.
192. McKee, J.E. and H.W. Wolf. 1963. Water quali ty cri teria. 2nd Ed., Ca l i - fornia State Water Quality Board Publication No. 3-A, Sacramento.
193. Radian Corporation. 1975. Coal f i red power plant trace elmerlt study.
194. Klein, D . H . , A . W . Andren, ' J .A . Carter, J.F. Emery, C . Feldman, W . Fulkerson,
Prepared for EPA Region VI11 by Radian Corporation, Austin, Texas. 3 volumes.
W.S. Lyon, J.C. Ogle, Y . T831mi , R . L . Van Hook and N. Bolton. 1975. Pathways o f thirty-seven trace elemlwts throuoh a coal f ired power plant. Environmental Science and Technology 9(10):973-979.
Fll-13

195. Jenne, E.A. 1970. Atmospheric and f luvial t ransport of mercury. In: Mercury in the Environment. U.S. Geological Survey Paper 713, WashGgton,
IC
D.C., p.40-49. -
196. B.C. Research and Dolmage Campbell and Associates. 1975. Preliminary .. environmental impact study of the proposed Hat Creek development.
Bri t ish Columbia Hydro and Power Authority, Vancouver, B.C. 183pp. -
197. Bohn, H.L. 1972. Soil absorption o f air pollutants. Journal Environmental It
Quality 1(4):372-377.
198. Lee, G.F. 1975. Role of hydrous metal oxides i n the transport of heavy metals in the environment. In: Heavy Metals in the Aquatic Environment. P.A. Kreukel (ed). P e r g a m o n r e s s , N e w York. p.137-147.
I
199. Wood, J.Y. 1975. Metabolic cycles for toxic elements in the environment. II
~
In: Heavy Metals i n the Aquatic Environment. P.A. Kreukel ( ed ) , Pergammon Fess , N e w York. p.105-112.
L
200. Hutchinson, G . E . 1975. A t r e a t i s e on limnology, Volume iV. Limnological -.
Botany. John Wiley and Sons, N e w York. 660pp.
201. Miettinen, J.K. 1975. The accumulation and excretion of heavy metals i n m
organisms. I n : Heavy Metals i n the Aquatic Environment. P . A . Kreukel (ed.) , PergaRon Press, N e w York. p.155-166.
202. Van Hook, R.I., B.G. Blaylock, E.A. Bondietti,.C.W. Francis, J.W. Huckabee, D.E. Reichle, F.H. Swetton and J.P. Witherspoon. 1976. Radioisotope 'techniques in .del ineat ion o f environmental behavior of cadmium. Environmental Qual i ty .. and Safety 5:167-181, ..
203. Miller, J .E. , J .J . Hassett and D . E . Koeppe. 1977. Interactions o f lead and cadmium on metal uptake and growth of corn plants. Journal of Environmental Quality 6(1):18-20.
204. James, P.W. 1973. The e f f ec t of air pollutions other than hydrogen f luoride
M.S. Bradley and D.L. Harobswortr(eds.), University of Toronto Press, and sulfur dioxide on l ichens. In: Air Pollution and Lichens. B.W. Ferry,
Toronto. p . 143-1 75.
205. Krumtolz, L.A. and R.F. Foster. 1957. Accumulation and retention of radio-
organisms. National Academy of Sciences Publication 551. Washington, D.C. a c t iv i ty from f i ss ion products and other radiomaterials by freshwater
88PP - 206. Goettl, J.P., J.R. Sinley and P.H. Davies. 1974. Long term accumulation
of copper in rainbow t r o u t . I n : Water Pollution Studies. Studies of the Effects of Metal. Ions on n sh and Aquatic Organisms. Job Progress
Wildlife, Fort Collins, Colorado. p.50-61. Report F-33-R-9. Department of Natural Resources and Colorado Division of
207. Schutte, K.H. 1964. The biology of the trace elements, their role in nutri t ion. J .P. Lippincott Co., Philadelphia. 288pp.
Fll-14

208. Reimers, R.S., P.A. Kreukel, 11. Eagle and G. T r a g i t t . 1975. Sorpt ion phenomenon i n the organics o f bot tom sediments. In : Heavy Yetals i n the Aquatic Environment. P.A. Krenkel (ed.), PergamoFPress, New ''ark. p.117-129.
209. Krauskopf, K.B. 1956. Fac to rs con t ro l l i ng t he concen t ra t i on o f t h i r t een r a r e elements i n seawater. Geochim. Cosmochim Acta 9:l-32.
210. Palmer, R.F. 1958. Radioisotopes i n r a t s exposed t o r e a c t o r e f f l u e n t water. Hanford Biology Research, Annual Report f o r 1957. O f f i c e o f Technical Services, U.S. Cepartment o f Comerce. Washington, [).C. p.189-190.
211. Lackey, J.B. 1959. S h e l l f i s h and rad ioact iv i ty . Engineer ing Progress 13: l l .
212. G r a y b i l l , F.A. 1976. Theory and a p p l i c a t i o n o f t h e l i n e a r model. Duxbury Press, North Scituate, Massachusetts. pp.564-569.
213. P h i l l i p s , R.T. and W.M. Wells. 1974. Solid waste disposal. f ladian Corporation Report tPB-233.
214. Freedman, W.R. and R.M. Peterson. 1971. Science 172:1027-1028.
215. B i l l i n g s , C.E., A.M. Sacco, W.R. Matron, W.R. G r i f f i n , W.R. Ceri igl io, R.A. Harley. 1975. Journal Air Po l lu t ion Cont ro l Assoc ia t ion 23:773.
216. Kalb, G.W. and C. Ba ld ick. 1975. A de te rm ina t ion o f an Ha mars balance a t a c o a l - f i r e d power plant. Tra-Det Labs, Columbus, Ohio, EPA Contract 858-02-0225.
217. Andren, A.W., D.H. K l e i n and Y . ~ Talmi. 1975. Selenium i n c o a l - f i r e d steam plant emissions. Environmental Science and Technology 9:9(856:'.
218. Agate, J.N., e t a l . 1949. I n d u s t r i a l f l u o r o s i s . A s tudy o f t he haza rd t o man and animals near Ft. Wil l iams, Scotland. A r e p o r t t o t h e f l u o r o s i s com- mission, Medical Research Council Memorandum 22. H is Ma jes ty 's S ta t ionery O f f i ce , London. 131pp.
219. Treshow, M. 1969. Symptomology o f f l u o r i d e i n ju ry on vegetatjon. I n : Handbook o f E f f e c t s Assessment: Vegetation. N.L. Lacasse and W.J. K r o z (eds.)
Park, Pennsylvania. pp.XII-1 - XII-41. Center f o r Air Environmental Studies. Pennsylvania State Universi ty, Universi ty
220. Thomas, M.D. 1958. Air p o l l u t i o n w i t h r e l a t i o n t o agronomic c:rops. P a r t I : genera l s ta tus o f research on t h e e f f e c t s o f a i r p o l l u t i o n on p lan ts . Agronomy Journal 50:545-550.
221. McCune, D.C. 1969. On t h e e s t a b l i s h m e n t o f a i r q u a l i t y c r i t e r i a w i t h r e f e r e n c e t o t h e e f f e c t s o f a t m o s p h e r i c f l u o r i n e on vegetat ion. Air Oua l i t y Monograph 69-3. New York Petroleum Inst i tute. 33pp.
222. Nat ional Academy o f Sciences. 1971. B io log ica l e f fec ts o f a tmospher ic po l - l u t i o n : f l u o r i n e . NAS, Washington, D.C. 295pp.
223. Hitchcock, A.E., P.W. Zimrrerman, and R.R. Coe. 1962. Results of ten years work (1951-1961) on t h e e f f e c t o f f l u o r i n e on g lad io lus . Con t r i bu t i ons t o t he Boyce Thompson I n s t i t u t e 21 :303-344.
F l l - 1 5

224.
225.
226.
227.
228.
229.
230,
231.
232.
233.
234.
235.
236.
- I
Witchcock. A . E . , P.W. Zimnenan, and R.R. Coe. 1963. The e f f ec t of f luorine . -.
22:175-206. On milo maize (sorpn sp.), Contributions t o the Boyce Thompson I n s t i t u t e - w o l b , 5.5. 1964. Dis t inc t ive e f fec ts of root versus leaf acquired fluorine. Proceedings Florida State Horticultural Society 77:516-517.
Jacobson, J.S,, L.A. Weinstein, D.C. McCune and A . E . Hitchcock. 1966. The accumulation of fluorine by plants. Journal Air Pollution Control Association 16:412-416.
Ledbetter, M.C., R. Mazr ineaou, and A . Meiss. 1960. Distribution s tudies of radioactive F@ and s t ab le F1d i n tomato plants. Contributions to the Boyce Thompson I n s t i t u t e 20:331-348.
m
- I
Maienthal, E.J. and D.A. Becker. 1976. A survey on cur ren t l i t e r a - ture on sampling and sample handling fo r environmental materials and long term storage. Interface 5 (4):49-61.
Laitinen, H.A. 1975. Analytical techniques fo r heavy metals 'other than mercury. In: Heavy Metals i n the Aquatic Envi ronment , P.A. Krenkel (ed.) , Ergamon Press, New York. p . 73-60.
Christian, G.D. and F.J. Feldman. 1970. Atomic absorption spectro- scopy: applications in agriculture, biology, and medicine. Wiley- Interscience, New York. 490 pp. .c
Ahearn, A.J. 1972. Trace analysis by mass spectrometry. Academic Press, New York. 460 pp. e
British Columbia Hydro and Power Authority. 1977. Hat Creek project power plant conceptual design report . Vancouver, B..C. pp. discont.
HcBride, J.P., R.E. Houre, J.P. Witherspoon, and R.E. Blanco. 1977. Radiological impact o f a i rborne eff luents o f coal-fired and nuclear
Tenn. 43 pp. power plants. ORIIL-5315. Oak Ridge :!ational Laboratory. Oak Ridge, L
L
T i t l e 10, Part 50, Appendix I , Code of Federal Regulations, Revised January 1, 1976. p. 293-296.
British Columbia Hydro and Power Authority. 1977. Preliminary report bulk sample program f o r Hat Creek Project. Vancouver, 6.C. I
Environmental Research & Technology, Inc. 1977. The f e a s i b i l i t y of a meteorological control system versus a f lue gas desulfurization system fo r the Hat Creek thermal generating plant. ERT Doc. No. P-5074. Xestlake Village, California. 4.6 pp.
m
1 .
I
F
F11-16
237.
236.
239.
240.
;:41.
242.
243.
244.
245.
246.
247.
Weinstein, L . H . 1977,. Fluoride and p l a n t ' l i f e . Journal of Occupational Medicine 19 (1):49-78.
w i t h reference to the effects of atmospheric fluorine on vegetation. McCune, D . C . 1969. On the establishment of a qua l i ty c r i te r ia
Air Quality Monograms 69-3. New York. 33 pp.
Hitchcock, A . E . , D . C . McCune, L.H. Weinstein, D.C. MacLean, J.S. Jacobsen, and R . H . Mandl. 1971. Effects of hydrogen fluorine fumigation on a l f a l f a and orchard grass: a summary of experiments from 1952 through 1965. Contributions from Boyce Thompson Ins t i t u t e 24(14): 363-386.
Mandl, R . H . , L . H . Weinstein, and M. Keveny. 1975. Effects of hydrogen fluoride and sulfure dioxide alone and i n combination on several species of plants. Environmental Pollution 9:133-143.
Beak Consultants, L t d . 1978. The hydrology, drainage, an'i water quali ty and use report:. Vancouver, B . C . pp. discont.
Study f o r Hat Creek Power Project. Vancouver, B.C. pp. d.iscont. British Columbia Hydro and Power Authority. 1978. Water Management
British Columbia Hydro and Power Avthority. 1977. Hat Creek Project, Power Plant Description. Revision F. Vancouver, B . C . pp,. discont.
Chamberlain, A . C . 1960. Aspects of the deposition o f radioactive and other gases and particles. International Journal o f Air Pollution 3:63-68.
Canadian Combustion Research Laboratory. 1977. Pilot-scale combustion studies w i t h Hat Creek coal. B.C. Hydro-CANMET joint research project. ERL Report 77-96 (TR) . 2 volumes. 671 pp.
Western Research & Development. 1978. Trace element material balance fo r Hat Creek coal t e s t burn . WR&D Ref. 3463-R1. Calgary, Alberta. pp. discont.
Acres Consultants Services, L t d . 1978. Solid waste disposal, coal storage and land reclamation report. Prepared for B . C . Hydro and Power Authority's Hat Creek Project. Vancouver, British Cc'lumbia. pp. d i scont.
1 Fll-17

ADDEIJDUI4 A
TRACE ELEWENT CO?ICENTRATIOFI IN RECEPTORS OCTOBER 1976
m -
a - F A - 1

c o.onto O.oU53
0.0400 0.0021
< 0.0010
< 0.0010
0 . m o O.GO31
< 0.0013
0.0010 5 10.0001)
< 0.w10
0. Ib61 0.0167
< 0.0913 0.0051
< 0.no10
< o.ootn < 0.0010
O.Wl00 < 0.010
< 9.0010
< 0.0010
< 0.0010
>
>
>
> > > >
>
> >
>
> > > >
0.0120
0.001 0 . W
0.0100 O . " X
O.oo00 0.0003 0.0017 0.0003 o.oooo 0.WW
a.uooo
0.0067
0. w m 0.0015
0.0667
0.0033
0.0003
0.0000
0.0000 0.0059
0.- 0. 0000
0.000
0 .1ov < 0.0013 < 0.0023
.z 0.0010 0.1333
< 0.0010
0.0060
0.0003 < 0.0013 > 10.0000 < 0.0010
0.0010 0. (j000
.z 0.0010
0.0200
c o m l o o.ono3
< 0.0010
c 0.0010
I .0133
< O.Ml0 c 0.0010
.z 0.0010
< 0.0010
> >
> >
>
> >
>
>
z
>
>
>
>
>
>
0.0519 0.0003 0.004
0.oooO 0.0333
0.W3 0 . m o
0.0012 0.0001 O.OMO
0. 0000 0.0000 0.1517 0.0000 0.0000
0.000 0 . W
0 . W O.Wo0 1 .M?9 O . W o.MyI0 0.ayH) O . W
< <
< <
<
< >
<
< < <
< <
< <
<
<
0.2333 0.0015 0.0020 0.0561 0.0010 0.0010
0.0033 0.0103
l o . m 0.0010
0.0010
O t 0 0 l 0 0.0533 0.0097 0.0010
0.0031 0.0010
0.0010 0.0010
0.1500 0.0010 0.0010
0.0010 0.0010
> >
> >
> >
> >
> >
>
> >
> > > >
o.oR02 0.0303 0.4006 0.0035 0.0ooo 0.0ooO 0.0023 0.0010 0 .m0 0.0000 0.0000
0.0240 0.oOOa
0.0051 0.0003 0.0015 0 . m o.wo0 O . m
0.0755 0.0000
0.- 0.- 0.0000
< 0.0013 O . M O O
< 0.0020 0.0600
< 0.0013 < 0.0013
0.0050
0.0213 < 0.0013 > 10.0000 < 0.0017
0.0013 0.1561
< 0.0061 < o.oat3
0.0070 < 0.0013 < 0.0013 < 0.0013
0.1267 < 0.0013 < 0.0013 < 0.0013 .z 0.0013
> >
> >.
> > > >
. > >
j.
> >
> > > 5
0.0551
0.0303
0.0058
O.Oa%
0.005 0.0033
0.0015 0.0144 0.0M)I
0.0007
0 . 0 m
0.0122 0.0003
0.0020
0 . O o o l
0.0003 0.0011
0.003) 0.0005
O . w O 7 0.03l I
0.0033 O . 0 0 0 I 0.0005
> >
> >
> >
>
> z > > , >
5
> > 5
0.w0 0.m0i
0.000)
0.0132
0.001
0.m0
O.OIW1
0.wn 0.0001
0 . m
0.um1 U . W I
0.0769 0.0015 0.0001
11.0031
J.0MX;
0 . 0 0 1
0.0001 Q . i Z 4 0 n.mw 0.w01 0 .001
0.0001

c 0.0010 > 0.0000 < 0.0010 > 0.0000 < o.oo?o > O.wo6 < 0.0010 > 0.0000
< 0.0013 > 0.0003 0.1661 0.0337
< 0.0500 > 0.0000 -z .0.0013 > 0.0007 < 0.0010 > 0.oow > 1 o . m > 0.0000
< 0.0001 > 0.0000 0.0261 0.0120
< 0.0010 > o.ooo0 0.0061 0.0017
< 0.0010 > 0 . m 0 .0023 0.0003
< 0.0010 > 0 . m
c 0.0010 z 0.0000
< 0.0010 > 0.0000 0.1133 0.0437
> 5.OmO > 1 . O W . . Praesodylnlm (Pr) < 0.0010 =- %Moo
Rhenlusn (He) Rhodium (Rh)
< 0.0010 > 0.0000 < 0.0010 > 0 . m
Rubidlull (Rb) < 0.0010 > 0.0000
< 0.0010 > o.ow0 c 0.0010 > 0.0000
< 0.0010 > 0.oow 0.0027 O . o W 3
< 0.0013 > 0.0007 0.0061 0.0133
< 0.0500 > O.oOo0 0.0020 0.0006
< 0.0010 > 0 . m
5 10.0" > 0 . m
0.0003 o.wo9
0.0007 0.0013 0.0002 0.0001
< 0.0010 z 0 . m
< 0.0020 Z 0.0006
< 0.0010 z 0 . w < 0.0010 > 0.ww
c 0.0010 > 0.oOw
c 0.0010 z 0.0000 0.0261 0.0035
> 8.0000 > 1 . m o < 0.0010 > 0.0000 < 0.w10 z. 0 . w < 0.0010 > 0 . m
< 0.0010 > 0 . m
< 0.00l0 > 0 . m
c 0.0010 > 0 . m
< 0.0010 > o.Ow0 0.0011 0.0003
0.2661 0.1202 0.0020 0.0000
< o.oclw > 0,-
< 0.0010 z 0.0000
0.0010 2- 0 . m
z 10.0000 > 0.0000
< o.ooo1 > 0.aXH) 0.0080 0.0020
< 0.0010 z o.oW0 0.0261 0.0167
< 0.0010 > 0.0ooo 0.0053 0.0013
< 0.0010 > O.Ow0 c 0.0010 > o.oo00
< 0.0010 > 0.0000 0.1661 0.0333
> 6.0000 > 2.6450 c 0.0010 > 0 . m
< 0.w10 > 0 . w < 0.0010 > 0.0000 < a.0017 z 0 . 0 ~ 7
Tram element conoentrstlon ( u g h ) in ratar eamplaa (oontinued)
site 1 Element
s i t e 2
Wean Std err nom Std err Hean Std err Hean Std err Elem Std e r r Slte 3 site 4 Overall
< 0.0013 > 0.0003 < 0.0013 > 0.0007
< 0.w11 > 0.0001 < 0.0011 > 0.~M01
0.0027 0.W7 c 0.0022 > 0.0002
< 0.0013 > O . w o 3 0.0033 O.Lm88
c 0.0011 5 o.mM1
< 0.0023 2- 0.0001 0.1500 0.0350
< 0.0010 > 0.0002 c c.0500 -- C.%XL? < 0.WjUU > ".WW < 0.0020 > 0.0006 < 0.0013 > 0.0003
< 0.0016 > 0.Wm
> 10.0000 > 0.0000 < 0.0011 > o.wo1
0.0071 0.0012
> 10.0000 5 0.0000
< 0.0001 > 0.0000 < Q.0001 > 0.0000 0.0111 0.0037
0.0133 0.0033 O.OlS0 O . O M 3 c 0.0011 5 0.0001
c Q.lM35 5 0.0005 < n.w1t > 0 . 0 ~ 1
c O.OOI1 > 0.0001 < 0.0011 > O . O W 1
0.4661 0.2667 O,l!l33 0.W766
< 0.0011 > 0 . m 1
> 6.1500 5 O . R i 2 1
< 0.0011 > 0 . m 1
c 0.0011 > 0.0001
c 0.0011 > 0.0001
c 0.0015 5 0.0003
< 0.0013 > 0.0003 0.0043 0.0009
< 0.0013 > 0.0007
c 0.0013 > o.omi < o.Do13 > o.wo7
< 0.0013 > 0.0003
> 0 . o w o > 2.0000 < 0.0013 > 0.0003 < 0.0013 > 0.0003 < 0.0013 > 0.0003 < 0.0023 > 0 . o w -. -
? Y

c
< >
> < < < < < <
c <
< <
< <
0.0010 > 0.0010 >
0.0010 > 0.0027 > 5.- 0.0010 >
0.2333 1.6661 >
1.3333 >
0.0010 > 0.0010 >
0.0010 > 0.0010 > 0.0060 > 0.0010 > 0.0010 > 0.0007 >
0.0041 > o.Qo10 >
0.0010 > 0.0020
0.0010 > 0.0123 0.0020 >
0 . o m &woo c 0.OoM
O.wO3
0.Moo < 1.1541 >
0.6661 > 0.0333
o.Wo0 < 1.3333 >
0.0000 < 0.Oom: < 0.0000 <
0 . m < 0.0020 <
O . m < 0.005B 0.0lmo < 0.0011 0.ooM) < 0 . m < 0 . m < 0.0039 o.om6,
0.0010 0.0010 0.0010 0.0020 7.0000 0.u010
0.2661 1.6667
4.3333 0.0010 0.0010
0.0010 0.0010 0.0060
0.0010
0.0167 0.0019
0.0010
0.0047 0.0010
0.0010
0.0010 0.0130 0.0017
> 0.0000
> 0 . m > 0.0000 > 0.wO0
> 3 . m
> 0.3333 > 0 . m
> 0.0019 0.0661
> 0.oMx) > 0 . m
> 0.0000
> 0 . m
> 0.0010 z 0 . w 3 0.0000
> 0.0000 D.0033
> 0.0001 > 0 . m
5 O . m 5 0.0000
0.m35 0.0001
< O.Wl0 > o , . m < 0.0010 3 0.0000
< 0.0010 > 0.OoM)
< 0.0023 > 0.0003
0.0010 > 0.0000 6.3333 0.8819
> 2.3333 > 0.3333
> 5.ooM > 1 . m o 0.1333 0.0333
< 0.0010 > o.ow0 < 0.0010 > o.oo00 < 0.0010 > 0.0000 < 0.0010 > o.Wo0
0.0010 3 0.0015 < 0.0010 > 0 . m
< 0.0010 3 0 . m
< 0.0010 > o.Mo0 0.0233 0.0033
0.0057 > 0.0012 0.0023 0.0003
< 0.00IO > 0.0000
< 0.0010 > o.Wo0 0.0461 0.0261 0.0021 0.0003
< 0.0013 > < 0.0013 > < 0.0013 > C 0.0023 > > 6.6667 > < 0.0013 >
2.3333 >
> 5.6661 > 0.2661
< 0.0013 > < 0.0013 > < 0.0013 > < 0.0013 >
0.0070 > E 0.0013 >
< 0.0013 > 0.0160
< 0.0021 > < 0.0063 >
< 0.0013 3
< 0.0020 >
< 0.0013 > 0.0110 0.0023
0.0003 0.0003 0.0003
0 . m I
2.0216 0.0003 0.6667 0.0661
O . M o 3 1.0559
O . o W 3 0.0003 0.0003 0.0030 O.Om3 0.0003 0 . w o 0.0012 0.0022 O . O w 0
0.0003 0.0005 0.0115 0.0003
> < c < < <
<
< <
<
<
< <
<
<
0.0011 > 0.0001
0.0011 > 0.0001 0.0011 > 0.0001
0.0023 > 0.0002 6.2500 > 0.8621 0.0011 > 0 . m 1
0.2250 0.0219 2.00M: > 0.2462
4.0333 > 0.5@82 o.ou11 > o.Ooo1 0.0011 > 0.O001 0.0011 > 0.0001
0.0011 5 0.0001
0.0011 5 0.0001 0.0ffij > 0.00m
0.0011 > 0.0001 0.0162 > o.om1 0.0014 > 0.0003 0 .0055 > 0.0001 0.00IC > 0.0032
0.0011 > 0.0001 0.0011 i o.Ooo1 0.0223 0.0016 0.0022 > 0.0002
c I 1 I I 1 I ' I 'I I 'I
:.' i

s 1 t e 1 Element
s i t e 2 sits 3 Mean Std err . Mean Std err . !!+lean Std err Mean Std err U e m S t d err
sits 4 OYCrDll
> 1000.00 > 0.00 > 1,000.00
lo.w ' 3.79 1 .33 0.33 0.53
6.33 > 900.00 > 100.00 > 1000.00 < 0.47 > 0.21 0.10 . Y . L , c Y."? -. 6.26
v.33 3.10 4 .OO 1.53
1.67 5.00
< 0.37 > 0.15 < 0.23 > lwo.w > 0.00 > 1wo.w
24.w 10.02 2.00
32.00
20.w 0.00 2.33
61.67 8.72 18.56
17.3'I
0.33 261 .33
2.91 26.67 3.71
6.00 25.33
c 0.41 > 0.22 c l.M > 0.85
0.50
1.67
0.63 202.w
0.19 0.50 03.17
1.93 1.03 1.67 72.31
10.67 3.28 1.13
13.67
< 0.27 > 0.09 < 0.20 0.47 0.37
~ ~ " " . ^ ^ ^
> 0.w 0.03
> 0.03 0,33
> u.w 0.00
0.67 0.W
5 0.03 5 0.w
0 ,W 2.09
5.93 180.06
9.49 1 .oo
0.33 0.06
0.15 26.67
0.33
0.12 3.71
> 0.00
> iwo.00 7 0.00 > 1wo.00 > 0.00
0.91 0.03 c 1.57 > 0.72
> lwo.w 7 0.00 > lwo.w > 0.00 5.w 1.53 4.67 1.20
c u.>u 7 0.21 c 0.30 > 0.10 0.10 0.W 0.27 0.17
2.33 3.w 1 .w 6.67 3.18
0.88 2.00 0.50 < 0.43 > 0.09 < 0.41 > 0.22 > 1000.00 7 0.00 > 1lxQ.00 > 0.00
35.00 1.67
0.89 22.33 0.W 0.33
40.67 1.63
5.81 40.33 0.37 15.30
293.33 158.99 > 526.67 > 241.13 14.33 49.w
3 . a 16.50
22.00 4.04 33.67 7.54
3.67 1 .13
0.- 1.33 > 0.83 0.43 < 0.60 Z 0.21
156.67 0.83 0.17 0.73 0.22
17'.64 Z 347.W > 326.50
29.33 2.33 0.61
4.w 27.33 1.47 0.53
0.13 4.91
0.13 0.W > 0.06 < 0.30 > 0.10
0.70 0.06
> 1000.00 > . 0.M) < 1.111 > 0.21
> 975.00 > 25.00 6.50 1.11
< 0 . 2 3 > 0.011 c U.% > 0.06
4.92 3.33
1.28
< 0.30 5 0.07 0.54
> 1000.00 > 0.00
211.33 3.34 1.91 0 . 2 5
33.50 > 205.71, z UG.07
5.49
35.6.1 12.1.1 2. j1
< l.Y9 > 0 . 4 4
5.26
< 0.W 5 0.14 0.70 0.W
Z 194.50 > 78.15
1 . <I5 22.25
0.31 2.64
0.73 < 0.27 > 0.03
0.14

< 0.40
< 0.n
< 0.21 1.93
> 1wo.00 17.00
< 4.33 . 31.))
c 0.w > 1M0.00 > 1wo.00
0.16 1 .O3 0. G I
32.00 11.61
< 0.n 0.n
> 1oou.00 < 0 .21 > 1oou.00
5.00 < n . n
0.n 40.33
> 0.06 < 0.20 > 0.51
1.03 0.W
> 0.4) < 0.20 1.61
> 0.00 2- 1wo.00
> 0.33 < 4.61 4.51 31.33
> 0.09 < 0.20 31.30 2.60
> 0.00 > 1000.00 > 0.00 > 1 ~ 0 . 0 0
0.02 0.14 1 .4 1.11
11.19 2.13 1.h1
29.33 10.60 13.00
> 0.03 < 0.20 > 0.09 < 0.20 .> 0.00 > 190.M > o m < 0.20 > 0 . 0 > 1000.00
2.m > n.ug < 0.20
3.61
> 0 . 4 < 0.20 15.16 21.00
> 0.00
0.01
> 0.00 0.33
> 0.00
6.01 > Oi61
1.25 > 0.00
> 0.00
> o.m 0.01 0.44 1.45
3.06 5.10
> 0.00
> 0.00
> 121.41 > 0.w > 0.00
0.00
> n.w > 0.00
6.24
< 0.30 1.61 0.81
< 0.30 > 1 w o . w
41.61 < 4.61
4 .DO < 0.33 > 1WO.00 r 533.33
0.13' 1.33
156.33 9.33
12.30 < 0.30 < 0.30 > 910.00 < 0.30 > 1wo.w
5.00 < 0.30 < 0.30
45.33
> 0.06 < 0.5.1
0.61 < 0.51
> 0.06 C 0.30 0.07 < 0.63
> 0 . w > 1000.00 0.45
> 0.61 < 4 . 0 0 ,14 .00
1.53 , 3.61 > 0.01 < 0.30
> 0 . 0 0 , > 1MO.W
> 231.86 > 056.61
0.33 0.02 0.11
2.23 0.61,
' 45.11 0.00
6.15 110.33 14.00
> 0.06 < 0.30 > 0.06 < 0.30
> 0.06 < 0 .30 > 90.00 > 916.61
> 0.00 > 1wo.00 0.00 3.61
> 0.06 < 0.30 > 0.06 < 0.30
16.41 49.61
> > > > >
>
> >
>
> >
> >
>
> >
0.23 0.10
0.10 0.10
0.00
0.00 2.m
2.19 0.10
143.33 0 .PO
0.00
0.96
36.10 2.52
2.00
0.10 0.10
23.33 0.10 0.00
1.20 0.10 0.10
15.68
< o,31 > o.af
< 3.20 > 2.00 < 0.99 > 0.23
< 0.n > 0.03 > 1000.00 > 0.00
2 7 . 5 0 4 .I1 < 4 . 4 % > 0.23
1 l . W 0.05
< 0.20 > 0.04
> 1000.00 > 0.00
> fMl.50 > 02.51
0.14 0.01
0.42 1.64 0.36
04 .00 20.91 0.00
< 0.21 > 0.03 14.24 2.01
C 0.21 > 0.01
< 0.27 > 0 .03 > 919.11 > 41.66
> 1000.00 > 0.00
< 0.n > 0.03 4.33 0.57
< 0.21 > 0.03
39.00 6.08
n
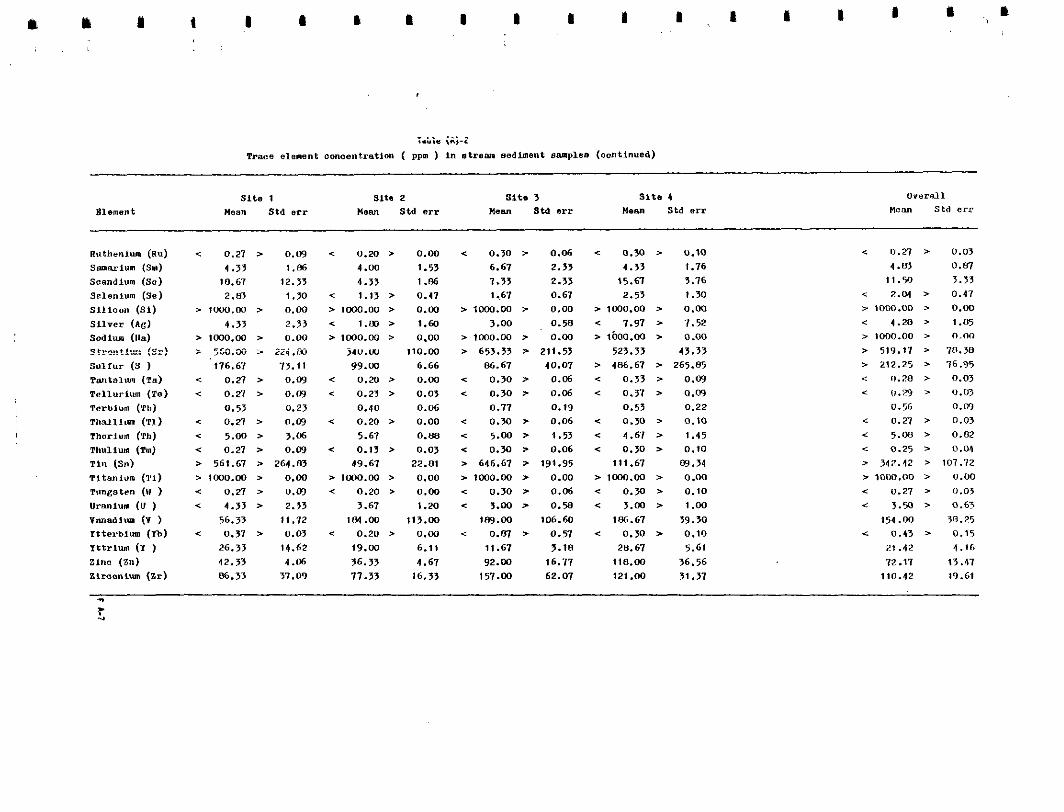
L r 1 i I 1 L 1
~ ~- ~- ~~~ ~~~
S l t e 1 Blalnant
Slta 2 sit+ 3 Hean Std err Wean Std err Hem std err Hean Std err
Slt.3 4
Ruthenim (RY) 0.21 > 0.09 < 0.20 > 0.00 < 0.30 Z 0.06 C 0.30 > 0.10 SBnaPiUrn (Sol) 4 . 3 3 1 . 8 6
10.67 4 .OO
1 2 . V 1.53
4.33 1 .e6 1.33 6.61 2.33 4.33
2.33 1 .I6
se1enim (se) 15.61
2.m 3.76
Si l i con (SI) 1.>0 c 1.13 z 0.41 1-67 0.61 2.53 1 .30
> 1 w o . 0 0 > 0.00 > 1ow.00 > 0.w > 1m.w z 0.00 > 1wo.00 > 0.w S i l v e r (AG) 4 .33 2.93 < 1.m z 1.60 3.00 0.50 < 7.91 > 7.52 Sodium (Ila)
Soandim ( s a )
z*z.c:!$PL?: (S;.! : 5 L D . S > 22.4.E
S U l f U r (S ) 116.67 73.11 j4u.w 110.00 > 653.33 z 211.53 523.33 43.33 99.w 6.66 06.61 40.01 > 406.61 > 265.05
< 0.n > 0.09 < 0.2-3 > 0.w c 0.30 > 0.06 c 0.73 > 0.09
> 1m.w > 0.00 > 1 w o . w > 0.00 > lwo.w > 0.w > 1600.00 > 0.00
T m t B l m (Ta) Tellurlurn (re) < 0.n > 0.09 < 0.23 Z 0.03 C 0.30 Z 0.06 0.37 > 0.09
Terblum (Pb) T h s l l l m (T1)
0.53 0.23 0.40 0.06 0.17 0.19 0.53 0.22 < 0.n > 0.m 0.20 > 0.00 c 0.30 0.06 0.30 > 0.10
Thorium (Th) Thulium (Tm)
C 5.00 > 3.06 5.61 < 0.21 > 0.09 c 0.13 z 0.0) c 0.30 z 0.06 c 0.30 > 0.10
0.00 c 5.W z i .53 < 4.61 > 1.45
TI11 (Sn) Tltanlum ( T i )
> 561.61 > 264.83 49.61 22.01 > 646.61 > 191.95 111.61 4L.34 > l w o . w > 0.00 > 1wo.w > 0.00 > 1m.00 > 0.00 5 1m.w I 0.00
hmesten (U ) 0.n > 0.m < 0.20 z 0.00 c 0.30 > 0.06 c 0.30 > 0.10
uraniun (U ) Vanadl lm (V )
< 4 . 3 3 > 2.33 56.33 11.12
3.61 1.20 c 3 . 0 0 z 0.58 < 3.00 > l.w 1W.w 113.00 1m.w 1M.W lWj.61
rttePb1um (n) c 0.31 > 0.03 < 0 .20 z 0.00 0.81 > 0.51 c 0.30 , 0.10 39.30
I t t r I W (1 ) 26.33 14.62 21°C ( a " )
19.00 42.33 4.06 36.33
6.11 4.61
11.61 92.03 16.71
z1rcon1m (2r) 110.00
86.33 36.56
37.09 71.33 16.33 151.00 62.01 121 .w 31.31
3.18 28.61 5.61
< 0.21 > 0.03
1 1 . 5 0 4.03 0 . M
3 . 3 3 < 2.04 > 0 . 4 1 > IOM).OO 1 0.00 < 4 . 2 0 > 1 .05
, 10oo.00 z o.no , 519.21 > 7n.30 z 212.25 > 76.95 < 0.70 > 0.03
< <,.a I o.m
c 0.27 > 0.03 0.56 0.4
4 5 . M 5 0.02
C 0 . 2 5 > 0.04
z 347.42 > 101.72
C U.27 > 0.03 z 1w0.00 > 0.00
3.50 > 0.63
< 0.13 > 0.15 154.00 38.25
21.42 1.16
110.42 72.17 13.41
19.61

3.33 < 0.20
< 0.43 23.67
< 0.20 < 0.20
1.90
< 0.30 24 .w
w 1000.00 < 0.23 < 0.17 W 963.33
9.~3 0.37 I .67
< 0.20 < 0.20 c 0.20
74.33 < 0.20 c 0.m c 0.30 < 0.20
1. 6 > 0.w < 0.11
4.33
> 0.03 0.53
w 0.00 c 0.17 20.19 1.00
w 0.00 < 0.17 1.05 5.69
1 .os
w 0.W 0.17 16.67
w 0.00 > 1000.00 > 0.03 < 0.11 > 0.03 c 0.10 w 36.61 w 1000.00
8.59 2.67 0.15 < 0.30 0.30 4.33
W 0.00 < 0.17
> 0.00 c 0.17 W 0 .W < 0.17
> 0.00 0.17 28.37 145.00
w 0.60 0.33 W 0.10 < 0.17 W 0.00 < 0.17
r 0.03 1.45
w 0.09 2.52
W 0.03 > 0.03
0.49
> 0.03 1.20
w 0.00 Z 0.03 w 0.00 w 0.00
0.00 > 0.20
0.67 W 0.03 > 0.03 W 0.03
W 0.03 73.65
, 0.15 W 0.03 W 0.03
> 69.33
< 0.33 < 0.17
0.67 < 0.17 C 0.17
0.97
< 0.30 22.67
z 1000.00 < 0.20 < 0.13 > 793.33
3.53 0.37 4 .M
< 0.17 4 0.17 < 0.11
61.33 -Z 0.17
0.43 < 0.17 < 0.1’1
0.03 65.36
0 . W 1.65
0.03 0.03
0.52 10.49 0.12 0.00 0.06 0.03
206.67
0.03 2.74
0.03 1 .w
0.03 0.03 30 .n2 0.03 0.13 0.03 0.03
< 0.10 W 25.67
c 0.43
L 0.18 13.11
c 0.18 1.30
C 0.26 21.11
> 10.00
< 0.13 < 0.20
> 91o.m
< 0.1.1 5.14
c 0.w 4 .13
c 0.10 < 0.10
< 0.IJ
94.22
< O.:.?
c 0.21
.z 0.18
w 21.81 w 0.01 > 0.04
5.46 w 0.01 w 0.01
0.40
3.64 w 0.04
w 0.00
> 0.02
w 0.02 > 6 0 . 4 4
2.135 > 0.07
0.44 w 0.01 w 0.01 w 0.01
?I .60 w 0.01 > G.20 w 11.04 > 0.01
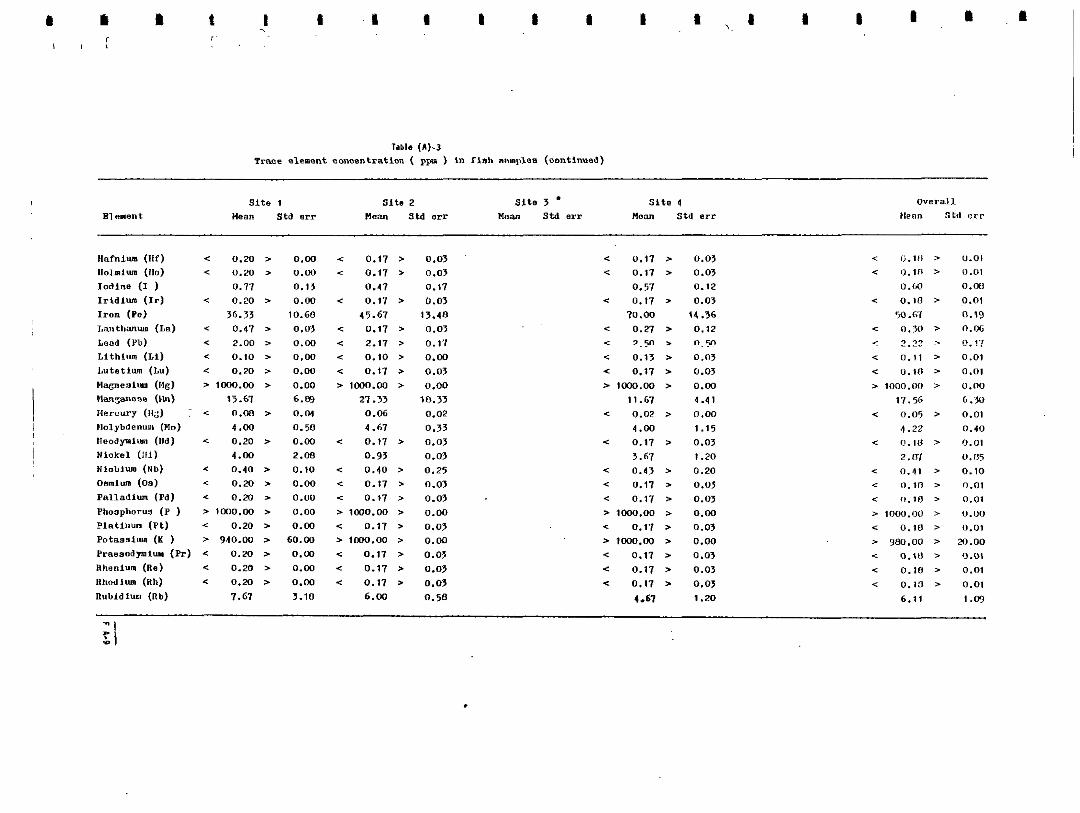
Hafniw ( I l f ) I l O l r n i u m (110)
< 0.20 > 0.w < 0.17 > 0.03 c 0.20 > 0.00 < 0.17 > 0.03
0.17 0.13 0.41 0.11
c 0.11 > 0.03 < 0.llI > u.01 c 0.11 > 0.03 c 0 . 1 ~ 1 5 0.01
IodIne ( I ) I r l d l m (Ir) < 0.20 > 0.00 < 0.17 > U.03 < 0.11 > 0.03
0.51 0.12 0.60 0.w
Iron (Pe) 36.33 10.60 45.67 13.48 70 .oo 14.36 50.67 0.19 < 0.10 > 0.01
< 0.30 > 0.m Lrmtllmuo (La) < 0.41 > 0.03 < 0.11 > 0.03 Load (Yb) < 2.00 > 0.00 < 2.11 > 0.17
< 0.21 > 0.12
Llthilm (Ll) < 0.10 > 0.00 < 0.10 > 0.00 < 7 ~ 5 n > o.?
L"t8tluln (LU) < 0.20 > 0.00 c 0.17 > 0.07 < 0.17 > 0.03
Ilanganese (Mn) 15.61 6.03 21.33 10.33 11.61 4.41 Mercury (11:) T < 0.08 z 0.04 0.06 0.02 c 0.02 > 0.00
< 0.13 > 0.03 c 2.22 . C.!?
< 0 . 1 1 z 0.01
< u.10 z 0.01
Mweslum (Mg) > 1000.00 > 0.00 > 1000.00 > 0.00 > lrn.00 > 0.00 z 1000.00 > 0.00
11.56 6.W
Nolybdenun (no) 4 . 0 0 0.50 4.67 0.33 lleodyrnlun (Ild) .C 0.20 > 0.00 c 0.11 > 0.03 0.17 Z 0.03 Nickel 011) 4 . 0 0 2.08 0.93 0.03 NloblUlo (Nb) C 0.40 > 0.10 C 0.40 > 0.25 < 0.43 z 0.20
< 0.05 > 0.01 4 . 0 0 1.15 1.22 0.40
c Q.lL? 0.01 3.67 1.20 2.m
< 0.41 > 0.10 0.05
omlm (OS) < 0.20 > 0.00 c 0.11 > 0.01 c 0.11 > 0.03 P e l l a d l m (Pd) c 0.20 r 0.00 c 0.17 > 0.07 < 0.11 Z 0.03 Phosphorus (P ) z 1mO.w z 0.00 > 1wO.W > 0.00 > 1rn.00 z 0.w
c o.1n > 0.01 c u.10 > 0.01
P1Rt I ) lUn ( P t ) > 1000.00 > 0.00
PotaseIwn (K ) > 940.00 > 60.00 2- lmo.00 > 0.00 0.20 z 0.00 c 0.11 > o.o> < 0.17 Z 0.03 c 0.10 > 0.01
> lwo.OO z 0.00 Praesodpiuo (PP) < 0.20 > 0.w c 0.11 z 0.03 < 0.17 > 0.03
z 900.00 > m.00
Rhenium (Re) c 0.20 > 0.00 < 0.17 > 0.03 < 0.10 > 9.u1
Rhodium (Rh) < 0.20 > 0.00 < 0.17 > o.o> c 0.17 z 0.03 C 0.17 Z 0.03
.z 0 . IR > 0.01
nubldllm (nb) 7.61 3.10 6.W 0.58 4 -67 I .20 6.11 1.4 < 0.13 > 0.01
TI P &I

< (1.20 > 0.00
< 0.20 > 0.00
< 0.13 > 0.03 < 0.70 > 0.15
102.00
2.61 31.13
> 533.33 > 99.30 0.61
. 93.61 > 1000.00 > 0.00
00. u)
< 0.20 > 11.00
< 0.20 > 0.00
< 0.20 > 0.00
< 0.20 > 0.00
< u.?o > 0.00
< 0.20 > 0.00 < 0.20 > (1.00
10.33 6.44 < n.zo 5 0.00
< n.20 > 0.00
0.97 0.55
< 0.13 > 0.03 < 0.20 > 0.00
01.61 0. 61
23.51
0.10
< , 0.1'1
< 0.10 < 0.11
< 0.67 40.33
2.61 > 496.6'1
> 100o.m 2 2 . m
< 0.17 < 0.17 < 0.17 c 0.17 < 0.17 < 0.17 < 0.21
< 0.11 5.3s
< 0.17 1.23
< 0.17 < 0.13
< 0.m 94.33
> 0.03 > 0.03 > 0.00
> 0.17 0.01
0.61 > 32.03
4.93 > 0.00 > 0.03 > 0.03 > 0.03 > 0.03 > 0.03 > 0.01 > 0.07
, 0.03 0.33
, 0.03
> 0.05 0.M
> 0.03
37.91 5 0.21
< c < <
>
< >
< <
< <
<
< <
< <
<
0.17 0.17 0.10 0.70
165.33
, 0 . 5 3 426.67 28.61
013.33
0.20 0.17
0.11 0.11 0.17 0.17
4 .OO
3.67
0.17 0.11 0.27 0.17 0.17
67.33
0.41
> 0.01
> 0.00 > 0.03
> 0.21 60.24
0.23
> 03.33 7.69
> 126.61 > 0.03 w 0.06
> 0.03 > 0.03
> 0.03
> 0.03 1.61
> 0.03 1 .00
> cJ.03
0.03 > 0.03 > 0.07
> 0.09
24.26
< < < <
>
< >
< < < <
< <
< <
< <
<
u.1u 0.10
9.11
0.69 105.22
I .96 485.56
49.10 957. I O
0. lo 0.19 0.10
0.10
0.10
0.111
6.56 1.38
0.10
0.10
O.(P 0.10
0 . 1 4 01.11
0.W
2- 0.01 > 0.01
> 0.01
> 0.09
26.17 0.45
> 32.20 26 .40
> 42.22 > 0.01 5 0.m > 0.01
> 0.01 > 0.01
> 0.01 > 0.15
> 0.01
2.12
> 0.01
0.33 > 0.01 > 0.02
> 0.09
15.10
I ' I I I I

> 1 w o . w > O.w z lwo.w > 0.00 > 1 w o . w > < 0.53 5 0.23 < 1.40 > 0.60 0.21 >
4 . 3 3 0.08 0.33 2.3) 1.00 > 936.61 > 63.33 > 926.61 > 73.33 > 1WO.W >
0.53 0.24 0.43 0.28 0.30 c 0.30 > 0.00 < 0 . 3 5 > 0.09 e 0.20 >
o.,, ~ " 0.67
' 6.61 0 . N 3.33 0.88
i j.w 6.U" 3.w 2.61
c 0.51 > 0.03 c 0.43 > 0.W e 0 . 3 3 > > lwo.w > 0 .w > 1ooo.w > 0.00 z 1ooo.w >
20.w 14.19 33.67 4.91 7.33 2.73 1.33 0.33
31.61
236.67 48.01 62.00 ll.M 1.93
08.33 1t.m 154.33 39.65 64.67
13.33 5m.w
1.67 12.W 40.33
1.53 21.11
21 .>I 58.33 11.26 31.61
< 1.10 > 0.19 c 0.30 > 0.00
2.61 0.33 1.33 1.11
0.57 0.43 c 0.43 z
0.12 216.61
1.20 0.40 1.03
c 0.10 > 0.21 43.12 > 466.61 > 260.22 43.67
21.67 2.33
3.33 0.33
18.61 1.50
0.33 31.61 0.93 0.4 0.51 , 0.23 0.M)
< 0.30 > 0.W < 0.21 > 0.03 < 0.20 >
0.00
0.09 1.53 0.00
0.06
0.10
1 .uu
0.09
1.20
12.51 0.00
1.03 22.10
162.09 11.35 20.19 0.35 0.24
19.94 0.50
16.23 0.50
0.21 0.06
> looo.w > c 0.27 >
> 1000.00 > c 0.33 > c IO.21 >
11.01
6.00
5.00
< 1.13 > > 1oo0.w >
23.67 2.33
216.61 82.67
34 .33 10.67
2.61 c 0.40 >
0.67 221.61
1.60 25.33
0.73 < 0.21 >
0.00 0.03 0.50 0.00 0.15 0.03 >.'I6
0.45 1 .OO 0.00
9.M 0.67
180.03 31.78
0.33 12.00 0.61 0.15
112.04 0.13
' 0.40
12.14 0.27 0.03
z 1m.m >
0.40 >
3.61 z low.w > < 0.43 > < 0.23 >
0. b l
1.61 < 0.43 > > 1000.00 >
59 .OO 1 .m
54.33 380.00
7.33 65.00
c 1 . 1 0 > c 0.40 >
0.13 89 .oo 0.90
14.61 O.6<
-z 0.23 >
0.00 0.15 0.61 0.w 0.11 0.07
0 . 3 3 4.33
0.11
45.51 0.W
0.35 22.53
240.00
52.56 1 .I5
0.49 0.10
41.00 0.10
5.36 0.09
0 .4.
0.15
> looo.w > < 0.57 >
4.m
< 0.41 > > 912.61 S
< 0.27 >
0.93 4.01 0.58 ,
>1oM).w > 35.20
2.05 1.53.m ? ~ I . O I
47.13 12.93
c 1.11 > c 0.51 >
> Nl.53 > .z 1.41 z
0. M
22.40 c O . m , e 0.25 >
0.16 0.00
ln.6fl 0.12
0.M
0.03 1.u) 0.62 0.11 0.00
9.16 0.R)
4 I .70 6fl. 98
11.03 2.53
0.n 0.12
63.M 0.13
0.20
0 . 0
3.91
0.02

ilall*l"O (111) < 0.30 > 0.00
ilolmllm (110) C 0.41 > 0.17
I P l d l l l o (1r) I v d l n n ( J ) 1.11 > 0.79
' Iron ( ~ e )
c 0.30 > 0.00
> 1000.00 > 0.00
1,nnthanun (La) 31.33 14.52 Load (Ph) 10.00 L l t h l w l (Id)
1 .w 31.33 2 4 . 0
i:3;110.11u1 (116) > 1 o w . w > 0.00
mtot la , . (LU) < 0.30 > 0.00
! I;Rh?;:il.,BnO (lhl) > 1000.00 > 0.00
:.icrcury ((IC) 0.16 0.02 ilolybdomm (110) : :codpluo (I!d)
3.00 1.67
0.50
1:Iok"l (!!I) 0.33
42.33 7.31 n l 0 ~ l " I : l (:Ib) 9.33 2.33 0.0111, (OS) c 0.30 > 0.00
F n l l R ~ l l U l ~ (Pd) < 0.30 > 0.00
Phaspltoruo (1' ) > 1wO.w > 0.00
Platll,"n ( F t ) C 0.30 > 0.00
1'0tO"OIWJ (I: ) > low.00 > 0.00
i'mc'lon:RII:,n'(I'r) j .61 0. D l >
!lhodlur, (:lI,)
n n b l d t m (!~b)
ilhonlue (ilc) c 0.30 > 0.00 < 0.30 > 0.00
64.33 1.20
i i;
c 1.17 > 0.92 c 0.20 > 0.06 < 0.03 > 0.50 < 0.31 > 0.01 c 0.51 > n.21
0.80 1.33 0.33 0.73 0.12 1.23 0.39 < 0.10 > 0.21 < O . @ > 0.15
0.20 , 1.40 0.21 > 0.03 c 0.20 > 0.06 -z 0.21 > 0.03 < 0.23 > 0.07 c 0.25 > 0.02
> 1000.00 > 0.00 > 1wO.w > 0.00 > 1wo.00 > 0.00 > 1000.00 2- 0.00 > 1000.00 > 0.00
31.61 1.67
14.24 30. W 0.35 4 .oo
15.53 15.00 5 . 6 57.33 0.58 11.33 0.67
40.03 33.07 8.98
5.61 13.61
0.33 1.13 6.69 1.00 2.65 11.60 1.49 0 . 3 3 2.67 14.39 5.15
0.16
c 0.30 > 0.06 < 0.20 > 0.06 0.27 > 0.03 c 0.23 > 0.07 c 0.26 > 0.02
0.80 1.47 0.19 -Z 0.33 > 0.15 C 1.15 > 0.27
> 10lM.00 2- 0.00 > lLnm.00 > 0.00 > 1000.00 > 0.W > 1000.00 > 0.00 > 1000.00 > 0.00
> 993.33 > 6.67 > ImO.00 > 0.00 > 906.61 > 93.33 > 026.67 > 173.33 > 945.33 > 30.4 0.01 3.00
0.03 0.07 0.04 0.00 0 . 0 0.01 1.53
0.01 2.33
0.09 0.61
0.01 5.w 1 .oo 1 .OO
9.00 1 .00 0.00 2.07
1.61 3.20 1.67 3.10 10.33 0.49
11.06 60.00 30.45
10.01 2.c3
11.33 60.W 30:45 36.33 13.70 29 .w 6.43
6.14 45.53
16.33 0.51
6.98 15.33 7.00 0.67 0.33 13.10 2.36 < 0.21 > 0.03, < 0.20 > 0.06 < 0.21 > 0.03 < 0.23 > 0.01 c 0.25 > 0.02 c 0.21 > 0.03 0.20 > 0.06 < 0.27 > 0.03 < 0.23 > 0.07 < 0.25 > 0.02 > 1000.w > 0.00 > 1Lnm.W > 0.00 > iWO.00 > 0.00 > 156.67 > 243.31 > 951.33 > 4c.61
0.27 > 0.03 0.20 > 0.06 .C 0.27 > 0.03 < 0.23 > 0.07 c 0.25 > 0.02
> l o w . w > 0.00 > lLnm.w > 0.00 > 100o.w > 0.00 > 10w.00 > 0.00. > 1000.00 > 9.w 5.00 1 .oo 5.61 2.33 4 .00 1.51 15.00 12.01 6.67 2.30
c 0.27 > 0.03 c 0.20 > 0.06 I. 0.21 > 0.03 < 0.23 > 0.07 < 0.25 > 0.02
c .0.21 > 0.0) c 0.20 > 0.06 c 0.27 > 0.03 c 0.23 > 0.01 c 0.25 > 0.02
31.61 10.40 14.33 48.03 52.w 26.00 .14.61 10.20 54 .a 111.19

C 0.30 > 0.00 0.27 > 0,03
8.67 2.61 0.61 6.61 2.67
c 2.91 > 2.02 1.67 14.04 3.00
> 1000.00 > 0.w > 1 w o . w > 0.00 2 . w 1 .w
c 1.27 > 0.m c 1.07 > 0,W 1 lwo.w z 0.00 > 100o.w > 0.00
,;ii;.>; i Z 6 . W
230.00 235.5j
5.17 4>.S>
123.37 < 0.30 > 0.00 < 0.n > 0.03
34.m
< 0.53 > 0.23 < 0.3> > 0.09
c 0.30 > 0.00 < 0.30 > 0.w < 0.50 > 0,25
0.67 0.10
< 4.61 > 0.67 c 0.30 w 0.03 c 0.23 > 0.05
1.33 2.40
> 1000.00 > ,. 0.00 z 1wo.M) 5 0.w > 337.33 > 131.33 24.33 14 .44
< 0.m > 0.00 < 0.27 > 0.03 < 4.33 w 1 .33 4 .33 1 . 3 3
< 0.30 > 0.W < 1.43 > 0.57 306.61 121.14 217.67 100,04
20.33 4.18 35.00 14.11 115.61 103.61
42.69 21.53 16.00
92.37 19.97 22.48
< 0 . M z 0.06
6.00 8.67
3.06 4.18
2.33 0.88
> IWO.00 7 0.00 < 0.20 7 0.06
> 1000.00 z 0.03 1 5bb.bl 7 227.41
15.33 52.34 c 0.20 z 0.06
< 0.20 z 0.06 0.40
< 0.20 z 0.06,
0.12
4.67 c 0.20 7 0.06
1.76
23.33 > 1 m . 0 0 z 0.00
9.91
c 0.20 > 0.06
c 3.00 z 1.15
c 0.20 j r 0.06
376.61 101.45
225.67 1W.60 16.00 4.16
155.33 107.34
c 0.77 Z 0.03 3.33
48.33 0,67
32.11 c 1.27 > 0.31 > 1 w o . w > 0.00 c 0.21 z 0.03 z 1wo.00 2. 0.00
206.67 > 783.33 > 216.67
54 .m
< 0.n > 0.03 < 0.21 > 0.03
0.50 0.10
c 0.27 > 0.03 < 5.w > 1.13 e 0.27 > 0.03
5.33 2.60
c 0.n > 0.03 > 943.33 > 56.61
e 3.61 > 0.80
c 0.n > 0.03 194.00 125.04
15.w 220.w
4 .w
> 385.00 > 308.48 68.07
< 0.23 > 0.07 < 0.25 > 0.W
3.00 0.00 17.67 4 . 3 3
4.35 0. D1 19.47
2.33 6 . E
0.33 < 2.10 , 0 . 4 4
c 0.23 > 0.07 < 0.60 > 0.21 > 1000.00 > 0.00 > 1000.00 > 0.00
> 1 ~ 0 . 0 0 0.00 > moo.00 > o.m 400.00 115.41 > 310.00 > 69.65 40.61 14.95 > 252.13 > t12.31
< 0.23 > 0.07 < 0.25 0.07 c 0.23 > 0.07 < 0.11 0.a
< 0.27 > 0.03 < 0.51 > 0.05 0.31 0.03 < 0.45 0.05
5.33 > 0.88 c 5.40 , 0.67 .= 0.23 > 0.07 < 0.25 , 0.07
35.67 25.10 > 85.20 , 65.61 > 1000.00 > 0.00 > 980.67 > 11.33 c 0.30 > 0.00 e 0.21 > 0.02
< 2.61 > 0.m < 3.m > 0.47 253.W 158.50
c 0.40 > 0.10 c 0.52 > 0.16 297.60 51.56
82.00 15.33 7.84
0.00 20.33
141.13 5.61
31.05 60.61 11.84 > 156.13 > 63.95

> 53.33 5
< 0.40 > < 0.m >
11.61 < 0.13 > < o m >
. 10.61 3.00 0.4 >
< $1.17 >
> 1ow.00 >
< 0.13 > 106.61
2.00
1M.W 0.43
< 0.13 >
< 0.13 > < 0.13 >
263.13 < 0.13 >
0.13 c 0.13 > < 0.13 >
13.W 0.25 0.15
0.03 5.04
0.60 0.50 2.03
0.13 0.03
0 . W
7?.M 0.03
0.W
90.00 0.12
0.ui
0.03 0.03
10.01 0.03 0.03 0.03 0.03
< 0.50 53.w
< .o.Yl 24.33
< 0.10
< 0.50
11.ljl 1.21
< 0.33 > lwo.OO
< 0.10 0.21
36.33 1.67
31.33 3.93
< 0.10 c 0.10 < 0.10
110.61 < 0.10
< 0.13 c 9.10
< 0.11
> 0.26 < 0.20 > 29.14 > 29.00 >
> 0.52 < 0.31 > 1.33 45.61
> 0.M < 0.17 > > 0.15 c 0.27 >
0.m 46.67 0.37
> n.ol < 0.30 3.33
> 0.00 > 1Mo.M > 0.12 < 0.20 >
> 0.00 < 0.10 > 11.39 0.33
204.61
2.56 9.00
13.53 4 . 0 0
14.33 2- 0.00 < 0.11 )r
> 0.00 < 0.11 >' > 0.00 < 0.11 >
> 0.00 < 0.17 > 19.11) 70.00
> 0.03 0.13 > 0.03 0.11 > > 0.00 c 0.17 >
22.01 0.06
0.03 9.33 0.4 0.12
13.28 0 .33 0.10 O . M
0.06
0.00
91.11 5.29
3.04 1.53
0.4 0.07
37.32 0.4
0.01 0.03 0.4 0.4
> 11.33 > 14.15 > M.67 > < 0.11 > 0.03 < 0.20 > < 0.64 > 0.12 < 0.4'1 >
104.00 28.59 193.33 < 0.11 1 0.03 < 0.10 > C 0.23 > 0.03 < 0.17 >
16.61 I .oo
3.11 I1l.W 4 -51 3.61
< ' 0.83 > 0.09 < 0 . 4 1 > > Iw0.M > 0.00 j . 1000.00 >
0.20 0.00 0.13 c 0.10 > 0.00 < 0.10 >
196.61 3.33
40,55 0.00
556.61
0.93 6.00
0.01 1.43 10.61 1 .I6 21 .>I
< 0.11 > 0.03 c 0.10 > < 0.11 > 0.03 < 0.10 > C 0.17 > 0.03 < 0.10 >
> 106.67 > 293.33 115.00 < 0.17 > 0.03 < 0.10 >
0.21 0.11 c 0.20 > c 0.13 > 0.03 < 11.17 s < 0.17 > 0.07 .z 9.10 >
35.41 0.00
41.11 0.a
0.00 0.03
40.05 0.M
0.09 0.00
0.03 0.00
101.13
0.01 3.21
4.26
0.00
0.00
31.15 0.00
0.M 0.10
0.m 0. M
> 57.41 > 10.38 < 0.29 > 0.4
0.60 z 9.11
< 9.13 > 0.02
18.06
< 0.35 > 0.12
39.33 12.47 3.65
< 0.56 > 0.01 0.93
2. lOW.00 > 0.00
< 0.19 > 0.03 < 0.11 j . 0.01
?20.20 55.31 4.40 1.29 2.15 0.66
15.53 11.16
< 0 . 1 3 > 0.02 < 0.13 > o.a.2
< 0.13 > 0.02 > 254.73 > 111.66 < 0.13 > 0.02 < o.rn > O.M
4.m
< 0.15 > 0.02 < 0.19 j . 0.02
r ' I ' I ' I - I I ' 1

< 0.13 0.13
c 0.13 0.37
< 0.21 123.W
5.67 = n .I
< 0.13 > 1wo.w
111.67 0.07 5.00 0.13 2.67
c 0.13
c 0.13
< 0.13
c 0.11 > 1 o o o . 0 0
Y . . ,
5 0.03 c 0.10 > 0.07 c 0.10
0.03 0.17 > 0.05 0.10
41.22 56.67 > 0.4 < 0.23
1.20 : 4.33 i ^ . i i
10.00
> 0.05 < 0.10
> 0.00 > 100o.w 13.62 21.00 0.w 2.w
0.10 4.w
> 0.03 c 0.10
0.33 > 0.03 < 0.13
9.33
> 0.03 c 0.10
> 0.03 c 0.10
> 0.00 > lwO.w > 0.03 c 0.10
> 966.67 > 33.33
0.03 0.03
0.05 1.53
> 668.67 >
c 0.10 > < 0.10 >
c 0.10 > 0.90
> 0.00 > 0.00
> 0.00 0.03
5.11 > 0.07
> c.w 4 -04
> 0.00 > 0.w
0.00 0.01 1 .oo
> 0.00 5.33
> 0.03. z 0.00 z 0.00 2- 0.00 > 0.00
131.33 0.00 0.00 0.00 0.06
c 0.17 < 0.17 c 0.27 c 0.17
c 0.33 86.67
c 3.00 i 0.io e 0.17 > lwO.w
160.00 0.04
.z 0.11 5.00
c 0.17 10.67
.z 0.11 c 0.11 > lwo.w c 0.17
> 0.01 c 0.17 z > 0.07 < 0.17 >
z 0.03 0.27 > 0.07 < 0.17 >
29.29 141.00 > 0.19 0.37 w 0.58 < ' 3.00 > > s.w > 0.07 c 0.11 >
0.45
> 0.00 > 1000.00 > 73.11 0.00
219.33 0.05
1.53 6.61 > 0.07 c 0.17 >
> 0.4 c 0.11 > > 0.07 < 0.17 > > 0.07 c 0.11 > > 0.00 > lwo.w >
> 0.07 C 0.17 >
5.04 5.73
> 966.67 > c 0.17 > < 0.11 >
< 0.17 > 1.33
33.33 0.07 0.07 0.01 0.33
> 1000.00 > c 0.11 > c 0.17 z
0.11 > 3.33
0.03 0.03
0.03 0.01
29.51 0.03 1.00 u.20
0.00 0.03
76.34 0.01 2.61 0.03 0.88 0 .03 0.03 0.03 0.00
0.00 0.03
0.03 0.03 0.03 0.33
c 0.10 > 0.00 < 0.13 < 0.10 > 0.m 0.13
0.31 0.1) e o.?n < 0.10 > 0.w 0 . 1 3
138.33 61 .U7 109.13 0 .33 5.00
0.09 e 11.30
0.50 c 5.33 U . Z I 11.12 c u.21
< 0.10 > 0.00 c 11.11
> 456.67 > 271.W 3 194.93 > 1000.00 > 0.00 1000.00
0.10 5.00
0.02 0.50
0.01 5.17
e 0.13 > 0.03 c u.14 12.67 4 .Ob u.13
< 0 . 1 3 > 0.03 c 9.15
0.10 > 0.00 e 0.13 < 0.10 > 0.w c 0.13
c 0.10 > 0.00 c 0.13
, 1000.00 > u.00 3 100o.uo
> 0.02 > 0.02
> 0.03 > 0.0'
> 0.04
16.1%
> 1.01
> 0.06 > 0.02 i. 0.00
> 62.94 0.01 0.69
> 0.02
> 0.02 1.73
> 0.02 > 0.02 > 0.00 > 0.02
5 1000.00 >
< 0.10 > -z 0.10 > c 0.10 >
0.50
0.00 0.00 0.03 0.00 0.06
> 1?0.10 >
e 0.13 > c 0.13 >
e 0.13 > 1.01
65.93 0.02 0.02 0.02 0.41
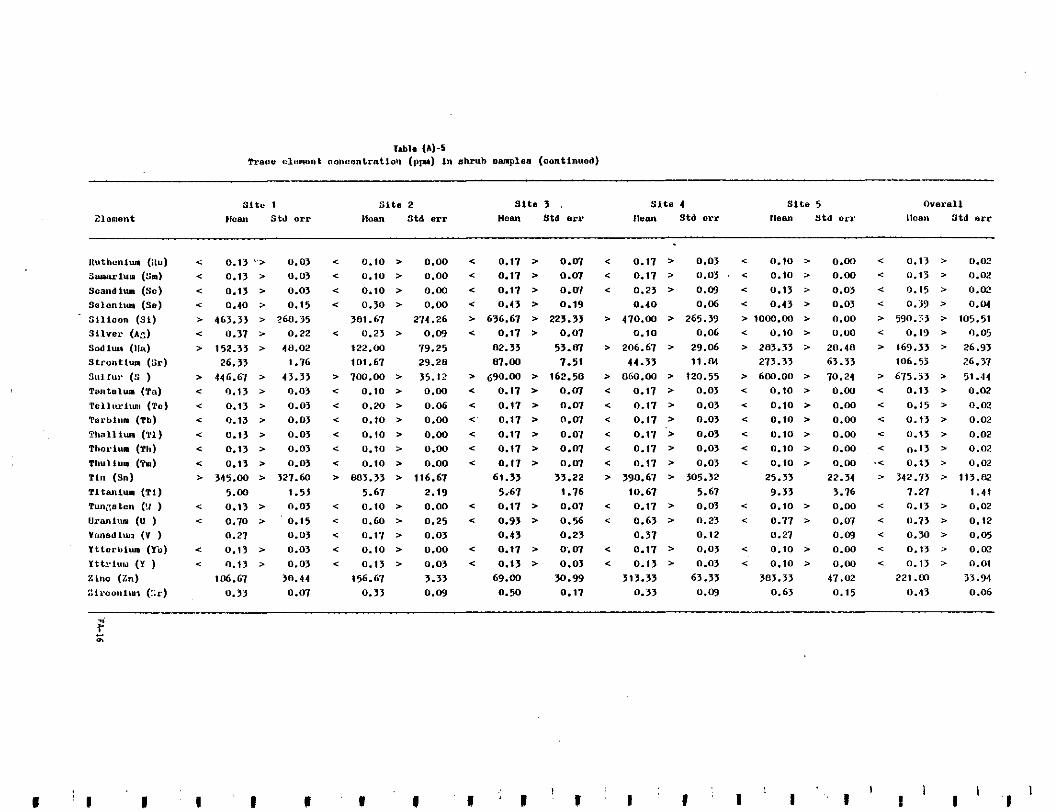
< <
< c
0.13 "> 0.03 0.13 > 0.03 0.13 > 0.03 0.40 > 0.15
463.33 > 260.35 0.31 > 0.22
152.33 > 40.02
446.61 > 43.33 26.33 1 .I6
0.13 > 0.aj
0.13 > 0.03 0.13 > 0.03
0.13 > 0.03 0.13 > 0.03
0.13 > 0.03 345.00 > 327.60 5.00 0.13 > 0.03
1.53
0.10 > 0.15 0.21 0.13 > 0.03
0.03
0.13 > 0.03
0.33 0.01 101.61 30.44
< 0.10
< 0.10 < 0.10 < 0.30
3~11.61 < 0.23
122.00
> 700.00 101.67
< 0.10 < 0.20
< 0.10 < 0.10
0.10 > aa3.33
< 0.10 5.61
< 0.60 < 0.11
0.10 < 0.13
156.61
< 0.10
0.33
> 0.00 0.17 > 0.07 < 0.11 > 0.03 < 0.10 > 0.00 c 0.13 > 0.00 < 0.17 > 0.07 0.17 > 0.03 . < 0.10 > 0.00 < 0.15 > 0.00 < 0.17 > 0.07 c 0.23 > 0.09 0.13 > 0.03 0.15 > 0.00 < 0.43 > 0.19 0.40 0.06 < 0.43 > 0.03 < 0.J9
> 0.09 < 0.17 > 0.07 274.26 > 696.67 > 223.33 > 410.00 > 265.39 > 1000.00 > 0.00 > 590.53
0.10
19.25 02.33 53.81 > 206.61 > 29.06 > 283.33 > 20.40 > 169.33 0.06 < 0.10 > 0.00 0.19
29.28 87.00 1.51 44.33 11 .M 213.33 63.33 106.55 > 35.12 > 690.00 > 162.58 > 860.00 > 120.55 > 6M.00 > 10.24 > 615.53 > 0.00 < 0.11 > 0.07 c 0.17 > 0.03 < 0.10 > 0.00 < 0.15
> 0.06 < 0.17 > 0.01 < 0.17 > 0.03 < 0.10 > 0.00 < 0.15 > 0.00 c 0.11 > 0.07 < 0.17 > 0.03 < 0.10 > 0.00 c 0.13 > 0.00 < 0.17 > 0.07 < 0.17 '> 0.03 < 0.10 > 0.00 < 0.13 > 0.00 < 0.11 > 0.07 < 0.17 > 0.03 < 0.10 > 0.00 < 0.13 > 0.00 < 0.17 > 0.07 < 0.17 > 0.03 0.10 > 0.00 .< 0.13 > 116.61
2.19 61.33 5161
35.22 > 390.61 > 305.32 1.76
25.33 10.61 5.61 3.16 1.21
22.34 > 342.13 9.33
> 0.00 < 0.17 > 0.07 < 0.17 > 0.03 < 0.10 > 0.00 n.13 > 0.25 < 0.93 > 0.56 < 0.63 > 0.23 e 0.17 > 0.01 < 0.73 > 0.03 0.43 0.23 0.37 0.12 0.27 0.09 0.30 > 0.w 0.17 > 0.07 < 0.11 > 0.03 < 0.10 > 0.00 < 0.13
> 0.03 < 0.13 > 0.03 < 0 . 1 3 > 0.03 < 0.10 > 0.00 < 0.13 3.33 69.00 30.99 0.09 0.50
313.33 63.33 0.17 0.33 0.15 0.45
303.33 0.03 0.63
221 .m 41.02
> 0.02
> IJ.02
> 0.02
> 0.04 > 105.51 > 0.05 > 26.93
26.31 > 51.44 > 0.02
> 0.02
> 0.02 > 0.02
> 0.02 > 0.02
> 113.02
> 0.02 1.41
> 0.12 > 0.05 > 0.02
> 0.01
33.94 0.06

Element s i te 1
Mean Std err Hean Std orr Mean Std err Mean Std err Mean Std err Hcan Std err S l t o 2 site 3 s i t e I S l t o 5 Overall
< 0.23 > 55.33
< 0.50 > 102.33
< 0.11 z < 0.17 >
2.67 1 .30
< 0.21 > > 1m.w >
< 0.17 > 191.61 3.61
0.11
< 0.23 >
5.33 < 0.11 > < 0.11 2-
0.11 > 29.00 0.17 >
0.33 0.13 >
c 0.11 >
30.32 0.03
18.89 0.21
0.03 0.03 0.67 0.35
0.00 0.03
0.03 0.03
122.11
0.03 1.20
0.03 1.45
0.03 0.03
12.49 0.03 0.03 0.03 0.03
91.61 46.11 52.33 30.96 c 0.41 r 0.09 < 0.30 > 0.06 < 0.20 > 0.00 < 0.37 > 0.03 < 0.31 0.03
13.w ' 2.w z 141.00 > 68.55 > 13.4 > 20.72
< 1.03 > 1.09 0.40 186.83 135.35 56.33
0.06 0.23 0.03 5.10 121.61 1.26
0.33 0.03 < 0.66 > 0.25
< 0.23 z 0.03 < 0.20 > O.W < 0.17 > 0.03 c 0.20 > 0.00 c 0.19 > 0.01 100.67 25.03 111.56 26.15
< 0 . 2 3 > 0.03 c: 0.20 > 0.00 c 0.11 > 0.03 c 0 .20 > 0.00 < 0.19 > 0.01
3.w 19.00
1 .w 2.33 0.33 5.03 1.53 17.w 1.90 0.61
2.33 0.80 2.33
3 .07 0.33 1.27 0.37 5.16 1.42
0.45
c 0.33 z 0.q) < 0.30 > 0.06 c 0.30 > 0.12 < 0 .31 > 0.03 c 0 . 3 1 > 0.03 > 10oo.00 > 0.00 > 1wo.00 > O.W > IOOO.OO > 0.00 > 1ooo.on > 0.00 > 1oon.00 z 0.00
< 0.31 > 0.12 0.23 0.03 0.30 0.06 < 1.03 > 0.50 < c.42 > 0.11 < 0.23 > 0.03 < 0.20 > 0.00 c 0.11 > 0.03 c 0.20 > 0.00 c 0.19 iI.01
1.61 c 3.69 > 0 . n ~
13.61 c 0.23 > 0.03 -z 0.20 > 0.00 < 0.11 z 0.03 < 0.20 > 0.w c 0.19 > 0.01
4.48 6.33 2.85 4.61 0.88 6.61 0.33 1.33 1.28
< 0.23 z 0.03 < 0.20 > 0.00 0.11 > 0.03 0 .20 > 0.00 c 0.19 > 0.m < 0.23 > 0.03 < 0.20 > 0.00 c 0.11 > 0.03 c 0 .20 > 0.00 < 0.19 > u.01
24 .W 1.53 22.w 6;51 1 4 . 0 0 1 .53 13.33 2.19 20.41 2.92 < 0.23 > 0.03 < 0.20 w 0.00 < 0.11 > 0.03 < 0.20 > 0.w < 0.19 > 0.01
0.40 0.06 0.43 0.09 0.20 0.00 0.41 0.11 0.31 0.04 < 0.23 z 0.03 < 0.11 z 0.03 < 0.11 > 0.03 c 0.20 I 0.00 c 0.18 > 0.01
14.61 02.86 124.W 80.43 54.33 10.55 22.00 5.03 111.13 34 .I9 0.33 2.33 3.61 1.20 < 1.10 > 0.47 6.67
< 0.53 > 0.24 < 0.21 > 0.07 < 0.20 > 0.00 < 0.30 > 0.06 < 0.31 > 0.05
< 0.23 > 0.03 < 0.20 > 0.00 < 0.11 > 0.03 C 0.20 > 0.w < 0.19 > 0.01
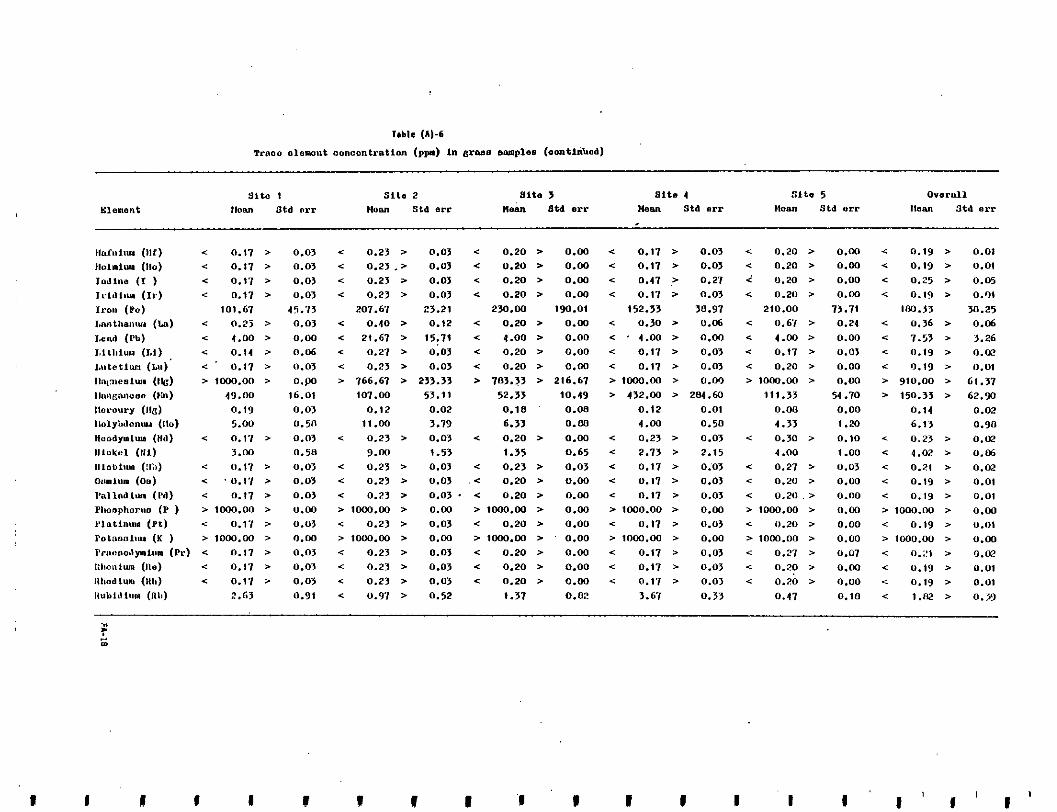
0.03 0.03 0 . 0 3 0.03
4'1.73 0.03 0.00 0.06 0.03 0.PO 16.01 0.03 o.5n 0.03 0.50 0.03 0.03 0.03 0.00 0.03 0.00
0.03 0.03 0.03 0.91
< 0.23 > 0.03 e 0.23 .> 0.03 e 0.23 > 0.03 c 0.23 > 0.03
e 0.40 > 0.12 207.61 23.21
e 21.61 > 15.11 < 0.21 > Oi03 < 0.23 > 0.03 > 766.61 > 233.33
101.00 0.12
53.11 0.02
11.00 c 0.23 > 0.03
3.79
9.00 e 0.23 > 0.03
1.53
< 0.23 > 0.03
e 0.23 > 0.03
> 1WO.M > 0.00 < 0.23 > 0.03 > I m . 0 0 > 0.00 < 0.23 > 0.03 e 0.23 > 0.03
< 0.23 > 0.03 < 0.97 > 0.52
e 0.20 > 0.00 < 0.20 > 0.00 < 0.20 > 0.00
< 0.20 > 0.00
< 0.20 > 0.00 230.00 190.01
4.00 > 0.00 < 0.20 > 0.00
c 0.20 > 0.00 > 103.>3 > 216.67
52.33 10.49 0.10 0.08
6.33 0.80
< 0.20 2- 0.00 1.35 0.65
< 0.23 > 0.03 e 0.20 > 0.00
< 0.20 > 0.00 > toO0.00 > 0.00 < 0.20 > 0.00 > 1m.m > ' 0.00 c 0.20 > 0.00 < 0.20 > 0.00 c 0.20 > 0.00
1 .31 0.02
e 0.17 > 0.03 e 0.11 > 0.05
c 0.47 .> 0.27 < 0.17 > 0.03
< 0.30 > 0.06 152.33 30.91
e 0.17 > 0.03 < ' 4 . 0 0 > 0.00
< 0.11 > 0.03 > 1m.w > 0.00
> 432.00 > 204.60 0.12 4 .w
0.01 0.50
0.23 > 0.03
2.13 > 2.15 < 0.11 > 0.03 < 0.11 > 0.03 c 0.11 > 0.03
< 0.17 > 0.03 > 1000.00 > 0.00
< 0.11 , 0.03 > 1000.00 > 0.00
< 0.11 > 0.03 < 0.17 > o.o>
3.67 0.33
e 0.20 > < 0.20 > i 0.20 > < 0.20 >
c 0.67 > 210.00
< 4 . 0 0 3.
< 0.17 > < 0.20 > > 1000.00 >
111.33 0.00
4.33 c 0.30 >
c 0.27 > c 0.20 > < 0 . 2 0 . > > 1000.00 > c 0.20 > > 10M.00 > c 0.27 >
4 .OO
e 0.20 > e 0.20 >
0.47
0.00 0.00
0.00
0.00
73.71 0.24 0.00 0.01
0.00
0.00
54 . I O
0.00
0.10
1.20
0.03 I .oo
0.00
0.00
0.00
0.00
0.00
0.01 0.00 0 .oo 0. IO
< 0.19 > 0.01 < 0.19 > 0.01
0.25 > 0.05 < 0.19 > 0 .w
< 0.36 > 0.06 100.33 30.25
c 1.53 > 5 . 2 6 e 0.19 > 0.m c 0.19 > 0.01
> 910.00 > 61.31 > 150.33 > 62.90
0.14 0.02 6.13 0.90 0.23 > 0.02
c 0.21 > 0.02
e 4 . 0 2 5 0.06
c 0.19 > 0.01 e 0.19 > 0.01
c 0.19 > 0.01 > 1000.00 > 0.00
< 0.21 > 0.02 > 1000.00 > 0.00
< 0.19 > 0.01 c 0.19 > 0.01 < l .N > 0.39

< 0.17 e 0.17 c 0.11 < 2.23 5 1 W O . 0 0 c 0.13
102. j3 19.00
'5.1333
c 0.17 < 0.17
e 0.17 c 0.17
0.17 c 0.17
10.33
c 1.17 5.00
< 0.07 0.43
e 0.11 < 0.15
20.67 0.63
5 0.03 < 0.23 > 0.03 <. 0.23 > 0.03 < 0.23 > 1.30 < 2.30 z 0.00 > 1wo.w > 0.07 e 0.23
03.05 20.00 2.52
1w.22 > 493 .33 45.67
> 0.03 c 0.23 > 0.05 c 0.23 > 0.03 c 0.23 > 0.03 < 0.23 > 0.03 e 0.23 > 0.03 < 0.23
4.90 131.33 0.58 41.67
> 0.09 c 1 .33 5 0.03 < 0 . 2 3
> 0.03 c 0.23 1.60
> 0.03 e 0.33 3.04 23 .33 0.09 0.87
0.09
z 0.03. c 0.20 > 0.00 e 0.17 > 0.0) < 0.20 > 0.00 c 0.17 > 0.03 c 0.20 > 0.M c 0.17 > 0.70 c 3.33 > 1 .33 < 0.93 > 0.00 > low.w > 0.00 z- iwo.00 > 0.03 c 0.20 > 0.00 c 0.17
13.61 20.00 1o:m 19.W
9.02 5 . 0 0
I34.33 13.33
> 0.03 < 0.20 > 0.00 < 0.17 > 251.51 I 620.00 > 294.62 < 776.67
> 0.03 < 0.20 > 0.00 e 0.17 > 0.03 < 0.20 > 0.00 0.11 > 0.03 c 0.20 > 0.00 c 0.17 > ' 0.03 c 1.40 > 0.60 e 0.11 > 0.03 c 0.20 > 0.00 c 0.17
65.3Ft 31 .02 5.46
29.50 6.00 0.00
23.67 7.00
> 0.03 c 0.20 > 0.00 e 0.17 > 0.33 c 1.30 > 0.35 c 0.03
0.70 < 0.27 > 0.01 0.W z 0.03 c 0.20 > 0.00 e 0.17 > 0.03 c 0.20 > 0.m c 0.20
3.28 I 4 .W 4.93 0.13 . 0.80 0.12
35.67 0.33
z > >
> > >
> > >
> >
>
>
> >
>
>
0.03 0.03
0.54 0.03
0.03 0.W
4 .M 1 .ffi
91.35 0.03 0.03 0.03 0.03 0.03 0.03
11.41
3.06 0.03 0.09
0.03 0.60
0.00 5.36 0.09
< 0.20 e 0.20 < Q.20
< 6.61 > 1000.00
c 0.20
230.67 77 i 11
< 0.20
250.61
< 0.20 e 0.20
c 0.20 e o.m < O.?Q
161.33
< n.20 20.33
1.67 0.G7
< O.?Q
0.43 16.61
1 . 9
> 0.00 < 0.19 > 0.w < 0.19 z 0.00 ~ 1 9 > 2.33 < i.09 > u.00 7 1000.00
> 0 .W 0.19 174 .69 5-25
3 3 . 4 24 .T?
> 0.00 < 0.19 01.62 53G.40
> 0.00 0.19 > 0.00 C 0.19 > 0.00 -z 0.19 > 0.60 < 0.55 > 0.00 < 0.19
149.40 13.30
71 .54 17.60
> 0.00 < 0.19 > 0.33 < 1.m
> 0.00 < n.19 0.24 0.75
0.13 < 0.26
0.76 I .w1 %2.07
0.07
> > > > > >
>
> > >
> > >
> 5
2.
> >
0.01 0.01
0.01
0.74 0.00 11.01
59.45 ! .??
Illi.41
0.01
0.01
0.01
0.01
0.19
32 .64 0.01
4 .m 0.01
0. I 3
0.01 0.3
0.04 2.64 q.17

> 106.67 > 13.33 < 0.57 > 0.03
0.63 55.33
0.12
< 0.20 > 0.00
7.84
< n.27 > 0.07
1.57 0.45
< 0.33 > 0.03 1 .w 1.05
> 1wo.00 > 0.00
1.25 0.30 < 0.17 > 0.03
10.33 0.61 5.61
< 1.20 > 0.42 0.61
< 0.20 > 0.00
12.00 1.51
< 0.20 > 0.00
0.20 16.00
0.00
< 0.20 > 0.00 1.15
' 0.40 0. IO c 0.11 > 0.03
0.20 2- 0.00
> 216.61 > 51.75 > 170.00 > 20.00 > 196.61 > 3.33 > 161.33 > 59.10 > 1ffi.21 j 1Z.m < 0.33 > 0.13 < 0.21 > ' 0.03 < 0.33 > 0.03 < 0 .41 > 0.12 < 0.35 > 0.04
1.57 63.33
0.72 1.20 0.40 11.22
0.93 00.33 3.04
0.03 0.13 0.22 1.01 0.17 101.61
< 0.23 > 0.03 < 0.20 > 0.00 < 0.20 > 0.00 < 0.20 > 0.06 c 0.21 > 0.01 35.04 63.33 13.53 10.40 9.15
< 0.23 > 0.03 < 0.23 > 0.03 0.23 > 0.03 0.21 > 0.12 < 0.25 > 0.03 I .Do 1.11 2.57 0.90 1 .e3 1 .w 3.33 0 . 3 3 3.61 2.67 0.00 3.05 0.31
2.27 0.33
0.93 3.61
2.01
0.33 0.37
> 1 0 0 0 . M > , 0 .0 > lwo.00 > 0.00 z 1000.00 > 0.00 > 1m.w > 0.03 > 1000.00 > 0.00 5.33 2.40 2.27 0.93 2.00 0.50 1.53 O,'% 2.13 0.61
< 0.17 > 0.03 < 0.20 > 0.00 C 0.20 > 0.00 < rJ.23 5 0.03 < 0.19 > 0.01
19.00 9.67
0.50 52.33 5.61 19.00 2.61 11.33 4.26
4 .oo 0.33 5.00 0.00
1 .I6 1.00
1 1 . n 2.51 1.53
1 .03 1.73 1.10
0.13 0.93 9.61
0.07 . ' 2.00 4.26
0.50 < 1.57 > 1.22 c 1.51 > 0.29
0.61 0.00 16.33 . 4.70 32.33 9.33 15.m 5.:!6 < 0.23 > 0.03 < 0.20 > 0.00 < 0.20 > 0.00 < 0.20 > 0.06 < 0.21 > 0.01
0.03 < 11.22 > n.01
< 0.33 > 0.09 < 0.20 > 0.00 < 0.20 > 0.00 c 0.20 > 0.06 < 0.23 > 0.02 34 .oo 64.13 ?I .52
0.03 0.17 0.41 0.m 0.40 0.10 < n.60 > 0.21 < 0.51 > 0.07
< 0.23 > 0.03 < 0.20 > 0.00 c 0.20 > 0.00 < n.20 > 0.06 c 0.21 > 0.01
< 0.40 > 0.06 < 0.33 > 0.03 < 0.30 > 0.00 < 0.33 > 0.03 0.34 > 0.02
< lJ.23 > 0.05 < 0.20 > 0.00 < 0.20 > 0.00 0.20 > 0.06 < (1.21 > 0.01
0.27 151.0 116.52
0.01
49.00 0.20
20 i 0 3 0.00 < 0.20 > 0.00
46.61 0.23
9.04 52.00
< 0.23 > 0.05 0.20 > 0.00 < 0.20 > 0.00 < 0.23 > 0.Uj 0.21 > 9.01

I I I 1 I I L L
< 0.20 > 0.00 < 0.23 > 0.03 < 0.20 c 0.20 > 0.00 c 0.23 > 0.03 c 0.20
0.21 < 0.20 > 0.00 < 0.23 > 0.03 < 0.20
0.07 0.51 0.03 < 0.23
513.33 13fi.42 0.07
570.00 113.00 593.33 0.07
29.33 1 .I6 4 .GI 53 .33
1.20 1.53
0.61 0.10 6.01 17.61
0.51 0.23 < 0.20 > 0.00 < 0.23 > 0.03 < 0.20
0.53
> 100o.w > 0.00 > 156.61 > 233.40 > m o . o o 114.67 110.41 115.33 49.15 300.00 0.58 0.15 4.67
0.25 0.33 5.61
0.03 2.03
0.40
0.53 0.09 1.05 0.60 4.33
I .90 3.33 0.88 4.67, 1.20 6.00
< 0.21 > 0.03 C 0:51 > 0.17 c 0.37 < 0.20 > 0.00 < 0.23 > 0.03 < 0.20 C 0.20 > 0.00 < 0.23 > 0.03 < 0.20 > lwo.00 > 0.00 > 1000.00 z 0.00 > 1000.00 < 0.20 W 0.00 < 0.23 > 0.03 .C 0.20 > 1 w o . 0 0 > 0.00 > 1000.00 > 0.00 > 1wo.00
> > > >
> >
> > >
> >
>
0.00 0.00 0.03 0.00
124.41 0.41 1 .GI 0.12
0.00 0.00
1W.62
0 . 3 3 0.03
0.10 2.00
0.00 0.03
0.W 0.00
0.00 0.00
< 0.20 > 0.00 c 0.20 I 0.06 < 0.21 > 0.01 < 0.20 > 0.00 < 0.20 > 0.06 -z 0.21 5 0.01
0.30 < 0.20 > 0.00 c 0.20 > u.06 < U.?I > 0.01
0.00 0.33 0.03 < 0.14 > 0.03
306.61 0.93
03.53 143.33 112.15 513.35 0.07 0.m
53.11
11.61 2.11 36.61 4 .63 0.09 I .71
30.33 0.45 4 .w
0.60 0.21 < 0.31 > 0.4) c 0.55 > 0.07 < 0.20 > 0.00 c 0.20 > 0.06 < 0.21 > 0.01 > lwo.00 > 0.00 > 793.33 > 206.61 > 910.00 > 60.45
203.33 54.57 232.00 204.01 222.67 0.56 0.1 I 0.47
55.45
0.00 0 . W
1 .OO 4.33 0.41 0.05
1 .ffi 5.40 0.57 0.12 0.60 0.06 0 . W 0.21
0.67
6.61 c 0.43 > 0.15 c 0.23 > 0.03 c 0.31 > 0.05
1.33 6.33 1 .GI 5.40 0.65
c 0.20 > 0.00 c 0.20 > 0.06 < 0.21 5 10.01
c 0.20 > 0.00 . < 0.20 > 0.06 < 0.21 > 0.91
> lwo.00 > 0.00 > 1000.00 > 0.00 > 1wo.00 > 0.00
' > 1000.00 > 0.00 > 1wo.00 > 0.00 > 1oO0.00 > 0.m < 0.20 1 0.00 -Z 0.20 > 0.06 < 0.21 > 0.01
Praesodynlm (a) 0.33 0.03 I .03 0.40 0.33 0.01 0.21 0.01 0.37 0.03 0.47 0.11 < 0.20 w 0.00 c 0.23 > 0.03 c 0.20 .' 0.00 < 0.20 > 0.00 < 0.20 > 0.06 c 0.21 > 0.01
RhodIu. (Rh) < 0.20 > 0.00 < 0.23 > 0.03 c 0.20 > 0.00 < 0.20 r 0.00 c 0.20 > 0.06 < 0.21 > 0.01
3.67 0.33 2.33 0.67 4.67 1.20 4.67 1.20 1.33 0 . 3 3 3.33 0.47
nhcnluo (ne)
A"b1dlum (Ab)
i] E l

< 0.20 > . 0.03 0.23
< 1.01 > > R20.00 > < 0.211 z
223.33 14.33
'190.61 < 11.20 > < 0.20 > < 0.20 >
< 0.20 > < 0.20 >
c 0.20 > > 300.61 >
99.33
c 1.00 > 0.20 >
< 0.20 > 2.33
25.35 0.61
2.33
0.00
0.09
0 . 4 1 0.03
180.00
0.00 90.62
5.90 43.06 0.00
0.00
0.00
0.00
0.00
312.22 0.00
45.51 0.00 0.00
0.33 0.00
0.20
2.33 0.61
< 0.23 > 0.03 < 0.20 > 0.93 0.01 0.93 0.53 1.41 > 0.53 < 1.11 >
0.61
> I w o . 0 0 > 0.00 > lMo.00 > < 0.20 > 0.06 < 0.20 > > 240.00 > 95.39 > 130.00
0.m
300.00 29.m 12.66
95.04 46.00
430.00 c 0.23 > 0.03 < 9.20 >
0.23 > 0.03 -z 0.20 > < 0.23 > 0.03 < 0.20 > < 0.23 > 0.03 < 0.20 > < 0.23 Z 0.03 < 0.20 > < 0.23 > 0.03 < 0.20 >
51 .00 31.53 > 354.00 > 22H.W 107.23 153.00
< 0.23 > 0.03 C 0.20 > < 1.53 > 0.33 < 0.91 >
< 0.27 > 0.03 < 0.20 5
6.00 . 2.08 3.61
31 .00 4.61
9.02 3.18 1 .00
26.61 55.33
22.61 3.61
0.00
0.15
0.43 0.23
0.00
50.00 0.00
0.96 190.00
0.00
0.00
0.00 0.00
0.00
323.35 0.00
31.85 0.00
0.03
0.00
1.20
0.50 11.61 0.00
< <
< > E
>
< < <
< <
<
< <
<
0.61 > 0.24 0.20 > 0.00 < 0.20 z
0.93 0.03 0.9 0.90
020.00 > 100.00 > 110.00 > 0.61 > 0 . 4 < 1.10 >
0.20 > u.00 < 0.23. > 549.33 > 145.92 > 413.33 >
19.00 6.66 23.67 240.00 85.05 z 394.00 >
0.20 > 0.00 < 0.20 > 0.20 > 0.00 c 0.20 > 0.20 > 0.00 < 0.20 > 0.20 > 0.00 < 0.20 >
0.20 > 0.00 < 0.20 > 0.20 > 0.00 < 0.20 >
304.67 193.91 81 .00 11.14
239.00
0.20 > 0.00 c 0.20 > 01 .no
3.00 1.00 > 0.00 < 1.61 >
0.00 2.3> 0.20 > O.M 5 0.20 > 0.60
51 .GI 16.90 3.61 0.61 1.67
0.06 0.10
6 7 .oo
0.06
0.06
0.06 0.45
122.MI 0.03
103.66
4.91 KI5.61
0.06 0.06 0.06
0.06 0.06
133.M 0.06
12.11 0.06
0.33 0 . 3 3 0.06 0.06
51.51 0.61
< 0.21
c 0.03
1.0) 0.53
> lv12.00 < 0.21
z 3 3 1 . 2 ~ 26.10
> 290.93 c 0.21 < 0.21
< 0.21 < 0.21 < 0.21
0.21
> Z65.W
< 0.21 12l1.41
< 1.19 3.41
< 0.21
I .53 41.21
I.C*
> 0.01 > 0.ffi
0.12 > 0.11 z. 54.50 > 0.01
, 44.1X3
> 11.04 4 .?9
> 0.01 > 0.01
> 0.01
> 0.01 > 0.01
z 0.01 > 91.56
25.16 > 0.01
> 0.11
> 0.01 0.55
0.69 10.60 4.61
P
h

< 0.20 17.00
< 0.03 103.00
< 0.20 < 0.10
0.40
< 0.40 5.61
> 1000.00
0.53 < 0.10 > 583.33
< 0.m 3.67
< 0.20 10.67
c 0.20 < 0.20
0.20 91 .OO
c 0.37 1.33
9.54 10.61 6.33 > 0.00 < 0.20 z 0.00 c 0.20
20.33
> 0.09 < 0.13 > 0.12
58.16 46.00 9.24 3.21 51.61
> 0.00 < 0.30 > 0.06 < 0.23 > 0.00 0.17 > 0.0) < 0.20
0.12 0.13 0.3?
0.22 5.00
0.37 2.08 13.61
> 0.06 c 0.33 z 0.01 c 0.31 > 0.00 > tooo.00 > 0.00 > 10w.w
> 0.00 c 0.10 > 0.w < 0.10 0.24 0.23 0.03 0.40
> 212.19 > 516.61 > 241.82 633.33 2.00
> 0.51 < 0.47 > 0.22 < 0.27 54.61 11.61 2.40
2- 0.00 0.11 > 0.03 < 0.20 ,171.61
> 0.00 < 0.17 > 0.05 < 0.20 > 0.00 c 0.11 z 0.03 < 0.20
> 0.00 < 0.11 > 0.03 < 0.20 24.01 153.00 32.1) 91 .53
0.33 6.27 k .08 1 .?? > 0.03 < 0.33 > 0.09 < 0.40
(1.08 3.00 0.58.
> 0.00 < 16.84
2.31 9.82
2. 0.00 < > 0.05 c
0.03 0.3
> 0.w < > 0.00 >
> 0.00 < 0.20
164.96 > 0.00
> 0.03 < 164.11
> 0.00 < > 0.00 < > 0.00 <
39.49 > 0.00
0.53 > 0.00 <
3 . 0 0 0.W
'3.67 0.m > 0.60
1 .I6 W.?3 m.37 0.20 > 0.00 0.47 > 0.27 1.23 0.88 6.00 0.50 0.60 > 0.21
iwo.OO > 0.w 0.23 0.13 > 0.03
0.03
676.67 Z 197.01 4 .00 1 .on
23.61 1.71 > 1.13
12.17 0.20 > 0.00
0.20 > 0.00
0.20 > 0.00
109.67 10.33 0.20 > 0.02
6.61 4.61 0.57 > 0.09
> < <
< <
< >
<
<
<
< <
<
c
61.00 > 19.51 0.27 > 0.07 0.11 , n.03
33.33 6.36 0.20 > 0.w o.n > n.05 1.10 0.45
18.W 14.50 0.60 > 0.21
1ooo.M) > 0.w 0.m 0.23 0.13 > 0.03
116.61 123.41 5.33 2.03
13.33 1.43 > 0.57
0.20 > 0.00 7.88
0.20 > 0.00
139 .OO
0.20 > 0.00
0.20 > 0.00 41.06
0.83 0.11 0.37 > 0.09
5
<
<
< <
< >
< >
<
<
< <
<
<
21.60 > 10.50 0 . 3 3 > 0.12 1.05 > 0.61
61 .67 0.19 > 0.01
12.06
n , ? ~ 5 "."5 0.11 0.20
0.46 > 0.06
9.61 2.05
1wo.w > 0.00
0.11 > o m 517.33 > 15.W 3.60 0.51
0.19 > 0.01 33.53
0.19 > o m
0.40 0.08
50.20 0.96 > 0.28
0.19 > 0.01
110.00 14.07 0.19 2- 0.01
3.29 1.34 0.37 > 0.02
: < 0.20 > 0.00 c 0.17 z 0.03 0.20 z 0.00 0.20 > 0.00 < 0.20 > 0.00 < 0.19 > 0.01

M C M 3 t $ L.l.1.
::1tc I SltO 2 MCRD D t d err
< 0.20 > 0.00 < 0.11 > 0.03 < 0.20 > 0.00 0.17 > 0.03
0.50 0.15 < 0.50 > 0.25 < 0.20 > 0.00 < 0.17 > 0.03
122.33 1.10
24 . I4 0.47 < 0.50 > 0.12
144.00 34 .?a
< 0.10 > 0.00 0.10 2. 0.00
< 2.GI > 0.61 < 2.50 > 0.29
c 0.20 > 0.00 < 0.11 > 9.03 > 1000.00 > 0.00 > 1wo.00 > 0.00
12.00 10.00 1 :53 0.33 < 0.02 > 0.00 < 0.02 > 0.00
< 0.30 > 0.06 0.31 0.67
3.67 0.01
C 0.50 > 0.06 1.20 3.00 0.50
0.43 0.4
< 0.20 > 0.00 < 0.11 > 0.05 < 0.20 > 0.00 < 0.17 > 0.03
> 1wo.00 > 0.00 > 100o.Ou > 0.00
< 0.20 > 0.00 < 0.11 > 0.03 > looo.w > 0.00 > 1000.00 > 0.00
< 0.20 > 0.00 < 0.20 > 0.00 < 0.11 > 0.03
0 .13 0.03
< 0.20 > 0.00 < 0.17 5 0.03 5 .55 1.45 5.67 0.00
4 . G I 0 . 3 3 , 3.67
l l e m .Std orr 3 1 t o 3
< 0.20 > 0.00
< 0.20 > 0.00
< 0.20 > 0.00 1.11 0.43
6t6.67 219.27 0.73 0.03
< 2.00 > 0.00 0.10 0.00
.z 0.20 > 0.00
> 1000.00 > 0.00
2.00 < 0.02 > 0.00
0.58
4.33 < 0.33 > . 0.4
0.33
< 4 . 0 0 > 1.00 < o m z 0.06 < 0.20 2. 0.00
< 0.20 > 0.00
< 0.20 > 0.00
> 1ooo.w > 0.00
> Iwo.00 > 0;w
< 0.20 > 0.00
0.20 O.M)
< 0.20 > 0.00 4 .33 0.80
31te 4 l l o m Std err
< 0.20 > 0.00 < 0.20 > 0.00
c 0.20 2. 0.00 0.73 0.05
20 .33 51.57 0.97 0.52
c 0.13 > 0.03 10.33 > 6.14
< 0.20 > 0.00
> 1000.00 > 0.00 2.67
< 0.02 > 0.00
0.33
4 .OO 0.50 < 0.30 > 0.06
. 9 .00 < 0.40 > 0.15
7.00
< 0.20 > 0.00
< 0.20 > 0.00
> 1ooo.w z 0.00 < 0.20 > 0.00 > I000.00 > 0.00
< 0.20 z 0.00
< 0.11 , 0.03
< 0.20 > 0.00 I I .oo 1 .I3
< 0.20 > 0.00 < 0.20 > 0.00
0.90 0.55 < 0.20 > 0.00
165.33 73.00 1 .07
< 0.50 > 5.77 0.41
0.17 > 0.03
> 1000.00 > 0.w < 0.20 > 0.00
< 0.04 > 0.02 2.00 0.00
c 0.33 > 0.W 4.61 0.33
< 0,.51 > 0.12 4.33 l . M
< 0.20 > 0.00
< 0.20 > 0.00 > 1000.00 > 0.00
< O.?O > 0.00
> 1ono.oo > 0.00
< 0.20 > 0.00
< 0.20 > 0.00
< 0.20 > 0.00
4.3; 0 . LID
i 0.19 > 0.01
< 0.19 > 0.01
< 0.16 > 0.14 < ,0.19 > 0.01
252.33 64.02 < 0 . C l > 0.16 < 5.20 > 1.74 < 0.12 z 0.01
> 1000.00 > 0.00
< 0.19 > 0.01
4 . 0 0 2.01 < 0.03 j 0.m
4 .?I 0.21 < 0 .33 > 0 .02
4 . m > 1.36 e 0.rw > 0.05 < 0.19 > 0.01
< 0.19 > 0.01
e 0.19 5 0.01
0.13 > 0 . 0 1
> 1000.0~1 > 0.m
-: ll.10 > ,,.01
< SJ.19 > 0.01
!i.7.> 0.c1
> Iwo.00 > 0.00
I a t I I n I I i I I I

< 0.20 > 0.w c < 0.40 > 0.20 < i 0.20 z 0.00 <
0.51 0.03 <
c 0.20 > 0.00 c > 520.33 > 215.14
> 440.00 > 35.12 > 50.61 24.61
z 990.00 > 10.00 > < 0.20 > 0.w c < 0.20 > 0.00 <
< 0.20 > 0.00 c c 0.20 > 0.00 c
c 0.20 > 0.00 c < O.?O > 0.00 c
46.00 21.59 6.W 1.15
< 0.20 > 0.00 c 0.20 > 0.00 c 0.33 0.03
< 0.20 > 0.w c 0.23 > 0.13 c
146.33 3.33
01.in 0.08
0.11 >
0.11 > 0.30 >
0.61 > 306.61 0.17 >
390.00 > 34 .61 a40.00 , 0.11 > 0.23 z 0.11 > 0.11 z 0.11 > 0.11 5
50.33
0.11 , 4 . 0 0
0.11 0.21 0.17 , 0.13 >
165.00 2.61
0.03 0.10
0.18 0.03
103.90 0.03 Do.03 6.36 85.05 0.03 0.w
0.03 0.03
0.03
20.03 0.03
1 .w 0.03 0.03 0.07
0.03 0.03
12.63 0.33
< 0.20 > 0.00 c c 0.20 > 0.00 c c 0.20 2- 0.00 < .z 0.03 > 0.03 c
c 0.20 > 0.00 c > 436.61 > 21.86 >
250.W 18.10
42.11 21 .o> > 1000.w > 0.00 > c 0.20 > 0.00 c d. 0.20 z 0.00 c < 0.20 > 0.00 c < 0.20 > 0.00 c c 0.20 5 0.00 c .F 0.20 > 0.00 c > 305.33 > 310.13 >
4.61 0.61 c 0.20 > 0.00 <
< 0.41 , 0.21 C
C 0.23 > 0.03 c 0.20 > oiw < -z 0.10 > 0.00 c
126.61 2.33
51.32 0.33 <
0.20 > 0.00 c
0.20 > 0.w c
0.20 > 0.00
0.11 > 0.19 < 34.61 9.35 0.41 > 0.21 c
420.00 > 3 4 - 6 4 >
15.11 1.38 723.33 > 216.61 > 0.20 > 0.00 < 0.40 > 0.06 c
0.20 > 0.00 c 0.20 2- 0.00 c
0.20 > 0.00 c
0.20 > 0.00 <
342.00 > 329.05
0.20 > 0.00 c 4.33 0.00
0.41 > 0.27 c 0.20 0.06 < 0.20 > 0.w c
0.13 > 0.03 c 93.33 3 .I6 5.33 Z ' 2.40
0.20 > 0.00 c 0.51 > 0.17 < 0.70 > 0.00 0.60 > 0.12 C
210.00 145.26 > 0.20 > 0.00 <
?.!?.)f % 1!!.?? >
993.33 > 6.61 >
0.20 > 0.00 c 0.20 > 0.00 <
0.20 > 0.00 < 0.20 > 0.00 c
0.20 > 0.00 <
0.20 > 0.00 <
171.00 146.09 >
34.33 10.93
4.33 0.33 0.20 > 0.00 <
0.20 > 0.00 < 0.20 > 0.00 <
0.20 > 0.00 < 0.13 > 0.03 <
92 .OO 25.51 1.33 0.33 <
0.19 > 0.01
0 . e > 0.05 0.19 > 0.01
0.69 > 0.06
211.95 , 70.11) u.25 > 0.wj
<?L.OS : tZ .45
909.37 > 51.32 35.40 6.10
0.25 > 0.05
0.19 , 0.01
0.19 > 0.01
0.19 > 0.01
0.19 > 0.01
0.19 > Q.01
?00.17 > c9.15
0.19 > 10.01 I .61 0.31
0.?5 > 0.02 0.iO > , , .VI
0.19 > 0.01
0.15 5 0.03 124.61 22.61 7.00 > 9.57