hatchery and wild production of pacific salmon in relation to large
TRANSCRIPT

ICES Journal of Marine Science, 54: 1200-1215. 1997
Hatchery and wild production of Pacific salmon in relation to large-scale, natural shifts in the productivity of the marine environment
R. J. Beamish, C. Mahnken, and C. M. Neville 0 /P Beamish, R. J., Mahnken, C., and Neville, C. M. 1997. Hatchery and wild production of Pacific salmon in relation to large-scale, natural shifts in the productivity of the marine environment. - ICES Journal of Marine Science, 54: 1200-1215.
Pacific salmon have been fished extensively for at least a century and artificial production of Pacific salmon has been a management strategy to improve production for almost as long. Hatchery production is considered important because it is commonly believed that the carrying capacity for salmon in the ocean has remained more or less constant and is underutilized as a consequence of limited production of smolts in fresh water. Since the mid-1960s there has been an increase in hatchery production, partly as a response to a desire to increase catch and partly because of improved hatchery techniques. Since the late 1970s there has been a dramatic increase in the total Pacific salmon catch. The increases in catch are now known to result from a large-scale shift in the productivity of the sub-arctic Pacific and management and enhancement actions. Environmental indices changed about 198991990 and may indicate that the productive regime of the 1980s has ended. This would imply that under natural conditions Pacific salmon abundance would decline. There are no clear indications of what to expect in the new regime, but it is apparent that the massive production of artificially reared Pacific salmon would not be necessary in a less productive regime. Of concern is the impact that the large numbers of artificially reared salmon will have on wild salmon stock levels.
0 1997 International Council for the Exploration of the Sea
Key words: climate change, hatcheries, Pacific salmon.
R. J. Beamish and C. M. Neville: Fisheries and Oceans Canada, Pa@ Biological Station, Hammond Bay Road, Nanaimo, B.C., Canada V9R 5K6. C. Mahnken: National Marine Fisheries Service, Manchester Marine Experimental Station, PO Box 130, Manchester, Washington 98353, USA
Introduction
Pacific salmon have been fished extensively for over a century and have become the priority for fisheries man- agement in the four major salmon-producing countries. The management of Pacific salmon is complicated by human development which results in the loss of fresh- water spawning and rearing areas, and affects recruit- ment. It is surprising, therefore, that the catches of Pacific salmon by Canada, United States, Russia, and Japan are at historic high levels. An almost threefold increase in catch has occurred since the early 1970s when historic low catches occurred almost synchro- nously in all four countries. The rapid increases in catch and in spawning abundances in the 1980s and early 1990s were a result of management, enhancement pro- grammes, and a favourable environment. However, high harvest rates in ocean fisheries targeted on the abundant hatchery stocks makes conservation of wild stocks difficult, especially during periods of decreasing ocean
10543139/97/061200+ 16 $25,00/0/jm970305
productivity. In general, in the late 1970s and 1980s Pacific salmon management rebuilt stocks and increased catches but many now think that it is time to manage Pacific salmon to preserve wild stocks (NRCC, 1996). In this paper, we review the history of the fishery and the enhancement programmes in relation to the new con- cepts that Pacific salmon abundance fluctuates naturally as a result of decadal-scale changes in climate and the ocean. The critical issue is the effect that a natural decline in productivity will have on the relative survival of the wild and hatchery population segments.
Methods
Hatchery production
Annual production from Pacific Rim hatcheries of five species of Pacific salmon was obtained from published and unpublished sources. A comprehensive historical data set was compiled from previously unreported raw
0 1997 International Council for the Exploration of the Sea
Downloaded from https://academic.oup.com/icesjms/article-abstract/54/6/1200/674023by gueston 14 April 2018

Pa& salmon 1201
data forms archived by fishery agencies, annual reports of hatcheries, and electronic databases. Complete data series from Russia and Korea were unavailable, but discontinuous Russian data were available from three sources and were used to estimate the total present Pacific Rim output (Konovalov, 1980; Mahnken et al., 1983; Heard, 1995).
Hatchery production trends for the 40-year period from 1950 to 1990 were analysed for all five species from four geographic areas: the Pacific Northwest (Washington, Oregon, Idaho, and California), Canada (British Columbia), Alaska, and Japan (Honshu and Hokkaido).
We chose coho (Oncorhynchus kisutch) and fall chinook (Oncorhynchus tshawytscha) (chinook that re- turn to the rivers in the fall) salmon for analysis of temporal and geographic variation in survival because of the large continuous data sets. Survival information for coho and chinook salmon is from coded wire tag (CWT) databases maintained by the Pacific States Marine Fisheries Commission (Coronado-Hernandez, 1995). We computed mean survivals from this data set and used two-way analysis of variance to make statistical comparisons of mean survival values over time. Pairwise comparisons between sampling dates were made using the Fishers PLSD test (p<O.O5). Survival data for Japanese chum (Oncorhynchus keta) salmon was pro- vided by Masahide Kaeriyama and Shigihiko Urawa of the Hokkaido Salmon Hatchery, Hokkaido, Japan.
The interaction of hatchery and wild Pacific salmon was examined by comparing estimates of hatchery production (including Russian hatchery production) with wild production for the years 1974 and 1992. We selected 1974 because this was the year of lowest average catches and 1992 is the latest year of complete hatchery releases. Pink (Oncorhynchus gorbuscha), chum, and sockeye (Oncorhynchus nerka) salmon were used because they represent approximately 90% of the total catch in the Pacific. We simplified assumptions of escapements, marine survival, and average weights to produce a first approximation of production. For all species we used an estimate of harvest rate of 70% and an escapement of 30%. Because catch increased in the 1980s lower sur- vival rates were used in 1974 than in 1992 and we used heavier average weights in 1974 than in 1992. Survival rates for pink, chum, and sockeye salmon respectively were based on data published by Heard (1991) Burgner (1991) and Salo (1991). Mean weights for all three species were taken from Bigler et al. (1996).
Fishery
Pink, chum, sockeye, coho, and chinook are the major species contributing to the Pacific salmon fishery. Steelhead (0. mykiss) and masu salmon (0. masou) are important regionally, but their abundance is small com-
pared with the other species. The largest catches of all species of salmon occurred in the United States (43%), most from Alaska. Japan accounted for 28% of the catch, Russia for 20%, and Canada caught 9% of the total landings over the period 1985-1995. In recent years (1985-1995), pink, chum, and sockeye have represented 93% of the catch. The species vary in national and regional importance but sockeye commands the highest price in all countries. Chinook and coho, despite their relatively low abundance, are highly valued in the North American recreational fishery.
Because of their high abundance, we use the catches of pink, chum, and sockeye to represent the catch history of Pacific salmon in this century. Catch has been shown to be a reliable indicator of abundance (Beamish and Bouillon, 1993; Hare and Francis, 1995). The North Pacific catch of pink, chum, and sockeye was high in the 1920s and 1930s with the highest catch of 837 400 t occurring in 1939 (Fig. 1). From 1944 to 1974 catches were at their lowest level, with the lowest of 269 200 t in 1974. Catches then increased steadily with the historic high catch of 897 500 t occurring in 1995. There is no indication that the increasing trend of catches has changed. However, there are indications of small reduc- tions in catch in some areas and it is possible that the expected decline has started.
There has been a general trend to reduced body sizes associated with the increased abundance in the 1980s and 1990s (Ricker, 1981; Ricker, 1995; Bigler et al., 1996). Perhaps the most striking changes in size are evident from the Japanese chum salmon fishery from 1985 to 1995, which accounted for 68% of the total chum salmon catch for this period. There has been a continuous decline in weight of between 11 and 32% body weight from 1970 to 1988 (Ishida et al., 1993). While there have been a number of possible explanations for these size changes including size-selective fishing gear (Ricker, 1981), the size changes are generally believed to reflect density-related reductions in growth associated with increased abundance (Bigler et al., 1996).
The combined commercial and recreational chinook salmon catches in both Canada and the United States have declined since 1974 (Fig. 2a, b). The decrease in Canada (Fig. 2a) has been a steady decline that is strongly linear (r2=0.91). In the United States (Fig. 2b), a declining trend started about 1988. Total coho salmon catches have remained constant in Canada (Fig. 3a) and have increased in the United States (Fig. 3b). However, catches of coho salmon at the southern limit of their distribution, off Canada and off Washington and Oregon, decreased in the 1990s. No fishery was allowed off Washington and Oregon in 1994 and 1995, and a much reduced fishery was allowed in 1996. Preliminary catch data from 1997 indicate a large reduction in catch throughout most of the stocks from Oregon to Alaska.
Downloaded from https://academic.oup.com/icesjms/article-abstract/54/6/1200/674023by gueston 14 April 2018

1202 R. J. Beamish et al.
800
1
1925 1935 1945 1955 1965 1975 1985 1995 Year
Finure 1, Catches of nink. chum. and sockeve salmon by the four major salmon producing countries from 1926 to 1995, showing the’high catches in 1695 and historic low catches in 1974.
Trends in hatchery production
Sockeye salmon
Sockeye salmon were propagated in Alaska before the turn of the century and in British Columbia before 1917. However, initial culture efforts produced no consistent benefits and production ceased soon thereafter (Foerster, 1968; Allee, 1990). In Washington State, artificial propagation of sockeye salmon began in 1896 at the Baker Lake Station in the Skagit River basin, and in the Columbia River in the 1940s to mitigate for losses of sockeye due to construction of hydroelectric dams (Mullan, 1986). Disease and low returns forced aban- donment of the Columbia River programmes in the 1960s.
In recent years, sockeye salmon culture has been re-established in Alaska and British Columbia using two different methods of artificial propagation. Hatchery production increased from 2 million in 1960 to over 300 million in recent years (Fig. 4). British Columbia is now the largest producer of artificially propagated sockeye salmon, reporting more than 290 million fry in 1993 (Fig. 4). Alaska re-established hatcheries for sock- eye in 1974 and releases have increased to 75 million smelts in 1992, or 21% of the total North American production.
1980 1985 Year
4 ( 6) 1
10970 I I I I I I
1975 1980 1985 1990 1995 Year
Figure 2. Total catches of chinook salmon (commercial and sport) in (a) Canada and (b) the United States from 1974 to 1993. The dashed line indicates a strong linear decline in a (?=0.91) and a weaker linear decline in b (?=17).
Downloaded from https://academic.oup.com/icesjms/article-abstract/54/6/1200/674023by gueston 14 April 2018

Pa+ salmon 1203
(a) 10 1 I
10970 I I I I I I
1975 1980 1985 1990 1995 Year
4-
2-
10970 I I I I I
1975 1980 1985 1990 1995 Year
Figure 3. Total catches of coho salmon (commercial and sport) in (a) Canada and (b) the United States from 1974 to 1993. The dashed line indicates little change in a and there is an increase in b (?=0.32).
Chum salmon
Japan began rearing chum salmon in hatcheries in the late 1880s and production remained at below 0.5 billion
fry until the 1960s. In the early 1960s it was also observed that larger fish of 2-3 g average weight released to coastal waters later in the spring survived at a much higher rate (Mayama, 1985). Marine survival from unfed fry released in 1950-1960 averaged 1.2%; survival improved to 2.3% after 1966 as the percentage of fed fish increased (Isaksson, 1988). Over this period Japanese hatchery production increased from 260 million fish released to around 580 million (Fig. 5a). The Japanese chum salmon hatchery system entered a phase of rapid industrialization in the 1970s and production rose from 580 million fry in 1970 to 2 billion in 1981. After the early 198Os, Japanese production of chum salmon was maintained at this level. There are virtually no wild stocks left in Japan; their entire catch being dependent on their hatchery programme (Kaeriyama, 1996). Currently, there is concern about the dependence on hatchery production and attempts are being made to develop wild stocks that will spawn naturally with a corresponding reduction in hatchery production.
In North America, enhancement efforts for chum salmon also accelerated in the 1970s (Fig. 5a), adding an additional 850 million fry to the already impressive releases by Japan for a total Pacific Rim production of nearly three billion chum salmon fry (exclusive of Russian hatchery releases).
Pink salmon
Pink salmon is second to chum salmon in the numbers of juveniles released into the North Pacific Ocean; accounting for 29% of the total reported in 1992 (Heard, 1995). Alaska is the largest producer of hatchery-reared
Sockeye salmon
nL 1975 1980 1985 1990
Release year
Figure 4. Production of sockeye salmon from the Pacific Northwest (Washington, Oregon) (U) British Columbia spawning channels @I), and Alaska hatcheries 0 from 1960 to 1993.
Downloaded from https://academic.oup.com/icesjms/article-abstract/54/6/1200/674023by gueston 14 April 2018

1204 R. J. Beamish et al.
g 1250
2 (b)
Pink salmon
250
1965 1970 1975 1980 1985 1990 Release year
Figure 5. a. Production of chum salmon from the Pacific Northwest (Washington, Oregon) (Q British Columbia (o), Alaska (4, and Japanese hatcheries @), 1950 to 1993. Note that Japan produces the majority of chum from hatcheries. b. Production of pink salmon from the Pacific Northwest (Washington, Oregon), British Columbia, Alaska, and Japanese hatcheries, 1950-1993.
pink salmon. In Alaska, the releases remained low (less than 100 million) until the early 1980s when an indus- trialization period began and the numbers increased tenfold to a total of 1006 million in 1992 (Fig. 5b). Russia is the second largest producer of hatchery-reared pink salmon; releasing 584 million juveniles in 1992 (Heard, 1995; McNair, 1996); however, the Russian hatchery releases are not included in Fig. 5b as their continuous production history was not available to us.
Coho salmon
Coho salmon are released either as fry or as yearling smolts. Coho salmon production in western North
America grew slowly from its inception at the turn of the century; up to 1940 the output from hatcheries never exceeded about 25 million fish annually (Fig. 6a). In the 1950s and 1960s advances in the knowledge of feeds, disease prevention, and the early life history culture requirements of coho salmon led to improved post- release survival of hatchery fish and an industrial phase of expansion that lasted through the 1970s (Lichatowich and McIntyre, 1987). In the late 1970s and early 1980s private sea ranches added 9.3 million smolts per year to Oregon coastal production (Fig. 6a) and helped lead to a record production of 198 million hatchery coho salmon in 1981. In the 1980s coho salmon production in Washington and Oregon stabilized then began to
Downloaded from https://academic.oup.com/icesjms/article-abstract/54/6/1200/674023by gueston 14 April 2018

Pacific salmon
(a) Coho salmon
500 (b)
Chinook salmon
f900 1910 1920 1930 1940 1950 1960 1970 1980 1990 Release year
Figure 6. a. Production of coho salmon from the Pacific Northwest (Washington, Oregon) (U), British Columbia (II), and Alaska, hatcheries 0, 1900 to 1992. b. Production of chinook salmon from the Pacific Northwest (Washington, Oregon, California), British Columbia, and Alaska hatcheries, 1900 to 1992.
decline, but the decline was offset by an added produc- tion of 40 million hatchery fish from Alaska and British Columbia.
Chinook salmon
Hatchery production of chinook salmon, the first salmon species to be artificially propagated in western North America, began in Washington State in 1895, and production grew slowly to around 40 million fish released until the late 1940s (Fig. 6b). The industrial phase of chinook salmon hatchery production began in the 1950s as development in the Pacific Northwest resulted in the loss of freshwater habitat and increased
fishing effort. New hatcheries were constructed on the Columbia River and in the Puget Sound region from 1950 to 1980 and in British Columbia and Alaska in the 1980s adding another 400 million fish annually. By 1988, when production peaked, more than 420 million fry, fingerling, and smolts were being released from eastern Pacific hatcheries, a sevenfold increase from the base level of 59 million fish released in 1949.
A period of declining production began in 1989 in most sectors of the chinook salmon hatchery system. This decline can be attributed to various factors. Survival of adult hatchery fish had declined following the oceanic regime shift in 1976-1977 and a series of El Nifio events in the late 1970s and early 1980s. These
Downloaded from https://academic.oup.com/icesjms/article-abstract/54/6/1200/674023by gueston 14 April 2018

1206 R. .I. Beamish et al.
I All species
1960 1970 Release year
Figure 7. Total hatchery and enhanced production of the five major species of Pacific salmon, from the Pacific Northwest, British Columbia, Alaska, and Japan, 1950 to 1992. Sockeye (Q; Chinook Q; Pink (Q; Chum @); Coho (U).
conditions, in association with large removals by the fishery, resulted in reduced spawning escapement and hatcheries were unable to meet egg needs for full pro- duction. More restrictive policies, introduced to protect the remaining wild populations, and reduced operating budgets at some hatcheries, further reduced chinook salmon production.
Total Pacific Rim production
Total Pacific Rim production for all species combined, excluding Russia, can be divided into four phases (Fig. 7). The developmental period began in the late 1800s and ended around 1970, during which a rudimentary hatchery husbandry was developed. The technical period from 1970 to 1980 was characterized by significant improvements in feed and disease control as well as new hatchery designs. The industrialization period of expanding hatchery production from 1980 to 1990 occurred in response to intense fishing pressure and loss of freshwater habitat. The most recent period, after 1990, has been characterized by a concern about the large numbers released. The total Pacific Rim produc- tion for all species in 1992 (including Russian produc- tion) stood at more than 5.5 billion fry, fingerlings, and smolts released (Heard, 1995). Recent releases may exceed 6 billion, although this number is provisional.
Trends in survival of hatchery fish
Coho salmon
The mean survival of hatchery coho salmon released into tributaries of British Columbia’s Strait of Georgia
peaked in the early 1970s and was the highest (>25%) recorded for any location within the North American range of the species (Fig. 8). Survival declined from an average of around 20% in the period 1972-1976 to less than 7% in the 1980s. Hatchery stocks released into coastal oceanic waters from British Columbia, south to California, were considerably less productive, averaging less than 5% survival.
Puget Sound and Columbia River coho salmon stocks showed a similar trend. Stocks released in the Puget Sound estuary exhibited consistently high mean sur- vivals from the early 1970s through the mid-1980s ranging from 3 to 13% with notable declines after 1977 and the 1983 El Nifio event. From 1972 to 1990 the mean survival Columbia River hatchery stocks was between 1 and 5%.
A comparison of long-term mean survival by regions shows another interesting feature of hatchery coho salmon releases from 1970 to 1990 (Fig. 9). When arranged in declining order of survival, general latitu- dinal clines appear among the coastal stocks, both north and south from the centre of the geographic distribution of the species at about the latitude of Vancouver Island. The stocks in this region have the highest survival (4%) while stocks in coastal California and coastal Alaska, at the limits of the geographic range, have the lowest survival (l-1.5%). The large protected coastal estuaries; Strait of Georgia, Puget Sound, and southeast Alaska, known to be excellent areas for juvenile rearing and survival of salmonids (Healey, 1980; Simenstad et al., 1982), appear as latitudinal anomalies with relatively high survival (5.5- 7.5%).
Downloaded from https://academic.oup.com/icesjms/article-abstract/54/6/1200/674023by gueston 14 April 2018

PaciJic salmon 1207
Year
Figure 8. Mean percentage survival of coho salmon released from hatcheries in the Strait of Georgia (Cl) and aggregated mean percentage survivals for northern B.C./western Vancouver Island/Washington coastal regions (+) and for Oregon/California coastal regions (0), 1971 to 1990. Error bars are 1 standard error. Asterisks denote differences (~~0.05) ANOVA, Fisher PLSD between successive means.
I-
r
Estuaries
Coastal
Figure 9. A comparison of the mean percentage survival of coho salmon released into different ocean environments. Error bars are 1 standard error.
Fall chinook salmon and south of Puget Sound (Fig. IOa, b). Survival peaked in Puget Sound, Strait of Georgia, and off the west coast
Survival and trends in survival of fall chinook salmon of Vancouver Island in the mid-1970s at between 3 and hatchery stocks are distinctly different for stocks north 4%, then declined sharply to less than 2% in the 1980s. A
Downloaded from https://academic.oup.com/icesjms/article-abstract/54/6/1200/674023by gueston 14 April 2018

1208 R. J. Beamish et al.
5 (a)
+ Outer Vancouver Is.
??Upper Columbia River 0 Oregon Coastal 0 Washington Coastal + Lower Columbia R.
1970 1975 1980 1985 1990
Year
Figure 10. Trends in the marine survival of hatchery reared fall chinook salmon showing the different pattern in the more northern areas (a) and southern areas (b). Asterisks denote differences (pcO.05) ANOVA, Fisher PLSD between successive means.
further decline to about 0.5% survival followed the 1983 shift (19761977) in the climate-ocean environment El Nifio and has continued downward since. Stocks (Beamish and Bouillon, 1993; Hare and Francis, 1995; south of Puget Sound showed the opposite trend, with Adkison et al., 1996; Hare, 1996). For most stocks of survival less than 1% until 1982, then rising to around chum, pink, and sockeye, marine survival improved, 2% following the 1983 El Nifio. However, mean survival resulting in increased catches and increased numbers of of fall chinook salmon, aggregated by region, did not spawning salmon. However, the climate-ocean change show the same geographic cline as coho salmon. We in 19761977 reduced marine survival for coho and note that coho and chinook salmon have distinct life chinook in the Strait of Georgia, off Washington, and histories, so we would not expect, apriori, that responses Oregon (Pearcy, 1992; Beamish et al., 1995; Pearcy, would be similar. 1996).
Shifts in the climate/ocean environment In recent years it has been shown that Pacific salmon abundance trends were closely associated with a major
The climate event of 19761977 was detectable in a change in the pattern of the southern oscillation index (Fig. 11) and in other indices of climate change in the sub-arctic Pacific (Trenberth, 1990; Ebbesmeyer et al.,
Downloaded from https://academic.oup.com/icesjms/article-abstract/54/6/1200/674023by gueston 14 April 2018

Pa+ salmon 1209
1.25
1989 0.75
0.25
iz -0.25
-1.75 ’ I I I I I I I 1960 1965 1970 1975 1980 1985 1990 1995
Year
Figure 11. The southern oscillation index is the anomalies of the normalized sea level pressure difference between Darwin and Tahiti. The extreme negative values represent El Nifio conditions. Changes in the pattern occurred in 1977, 1988-1989, and 1996.
1991; Graham, 1994; Trenberth and Hurrell, 1995). The change had a profound impact on the thermal structure of the ocean (Polovina et al., 1995; Deser et al., 1996) as well as the productivity (Venrick et al., 1987; Brodeur and Ware, 1992).
Associated with the observation of natural fluctua- tions is the concept of regimes (Hare and Francis, 1995; Steele, 1996; Beamish et aZ., 1997). The regime concept identifies persistent periods of mean productivity that occur over large areas of the ocean and shift in response to decadal-scale changes in the environment. The actual cause of the changes, such as the 1976-1977 event, remains unknown but the existence of the event and the impact are well documented. Thus, the period beginning in 1977 could be considered to be a regime in which the productivity of the northern Pacific salmon stocks increased.
Another change occurred in about 1989. The intensity of the Aleutian Low weakened (Beamish et al., 1997) and there was an la Nina event in the tropical Pacific. In the early 1990s intense high pressures in the western tropical Pacific caused extreme El Nifio-like conditions that were unique to this century (Trenberth and Hoar, 1996).
The weakening of the Aleutian Low in the late 1980s would be expected to reverse the trend of improved ocean productivity in the sub-arctic Pacific. There is no evidence of a switching back to the pre-1977 conditions in the ocean, but a switching in the trends of sea surface temperatures is evident in the analyses of Deser et al. (1996). However, there is some evidence of change, such as the collapse of the Japanese sardine (Sardinops melanostictus) fishery (Hiyama et al., 1995) and dra- matic reductions in zooplankton in the California
current (Roemmich and McGowan, 1995) and nitrate reductions off British Columbia (Freeland et al., 1997). As mentioned, there has not been a decline in the total catch of Pacific salmon, as might be expected with the less intense Aleutian Low pressure periods. We will simply have to wait to see if the decline occurs or if there are additional mechanisms that are maintaining high productivity.
Interaction of hatchery and wild pink, chum, and sockeye production
For chum salmon, we used a marine survival rate of 1.5% and an average weight of 3.72 kg for 1974, and a survival of 3.0% and weight of 2.92 kg for 1992. The total chum salmon hatchery production in the 1974 catch, using these estimates was 46 000 t (70% harvest rate). In 1992, the estimated catch from the hatchery production was 180 600 t (70% harvest rate), The total catch in 1974 was 119 100 t and 215 700 in 1992, indi- cating that the percentage of hatchery fish increased from 39% to 84%. Our 1992 estimates of the hatchery contribution were checked using national estimates of hatchery contributions. Most of the Japanese catch of 137 000 t comes from hatcheries. Thirty-eight percent of the Canadian catch of 6840 t came from hatchery production (NPAFC, 1996). We do not have published estimates of the hatchery chum production to the catch for either the contribution of United States or Russia. If we assume a marine survival of 1.5% (i.e. half of the Japanese survival) because of differences in the hatchery practices between Japan and the other countries, the catch from the hatchery production for the United
Downloaded from https://academic.oup.com/icesjms/article-abstract/54/6/1200/674023by gueston 14 April 2018
1210 R J. Beamish et al.
States and Russia would be 24 100 (70% harvest rate). Adding these estimates gives 168 000 t or 78% of the total catch. Obviously these two different estimates of hatchery contributions to the catch are only approxima- tions, but they are similar. Therefore, we estimate that approximately 84% of the current total catch of chum salmon comes from hatcheries.
We estimated the contribution of hatchery and wild pink salmon using marine survival rates of 1.5% in 1974 and 3% in 1992, an average exploitation rate of 70% and average weights of 1.83 kg in 1974 and 1.42 kg in 1994. In 1974, we estimated that 533 million hatchery pink juveniles were produced, or 14 600 t. A 70% harvest rate would represent a catch of 10 200 t or 10% of the 1974 catch of 97 700 t. In 1992, hatchery production was 1602 million, which would produce a catch of 47 800 t (70% harvest rate). In 1992, this represented 23% of the catch of 208 600 t. Unpublished estimates indicate that hatchery-reared pink salmon have comprised 20% of the Russian catch in recent years. If this estimate is used for all pink catches, the hatchery contribution in 1992 would be 41 700 t, which is similar to 47 800 t.
In 1974, only Canada and the United States reported producing sockeye in enhancement facilities, with 99% of the production from Canada. When we used a marine survival of 3% and a mean weight of 2.79 kg, an estimate of total catch of 12 100 t was obtained. This represented 56% of the Canadian catch. However, it has been estimated that the Canadian enhancement programme contributes from 3 to 20% to the catch (NPAFC, 1996), although it is acknowledged that there may be problems with these estimates. As an approximation, we used a 10% contribution and estimated the Canadian contribu- tion to the total catch in 1974 to be 2200 t, or 4% of the catch. In 1992, we used the same procedures to estimate the Canadian contribution of 2100 t to the Canadian catch of 21 000 t. The United States hatchery production contributed 80 million or 8670 t to the catch (6% sur- vival, 2.58 kg average weight). The total contribution of 9900 t represents 5% of the total catch. These estimates of hatchery and wild contribution to the total catch indicate that sockeye are the least enhanced of the three species.
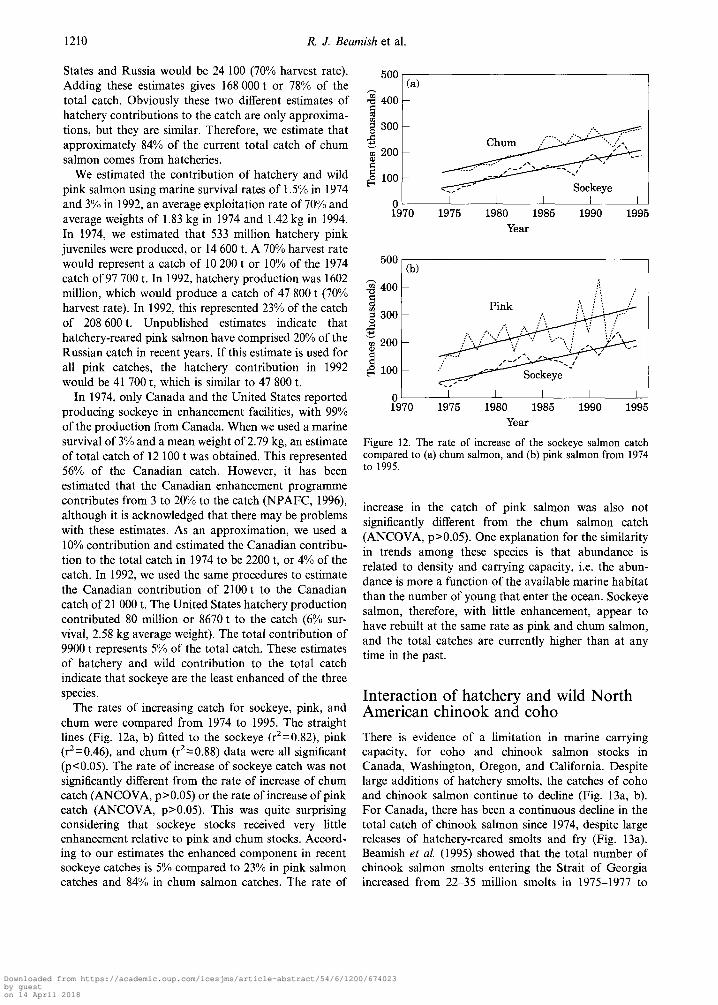
The rates of increasing catch for sockeye, pink, and chum were compared from 1974 to 1995. The straight lines (Fig. 12a, b) fitted to the sockeye (?=0.82), pink (?=0.46), and chum (r2=0.88) data were all significant (~‘0.05). The rate of increase of sockeye catch was not significantly different from the rate of increase of chum catch (ANCOVA, p>O.OS) or the rate of increase of pink catch (ANCOVA, p>O.O5). This was quite surprising considering that sockeye stocks received very little enhancement relative to pink and chum stocks. Accord- ing to our estimates the enhanced component in recent sockeye catches is 5% compared to 23% in pink salmon catches and 84% in chum salmon catches. The rate of
500 (a)
z 400 f g 300
5
;;; 200 z
g 100 I 1970 1975 1980 1985 1990 1995
Year
500 ) 09
0' I I I I I
1970 1975 1980 1985 1990 1995 Year
Figure 12. The rate of increase of the sockeye salmon catch compared to (a) chum salmon, and (b) pink salmon from 1974 to 1995.
increase in the catch of pink salmon was also not significantly different from the chum salmon catch (ANCOVA, p>O.O5). One explanation for the similarity in trends among these species is that abundance is related to density and carrying capacity, i.e. the abun- dance is more a function of the available marine habitat than the number of young that enter the ocean. Sockeye salmon, therefore, with little enhancement, appear to have rebuilt at the same rate as pink and chum salmon, and the total catches are currently higher than at any time in the past.
Interaction of hatchery and wild North American chinook and coho There is evidence of a limitation in marine carrying capacity, for coho and chinook salmon stocks in Canada, Washington, Oregon, and California. Despite large additions of hatchery smolts, the catches of coho and chinook salmon continue to decline (Fig. 13a, b). For Canada, there has been a continuous decline in the total catch of chinook salmon since 1974, despite large releases of hatchery-reared smolts and fry (Fig. 13a). Beamish et al. (1995) showed that the total number of chinook salmon smolts entering the Strait of Georgia increased from 22-35 million smolts in 1975-1977 to
Downloaded from https://academic.oup.com/icesjms/article-abstract/54/6/1200/674023by gueston 14 April 2018

Pa+ salmon 1211
, , , / j50$ 70 1975 1980 1965 1990 19905
Year
200
I 10970
I I I I I 1975 1980 1985 1990 199%
Year
Figure 13. (a). The decline in chinook catch from southern British Columbia, Washington, and Oregon in relation to hatchery production. (b). The decline in coho catch from southern British Columbia, Washington, and Oregon in relation to hatchery production. Catch ( ??); Release (+).
81.6 million smolts in 1992 as the catches declined from about 750 000 fish to 200 000 from the mid-1970s to the present. The declines in catch of coho salmon are most evident off Washington and Oregon, again despite the large numbers of hatchery releases (Fig. 13b). Associ- ated with the declines in coho salmon catch in the United States was a dramatic decline in the percentage of wild coho salmon. This decline in wild stock produc- tion has been shown to be related to a substantial reduction in spawning densities in fresh water (Flagg et al., 1995) and overfishing of less abundant wild stocks in mixed fisheries of hatchery and wild stocks (Ricker, 1976). Another problem is the larger size of hatchery fish compared to wild fish when they enter the ocean. Because larger smolts of a particular brood year may have higher survival (Ricker, 1962), there is a possibility that releases of larger hatchery smolts may increase the predation mortality on the smaller, wild smolts.
Discussion The development of the North Pacific salmon hatchery system began in the late 19th century, and since the 1950s has played a prominent and important role in the enhancement of salmon in the Pacific Rim nations. In the Pacific Northwest, managers believed that hatcheries
were a means by which they could continue to develop regional water resources for power, irrigation, and industrial or domestic use, and at the same time, main- tain chinook and coho salmon fisheries at historic levels (Lichatowich and McIntyre, 1987). These beliefs led to increased reliance on hatcheries by fisheries managers and led to the rapid expansion of production through the 1970s. However, in the Pacific Northwest the decline in wild spawning stocks of chinook and coho salmon has focused attention not only on freshwater habitat loss and fishery-related impacts on the wild stocks, but on the genetic and demographic consequences of uncon- trolled expansion of hatcheries as well (Nehlsen et al, 1991; Meffe, 1992; NRCC, 1996). The concern extends beyond the North American coho and chinook salmon fisheries. The large production of hatchery chum salmon in Japan and both pink and chum salmon in Alaska, declining fish size, the failure of Russian chum stocks to rebuild during periods of increased productivity and concerns over limits on ocean-carrying capacity, have all conspired to force a re-evaluation of the industrial-scale hatchery production of North Pacific salmon.
Since the late 1980s public hatcheries in the Columbia River basin have annually reared between 200 and 300 million juvenile salmonids for release into the basin (Chapman, 1986; Schiewe et al., 1989). Based on hatch- ery releases of nearly 203 million fish and an estimated 145 million naturally produced fish, a total of almost 348 million salmonid smolts were present in the basin in 1992. This is 32% above estimated smolt numbers prior to 1850, yet adult returns remain low. Such large num- bers of smolts place a large demand on food production capabilities of the Columbia River and estuary. McCabe et al. (1983) showed the existence of a significant diet overlap among sub-yearling and yearling chinook salmon, coho salmon, and steelhead trout in the estuary during spring. It is one concern to understand why the increased catches did not occur, there also needs to be equivalent concern about the interactions among hatch- ery and wild salmon when overall ocean productivity declines.
Survival of coho and chinook salmon in the southern regions may be driven by the same set of regional ocean/climate conditions as those governing survival of chum, pink, and sockeye salmon but opposite in phase. Two forms of decline are evident in the coho salmon survival curves; sharp short-term declines associated with El Nifio events, and a more prolonged long-term decline typical of the late 1980s that appear to be related to long-term climate trends in Pacific waters along the eastern Pacific seaboard (Freeland, 1990). Stocks released from southern regions are believed to migrate in a narrow coastal corridor that is characterized by highly variable inter-annual changes in flow, temperature, and current (Pearcy, 1992). Those species and stocks released into the more northerly regions enter a much larger area
Downloaded from https://academic.oup.com/icesjms/article-abstract/54/6/1200/674023by gueston 14 April 2018

1212 R. J. Beamish et al.
of acceptable ocean conditions that is greatly influenced by the Aleutian low pressure system (Beamish and Bouillon, 1993).
Cooper and Johnson (1992) compared trends in abun- dance of Washington, Oregon, and British Columbia steelhead trout. They suggested that similarities in steelhead trout abundance trends in widely separated geographical regions indicated that common factors were responsible for the observed declines, and that oceanic conditions were responsible. Because freshwater, estuarine, and near-shore conditions differ considerably from year to year within this region, they concluded that these factors alone could not explain the similarities in steelhead trout survival. Olsen and Richards (1994) concluded that similar chinook salmon run size trends can be observed between several west coast river basins and that the data support the hypothesis that ocean conditions have had a marked and uniform impact on chinook salmon production in the Pacific Northwest.
Hatcheries have played a major role in supplying salmon and trout to the common property fishery in the Pacific Northwest. But with the near catastrophic decline in the population of southern stocks and over- abundance of the northern stocks, we have entered a new era in the operation of hatcheries. Biologists are now recommending that hatchery programmes be revised to include conservation objectives instead of merely supplying fish for harvest (Flagg et al., 1995). The philosophical basis for concern has been stated as follows: “Salmonid management based largely on hatchery production, with no overt and large-scale ecosystem-level recovery program is doomed to failure. Not only does it fail to address the real causes of salmon decline, but it may actually exacerbate the problem and accelerate the extinction process” (Meffe, 1992).
We have shown that the contribution of hatchery fish to the total catch in the Pacific has increased dramati- cally from the early 1970s to the present. Our use of standard harvest rates, marine survivals, and average weights oversimplifies the complex growth and fishing patterns among species, stocks, and countries. However, when we compare the estimates of production with published and unpublished estimates of hatchery contri- butions to national catches, we found that the estimates were similar. The very high percentages of wild sockeye salmon in the catches clearly indicate that the present total catch of sockeye is a result of the improved production of wild stocks. This is certainly not the case for chum salmon, as most of the total catch is of hatchery-reared individuals. An interesting issue is the fate of the wild chum stocks. Russian scientists have proposed that at the beginning of this century there were 10 times more chum salmon from Russia than from Japan in the ocean feeding areas and that presently there are 10 times more Japanese produced chum salmon than Russian. They believe that the absence of any increase in
their chum salmon catches since the early 1970s is a result of the larger size and associated higher marine survival of the Japanese hatchery-reared chum com- pared with the wild chum produced in rivers in Russia. It is not possible to determine what might have hap- pened to chum stocks in the 1980s had there not been the large releases of hatchery fish, but it will be necessary to determine what will happen to wild chum stocks when the ocean conditions becomes less favourable and the carrying capacity for Pacific salmon declines.
Natural fluctuations in abundance are common fea- tures of animal populations and Pacific salmon popula- tions are no exception. Trends in the abundance of other species such as Pacific sardines (Saudimp sp.) or Pacific hake (Mevluccius productus) are well documented (Soutar and Isaacs, 1974). In fact, the fishery for Pacific halibut (Hippoglossus stenolepis) is a healthy, mature fishery that is managed on the basis of decadal-scale trends in abundance (McCaughran, 1997). The relation- ship between the abundance trends of fishes and indica- tors of global climate trends (Beamish et al,, 1997; Mantua et al., 1997) is new information that was not available when many of the Pacific salmon enhancement projects were originally planned. However, it is import- ant that these new concepts be incorporated into any programme of producing hatchery salmon that is intended to rebuild stocks and increase catch, because changes in the trends in the climate/ocean environment will change the capacity of the ocean habitat to support Pacific salmon. Periods of reduced Aleutian Low pres- sure may be times when productivity is naturally at low levels for pink, chum, and sockeye salmon. During these times, releases of large numbers of hatchery smolts may be far in excess of the number needed to maximize the catch and maintain optimal individual lengths for these species.
Accepting that natural fluctuations occur and recog- nizing that key indicators of global climate trends changed most recently about 1989-1990, is there a potential negative impact of the present production of 6.1 billion hatchery fry and smolts on the wild stocks? The declines in wild coho and chinook salmon in the catches off Washington and Oregon (Pearcy, 1992) or the declines in wild pink salmon returns in Prince William Sound may be evidence that under conditions of reduced ocean productivity the survival of wild fish is affected by the presence of the hatchery fish. Another example of the interaction of hatchery and wild produc- tion is the finding that the amount of freshwater habitat that is available for wild salmon is related to the amount of enhancement that is needed (R. C. Francis, University of Washington, Seattle, USA, pers. comm.). As wild spawning and rearing habitat is increased, hatchery production must be reduced.
A fundamental consideration relating to the regula- tion of the abundance of plants and animals that
Downloaded from https://academic.oup.com/icesjms/article-abstract/54/6/1200/674023by gueston 14 April 2018

Pacific salmon 1213
produce large numbers of offspring is the observation that their abundance is regulated by their niche or habitat and not by the number of young produced. Salmon is a fecund species that produces large numbers of offspring. In the unfished state, salmon populations are regulated by their habitat. The anadromous life history of Pacific salmon complicates the interpretation of habitat effects, but as they spend most of their life in salt water, during which there is extremely high mor- tality, it is clear that the ocean habitat must have a powerful influence on abundance. Fishing clearly com- plicates this basic relationship, but we must not ignore that the underlying relationship still exists. It may be popular to attempt to rebuild stocks to historic levels of abundance so that catch can be increased, but these human interventions into the ecosystem are not immune to the natural factors that act to regulate populations. Clearly, targets for rebuilding and increasing catch must be based on the productivity of the ecosystem and not on past conditions or perceived historic high abundance levels. Ignoring natural fluctuations in the ocean eco- system may result in costly and wasteful investments; more importantly, the intervention into a poorly under- stood process may create problems that are not easily corrected.
The success of Pacific Rim enhancement projects for pink, chum, and sockeye in the 1970s and 1980s was interpreted as evidence that the carrying capacity for salmon in the ocean remained more or less constant over time and was underutilized as a consequence of overfish- ing and reduced spawning and rearing habitat in fresh water. We now believe that there are natural, decadal- scale fluctuations in the marine carrying capacity for salmon and the successes after the 1976-1977 regime shift were associated with the improved marine survival in the north and the reduced abundance of coho and chinook salmon in the south with poorer marine sur- vival. The critical issue now is the role of enhancement activities in less productive ocean regimes during periods of naturally declining salmon abundance. The large releases of 6.1 billion fry and smolts may be keeping abundances artificially high and may even be exceeding the carrying capacity. The consequences of exceeding the carrying capacity have not been addressed for Pacific salmon, yet it is a well known concept for animals on land that is often associated with abrupt crashes in abundance. As there have been no impact studies associ- ated with the releases of enhanced fish, it is unknown if the expected decreases in abundance and increases in marine mortalities will affect wild and hatchery fish equally.
In one sense, the collective enhancement activities represent a very large, uncontrolled experiment. The hatchery releases are large relative to wild production and must influence wild smolt production. Indices of global climate have changed in 1989-1990 and we can
expect impacts of global warming (Kerr, 1995). While we do not know how global warming will interact with natural fluctuations, most scientists believe there will be an increase in the frequency of extreme events. It is apparent that the massive production of artificially reared Pacific salmon and the potential for large-scale changes in the climate-ocean environment constitute a basin-scale experiment with the Pacific salmon ocean ecosystem. We must also recognize that we are stressing our marine ecosystems in other ways. As 1500 of the world’s most prominent scientists warned in 1992, “Human beings and the natural world are on a collision course”. There is significant information available to warn us that the impacts of these hatchery fish on wild fish need to be evaluated in the same manner as we evaluate the impacts of introductions of man-made substances to any natural ecosystem and while there is still time to change practices if the impacts turn out to be alarming.
References
Adkison, M. D., Peterman, R. M., Lapointe, M. F., Gillis, D. M., and Korman, J. 1996. Alternative models of climatic effects on sockeye salmon (Oncorhynchus nerku) productivity in Bristol Bay, Alaska and the Fraser River, British Columbia. Fisheries Oceanography, 5(3/4): 137-152.
Allee, B. 1990. Sockeye salmon enhancement in Alaska. 1990 Sockeye culture workshop, Anchorage, Alaska, IO-11 July 1990, p. 1.
Beamish, R. J. and Bouillon, D. 1993. Pacific salmon produc- tion trends in relation to climate. Canadian Journal of Fisheries and Aquatic Sciences, 50: 1002-1016.
Beamish, R. J., Neville, C., and Cass, A. J. 1997. Production of Fraser River sockeye salmon (Oncorhynchus nerku) in rela- tion to decadal-scale changes in the climate and the ocean. Canadian Journal of Fisheries and Aquatic Sciences, 54: 543-554.
Beamish, R. J., Riddell, B. E., Neville, C. M., Thomson, B., and Zhang, Z. 1995. Declines in chinook salmon catches in the Strait of Georgia in relation to shifts in the marine environ- ment. Fisheries Oceanography, 4(3): 243-256.
Bigler, B. S., Welch, D. W., and Helle, J. H. 1996. A review of size trends among North Pacific salmon (Oncorhynchus spp.). Canadian Journal of Fisheries and Aquatic Sciences, 53: 455465.
Brodeur, R. D. and Ware, D. M. 1992. Long-term variability in zooplankton biomass in the subarctic Pacific Ocean. Fisheries Oceanography, 1: 32-38.
Burgner, R. L. 1991. Life history of sockeye salmon (Oncorhyn- thus nerka). In Pacific salmon life history, pp. 3-117. Ed. by C. Groot and L. Margolis. University of British Columbia Press, Vancouver, British Columbia.
Chapman, D. W. 1986. Salmon and steelhead abundance in the Columbia River in the nineteenth century. Transactions of the American Fisheries Society, 115: 622-670.
Cooper, R. and Johnson, T. 1992. Trends in steelhead abun- dance in Washington and along the Pacific Coast of North America. Washington State Department of Wildlife and Fisheries Management Division. Report 92-20.
Downloaded from https://academic.oup.com/icesjms/article-abstract/54/6/1200/674023by gueston 14 April 2018

1214 R. J. Beamish et al.
Coronado-Hemandez, M. C. 1995. Spatial and temporal fac- tors affecting survival of hatchery-reared chinook, coho, and steelhead. PhD Thesis, University of Washington, Seattle. 235 pp.
Deser, C., Alexander, M. A., and Timlin, M. S. 1996. Upper- ocean thermal variations in the North Pacific during 1970- 1991. Journal of Climate, 9: 1840-1855.
Ebbesmeyer, C. C., Cayan, D. R., McLain, D. R., Nichols, F. H., Peterson, D. H., and Redmond, K. T. 1991. 1976 step in the Pacific climate: forty environmental changes between 1968-1975 and 1977-1984. In Proceedings of the Seventh Annual Pacific Climate (PACLIM) Workshop, April 1990, pp. 115-126. Ed. by J. L. Betancourt and V. L. Tharp. Californian Department of Water Resources Interagency Ecological Study Program Technical Report No. 26.
Flagg, T. A., Mahnken, C. V. W., and Johnson, K. A. 1995. Captive broodstocks for recovery of Snake River sockeye salmon. American Fisheries Society Symposium, 15: 81-90.
Foerster, R. E. 1968. The Sockeye Salmon. Bulletin of Fisheries Research Board of Canada, 162. 422 pp.
Freeland, H. J. 1990. Sea surface temperatures along the coast of British Columbia: regional evidence for a warming trend. Canadian Journal of Fisheries and Aquatic Sciences, 47: 346350.
Freeland, H., Denman, K., Wong, C. S., Whitney, F., and Jacques, R. 1997. Evidence of change in the N.E. Pacific Ocean Deep Sea Research (in press).
Graham, N. E. 1994. Decadal-scale climate variability in the tropical and North Pacific during the 1970s and 1980s: observations and model results. Climate Dynamics, 10: 135- 162.
Hare, S. R. 1996. Low-frequency climate variability and salmon production. PhD Thesis, University of Washington, Seattle. 306 pp.
Hare, S. R. and Francis, R. C. 1995. Climate change and salmon production in the northeast Pacific Ocean. In Climate change and northern fish populations, pp. 357-372. Ed. by R. J. Beamish. Canadian Special Publication of Fisheries and Aquatic Sciences 12 1.
Healey, M. C. 1980. The ecology of juvenile salmon in Georgia Strait, British Columbia. In Salmonid ecosystems of the North Pacific, pp. 203-229. Ed. by W. J. McNeil and D. C. Hinsworth. Oregon State Univ. Press, Corvallis, Oregon. 97331.
Heard, W. R. 1991. Life history of pink salmon (Oncorhynchus gorbuscha). In Pacific salmon life history, pp. 119-230. Ed. by C. Groot and L. Margolis. University of British Columbia Press, Vancouver, British Columbia.
Heard, W. R. 1995. An estimate of total 1992 hatchery releases of juvenile salmon, by country, into waters of the North Pacific Ocean and adjacent seas. (NPAFC Dot.). Auke Bay Laboratory, Alaska Fisheries Science Center, NMFS, NOAA, 11305 Glacier Highway, Juneau, AK. 99801-8626. 6 PP.
Hiyama, Y., Nishida, H., and Goto, T. 1995. Interannual fluctuations in recruitment of growth of the sardine (Surdi- naps melunostictus) in the Sea of Japan and adjacent waters. Research Ponulation Ecolouv. 37(2): 177-183.
Isaksson, A. 1988. Salmon ranching; a world review. Aqua- culture, 75: l-33.
Ishida, Y., Ito, S., Kaeriyama, M., McKinnell, M., and Nagasawa, K. 1993. Recent changes in age and size of chum salmon (Oncorhynchus keta) in the North Pacific Ocean and possible causes. Canadian Journal of Fisheries and Aquatic Sciences, 50: 290-295.
Kaeriyama, M. 1996. Population dynamics and stock manage- ment of hatchery-reared salmon in Japan. Bulletin of National Research Institute of Aquaculture, 2: 1 l-l 5.
Kerr, R. A. 1995. It’s official: first glimmer of greenhouse warming seen. Science. 270: 1565-1567.
Konovaloi, S. M. 198d. U.S.S.R.: Salmon ranching in the Pacific. In Salmon ranching, pp. 63-88. Ed. by J. E. Thorpe. Academic Press, London.
Lichatowich, J. A. and McIntyre, J. D. 1987. Uses of hatch- eries in the management of Pacific anadromous salmonids. American Fisheries Society Symposium, 1: 13 l-l 36.
Mahnken, C. V. W., Damkaer, D. M., and Wespestad, V. G. 1983. Perspectives of North Pacific salmon sea ranching. In Second International Fish Farming Conference, pp. 186 216. 22-24 March, 1983, Brighton, England. Interbuild Exhibitions Ltd., London.
Mantua, N. J., Hare, S. R., Zhang, Y., Wallace, J. M., and Francis, R. C. 1997. A Pacific inter-decadal climate oscilla- tion with impacts on salmon production. Bulletin of the American Meteorological Society (in press).
Mayama, H. 1985. Technical innovations in chum salmon enhancement with special reference to fry condition and timing of release. In Proceedings of the Eleventh U.S.- Japan Meeting on Aquaculture, Salmon Enhancement, Tokyo, Japan, ~19-20 October 1982, pp. 83-86. Ed. by C. J. Sinderman. NOAA Technical Reoort NMFS 27.
McCabe, G. T. Jr., Emmett, R. L:, and Durkin, J. T. 1983. Interrelations between juvenile salmonids and non-salmonid fish in the Columbia River. Fisheries Bulletin, 81: 815-826.
McCaughran, D. A. 1997. Seventy-five years of halibut man- agement success. Second World Fisheries Congress, Brisbane, Australia, August 1996 (in press).
McNair, M. 1996. Alaska Fisheries Enhancement Program 1995 Annual Report. Alaska Department of Fish and Game. Report 5596-08, 43 pp.
Meffe, G. K. 1992. Techno-arrogance and halfway technolo- gies: salmon hatcheries on the Pacific Coast of North America. Conservation Biology, 6(3): 350-354.
Mullan, J. W. 1986. Determinants of sockeye salmon abun- dance in the Columbia River, 188Os-1982: a review and synthesis. U.S. Fish and Wildlife Service Biological Report 86(12), 136 pp.
Nehlsen, W., Williams, J. E., and Lichatowich, J. A. 1991. Pacific salmon at the crossroads; stocks at risk from California, Oregon, Idaho, and Washington. Fisheries, 16(2): 421.
NPAFC. 1996. An assessment of Canadian enhanced salmon production 1977-1995. Prepared by Salmon Enhancement Program Coordination and Assessment Division, Depart- ment of Fisheries and Oceans, Vancouver, B.C. North Pacific Anadromous Fish Commission (NPAFC) Annual Meeting, Tokyo, Japan, September 1996. Document 204, 20 pp.
NRCC. 1996. Upstream: salmon and society in the Pacific Northwest. National Research Council Committee on Pro- tection and Management of Pacific Northwest Anadromous Salmonids. National Academy Press, Washington, DC. 452 pp.
Olsen, D. and Richards, J. 1994. Inter-basin comparison study, Columbia River salmon production compared to other West Coast production areas, phase II analysis. Report prepared for the Army Corps of Engineers, Portland, Oregon, Portland State University and the Pacific Northwest Project. 29 PP.
Pearcy, W. G. 1992. Ocean ecology of North Pacific salmonids. University of Washington Press, Seattle, Washington. 179 pp.
Pearcy, W. G. 1997. Salmon production in changing ocean domains. In Pacific salmon and their ecosystems, pp. 331- 352. Ed. by D. J. Stouder, P. A. Bisson, and R. J. Naiman. Chapman & Hall, London. 685 pp.
Downloaded from https://academic.oup.com/icesjms/article-abstract/54/6/1200/674023by gueston 14 April 2018

Pacific salmon 1215
Polovina, J. J., Mitchum, G. T., and Evans, G. T. 1995. Decadal and basin-scale variation in mixed layer depth and the impact on biological production in the Central and North Pacific, 1960-88. Deep-Sea Research, 42: 1701-1716.
Ricker, W. E. 1962. Regulation of the abundance of pink salmon populations. In Symposium on pink salmon, 1960, pp. 155-201. H. R. MacMillan Lectures in Fisheries, Univer- sity of British Columbia, Vancouver, British Columbia.
Ricker, W. E. 1976. Review of the rate of growth and mortality of Pacific salmon in salt water and noncatch mortality caused by fishing. Journal of the Fisheries Research Board of Canada, 33: 1483-1524.
Ricker, W. E. 1981. Changes in the average size and average age of Pacific salmon. Canadian Journal of Fisheries and Aquatic Sciences, 38: 16361656.
Ricker, W. E. 1995. Trends in the average size of Pacific salmon in Canadian catches. In Climate change and northern fish populations, pp. 563-602. Ed. by R. J. Beamish. Canadian Special Publication of Fisheries and Aquatic Sciences 121.
Roemmich, D. and McGowan, J. 1995. Climate warming and the decline of zooplankton in the California current. Science, 267: 13241326.
Salo, E. 0. 1991. Life history of chum salmon (Oncorhynchus keta). In Pacific salmon life history, pp. 231-309. Ed. by C. Groot and L. Margolis. University of British Columbia Press, Vancouver, British Columbia..
Schiewe, M., Miller, D., Dawley, E., Ledgerwood, R., and Emmett, R. 1989. Quality and behavior ofjuvenile salmonids
in the Columbia River estuary and nearshore ocean. National Marine Fisheries Service. Northwest Fisheries Science Center. University of Washington, Department of Oceanography, Oregon State University. 38 pp.
Simenstad, C. A., Fresh, K. L., and Salo, E. 0. 1982. The role of Puget Sound and Washington coastal estuaries in the life history of Pacific salmon: an unappreciated function. In Estuarine comparisons, pp. 343-364. Ed. by V. S. Kennedy. Academic Press, New York.
Soutar, A. and Issacs, J. D. 1974. Abundance of pelagic fish during the 19th and 20th centuries as recorded in anaerobic sediment off the Californias. Fishery Bulletin, 72: 257-273.
Steele, J. H. 1996. Regime shifts in fisheries management. Fisheries Research, 25: 19-23.
Trenberth, K. E. 1990. Recent observed interdecadal climate changes in the Northern Hemisphere. Bulletin of the American Meteorological Society, 71: 988-993.
Trenberth, K. E. and Hoar, T. J. 1996. The 1990-1995 El Nifio-southern oscillation event: Longest on record. Geo- physical Research Letters, 23: 57-60.
Trenberth, K. E. and Hurrell, J. W. 1995. Decadal coupled atmosphere-ocean variations in the North Pacific Ocean. In Climate change and northern fish populations, pp. 1424. Ed. by R. J. Beamish. Canadian Special Publication of Fisheries and Aquatic Sciences 12 1.
Venrick, E. L., McGowan, J. A., Cayan, D. A., and Hayward, T. L. 1987. Climate and chlorophyll a long-term trends in the central North Pacific Ocean. Science, 238: 70-72.
Downloaded from https://academic.oup.com/icesjms/article-abstract/54/6/1200/674023by gueston 14 April 2018