hawaii farmers union united (hfuu) 2018 membership survey
TRANSCRIPT

Hawaii Farmers Union United (HFUU) 2018 Membership Survey
Report
Prepared By
Saleh Azizi
Policy Committee Chair
Hawaii Farmers Union United
Honolulu, Hawai’i
10/8/2018
Recommended citation: Azizi, S (2018) HFUU 2018 Membership Survey Report. Hawaii Farmer Union
United (HFUU), Oct 2018: Wailuku, HI

9.28.2018 HFUU 2018 SURVEY REPORT
2
Contents EXECUTIVE SUMMARY ............................................................................................................................. 3
BACKGROUND ......................................................................................................................................... 4
SURVEY PERFORMANCE & SIGNIFICANCE ................................................................................................ 5
FINDINGS 1: OPERATIONAL CHARACTERISTICS ........................................................................................ 6
Operational Characteristics- Food Production ...................................................................................... 6
Operational Characteristics- Years in Operation ................................................................................... 6
Operational Characteristics- Type of Operation ................................................................................... 7
Operational Characteristics- Land Tenure ............................................................................................ 7
Operational Characteristics- Labor ....................................................................................................... 8
FINDINGS 2: MEMBERSHIP DEMOGRAPHICS ............................................................................................ 9
Membership Demographics- Age ......................................................................................................... 9
Membership Demographics- Gender ................................................................................................... 9
Membership Demographics- Race ....................................................................................................... 9
FINDINGS 3: MARKETING & SALES ......................................................................................................... 10
Marketing & Sales- Farm Income ....................................................................................................... 10
Marketing & Sales-Markets ............................................................................................................... 11
Marketing & Sales- Products .............................................................................................................. 11
Marketing & Sales- Organic Production ............................................................................................. 13
FINDINGS 4: MEMBERSHIP POINT OF VIEW ........................................................................................... 14
Membership Outlook- Perspectives on HFUU leadership, national charter & communications .......... 14
Membership Outlook- Perspectives on Local Chapters ....................................................................... 14
Membership Outlook- Social values ................................................................................................... 15
Membership Outlook- Priorities ......................................................................................................... 15
Membership Outlook- Challenges ...................................................................................................... 19
FINDINGS 5: TRAINING & EDUCATION ................................................................................................... 21
Training & Education- Desired Training .............................................................................................. 21
Training & Education- Business Related Training ................................................................................ 21
NEXT STEPS? SOME SUGGESTIONS…...................................................................................................... 22
REFERENCES .......................................................................................................................................... 23

9.28.2018 HFUU 2018 SURVEY REPORT
3
EXECUTIVE SUMMARY The Hawaii Farmers Union United (HFUU), a statewide organization formed in 2010 is a nonprofit corporation formed under Hawai’i law and Section 501(c)(5) of the Federal Internal Revenue Code. In 2017 HFUU became a Chartered State Division of the National Farmers Union (NFU). HFUU. It advocates for the sovereign right of farmers to create and sustain vibrant and prosperous agricultural communities for the benefit of all Hawai’i through cooperation, education and legislation. HFUU has grown to 1,359 members in 13 local chapters statewide. The last membership survey was done in 2016 and the purpose of the 2018 survey was to renew our understanding of HFUU member’s values, needs, challenges, and priorities. This was especially urgent as the HFUU membership has increased from 559 people in 2014 to 1,359 people in 2017, a 143% membership increase in the last three years. One hundred forty-five people completed the survey; the response rate was high enough to make accurate conclusions about the HFUU membership.
HFUU is first and foremost an organization for Hawai’i’s existing and future family farmers. Between 1073 and 1291 of HFUU members grow food in some capacity; between 707 and 978 of HFUU members operate on a little less than 4 acres on average. When combined, members have anywhere between 2,778 and 3,844 acres in food production, hire between 1,059 and 1,794 people for their operations, and average $89,465 in annual revenue. HFUU members make a significant contribution Hawai’i’s local food system at least 24% ($20 million) of local food sales in Hawai’i and possibly up to 64%- $54 million1. While 911 to 1,155 members agree or strongly agree that non-farm income is crucial for them to continue farming, up to 50% of all members want to make all their income from farming. However, currently between 122 and 326 HFUU members make 80% up to all their income from farming.
Labor retention and marketing are the main challenges farmers are facing in the field. Between 258 and 476 HFUU members need additional labor help in order to sell additional produce or product; additional labor (skilled, full-time and part-time) is especially needed to assist with marketing and sales. Between 15% and 33% of members would like marketing assistance. But members also reported other challenges of transportation- availability of truck and refrigerated transportation; and production and processing including availability of tractor, wash station, certified kitchen to do value-added production.
HFUU members feel that It’s all about the food. Members supply grocery stores, CSAs and farmers markets with vegetables, greens, herbs, flowers, fruits, meat, milk, dairy, eggs, value-added products, and also provide educational and training services. Majority of members are committed to an organic method of food production but most are not USDA certified. However, members do not stop at organic, a majority are committed deeper approach of sustainability through of regenerative agriculture- a holistic approach to good soil and human health- and support President Vincent Mina’s efforts as Chair of NFU’s Regenerative Agriculture Local Food Committee (RALF), one of HFUU’s contribution to NFU.
1 USDA reported that Local Food Sales total was $84.4 million for Hawaii in 2015 (USDA, 2016)
9.28.2018 HFUU 2018 SURVEY REPORT
4
BACKGROUND The purpose of this section is to provide background information about the HFUU 2018 membership survey. The Hawaii Farmers Union United (HFUU), a statewide organization formed in 2009 is a nonprofit corporation formed under Hawai’i law. It advocates for the sovereign right of farmers to create and sustain vibrant and prosperous agricultural communities for the benefit of all Hawai’i through cooperation, education and legislation. HFUU has grown to 1359 members in 13 local chapters statewide. HFUU (www.hfuuhi.org) is part of the National Farmers Union (est 1902), AKA the National Farmers Educational and Cooperative Union of America. www.nfu.org.
In February 2018 I was voted in as a Policy Committee Chair by the HFUU state board. Before that I served as vice president for the HFUU Wai’anae chapter since its start in August 2016 and still do. I also pursue a PhD degree in Urban and Regional Planning at University of Hawai’i at Manoa with focus on understanding the local food economy in Hawai’i, perspectives of small farmers and policy that can incentivize an increase in local food production. I also work at Kahumana Organic Farms & Café, 25 acres of organically certified farms in Lualualei Valley, Wai’anae Oahu with a farm hub project. The Kahumana Farm Hub empowers the Wai’anae community to contribute to local food supply through marketing assistance (aggregation and distribution) for sixty to seventy small farmers, kupuna, backyard growers, and other food producers.
The task of the HFUU Policy Committee is to better understand the HFUU membership. This has been done in the past through surveys. The last membership survey was done in 2016 by then Policy Committee Chair Jessica Wooley and Policy Committee Recording Secretary Faith Ewbank. Purpose of the 2018 survey was to renew our understanding of HFUU member’s values, needs, challenges, and priorities. This was especially urgent as the HFUU membership had increased from 559 people in 2014 to 1359 people in 2017, a 143% membership increase.
The survey was designed in collaboration by an HFUU team of people including Vincent Mina, David Fischer, David Case, Keith Ranney, Melissa Jenks-Olivit, Anny Burch, and myself. I also received assistance from Dr. Christy Mello at University of Hawaii at West Oahu with the development of survey questions.

9.28.2018 HFUU 2018 SURVEY REPORT
5
SURVEY PERFORMANCE & SIGNIFICANCE
The survey was conducted online using Qualtrics survey software. It was open April 28 and closed August 31, 2018. A total of two notices were sent out to all HFUU member emails during this time. A total of 145 people, 10% of HFUU membership in 2017, responded to the survey. While HFUU had 1395 total members in 2018, at the time the survey in May 2018 approximately 1,000 members received the survey notice. The response rate is high enough that we can utilize survey responses to make larger conclusions about the HFUU membership.
Is the survey statistically significant? The short answer is
yes to some extent. Here is an example of how
conclusions will be derived from survey results. N means
the number of people that responded to a specific survey
question also known as sample size. For example, 126
people answered the question, do you farm/grow food of
which 87% of people answered yes. Confidence interval
(CI) is approximately 8. From these results we can then
say with 95% confidence that 79% (87-8=79) to 95%
(87+8=95) of HFUU members farm/grow food. In 2017
HFUU membership was 1359. In other words, we can be
95% certain that between 1073 and 1291 HFUU members
grow food in some capacity. The smaller the CI the more
accurate answers but the sample size is large and the
opposite is true. When only a few people answer a
question the the conclusion is weaker (see Figure 1).
Who took the survey?
Graphic 1 shows the percentage of survey respondents from each HFUU chapter in bold. Next to it, in
parenthesis, is the share of HFUU members that belonged to that chapter in 2017. For example, 30% of
survey respondents are members of the Maui Haleakala Chapter. In other words, we can say with 95%
certainty that 22 to 38% of
all HFUU members belong to
this chapter. In fact, in 2017
Haleakala chapter
membership made up 32%
of all HFUU members.
At 95% confidence level
Population size 1000
Sample Size (n) Confidence Interval (%)
10 30.85
30 17.63
50 13.52
70 11.3
90 9.86
110 8.82
130 8.02
145 7.53
Figure 1-Sample Size and Confidence Intervals for 2018 HFUU Survey

9.28.2018 HFUU 2018 SURVEY REPORT
6
FINDINGS 1: OPERATIONAL CHARACTERISTICS
Operational Characteristics- Food Production
Survey questions:
1. Do you farm/grow food? 87% (110) said yes (n=126, CI=8)
2. Do you own a registered farm? Yes 41%, No 59% (n=54, CI=13)
Explanation: 126 people answered the question do you farm/grow food of which 87% of people answered yes. In other words, we can say with 95% confidence that 79% (1,073) to 95% (1,291) of HFUU members farm/grow food. But not as many members own a registered farm: only 41% with a confidence interval of 13. As a result, we can say with 95% confidence that between 28% (340) and 54% (733) of HFUU members own a registered farm operation.
Did you also know that…
Hawai’i has a total of 7,000 farmers (USDA, 2012) and in 2015 approximately 3,500 farmers participated in local food sales through CSA, farmer’s market, farm direct, stores, restaurants, and other institutions (USDA, 2016).
HFUU members are not only food growers, they perform other vital food systems functions. On average, members are involved 2 or more overlapping functions including:
1. Food production, organic focus 2. Agri-tourism and farm tours 3. Farmer education and training 4. Food processing, marketing, and distribution 5. Restaurant and hotel operations
Operational Characteristics- Years in Operation
Survey question:
3. Have you been farming for more than 10 years? 36% Y 64% N (n=102, CI=9)
Explanation: 102 people responded to the question. We can be 95% confident that between 367 (27%)
611 (45%) of HFUU members are beginner farmers (less than 10 years in operation).
Did you also know that…
In Hawaii, 33% of all farmers are beginner farmers compared to 22% of all farmers in the United States
in total. Read more about beginner farmers in United States here.

9.28.2018 HFUU 2018 SURVEY REPORT
7
Operational Characteristics- Type of Operation
Survey question:
4. What do you farm? (n=92)
The responses to this question were made into a word cloud. HFUU members engage in a variety of farming including production of fruits, vegetables, greens, herbs, livestock and poultry.
Operational Characteristics- Land Tenure
Survey question:
5. Where do you grow/ raise food? (n=108, CI=9)
1. My yard 32% 2. Someone else’s farm 8% 3. My own farm that I own 32% 4. Friend/ family's land 8% 5. Other 20%
Leased land 50% of other
All of above
Explanation: 74% of total survey takers answered the question of where they grow food. We can say
with 95% certainty that between 65% (883) and 83% (1,128) members grow food; between 23% (313)
9.28.2018 HFUU 2018 SURVEY REPORT
8
and 41% (557) of members grow food on their own farm that they own and the same number of people
grow food in their backyards. About 1% to 19% of members farm on leased lands.
Survey Question:
6. How many acres do you farm? (n=90; CI=10)
90 members responded that they are currently farming on 353.78 acres
On average, HFUU members farm on 3.93 acres
Explanation: 62% of total survey takers answered the question. We can say with 95% certainty that
between 52% (707) and 72% (978) of HFUU members operate on a little less than 4 acres each (3.93
acres average) and that HFUU members operate between 2,778 and 3,844 acres in production.
Did you also know that…
In 2012 there were 1,115 farmers in Hawaii that participated on local sales (direct sales) who operated
on less than 9 acres (USDA, 2012).
Operational Characteristics- Labor
Survey Question:
7. Do you employ others than yourself? (n=100, CI=9)
Yes (how many) 35%- 3 people (average), No 65%
Explanation: We can say with 95% certainty that 26% (353) to 44% (598) of HFUU members hire
between 1,059 and 1,794 other people for their operations.
Did you also know that…
In 2012, farmers on 1 to 9 acres, hired on average approximately 3 paid laborers each (1,000 farmers
hired 3,472 laborers). In total, 1,977 farmers (28% of all farms) hired a total of 12,492 people. Over 50%
(3,518) of all farmers also operated with 2 volunteer laborers on average (USDA, 2012)
Conclusion:
In conclusion, when compared to the latest agricultural census for Hawai’i (USDA, 2012) survey results suggest that 1) HFUU’s members hire on average the same amount of laborers when compared to laborers hired by Hawai’i farmers that operate on 1 to 9 acres, 2) there is no data in the latest census for hires by farmers that do local sales, 3) 26% to 44% of HFUU members hire laborers; the lower estimate of 26% is close to the share of Hawai’i's farmers who hire labor (28%), but if the actual number is closer to 44% than we conclude that HFUU members hire more laborers when compared to entire agricultural sector in Hawai’i.

9.28.2018 HFUU 2018 SURVEY REPORT
9
FINDINGS 2: MEMBERSHIP DEMOGRAPHICS
Membership Demographics- Age
Age (n=82, CI=10)
1. Average Age 56 years old 2. Median Age 60 years old 3. 12% to 32% of membership 40 years old or younger 4. 14% to 34% of membership 70 years old or older
Explanation: Survey results suggest that, with 95% confidence, 12 to 32% of HFUU members are 40 years or younger and 14 to 34% of members are 70 years or older. This results show a good likelihood of 40 year old and younger members continuing and regenerating HFUU’s efforts.
Membership Demographics- Gender
Gender (n=121, CI=8)
Male 47%, Female 51%, Other 2%
Explanation: We can say with 95% certainty that 43% (584) to 59% (801) of all HFUU members are
female and that 39% (530) to 56% (761) members are men.
Membership Demographics- Race
Ethnicity (n=145; CI=8, 100%)
Explanation: Majority of HFUU members are Caucasians; the second largest group are Asians followed
by Native Hawaiians.
Did you also know that…In 2012 Hawaii’s farm base consisted of 46% Caucasian farmers, 34% Asian
farmers, 8% Native Hawaiian farmers and 11% more than one race (USDA, 2012).
10%8%
65%
17%
HFUU Membership Race
Asian
Native Hawaiian or otherPacific Islander
White
Other (hispanic, mixed)
9.28.2018 HFUU 2018 SURVEY REPORT
10
FINDINGS 3: MARKETING & SALES
Marketing & Sales- Farm Income
Survey questions:
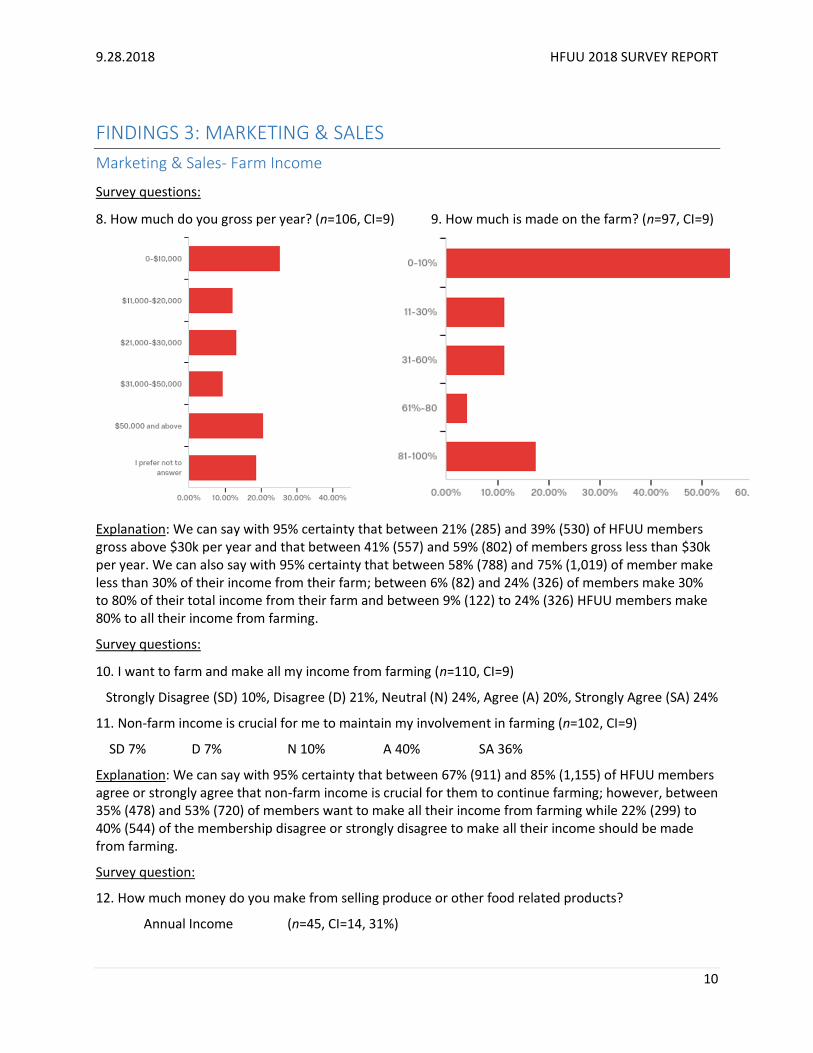
8. How much do you gross per year? (n=106, CI=9) 9. How much is made on the farm? (n=97, CI=9)
Explanation: We can say with 95% certainty that between 21% (285) and 39% (530) of HFUU members gross above $30k per year and that between 41% (557) and 59% (802) of members gross less than $30k per year. We can also say with 95% certainty that between 58% (788) and 75% (1,019) of member make less than 30% of their income from their farm; between 6% (82) and 24% (326) of members make 30% to 80% of their total income from their farm and between 9% (122) to 24% (326) HFUU members make 80% to all their income from farming.
Survey questions:
10. I want to farm and make all my income from farming (n=110, CI=9)
Strongly Disagree (SD) 10%, Disagree (D) 21%, Neutral (N) 24%, Agree (A) 20%, Strongly Agree (SA) 24%
11. Non-farm income is crucial for me to maintain my involvement in farming (n=102, CI=9)
SD 7% D 7% N 10% A 40% SA 36%
Explanation: We can say with 95% certainty that between 67% (911) and 85% (1,155) of HFUU members agree or strongly agree that non-farm income is crucial for them to continue farming; however, between 35% (478) and 53% (720) of members want to make all their income from farming while 22% (299) to 40% (544) of the membership disagree or strongly disagree to make all their income should be made from farming.
Survey question:
12. How much money do you make from selling produce or other food related products?
Annual Income (n=45, CI=14, 31%)

9.28.2018 HFUU 2018 SURVEY REPORT
11
Average Sales $89,465 annually
Total $4,034,040.00
Explanation: We can say with 95% certainty that between 17% (231) and 45% (612) of HFUU members average $89,465 in revenue annually and contribute anywhere between $20 million and $54 million to in local food sales annually.
Did you also know that…
Hawai’i Local Food Sales was estimated at $84.4 million in 2015 of which $22.8 million was direct to consumer and $61.6 million was to supermarkets, restaurants, institutions and wholesalers (USDA, 2016).
Conclusion: In conclusion, when compared to the USDA 2015 report on Local Food Sales in Hawai’i (USDA, 2016) survey results suggest that HFUU members make a significant contribution Hawai’i’s local food system at least 24% ($20 million) of local food sales in Hawai’i and possibly up to 64%- $54 million.
Marketing & Sales-Markets
Survey question:
13. Where do make the most sales? (n=72, CI=11)
Explanation: HFUU members rely mostly on farmer’s markets and stores for their sales. Based on these results we can say with 95% certainty that 10% (136) to 33% (448) of members make their sales at farmer’s markets and the same number of members make most of their sales to stores including retail stores, supermarkets, health food stores and other stores.
Marketing & Sales- Products
Survey question:
9.28.2018 HFUU 2018 SURVEY REPORT
12
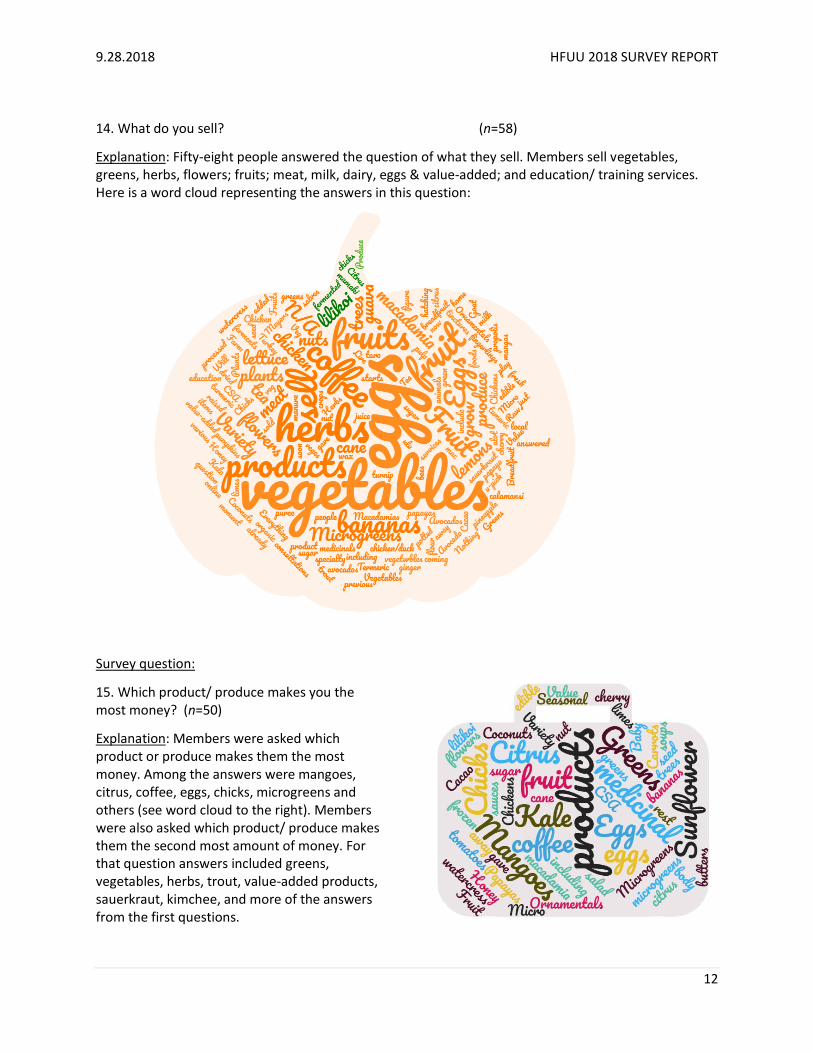
14. What do you sell? (n=58)
Explanation: Fifty-eight people answered the question of what they sell. Members sell vegetables, greens, herbs, flowers; fruits; meat, milk, dairy, eggs & value-added; and education/ training services. Here is a word cloud representing the answers in this question:
Survey question:
15. Which product/ produce makes you the most money? (n=50)
Explanation: Members were asked which product or produce makes them the most money. Among the answers were mangoes, citrus, coffee, eggs, chicks, microgreens and others (see word cloud to the right). Members were also asked which product/ produce makes them the second most amount of money. For that question answers included greens, vegetables, herbs, trout, value-added products, sauerkraut, kimchee, and more of the answers from the first questions.

9.28.2018 HFUU 2018 SURVEY REPORT
13
Marketing & Sales- Organic Production
Survey question:
16. Do you refer to it as… (n=34, CI=17)
1. Permaculture 12%
2. Food Forest 12%
3. Conventional 8%
4. Organic 47%
5. Other 21%
I. Non-certified organic production
II. Orchard
III. Regenerative
Explanation: This question came after a question about acreage in production. Given these answers, we can say with 95% certainty that between 30% (408) and 64% (870) of HFUU members grow organic food. Unfortunately this question cannot tell us about operations that are USDA certified organic.
Did you also know that…
In 2012, 184 farms produced organic commodities in Hawai’i compared to 536 in 2007 (USDA, 2012).
9.28.2018 HFUU 2018 SURVEY REPORT
14
FINDINGS 4: MEMBERSHIP POINT OF VIEW Explanation: In the beginning of the survey members were presented with over forty statements and asked to rate them according to whether they strongly agree, agree, are neutral, disagree, or strongly disagree. In this section we present those results. After they rated the statements they were asked to explain in a short answer which of them they thought was the most important and why. Those results will be present below in the section called priorities.
Membership Outlook- Perspectives on HFUU leadership, national charter &
communications
Survey questions: In this section members rate a statement related to HFUU leadership, national charter & communications (n=110, CI=9)
Numbers matter and drive my desire to be a member of HFUU – We can be 95% certain that 52 to 70% of HFUU members agree or strongly agree to this statement while 21 to 39% of members are neutral to it.
HFUU funds can and should be used for chapter presidents and HFUU leadership to physically come together twice a year- We can be 95% certain that 61 to 79% of HFUU members agree or strongly agree to this statement while 14 to 32% of members are neutral to it.
I value the newsletter and meeting notices that I receive from HFUU- We can be 95% certain that 78 to 96% of HFUU members agree or strongly agree to this statement.
I value the legislative updates from me to comment on that I receive from HFUU- We can be 95% certain that 78 to 96% of HFUU members agree or strongly agree to this statement.
I value our HFUU President is the chair of Regenerative Agriculture Local Food Committee (RALF) NFU- We can be 95% certain that 60 to 78% of HFUU members agree or strongly agree to this statement while 18 to 36% of members are neutral to it.
I feel HFUU’s standing as a chartered chapter of the NFU supports HFUU’s mission- We can be 95% certain that 64 to 82% of HFUU members agree or strongly agree to this statement while 16 to 34% of members are neutral to it
Membership Outlook- Perspectives on Local Chapters
Survey questions: In this section members rate a statement related local chapter operation (n=110, CI=9)
Through their efforts I am satisfied that the HFUU chapter in my region is bringing value to that region- We can be 95% certain that 68 to 86% of HFUU members agree or strongly agree to this statement while 5 to 23% of members are neutral to it.
I use and value the local discounts I receive in being a member of HFUU- We can be 95% certain that 57 to 75% of HFUU members agree or strongly agree to this statement while 12 to 30% of members are neutral to it.
I would like to see more discounts offered on my island- We can be 95% certain that 71 to 89% of HFUU members agree or strongly agree to this statement while 8 to 26% of members are neutral to it.

9.28.2018 HFUU 2018 SURVEY REPORT
15
I value and attend monthly meetings of HFUU- We can be 95% certain that 46 to 64% of HFUU members agree or strongly agree to this statement while 24 to 42% of members are neutral to it.
Membership Outlook- Social values 81% to 99% of HFUU members Agree & Strongly Agree that…(n=110, CI=9)
1. Eat Local- I make it a priority to buy and eat local
2. Political Power- It’s important to me that HFUU has a seat on the State’s Board of Agriculture
3. Solution Oriented- I value HFUU as an organization to be focused on being the solution rather
than an anti-organization
71% to 90% of HFUU members Agree & Strongly Agree that…(n=110, CI=9)
1. Regenerative agriculture- cover cropping along with other regenerative soil health practices
should be a strategic objective for HFUU
2. Economic Incentives- those making a living at farming should be taxed less than others
3. Training & Education- I want more outreach about farming and gardening techniques
Membership Outlook- Priorities
Survey question:
20. Which is the single most important item from the previous question? (n=78, CI=11)
Explanation: In the beginning of the survey members were given multiple statements and asked whether they strongly agree, agree, are neutral, disagree, or strongly disagree. After that question members were asked to write a short explanation of which item they thought was the most important.

9.28.2018 HFUU 2018 SURVEY REPORT
16
A total of seventy-eight comments were given and organized into themes. The strongest theme was concerned with Living on farms and second most important theme was food hub and marketing and third was political and legislative focus (see graph above HFUU member priorities).
The three most important themes are statistically significant with a confidence interval of 11. In other words, comments from those themes are prevalent enough that we can say, with 95% confidence, that they represent the wider HFUU membership; for example, 13% to 35% of HFUU members feel that living on farms is the single most important and 4% to 26% of members prioritize food hub and marketing and 2% to 24% of members prioritize political and legislative focus. Other priority areas of concern can be seen in the graph; while these are concerns of the survey participants we can’t be sure they reflect all HFUU members because of the low number of respondents. What follows are some comments from each area:
1. Living on Farms- State and county zoning and codes, farm dwelling, farm labor retention 13-35% of members
Comment 1- Whether you own your land or lease it, the cost of starting and running a farm while paying Hawai‘i rent prices for an additional living space is prohibitive and crippling to the average young beginning farmer
Comment 2- Farm worker housing, legalizing farming on ag lands and housing. Need housing that is not so costly, such as current permitting and building code fees
Comment 3- The intersection of the high cost of housing and zoning laws limiting the ability to provide housing for farmers and their laborers creates a huge hurdle for me to plan a functioning farm plan. Perhaps a survey of how many workers are required per acre of existing farms organized by size and what is allowed by zoning would highlight that the formula should be modified to both limit abuse and encourage people to live where they are working
Comment 4- Farming is very hands on and requires an intense time commitment living on my farm gives me the opportunity to offer more time and dedication than having to travel to my farm day and night.
Comment 5- Farm housing so that we can attract and help train true farm workers that can live in dignity rather than be reliant on a revolving stream of woofers.
Comment 6- From what I have been told on island we have such a bad problem with homelessness and drug abuse that many people are stealing food from trees to make money that is why it is important for farmers to live where they grow their food so they can ward off any intruders also with climate change we need to be close by to help our crops out as necessary.
Comment 7- Being on the job 24/7 makes for a more responsible owner. It gives for more pride and kuliana in the product they produce.
Comment 8- Farmers live on the Farm!!
Comment 9- Farmers living on the land they farm. Especially with a farm that is a diversified integrated operation, requiring a farmer to manage a whole system from soil building to crop rotations and being able to monitor, hone and manage at any time of day the function of the operation.
Comment 10- Organic/small/regenerative farmers should be able to live on the land they are farming in ECOVILLAGES

9.28.2018 HFUU 2018 SURVEY REPORT
17
2. Food hub and marketing: food hub, marketing, certifications, value-added production, certified kitchen, sales- 4 to 26% of membership
Comment 1- I think having some sort of organized group that I can go to for helping me find customers would be really great, and I'd be open to paying HFUU for those connections.
Comment 2- I feel we need to expand the smaller micro farms involvement in the food chain on the Islands. These might be defined as those on 3 acres or less that want to participate at the farmer's markets or co-ops. This would boost the total locally available food products and help to decrease our reliance on the domestic and foreign supply boats.
Comment 3- I would love to hear more about/participate in discussions around a Farmers Union marketing hub that would help with processing, distribution, and branding. North Shore EVP laying the groundwork for a food hub on Oahu by providing Group GAP food safety certification training. GAP certification is one of the biggest hurdles to getting aggregated quantities of local produce into larger distribution chains (schools, hospitals, hotels, etc.).
Comment 4- Farmers hub to help with processing, distribution and branding.
Comment 5- I think there is a real opportunity for farmers to come together around decentralized food hubs and marketing hubs. I'm not talking about a single hub in an area, I'm talking about food hubs in our communities. The farmers from each community coming together in that community, not traveling to a farmers' market or food hub 25 miles away…
Comment 6- The idea of a FU marketing hub has strong appeal, but I would want to retain some identity for my produce and value-added foods within it! Our biggest constraint right now is the prohibitive cost of the requirement to use a commercial kitchen if we are to legally sell our fermented foods, chocolate, and eggs at our local farmers’ market
Comment 7- Assisting members to generate more on farm income from sales ought to be a strategy item for HFUU
Comment 8- We can use help getting our packaging/labeling and marketing down, including value-added and an access to a certified kitchen.
3. Political Power: legislative representation, power in numbers, national charter- 2 to 24% of members
Comment 1-The power & strength of a United group comes from the power of influence from the numbers of represented members. It's that power that can help to influence crucial political allies to fight for us, to help our cause to become successful farmers who are willing to work so hard every day to produce the best regenerative, nutrient dense yet delicious food to feed ourselves & others.
Comment 2- I value the legislative updates for me to comment on that I receive from HFUU. Having to choose one, I'd say this one because therein lies our power as a statewide and nationally chartered organization of farmers. Our numbers, when committed to legislation by commenting on the value of a bill benefitting ag, can make change in a very real way for Hawaii.
Comment 3- Notices about upcoming legislation & the simplicity of testifying on line
Comment 4- I believe the government on all levels (local, state and federal) should be doing much more to enhance the future of regenerative agriculture in all scope and especially address the economic needs of the small farmer so that they can focus entirely on producing REAL food

9.28.2018 HFUU 2018 SURVEY REPORT
18
4. Food Production: Regenerative Practices, Soil Health, Human Health, Food Production Skills- not statistically significant
Comment 1- Feeding the soil should be our number one objective; everything else comes from this.
Comment 2- I would like to see inclusion of a much broader set of practices and solutions, especially things that are no or low-cost, as well as a stronger focus on the fallow. County and State land agencies need to have a better understanding of this critical part of farming. Fallow lands are also typically not considered as "in ag" by the real property tax office and small farms can sometimes end up be taxed for fallow portions at a higher residential rate. Active and passive fallow lands are not 'abandoned' and some lands need a long fallow (years) to get rid of toxins and rebuild nutrients. Public perception also sees such lands as 'under utilized' which leaves them vulnerable to the sway of development. HFUU could help increase public and agency awareness there.
Comment 3- I just love to grow trees and plants and work the soil
Comment 4- Personally regenerative agriculture is the most important thing on the list. It is what we are all about. Our farm has never been in the black due to this and therefore we must have an outside income. Regardless, we are preparing ahead long-term, hopefully for generations and are willing to make the sacrifice in spite of the fact that we are on a State ag. lease. We do not enjoy being jerked around by the State but it was the only way farming would happen for us.
Comment 5- My only motivation for attending the monthly meetings is to learn and improve my ability to GROW VEGETABLES....and fruit.. I suggest each meeting pick a popular vegetable like tomatoes or lettuce or fruit like papayas or bananas and have an EXPERIENCED KNOWLEDGEABLE person lead a discussion on best methods end related ideas about that vegetable. Everyone should be able to speak about their best methods and failures and have the group suggest helpful insights. I have spoken with other serious growers and they feel the same way
5. Access to Local Food: Availability of local food, affordability of local food, and health concerns- not statistically significant
Comment 1- The need to have accessible local grown at a fair price in locations throughout the state.
Comment 2- I feel as long as farmers continue to sell there produce at such a high price you are "beating a dead horse" so to speak. We are trapped by our rent and housing costs and other things just to stay alive. I really believe as farmers we need to find a way to present our produce to low income people at a reasonable price… We will never improve people’s health doing what we are doing.
Comment 3- Making it a priority 2 buy & eat locally grown NON GMO produce. All residents need 2 support local Farmers who do NOT kow tow 2 big business, harmful pesticide companies, Monsanto/Bayer & corrupt politicians.
6. Membership: membership, discounts, membership benefits- not statistically significant
Comment 1- Ramping up membership is key for HFUU to achieve its local ag and good food goals. This can be done through offering more membership discounts.
Comment 2- Focusing on member benefits that are accessible and not focused on the time and expense of meetings is important to develop. Along these lines, an interactive member to member website

9.28.2018 HFUU 2018 SURVEY REPORT
19
where current responses to weather conditions, pest disease, markets, labor would be good. Helping farmers find and if needed train people interested in working on their farms would help a lot.
Comment 3- HFUU is a large organization that needs more support organizing and maintaining members, as well as organizing financial operations and transparency. I would love to support with these things and feel that they are important to deal with now before moving forward
7. Access to farms: accessible land, affordable of farm living, beginner farmers- not statistically significant
Comment 1- Actively advocating for AFFORDABLE FARMS FOR FAMILIES is single most important factor to reversing our dependency on outside food sources.
Comment 2- Assistance for young farmers to afford buying land, or being able to live on lease land!!
8. Leadership: HFUU/ HFUF coordination, President Vincent Mina - not statistically significant
Comment 1- I’d like to have a clearer understanding of the organizational structure of HFUU and HFUF. From the last meeting I attended, I felt we have lost sight of who we are & the farmers we were supposed to represent…personally I sense our Chapter has been infiltrated & headed toward corruption due to lack of foresight & a lack of understanding of the structure & functions of a successful Union.
Comment 2- The union on Maui has become fractured, both geographically and because of widely differing opinions and experiences of interactions with Vince Mina. To bring us together, I support creating new projects and events that are INCLUSIVE, bringing all the farmers and people who believe in Regenerative Culture (of which agriculture is a major part) together to connect in ways that are simply not happening now with the staggered chapter meetings and often bruised feelings around leadership…he's stepped on a lot of toes and there's a lot of ill-feeling about him, which ought to bring us all to question where and how he can serve best…
Membership Outlook- Challenges
Survey question:
17. Do you need help with marketing/advertising? (n=109, CI=9) Yes 24%, No 39%, N/A 37%
Explanation: This question can be quite useful. It tells us that we can be 95% certain that marketing
assistance does not apply for 28% to 46% of HFUU membership and that 30% to 48% of all HFUU
members do not at this point need assistance with marketing perhaps because they have already
addressed their own needs. We can also say with 95% certainty to 15% to 33% of members would like
marketing assistance.

9.28.2018 HFUU 2018 SURVEY REPORT
20
Survey question:
18. Do you need more of any of
the following to help sell a
food/food product? (n=131, CI=8).
Explanation: Members feel that
their biggest challenges are labor
and time. We can say with 95%
certainty that 19 to 35% of
members, between 258 and 476
HFUU members need labor help as
well as more time in order to help
sell a product.
Survey question:
19. Most pressing need from the previous question (n=39)
Explanation: Members responded to the question of their most pressing need from the previous question. Among the top needs were labor (skilled, part-time, marketing, weeding, living on-farm); transportation- truck, refrigeration; and production- equipment, tractor, wash station, certified kitchen, value-added production.

9.28.2018 HFUU 2018 SURVEY REPORT
21
FINDINGS 5: TRAINING & EDUCATION
Training & Education- Desired Training
Survey question:
Is there anything you like to learn more about (for example, grow a new type of plant, how to package something etc.)? Y 71%, N 29% (n=101, CI=9)
Explanation: Most members want to learn more. We can be 95% certain that between 62% and 80% of HFUU members want to learn new skills in relation to food production, processing, marketing, and farm planning. The following word cloud was made from member responses on what they would like to learn.
Training & Education-
Business Related Training Survey question: Do you want to start your own small business?
(n=97, CI=9) Y 23%, N 18%, I already own a small business 60%
Explanation: From the responses in this question we can state with 95% certainty that 51% (693) to 69% (938) of HFUU members already own a small business while 14% to 32% of our membership wants to start their own business and 9 to 27% are not interested in starting a business.
Survey questions: In this next section members rate a statement related business training (n=110, CI=9).
I would like to participate in efforts to explore new business models around collaboration- We can be 95% certain that 63 to 81% of HFUU members agree or strongly agree to this statement while 16 to 34% of members are neutral to it.
I would like help with business planning and attracting investment- We can be 95% certain that 34 to 52% of HFUU members agree or strongly agree to this statement while 25 to 43% of members are neutral to it and 15 to 33% of members either disagree or strongly disagree.
I would prefer such help to be individualized- We can be 95% certain that 42 to 60% of HFUU members are neutral to this statement; 33 to 51% of members agree or strongly agree
I like to learn in a group setting so I can benefit from other’s questions and suggestions- We can be 95% certain that 74 to 92% of HFUU members agree or strongly agree to this statement while 5 to 23% of members are neutral to it.

9.28.2018 HFUU 2018 SURVEY REPORT
22
NEXT STEPS? SOME SUGGESTIONS…
1. Legislative survey- many members support HFUU’s work with legislation, updates and proposed
bills, guidelines for submitting comments etc. A follow-up survey can get more specific input
from members the legislative measures they would support
2. Update HFUU Strategic Goals- survey results give us a fresh look at member preferences and
could be used to review & update existing strategic goals.
3. Amending Internal Policy- survey results may suggest that HFUU internal bylaws should be
reviewed and updated
4. Chapter Specific Surveys- each chapter can perform it’s own chapter specific survey to add more
nuances to specific regional challenges and opportunities
9.28.2018 HFUU 2018 SURVEY REPORT
23
REFERENCES USDA (2012) National Agricultural Statistics Services Census of Agriculture.
https://www.agcensus.usda.gov/Publications/2012/Full_Report/Volume_1,_Chapter_1_State_Level/Hawaii/hiv1.pdf Hawaii Summary
USDA (2013) Beginner Farmers and Ranchers at a Glance. Posted by M. Ahearn, Farm and Rural Household Well-Being Branch, Economic Research Service in Food and NutritionFarming Research and Science. Retrieved from https://www.usda.gov/media/blog/2013/01/30/beginning-farmers-and-ranchers-glance (2/1/18)
USDA (2016) Local Food Sales Reaches $84.4 million in Hawaii. Pacific Region Farm News. In cooperation with Hawaii Department of Agriculture. Dec 21, 2016: Honolulu, HI