hawaiian native forest conserves water relative to timber
TRANSCRIPT
Ecological Applications, 19(6), 2009, pp. 1429–1443� 2009 by the Ecological Society of America
Hawaiian native forest conserves water relative to timber plantation:Species and stand traits influence water use
AURORA KAGAWA,1 LAWREN SACK,1,2,5 KA‘EO DUARTE,1,3 AND SHELLEY JAMES4
1University of Hawai‘i at Manoa, Botany Department, 3190 Maile Way, Honolulu, Hawaii 96822 USA2University of California, Department of Ecology and Evolutionary Biology, 621 Charles E. Young Drive South,
Los Angeles, California 90095 USA3Kamehemeha Schools, Land Assets Division, 567 South King Street, Honolulu, Hawaii 96813 USA
4Bishop Museum, Natural Sciences, 1525 Bernice Street, Honolulu, Hawaii 96817 USA
Abstract. Tropical forests are becoming increasingly alien-dominated through theestablishment of timber plantations and secondary forests. Despite widespread recognitionthat afforestation results in increased evapotranspiration and lower catchment yields, little isknown of the impacts of timber plantations on water balance relative to native forest. Nativeforest trees have been claimed to use water conservatively and enhance groundwater rechargerelative to faster-growing alien species, and this argument should motivate native forestpreservation and restoration. However, data have been available primarily for leaf-level gasexchange rather than for whole-plant and stand levels. We measured sap flow of dominant treeand tree fern species over eight weeks in native Metrosideros polymorpha forest and adjacentalien timber plantations on the island of Hawai‘i and estimated total stand transpiration.Metrosideros polymorpha had the lowest values of sap flux density and whole-tree wateruse (200 kg�m�2 sapwood�d�1, or 8 kg/d for trees of 35 cm mean diameter at breast height, D),substantially less than timber species Eucalyptus saligna or Fraxinus uhdei (33 and 34 kg/d fortrees of 73 and 30 cm mean D, respectively). At the stand level, E. saligna and F. uhdei treeshad three- and ninefold higher water use, respectively, than native M. polymorpha trees.Understory Cibotium tree ferns were most abundant in M. polymorpha-dominated forestwhere they accounted for 70% of water use. Overall, F. uhdei plantation had the highest wateruse at 1.8 mm/d, more than twice that of either E. saligna plantation or M. polymorpha forest.Forest water use was influenced by species composition, stem density, tree size, sapwoodallocation, and understory contributions. Transpiration varied strongly among forest typeseven within the same wet tropical climate, and in this case, native forest had strikinglyconservative water use. Comparisons of vegetation cover in water use should provideadditional resolution to ecosystem valuation and land management decisions.
Key words: ecohydrology; ecosystem services; forest water budget; hapu‘u; Hawaii, USA; heat balancecollar; heat dissipation sensor; ‘ohi‘a; sap flow; scaling; tropical forest; watershed.
INTRODUCTION
In the last century, humans have modified the global
landscape at rates faster than in any other period in
history, with direct and indirect impacts on water
resources. Tropical forests are becoming increasingly
alien-dominated through the establishment of high-
productivity alien timber plantations and invaded
secondary forest (Fine 2002, Lugo and Helmer 2004,
Wright 2005). While these forested systems are valued
for fiber, fuel, and carbon sequestration, monotypic
timber plantations often consist of species chosen for
fast growth, high yield, and tolerance to a wide range of
conditions; these traits often enable these plants to
spread beyond their planted range and become invasive
(Richardson 1998). Such substantial changes in vegeta-
tion may significantly decrease water supplies (Le
Maitre et al. 2002, Huxman et al. 2005); thus, as
demand for freshwater increases, there is a critical need
to understand the hydrological implications of different
land uses. In Hawaii and elsewhere, rainfall in forested
upland areas feeds the groundwater and surface water
resources serving human activities and natural ecolog-
ical functions. Quantifying the hydrological impacts of
land use and vegetative cover has critical implications
for ecology, land and water management, and restora-
tion.
The rapidly expanding field of ecohydrology attests to
the increased recognition of the important and dynamic
role of vegetation in shaping the terrestrial water
balance (Baird and Wilby 1999, Eagleson 2002, Rodri-
guez-Iturbe and Porporato 2004). Vegetation water use
(transpiration) makes up the bulk of evapotranspiration
Manuscript received 12 September 2008; revised 6 January2009; accepted 9 January 2009. Corresponding Editor: F. C.Meinzer.
5 Corresponding author: Department of Ecology and Evo-lutionary Biology, University of California, 621 Charles E.Young Drive South, Los Angeles, California 90095-1606USA. E-mail: [email protected]
1429

(ET), which removes precipitation from the ecosystem
that would otherwise contribute to streamflow or
groundwater recharge. Catchment-level studies show
that following deforestation, ET decreases and conse-
quently streamflow increases (Bosch and Hewlett 1982,
Brown et al. 2005); following the afforestation of grass-
lands, shrublands, and croplands, ET increases and
streamflow decreases (Le Maitre et al. 2002, Farley et al.
2005, Huxman et al. 2005, Jackson et al. 2005). How-
ever, there are few available data showing differences in
plant water use for native and plantation forest stands of
contrasting species composition in a given climate.
We examined the degree to which stand transpiration
can differ between native Hawaiian old-growth forest
and the alien timber plantations to which it is often
converted, and we quantified the factors that contribute
to differences. Several previous studies of native
temperate forests have suggested that stand water use
can depend on species composition as well as stand
structure (e.g., Vertessy et al. 2001, Ewers et al. 2002).
The rapid growth that characterizes alien plantation
trees suggests these species are also high water users.
Physiological studies in Hawaii have indicated higher
stomatal conductance and leaf-level gas exchange rates
for alien plants relative to co-occurring or phylogenet-
ically related native plant species (Pattison et al. 1998,
Baruch and Goldstein 1999, Baruch et al. 2000, Stratton
and Goldstein 2001, Cordell et al. 2002, Funk and
Vitousek 2007). All else being equal, higher stomatal
conductance for alien species would predict higher
whole-plant transpiration rates of alien species vs. native
species.
There exist very few comparative studies of native and
alien species’ water use at the whole-plant and stand
scales relevant to hydrology. In Hawaii, there have been
no previous studies to our knowledge; transpiration data
for whole trees are available only for native species at
contrasting sites (Santiago et al. 2000) or stand densities
(Meinzer et al. 1996) or for alien species at a single site
(Barnard and Ryan 2003, Hubbard et al. 2004, Restom
Gaskill 2004). Whole-plant transpiration depends on
site conditions and on species traits. The sap flow per
sapwood area (sap flux density), a frequently used
measure of sap flux capacity standardized by tree size,
depends upon anatomical and functional properties
including hydraulic conductance, capacitance, and
resistance to cavitation; these properties can vary
strongly among trees of given species and across species
(see Meinzer et al. 2003, Melcher et al. 2003). Another
way to express rates of sap flow is per leaf area, which is
equivalent to the product of sap flow per sapwood area
and the sapwood area : leaf area ratio; this ratio varies
among trees of given species, in particular tending to
increase with tree size and age, and also varies strongly
across species (McDowell et al. 2002). Stand-level
transpiration additionally depends on stand-level traits,
including tree sizes and ages, and stand densities, as well
as understory development (Hatton and Wu 1995,
Vertessy et al. 2001). For example, young, mature
stands typically transpire more than old stands due to agreater stand density and sapwood area, greater
sapwood-specific transpiration, and/or greater overstoryleaf area index (Richardson 1998, Roberts et al. 2001,
Vertessy et al. 2001, Moore et al. 2004, Delzon andLoustau 2005, Wright 2005). Notably, alien-dominatedforests in Hawaii consist of relatively recent introduc-
tions, with a monotypic closed canopy and littleunderstory, and thus differ in many aspects of stand
structure from naturally regenerating, native-dominatedforest.
We focused on old-growth forest vs. alien timberplantation and aimed to measure water use for several
dominant tree species found across the Hawaiian Islandsand to scale up to stand level. We measured plant water
use in native forest dominated by Metrosideros poly-morpha and timber plantation dominated by the alien
trees Eucalyptus saligna and Fraxinus uhdei. Our studyaddressed, for a wet forest site on the island of Hawai‘i:
(1) whether different tree species transpire at differentrates and (2) whether stands dominated by these
different species differ in rates of ground-area-basedtranspiration. We hypothesized that transpiration would
be higher for alien timber species compared to nativespecies on a leaf, sapwood area, and whole-tree basis.We further determined the degree to which species
differed in their temporal partitioning of water use. Wealso hypothesized that stand-level water use would be
higher for timber plantations, with intrinsic specieswater use differences further mediated by adjustments in
tree sizes and stem densities and by understorydevelopment.
METHODS
Study sites and species
The study was conducted at Honaunau ForestReserve on the leeward slope of Mauna Loa, Hawai‘i
Island (Fig. 1). The reserve is a 4250-ha mosaic of nativeforest and alien tree plantations owned by nativeHawaiian legacy trust Kamehameha Schools. From
1956 to 1962, 340 ha were cleared and planted in variousalien timber species (Carlson and Bryan 1959, 1963).
Since then, the area has been left largely unmanaged.The Honaunau Forest was chosen for its continuous
native and alien-dominated stands and for its simplehydrology; due to the high substrate permeability and
low slope that minimize horizontal fluxes, runoff occursonly in large storm events.
Within the forest reserve, we selected two sites 5 kmapart representing native and alien-dominated vegeta-
tion in the ahupua‘a (land divisions) of Kahauloa(19.4828 N, 155.8698 W) and Honaunau (19.4358 N,
155.8448 W). The sites were selected to isolate the effectsof forest type on stand transpiration; both were at 1000
m elevation on 750–1500-yr-old basaltic ‘a‘a lava flows(Lockwood 1995) of Puna-Udarent soil type with
gradual slopes of ,20% (P. Niemeyer, personal commu-
AURORA KAGAWA ET AL.1430 Ecological ApplicationsVol. 19, No. 6

nication). At Kahauloa and Honaunau, mean annual
precipitation is 1520 and 1450 mm, respectively, with
.65% occurring during the wet summer months of
April–October (T. Giambelluca, unpublished data), while
estimated annual pan evaporation is between 760 and
1020 mm (Ekern and Chang 1985). Soil moisture
measurements for one year prior to the study showed
minimal variation in the upper 15 cm, with soil water
content always .64% of that at field capacity, with a
median of 71–83% (CS-616 water content reflectometers;
Campbell Scientific, Logan, Utah, USA). During this
study, measurements of photosynthetically active radi-
ation (PAR), temperature, and vapor pressure deficit
(VPD) were made in nearby forest gaps (WS-2308
system; LaCrosse Technology, LaCrosse, Wisconsin,
USA). Values across the study period for daily
maximum and mean PAR (considered 06:00 to 18:00)
were 981 and 404 lmol�m�2�s�1, respectively; values for24-h minimum, mean, and maximum temperature were
15.28, 19.98, and 28.28C, respectively; and values for
VPD were 0.16, 0.47 (0.72, if considered 06:00 to 18:00),
and 1.52 kPa.
In the native old-growth forest of Kahauloa (Fig. 2A),
we measured the water use of the dominant endemic
canopy tree Metrosideros polymorpha (Myrtaceae; com-
mon name ‘ohi‘a; Wagner et al. 1999) and the endemic
understory tree fern Cibotium glaucum (Cibotiaceae;
common name hapu‘u pulu; Palmer 2002, Smith et al.
2006). At the alien tree plantation site in Honaunau
(Fig. 2B, C), we measured sap flow for Eucalyptus
saligna (Myrtaceae; Wagner et al. 1999) and Fraxinus
uhdei (Oleaceae; Wagner et al. 1999) occurring in
monotypic stands of 2 ha and 25 ha, respectively, also
with tree-fern-dominated understory.
Measuring and characterizing tree sap flow
From August through September 2006 (wet season),
we measured whole-plant transpiration for six individ-
uals of each dominant tree species. Tree sap flow was
determined using modified Granier-style heat dissipa-
tion probes with 1 cm long sensor tips (James et al.
2002). To account for circumferential and radial varia-
tion in sap flow, two to five sensors were installed in each
tree at 2–6 cm depth, positioned around the circumfer-
ence at 1.3 m height. The heated and reference probe tips
of each sensor were positioned 10 cm apart vertically,
and replicate sensors were installed at least 10 cm apart
around the tree circumference to avoid heating the
reference probes. To protect the sensors and reduce the
effects of external thermal gradients (Lu et al. 2004) we
insulated the tree trunk with bubble wrap and aluminum
foil. The heated probe tips were supplied with contin-
uous power via a voltage regulator circuit connected to
6-V deep-cycle batteries (models T105 and T125; Trojan,
Santa Fe Springs, California, USA). These batteries
were replaced with recharged batteries each week. We
FIG. 1. Native and alien-dominated timber stands in Honaunau Forest, Hawaii, USA. Study sites were located 5 km apartwithin the same continuous patchwork of native forest and alien timber plantation. The study stands are represented by stars: fromnorth to south, native old-growth forest dominated by Metrosideros polymorpha (Kahauloa) and timber plantations dominated byEucalyptus saligna and Fraxinus uhdei (Honaunau), respectively.
September 2009 1431NATIVE VS. ALIEN FOREST WATER USE

measured differential voltage between the two probe tips
every minute and recorded means every 10 min with
AM16/32 multiplexers connected to CR1000 datalog-
gers (Campbell Scientific, Logan, Utah, USA) powered
by 7-Ah 12-V sealed lead-acid batteries (Radio Shack,
Fort Worth, Texas, USA).
We calculated sap flux density (v) for each interval
using the calibration developed by Granier (1985) and
recently validated for our modified probe design
(McCulloh et al. 2007). Sap flux density (in grams per
square meter per second) can be estimated from the
temperature difference between heated and reference
probe tips (DT ), which is proportional to the measured
voltage difference between probes (DV; Lu et al. 2004)
v ¼ 119 3DVm � DV
DV
� �1:231
ð1Þ
where DVm is the maximum voltage difference corre-
sponding to the maximum temperature difference during
(theoretical) zero flow each night, and DV is the voltage
difference corresponding to the temperature difference
at any point in time, which decreases as flow increases.
While DVm is usually assumed to be constant, we found
that DVm decreased by 10–20% during the weekly
discharge of our deep-cycle batteries. To prevent an
overestimation of sap flow, linear interpolation was used
to estimate a DVm value for each 10-min interval
between the measured DVm values for successive nights.
To account for radial variation of sap flux density
within the tree, we calculated whole-tree sap flow by
weighting the measured sap flux density for each probe
by an associated sapwood annulus (Hatton et al. 1990).
Concentric annuli were defined below the cambium as
delimited by an outer and inner radius (ri and ri�1)
midway between successive probe tips. Sap flow for each
annulus was calculated by multiplying the measured sapflux density at a given depth (vi ) by the corresponding
annulus area; these were summed for n probed depths toobtain whole-tree sap flow (Q, in grams per second):
Q ¼Xn
i¼1
pðr2i � r2
i�1Þvi: ð2Þ
We determined sapwood-area- and leaf-area-specific
sap flow rates by dividing these whole-tree flow ratevalues by estimated sapwood and leaf area for the study
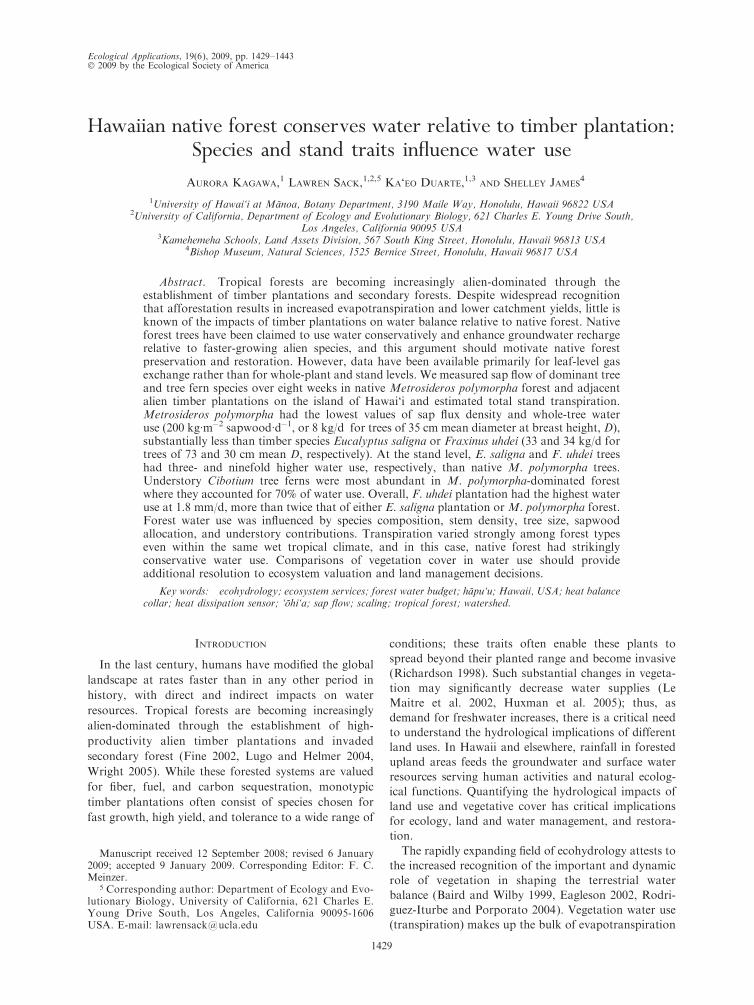
individuals. The resulting data were used to plot diurnalcurves for individual trees (Fig. 3) that were then
characterized on a daily basis to allow comparison ofsap flow patterns among species.
Measuring tree sapwood area
We determined cross-sectional sapwood area of the
study trees from trunk cores extracted at the end of thestudy to avoid any possible impacts of coring on sapflow patterns. For each tree, we measured diameter at
1.3 m height (D) and extracted cores of 5–15 cm lengthwith a 4.3-mm increment borer, noting the depth of
outer bark (dbk) and phloem (dph).Several methods were used to determine sapwood
depth (dsw), including staining of living parenchyma with
triphenyl tetrazolium chloride in a phosphate buffersolution (Sigma-Aldrich, St. Louis, Missouri, USA;
Spicer and Holbrook 2005), visual observation of vesseltranslucency, and projection from sap flow profiles of thedepth at which flow was zero. Fraxinus uhdei had living
parenchyma across the full extent of the cores, and sapflow measurements indicated that maximum flow did not
significantly decrease with depth, so we assumed all of its
FIG. 2. Stands typical of the forest types studied: (A) native old-growth Metrosideros polymorpha forest with dense Cibotiumtree fern understory, and alien timber stands of (B) Eucalyptus saligna and (C) Fraxinus uhdei.
AURORA KAGAWA ET AL.1432 Ecological ApplicationsVol. 19, No. 6
wood was uniformly water conducting. The E. saligna
sapwood–heartwood boundary was determined by visu-
ally inspecting the point at which vessels were no longer
translucent; sap flow depth profile data showed very low
flow beyond this transition. Water-conducting sapwood
in M. polymorpha was less distinct than in E. saligna but
could be resolved similarly.
Sapwood area (AS, in square centimeters) was calcu-
lated as the difference between the area of the cross-
sectional disc from the cambium inward and the area of
the heartwood cross-section:
AS ¼ p 3 r2outer � p 3 r2
inner ð3Þ
where
router ¼D
2� ðdbk þ dphÞ ð4Þ
rinner ¼D
2� ðdbk þ dph þ dswÞ ð5Þ
and the radius is in centimeters.
Estimating tree leaf area
We estimated total leaf area for the study trees by
multiplying the number of tree branches by an average
leaf area per branch, determined from branches sampled
from three other similar trees for M. polymorpha and F.
uhdei (using a LI-COR 3100C leaf area meter; LI-COR,
Lincoln, Nebraska, USA). In cases in which branch leaf
area was very large, we estimated leaf area by dividing
total branch leaf dry mass by leaf mass per area
calculated from a subsample of 10 or more leaves on
the branch, with dry mass determined after oven-drying
at 708C for 48 h. For E. saligna, branches wereinaccessible; to obtain mean leaf area per branch, we
assessed mean area per leaf from fallen branches and
multiplied this value by the number of leaves counted in
digital photographs of sample branches in the canopy.
The number of branches on the sap flow trees was
estimated by visual inspection of photographs (Santiago
et al. 2000). These estimates of leaf area for tall canopy
trees are relatively coarse, but they should allow robust
comparisons of sap flow per leaf area across species
(e.g., Meinzer et al. 1999, Santiago et al. 2000).
Measuring tree fern sap flow
From August through October 2006, we measured
bulk sap flow for healthy fronds of seven individuals
of the dominant tree fern Cibotium glaucum. We took
measurements every minute and recorded 15-min aver-
ages using a stem heat balance collar system placed
on frond stipes (Dynamax Flow32 system; Dynamax,
Houston, Texas, USA) powered by 12-V deep-cycle
batteries connected in parallel (model 30XHS Trojan;
85 Ah, Kirkland, Issaquah, Washington, USA; 60 Ah,
Daleco, Kailua-Kona, Hawaii, USA). We calculated
bulk sap flow from voltages of four thermocouples per
collar using the manufacturer’s calculation procedures
(Sakuratani 1981, Baker and van Bavel 1987) and
determined sap flow per frond area by dividing by frond
area (minus that of the stipe) determined after the study
using a LI-COR 3100C leaf area meter.
Water use parameters and statistical analyses
for comparing species
We extracted daily parameters from diurnal sap flow
data (all statistics calculated using R version 2.5.1; R
Development Core Team 2007). We determined diurnal
sap flow rate (Etot, in kilograms per day), daily maxi-
mum sap flow rate (Emax, in grams per second), time of
maximum sap flow (tmax), daily period with .50% of
maximum sap flow (Dtpeak, in hours), and proportion
of nocturnal sap flow, with nocturnal flow defined as
occurring between 18:30 and 06:30 (En/Etot, in per-
centages). Data for each parameter were averaged over
two months for each individual tree or tree fern. These
individual means were ln-transformed to improve
homogeneity of variance and compared using one-
way ANOVA, followed by Tukey’s hsd comparisons
with a family-wise confidence level of 0.05 (Zar 1999).
We performed the same analyses for the parameters
FIG. 3. (Top) Sap flow per sapwood area (E/AS) on arepresentative day (30 August 2006) for Metrosideros poly-morpha in native forest and for Eucalyptus saligna and Fraxinusuhdei in adjacent alien timber plantations. (Bottom) Sap flowper frond area (E/AL) for the tree fern Cibotium glaucum innative forest. Day and night are indicated on the x-axis by whiteand black bars.
September 2009 1433NATIVE VS. ALIEN FOREST WATER USE

scaled by sapwood area and leaf area. To account for
the importance of day-to-day variation in sap flow, we
also compared species’ parameters in repeated-mea-
sures ANOVAs for the study periods during which
data were collected simultaneously for every individual
tree (19 days) and for individual trees and tree ferns
combined (12 days), blocking by individual trees and
tree ferns.
Sapwood and frond area allometries
for scaling transpiration to the stand
For each of the three study tree species, we
determined sapwood area vs. D relationships by
combining data from our six study trees per species
with D and trunk core data for 9–24 additional trees of
each species sampled along 100-m transects within each
stand type. We calculated AS for trees and fitted
coefficients for the least-squares linear regression of ln-
transformed AS against ln-transformed D.
For C. glaucum tree ferns, we developed an
allometry relating ln-transformed individual frond leaf
area (AL) to ln-transformed frond length index (L), an
easily-measured characteristic, the projected horizontal
frond length from its base at caudex (stem) insertion to
its distal tip (Arcand et al. 2008). We used an allo-
metric relationship based on 10 mature fronds from
our site, including our seven sap flow study fronds, and
eight other C. glaucum individuals in a similar Ha-
waiian wet forest (Arcand et al. 2008), as the allometric
relationships were statistically similar in slopes and
intercepts.
Scaling transpiration to the stand
For each of three stand types (M. polymorpha-, E.
saligna-, and F. uhdei-dominated), we surveyed five to
six 20 3 20 m plots to determine total sapwood and
Cibotium leaf area on a ground area basis. In each plot,
we recorded species and D for every stem (D . 1 cm).
For each individual of Cibotium, we recorded the
number of live fronds and representative L. In eight
plots with high Cibotium densities, we surveyed these in
a 10 3 20 m plot within the larger plot. We applied our
species-specific allometries (Table 1) to the data to
obtain estimates of plot sapwood area (AS,pl, in square
centimeters) and plot Cibotium frond area (AL,pl, in
square meters). For each plot with n trees and m
Cibotium,
AS;pl ¼Xn
i¼1
ea 3 Dbi 3 c for each tree species ð6Þ
AL;pl ¼Xm
i¼1
ea 3 Lbi 3 c 3 ji for each tree fern species
ð7Þ
where a and b are species-specific allometric coefficients,
c is a species-specific allometric correction coefficient,
and j is the number of fronds per tree fern caudex
(Table 1; Baskerville 1972, Sprugel 1983). We estimated
total tree fern leaf area using a C. glaucum leaf area–
frond length index relationship as C. glaucum was the
dominant tree fern species across stand types.
For each plot, we estimated daily plot transpiration
(Epl, in millimeters per day) by multiplying the daily sap
flow rates for each study species (ES, EL) by its
corresponding stand sapwood area (AS,pl) for trees or
frond area (AL,pl) for tree ferns. We summed the
contributions from each tree species (i from 1 through
k) and the understory Cibotium and divided these by the
plot ground area (Apl, typically 400 m2):
Epl ¼
Xk
i¼1
ðAS;pl 3 ESÞi
Apl
þ AL;pl 3 EL;CG
Apl
: ð8Þ
Statistical analyses for comparing stands
We compared stand structure and transpiration using
one-way ANOVA and post hoc Tukey comparisons.
Our estimates assumed the sap flow measurements of the
study trees and their scaling with tree size to be
representative of their species across the stand.
To account for the propagation of error from multiple
sources in our estimates, we performed the same one-
way ANOVA on stand transpiration data simulated
TABLE 1. Mean traits for tree and tree fern species and allometric coefficients for sapwood and frond area in native and alien-dominated timber stands in Honaunau Forest, Hawaii, USA.
Species
Approximatemaximumheight (m)
Mean trait values
D (cm) AS (cm2) L (m) AL (m2)
Metrosideros polymorpha 30 35.0 6 8.5 (6) 261 6 107 (6)Eucalyptus saligna 55 73.3 6 9.4 (6) 605 6 158 (6)Fraxinus uhdei 30 30.0 6 2.1 (6) 609 6 84 (6)Cibotium glaucum 7 2.43 6 0.19 (7) 2.40 6 0.25 (7)
Notes: Mean trait values for tree species include tree diameter at 1.3 m height (D) and sapwood area (AS) and, for the tree fernspecies, frond length index (L) and individual frond area (AL). Allometric coefficients a and b were fitted for ln(AS)¼aþb ln(D) fortrees and ln(AL)¼ aþ b ln(L) for tree ferns with a data set of sample size n. These allometries were applied as AS¼ ea 3Db 3 c andAL¼ ea 3 Lb 3 c, respectively; the correction factor c, calculated as er2=2, accounts for systematic bias in fitting coefficients to ln-transformed data (Baskerville 1972, Sprugel 1983).
AURORA KAGAWA ET AL.1434 Ecological ApplicationsVol. 19, No. 6

using nonparametric bootstrap methods (Blukacz et al.
2005). For each of the five to six plots surveyed per
stand type, we generated 2000 bootstrap replicates to
estimate stand sapwood area, frond area, and transpi-
ration rates, using our vegetation survey data, allometry
data, and sap flow data. For each bootstrap replicate, we
generated new allometric coefficients obtained by
resampling, with replacement, pairs of data from ourallometry data sets. To estimate sapwood area and frond
area of each individual surveyed, we applied these new
coefficients to tree D and tree fern L data, adding a
resampled residual each time. Each sapwood or frond
area estimate was then multiplied by a resampled mean
daily transpiration rate for the appropriate species, and
these were summed over the stand. While the 2000
bootstrap replicates enabled determination of confi-dence intervals (bias-corrected and accelerated; Efron
and Tibshirani 1993) for mean stand traits and transpi-
ration, we used only the bootstrap means for ANOVAs
and post hoc analyses to compare the effect of stand
type on stand transpiration. Because estimates of stand-
level water use neglected the sap flow from non-study
species, we additionally tested different scaling scenarios
to estimate their contribution to overall stand rates.
RESULTS
Species differences in tree size,
sapwood allocation, and water use
The study trees varied in sizes and in sapwood
allocation (Table 1). Trees of E. saligna were much
larger than those of M. polymorpha and F. uhdei (means
for D of 73, 35, and 30 cm, respectively). Despite the
difference in sizes, tree sapwood area was similar for F.
uhdei and E. saligna because of high allocation to
sapwood in F. uhdei relative to M. polymorpha and E.
saligna (84%, 23%, and 14% of basal area, respectively).Of all the study trees, M. polymorpha had the lowest
sapwood area per individual.
Across the study period, the temporal dynamics of sapflow for each tree species correlated well with environ-
mental drivers. Sap flow rates calculated at hourly
intervals correlated strongly with PAR, temperature,
and VPD during the daytime (06:00 to 18:00; Pearson
correlation coefficients range ¼ 0.2–0.8; P , 0.001).
Testing a range of models for prediction of sap flow
from combined environmental drivers indicated that the
species differed in which models fitted best and thus
showed different responses to given and combined
environmental factors (A. Kagawa, L. Sack, K. Duarte,
and S. James, unpublished manuscript). Species also
differed strongly in their realized overall sap flow rates.
Daily maximum sapwood area–specific sap flow rates
(sap flux density) varied fourfold fromM. polymorpha to
F. uhdei, with E. saligna intermediate (Figs. 3 and 4A).
Maximum whole-tree sap flow rates varied sevenfold
across species, from M. polymorpha to F. uhdei, with E.
saligna intermediate (Fig. 4A, inset). Species also varied
strongly in total daily water use, with M. polymorpha
having ,50% of the sapwood area-specific sap flow of E.
saligna and F. uhdei (Fig. 4B), and whole-tree daily
water use ofM. polymorpha was ,30% that of E. saligna
and F. uhdei (Fig. 4B, inset). Sap flow scaled by leaf area
also varied strongly among tree species (Table 2).
Metrosideros polymorpha, E. saligna, and F. uhdei had
maximum sap flow rates per leaf area of 2.05 6 0.59
mg�m�2�s�1, 4.66 6 0.79 mg�m�2�s�1 and 31.9 6 4.6
mg�m�2�s�1. The leaf-area-specific sap flow rate of
understory C. glaucum was 9.49 6 1.10 mg�m�2�s�1,intermediate between the alien tree species’ rates.
Species showed strong variation in diurnal sap flow
patterns (Fig. 3, Table 2). On average, E. saligna reached
maximum flow at 09:37 (67 min), .1 h earlier than M.
polymorpha, F. uhdei, and C. glaucum (10:48 6 8 min,
10:52 6 3 min, and 11:05 6 6 min [mean 6 SE],
respectively). The duration of peak flow was .50%
longer for E. saligna and M. polymorpha than for F.
uhdei (6.9 6 0.5, 6.0 6 0.3, and 3.9 6 0.3 h, respectively);
the duration of peak flow for C. glaucum was
intermediate at 4.7 6 0.6 h. Both E. saligna and M.
polymorpha exhibited strong nocturnal sap flow at 30%
6 3% and 24% 6 4% of total sap flow, respectively,
while F. uhdei and C. glaucum showed relatively low
nocturnal rates (5% 6 2% and 4% 6 1%, respectively;
Fig. 5).
Stand-level differences in structure and water use
The three stand types were each characterized by a
different dominant canopy tree species and a fern under-
story. In native old-growth stands, M. polymorpha
accounted for 87.7% 6 5.0% of the total living tree
basal area, with the remainder consisting largely of Ilex
anomala and Acacia koa (Table 3). In the E. saligna- and
F. uhdei-dominated timber plantations, E. saligna and
F. uhdei accounted for 89.6% 6 3.5% and 84.7% 6 5.7%
of the living basal area, respectively, with the remain-
der consisting largely of remnant M. polymorpha and
A. koa.
The three stand types varied strongly in tree sizes and
tree densities (Fig. 6A–C). The live stem density (N ) in
stands of F. uhdei was twice that for stands of E. saligna
and M. polymorpha. By contrast, D for E. saligna was
nearly twice that F. uhdei, contributing to high stand
basal area. Overall, the variation in stem density and
diameter in conjunction with species-specific sapwood
allocation patterns resulted in F. uhdei stands having the
TABLE 1. Extended.
Allometric coefficients
a b c n
�0.779 6 0.412 1.73 6 0.12 1.02 15�0.878 6 0.417 1.68 6 0.10 1.03 22�0.654 6 0.034 2.07 6 0.01 1.00 30�1.07 6 0.21 2.13 6 0.24 1.06 18
September 2009 1435NATIVE VS. ALIEN FOREST WATER USE

highest total stand sapwood area, nearly four times
greater than that of M. polymorpha-dominated stands
(Fig. 6A–C).
Stand types also varied strongly in Cibotium abun-
dance (Fig. 6D–F). Native stands dominated by M.
polymorpha had especially dense Cibotium understory,
twice the fern density found in E. saligna or F. uhdei
timber stands. While the averageCibotium frond was 50–
65% larger in native M. polymorpha stands, the numberof fronds per tree fern was statistically similar across
stand types. Overall, standCibotium frond area estimates
were two to three times higher for native stands than for
the timber stands (Fig. 6D–F).
The estimated total stand water use varied 2.5-fold
across stand types (Fig. 6G). With both high transpira-
tion rates and high sapwood area, stands dominated by
F. uhdei used more than twice as much water as stands
dominated by E. saligna or M. polymorpha. In native
forest dominated by M. polymorpha, Cibotium transpi-
ration accounted for 75.3% 6 6.7% of stand water use.
By contrast, for alien timber stands dominated by F.
uhdei or E. saligna, Cibotium transpiration, while still
substantial, was secondary to that of the dominant tree
species (11.8% 6 2.6% and 32.2% 6 5.6%, respectively).
Stand types still varied strongly in water use even after
accounting for contributions from the other less-
abundant species that were not measured in our study.
In a scenario in which all other species contributed 100%
of their basal area to sapwood, F. uhdei stands still had
at least 75% higher sapwood area than the two other
stand types. We tested different sap flow rate scenarios,
and we arrived at the same overall finding. For instance,
when, as the most conservative case, we used the highest
rates (i.e., F. uhdei rates) for the non-study species in M.
polymorpha stands and the lowest rates (M. polymorpha
rates) for the non-study species in F. uhdei stands, F.
uhdei stands had 60% higher daily transpiration.
FIG. 4. Mean sap flow rates of tree species in Honaunau Forest: (A) mean diurnal maximum sap flow rate per sapwood area(Emax/AS) and per tree (Emax, inset) and (B) mean diurnal sap flow per sapwood area (Etot/AS) and for the whole plant (Etot, inset).Species abbreviations: MP, Metrosideros polymorpha; ES, Eucalyptus saligna; FU, Fraxinus uhdei (n ¼ 6 individuals per species).Bars show mean þ SE, with the same lowercase letters indicating no statistically significant difference (P ¼ 0.05; post hoc Tukeycomparisons of ln-transformed data).
AURORA KAGAWA ET AL.1436 Ecological ApplicationsVol. 19, No. 6

DISCUSSION
Strong differences in water use among native
and alien species
Metrosideros polymorpha exhibited the lowest rates of
mean maximum sap flow on a whole-plant, sapwood
area, and leaf area basis relative to the two alien tree
species in our study, whereas F. uhdei had the highest
rates and E. saligna was intermediate. The relative water
use rates of these species parallel their differences in
growth rates, and especially the slow growth of M.
polymorpha (Zimmerman et al. 2008).
Our measured transpiration rates were broadly
consistent with values reported in the literature for the
individual species considered separately in largely
TABLE 2. Mean squares for ANOVA for water use parameters of the tree species Metrosideros polymorpha, Eucalyptus saligna,and Fraxinus uhdei.
Parameter
One-way ANOVA Repeated-measures ANOVA
Speciesdf ¼ 2
Errorinddf ¼ 15
Speciesdf ¼ 2
Errorinddf ¼ 15
Daydf ¼ 18
Species 3 daydf ¼ 36
Errortotdf ¼ 270
Whole-tree
Etot (kg/d) 9.19** 1.37 203** 28.9 2.18*** 0.466*** 0.167Emax (g/s) 11.5 ** 1.30 237** 28.6 0.932*** 0.198** 0.108
Per sapwood area
Etot/AS 1.70* 0.339 45.1* 7.73 2.18*** 0.466*** 0.167Emax/AS 3.04** 0.355 65.9** 8.60 0.932*** 0.198** 0.108
Per leaf area
Etot/AL 8.20*** 0.275 176*** 6.48 2.18*** 0.466*** 0.167Emax/AL 12.4*** 0.259 247*** 6.65 0.932*** 0.198** 0.108
Temporal patterns
tmax (h) 2.975** 0.411 50.103* 10.798 12.51* 11.49** 6.74Dtpeak (h) 14.013*** 0.808 225.05*** 11.99 33.31*** 5.86* 3.83En/Etot (%) 0.09987*** 0.00508 2.1331*** 0.1217 0.05850*** 0.02242** 0.01163
Notes: Results are shown for integrated diurnal sap flow and daily maximum sap flow rate on a whole-tree basis (Etot; Emax), andscaled by sapwood area (Etot/AS, Emax/AS), and leaf area (Etot/AL, Emax/AL); and for time at maximum sap flow (tmax), timeduration at which sap flow exceeded 50% of maximum (Dtpeak), and percentage of sap flow occurring at night (18:30–06:30;En/Etot). One-way ANOVAs tested species differences, including all data over the eight-week measurement period; repeated-measures ANOVAs tested differences among species, days, and the interaction for 19 days that all study trees were measuredsimultaneously. Errorind refers to variation among individual trees, and Errortot to overall variation.* P , 0.05; ** P , 0.01; *** P , 0.001.
FIG. 5. Nocturnal sap flow of study species calculated as apercentage of total diurnal sap flow occurring at night (En;between 18:30 and 06:30 hours). Bars show means þ SE, withthe same lowercase letters indicating no statistically significantdifference (P ¼ 0.05; post hoc Tukey comparisons of ln-transformed data). Species abbreviations: MP, Metrosiderospolymorpha (n ¼ 6 trees); ES, Eucalyptus saligna (n ¼ 6); FU,Fraxinus uhdei (n ¼ 6); CG, Cibotium glaucum (n¼ 7).
TABLE 3. Stand compositions for the native forests and timberplantations.
SpeciesPercentageof TBA
Metrosideros/Cibotium forest(TBA 43.8 6 12.3 m2/ha)
Metrosideros polymorpha 87.7 6 5.0Ilex anomala 4.9 6 3.4Acacia koa 2.3 6 2.3Coprosma spp. 1.3 6 0.6Toona ciliata 1.2 6 1.2Cheirodendron trigynum 1.1 6 1.0
Eucalyptus saligna plantation(TBA 79.0 6 15.7 m2/ha2)
Eucalyptus saligna 89.6 6 3.5Metrosideros polymorpha 4.3 6 3.3Acacia koa 1.6 6 1.0Fraxinus uhdei 1.3 6 1.3Ilex anomala 1.2 6 0.7Perrottetia sandwicensis 0.8 6 0.5
Fraxinus uhdei plantation(TBA 43.0 6 2.6 m2/ha2)
Fraxinus uhdei 84.7 6 5.7Metrosideros polymorpha 9.3 6 5.2Acacia koa 6.0 6 1.7
Note: Included are the percentages of total living tree basalarea (TBA) accounted for by component tree species (means 6SE), in order of decreasing abundance and TBA for each of thestand types.
September 2009 1437NATIVE VS. ALIEN FOREST WATER USE

monotypic stands. Trees of individual species can show
substantial ranges in sap flow rates depending on their
ages, sizes, and sites with different climates and histories.
Our values for M. polymorpha were low to moderate in
the range reported by Santiago et al. (2000) for a much
wetter site at 1200 m elevation on the island of Maui
(5000 mm annual rainfall). In that study, the whole-
plant daily transpiration rates were 3–44 kg/d and rates
scaled by leaf area were 0.07–0.48 kg�d�1�m�2 for trees
of unspecified size by comparison with our rates of 0.4–
34.5 kg/d and 0.03–0.14 kg�d�1�m�2, respectively. We
note that the rates in our study were for averages over
two months, while those reported by Santiago et al.
(2000) were for five measurement days with the highest
evaporative demand.
While we found that the tree and stand transpiration
rates of E. saligna were relatively low, especially relative
to F. uhdei, we note that this species has been widely
regarded as a rapid water user based on high transpira-
tion rates per sapwood area under different conditions.
The mean diurnal maximum sap flow rate per sapwood
area for E. saligna (16 g�m�2�s�1) in our study was
approximately half of the 35 g�m�2�s�1 reported for much
younger 5-yr-old plantation trees with D of 21 cm and
height of 26 m, grown at 350 m elevation in Hamakua,
Hawaii (Barnard and Ryan 2003). The trees of E. saligna
at our site were over 50 years old, with D of 70 cm on
average and height of 50–60 m. The lower rates observed
for trees at our site were consistent with previous
observation of a decline in sap flow rates per sapwood
area with increasing tree age and size (McDowell et al.
2002); in the Hamakua study, maximum sap flow
decreased 40% between 1-yr-old and 5-yr-old trees
(Barnard and Ryan 2003). In addition, environmental
conditions differed between these studies; although
similar in VPD range, the Hamakua site had a greater
mean annual precipitation (MAP) by 2500 mm, a deep
ash substrate in contrast to the shallow soil at our sites,
FIG. 6. Stand structure and estimated stand-level water use for native forest dominated by Metrosideros polymorpha and alientimber plantations dominated by Eucalyptus saligna and Fraxinus uhdei (n¼ 5, 5, and 6 stands, respectively). Panels (A)–(F) showschematics of trees and tree ferns in 10 3 10 m plots for each stand type, indicating mean values for the factors important indetermining stand water use. (A–C) Circles indicate dominant tree species cross-sectional area at breast height, with sapwood areain gray and heartwood area in black. (A–C insets) Diameter at breast height (D, cm), density (N, stems/ha), basal area at the plotscale (AB,pl, m
2/ha), and sapwood area at the plot scale (AS,pl, m2/ha). (D–F) Triangles indicate Cibotium tree fern mean frond area
per individual (frond area3number of fronds per plant). (D–F insets) Frond area (AL, m2), density (N, 103 caudices/ha), and frond
area at the plot scale (AL,pl, 103 m2/ha). (G) Scaled-up mean stand diurnal sap flow (Epl), the sum of tree (gray) and tree fern (open)
components. Error bars indicate 95% confidence intervals, and the same lowercase letters indicate statistically indistinguishablemeans (P � 0.05; post hoc Tukey comparisons).
AURORA KAGAWA ET AL.1438 Ecological ApplicationsVol. 19, No. 6

and likely windier conditions associated with its lower
elevation on the island’s windward side. Soil nutrient
availability may also influence sap flow differences
among sites; a study at the Hamakua site showed that
fertilization increased sapwood-scaled sap flow by 43%
(Hubbard et al. 2004). Finally, we note that a study of
closely related congener Eucalyptus grandis in South
Africa also found high daily water use for 9-yr-old trees,
70 kg�d�1�tree�1 (Dye 1996), in contrast with the 33 kg/d
found for E. saligna in this study. That study reported
that trees exploited deep water sources, which would
have been highly unlikely at our site given the
exceedingly high permeability of the lava substrate; the
shallowest groundwater sources would have been at least
300 m below the ground surface (Bauer 2003). By
contrast, our mean value for the whole-tree sap flow rate
of F. uhdei was 34 kg/d, similar to that for E. saligna,
higher than the 2.6–17.3 kg/d reported for F. uhdei trees
in a stand at 460 m elevation on the island of O‘ahu, for
trees withD of 10–45 cm (RestomGaskill 2004); that site
was drier, with mean annual rainfall of 540–750 mm.
These differences in sap flow rates for the trees in this
study relative to the mean values published for trees of
the same species or genus at other sites further confirm
the degree to which transpiration can be plastic within
species. These comparisons highlight the ongoing need to
determine species’ relative water use for specific tree sizes
and ages and for the soil and atmospheric conditions at
specific sites.
Notably, the leaf-level transpiration rates for under-
story C. glaucum (9.49 6 1.10 mg�m�2�s�1) were within
the range of the canopy tree species with higher irradiance
and evaporative demand. Previous work reported that the
stomatal conductance of C. glaucum as measured by
porometry ranged up to 180 mmol�m�2�s�1 for plants atsites of a range of elevation and exposures (Durand and
Goldstein 2001), a moderate value relative to the range
for woody angiosperms (Jones 1992). To our knowledge,
there are no previously published studies of sap flow in
tree ferns, and thus, further study of tree fern water use
is needed, especially in systems in which they are
abundant and play a potentially major role in forest
water use, as shown in this study.
The substantial differences in transpiration on a
sapwood and whole-tree basis observed among the
coexisting species at our study sites may arise from
variation in the microclimate at leaf level (e.g., light,
temperature, and wind) and/or at the root level (e.g., due
to contrasting rooting depth). Species differences may
also arise from variation in root, wood, and leaf prop-
erties, contributing to differences in hydraulic, stomatal,
and canopy conductances (Tyree and Zimmermann
2002). Differences at the whole-tree level can also be
explained by lower sapwood allocation, and thus lower
sapwood area per tree, which contributed to the low
maximum sap flow rates for M. polymorpha. Differences
among species in daily rates also corresponded to
differences in temporal partitioning of water use. The
high daily rates for F. uhdei and E. saligna were driven
by short intervals of high sap flow for F. uhdei vs. long
periods of relatively lower flow for E. saligna; M.
polymorpha also sustained its low peak rates for long
periods. The early sap flow peak of E. saligna could arise
from its greater height or steep leaf angle facilitating
light interception at low sun angles (King 1997) or
nocturnal tissue recharge, while late maxima for
understory Cibotium are most likely due to shading
from canopy trees delaying the onset of photosynthesis
and transpiration in the morning. We found substantial
nocturnal sap flow and that this varied across species;
further, the rates of nocturnal sap flow may have been
underestimated to some degree due to our assumption of
zero sap flow at night (Dawson et al. 2007). Substantial
nocturnal sap flow in E. saligna and M. polymorpha may
arise from tissue recharge and/or nocturnal transpira-
tion; nocturnal transpiration has been documented
previously for M. polymorpha and Eucalyptus grandis
(Benyon 1999, Dawson et al. 2007) and attributed to
stomatal leakiness or to partially open stomata (Marks
and Lechowicz 2007). The variation among species in
sap flow rates and their temporal dynamics highlights
the importance of further work, e.g., to model the
response of stomatal conductance and transpiration to
climate variables and to elucidate the specific internal
and external control mechanisms. Such work should
allow prediction of species-specific transpiration rates
across a range of climatic conditions (Oren et al. 1999,
Oren and Pataki 2001, Pataki and Oren 2003, Ford et al.
2005, Ewers et al. 2007).
Strong differences in water use among native forest
and alien timber plantations
Our finding of strong variation among stands in
transpiration demonstrates that individual tree species’
traits (sap flow, as well as sapwood allocation) can
strongly influence stand-level transpiration in native vs.
alien-dominated wet tropical forests. These findings are
consistent with previous work in temperate and boreal
forests in which species composition was responsible for
variation in stand-level transpiration even given similar
leaf area index and soil type (Ewers et al. 2002, 2005). In
a study of 40- vs. 450-yr-old temperate riparian forests,
higher stand-level transpiration in the younger forest
was associated with greater numbers of young trees of
species with high sap flux densities and higher stand-
level sapwood area (Moore et al. 2004). Thus, differ-
ences in species composition can affect stand-level
transpiration, and stand transpiration is further affected
by stand structure and age.
Stand structure reflects differences in site history,
including planting densities, and species’ growth rates.
The 1.7-fold higher stem density for F. uhdei than for
M. polymorpha, along with its sixfold higher sapwood
allocation, resulted in over threefold higher total
sapwood area for F. uhdei; this difference, combined
with the fourfold higher sap flux density of F. uhdei,
September 2009 1439NATIVE VS. ALIEN FOREST WATER USE

resulted in a nearly ninefold higher stand-level tran-
spiration rate than for M. polymorpha trees. The
conservative stand-level transpiration of native M.
polymorpha-dominated stands was associated with not
only low sapwood area-specific transpiration for M.
polymorpha and low sapwood allocation, but also to
lower stem densities, the result of natural recruitment
and centuries of forest establishment and regeneration
(Drake and Mueller-Dombois 1993). By contrast, the
alien timber stands had higher densities of younger
trees with lower understory tree fern development. The
importance of stem density and total sapwood area has
been shown by previous studies of plantations; high-
density stands had higher transpiration rates under
non-limiting soil moisture conditions (Meinzer et al.
1996, Cienciala et al. 2000) and higher sapwood area
correlated with greater stand water use (Dunn and
Connor 1993, Vertessy et al. 2001).
Transpiration from the understory was especially
important in native M. polymorpha-dominated stands,
where water use by the abundant tree ferns more than
doubled the water use contributed by the trees alone.
This result is striking, yet consistent with estimates of
high contributions to forest water use of understories of
bracken fern (Roberts et al. 1980) and the evergreen
ericaceous shrub salal (Black et al. 1989). A strong
understory contribution may be common especially
when canopies are relatively open and/or for old-growth
stands; as overstory leaf area index (LAI) declines with
stand age, understory LAI and transpiration increase in
importance even though the rates of transpiration per
leaf area for the understory would be less than that of
the overstory (Vertessy et al. 2001, Eamus et al. 2006).
We highlight the need to consider understory plants, and
especially fern-dominated understories, as significant
water users. More broadly, this finding further demon-
strates that species composition influences stand water
balance as high frequencies of relatively low water-using
species can exert strong effect on comparative stand
water use. Because tree ferns were much more abundant
in the M. polymorpha forest, the ninefold difference in
transpiration between F. uhdei- and M. polymorpha-
dominated stands was reduced to a 2.5-fold difference
when tree fern water use was included. While understory
contributions did compensate for differences among tree
contributions, leading to narrower variation among
stands in transpiration, the remaining 2.5-fold difference
provides a case against the contention that transpiration
is always conservative across different forests (Roberts
1983, 2000).
We measured native and alien timber transpiration
for two months in the peak growing season, but our
findings are indicative for annual differences in transpi-
ration. We note that the highest water user studied here,
F. uhdei, is winter-deciduous and remains partially or
completely leafless for one month (Harrington and Ewel
1997). However, we expect that annual transpiration for
F. uhdei would be highest even if that of evergreen
species M. polymorpha and E. saligna remained the same
during the remainder of the year. Even three to four
months of zero sap flow for F. uhdei should not obviate
its fourfold greater transpiration rates during the wet
summer season, especially as the transpiration rates of
the evergreen species might also decrease for part of the
year, e.g., during the typically drier winter (see Hubbard
et al. [2004] for evidence of decreased sap flow during a
dry summer). We note that transpiration is typically
considered the most important determinant of stand
evapotranspiration (which also includes the evaporation
of intercepted rainfall), especially in the tropics (Calder
2001). Future work should elucidate the full water
balance of contrasting forest types by including canopy
and understory interception, stem flow, and seasonal
changes in soil water availability and leaf area. This
study, by showing significant variation across stand
types in transpiration, points to strong and dynamic
variation in overall water balance.
Implications for forest and water resources conservation
Our finding that alien timber stands can use much
more water than native forest has significant implica-
tions for the management of forested areas for
hydrologic services in addition to other ecological
services and objectives. In cases in which alien vegeta-
tion contributes to higher evapotranspiration, the eco-
nomic costs of the lost water resources should inform
land use and land management decisions. We note that
the economic and ecological importance of vegetation
water use may be strong not only when considering
timber plantations and forest, but also in cases of rapid
vegetation change, such as during the spread of invasive
species such as F. uhdei, which is known to displace
native trees in Hawaii following disturbance (Friday et
al. 2008), or as would occur with pest-induced mortality
of hydrologically important species (e.g., mortality of
eastern hemlock caused by hemlock woolly adelgid;
Ford and Vose 2007). The observed strong differences in
stand transpiration between E. saligna and F. uhdei in
this study further highlight the importance of consider-
ing hydrologic services in assessing the costs against
benefits of alternative commercial timber production
designs at specific sites.
The findings of this study also point to a strong need
to characterize the water uses of different vegetation
covers at a range of scales. While effective water
resources management depends on understanding pro-
cesses at the catchment scale, the land use decisions
affecting water resources tend to be made at smaller
spatial scales by landowners and local municipalities
(Agrawal et al. 2008). At those scales, timber plantations
are currently considered to be of higher market value
than native old-growth forests, but a broader valuation
of hydrological services may change the bases upon
which land management decisions are made (e.g.,
Kremen et al. 2000, Kaiser and Roumasset 2002,
Brauman et al. 2007). A wide range of forest types have
AURORA KAGAWA ET AL.1440 Ecological ApplicationsVol. 19, No. 6

often been estimated to have similar hydrological value
based on their prevention of runoff and erosion(Bruijnzeel 2004, Scott 2005). However, an additional
resolution in calculation of hydrologic costs andservices, by incorporating differences among vegetation
types in transpiration rates, could contribute to highervaluation of old-growth native forest relative tocommercial plantations. Given the increasing recogni-
tion of the value of forests for carbon sequestration,there is a strong need for detailed assessment of the
ecohydrological costs and benefits of alternative forestcovers for appropriate land use decisions.
CONCLUSIONS
Our study demonstrated that old-growth native M.
polymorpha forest can have conservative water userelative to certain alien timber plantations, despite
similar climate and soil. Even accounting for the strongunderstory contributions in native forest, F. uhdei stands
used water at twice the rate of stands dominated bynative M. polymorpha or alien E. saligna on a daily
basis. Our study also found strong differences in stand-level transpiration even among similarly aged alien
timber stands with different dominant species, E. salignaand F. uhdei. This study provides an example of how
major variation in stand-level water use can arisethrough differences in species’ sap flow rates, size, and
structure, and in stand history and organization. Thesefindings point to the importance of considering species
differences and stand structure in the valuation offorests for hydrologic services.
ACKNOWLEDGMENTS
We thank M. C. Ho, E. Kagawa, J. Hardison, J. and D.Fergerstrom, K. Brauman, S. Ziegler-Chong, T. Idol, B.Ostertag, D. Drake, the staff of the UHM-CTAHR KainaliuResearch Station and USDA-FS Institute of Pacific IslandsForestry, many volunteers from UHM, Hawai‘i and WestHawai‘i CC Forest TEAMS, Amy B. H. Greenwell Ethnobo-tanical Garden, and the Kona community for logistical,technical, and field assistance and discussion; KamehamehaSchools for site access; and anonymous reviewers for helpfulcomments on the manuscript. This work was supported in partby scholarships from Sigma Xi GIAR, KS ‘Imi Na‘auao and‘Aina Ulu programs, UHM EECB, NHSEMP, and KahuewaiOla programs, and funding from USGS contract number2004HI57B, NSF grant IOS-0753233, and the USDOE ECHOinitiative. This paper is contribution number 2008-011 to theHawai‘i Biological Survey.
LITERATURE CITED
Agrawal, A., A. Chhatre, and R. Hardin. 2008. Changinggovernance of the world’s forests. Science 320:1460–1462.
Arcand, N., A. K. Kagawa, L. Sack, and T. W. Giambelluca.2008. Scaling of frond form in Hawaiian tree fern Cibotiumglaucum: compliance with global trends and application forfield estimation. Biotropica 40:686–691.
Baird, A. J., and R. L. Wilby, editors. 1999. Eco-hydrology:plants and water in terrestrial and aquatic environments.Routledge, London, UK.
Baker, J. M., and C. H. M. van Bavel. 1987. Measurement ofmass flow of water in stems of herbaceous plants. Plant, Celland Environment 10:777–782.
Barnard, H. R., and M. G. Ryan. 2003. A test of the hydrauliclimitation hypothesis in fast-growing Eucalyptus saligna.Plant, Cell and Environment 26:1235–1245.
Baruch, Z., and G. Goldstein. 1999. Leaf construction cost,nutrient concentration, and net CO2 assimilation of nativeand invasive species in Hawaii. Oecologia 121:183–192.
Baruch, Z., R. R. Pattison, and G. Goldstein. 2000. Responsesto light and water availability of four invasive Melastoma-taceae in the Hawaiian Islands. International Journal ofPlant Science 161:107–118.
Baskerville, G. L. 1972. Use of logarithmic regression in theestimation of plant biomass. Canadian Journal of ForestResearch 2:49–53.
Bauer, G. R. 2003. A study of the ground-water conditions inNorth and South Kona and South Kohala districts, Island ofHawaii, 1991–2002. PR-2003-01. State of Hawaii, Depart-ment of Land and Natural Resources, Commission on WaterResource Management, Honolulu, Hawaii, USA.
Benyon, R. G. 1999. Nighttime water use in an irrigatedEucalyptus grandis plantation. Tree Physiology 19:853–859.
Black, T. A., F. M. Kelliher, J. S. Wallace, J. B. Stewart, J. L.Monteith, and P. G. Jarvis. 1989. Processes controllingunderstorey evapotranspiration [and discussion]. Philosoph-ical Transactions of the Royal Society B 324:207–231.
Blukacz, E. A., W. G. Sprules, and J. Brunner. 2005. Use of thebootstrap for error propagation in estimating zooplanktonproduction. Ecology 86:2223–2231.
Bosch, J. M., and J. D. Hewlett. 1982. A review of catchmentexperiments to determine the effect of vegetation changes onwater yield and evapotranspiration. Journal of Hydrology55:3–23.
Brauman, K. A., G. C. Daily, T. K. Duarte, and H. A.Mooney. 2007. The nature and value of ecosystem services:an overview highlighting hydrologic services. Annual Reviewof Environment and Resources 32:67–98.
Brown, A. E., L. Zhang, T. A. McMahon, A. W. Western,and R. A. Vertessy. 2005. A review of paired catchmentstudies for determining changes in water yield resultingfrom alterations in vegetation. Journal of Hydrology 310:28–61.
Bruijnzeel, L. A. 2004. Hydrological functions of tropicalforests: Not seeing the soil for the trees? Agriculture,Ecosystems, and Environment 104:185–228.
Calder, I. R. 2001. Canopy processes: implications fortranspiration, interception and splash induced erosion,ultimately for forest management and water resources. PlantEcology 153:203–214.
Carlson, N. K., and L. W. Bryan. 1959. Hawaiian timber forthe coming generations. Trustees of the Bernice P. BishopEstate, Honolulu, Hawaii, USA.
Carlson, N. K., and L. W. Bryan. 1963. The Honaunau Forest:an appraisal after seven years of planting. Journal of Forestry61:643–647.
Cienciala, E., J. Kucera, and A. Malmer. 2000. Tree sap flowand stand transpiration of two Acacia mangium plantationsin Sabah, Borneo. Journal of Hydrology 236:109–120.
Cordell, S., R. J. Cabin, and L. J. Hadway. 2002. Physiologicalecology of native and alien dry forest shrubs in Hawaii.Biological Invasions 4:387–396.
Dawson, T. E., S. S. O. Burgess, K. P. Tu, R. S. Oliveira, L. S.Santiago, J. B. Fisher, K. A. Simonin, and A. R. Ambrose.2007. Nighttime transpiration in woody plants from con-trasting ecosystems. Tree Physiology 27:561–575.
Delzon, S., and D. Loustau. 2005. Age-related decline in standwater use: sap flow and transpiration in a pine forestchronosequence. Agricultural and Forest Meteorology 129:105–119.
Drake, D. R., and D. Mueller-Dombois. 1993. Populationdevelopment of rain forest trees on a chronosequence ofHawaiian lava flows. Ecology 74:1012–1019.
September 2009 1441NATIVE VS. ALIEN FOREST WATER USE

Dunn, G. M., and D. J. Connor. 1993. An analysis of sap flowin mountain ash (Eucalyptus regnans) forests of different age.Tree Physiology 13:321–336.
Durand, L. Z., and G. Goldstein. 2001. Photosynthesis,photoinhibition, and nitrogen use efficiency in native andinvasive tree ferns in Hawaii. Oecologia 126:345–354.
Dye, P. J. 1996. Response of Eucalyptus grandis trees to soilwater deficits. Tree Physiology 16:233–238.
Eagleson, P. S. 2002. Ecohydrology: Darwinian expression ofvegetation form and function. First edition. CambridgeUniversity Press, Cambridge, UK.
Eamus, D., T. Hatton, P. Cook, and C. Colvin. 2006.Ecohydrology: vegetation function, water and resourcemanagement. CSIRO Publishing, Collingwood, Victoria,Australia.
Efron, B., and R. J. Tibshirani. 1993. An introduction to thebootstrap. First edition. Chapman and Hall, New York, NewYork, USA.
Ekern, P. C., and J.-H. Chang. 1985. Pan evaporation: State ofHawai‘i, 1894–1983. Report R74. State of Hawaii, Depart-ment of Land and Natural Resources, Honolulu, Hawaii,USA.
Ewers, B. E., S. T. Gower, B. Bond-Lamberty, and C. K.Wang. 2005. Effects of stand age and tree species on canopytranspiration and average stomatal conductance of borealforests. Plant, Cell and Environment 28:660–678.
Ewers, B. E., D. S. Mackay, S. T. Gower, D. E. Ahl, S. N.Burrows, and S. S. Samanta. 2002. Tree species effects onstand transpiration in northern Wisconsin. Water ResourcesResearch 38:1–11.
Ewers, B. E., D. S. Mackay, and S. Samanta. 2007. Interannualconsistency in canopy stomatal conductance control of leafwater potential across seven tree species. Tree Physiology 27:11–24.
Farley, K. A., E. G. Jobbagy, and R. B. Jackson. 2005. Effectsof afforestation on water yield: a global synthesis withimplications for policy. Global Change Biology 11:1565–1576.
Fine, P. V. A. 2002. The invasibility of tropical forests by exoticplants. Journal of Tropical Ecology 18:687–705.
Ford, C. R., C. E. Goranson, R. J. Mitchell, R. E. Will, andR. O. Teskey. 2005. Modeling canopy transpiration usingtime series analysis: a case study illustrating the effect of soilmoisture deficit on Pinus taeda. Agricultural and ForestMeteorology 130:163–175.
Ford, C. R., and J. M. Vose. 2007. Tsuga canadensis (L.) Carr.mortality will impact hydrologic processes in southernAppalachian forest ecosystems. Ecological Applications 17:1156–1167.
Friday, J. B., P. G. Scowcroft, and A. Ares. 2008. Responses ofnative and invasive plant species to selective logging in anAcacia koa–Metrosideros polymorpha forest in Hawai‘i.Applied Vegetation Science 11:1–12.
Funk, J. L., and P. M. Vitousek. 2007. Resource-use efficiencyand plant invasion in low-resource systems. Nature 446:1079–1081.
Granier, A. 1985. Une nouvelle methode pour la mesure du fluxde seve brute dans le tronc des arbres. Annales des SciencesForestieres 42:193–200.
Harrington, R. A., and J. J. Ewel. 1997. Invasibility of treeplantation by native and non-indigenous plant species inHawaii. Forestry Ecology and Management 99:153–162.
Hatton, T. J., E. A. Catchpole, and R. A. Vertessy. 1990.Integration of sapflow velocity to estimate plant water-use.Tree Physiology 6:201–209.
Hatton, T. J., and H.-I. Wu. 1995. Scaling theory to extrapolateindividual tree water use to stand water use. HydrologicalProcesses 9:527–540.
Hubbard, R. M., M. G. Ryan, C. P. Giardina, and H. Barnard.2004. The effect of fertilization on sap flux and canopy
conductance in a Eucalyptus saligna experimental forest.Global Change Biology 10:427–436.
Huxman, T. E., B. P. Wilcox, D. D. Breshears, R. L. Scott,K. A. Snyder, E. E. Small, K. Hultine, W. T. Pockman, andR. B. Jackson. 2005. Ecohydrological implications of woodyplant encroachment. Ecology 86:308–319.
Jackson, R. B., E. G. Jobbagy, R. Avissar, S. B. Roy, D. J.Barrett, C. W. Cook, K. A. Farley, D. C. Le Maitre, B. A.McCarl, and B. C. Murray. 2005. Trading water for carbonwith biological sequestration. Science 310:1944–1947.
James, S. A., M. Clearwater, F. C. Meinzer, and G. Goldstein.2002. Heat dissipation sensors of variable length for themeasurement of sap flow in trees with deep sapwood. TreePhysiology 22:277–283.
Jones, H. 1992. Plants and microclimate: a quantitativeapproach to environmental plant physiology. Second edition.Cambridge University Press, Cambridge, UK.
Kaiser, B., and J. Roumasset. 2002. Valuing indirect ecosystemservices: the case of tropical watersheds. Environment andDevelopment Economics 7:701–714.
King, D. A. 1997. The functional significance of leaf angle inEucalyptus. Australian Journal of Botany 45:619–639.
Kremen, C., J. O. Niles, M. G. Dalton, G. C. Daily, P. R.Ehrlich, J. P. Fay, D. Grewal, and R. P. Guillery. 2000.Economic incentives for rain forest conservation acrossscales. Science 288:1828–1832.
Le Maitre, D. C., B. W. van Wilgen, C. M. Gelderblom, C.Bailey, R. A. Chapman, and J. A. Nel. 2002. Invasive alientrees and water resources in South Africa: case studies of thecosts and benefits of management. Forest Ecology andManagement 160:143–159.
Lockwood, J. P. 1995. Mauna Loa eruptive history—thepreliminary radiocarbon record. Pages 81–94 in J. M. Rhodesand J. P. Lockwood, editors. Mauna Loa revealed: structure,composition, history and hazards. American GeophysicalUnion, Washington, D.C., USA.
Lu, P., L. Urban, and P. Zhao. 2004. Granier’s thermaldissipation probe (TDP) method for measuring sap flow intrees: theory and practice. Acta Botanica Sinica 46:631–646.
Lugo, A. E., and E. Helmer. 2004. Emerging forests onabandoned land: Puerto Rico’s new forests. Forest Ecologyand Management 190:145–161.
Marks, C. O., and M. J. Lechowicz. 2007. The ecological andfunctional correlates of nocturnal transpiration. Tree Phys-iology 27:577–584.
McCulloh, K. A., K. Winter, F. C. Meinzer, M. Garcia, J.Aranda, and B. Lachenbruch. 2007. A comparison of dailywater use estimates derived from constant-heat sap-flowprobe values and gravimetric measurements in pot-grownsaplings. Tree Physiology 27:1355–1360.
McDowell, N., et al. 2002. The relationship between tree heightand leaf area : sapwood area ratio. Oecologia 132:12–20.
Meinzer, F. C., J. H. Fownes, and R. A. Harrington. 1996.Growth indices and stomatal control of transpiration inAcacia koa stands planted at different densities. TreePhysiology 16:607–615.
Meinzer, F. C., G. Goldstein, A. C. Franco, M. Bustamante, E.Igler, P. Jackson, L. Caldas, and P. W. Rundel. 1999.Atmospheric and hydraulic limitations on transpiration inBrazilian cerrado woody species. Functional Ecology 13:273–282.
Meinzer, F. C., S. A. James, G. Goldstein, and D. Woodruff.2003. Whole-tree water transport scales with sapwoodcapacitance in tropical forest canopy trees. Plant, Cell andEnvironment 26:1147–1155.
Melcher, P. J., M. A. Zwieniecki, and N. M. Holbrook. 2003.Vulnerability of xylem vessels to cavitation in sugar maple:scaling from individual vessels to whole branches. PlantPhysiology 131:1775–1780.
Moore, G. W., B. J. Bond, J. A. Jones, N. Phillips, and F. C.Meinzer. 2004. Structural and compositional controls on
AURORA KAGAWA ET AL.1442 Ecological ApplicationsVol. 19, No. 6

transpiration in 40- and 450-year-old riparian forests inwestern Oregon, USA. Tree Physiology 24:481–491.
Oren, R., and D. E. Pataki. 2001. Transpiration in response tovariation in microclimate and soil moisture in southeasterndeciduous forests. Oecologia 127:549–559.
Oren, R., J. S. Sperry, G. G. Katul, D. E. Pataki, B. E. Ewers,N. Phillips, and K. V. R. Schafer. 1999. Survey and synthesisof intra- and interspecific variation in stomatal sensitivity tovapour pressure deficit. Plant, Cell and Environment 22:1515–1526.
Palmer, D. D. 2002. Hawaii’s ferns and fern allies. University ofHawaii Press, Honolulu, Hawaii, USA.
Pataki, D. E., and R. Oren. 2003. Species differences instomatal control of water loss at the canopy scale in a maturebottomland deciduous forest. Advances in Water Resources26:1267–1278.
Pattison, R. R., G. Goldstein, and A. Ares. 1998. Growth,biomass allocation and photosynthesis of invasive and nativeHawaiian rainforest species. Oecologia 117:449–459.
R Development Core Team. 2007. R: a language andenvironment for statistical computing. R Foundation forStatistical Computing, Vienna, Austria.
Restom Gaskill, T. G. 2004. Hydrology of forest ecosystems inthe Honouliuli Preserve: implications for groundwaterrecharge and watershed restoration. Dissertation. Universityof Hawaii at Manoa, Honolulu, Hawaii, USA.
Richardson, D. M. 1998. Forestry trees as invasive aliens.Conservation Biology 12:18–26.
Roberts, J. 1983. Forest transpiration—a conservative hydro-logical process. Journal of Hydrology 66:133–141.
Roberts, J. 2000. The influence of physical and physiologicalcharacteristics of vegetation on their hydrological response.Hydrological Processes 14:2885–2901.
Roberts, J., C. F. Pymar, J. S. Wallace, and R. M. Pitman.1980. Seasonal changes in leaf area, stomatal and canopyconductances and transpiration from bracken below a forestcanopy. Journal of Applied Ecology 17:409–422.
Roberts, S., R. A. Vertessy, and R. Grayson. 2001. Transpi-ration from Eucalyptus sieberi (L. Johnson) forests ofdifferent age. Forest Ecology and Management 143:153–161.
Rodriguez-Iturbe, I., and A. Porporato. 2004. Ecohydrology of
water-controlled ecosystems: soil moisture and plant dynam-ics. Cambridge University Press, Cambridge, UK.
Sakuratani, T. 1981. A heat balance method for measuringwater flux in the stem of intact plants. Journal of AgriculturalMeteorology 37:9–17.
Santiago, L. S., G. Goldstein, F. C. Meinzer, J. H. Fownes, andD. Mueller-Dombois. 2000. Transpiration and forest struc-ture in relation to soil waterlogging in a Hawaiian montanecloud forest. Tree Physiology 20:673–681.
Scott, D. F. 2005. On the hydrology of industrial timberplantations. Hydrological Processes 19:4203–4206.
Smith, A. R., K. M. Pryer, E. Schuettpelz, P. Korall, H.Schneider, and P. C. Wolf. 2006. A classification for extantferns. Taxon 55:705–731.
Spicer, R., and N. M. Holbrook. 2005. Within-stem oxygenconcentration and sap flow in four temperate tree species:Does long-lived xylem parenchyma experience hypoxia?Plant, Cell and Environment 28:192–201.
Sprugel, D. G. 1983. Correcting for bias in log-transformedallometric equations. Ecology 64:209–210.
Stratton, L., and G. Goldstein. 2001. Carbon uptake, growthand resource-use efficiency in one invasive and six nativeHawaiian dry forest tree species. Tree Physiology 21:1327–1334.
Tyree, M. T., and M. H. Zimmermann. 2002. Xylem structureand the ascent of sap. Springer, Berlin, Germany.
Vertessy, R. A., F. G. R. Watson, and S. K. O’Sullivan. 2001.Factors determining relations between stand age andcatchment water balance in mountain ash forests. ForestEcology and Management 143:13–26.
Wagner, W. L., D. R. Herbst, and S. H. Sohmer. 1999. Manualof the flowering plants of Hawaii. Bishop Museum,Honolulu, Hawaii, USA.
Wright, S. J. 2005. Tropical forests in a changing environment.Trends in Ecology and Evolution 20:553–560.
Zar, J. H. 1999. Biostatistical analysis. Fourth edition. Prentice-Hall, Upper Saddle River, New Jersey, USA.
Zimmerman, N., F. R. Hughes, S. Cordell, P. Hart, H. K.Chang, D. Perez, R. K. Like, and R. Ostertag. 2008. Patternsof primary succession of native and introduced plants inlowland wet forests in eastern Hawai‘i. Biotropica 40:277–284.
September 2009 1443NATIVE VS. ALIEN FOREST WATER USE