hawaii’s electricity analysis and recent trends
TRANSCRIPT

Hawaii’s Electricity Industry: 2019-2020 Analysis and Recent
Trends
July 2021
2
TABLE OF CONTENTS 1. INTRODUCTION ............................................................................................7
2. ELECTRICITY GENERATION BY PRODUCERS .......................................8 3. ELECTRICITY GENERATION BY SOURCES ..........................................17 4. FACTORS AFFECTING ELECTRICITY EXPENDITURES IN HAWAII ..35 5. ELECTRICITY CONSUMPTION BY SECTOR ..........................................45 6. CONCLUSIONS .............................................................................................53

3
LIST OF TABLES Table 1 Hawaii Electricity Net Generation by Producer ...........................................9 Table 2 Hawaii Electricity Net Generation by Utility .............................................13 Table 3 Hawaii Electricity Sales by Utility ..............................................................14 Table 4 Share of Utility Station Usage and Loss of Total Electricity Production ...15 Table 5 Share of Total Station Usage and Loss of Total Electricity Production ......16 Table 6 Electricity Net Generation by Source: Total Electric Power Industry .........17 Table 7 Electricity Net Generation by Source: Electric Utilities .............................19 Table 8 Electricity Net Generation by Source: IPP & CHP .....................................20 Table 9 Power Generating Capacity by Source: Total Electric Power Industry ......21 Table 10 Power Generating Capacity by Source: Electric Utilities .........................22 Table 11 Power Generating Capacity by Source: IPP and CHP ...............................23 Table 12 Power Generating Capacity by Source in 2020 .........................................24 Table 13 Average Operating Hours: Total Electric Power Industry .........................25 Table 14 Average Operating Hours: Electric Utilities ..............................................26 Table 15 Average Operating Hours: IPP and CHP ...................................................27 Table 16 Fossil Fuel Consumption: Total Electric Power Industry .........................28 Table 17 Fossil Fuel Consumption: Electric Utility .................................................30 Table 18 Fossil Fuel Consumption: IPP and CHP ....................................................31 Table 19 Hawaii Utility Fuel Consumption ..............................................................32 Table 20 Hawaii Utility Fuel Cost ............................................................................33 Table 21 Hawaii Utility Average Fuel Cost ...............................................……. …34 Table 22 Hawaii Average Revenue of Electricity by Utility ...................................40 Table 23 Hawaii Average Cost of Fuel and Purchased Power by Utility .................41 Table 24 Utility Fuel Cost and Purchased Power Cost Comparison by Utility ........43 Table 25 Other Major Cost of Electricity by Utility ................................................44 Table 26 Electricity Consumption by Sector and by Utility .....................................47 Table 27 Number of Retail Customers by Sector in Hawaii ....................................48 Table 28 Annual Electricity Consumption per Customer by Sector.........................49 Table 29 Revenue from Retail Electricity Sales by Sector in Hawaii .....................50 Table 30 Average Electricity Price by County in Hawaii ........................................51 Table 31 Average Electricity Price by Sector in Hawaii .........................................52

4
LIST OF FIGURES Figure 1 Electricity Production and Consumption in Hawaii: 2019 ........................10 Figure 2 Changes in Electricity Production and Consumption in Hawaii: 2019-2020 ……………………………… ..................................................................................11 Figure 3 Changes in Electricity Production and Consumption in Hawaii: 2005-2019 ……………………………… ..................................................................................12 Figure 4 Components of Utility Operating Expense in Hawaii: 2019 .....................35 Figure 5 Changes of Utility Operating Expense in Hawaii: 2019-2020 ..................36 Figure 6 Changes of Utility Operating Expense in Hawaii: 2005-2019 ...................37 Figure 7 Components of HECO Operating Expense: 2019 .....................................38 Figure 8 Changes of HECO Operating Expense: 2019-2020 ..................................38 Figure 9 Changes of HECO Operating Expense: 2005-2019 ...................................39 Figure 10 Electricity Consumption by Sector in Hawaii .........................................45
5
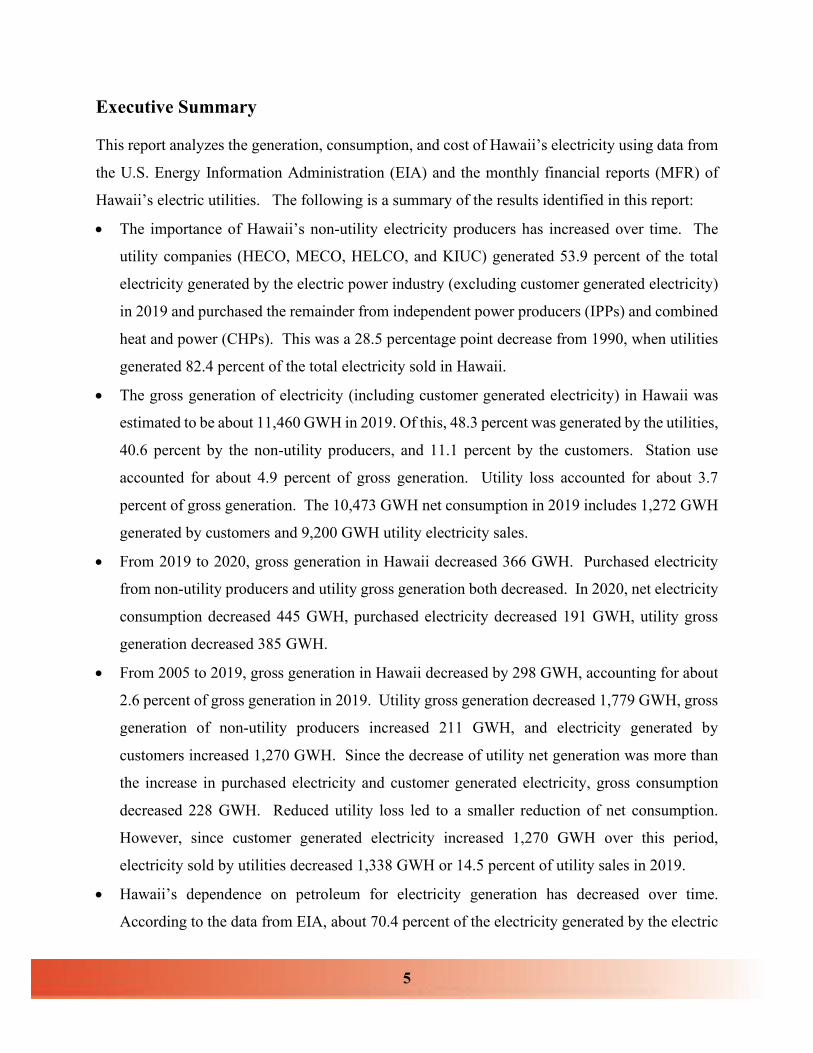
Executive Summary This report analyzes the generation, consumption, and cost of Hawaii’s electricity using data from
the U.S. Energy Information Administration (EIA) and the monthly financial reports (MFR) of
Hawaii’s electric utilities. The following is a summary of the results identified in this report:
• The importance of Hawaii’s non-utility electricity producers has increased over time. The
utility companies (HECO, MECO, HELCO, and KIUC) generated 53.9 percent of the total
electricity generated by the electric power industry (excluding customer generated electricity)
in 2019 and purchased the remainder from independent power producers (IPPs) and combined
heat and power (CHPs). This was a 28.5 percentage point decrease from 1990, when utilities
generated 82.4 percent of the total electricity sold in Hawaii.
• The gross generation of electricity (including customer generated electricity) in Hawaii was
estimated to be about 11,460 GWH in 2019. Of this, 48.3 percent was generated by the utilities,
40.6 percent by the non-utility producers, and 11.1 percent by the customers. Station use
accounted for about 4.9 percent of gross generation. Utility loss accounted for about 3.7
percent of gross generation. The 10,473 GWH net consumption in 2019 includes 1,272 GWH
generated by customers and 9,200 GWH utility electricity sales.
• From 2019 to 2020, gross generation in Hawaii decreased 366 GWH. Purchased electricity
from non-utility producers and utility gross generation both decreased. In 2020, net electricity
consumption decreased 445 GWH, purchased electricity decreased 191 GWH, utility gross
generation decreased 385 GWH.
• From 2005 to 2019, gross generation in Hawaii decreased by 298 GWH, accounting for about
2.6 percent of gross generation in 2019. Utility gross generation decreased 1,779 GWH, gross
generation of non-utility producers increased 211 GWH, and electricity generated by
customers increased 1,270 GWH. Since the decrease of utility net generation was more than
the increase in purchased electricity and customer generated electricity, gross consumption
decreased 228 GWH. Reduced utility loss led to a smaller reduction of net consumption.
However, since customer generated electricity increased 1,270 GWH over this period,
electricity sold by utilities decreased 1,338 GWH or 14.5 percent of utility sales in 2019.
• Hawaii’s dependence on petroleum for electricity generation has decreased over time.
According to the data from EIA, about 70.4 percent of the electricity generated by the electric

6
power industry was generated from petroleum fuel in 2019, and this represented a 19.6
percentage point decrease from the 1990 figure of 90.0 percent. In 2019, electricity generated
from renewable sources accounted for 16.2 percent of net generation of electricity by the
electric power industry.
• Most of the non-petroleum generated electricity was produced by non-utility producers.
Almost all electricity generated from the utilities was from petroleum fuel. From 1990 to 2019,
the petroleum generated electricity share of net utility generated electricity decreased only
slightly from 99.6 percent to 94.7 percent. The petroleum generated electricity share of non-
utility generated electricity decreased from 45.0 percent to 42.1 percent; the share of coal
generated electricity increased from 0.1 percent to 28.9 percent; the share of wind generated
electricity increased from 1.7 percent to 11.8 percent; the share of solar generated electricity
increased from 0.0 percent to 5.1 percent; and the share of biomass decreased from 48.9 percent
to 5.2 percent.
• In 2020, the total operating expense of Hawaii’s utilities decreased by $275 million from 2019.
Of this decrease, about 79.3 percent or $218 million was due to the decreased fuel cost, and
about 14.1 percent or $39 million was due to the decreased purchased power cost.
• From 2005 to 2019, the total operating expense of Hawaii utilities increased $674 million. Of
this increase, $61 million was due to increased fuel costs, and $215 million was due to
increased purchased power costs.
• The average revenue per kWh sold in Hawaii increased almost every year from 18.3 cents in
2005 to 34.0 cents in 2012, an increase of 9.3 percent per year over this period. From 2012 to
2016, however, the average revenue from electricity sales decreased 8.4 percent per year, from
34.0 cents per kWh to 24.0 cents per kWh. From 2016 to 2018, the average revenue from
electricity sales increased from 24.0 cents per kWh to 29.4 cents per kWh. In 2019 and 2020,
the average electricity revenue decreased to 29.0 cents per kWh and 28.2 cents per kWh,
respectively. The average electricity revenue in 2020 was the highest at KIUC at about 40.7
cents per kWh. This was followed by HELCO at 33.6 cents per kWh, MECO at 33.2 cents per
kWh, and HECO at 25.8 cents per kWh.
• Before 2015, the average purchased power cost was below the average utility fuel cost in most
of the years. Since 2015, average purchased power cost was above the average utility fuel
cost.

7
1. Introduction
Electricity plays an important role in Hawaii’s economy. Hawaii’s total expenditures on
utility sold electricity reached a peak of about $3.3 billion in 2012 due to the state’s heavy reliance
on imported petroleum and the rapid increase in petroleum prices until 2012. From 2005 to 2012,
total expenditures on utility sold electricity in Hawaii increased from $1.9 billion to $3.3 billion,
an average annual increase of 7.9 percent. It is important to note that this increase was much
higher than the 3.4 percent Honolulu CPI-U increase during the same period, which indicates that
energy expenditure growth outpaced inflation during this period. Since 2012, total expenditures
on utility sold electricity decreased due to decreased petroleum prices and increase generation of
customer-sited solar electricity. In 2020, total expenditures on utility sold electricity decreased
$263.1 million or 9.9 percent from 2019. The total fuel and purchased power cost of Hawaii’s
utilities decreased $256.8 million or 17.9 percent, and the average revenue per kWh of electricity
sold decreased 2.8 percent in 2020.
In 2013, the Research and Economic Analysis Division of DBEDT conducted a study to
examine Hawaii’s electric power industry based on data up to 2012. As an eighth follow up to the
2013 study, this study intends to answer the following research questions:
• Who produces electricity in Hawaii?
• What type of fuels are used to generate electricity in Hawaii?
• What are the main factors that affect electricity prices in Hawaii?
• How have the factors affecting electricity prices changed over time?
• What role does renewable energy play in electricity generation?
• What factors impact the production cost of electricity?
• What are the recent trends in electricity consumption by types of consumers?
• What is the performance of the electricity industry in 2019 and 2020?
The data provided in this report were primarily from three major sources. The first source
was the U.S. Energy Information Administration (EIA). The second source of data was each
respective Hawaii electric utility’s Monthly Financial Reports (MFR). The MFR data provided
both annual and monthly data by county utility. The third source of data was the utility Renewable
Portfolio Standard Status Report (RPS).

8
2. Electricity Generation by Producers Electricity consumed in Hawaii is mainly sold by the four electric utility companies:
Hawaiian Electric Company (HECO), serving the island of Oahu; Maui Electric Company
(MECO), serving the islands of Maui, Lanai, and Molokai; Hawaii Electric Light Company
(HELCO), serving the island of Hawaii; and Kauai Island Utility Cooperative (KIUC), serving the
island of Kauai. MECO and HELCO are whole owned subsidiaries of HECO, which is in turn a
wholly owned subsidiary of Hawaii Electric Industries, Inc.
Electricity consumed in Hawaii is generated mainly by the electric utilities and non-utility
electricity producers. Non-utility producers include independent power producers (IPP),
combined heat and power (CHP)-Electric Power, CHP-Industrial Power, and CHP-Commercial
Power. Over time, the share of electricity generated by the utilities decreased. As shown in Table
1, from 1990 to 2019, the electric utilities’ share of net electricity generation (excluding customer-
sited systems) decreased from 82.4 percent to 53.9 percent. Electricity generated by utilities and
the four types of non-utility producers are defined as the electricity generated by the electric power
industry in the EIA data.
In addition to the electricity generated by the electric power industry, some consumers also
generated electricity, such as electricity generated from the photovoltaic (PV) systems owned by
residential or commercial users.
Electricity generation data provided by the EIA and the utility MFR are not exactly
comparable. According to the MFR, electricity sold by the four utilities includes net generation
of the utilities and purchased electricity minus electricity lost in the utility systems (including a
small portion of electricity used but not paid for by electricity users). The net electricity generation
of the utilities is the total electricity generated minus the total usage by the utility owned power
stations. The purchased electricity is the total generation of non-utility producers minus their
station use. Since the usage data of non-utility producers is not available, total generation by the
non-utility producers is also not available. In 2019, net electricity to the utility system (excluding
station use but including purchased electricity) in Hawaii was 9,625 GWH based on the utility
MFR, lower than the net electricity generation from the EIA data (9,750 GWH).

9
Table 1. Hawaii Electricity Net Generation by Producer
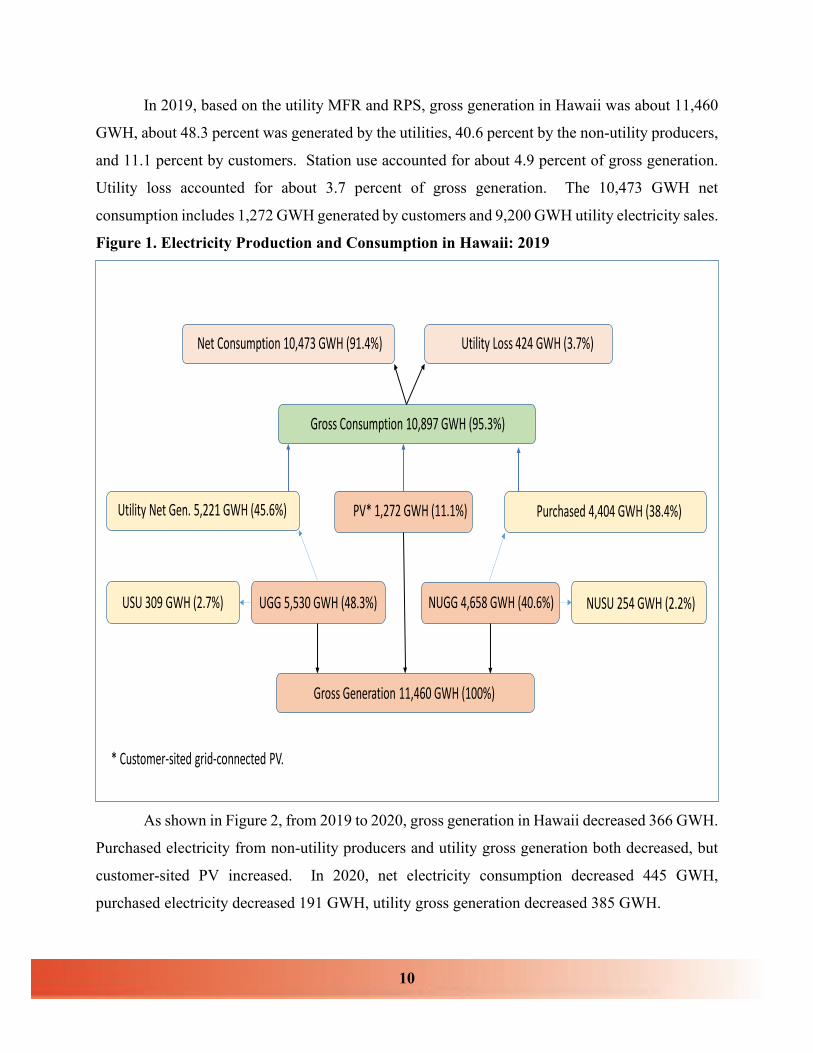
As shown in Figure 1, total gross electricity generation includes utility gross generation
(UGG), non-utility gross generation (NUGG), and customer generated electricity (customer-sited
grid-connected PV). Utility gross generation includes utility net generation (UNG) and utility
station use (USU). Non-utility gross generation includes utility purchased electricity and non-
utility station use (NUSU). Gross consumption of electricity is gross generation minus station use.
Gross consumption minus utility loss is the net consumption of electricity.
State % of Total GenerationTotal
Generation 1/ CHPYear GWh Utility IPP Electric Industry Commercial
1990 9,703 82.4 4.0 5.6 8.0 - 1991 8,703 84.3 4.3 1.7 9.7 - 1992 9,844 69.7 4.1 17.9 8.3 - 1993 9,944 61.2 5.2 26.0 7.7 - 1994 10,109 59.9 6.2 26.8 7.1 - 1995 10,304 60.1 6.2 27.3 6.4 - 1996 10,628 60.4 5.7 27.6 6.3 - 1997 10,312 60.2 6.4 27.8 5.6 - 1998 10,228 61.6 6.3 27.3 4.8 - 1999 10,404 62.0 5.8 26.7 5.4 - 2000 10,593 61.7 6.2 27.0 5.1 - 2001 10,633 60.0 4.9 30.3 4.7 - 2002 11,663 64.4 3.4 28.2 4.0 - 2003 10,976 59.2 5.0 33.2 2.7 - 2004 11,410 61.2 2.3 31.3 2.3 2.9 2005 11,523 60.0 2.4 32.7 2.3 2.5 2006 11,559 60.9 3.0 30.9 2.3 2.9 2007 11,533 60.1 4.4 30.6 2.3 2.6 2008 11,376 58.9 7.9 28.0 2.2 2.9 2009 11,011 59.1 7.3 28.4 2.3 2.9 2010 10,836 59.2 7.0 27.2 3.7 2.9 2011 10,723 59.5 7.5 26.4 3.7 3.0 2012 10,469 57.4 8.6 27.0 4.1 2.9 2013 10,267 56.0 9.6 27.2 3.8 3.5 2014 10,204 54.1 10.4 27.4 4.4 3.7 2015 10,120 54.3 11.2 26.6 4.2 3.7 2016 9,949 52.4 11.7 28.2 3.6 4.1 2017 9,813 53.2 12.2 27.8 3.0 3.8 2018 9,797 54.1 12.4 26.6 2.9 4.1 2019 9,750 53.9 12.7 26.4 2.8 4.2
1/ Total generation from EIA is based on survey of electricity producers' net generation (excluding station use). Source: Energy Information Administration, State Energy Data System
Units: %
10
In 2019, based on the utility MFR and RPS, gross generation in Hawaii was about 11,460
GWH, about 48.3 percent was generated by the utilities, 40.6 percent by the non-utility producers,
and 11.1 percent by customers. Station use accounted for about 4.9 percent of gross generation.
Utility loss accounted for about 3.7 percent of gross generation. The 10,473 GWH net
consumption includes 1,272 GWH generated by customers and 9,200 GWH utility electricity sales.
Figure 1. Electricity Production and Consumption in Hawaii: 2019
As shown in Figure 2, from 2019 to 2020, gross generation in Hawaii decreased 366 GWH.
Purchased electricity from non-utility producers and utility gross generation both decreased, but
customer-sited PV increased. In 2020, net electricity consumption decreased 445 GWH,
purchased electricity decreased 191 GWH, utility gross generation decreased 385 GWH.
UGG 5,530 GWH (48.3%)
Purchased 4,404 GWH (38.4%)
Gross Consumption 10,897 GWH (95.3%)
USU 309 GWH (2.7%)
PV* 1,272 GWH (11.1%)
NUSU 254 GWH (2.2%)NUGG 4,658 GWH (40.6%)
Net Consumption 10,473 GWH (91.4%) Utility Loss 424 GWH (3.7%)
Utility Net Gen. 5,221 GWH (45.6%)
Gross Generation 11,460 GWH (100%)
* Customer-sited grid-connected PV.

11
Figure 2. Changes in Electricity Production and Consumption in Hawaii: 2019-2020
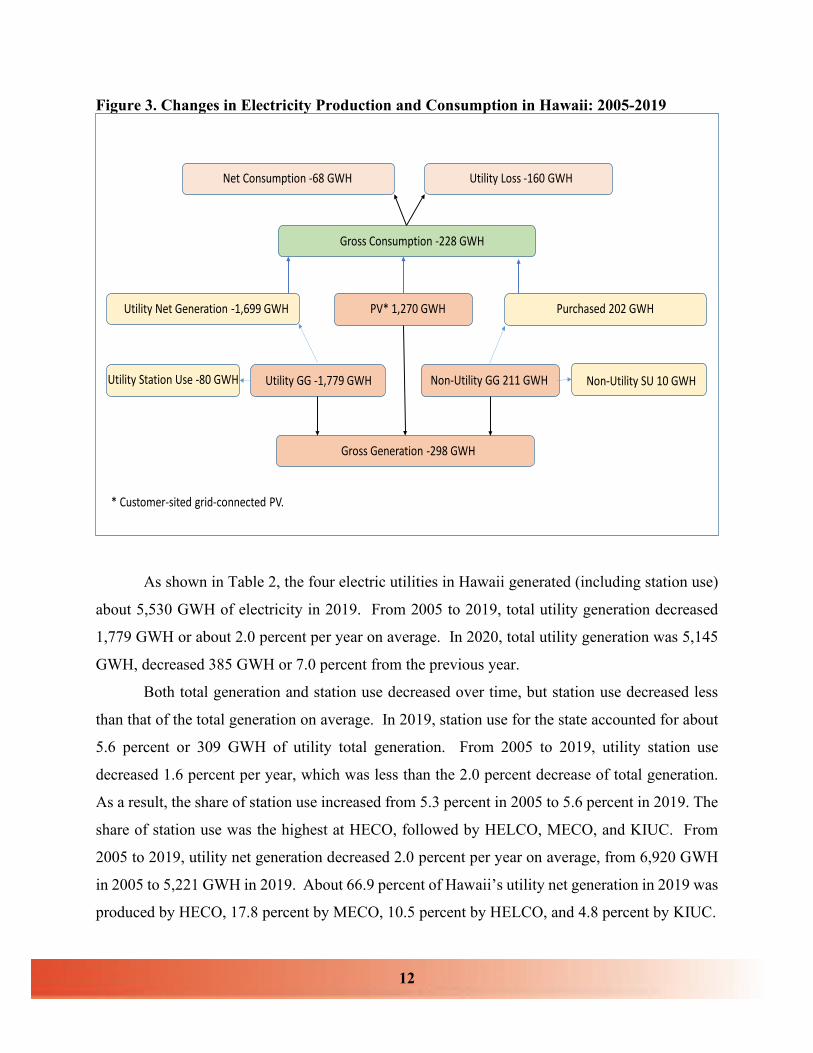
Figure 3 shows the changes in electricity production and consumption from 2005 to 2019.
Over the past 14 years, gross generation in Hawaii decreased by 298 GWH, accounting for about
2.6 percent of gross generation in 2019. Utility gross generation decreased 1,779 GWH, gross
generation of non-utility producers increased 211 GWH, and electricity generated by customers
increased 1,270 GWH.
Since the decrease of utility net generation was more than the increase in purchased
electricity and customer generated electricity, gross consumption decreased 228 GWH. Reduced
utility loss led to a smaller reduction of net consumption. However, since customer generated
electricity increased 1,270 GWH over this period, electricity sold by utilities decreased 1,338
GWH or 14.5 percent of utility sales in 2019.
Utility GG -385 GWH
Purchased -191 GWH
Gross Consumption -342 GWH
Utility Station Use -14 GWH
PV* 220 GWH
Non-Utility SU -10 GWHNon-Utility GG -201 GWH
Net Consumption -445GWH Utility Loss 103 GWH
Utility Net Generation -371 GWH
Gross Generation -366 GWH
* Customer-sited grid-connected PV.
12
Figure 3. Changes in Electricity Production and Consumption in Hawaii: 2005-2019
As shown in Table 2, the four electric utilities in Hawaii generated (including station use)
about 5,530 GWH of electricity in 2019. From 2005 to 2019, total utility generation decreased
1,779 GWH or about 2.0 percent per year on average. In 2020, total utility generation was 5,145
GWH, decreased 385 GWH or 7.0 percent from the previous year.
Both total generation and station use decreased over time, but station use decreased less
than that of the total generation on average. In 2019, station use for the state accounted for about
5.6 percent or 309 GWH of utility total generation. From 2005 to 2019, utility station use
decreased 1.6 percent per year, which was less than the 2.0 percent decrease of total generation.
As a result, the share of station use increased from 5.3 percent in 2005 to 5.6 percent in 2019. The
share of station use was the highest at HECO, followed by HELCO, MECO, and KIUC. From
2005 to 2019, utility net generation decreased 2.0 percent per year on average, from 6,920 GWH
in 2005 to 5,221 GWH in 2019. About 66.9 percent of Hawaii’s utility net generation in 2019 was
produced by HECO, 17.8 percent by MECO, 10.5 percent by HELCO, and 4.8 percent by KIUC.
Utility GG -1,779 GWH
Purchased 202 GWH
Gross Consumption -228 GWH
Utility Station Use -80 GWH
PV* 1,270 GWH
Non-Utility SU 10 GWHNon-Utility GG 211 GWH
Net Consumption -68 GWH Utility Loss -160 GWH
Utility Net Generation -1,699 GWH
Gross Generation -298 GWH
* Customer-sited grid-connected PV.

13
Table 2. Hawaii Electricity Net Generation by Utility
Table 3 shows that electricity purchased by the utilities increased from 4,202 GWH in 2005
to 4,404 GWH in 2019, an increase of 202 GWH. In comparison, net utility generation decreased
1,497 GWH during the same period. In 2020, electricity purchased decreased 191 GWH and net
utility generation decreased 562 GWH over the previous year. Electricity purchased decreased
from 2005 to 2011, increased from 2011 to 2016, and then decreased in 2017 and 2020. Electricity
purchased plus utility net generation is defined as the electricity net to system. The share of
purchased electricity, as a percentage of the total net to system, increased from 37.8 percent in
2005 to 46.5 percent in 2020.
Avg. ann. Growth2005 2014 2015 2016 2017 2018 2019 2020 2005 - 2019
Total utility generationState Total GWh 7,309 5,840 5,799 5,544 5,486 5,588 5,530 5,145 -2.0%HECO GWh 5,021 3,970 3,977 3,714 3,677 3,743 3,726 3,489 -2.1%HELCO GWh 561 573 536 595 550 600 579 649 0.2%MECO GWh 1,279 903 917 927 956 932 971 783 -1.9%KIUC GWh 448 394 369 308 304 313 254 224 -4.0%Utility station useState Total GWh 389 327 317 305 303 318 309 295 -1.6%HECO GWh 300 247 243 229 226 239 232 225 -1.8%HELCO GWh 31 28 24 27 28 29 29 30 -0.4%MECO GWh 45 40 38 39 41 41 41 38 -0.6%KIUC GWh 13 12 12 9 9 9 6 3 -5.3%Utility net generationState Total GWh 6,920 5,513 5,482 5,239 5,183 5,270 5,221 4,850 -2.0%HECO GWh 4,721 3,723 3,734 3,485 3,451 3,504 3,494 3,264 -2.1%HELCO GWh 530 546 512 567 522 570 550 620 0.3%MECO GWh 1,234 863 878 888 915 892 929 745 -2.0%KIUC GWh 435 381 358 299 295 304 248 221 -3.9%Utility share of net generationState Total % 100.0% 100.0% 100.0% 100.0% 100.0% 100.0% 100.0% 100.0%HECO % 68.2% 67.5% 68.1% 66.5% 66.6% 66.5% 66.9% 67.3%HELCO % 7.7% 9.9% 9.3% 10.8% 10.1% 10.8% 10.5% 12.8%MECO % 17.8% 15.7% 16.0% 17.0% 17.7% 16.9% 17.8% 15.4%KIUC % 6.3% 6.9% 6.5% 5.7% 5.7% 5.8% 4.8% 4.5%% of station use of utility generationState Total % 5.3% 5.6% 5.5% 5.5% 5.5% 5.7% 5.6% 5.7%HECO % 6.0% 6.2% 6.1% 6.2% 6.1% 6.4% 6.2% 6.4%HELCO % 5.5% 4.8% 4.4% 4.6% 5.0% 4.9% 5.0% 4.5%MECO % 3.5% 4.4% 4.2% 4.2% 4.3% 4.3% 4.3% 4.8%KIUC % 2.9% 3.1% 3.2% 3.1% 3.0% 3.0% 2.4% 1.5%Source: Hawaii Electric Utility Monthly Financial Reports.

14
Table 3. Hawaii Electricity Sales by Utility
It is important to note that not all the electricity sent to the utility systems was sold to
consumers; some electricity was lost during the process of transmission and distribution. In
Hawaii, about 4.4 percent of the electricity sent to the system was lost in 2019. The percent of
utility loss was highest in the HELCO system (6.5 percent), followed by MECO (4.9 percent),
KIUC (4.8 percent), and HECO (4.0 percent). Total electricity sold is electricity net to system
minus utility lost. From 2005 to 2019, total electricity sold decreased 1.0 percent per year on
average from 10,539 GWH to 9,201 GWH. In 2020, total electricity sold decreased 7.2 percent
from the previous year.
Avg. ann. Growth2005 2014 2015 2016 2017 2018 2019 2020 2005 - 2019
Electricity purchasedState Total GWh 4,202 4,371 4,402 4,508 4,416 4,310 4,404 4,213 0.3%HECO GWh 3,383 3,379 3,352 3,478 3,403 3,304 3,340 3,209 -0.1%HELCO GWh 688 595 631 578 602 568 572 422 -1.3%MECO GWh 97 333 325 292 242 268 256 265 7.2%KIUC GWh 35 65 94 159 169 170 235 317 14.6%Electricity net to systemState Total GWh 11,122 9,884 9,884 9,747 9,599 9,580 9,625 9,063 -1.0%HECO GWh 8,104 7,102 7,086 6,963 6,855 6,808 6,834 6,474 -1.2%HELCO GWh 1,217 1,140 1,143 1,146 1,124 1,138 1,122 1,042 -0.6%MECO GWh 1,331 1,196 1,203 1,181 1,157 1,160 1,185 1,010 -0.8%KIUC GWh 470 446 452 458 464 474 484 537 0.2%Utility lossState Total GWh 584 478 496 463 464 440 424 527 -2.3%HECO GWh 383 320 332 303 306 282 271 290 -2.4%HELCO GWh 101 78 79 78 77 74 73 64 -2.3%MECO GWh 79 64 66 63 62 61 58 51 -2.2%KIUC GWh 21 16 19 19 19 23 23 122 0.7%Total electricity soldState Total GWh 10,539 9,406 9,389 9,284 9,136 9,140 9,201 8,536 -1.0%HECO GWh 7,721 6,782 6,754 6,660 6,549 6,526 6,563 6,183 -1.2%HELCO GWh 1,116 1,063 1,065 1,067 1,047 1,064 1,050 978 -0.4%MECO GWh 1,252 1,132 1,138 1,118 1,095 1,099 1,127 959 -0.7%KIUC GWh 449 430 432 439 445 451 461 415 0.2%Share of purchased of net to systemState Total % 37.8% 44.2% 44.5% 46.3% 46.0% 45.0% 45.8% 46.5%HECO % 41.7% 47.6% 47.3% 50.0% 49.7% 48.5% 48.9% 49.6%HELCO % 56.5% 52.1% 55.2% 50.5% 53.5% 49.9% 51.0% 40.5%MECO % 7.3% 27.8% 27.0% 24.8% 20.9% 23.1% 21.6% 26.2%KIUC % 7.4% 14.5% 20.8% 34.8% 36.5% 35.9% 48.7% 59.0%Share of loss of net to systemState Total % 5.2% 4.8% 5.0% 4.7% 4.8% 4.6% 4.4% 5.8%HECO % 4.7% 4.5% 4.7% 4.3% 4.5% 4.1% 4.0% 4.5%HELCO % 8.3% 6.8% 6.9% 6.8% 6.8% 6.5% 6.5% 6.1%MECO % 5.9% 5.4% 5.5% 5.3% 5.4% 5.2% 4.9% 5.1%KIUC % 4.5% 3.6% 4.3% 4.1% 4.0% 4.8% 4.8% 22.7%Source: Hawaii Electric Utility Monthly Financial Reports.

15
Table 4 shows that utility station use and loss decreased from 972 GWH in 2005 to 733
GWH in 2019, a decrease of 2.0 percent per year on average. The share of utility station usage
and loss as a percentage of total utility generation and purchased electricity decreased from 8.4
percent in 2005 to 7.4 percent in 2019.
Table 4. Share of Utility Station Usage and Loss of Total Electricity Production
Data for the station use of non-utility producers is not available. If we assume that the
station use’s share of the non-utility producers as a percentage of purchased electricity is similar
to that of the utility station use share of net generation, the share of total station use and loss in
gross generation would be about 9.7 percent for 2019.
Avg. ann. Growth2005 2014 2015 2016 2017 2018 2019 2020 2005 - 2019
Total utility generation and purchased 1/State Total GWh 11,511 10,211 10,201 10,052 9,902 9,897 9,934 9,358 -1.0%HECO GWh 8,404 7,349 7,328.963 7,192.29 7,080 7,046 7,066 6,698 -1.2%HELCO GWh 1,248 1,168 1,166.894 1,173.05 1,151 1,167 1,151 1,072 -0.6%MECO GWh 1,376 1,236 1,241.660 1,219.87 1,198 1,200 1,227 1,048 -0.8%KIUC GWh 482 458 463.469 467.25 473 483 490 541 0.1%Station use and lossState Total GWh 972 805 812 768 767 758 733 823 -2.0%HECO GWh 683 568 575 532 532 521 503 515 -2.2%HELCO GWh 132 105 102 106 104 103 102 93 -1.8%MECO GWh 124 104 104 102 103 101 100 89 -1.6%KIUC GWh 34 28 31 28 28 32 29 126 -1.1%% of station use and lossState Total % 8.4% 7.9% 8.0% 7.6% 7.7% 7.7% 7.4% 8.8%HECO % 8.1% 7.7% 7.8% 7.4% 7.5% 7.4% 7.1% 7.7%HELCO % 10.5% 9.0% 8.8% 9.0% 9.1% 8.9% 8.8% 8.7%MECO % 9.0% 8.4% 8.4% 8.4% 8.6% 8.4% 8.1% 8.5%KIUC % 7.0% 6.2% 6.8% 6.0% 5.9% 6.7% 5.9% 23.2%1/ Excluding station use of non-utility producers.Source: Hawaii Electric Utility Monthly Financial Reports.

16
Hawaii’s gross electricity generation of utility and non-utility electricity producers in 2019
was estimated to be about 10,188 GWH. In 2019, about 71.4 percent of the gross generation of
electricity producers was produced by the HECO system (including both utility and non-utility
producers). HELCO accounted for about 11.6 percent of gross generation, MECO about 12.1
percent, and KIUC about 4.9 percent. From 2005 to 2019, each respective counties’ share of gross
generation remained stable.
Table 5. Share of Total Station Usage and Loss of Total Electricity Production
Avg. ann. Growth2005 2014 2015 2016 2017 2018 2019 2020 2005 - 2019
Station use of non-utilityState Total GWh 244 256 249 258 254 255 254 243 0.3%HECO GWh 202 211 205 215 209 211 208 207 0.2%HELCO GWh 38 29 28 27 30 28 29 19 -1.9%MECO GWh 3 15 14 12 10 12 11 13 8.7%KIUC GWh 1 2 3 5 5 5 6 5 13.1%Total gross generation 1/State Total GWh 11,755 10,467 10,450 10,311 10,157 10,152 10,188 9,601 -1.0%HECO GWh 8,606 7,560 7,534 7,407 7,289 7,257 7,274 6,905 -1.2%HELCO GWh 1,286 1,197 1,195 1,200 1,182 1,195 1,180 1,091 -0.6%MECO GWh 1,379 1,251 1,255 1,232 1,208 1,212 1,238 1,061 -0.8%KIUC GWh 484 460 466 472 478 488 495 546 0.2%Share of gross generationState Total % 100.0% 100.0% 100.0% 100.0% 100.0% 100.0% 100.0% 100.0%HECO % 73.2% 72.2% 72.1% 71.8% 71.8% 71.5% 71.4% 71.9%HELCO % 10.9% 11.4% 11.4% 11.6% 11.6% 11.8% 11.6% 11.4%MECO % 11.7% 11.9% 12.0% 12.0% 11.9% 11.9% 12.1% 11.0%KIUC % 4.1% 4.4% 4.5% 4.6% 4.7% 4.8% 4.9% 5.7%Total station use and lossState Total GWh 1,217 1,061 1,061 1,027 1,021 1,013 987 1,066 -1.5%HECO GWh 885 778 780 747 741 731 711 721 -1.5%HELCO GWh 169 134 130 132 135 131 130 112 -1.8%MECO GWh 127 119 118 114 114 113 110 102 -1.0%KIUC GWh 35 30 34 33 33 37 35 130 0.0%% of station use and lossState Total % 10.3% 10.1% 10.2% 10.0% 10.1% 10.0% 9.7% 11.1%HECO % 10.3% 10.3% 10.3% 10.1% 10.2% 10.1% 9.8% 10.4%HELCO % 13.2% 11.2% 10.9% 11.0% 11.4% 11.0% 11.1% 10.3%MECO % 9.2% 9.5% 9.4% 9.3% 9.4% 9.3% 8.9% 9.6%KIUC % 7.2% 6.6% 7.4% 7.0% 6.8% 7.6% 7.0% 23.9%1/ Including station use of non-utility producers. Estimated by DBEDTSource: Hawaii Electric Utility Monthly Financial Reports.
17
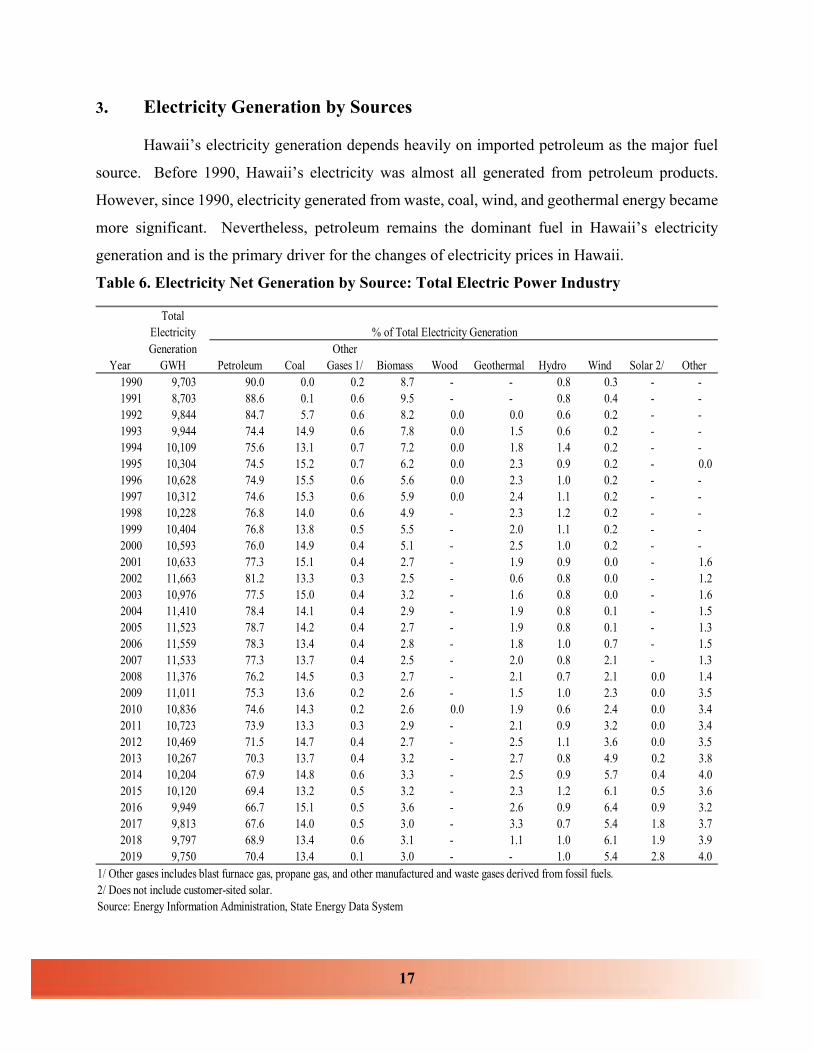
3. Electricity Generation by Sources
Hawaii’s electricity generation depends heavily on imported petroleum as the major fuel
source. Before 1990, Hawaii’s electricity was almost all generated from petroleum products.
However, since 1990, electricity generated from waste, coal, wind, and geothermal energy became
more significant. Nevertheless, petroleum remains the dominant fuel in Hawaii’s electricity
generation and is the primary driver for the changes of electricity prices in Hawaii.
Table 6. Electricity Net Generation by Source: Total Electric Power Industry
TotalElectricity % of Total Electricity GenerationGeneration Other
Year GWH Petroleum Coal Gases 1/ Biomass Wood Geothermal Hydro Wind Solar 2/ Other1990 9,703 90.0 0.0 0.2 8.7 - - 0.8 0.3 - - 1991 8,703 88.6 0.1 0.6 9.5 - - 0.8 0.4 - - 1992 9,844 84.7 5.7 0.6 8.2 0.0 0.0 0.6 0.2 - - 1993 9,944 74.4 14.9 0.6 7.8 0.0 1.5 0.6 0.2 - - 1994 10,109 75.6 13.1 0.7 7.2 0.0 1.8 1.4 0.2 - - 1995 10,304 74.5 15.2 0.7 6.2 0.0 2.3 0.9 0.2 - 0.0 1996 10,628 74.9 15.5 0.6 5.6 0.0 2.3 1.0 0.2 - - 1997 10,312 74.6 15.3 0.6 5.9 0.0 2.4 1.1 0.2 - - 1998 10,228 76.8 14.0 0.6 4.9 - 2.3 1.2 0.2 - - 1999 10,404 76.8 13.8 0.5 5.5 - 2.0 1.1 0.2 - - 2000 10,593 76.0 14.9 0.4 5.1 - 2.5 1.0 0.2 - - 2001 10,633 77.3 15.1 0.4 2.7 - 1.9 0.9 0.0 - 1.6 2002 11,663 81.2 13.3 0.3 2.5 - 0.6 0.8 0.0 - 1.2 2003 10,976 77.5 15.0 0.4 3.2 - 1.6 0.8 0.0 - 1.6 2004 11,410 78.4 14.1 0.4 2.9 - 1.9 0.8 0.1 - 1.5 2005 11,523 78.7 14.2 0.4 2.7 - 1.9 0.8 0.1 - 1.3 2006 11,559 78.3 13.4 0.4 2.8 - 1.8 1.0 0.7 - 1.5 2007 11,533 77.3 13.7 0.4 2.5 - 2.0 0.8 2.1 - 1.3 2008 11,376 76.2 14.5 0.3 2.7 - 2.1 0.7 2.1 0.0 1.4 2009 11,011 75.3 13.6 0.2 2.6 - 1.5 1.0 2.3 0.0 3.5 2010 10,836 74.6 14.3 0.2 2.6 0.0 1.9 0.6 2.4 0.0 3.4 2011 10,723 73.9 13.3 0.3 2.9 - 2.1 0.9 3.2 0.0 3.4 2012 10,469 71.5 14.7 0.4 2.7 - 2.5 1.1 3.6 0.0 3.5 2013 10,267 70.3 13.7 0.4 3.2 - 2.7 0.8 4.9 0.2 3.8 2014 10,204 67.9 14.8 0.6 3.3 - 2.5 0.9 5.7 0.4 4.0 2015 10,120 69.4 13.2 0.5 3.2 - 2.3 1.2 6.1 0.5 3.6 2016 9,949 66.7 15.1 0.5 3.6 - 2.6 0.9 6.4 0.9 3.2 2017 9,813 67.6 14.0 0.5 3.0 - 3.3 0.7 5.4 1.8 3.7 2018 9,797 68.9 13.4 0.6 3.1 - 1.1 1.0 6.1 1.9 3.9 2019 9,750 70.4 13.4 0.1 3.0 - - 1.0 5.4 2.8 4.0
1/ Other gases includes blast furnace gas, propane gas, and other manufactured and waste gases derived from fossil fuels.2/ Does not include customer-sited solar.Source: Energy Information Administration, State Energy Data System

18
From 1990 to 2019, the share of petroleum generated electricity in Hawaii (including both
utility and non-utility producers) decreased from 90.0 percent to 70.4 percent; the share of coal
generated electricity increased from 0.0 percent to 13.4 percent; the share of wind generated
electricity increased from 0.3 percent to 5.4 percent; and the share of biomass decreased from 8.7
percent to 3.0 percent (Table 6). In 2019, total renewable electricity (excluding customer-sited
solar) accounted for about 16.2 percent of net electricity generation.
Most of the non-petroleum generated electricity was produced by non-utility producers.
As shown in Table 7, almost all electricity generated from the utilities was from petroleum fuel.
From 1990 to 2019, the petroleum generated electricity share of net utility generated electricity
decreased only slightly from 99.6 percent to 94.7 percent. In 2019, only about 5.3 percent of
electricity generated by the utilities was from renewable sources. Due to increased generation of
non-utility producers and decreased generation of utilities, over the same period, the share of utility
petroleum generated electricity of total petroleum generated electricity decreased from 91.2
percent to 72.4 percent.
Non-utility producers depend more on non-petroleum sources of energy to generate
electricity, especially coal and wind. As shown in Table 8, from 1990 to 2019, the petroleum
generated electricity share of non-utility generated electricity decreased from 45.0 percent to 42.1
percent; the share of coal generated electricity increased from 0.1 percent to 28.9 percent; the share
of wind generated electricity increased from 1.7 percent to 11.8 percent; the share of solar
generated electricity increased from 0.0 percent to 5.1 percent; and the share of biomass decreased
from 48.9 percent to 5.2 percent.
The increased share of non-petroleum generated electricity, especially coal-fired
electricity, kept the growth rate of purchased electricity costs low.

19
Table 7. Electricity Net Generation by Source: Electric Utilities
TotalElectricity % of Total Electricity GenerationGeneration Other
Year GWH Petroleum Coal Gases 1/ Biomass Wood Geothermal Hydro Wind Solar 2/ Other1990 7,996 99.6 - - 0.1 - - 0.3 - - - 1991 7,333 99.7 - - - - - 0.3 - - - 1992 6,861 99.9 - - - - - 0.1 - - - 1993 6,084 99.8 - - - - - 0.2 - - - 1994 6,055 99.7 - - - - - 0.3 - - - 1995 6,191 99.7 - - - - - 0.3 - - - 1996 6,420 99.7 - - - - - 0.3 - - - 1997 6,213 99.7 - - - - - 0.3 - - - 1998 6,301 99.8 - - - - - 0.2 0.00 - - 1999 6,452 99.6 - - - - - 0.3 0.06 - - 2000 6,535 99.7 - - - - - 0.2 0.04 - - 2001 6,383 99.7 - - - - - 0.3 0.03 - - 2002 7,513 99.9 - - - - - 0.1 0.02 - - 2003 6,493 99.9 - - - - - 0.0 0.02 - - 2004 6,982 99.8 - - - - - 0.1 0.02 - - 2005 6,915 99.8 - - - - - 0.1 0.02 - - 2006 7,040 99.7 - - - - - 0.3 0.01 - - 2007 6,928 99.8 - - - - - 0.2 0.01 - - 2008 6,701 99.7 - - - - - 0.3 0.00 - - 2009 6,510 96.2 - - 0.1 - - 0.4 0.00 - 3.3 2010 6,416 96.3 - - 0.0 - - 0.3 - - 3.4 2011 6,376 95.8 - - 0.6 - - 0.3 - - 3.3 2012 6,013 95.6 - - 0.4 - - 0.5 - - 3.6 2013 5,748 95.6 - - 0.5 - - 0.3 - - 3.6 2014 5,517 94.9 - - 0.7 - - 0.4 - 0.2 3.8 2015 5,492 94.9 - - 1.0 - - 0.4 - 0.5 3.3 2016 5,218 96.0 - - 0.7 - - 0.3 - 0.8 2.2 2017 5,223 94.5 - - 1.1 - - 0.2 - 0.8 3.4 2018 5,296 94.3 - - 1.0 - - 0.4 - 0.7 3.6 2019 5,252 94.7 - - 1.1 - - 0.2 - 0.8 3.3
1/ Other gases includes blast furnace gas, propane gas, and other manufactured and waste gases derived from fossil fuels.2/ Does not include customer-sited solar.Source: Energy Information Administration, State Energy Data System

20
Table 8. Electricity Net Generation by Source: IPP & CHP
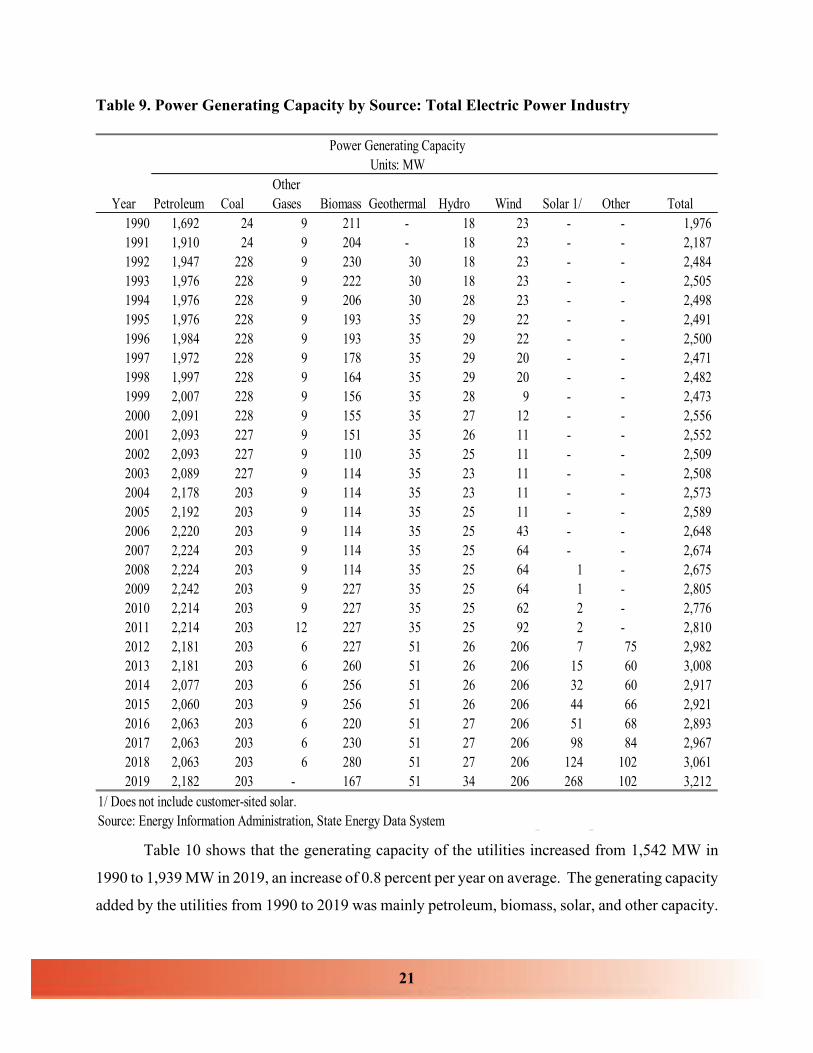
Based on the most recent data available from EIA, the generating capacity for Hawaii’s
total electric power industry increased from 1,976 MW in 1990 to 3,212 MW in 2019, an increase
of 1.7 percent per year on average. Coal-fired capacity increased from 24 MW to 203 MW or 7.7
percent per year over the period, solar capacity increased from 0 MW to 268 MW, wind capacity
increased from 23 MW to 206 MW or 7.8 percent per year on average, petroleum generation
capacity increased from 1,692 MW to 2,182 MW or an average of 0.9 percent, and biomass
capacity decreased from 211 MW to 167 MW or a 0.8 percent average per year (Table 9).
TotalElectricityGeneration Other
Year GWH Petroleum Coal Gases 1/ Biomass Wood Geothermal Hydro Wind Solar 2/ Other1990 1,707 45.0 0.1 0.9 48.9 - - 3.3 1.7 - - 1991 1,370 29.3 0.6 3.8 60.1 - - 3.7 2.6 - - 1992 2,983 49.7 18.7 2.1 27.0 0.0 0.1 1.7 0.8 - - 1993 3,860 34.3 38.3 1.6 20.1 0.0 3.9 1.1 0.6 - - 1994 4,054 39.6 32.7 1.6 18.0 0.0 4.6 3.0 0.5 - - 1995 4,113 36.6 38.0 1.7 15.5 0.0 5.7 2.0 0.5 - 0.1 1996 4,208 37.1 39.0 1.4 14.1 0.0 5.8 2.0 0.5 - - 1997 4,100 36.5 38.4 1.6 14.8 0.0 6.0 2.4 0.4 - - 1998 3,927 39.8 36.5 1.5 12.8 - 6.0 2.7 0.5 - - 1999 3,952 39.6 36.4 1.3 14.6 - 5.3 2.4 0.3 - - 2000 4,059 37.8 38.9 1.0 13.3 - 6.5 2.2 0.4 - - 2001 4,250 43.8 37.8 0.9 6.8 - 4.9 1.9 0.0 - 4.0 2002 4,150 47.3 37.2 1.0 7.1 - 1.8 2.1 0.0 - 3.5 2003 4,483 44.9 36.7 0.9 7.7 - 4.0 2.0 0.0 - 3.8 2004 4,428 44.6 36.2 1.1 7.4 - 4.8 1.9 0.1 - 3.9 2005 4,608 47.0 35.4 0.9 6.7 - 4.8 1.9 0.1 - 3.2 2006 4,519 45.1 34.3 0.9 7.2 - 4.7 2.1 1.7 - 3.9 2007 4,605 43.5 34.3 1.0 6.2 - 5.0 1.7 5.2 - 3.2 2008 4,676 42.5 35.2 0.8 6.5 - 5.0 1.4 5.1 0.0 3.4 2009 4,501 45.0 33.3 0.5 6.2 - 3.7 1.9 5.6 0.0 3.7 2010 4,420 43.2 35.0 0.5 6.4 0.0 4.5 1.2 5.9 0.0 3.3 2011 4,347 41.8 32.8 0.8 6.3 - 5.2 1.7 7.8 0.1 3.6 2012 4,457 39.0 34.5 1.1 5.8 - 5.9 1.9 8.5 0.1 3.3 2013 4,519 38.2 31.1 0.9 6.7 - 6.1 1.3 11.1 0.4 4.2 2014 4,687 36.1 32.2 1.3 6.3 - 5.4 1.5 12.3 0.6 4.1 2015 4,627 39.1 28.9 1.1 5.8 - 5.0 2.1 13.2 0.6 4.1 2016 4,731 34.5 31.7 1.1 6.8 - 5.5 1.6 13.5 0.9 4.4 2017 4,590 37.0 30.0 1.1 5.2 - 7.0 1.2 11.6 2.9 4.0 2018 4,501 39.0 29.1 1.2 5.6 - 2.4 1.7 13.4 3.3 4.3 2019 4,498 42.1 28.9 0.1 5.2 - - 1.8 11.8 5.1 5.0
1/ Other gases includes blast furnace gas, propane gas, and other manufactured and waste gases derived from fossil fuels.2/ Does not include customer-sited solar.Source: Energy Information Administration, State Energy Data System
% of Total Electricity Generation
21
Table 9. Power Generating Capacity by Source: Total Electric Power Industry
Table 10 shows that the generating capacity of the utilities increased from 1,542 MW in
1990 to 1,939 MW in 2019, an increase of 0.8 percent per year on average. The generating capacity
added by the utilities from 1990 to 2019 was mainly petroleum, biomass, solar, and other capacity.
Power Generating CapacityUnits: MW
OtherYear Petroleum Coal Gases Biomass Geothermal Hydro Wind Solar 1/ Other Total
1990 1,692 24 9 211 - 18 23 - - 1,976 1991 1,910 24 9 204 - 18 23 - - 2,187 1992 1,947 228 9 230 30 18 23 - - 2,484 1993 1,976 228 9 222 30 18 23 - - 2,505 1994 1,976 228 9 206 30 28 23 - - 2,498 1995 1,976 228 9 193 35 29 22 - - 2,491 1996 1,984 228 9 193 35 29 22 - - 2,500 1997 1,972 228 9 178 35 29 20 - - 2,471 1998 1,997 228 9 164 35 29 20 - - 2,482 1999 2,007 228 9 156 35 28 9 - - 2,473 2000 2,091 228 9 155 35 27 12 - - 2,556 2001 2,093 227 9 151 35 26 11 - - 2,552 2002 2,093 227 9 110 35 25 11 - - 2,509 2003 2,089 227 9 114 35 23 11 - - 2,508 2004 2,178 203 9 114 35 23 11 - - 2,573 2005 2,192 203 9 114 35 25 11 - - 2,589 2006 2,220 203 9 114 35 25 43 - - 2,648 2007 2,224 203 9 114 35 25 64 - - 2,674 2008 2,224 203 9 114 35 25 64 1 - 2,675 2009 2,242 203 9 227 35 25 64 1 - 2,805 2010 2,214 203 9 227 35 25 62 2 - 2,776 2011 2,214 203 12 227 35 25 92 2 - 2,810 2012 2,181 203 6 227 51 26 206 7 75 2,982 2013 2,181 203 6 260 51 26 206 15 60 3,008 2014 2,077 203 6 256 51 26 206 32 60 2,917 2015 2,060 203 9 256 51 26 206 44 66 2,921 2016 2,063 203 6 220 51 27 206 51 68 2,893 2017 2,063 203 6 230 51 27 206 98 84 2,967 2018 2,063 203 6 280 51 27 206 124 102 3,061 2019 2,182 203 - 167 51 34 206 268 102 3,212
1/ Does not include customer-sited solar.Source: Energy Information Administration, State Energy Data System

22
Table 10. Power Generating Capacity by Source: Electric Utilities
Table 11 shows that the generating capacity of the non-utility producers in Hawaii
increased from 435 MW in 1990 to 1,274 MW in 2019, an increase of 3.8 percent per year on
average. The growth rate of wind capacity was the highest during this period at 7.8 percent on
average per year. Wind was followed by coal-fired capacity at 7.0 percent per year and petroleum
capacity at 3.3 percent per year. Geothermal capacity increased from zero to 51 MW, but the
biomass capacity decreased from 211 MW to 107 MW over the period. The figures do not include
electricity generation from the customer-sited solar systems.
Power Generating CapacityUnits: MW
OtherYear Petroleum Coal Gases Biomass Geothermal Hydro Wind Solar 1/ Other Total
1990 1,538 - - - - 3 - - - 1,542 1991 1,574 - - - - 3 - - - 1,577 1992 1,617 - - - - 3 - - - 1,621 1993 1,655 - - - - 3 - - - 1,659 1994 1,655 - - - - 3 - - - 1,659 1995 1,655 - - - - 3 - - - 1,659 1996 1,664 - - - - 3 - - - 1,667 1997 1,652 - - - - 3 - - - 1,655 1998 1,677 - - - - 3 - - - 1,680 1999 1,687 - - - - 3 - - - 1,690 2000 1,705 - - - - 3 2 - - 1,711 2001 1,703 - - - - 3 2 - - 1,708 2002 1,702 - - - - 2 2 - - 1,706 2003 1,702 - - - - 2 2 - - 1,706 2004 1,791 - - - - 2 2 - - 1,795 2005 1,806 - - - - 4 2 - - 1,812 2006 1,833 - - - - 4 2 - - 1,840 2007 1,838 - - - - 4 2 - - 1,845 2008 1,838 - - - - 4 2 - - 1,845 2009 1,856 - - 113 - 4 2 - - 1,976 2010 1,827 - - 113 - 4 - - - 1,945 2011 1,827 - - 113 - 4 - - - 1,945 2012 1,788 - - 113 - 4 - - 39 1,945 2013 1,788 - - 113 - 4 - - 39 1,945 2014 1,684 - - 113 - 4 - 12 39 1,852 2015 1,669 - - 113 - 4 - 24 45 1,855 2016 1,669 - - 113 - 4 - 24 47 1,857 2017 1,669 - - 123 - 4 - 24 50 1,870 2018 1,669 - - 173 - 4 - 24 48 1,919 2019 1,782 - - 60 - 4 - 44 48 1,939
1/ Does not include customer-sited solar.Source: Energy Information Administration, State Energy Data System

23
Table 11. Power Generating Capacity by Source: IPP and CHP
The detailed power generating capacity by county in 2020 (2019 for Kauai) is provided in
Table 12. Currently, the state of Hawaii has about 2,397.9 MW firm capacity (guaranteed available
at a given time); 1,794.5 MW in Honolulu, 213.3 MW in Hawaii County, 273.1 MW in Maui
County, and 117.0 MW in Kauai County. About 87.2 percent of the firm capacity use petroleum,
7.5 percent use coal, and 5.3 percent use biofuel or waste.
Power Generating CapacityUnits: MW
OtherYear Petroleum Coal Gases Biomass Geothermal Hydro Wind Solar 1/ Other Total
1990 154 24 9 211 - 15 23 - - 435 1991 337 24 9 204 - 15 23 - - 610 1992 329 228 9 230 30 15 23 - - 863 1993 320 228 9 222 30 15 23 - - 846 1994 320 228 9 206 30 24 23 - - 839 1995 320 228 9 193 35 26 22 - - 832 1996 320 228 9 193 35 26 22 - - 833 1997 320 228 9 178 35 26 20 - - 816 1998 320 228 9 164 35 26 20 - - 802 1999 320 228 9 156 35 25 9 - - 782 2000 386 228 9 155 35 24 10 - - 845 2001 390 227 9 151 35 23 9 - - 844 2002 391 227 9 110 35 23 9 - - 803 2003 387 227 9 114 35 21 9 - - 802 2004 387 203 9 114 35 21 9 - - 778 2005 386 203 9 114 35 21 9 - - 777 2006 387 203 9 114 35 21 41 - - 808 2007 386 203 9 114 35 21 62 - - 829 2008 386 203 9 114 35 21 62 1 - 830 2009 386 203 9 114 35 21 62 1 - 829 2010 387 203 9 114 35 21 62 2 - 831 2011 386 203 12 114 35 21 92 2 - 865 2012 393 203 6 114 51 22 206 7 36 1,037 2013 393 203 6 147 51 22 206 15 21 1,064 2014 393 203 6 143 51 22 206 20 21 1,065 2015 391 203 9 143 51 22 206 20 21 1,066 2016 394 203 6 107 51 23 206 27 21 1,037 2017 394 203 6 107 51 23 206 74 34 1,097 2018 394 203 6 107 51 23 206 100 54 1,143 2019 400 203 - 107 51 30 206 224 54 1,274
1/ Does not include customer-sited solar.Source: Energy Information Administration, State Energy Data System

24
The state also installed about 553.9 MW non-firm capacity, mostly by non-utility
producers; 339.3 MW in Honolulu, 47.6 MW in Hawaii County, 79.0 MW in Maui County, and
87.6 MW in Kauai County. Solar accounted for about 46.9 percent of the non-firm capacity;
followed by wind at 40.8 percent, hydro at 5.9 percent, and petroleum at 5.1 percent. In addition,
about 772.4 MW customer-sited solar was installed in Hawaii; 513.0 MW in Honolulu, 107.0 MW
in Hawaii County, 120.2 MW in Maui County, and 32.2 MW in Kauai County.
Table 12. Power Generating Capacity by Source in 2020
Other BiofuelPetroleum Coal Gases Waste Geothermal Hydro Wind Solar Total
State Total MW With Customer-Sited Solar 2,119.5 180.0 - 133.2 - 32.9 226.0 1,032.2 3,723.8 State Total MW W/O Customer-Sited Solar 2,119.5 180.0 - 133.2 - 32.9 226.0 259.8 2,951.4 State Total Firm MW 2,091.4 180.0 - 126.5 - - - - 2,397.9 State Total Non-Firm MW 28.1 - - 6.7 - 32.9 226.0 259.8 553.5 State Total Customer-Sited Solar 772.4 772.4 State Total MW W/O Customer-Sited Solar 2,119.5 180.0 - 133.2 - 32.9 226.0 259.8 2,951.4 Honolulu 1,516.1 180.0 - 126.5 - - 123.0 188.2 2,133.8 Hawaii 213.3 - - - - 16.6 31.0 - 260.9 Maui 273.1 - - - - - 72.0 7.0 352.1 Kauai 1/ 117.0 - - 6.7 - 16.3 - 64.6 204.6 State Total Firm MW 2,091.4 180.0 - 126.5 - - - - 2,397.9 Honolulu 1,488.0 180.0 - 126.5 - - - - 1,794.5 Hawaii 213.3 - - - - - - - 213.3 Maui 273.1 - - - - - - - 273.1 Kauai 117.0 - - - - - - - 117.0 State Total Non-Firm MW 28.1 - - 6.7 - 32.9 226.0 259.8 553.5 Honolulu 28.1 - - - - - 123.0 188.2 339.3 Hawaii - - - - - 16.6 31.0 - 47.6 Maui - - - - - - 72.0 7.0 79.0 Kauai - - - 6.7 - 16.3 - 64.6 87.6 State Total Customer-Sited Solar - - - - - - - 772.4 772.4 Honolulu - - - - - - - 513.0 513.0 Hawaii - - - - - - - 107.0 107.0 Maui - - - - - - - 120.2 120.2 Kauai - - - - - - - 32.2 32.2 Source: Power Facts provided by HECO and KIUC.1/ Kauai capacity from Annual Report 2019.
25
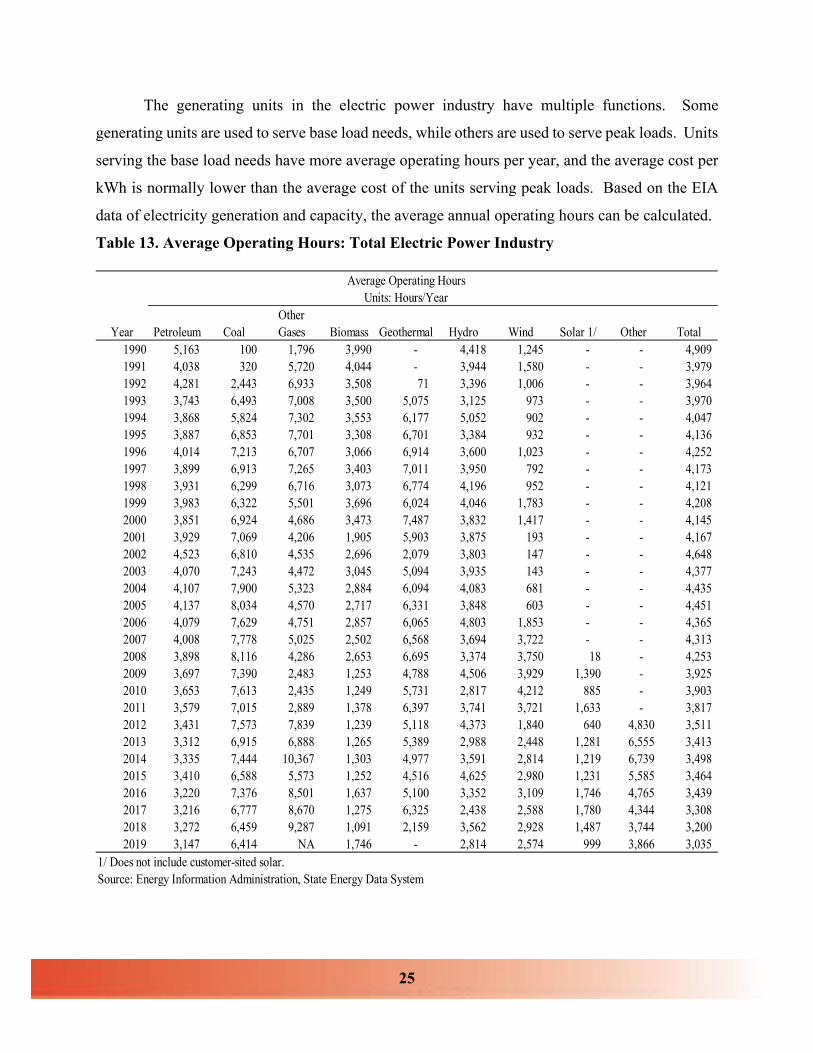
The generating units in the electric power industry have multiple functions. Some
generating units are used to serve base load needs, while others are used to serve peak loads. Units
serving the base load needs have more average operating hours per year, and the average cost per
kWh is normally lower than the average cost of the units serving peak loads. Based on the EIA
data of electricity generation and capacity, the average annual operating hours can be calculated.
Table 13. Average Operating Hours: Total Electric Power Industry
Average Operating HoursUnits: Hours/Year
OtherYear Petroleum Coal Gases Biomass Geothermal Hydro Wind Solar 1/ Other Total
1990 5,163 100 1,796 3,990 - 4,418 1,245 - - 4,909 1991 4,038 320 5,720 4,044 - 3,944 1,580 - - 3,979 1992 4,281 2,443 6,933 3,508 71 3,396 1,006 - - 3,964 1993 3,743 6,493 7,008 3,500 5,075 3,125 973 - - 3,970 1994 3,868 5,824 7,302 3,553 6,177 5,052 902 - - 4,047 1995 3,887 6,853 7,701 3,308 6,701 3,384 932 - - 4,136 1996 4,014 7,213 6,707 3,066 6,914 3,600 1,023 - - 4,252 1997 3,899 6,913 7,265 3,403 7,011 3,950 792 - - 4,173 1998 3,931 6,299 6,716 3,073 6,774 4,196 952 - - 4,121 1999 3,983 6,322 5,501 3,696 6,024 4,046 1,783 - - 4,208 2000 3,851 6,924 4,686 3,473 7,487 3,832 1,417 - - 4,145 2001 3,929 7,069 4,206 1,905 5,903 3,875 193 - - 4,167 2002 4,523 6,810 4,535 2,696 2,079 3,803 147 - - 4,648 2003 4,070 7,243 4,472 3,045 5,094 3,935 143 - - 4,377 2004 4,107 7,900 5,323 2,884 6,094 4,083 681 - - 4,435 2005 4,137 8,034 4,570 2,717 6,331 3,848 603 - - 4,451 2006 4,079 7,629 4,751 2,857 6,065 4,803 1,853 - - 4,365 2007 4,008 7,778 5,025 2,502 6,568 3,694 3,722 - - 4,313 2008 3,898 8,116 4,286 2,653 6,695 3,374 3,750 18 - 4,253 2009 3,697 7,390 2,483 1,253 4,788 4,506 3,929 1,390 - 3,925 2010 3,653 7,613 2,435 1,249 5,731 2,817 4,212 885 - 3,903 2011 3,579 7,015 2,889 1,378 6,397 3,741 3,721 1,633 - 3,817 2012 3,431 7,573 7,839 1,239 5,118 4,373 1,840 640 4,830 3,511 2013 3,312 6,915 6,888 1,265 5,389 2,988 2,448 1,281 6,555 3,413 2014 3,335 7,444 10,367 1,303 4,977 3,591 2,814 1,219 6,739 3,498 2015 3,410 6,588 5,573 1,252 4,516 4,625 2,980 1,231 5,585 3,464 2016 3,220 7,376 8,501 1,637 5,100 3,352 3,109 1,746 4,765 3,439 2017 3,216 6,777 8,670 1,275 6,325 2,438 2,588 1,780 4,344 3,308 2018 3,272 6,459 9,287 1,091 2,159 3,562 2,928 1,487 3,744 3,200 2019 3,147 6,414 NA 1,746 - 2,814 2,574 999 3,866 3,035
1/ Does not include customer-sited solar.Source: Energy Information Administration, State Energy Data System

26
As shown in Table 13, in 2019, for the total electric power industry, coal-fired units had
the highest average annual operating hours, followed by other units, and hydro units. Petroleum
units have average annual operating hours of 3,147 hours, similar to the average annual operating
hours of all units at 3,035 hours. Biomass units have relatively low average operating hours
because the biodiesel units at HECO are used to serve peak loads. The low average operating
hours of solar units is due to the lower daily solar generating window.
Table 14. Average Operating Hours: Electric Utilities
Average Operating HoursUnits: Hours/Year
OtherYear Petroleum Coal Gases Biomass Geothermal Hydro Wind Solar 1/ Other Total
1990 5,180 - - - - 6,789 - - - 5,187 1991 4,647 - - - - 6,090 - - - 4,650 1992 4,236 - - - - 2,932 - - - 4,233 1993 3,667 - - - - 4,105 - - - 3,668 1994 3,646 - - - - 5,613 - - - 3,650 1995 3,730 - - - - 4,763 - - - 3,732 1996 3,848 - - - - 5,333 - - - 3,851 1997 3,749 - - - - 5,609 - - - 3,753 1998 3,749 - - - - 4,104 - - - 3,750 1999 3,811 - - - - 5,625 - - - 3,817 2000 3,822 - - - - 5,038 1,325 - - 3,819 2001 3,736 - - - - 6,044 1,055 - - 3,737 2002 4,408 - - - - 4,267 803 - - 4,404 2003 3,813 - - - - 1,039 781 - - 3,806 2004 3,892 - - - - 4,862 743 - - 3,890 2005 3,823 - - - - 2,292 849 - - 3,816 2006 3,828 - - - - 5,914 420 - - 3,826 2007 3,761 - - - - 3,682 219 - - 3,755 2008 3,636 - - - - 4,468 86 - - 3,632 2009 3,374 - - 29 - 7,152 43 - - 3,294 2010 3,382 - - 14 - 4,180 - - - 3,299 2011 3,342 - - 343 - 4,878 - - - 3,279 2012 3,213 - - 191 - 7,059 - - 5,519 3,092 2013 3,073 - - 252 - 4,625 - - 5,254 2,956 2014 3,110 - - 324 - 5,742 - 868 5,389 2,979 2015 3,124 - - 464 - 5,301 - 1,039 3,982 2,961 2016 3,000 - - 332 - 4,108 - 1,820 2,423 2,811 2017 2,957 - - 446 - 2,387 - 1,806 3,632 2,793 2018 2,993 - - 307 - 4,790 - 1,573 3,948 2,761 2019 2,790 - - 941 - 2,797 - 915 3,556 2,709
1/ Does not include customer-sited solar.Source: Energy Information Administration, State Energy Data System

27
Table 14 and Table 15 compare the average operating hours of utility generating units and
non-utility generating units. For all generating units, the average operating hours of utility-based
units decreased from 5,187 hours per year in 1990 to 2,709 hours per year in 2019, a decrease of
2.2 percent per year on average. In contrast, the average operating hours of non-utility units
decreased from 3,925 hours per year in 1990 to 3,532 hours per year in 2019, a decrease of 0.4
percent per year on average.
Table 15. Average Operating Hours: IPP and CHP
Average Operating HoursUnits: Hours/Year
OtherYear Petroleum Coal Gases Biomass Geothermal Hydro Wind Solar 1/ Other Total
1990 5,000 100 1,796 3,962 - 3,875 1,245 - - 3,925 1991 1,193 320 5,720 4,044 - 3,453 1,580 - - 2,245 1992 4,503 2,443 6,933 3,508 71 3,502 1,006 - - 3,458 1993 4,134 6,493 7,008 3,500 5,075 2,900 973 - - 4,561 1994 5,011 5,824 7,302 3,553 6,177 4,974 902 - - 4,830 1995 4,697 6,853 7,701 3,308 6,701 3,204 932 - - 4,941 1996 4,874 7,213 6,707 3,066 6,914 3,372 1,023 - - 5,054 1997 4,669 6,913 7,265 3,403 7,011 3,735 792 - - 5,023 1998 4,884 6,299 6,716 3,073 6,774 4,208 937 - - 4,897 1999 4,890 6,322 5,501 3,696 6,024 3,835 1,373 - - 5,051 2000 3,976 6,924 4,686 3,473 7,487 3,681 1,435 - - 4,803 2001 4,772 7,069 4,206 1,905 5,903 3,592 1 - - 5,036 2002 5,023 6,810 4,535 2,696 2,079 3,762 1 - - 5,168 2003 5,202 7,243 4,472 3,045 5,094 4,211 1 - - 5,590 2004 5,099 7,900 5,323 2,884 6,094 4,008 668 - - 5,691 2005 5,604 8,034 4,570 2,717 6,331 4,144 548 - - 5,930 2006 5,267 7,629 4,751 2,857 6,065 4,592 1,923 - - 5,592 2007 5,184 7,778 5,025 2,502 6,568 3,696 3,835 - - 5,555 2008 5,149 8,116 4,286 2,653 6,695 3,165 3,869 18 - 5,633 2009 5,251 7,390 2,483 2,466 4,788 4,002 4,054 1,390 - 5,429 2010 4,932 7,613 2,435 2,472 5,731 2,557 4,212 885 - 5,319 2011 4,703 7,015 2,889 2,407 6,397 3,516 3,721 1,633 - 5,025 2012 4,423 7,573 7,839 2,279 5,118 3,875 1,840 640 4,081 4,296 2013 4,400 6,915 6,888 2,041 5,389 2,685 2,448 1,281 8,977 4,247 2014 4,304 7,444 10,367 2,074 4,977 3,192 2,814 1,428 9,253 4,401 2015 4,633 6,588 5,573 1,873 4,516 4,499 2,980 1,458 9,027 4,341 2016 4,149 7,376 8,501 3,020 5,100 3,218 3,109 1,680 9,962 4,564 2017 4,317 6,777 8,670 2,232 6,325 2,447 2,588 1,772 5,382 4,184 2018 4,455 6,459 9,287 2,366 2,159 3,343 2,928 1,467 3,563 3,938 2019 4,735 6,414 NA 2,202 - 2,816 2,574 1,015 4,142 3,532
1/ Does not include customer-sited solar.Source: Energy Information Administration, State Energy Data System

28
For petroleum generating capacity, the average operating hours of utility-based units
decreased from 5,180 hours per year in 1990 to 2,790 hours per year in 2019, an average decrease
of 2.1 percent per year. The average operating hours of non-utility units decreased from 5,000
hours per year in 1990 to 4,735 hours per year in 2019, an average decrease of 0.2 percent per
year.
Table 16. Fossil Fuel Consumption: Total Electric Power Industry
Consumption Consumption Per MWHOther Other
Petroleum Coal Gases Petroleum Coal GasesYear BBL ST Billion BTU BBL ST Billion BTU
1990 16,033,262 2,013 211 1.84 0.85 0.011993 12,605,395 603,669 1,044 1.70 0.41 0.021994 12,933,103 596,431 913 1.69 0.45 0.011995 13,034,983 688,499 663 1.70 0.44 0.011996 13,451,479 742,026 1,027 1.69 0.45 0.021997 13,226,872 754,453 622 1.72 0.48 0.011998 13,262,910 638,057 811 1.69 0.44 0.011999 13,544,370 646,215 447 1.69 0.45 0.012000 13,754,387 691,513 388 1.71 0.44 0.012001 13,661,310 717,290 315 1.66 0.45 0.012002 15,661,770 706,734 325 1.65 0.46 0.012003 13,133,452 751,987 361 1.54 0.46 0.012004 13,995,473 702,545 269 1.56 0.44 0.012005 14,131,327 703,865 231 1.56 0.43 0.012006 14,211,287 674,909 240 1.57 0.44 0.012007 13,943,232 689,627 254 1.56 0.44 0.012008 13,407,277 746,642 213 1.55 0.45 0.012009 12,739,777 663,171 126 1.54 0.44 0.012010 12,334,599 733,480 123 1.53 0.47 0.012011 12,089,799 709,440 198 1.53 0.50 0.012012 11,199,945 756,726 265 1.50 0.49 0.012013 10,765,251 701,013 228 1.49 0.50 0.012014 10,388,099 743,893 350 1.50 0.49 0.012015 10,510,012 653,257 276 1.50 0.49 0.012016 10,796,701 779,186 242 1.63 0.52 0.002017 10,859,057 759,018 247 1.64 0.55 0.002018 11,097,703 734,351 264 1.64 0.56 0.002019 11,451,266 716,842 27 1.67 0.55 0.00
Source: Energy Information Administration, State Energy Data System

29
Fossil fuels used to generate electricity in Hawaii consist mainly of petroleum and coal.
As shown in Table 16, for the whole electric power industry, total petroleum used for electricity
generation decreased from about 16.0 million barrels (BBLs) in 1990 to 11.5 million BBLs in
2019, an average decrease of 1.2 percent per year. Decreased petroleum consumption for
electricity generation was due to both a reduction in electricity generated by petroleum and a
reduction in petroleum consumption per kWh of electricity generated. From 1990 to 2019, total
electricity generated by petroleum decreased an average of 0.8 percent per year and petroleum
consumption per MWH of electricity decreased 0.3 percent per year, from 1.84 BBL per MWH in
1990 to 1.67 BBL per MWH in 2019.
Coal used for electricity generation in Hawaii was very limited before 1993. From 1993
to 2019, total coal used for electricity generation increased from 603,669 short tons (STs) to
716,842 STs, an average increase of 0.7 percent per year. During this period, total coal generated
electricity decreased 0.5 percent per year, and coal consumption per MWH generated increased
1.2 percent per year on average, from 0.41 ST per MWH to 0.55 ST per MWH.
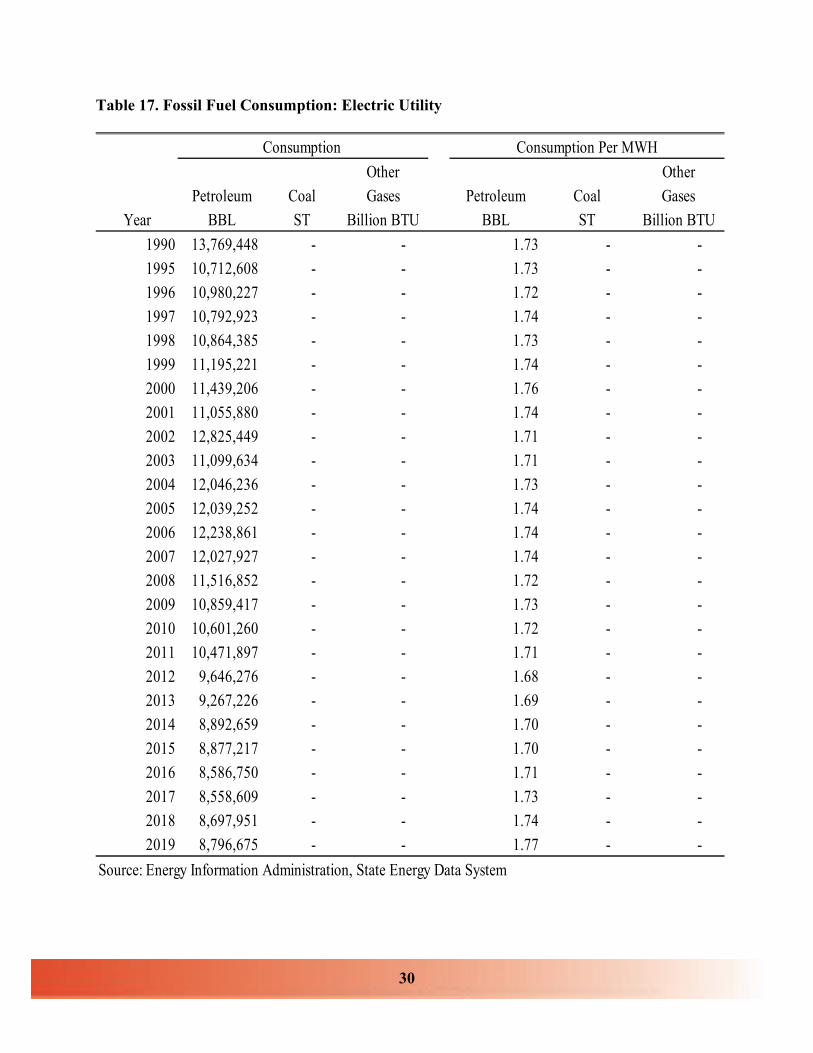
The utilities accounted for about 76.8 percent of the petroleum used to generate electricity
in Hawaii. As shown in Table 17, petroleum consumption per MWH was stable over the period
analyzed for utility units. From 1990 to 2019, petroleum consumption per MWH remained about
the same.
The non-utility petroleum units are more energy efficient than the utility units. In addition,
the energy efficiency of non-utility units improved over time. From 1990 to 2019, petroleum
consumption per MWH for non-utility petroleum units decreased an average of 2.5 percent per
year from 2.95 BBL to 1.40 BBL. In 2019, the petroleum consumption per MWH for non-utility
producers was only about 79 percent of the per MWH petroleum consumption by utility producers.
30
Table 17. Fossil Fuel Consumption: Electric Utility
Consumption Consumption Per MWHOther Other
Petroleum Coal Gases Petroleum Coal GasesYear BBL ST Billion BTU BBL ST Billion BTU
1990 13,769,448 - - 1.73 - - 1995 10,712,608 - - 1.73 - - 1996 10,980,227 - - 1.72 - - 1997 10,792,923 - - 1.74 - - 1998 10,864,385 - - 1.73 - - 1999 11,195,221 - - 1.74 - - 2000 11,439,206 - - 1.76 - - 2001 11,055,880 - - 1.74 - - 2002 12,825,449 - - 1.71 - - 2003 11,099,634 - - 1.71 - - 2004 12,046,236 - - 1.73 - - 2005 12,039,252 - - 1.74 - - 2006 12,238,861 - - 1.74 - - 2007 12,027,927 - - 1.74 - - 2008 11,516,852 - - 1.72 - - 2009 10,859,417 - - 1.73 - - 2010 10,601,260 - - 1.72 - - 2011 10,471,897 - - 1.71 - - 2012 9,646,276 - - 1.68 - - 2013 9,267,226 - - 1.69 - - 2014 8,892,659 - - 1.70 - - 2015 8,877,217 - - 1.70 - - 2016 8,586,750 - - 1.71 - - 2017 8,558,609 - - 1.73 - - 2018 8,697,951 - - 1.74 - - 2019 8,796,675 - - 1.77 - -
Source: Energy Information Administration, State Energy Data System

31
Table 18. Fossil Fuel Consumption: IPP and CHP
Fuel consumption data provided by the EIA is only available at the state level. Conversely,
data available from the utility MFR includes fuel consumption by individual utility producers, and
the average price of fuel data is also available. The fuel cost of non-utility producers, however, is
not available in the utility MFR.
Consumption Consumption Per MWHOther Other
Petroleum Coal Gases Petroleum Coal GasesYear BBL ST Billion BTU BBL ST Billion BTU
1990 2,263,814 2,013 211 2.95 0.85 0.011993 1,949,294 603,669 1,044 1.47 0.41 0.021994 2,524,020 596,431 913 1.57 0.45 0.011995 2,322,375 688,499 663 1.54 0.44 0.011996 2,471,252 742,026 1,027 1.58 0.45 0.021997 2,433,949 754,453 622 1.63 0.48 0.011998 2,398,525 638,057 811 1.53 0.44 0.011999 2,349,149 646,215 447 1.50 0.45 0.012000 2,315,181 691,513 388 1.51 0.44 0.012001 2,605,430 717,290 315 1.40 0.45 0.012002 2,836,321 706,734 325 1.44 0.46 0.012003 2,033,818 751,987 361 1.01 0.46 0.012004 1,949,237 702,545 269 0.99 0.44 0.012005 2,092,075 703,865 231 0.97 0.43 0.012006 1,972,426 674,909 240 0.97 0.44 0.012007 1,915,305 689,627 254 0.96 0.44 0.012008 1,890,425 746,642 213 0.95 0.45 0.012009 1,880,360 663,171 126 0.93 0.44 0.012010 1,733,339 733,480 123 0.91 0.47 0.012011 1,617,902 709,440 198 0.89 0.50 0.012012 1,553,669 756,726 265 0.89 0.49 0.012013 1,498,025 701,013 228 0.87 0.50 0.012014 1,495,440 743,893 350 0.89 0.49 0.012015 1,632,795 653,257 276 0.90 0.49 0.012016 2,209,951 779,186 242 1.35 0.52 0.002017 2,300,448 759,018 247 1.35 0.55 0.002018 2,399,752 734,351 264 1.37 0.56 0.002019 2,654,591 716,842 27 1.40 0.55 0.00
Source: Energy Information Administration, State Energy Data System

32
As shown in Table 19, from 2005 to 2019, total petroleum consumption by the four electric
utilities in Hawaii decreased an average 1.9 percent per year from about 12.0 million BBLs to
about 9.2 million BBLs; fuel oil consumption decreased an average 2.4 percent per year from 9.1
million BBLs to 6.5 million BBLs; diesel oil consumption decreased an average 0.6 percent per
year, from 2.9 million BBLs to 2.7 million BBLs. In 2020, petroleum consumption by the utilities
decreased 7.6 percent from the previous year; fuel oil decreased 6.3 percent, while diesel decreased
11.4 percent.
Table 19. Hawaii Utility Fuel Consumption
Growth Avg. ann. Growth2005 2012 2015 2016 2017 2018 2019 2020 2020 2005 - 2019
PetroleumState Total BBL 12,046,758 10,101,880 9,389,734 9,019,130 9,049,319 9,177,944 9,203,662 8,500,645 -7.6% -1.9%HECO BBL 7,993,010 6,793,695 6,374,751 5,952,009 6,006,645 6,081,565 6,105,873 5,705,353 -6.6% -1.9%HELCO BBL 1,136,268 904,034 909,157 1,034,292 939,346 1,010,891 1,031,821 1,142,285 10.7% -0.7%MECO BBL 2,170,554 1,697,767 1,477,603 1,515,071 1,600,110 1,560,142 1,633,411 1,331,946 -18.5% -2.0%KIUC BBL 746,926 706,384 628,223 517,758 503,218 525,346 432,557 321,061 -25.8% -3.8%Fuel OilState Total BBL 9,120,687 7,612,236 6,766,206 6,573,322 6,485,587 6,566,897 6,513,044 6,116,177 -6.1% -2.4%HECO BBL 7,874,530 6,703,981 6,139,949 5,768,973 5,709,841 5,813,837 5,671,391 5,348,859 -5.7% -2.3%HELCO BBL 726,866 533,394 387,475 509,691 399,720 393,831 456,545 445,766 -2.4% -3.3%MECO BBL 519,291 374,861 238,782 294,658 376,026 359,229 385,108 321,552 -16.5% -2.1%KIUC BBL - - - - - - - - Diesel State Total BBL 2,926,071 2,489,644 2,623,528 2,445,808 2,563,732 2,611,047 2,690,618 2,384,468 -11.4% -0.6%HECO BBL 118,480 89,714 234,802 183,036 296,804 267,728 434,482 356,494 -17.9% 9.7%HELCO BBL 409,402 370,640 521,682 524,601 539,626 617,060 575,276 696,519 21.1% 2.5%MECO BBL 1,651,263 1,322,906 1,238,821 1,220,413 1,224,084 1,200,913 1,248,303 1,010,394 -19.1% -2.0%KIUC BBL 746,926 706,384 628,223 517,758 503,218 525,346 432,557 321,061 -25.8% -3.8%% of Fuel OilState Total % 75.7% 75.4% 72.1% 72.9% 71.7% 71.6% 70.8% 71.9%HECO % 98.5% 98.7% 96.3% 96.9% 95.1% 95.6% 92.9% 93.8%HELCO % 64.0% 59.0% 42.6% 49.3% 42.6% 39.0% 44.2% 39.0%MECO % 23.9% 22.1% 16.2% 19.4% 23.5% 23.0% 23.6% 24.1%KIUC % 0.0% 0.0% 0.0% 0.0% 0.0% 0.0% 0.0% 0.0%County % of Fuel OilState Total % 100.0% 100.0% 100.0% 100.0% 100.0% 100.0% 100.0% 100.0%HECO % 86.3% 88.1% 90.7% 87.8% 88.0% 88.5% 87.1% 87.5%HELCO % 8.0% 7.0% 5.7% 7.8% 6.2% 6.0% 7.0% 7.3%MECO % 5.7% 4.9% 3.5% 4.5% 5.8% 5.5% 5.9% 5.3%KIUC % 0.0% 0.0% 0.0% 0.0% 0.0% 0.0% 0.0% 0.0%County % of DieselState Total % 100.0% 100.0% 100.0% 100.0% 100.0% 100.0% 100.0% 100.0%HECO % 4.0% 3.6% 8.9% 7.5% 11.6% 10.3% 16.1% 15.0%HELCO % 14.0% 14.9% 19.9% 21.4% 21.0% 23.6% 21.4% 29.2%MECO % 56.4% 53.1% 47.2% 49.9% 47.7% 46.0% 46.4% 42.4%KIUC % 25.5% 28.4% 23.9% 21.2% 19.6% 20.1% 16.1% 13.5%Source: Hawaii Electric Utility Monthly Financial Reports.
33
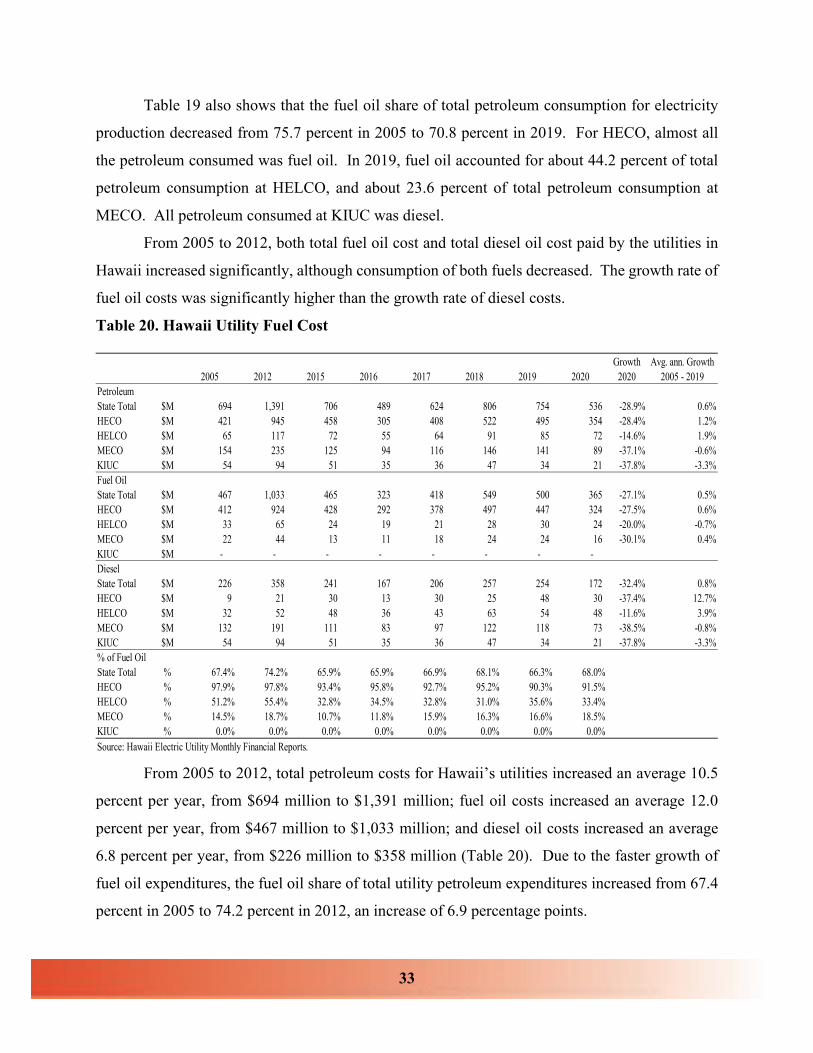
Table 19 also shows that the fuel oil share of total petroleum consumption for electricity
production decreased from 75.7 percent in 2005 to 70.8 percent in 2019. For HECO, almost all
the petroleum consumed was fuel oil. In 2019, fuel oil accounted for about 44.2 percent of total
petroleum consumption at HELCO, and about 23.6 percent of total petroleum consumption at
MECO. All petroleum consumed at KIUC was diesel.
From 2005 to 2012, both total fuel oil cost and total diesel oil cost paid by the utilities in
Hawaii increased significantly, although consumption of both fuels decreased. The growth rate of
fuel oil costs was significantly higher than the growth rate of diesel costs.
Table 20. Hawaii Utility Fuel Cost
From 2005 to 2012, total petroleum costs for Hawaii’s utilities increased an average 10.5
percent per year, from $694 million to $1,391 million; fuel oil costs increased an average 12.0
percent per year, from $467 million to $1,033 million; and diesel oil costs increased an average
6.8 percent per year, from $226 million to $358 million (Table 20). Due to the faster growth of
fuel oil expenditures, the fuel oil share of total utility petroleum expenditures increased from 67.4
percent in 2005 to 74.2 percent in 2012, an increase of 6.9 percentage points.
Growth Avg. ann. Growth2005 2012 2015 2016 2017 2018 2019 2020 2020 2005 - 2019
PetroleumState Total $M 694 1,391 706 489 624 806 754 536 -28.9% 0.6%HECO $M 421 945 458 305 408 522 495 354 -28.4% 1.2%HELCO $M 65 117 72 55 64 91 85 72 -14.6% 1.9%MECO $M 154 235 125 94 116 146 141 89 -37.1% -0.6%KIUC $M 54 94 51 35 36 47 34 21 -37.8% -3.3%Fuel OilState Total $M 467 1,033 465 323 418 549 500 365 -27.1% 0.5%HECO $M 412 924 428 292 378 497 447 324 -27.5% 0.6%HELCO $M 33 65 24 19 21 28 30 24 -20.0% -0.7%MECO $M 22 44 13 11 18 24 24 16 -30.1% 0.4%KIUC $M - - - - - - - - Diesel State Total $M 226 358 241 167 206 257 254 172 -32.4% 0.8%HECO $M 9 21 30 13 30 25 48 30 -37.4% 12.7%HELCO $M 32 52 48 36 43 63 54 48 -11.6% 3.9%MECO $M 132 191 111 83 97 122 118 73 -38.5% -0.8%KIUC $M 54 94 51 35 36 47 34 21 -37.8% -3.3%% of Fuel OilState Total % 67.4% 74.2% 65.9% 65.9% 66.9% 68.1% 66.3% 68.0%HECO % 97.9% 97.8% 93.4% 95.8% 92.7% 95.2% 90.3% 91.5%HELCO % 51.2% 55.4% 32.8% 34.5% 32.8% 31.0% 35.6% 33.4%MECO % 14.5% 18.7% 10.7% 11.8% 15.9% 16.3% 16.6% 18.5%KIUC % 0.0% 0.0% 0.0% 0.0% 0.0% 0.0% 0.0% 0.0%Source: Hawaii Electric Utility Monthly Financial Reports.
34
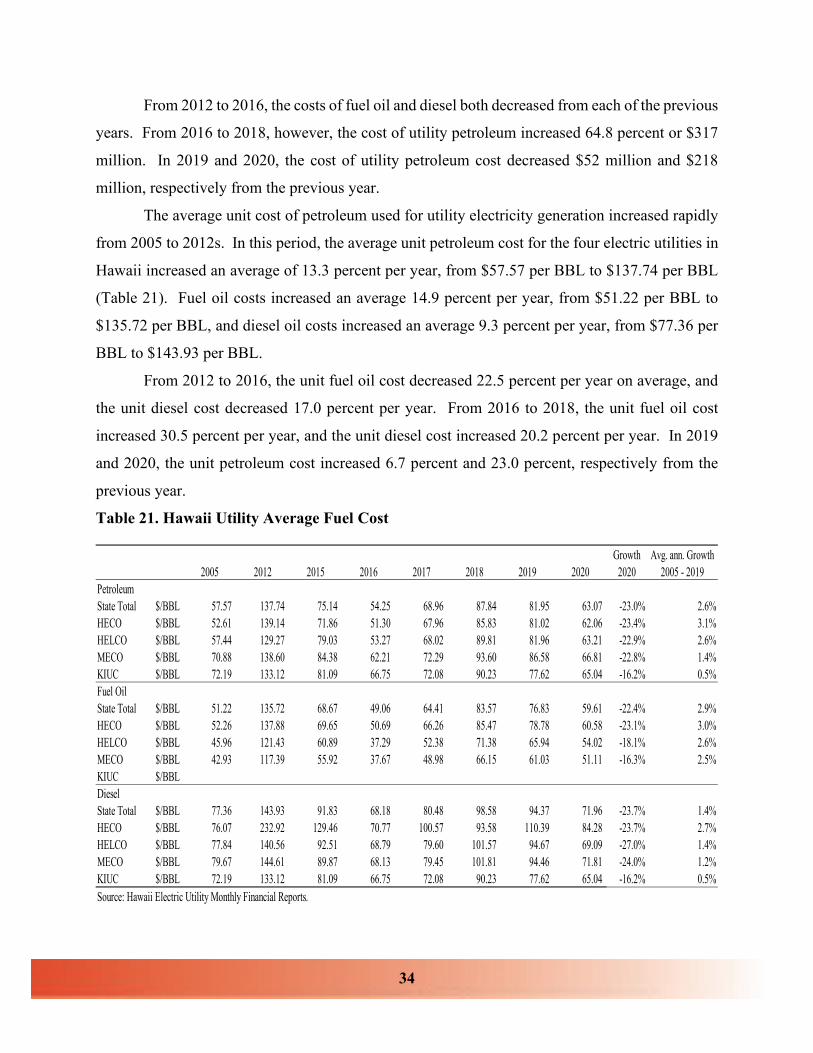
From 2012 to 2016, the costs of fuel oil and diesel both decreased from each of the previous
years. From 2016 to 2018, however, the cost of utility petroleum increased 64.8 percent or $317
million. In 2019 and 2020, the cost of utility petroleum cost decreased $52 million and $218
million, respectively from the previous year.
The average unit cost of petroleum used for utility electricity generation increased rapidly
from 2005 to 2012s. In this period, the average unit petroleum cost for the four electric utilities in
Hawaii increased an average of 13.3 percent per year, from $57.57 per BBL to $137.74 per BBL
(Table 21). Fuel oil costs increased an average 14.9 percent per year, from $51.22 per BBL to
$135.72 per BBL, and diesel oil costs increased an average 9.3 percent per year, from $77.36 per
BBL to $143.93 per BBL.
From 2012 to 2016, the unit fuel oil cost decreased 22.5 percent per year on average, and
the unit diesel cost decreased 17.0 percent per year. From 2016 to 2018, the unit fuel oil cost
increased 30.5 percent per year, and the unit diesel cost increased 20.2 percent per year. In 2019
and 2020, the unit petroleum cost increased 6.7 percent and 23.0 percent, respectively from the
previous year.
Table 21. Hawaii Utility Average Fuel Cost
Growth Avg. ann. Growth2005 2012 2015 2016 2017 2018 2019 2020 2020 2005 - 2019
PetroleumState Total $/BBL 57.57 137.74 75.14 54.25 68.96 87.84 81.95 63.07 -23.0% 2.6%HECO $/BBL 52.61 139.14 71.86 51.30 67.96 85.83 81.02 62.06 -23.4% 3.1%HELCO $/BBL 57.44 129.27 79.03 53.27 68.02 89.81 81.96 63.21 -22.9% 2.6%MECO $/BBL 70.88 138.60 84.38 62.21 72.29 93.60 86.58 66.81 -22.8% 1.4%KIUC $/BBL 72.19 133.12 81.09 66.75 72.08 90.23 77.62 65.04 -16.2% 0.5%Fuel OilState Total $/BBL 51.22 135.72 68.67 49.06 64.41 83.57 76.83 59.61 -22.4% 2.9%HECO $/BBL 52.26 137.88 69.65 50.69 66.26 85.47 78.78 60.58 -23.1% 3.0%HELCO $/BBL 45.96 121.43 60.89 37.29 52.38 71.38 65.94 54.02 -18.1% 2.6%MECO $/BBL 42.93 117.39 55.92 37.67 48.98 66.15 61.03 51.11 -16.3% 2.5%KIUC $/BBLDiesel State Total $/BBL 77.36 143.93 91.83 68.18 80.48 98.58 94.37 71.96 -23.7% 1.4%HECO $/BBL 76.07 232.92 129.46 70.77 100.57 93.58 110.39 84.28 -23.7% 2.7%HELCO $/BBL 77.84 140.56 92.51 68.79 79.60 101.57 94.67 69.09 -27.0% 1.4%MECO $/BBL 79.67 144.61 89.87 68.13 79.45 101.81 94.46 71.81 -24.0% 1.2%KIUC $/BBL 72.19 133.12 81.09 66.75 72.08 90.23 77.62 65.04 -16.2% 0.5%Source: Hawaii Electric Utility Monthly Financial Reports.
35
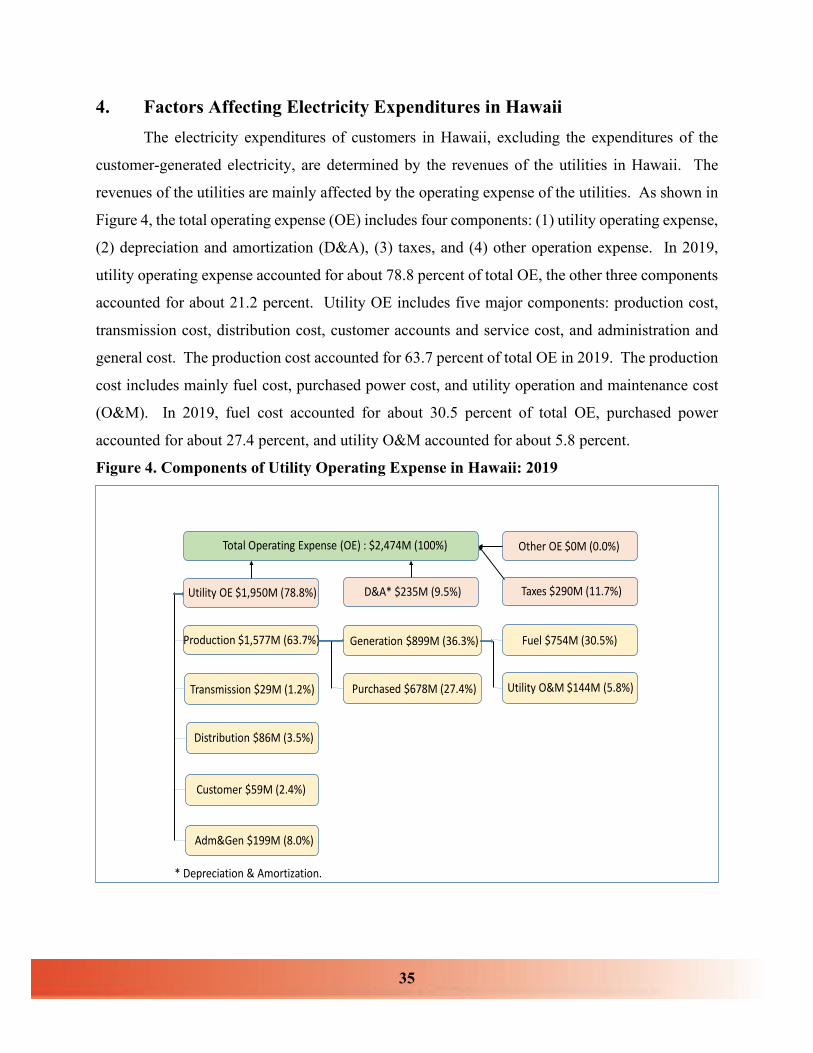
4. Factors Affecting Electricity Expenditures in Hawaii The electricity expenditures of customers in Hawaii, excluding the expenditures of the
customer-generated electricity, are determined by the revenues of the utilities in Hawaii. The
revenues of the utilities are mainly affected by the operating expense of the utilities. As shown in
Figure 4, the total operating expense (OE) includes four components: (1) utility operating expense,
(2) depreciation and amortization (D&A), (3) taxes, and (4) other operation expense. In 2019,
utility operating expense accounted for about 78.8 percent of total OE, the other three components
accounted for about 21.2 percent. Utility OE includes five major components: production cost,
transmission cost, distribution cost, customer accounts and service cost, and administration and
general cost. The production cost accounted for 63.7 percent of total OE in 2019. The production
cost includes mainly fuel cost, purchased power cost, and utility operation and maintenance cost
(O&M). In 2019, fuel cost accounted for about 30.5 percent of total OE, purchased power
accounted for about 27.4 percent, and utility O&M accounted for about 5.8 percent.
Figure 4. Components of Utility Operating Expense in Hawaii: 2019
Transmission $29M (1.2%)
Fuel $754M (30.5%)
Total Operating Expense (OE) : $2,474M (100%)
Distribution $86M (3.5%)
Customer $59M (2.4%)
Adm&Gen $199M (8.0%)
Generation $899M (36.3%)
Purchased $678M (27.4%) Utility O&M $144M (5.8%)
Utility OE $1,950M (78.8%) D&A* $235M (9.5%) Taxes $290M (11.7%)
Production $1,577M (63.7%)
* Depreciation & Amortization.
Other OE $0M (0.0%)
36
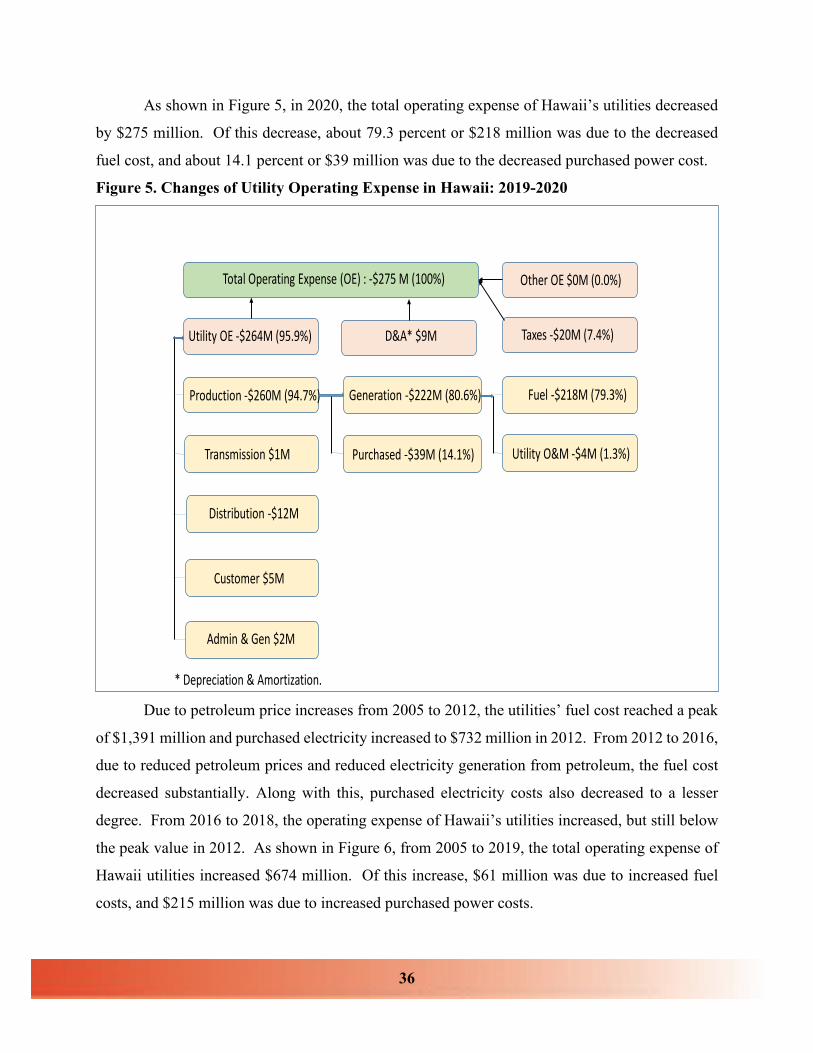
As shown in Figure 5, in 2020, the total operating expense of Hawaii’s utilities decreased
by $275 million. Of this decrease, about 79.3 percent or $218 million was due to the decreased
fuel cost, and about 14.1 percent or $39 million was due to the decreased purchased power cost.
Figure 5. Changes of Utility Operating Expense in Hawaii: 2019-2020
Due to petroleum price increases from 2005 to 2012, the utilities’ fuel cost reached a peak
of $1,391 million and purchased electricity increased to $732 million in 2012. From 2012 to 2016,
due to reduced petroleum prices and reduced electricity generation from petroleum, the fuel cost
decreased substantially. Along with this, purchased electricity costs also decreased to a lesser
degree. From 2016 to 2018, the operating expense of Hawaii’s utilities increased, but still below
the peak value in 2012. As shown in Figure 6, from 2005 to 2019, the total operating expense of
Hawaii utilities increased $674 million. Of this increase, $61 million was due to increased fuel
costs, and $215 million was due to increased purchased power costs.
Transmission $1M
Fuel -$218M (79.3%)
Total Operating Expense (OE) : -$275 M (100%)
Distribution -$12M
Customer $5M
Admin & Gen $2M
Generation -$222M (80.6%)
Purchased -$39M (14.1%) Utility O&M -$4M (1.3%)
Utility OE -$264M (95.9%) D&A* $9M Taxes -$20M (7.4%)
Production -$260M (94.7%)
* Depreciation & Amortization.
Other OE $0M (0.0%)

37
Figure 6. Changes of Utility Operating Expense in Hawaii: 2005-2019
The cost structures of the four utilities in Hawaii are not the same. Compared with the
neighbor island utilities, the share of fuel cost in the HECO system was lower, and the share of
purchased power was higher. As shown in Figure 7, in 2019, the total operating expense for HECO
was $1,650 million; fuel cost accounted for $495 million or 30.0 percent; and purchased electricity
accounted for $498 million or 30.2 percent. In comparison, the fuel cost and purchased electricity
cost in the neighbor island utilities accounted for 31.5 percent and 21.9 percent of total operating
expense, respectively.
Figure 8 shows the changes of operating expense in the HECO system in 2020. Total
operating expense of HECO decreased $205 million. Of this, about 68.7 percent or $141 million
of the decrease was due to the decreased fuel cost, and about 22.7 percent or $46 million was due
to the decreased purchased power cost.
Transmission $16M
Fuel $61M (9.0%)
Total Operating Expense (OE) : $674M (100%)
Distribution $49M
Customer $21M
Admin &Gen $110M
Generation $101M (15.0%)
Purchased $215M (31.9%) Utility O&M $40M (6.0%)
Utility OE $512M (76.0)% D&A* $98M (14.5%) Taxes $70M (10.4%)
Production $316M (46.8%)
* Depreciation & Amortization.
Other OE -$5M

38
Figure 7. Components of HECO Operating Expense: 2019
Figure 8. Changes of HECO Operating Expense: 2019-2020
Transmission $16M (1.0%)
Fuel $495M (30.0%)
Total Operating Expense (OE) : $1,650 M (100%)
Distribution $53M (3.2%)
Customer $39M (2.4%)
Admin &Gen $135M (8.2%)
Generation $570M (34.5%)
Purchased $498M (30.2%) Utility O&M $75M (4.5%)
Utility OE $1,310M (79.4%) D&A* $144M (8.7%) Taxes $195M (11.8%)
Production $1,067M (64.7%)
* Depreciation & Amortization.
Other OE $0.0M (0.0%)
Transmission $1M
Fuel -$141M (68.7%)
Total Operating Expense (OE) : -$205M (100%)
Distribution -$11M
Customer $1M
Admin &Gen $0M
Generation -$141M (69.0%)
Purchased -$46M (22.7%) Utility O&M -$1M (0.3%)
Utility OE -$197M (96.4%) D&A* $8M Taxes -$15M (7.5%)
Production -$188M (91.7%)
* Depreciation & Amortization.
Other OE $0M

39
Figure 9 shows the changes of operating expenses for the HECO system from 2005 to
2019. The total operating expense of HECO increased by $511 million from 2005 to 2019. About
$74 million was due to the increased fuel cost, and about $158 million was due to the increased
purchased power cost.
Figure 9. Changes of HECO Operating Expense: 2005-2019
The total revenue for the utilities, which reflects the total cost of electricity for customers,
increased an average of 7.9 percent per year from $1.9 billion in 2005 to $3.3 billion in 2012.
From 2012 to 2016, total revenue from electricity sales decreased an average of 9.2 percent per
year to about $2.2 billion. From 2016 to 2018, however, total revenue from electricity sales
increased $463 million or 9.9 percent per year to about $2.7 billion. In 2019 and 2020, total
revenue from electricity sales decreased 0.6 percent and 9.9 percent, respectively from the previous
year.,
Since the consumption of electricity has been relatively stable over time, the fluctuation of
the total electricity cost for customers was mainly due to fluctuations in the average price of
electricity. As shown in Table 22, the average revenue per kWh sold in Hawaii increased almost
every year from 18.3 cents in 2005 to 34.0 cents in 2012, an increase of 9.3 percent per year over
this period.
Transmission $9M
Fuel $74M
Total Operating Expense (OE) : $511M
Distribution $30M
Customer $15M
Admin &Gen $76M
Generation $92M
Purchased $158M Utility O&M $18M
Utility OE $380M D&A* $75M Taxes $59M
Production $251M
* Depreciation & Amortization.
Other OE -$3M

40
From 2012 to 2016, however, the average revenue from electricity sales decreased 8.4
percent per year, from 34.0 cents per kWh to 24.0 cents per kWh. From 2016 to 2018, the average
revenue from electricity sales increased from 24.0 cents per kWh to 29.4 cents per kWh. In 2019
and 2020, the average electricity revenue decreased to 29.0 cents per kWh and 28.2 cents per kWh,
respectively. The average electricity revenue in 2020 was the highest at KIUC at about 40.7 cents
per kWh. This was followed by HELCO at 33.6 cents per kWh, MECO at 33.2 cents per kWh,
and HECO at 25.8 cents per kWh.
Table 22. Hawaii Average Revenue of Electricity by Utility
The total cost of electricity in Hawaii was mainly affected by two factors, the fuel cost and
purchased power cost. The cost of utility fuel and the cost of purchased power were both impacted
by fluctuations in petroleum prices. Before 2015, the fuel and purchased power costs accounted
for more than 60 percent of the total electricity costs for almost every year. In 2015, 2016, 2017,
2018, 2019, and 2020 the fuel and purchased power share of the total electricity cost decreased to
53.3 percent, 48.5 percent, 51.8 percent, 55.2 percent, 53.6 percent, and 48.8 percent respectively.
Growth Avg. ann. Growth2005 2012 2015 2016 2017 2018 2019 2020 2020 2005 - 2019
Revenue from electricity salesState Total $M 1,927 3,281 2,467 2,226 2,395 2,688 2,672 2,408 -9.9% 2.4%HECO $M 1,201 2,217 1,636 1,466 1,592 1,790 1,785 1,592 -10.8% 2.9%HELCO $M 294 439 344 310 332 372 360 329 -8.6% 1.5%MECO $M 302 437 344 307 324 365 372 318 -14.6% 1.5%KIUC $M 130 188 143 143 147 162 154 169 9.3% 1.2%Total electricity soldState Total GWh 10,539 9,639 9,389 9,284 9,136 9,140 9,201 8,536 -7.2% -1.0%HECO GWh 7,721 6,976 6,754 6,660 6,549 6,526 6,563 6,183 -5.8% -1.2%HELCO GWh 1,116 1,085 1,065 1,067 1,047 1,064 1,050 978 -6.8% -0.4%MECO GWh 1,252 1,145 1,138 1,118 1,095 1,099 1,127 959 -15.0% -0.7%KIUC GWh 449 433 432 439 445 451 461 415 -9.9% 0.2%Average revenue/kWh soldState Total $/kWh 0.183 0.340 0.263 0.240 0.262 0.294 0.290 0.282 -2.8% 3.4%HECO $/kWh 0.156 0.318 0.242 0.220 0.243 0.274 0.272 0.258 -5.3% 4.1%HELCO $/kWh 0.263 0.405 0.323 0.290 0.317 0.349 0.343 0.336 -1.9% 1.9%MECO $/kWh 0.241 0.382 0.302 0.274 0.296 0.332 0.330 0.332 0.5% 2.3%KIUC $/kWh 0.291 0.435 0.331 0.326 0.331 0.360 0.335 0.407 21.2% 1.0%Source: Hawaii Electric Utility Monthly Financial Reports.

41
From 2005 to 2012, the total fuel cost of the utilities and the cost of purchased electricity
increased 9.1 percent per year, from $1,157 million in 2005 to $2,124 million in 2012. From 2005
to 2012, the utility fuel cost increased from $694 million to $1,391 million and the purchased
power cost increased from $463 million to $732 million (Table 23).
Table 23. Hawaii Average Cost of Fuel and Purchased Power by Utility
In 2020, the average fuel and purchased electricity cost per kWh decreased 11.5 percent,
from 15.6 cents to 13.8 cents. The fuel and purchased power cost share, as a percentage of the
total cost of electricity sold, decreased from 53.6 percent in 2019 to 48.8 percent in 2020. In 2020,
the share of fuel and purchased power cost was the highest for HECO at 50.6 percent, followed by
KIUC at 48.2 percent, HELCO at 45.0 percent, and MECO at 44.2 percent.
Growth Avg. ann. Growth2005 2012 2015 2016 2017 2018 2019 2020 2020 2005 - 2019
Fuel and purchased power costState Total $M 1,157 2,124 1,314 1,080 1,241 1,485 1,432 1,175 -17.9% 1.5%HECO $M 760 1,486 899 736 862 1,021 992 805 -18.9% 1.9%HELCO $M 168 262 169 136 152 189 178 148 -16.9% 0.4%MECO $M 170 273 180 145 161 196 190 141 -26.1% 0.8%KIUC $M 59 102 65 63 66 79 71 81 14.0% 1.4%Utility fuel costState Total $M 694 1,391 706 489 624 808 754 536 -28.9% 0.6%HECO $M 421 945 458 305 408 524 495 354 -28.4% 1.2%HELCO $M 65 117 72 55 64 91 85 72 -14.6% 1.9%MECO $M 154 235 125 94 116 146 141 89 -37.1% -0.6%KIUC $M 54 94 51 35 36 47 34 21 -37.8% -3.3%Purchased power costState Total $M 463 732 608 591 617 677 678 639 -5.7% 2.8%HECO $M 339 541 441 431 454 498 498 451 -9.3% 2.8%HELCO $M 103 145 98 81 88 98 94 76 -18.9% -0.7%MECO $M 16 38 56 51 46 50 49 52 5.7% 8.2%KIUC $M 5 8 14 28 30 32 38 61 60.0% 15.6%Average fuel and purchased power costState Total $/kWh 0.110 0.220 0.140 0.116 0.136 0.162 0.156 0.138 -11.5% 2.5%HECO $/kWh 0.098 0.213 0.133 0.111 0.132 0.157 0.151 0.130 -13.9% 3.1%HELCO $/kWh 0.150 0.242 0.159 0.128 0.145 0.177 0.170 0.152 -10.8% 0.9%MECO $/kWh 0.136 0.239 0.158 0.130 0.147 0.178 0.169 0.147 -13.1% 1.6%KIUC $/kWh 0.131 0.236 0.151 0.143 0.148 0.175 0.155 0.196 26.5% 1.2%Share of fuel and purchased power costState Total % 60.0% 64.7% 53.3% 48.5% 51.8% 55.2% 53.6% 48.8% -9.0% -0.8%HECO % 63.2% 67.0% 54.9% 50.2% 54.2% 57.1% 55.6% 50.6% -9.0% -0.9%HELCO % 57.2% 59.7% 49.3% 44.0% 45.7% 50.8% 49.5% 45.0% -9.1% -1.0%MECO % 56.4% 62.6% 52.5% 47.3% 49.8% 53.7% 51.1% 44.2% -13.5% -0.7%KIUC % 45.2% 54.3% 45.7% 43.9% 44.8% 48.7% 46.2% 48.2% 4.3% 0.2%Source: Hawaii Electric Utility Monthly Financial Reports.
42
In comparison, from 2005 to 2012, the average fuel and purchased electricity cost per kWh
increased from 11.0 cents to 22.0 cents, an average increase of 10.5 percent per year. The share
of fuel and purchased power cost, as a percentage of the total cost of electricity sold, increased
from 60.0 percent in 2005 to 64.7 percent in 2012. In 2012, the share of fuel and purchased power
cost was the highest in HECO at 67.0 percent, followed by MECO at 62.6 percent, HELCO at 59.7
percent, and KIUC at 54.3 percent.
From 2012 to 2016, both the average fuel cost and average purchased power cost
decreased, and the average cost of purchased power decreased at a slower rate. As shown in Table
27, from 2012 to 2016, the average fuel cost to generate one kWh of net electricity (gross
generation minus station use) by the utilities decreased 20.3 percent per year from 23.1 cents to
9.3 cents for the state. During the same period, the average cost of purchased electricity decreased
only 7.3 percent per year, from 17.7 cents to 13.1 cents. From 2016 to 2018, the average fuel cost
increased from 9.3 cents to 15.3 cents, and the average purchased power cost increased from 13.1
cents to 15.7 cents. In 2019 and 2020, the average fuel cost decreased to 14.4 cents and 11.1 cents,
respectively, and the average purchased power cost decreased to 15.4 and 15.2 cents, respectively.
In comparison, from 2005 to 2012, the average fuel cost to generate one kWh of net
electricity by the utilities increased 12.7 percent per year from 10.0 cents to 23.1 cents for the state.
During the same period the average cost of purchased electricity increased only 7.0 percent per
year from 11.0 cents to 17.7 cents. In 2005, the average cost of purchased electricity was above
the average fuel cost of the utilities. In 2012, the average cost of purchased electricity was about
23.4 percent below the average fuel cost of the utilities in Hawaii. Since 2015, however, the
average cost of purchased electricity was above the average fuel cost of the utilities again.
Due to the slower growth of purchased electricity costs from 2005 to 2012, the ratio of
average purchased power cost to average utility fuel cost decreased from 110 percent in 2005 to
77 percent in 2012. In 2020, the ratio of average purchased power cost to average utility fuel cost
increased to 137 percent. In 2020, the purchased electricity was cheapest at HECO (14.1
cents/kWh), followed by HELCO (18.0 cents/kWh), KIUC (19.1 cents/kWh), and MECO (19.5
cents/kWh).

43
Table 24. Utility Fuel Cost and Purchased Power Cost Comparison by Utility
In addition to fuel and purchased power costs, the cost of electricity is also affected by four
other components. As shown in Table 25, the operating income of the utilities accounted for about
10.2 percent, taxes accounted for about 11.2 percent, depreciation and amortization accounted for
about 10.1 percent, and other utility operating expenses accounted for about 21.2 percent of the
total electricity cost paid by consumers in 2020.
Growth Avg. ann. Growth2005 2012 2015 2016 2017 2018 2019 2020 2020 2005 - 2019
Average fuel cost of utility net generationState Total $/kWh 0.100 0.231 0.129 0.093 0.120 0.153 0.144 0.111 -23.5% 2.6%HECO $/kWh 0.089 0.229 0.123 0.088 0.118 0.149 0.142 0.108 -23.4% 3.4%HELCO $/kWh 0.123 0.239 0.140 0.097 0.122 0.159 0.154 0.116 -24.3% 1.6%MECO $/kWh 0.125 0.237 0.142 0.106 0.126 0.164 0.152 0.119 -21.5% 1.4%KIUC $/kWh 0.124 0.227 0.142 0.116 0.123 0.156 0.135 0.095 -30.0% 0.6%Average cost of purchased electricityState Total $/kWh 0.110 0.177 0.138 0.131 0.140 0.157 0.154 0.152 -1.4% 2.4%HECO $/kWh 0.100 0.170 0.132 0.124 0.133 0.151 0.149 0.141 -5.6% 2.9%HELCO $/kWh 0.149 0.213 0.154 0.140 0.146 0.172 0.164 0.180 10.0% 0.7%MECO $/kWh 0.167 0.172 0.171 0.173 0.188 0.187 0.191 0.195 2.2% 0.9%KIUC $/kWh 0.144 0.214 0.152 0.177 0.176 0.185 0.161 0.191 18.9% 0.8%Ratio of purchased cost/fuel costState Total % 110% 77% 107% 140% 116% 103% 107% 137% 28.8% -0.2%HECO % 113% 74% 107% 141% 113% 101% 105% 130% 23.2% -0.5%HELCO % 121% 89% 110% 144% 119% 108% 106% 155% 45.2% -0.9%MECO % 134% 72% 120% 163% 149% 114% 125% 163% 30.2% -0.5%KIUC % 116% 94% 107% 153% 143% 119% 119% 202% 69.9% 0.2%Ratio of fuel cost and average revenueState Total % 55% 68% 49% 39% 46% 52% 50% 39% -21.3% -0.7%HECO % 57% 72% 51% 40% 49% 54% 52% 42% -19.1% -0.7%HELCO % 47% 59% 43% 33% 39% 46% 45% 35% -22.8% -0.3%MECO % 52% 62% 47% 39% 43% 49% 46% 36% -21.9% -0.8%KIUC % 43% 52% 43% 36% 37% 43% 40% 23% -42.3% -0.4%Ratio of purchased power cost and average revenueState Total % 60% 52% 53% 55% 53% 53% 53% 54% 1.4% -0.9%HECO % 64% 53% 54% 56% 55% 55% 55% 55% -0.4% -1.2%HELCO % 57% 53% 48% 48% 46% 49% 48% 54% 12.1% -1.2%MECO % 69% 45% 57% 63% 64% 56% 58% 59% 1.7% -1.3%KIUC % 49% 49% 46% 54% 53% 52% 48% 47% -2.0% -0.2%Source: Hawaii Electric Utility Monthly Financial Reports.

44
Table 25. Other Major Costs of Electricity by Utility
Growth Avg. ann. Growth2005 2012 2015 2016 2017 2018 2019 2020 2020 2005 - 2019
Operating incomeState Total $M 134 191 203 207 182 215 224 245 9.2% 3.7%HECO $M 65 117 129 133 110 138 152 162 6.7% 6.2%HELCO $M 22 31 31 32 32 36 31 37 21.1% 2.6%MECO $M 27 24 31 29 27 29 31 29 -5.6% 1.0%KIUC $M 21 19 12 13 14 13 11 17 50.3% -4.3%TaxesState Total $M 220 379 316 301 314 287 290 269 -7.0% 2.0%HECO $M 137 260 213 204 214 192 195 180 -7.9% 2.6%HELCO $M 33 53 45 42 45 41 40 39 -0.8% 1.3%MECO $M 39 51 47 43 43 40 42 34 -17.2% 0.4%KIUC $M 11 16 12 12 12 14 13 16 20.0% 1.4%Depreciation and amortizationState Total $M 137 156 192 205 210 224 235 244 3.8% 3.9%HECO $M 70 90 116 126 132 138 144 152 5.6% 5.4%HELCO $M 27 33 37 38 39 40 42 39 -6.6% 3.3%MECO $M 25 20 22 23 23 26 31 32 5.8% 1.6%KIUC $M 16 13 17 18 15 19 18 20 10.0% 0.6%Other utility operating expensesState Total $M 286 440 451 442 456 495 517 511 -1.3% 4.3%HECO $M 173 269 286 273 279 312 318 308 -3.2% 4.4%HELCO $M 45 61 63 64 66 69 73 70 -4.4% 3.6%MECO $M 43 72 65 68 71 77 85 86 1.5% 5.1%KIUC $M 25 38 37 37 40 38 41 46 12.5% 3.5%All othersState Total $M 777 1,167 1,163 1,155 1,163 1,222 1,266 1,269 0.2% 3.5%HECO $M 445 736 744 736 735 780 809 802 -0.9% 4.4%HELCO $M 126 178 176 175 181 186 186 186 0.1% 2.8%MECO $M 133 166 165 164 164 172 188 182 -3.1% 2.5%KIUC $M 73 86 78 81 82 84 83 99 18.2% 0.9%% of operating incomeState Total % 7.0% 5.8% 8.2% 9.3% 7.6% 8.0% 8.4% 10.2%HECO % 5.4% 5.3% 7.9% 9.0% 6.9% 7.7% 8.5% 10.2%HELCO % 7.3% 7.0% 9.0% 10.2% 9.5% 9.6% 8.6% 11.3%MECO % 8.8% 5.5% 9.1% 9.5% 8.2% 7.9% 8.2% 9.1%KIUC % 15.8% 9.9% 8.5% 9.4% 9.4% 8.0% 7.2% 9.9%% of taxesState Total % 11.4% 11.6% 12.8% 13.5% 13.1% 10.7% 10.8% 11.2%HECO % 11.4% 11.7% 13.0% 13.9% 13.4% 10.7% 10.9% 11.3%HELCO % 11.3% 12.1% 13.0% 13.4% 13.4% 11.1% 11.0% 11.9%MECO % 13.0% 11.6% 13.6% 14.0% 13.3% 11.0% 11.2% 10.8%KIUC % 8.3% 8.4% 8.5% 8.4% 8.4% 8.5% 8.5% 9.3%% of depreciation and amortizationState Total % 7.1% 4.8% 7.8% 9.2% 8.8% 8.3% 8.8% 10.1%HECO % 5.8% 4.1% 7.1% 8.6% 8.3% 7.7% 8.1% 9.6%HELCO % 9.1% 7.5% 10.7% 12.2% 11.8% 10.9% 11.7% 11.9%MECO % 8.1% 4.6% 6.4% 7.6% 7.3% 7.2% 8.3% 10.2%KIUC % 12.6% 7.1% 11.9% 12.9% 10.4% 11.9% 11.6% 11.7%% of other utility operating expensesState Total % 14.9% 13.4% 18.3% 19.8% 19.1% 18.4% 19.4% 21.2%HECO % 14.4% 12.2% 17.5% 18.6% 17.5% 17.4% 17.8% 19.3%HELCO % 15.3% 13.9% 18.4% 20.6% 20.0% 18.5% 20.4% 21.3%MECO % 14.1% 16.4% 18.9% 22.3% 22.0% 21.1% 22.8% 27.1%KIUC % 19.5% 20.4% 25.8% 25.7% 27.4% 23.2% 26.7% 27.5%Source: Hawaii Electric Utility Monthly Financial Reports.

45
5. Electricity Consumption by Sector Electricity sold by the utilities can be classified into three sectors. First is the residential
sector, which includes all residential customers’ and utility employees’ accounts. Second is the
industrial sector, which includes the large power customers. Third is the commercial sector, which
includes all other customers.
As shown in Figure 10, total electricity sold by the utilities in Hawaii was about 9,201
GWH in 2019, 2,621 GWH or 28.5 percent was sold to the residential sector, 2,953 GWH or 32.1
percent was sold to the commercial sector, and 3,627 GWH or 39.4 percent was sold to the
industrial sector. In 2020, total electricity sold by the utilities decreased 665 GWH; sales to the
residential sector increased 82 GWH, sales to the commercial sector decreased 370 GWH, and
sales to the industrial sector decreased 377 GWH. From 2005 to 2019, total electricity sold by the
utilities decreased 1,338 GWH; sales to the residential sector decreased 543 GWH or 40.6 percent
of the reduced sales, sales to the commercial sector decreased 512 GWH or 38.2 percent, and sales
to the industrial sector decreased 283 GWH or 21.1 percent.
Figure 10. Electricity Consumption by Sector in Hawaii
COM: 2,953 GWH (32.1%)
RES: -543 GWH (40.6%)
IND: 3,627 GWH (39.4%) Industrial: -377 GWH
Residential: 82 GWH
Commercial: -370 GWH COM: -512 GWH (38.2%)
IND: -283 GWH (21.1%)
TT: 9,201 GWH (100.0%) Total: -665 GWH TT: -1,338 GWH (100.0%)
RES: 2,621 GWH (28.5%)
* Customer-sited grid-connected PV.
PV*: 1,083 GWH PV*: 1,080 GWHPV*: 84 GWH
Electricity Sales: 2019 Changes: 2019-2020 Changes: 2005-2019
46
The larger decrease in residential electricity sales was due to the installation of customer-
sited solar systems. Since most of the customer-sited solar systems were installed by residential
customers, electricity sold to residential customers decreased more than that of the other sectors.
As shown in Table 26, from 2005 to 2019, total electricity sold decreased an average 1.0 percent
per year in Hawaii, while electricity sold to the residential sector decreased an average 1.3 percent
per year from 3,164 GWH to 2,621 GWH. In comparison, electricity sold to the commercial sector
and the industrial sector decreased an average 1.1 percent and 0.5 percent per year, respectively,
over the same period. In 2020, the residential sector’s electricity sales increased 3.1 percent, the
commercial and industrial sectors’ electricity sales decreased 12.5 percent and 10.4 percent,
respectively over the previous year.
At the county level, from 2005 to 2019, residential sales in the HECO system decreased
the most at 1.9 percent per year; followed by MECO (decreased 0.8 percent per year), and HELCO
(decreased 0.2 percent per year). Residential sales of KIUC increased 1.1 percent per year during
the same period.
It appears that the decrease in electricity sales in recent years was due to decreased
electricity sales per customer, rather than a decrease in the number of customers. As shown in
Table 27, from 2005 to 2019, total utility customers for the state increased an average 0.6 percent
per year. The number of residential customers increased 0.7 percent per year from 398,332
customers to 439,022 customers, the number of commercial customers decreased 0.04 percent per
year from 64,072 to 63,504, and the number of industrial customers increased 1.3 percent per year
from 684 to 800.
At the county utility level, the number of customers increased slower at HECO compared
with the other utilities. From 2005 to 2019, the share of HECO customers as a percentage of total
statewide utility customers decreased 2.2 percentage points, from 63.0 percent to 60.8 percent.

47
Table 26. Electricity Consumption by Sector and by Utility
Growth Avg. ann. Growth2005 2012 2015 2016 2017 2018 2019 2020 2020 2005 - 2019
Total State Total GWH 10,539 9,639 9,389 9,284 9,136 9,140 9,201 8,536 -7.2% -1.0%HECO GWH 7,721 6,976 6,754 6,660 6,549 6,526 6,563 6,183 -5.8% -1.2%HELCO GWH 1,116 1,085 1,065 1,067 1,047 1,064 1,050 978 -6.8% -0.4%MECO GWH 1,252 1,145 1,138 1,118 1,095 1,099 1,127 959 -15.0% -0.7%KIUC GWH 449 433 432 439 445 451 461 415 -9.9% 0.2%ResidentialState Total GWH 3,164 2,739 2,558 2,497 2,504 2,586 2,621 2,703 3.1% -1.3%HECO GWH 2,143 1,777 1,627 1,580 1,579 1,608 1,635 1,736 6.2% -1.9%HELCO GWH 423 410 388 386 392 420 409 411 0.5% -0.2%MECO GWH 442 395 381 366 364 383 395 378 -4.3% -0.8%KIUC GWH 156 157 162 164 169 175 181 177 -2.3% 1.1%CommercialState Total GWH 3,465 3,238 3,143 3,073 3,028 2,971 2,953 2,583 -12.5% -1.1%HECO GWH 2,480 2,320 2,221 2,171 2,146 2,111 2,103 1,854 -11.9% -1.2%HELCO GWH 453 430 432 423 404 393 381 336 -11.9% -1.2%MECO GWH 406 374 374 364 362 349 349 287 -17.8% -1.1%KIUC GWH 125 114 116 116 115 118 120 107 -11.1% -0.3%IndustrialState Total GWH 3,909 3,662 3,687 3,714 3,604 3,584 3,627 3,249 -10.4% -0.5%HECO GWH 3,098 2,879 2,906 2,909 2,824 2,807 2,825 2,593 -8.2% -0.7%HELCO GWH 240 245 244 259 251 251 259 231 -10.8% 0.6%MECO GWH 404 375 383 388 369 367 383 294 -23.4% -0.4%KIUC GWH 167 162 155 159 161 159 159 131 -17.6% -0.3%% of ResidentialState Total % 30.0% 28.4% 27.2% 26.9% 27.4% 28.3% 28.5% 31.7%HECO % 27.7% 25.5% 24.1% 23.7% 24.1% 24.6% 24.9% 28.1%HELCO % 37.9% 37.8% 36.5% 36.2% 37.4% 39.5% 39.0% 42.0%MECO % 35.3% 34.5% 33.5% 32.8% 33.2% 34.9% 35.1% 39.5%KIUC % 34.8% 36.3% 37.5% 37.3% 38.0% 38.7% 39.3% 42.7%% of CommercialState Total % 32.9% 33.6% 33.5% 33.1% 33.1% 32.5% 32.1% 30.3%HECO % 32.1% 33.3% 32.9% 32.6% 32.8% 32.3% 32.0% 30.0%HELCO % 40.6% 39.6% 40.6% 39.6% 38.6% 36.9% 36.3% 34.3%MECO % 32.4% 32.7% 32.9% 32.6% 33.1% 31.8% 30.9% 29.9%KIUC % 27.9% 26.4% 26.8% 26.4% 25.8% 26.1% 26.0% 25.7%County % of TotalState Total % 100.0% 100.0% 100.0% 100.0% 100.0% 100.0% 100.0% 100.0%HECO % 73.3% 72.4% 71.9% 71.7% 71.7% 71.4% 71.3% 72.4%HELCO % 10.6% 11.3% 11.3% 11.5% 11.5% 11.6% 11.4% 11.5%MECO % 11.9% 11.9% 12.1% 12.0% 12.0% 12.0% 12.3% 11.2%KIUC % 4.3% 4.5% 4.6% 4.7% 4.9% 4.9% 5.0% 4.9%County % of ResidentialState Total % 100.0% 100.0% 100.0% 100.0% 100.0% 100.0% 100.0% 100.0%HECO % 67.7% 64.9% 63.6% 63.3% 63.1% 62.2% 62.4% 64.2%HELCO % 13.4% 15.0% 15.2% 15.5% 15.7% 16.2% 15.6% 15.2%MECO % 14.0% 14.4% 14.9% 14.7% 14.5% 14.8% 15.1% 14.0%KIUC % 4.9% 5.7% 6.3% 6.6% 6.8% 6.8% 6.9% 6.6%Source: Hawaii Electric Utility Monthly Financial Reports.

48
Table 27. Number of Retail Customers by Sector in Hawaii
Growth Avg. ann. Growth2005 2012 2015 2016 2017 2018 2019 2020 2020 2005 - 2019
Total State Total 463,088 484,716 494,631 497,292 499,664 500,794 503,515 506,484 0.6% 0.6%HECO 291,580 297,529 302,958 304,261 304,948 305,456 306,368 307,378 0.3% 0.4%HELCO 73,835 81,792 84,308 85,029 85,925 85,758 86,566 87,357 0.9% 1.1%MECO 63,901 68,922 70,533 70,872 71,352 71,875 72,522 73,304 1.1% 0.9%KIUC 33,772 36,473 36,832 37,130 37,439 37,705 38,059 38,445 1.0% 0.9%ResidentialState Total 398,332 420,240 429,084 431,496 435,104 436,545 439,022 442,170 0.7% 0.7%HECO 257,804 264,047 269,207 270,451 271,065 271,807 272,590 273,777 0.4% 0.4%HELCO 60,699 69,099 71,216 71,892 74,274 74,288 75,142 75,958 1.1% 1.5%MECO 54,135 58,879 60,231 60,475 60,902 61,410 61,957 62,749 1.3% 1.0%KIUC 25,694 28,215 28,430 28,678 28,863 29,040 29,333 29,686 1.2% 1.0%CommercialState Total 64,072 63,772 64,769 65,005 63,783 63,434 63,676 63,504 -0.3% 0.0%HECO 33,416 33,116 33,333 33,373 33,453 33,201 33,325 33,150 -0.5% 0.0%HELCO 13,071 12,617 13,001 13,046 11,564 11,374 11,328 11,302 -0.2% -1.0%MECO 9,632 9,908 10,152 10,255 10,311 10,313 10,414 10,409 0.0% 0.6%KIUC 7,953 8,131 8,283 8,331 8,455 8,546 8,609 8,643 0.4% 0.6%IndustrialState Total 684 704 778 791 777 815 817 810 -0.9% 1.3%HECO 360 366 418 437 430 448 453 451 -0.4% 1.7%HELCO 65 76 91 91 87 96 96 97 1.0% 2.8%MECO 134 135 150 142 139 152 151 146 -3.3% 0.9%KIUC 125 127 119 121 121 119 117 116 -0.9% -0.5%% of ResidentialState Total % 86.0% 86.7% 86.7% 86.8% 87.1% 87.2% 87.2% 87.3%HECO % 88.4% 88.7% 88.9% 88.9% 88.9% 89.0% 89.0% 89.1%HELCO % 82.2% 84.5% 84.5% 84.5% 86.4% 86.6% 86.8% 87.0%MECO % 84.7% 85.4% 85.4% 85.3% 85.4% 85.4% 85.4% 85.6%KIUC % 76.1% 77.4% 77.2% 77.2% 77.1% 77.0% 77.1% 77.2%% of CommercialState Total % 13.8% 13.2% 13.1% 13.1% 12.8% 12.7% 12.6% 12.5%HECO % 11.5% 11.1% 11.0% 11.0% 11.0% 10.9% 10.9% 10.8%HELCO % 17.7% 15.4% 15.4% 15.3% 13.5% 13.3% 13.1% 12.9%MECO % 15.1% 14.4% 14.4% 14.5% 14.5% 14.3% 14.4% 14.2%KIUC % 23.5% 22.3% 22.5% 22.4% 22.6% 22.7% 22.6% 22.5%County % of TotalState Total % 100.0% 100.0% 100.0% 100.0% 100.0% 100.0% 100.0% 100.0%HECO % 63.0% 61.4% 61.2% 61.2% 61.0% 61.0% 60.8% 60.7%HELCO % 15.9% 16.9% 17.0% 17.1% 17.2% 17.1% 17.2% 17.2%MECO % 13.8% 14.2% 14.3% 14.3% 14.3% 14.4% 14.4% 14.5%KIUC % 7.3% 7.5% 7.4% 7.5% 7.5% 7.5% 7.6% 7.6%Source: Hawaii Electric Utility Monthly Financial Reports.

49
From 2005 to 2019, electricity sales per customer in Hawaii decreased an annual average
of 1.6 percent from 22,757 kWh to 18,273 kWh (Table 28). Annual electricity sales per residential
customer decreased an average 2.0 percent per year, from 7,943 kWh to 5,969 kWh; annual
electricity sales per commercial customer decreased an average 1.1 percent per year, from 54,081
kWh to 46,382 kWh; and annual electricity sales by industrial customers decreased 1.8 percent per
year, from 5,715,476 kWh to 4,439,059 kWh.
At the county level, HECO had the highest annual electricity consumption per residential
customer in 2020 at 6,340 kWh. This was followed by MECO at 6,028 kWh, KIUC at 5,969 kWh,
and HELCO at 5,416 kWh. However, the difference between the utilities’ average residential
electricity consumption per customer has been decreasing over time, with HECO’s residential
consumption per customer decreasing faster than others. From 2005 to 2019, residential
consumption per customer decreased an average 2.3 percent per year at HECO, decreased 1.8
percent per year at HELCO, decreased 1.7 percent per year at MECO, and increased 0.1 percent
per year at KIUC.
Table 28. Annual Electricity Consumption per Customer by Sector
Growth Avg. ann. Growth2005 2012 2015 2016 2017 2018 2019 2020 2020 2005 - 2019
Total State Total kWh/C 22,757 19,886 18,981 18,670 18,283 18,251 18,273 16,852 -7.8% -1.6%HECO kWh/C 26,481 23,446 22,294 21,890 21,475 21,364 21,422 20,116 -6.1% -1.5%HELCO kWh/C 15,121 13,267 12,630 12,553 12,184 12,408 12,124 11,200 -7.6% -1.6%MECO kWh/C 19,595 16,611 16,129 15,771 15,343 15,291 15,545 13,078 -15.9% -1.6%KIUC kWh/C 13,284 11,876 11,731 11,826 11,889 11,964 12,105 10,802 -10.8% -0.7%ResidentialState Total kWh/C 7,943 6,518 5,962 5,786 5,755 5,923 5,969 6,112 2.4% -2.0%HECO kWh/C 8,311 6,729 6,043 5,844 5,824 5,915 5,998 6,340 5.7% -2.3%HELCO kWh/C 6,977 5,931 5,453 5,369 5,278 5,652 5,445 5,416 -0.5% -1.8%MECO kWh/C 8,165 6,715 6,328 6,058 5,972 6,237 6,378 6,028 -5.5% -1.7%KIUC kWh/C 6,072 5,574 5,692 5,717 5,867 6,017 6,180 5,969 -3.4% 0.1%CommercialState Total kWh/C 54,081 50,780 48,524 47,279 47,466 46,832 46,382 40,682 -12.3% -1.1%HECO kWh/C 74,227 70,053 66,641 65,044 64,153 63,573 63,117 55,930 -11.4% -1.2%HELCO kWh/C 34,685 34,095 33,234 32,417 34,954 34,559 33,671 29,731 -11.7% -0.2%MECO kWh/C 42,163 37,758 36,816 35,480 35,140 33,852 33,481 27,545 -17.7% -1.6%KIUC kWh/C 15,749 14,046 13,967 13,911 13,587 13,794 13,935 12,337 -11.5% -0.9%IndustrialState Total kWh/C 5,715,476 5,201,000 4,739,613 4,695,780 4,638,570 4,397,099 4,439,059 4,011,706 -9.6% -1.8%HECO kWh/C 8,606,672 7,866,900 6,951,690 6,656,945 6,567,020 6,265,913 6,235,636 5,749,926 -7.8% -2.3%HELCO kWh/C 3,686,703 3,225,790 2,685,072 2,840,736 2,881,831 2,615,831 2,697,867 2,381,936 -11.7% -2.2%MECO kWh/C 3,014,884 2,780,620 2,551,411 2,729,124 2,652,958 2,413,680 2,539,678 2,011,899 -20.8% -1.2%KIUC kWh/C 1,338,824 1,273,029 1,298,817 1,315,987 1,329,504 1,332,000 1,363,084 1,133,453 -16.8% 0.1%Source: Hawaii Electric Utility Monthly Financial Reports.

50
Due to rapid growth of electricity prices from 2005 to 2012, total revenue from retail
electricity increased substantially. This occurred in spite of a decrease in the kWh of electricity
sold over the same period. From 2005 to 2012, the total revenue generated from retail electricity
sales increased an average 7.9 percent per year for the state, revenue from residential sales
increased an average 6.6 percent per year from $653 million to $1,023 million, and revenue from
commercial and industrial sales (separate revenues from the commercial sector and the industrial
sector are not available in the MFR) increased an average 8.5 percent per year from $1,274 million
to $2,258 million.
Table 29. Revenue from Retail Electricity Sales by Sector in Hawaii
Growth Avg. ann. Growth2005 2012 2015 2016 2017 2018 2019 2020 2020 2005 - 2019
Total State Total $M 1,927 3,281 2,467 2,226 2,395 2,688 2,672 2,408 -9.9% 2.4%HECO $M 1,201 2,217 1,636 1,466 1,592 1,790 1,785 1,592 -10.8% 2.9%HELCO $M 294 439 344 310 332 372 360 329 -8.6% 1.5%MECO $M 302 437 344 307 324 365 372 318 -14.6% 1.5%KIUC $M 130 188 143 143 147 162 154 169 9.3% 1.2%ResidentialState Total $M 653 1,023 765 695 750 853 855 845 -1.2% 1.9%HECO $M 379 624 456 412 445 501 508 499 -1.7% 2.1%HELCO $M 118 174 135 122 134 156 149 145 -3.2% 1.7%MECO $M 110 154 119 105 112 131 134 127 -5.9% 1.4%KIUC $M 46 71 56 56 58 65 63 75 18.0% 2.3%OthersState Total $M 1,274 2,258 1,701 1,531 1,645 1,835 1,817 1,564 -13.9% 2.6%HECO $M 823 1,593 1,180 1,054 1,147 1,288 1,277 1,094 -14.4% 3.2%HELCO $M 176 265 209 188 198 216 211 185 -12.4% 1.3%MECO $M 192 282 224 202 212 234 238 191 -19.5% 1.6%KIUC $M 84 118 87 87 89 97 91 94 3.3% 0.6%% of ResidentialState Total % 33.9% 31.2% 31.0% 31.2% 31.3% 31.7% 32.0% 35.1%HECO % 31.5% 28.1% 27.9% 28.1% 28.0% 28.0% 28.4% 31.3%HELCO % 40.2% 39.6% 39.1% 39.3% 40.4% 41.9% 41.5% 43.9%MECO % 36.5% 35.3% 34.8% 34.3% 34.7% 35.9% 36.1% 39.8%KIUC % 35.5% 37.6% 38.8% 39.0% 39.7% 40.2% 40.9% 44.2%County % of TotalState Total % 100.0% 100.0% 100.0% 100.0% 100.0% 100.0% 100.0% 100.0%HECO % 62.3% 67.6% 66.3% 65.9% 66.5% 66.6% 66.8% 66.1%HELCO % 15.2% 13.4% 13.9% 13.9% 13.8% 13.8% 13.5% 13.7%MECO % 15.7% 13.3% 13.9% 13.8% 13.5% 13.6% 13.9% 13.2%KIUC % 6.8% 5.7% 5.8% 6.4% 6.2% 6.0% 5.8% 7.0%Source: Hawaii Electric Utility Monthly Financial Reports.

51
The higher growth in commercial and industrial electricity revenue, compared with
residential revenue from 2005 to 2012, was due to the higher growth in commercial and industrial
electricity prices. From 2005 to 2012, the average electricity price increased an average of 9.3
percent per year, from 18.3 cents per kWh to 34.0 cents per kWh. For the 2005 to 2012 period,
the average residential electricity price increased 8.8 percent per year, from 20.6 cents per kWh to
37.3 cents per kWh, and the average commercial and industrial electricity price increased 9.6
percent per year, from 17.3 cents per kWh to 32.7 cents per kWh (Table 30).
From 2012 to 2016, total revenue from electricity sales decreased 9.2 percent per year.
During the same period, the average residential electricity price decreased 7.1 percent and the
average commercial and industrial electricity price decreased 8.9 percent.
From 2016 to 2018, total revenue from electricity sales increased 9.9 percent per year,
revenue from residential sales increased 10.8 percent per year, and revenue from commercial and
industrial sales increased 9.5 percent per year.
In 2019, total revenue from electricity sales decreased slightly. In 2020, total revenue from
electricity sales decreased 13.9 percent, revenue from residential sales decreased 1.2 percent per
year, and revenue from commercial and industrial sales decreased 13.9 percent per year.
Table 30. Average Electricity Price by County in Hawaii
Growth Avg. ann. Growth2005 2012 2015 2016 2017 2018 2019 2020 2020 2005 - 2019
Total State Total $/kWh 0.183 0.340 0.263 0.240 0.262 0.294 0.290 0.282 -2.8% 3.4%HECO $/kWh 0.156 0.318 0.242 0.220 0.243 0.274 0.272 0.258 -5.3% 4.1%HELCO $/kWh 0.263 0.405 0.323 0.290 0.317 0.349 0.343 0.336 -1.9% 1.9%MECO $/kWh 0.241 0.382 0.302 0.274 0.296 0.332 0.330 0.332 0.5% 2.3%KIUC $/kWh 0.291 0.435 0.331 0.326 0.331 0.360 0.335 0.407 21.2% 1.0%ResidentialState Total $/kWh 0.206 0.373 0.299 0.278 0.300 0.330 0.326 0.313 -4.2% 3.3%HECO $/kWh 0.177 0.351 0.280 0.261 0.282 0.312 0.310 0.287 -7.4% 4.1%HELCO $/kWh 0.279 0.425 0.346 0.315 0.342 0.371 0.365 0.352 -3.7% 1.9%MECO $/kWh 0.249 0.391 0.313 0.287 0.309 0.342 0.340 0.335 -1.6% 2.2%KIUC $/kWh 0.297 0.450 0.343 0.340 0.345 0.373 0.349 0.421 20.7% 1.2%OthersState Total $/kWh 0.173 0.327 0.249 0.226 0.248 0.280 0.276 0.268 -2.9% 3.4%HECO $/kWh 0.147 0.306 0.230 0.208 0.231 0.262 0.259 0.246 -5.1% 4.1%HELCO $/kWh 0.253 0.393 0.309 0.276 0.302 0.335 0.329 0.325 -1.0% 1.9%MECO $/kWh 0.236 0.377 0.296 0.268 0.289 0.327 0.325 0.330 1.6% 2.3%KIUC $/kWh 0.287 0.426 0.324 0.317 0.322 0.351 0.327 0.396 21.2% 0.9%Source: Hawaii Electric Utility Monthly Financial Reports.

52
Table 31 shows the statewide average electricity price by sector in Hawaii, sourced from
EIA data. The data shows prices by sector from 1990 to 2019 are provided.
Table 31. Average Electricity Price by Sector in Hawaii
Residential Commercial Industrial Other TotalYear Cents/kWh Cents/kWh Cents/kWh Cents/kWh Cents/kWh
1990 10.26 10.18 7.57 9.40 9.021991 10.52 10.33 7.71 9.56 9.221992 10.90 10.53 7.83 9.71 9.441993 12.28 11.68 8.95 11.26 10.661994 12.45 11.67 8.82 11.21 10.681995 13.32 12.16 9.27 12.11 11.291996 14.26 12.99 10.03 12.91 12.121997 14.80 13.26 10.32 13.20 12.491998 13.82 12.31 9.41 12.28 11.561999 14.30 12.74 9.70 12.66 11.972000 16.41 14.81 11.69 14.76 14.032001 16.34 14.81 11.68 16.81 14.052002 15.63 14.11 11.02 16.85 13.392003 16.73 15.02 12.20 NA 14.472004 18.06 16.19 13.35 NA 15.702005 20.70 19.04 15.79 NA 18.332006 23.35 21.42 17.96 NA 20.722007 24.12 21.91 18.38 NA 21.292008 32.50 29.72 26.05 NA 29.202009 24.20 21.86 18.14 NA 21.212010 28.10 25.93 21.94 NA 25.122011 34.68 32.37 28.40 NA 31.592012 37.34 34.88 30.82 NA 34.042013 36.98 34.05 29.87 NA 33.262014 37.04 34.21 30.22 NA 33.432015 29.60 26.93 23.06 NA 26.172016 27.47 24.64 20.69 NA 23.872017 29.50 26.77 22.92 NA 26.052018 32.47 29.90 26.10 NA 29.182019 32.06 29.23 25.76 NA 28.72
Source: Energy Information Administration, State Energy Data System

53
6. Conclusions
In recent years, electricity generated by utilities as a percentage of the total electricity
generated by the electric power industry has decreased significantly. From 1990 to 2019, the share
of utility generated electricity decreased 28.5 percentage points, from 82.4 percent to 53.9 percent.
Before 2015, the average cost of electricity purchased by the utility was below the average fuel
cost of utility generated electricity in most of the years, the increased share of purchased electricity
has helped reduce the cost of electricity sold by the utility. Since 2015, however, the average cost
of electricity purchased by the utility was above the average fuel cost of utility generated electricity
due to decreased petroleum prices.
In 2019, gross generation in Hawaii was estimated to be about 11,273 GWH. Not all the
electricity generated was sold to the utility customers. In 2019, about 5.0 percent of the gross
generation in Hawaii was consumed by the power stations. In addition, about 3.8 percent of gross
generation was lost during electricity transmission and distribution, and about 9.6 percent of gross
generation was generated and consumed by the customers. Therefore, only about 9,200 GWH or
82.0 percent of the gross generation was sold to utility customers.
From 2005 to 2012, the average fuel cost to generate one kWh of net electricity by the
utilities increased 12.7 percent per year from 10.0 cents to 23.1 cents for the state. During the
same period the average cost of purchased electricity increased only 7.0 percent per year, from
11.0 cents to 17.7 cents. In 2005, the average cost of purchased electricity was above the average
fuel cost of the utilities. In 2012, the average cost of purchased electricity was about 23.4 percent
below the average fuel cost of the utilities in Hawaii. Since 2015, however, the average cost of
purchased electricity was above the average fuel cost of the utilities again. In 2019 and 2020, the
average cost of purchased electricity was 6.6 percent and 37.3 percent above the average fuel cost
of the utility generated electricity, respectively.
Among the four utility companies, the average cost of purchased electricity in 2020 was
the lowest at HECO at about 14.1 cents/kWh. The lower average cost of purchased power at
HECO was partially due to the lower purchased power cost from coal generated electricity.
The relatively slower growth of purchased power prices from 2005 to 2012 was due to the
rapid growth of petroleum prices and a higher share of electricity being generated from non-
petroleum sources including coal and renewable energy by non-utility producers. In 2012, about
54
95.6 percent of utility generated electricity was from petroleum; in contrast, only 39.0 percent of
non-utility generated electricity was from petroleum.
The average unit cost of petroleum used for utility electricity generation increased rapidly
from 2005 to 2012, with the growth rate being significantly higher than the growth rate of crude
oil prices. In this period, the average unit petroleum cost for the four electric utilities in Hawaii
increased an average of 13.3 percent per year from $57.57 per BBL to $137.74 per BBL. Fuel oil
costs increased an average 14.9 percent per year from $51.22 per BBL to $135.72 per BBL, and
diesel oil costs increased an average 9.3 percent per year from $77.36 per BBL to $143.93 per
BBL. In comparison, the average crude oil price increased an average 7.6 percent per year during
the same period. From 2012 to 2016, the unit fuel oil cost decreased 22.5 percent per year on
average, and the unit diesel cost decreased 17.0 percent per year. From 2016 to 2018, however,
the unit fuel oil cost increased 30.5 percent per year, and the unit diesel cost increased 20.2 percent
per year. In 2019 and 2020, the unit petroleum cost increased 6.7 percent and 23.0 percent,
respectively from the previous year.
In addition to fuel and purchased power costs, the cost of electricity is also affected by four
other components. The operating income of the utilities accounted for about 10.2 percent, taxes
accounted for about 11.2 percent, depreciation and amortization accounted for about 10.1 percent,
and other utility operating expenses accounted for about 21.2 percent of the total electricity cost
paid by consumers in 2020.
Total electricity sold by utilities decreased over the period analyzed. A large part of this
decrease was due to reduced utility electricity sales caused by the installation of customer-sited
solar systems. From 2005 to 2019, total electricity sold by the utilities decreased 1,338 GWH;
sales to the residential sector decreased 543 GWH or 40.6 percent of the reduced sales, sales to the
commercial sector decreased 512 GWH or 38.2 percent, and sales to the industrial sector decreased
283 GWH or 21.1 percent.
The analysis showed that the decrease in electricity sales was due to a decrease in electricity
sales per customer, rather than a decrease in the number of customers. This is a statement
appearing in preceding reports and is generally true to apply to the year of 2019 and 2020.
However, the electricity sales were further decreased by the pandemic in 2020, due to the reduced
activities in the commercial and industrial sectors.
55
In 2020, total utility generation decreased by 7.0% from 2019, compared to the annual
average 2.0% decrease of utility generation from 2005 to 2019. In 2020, the electricity purchased
by utilities decreased by 4.3% from 2019, which went against the trend that the purchased
electricity grew at an annual rate of 0.3% from 2005 to 2019. Compared to 2019, in 2020, total
electricity sold decreased by 7.2%; revenues from electricity sales decreased by 9.9%; fuel and
purchased power cost reduced by 17.9%; electricity sold to the residential sector increased by
3.1%; and electricity sold to the commercial and industrial sectors decreased by 12.5% and 10.4%,
respectively.