hawkesbury-nepean flood damages assessment: …...molino stewart pty ltd abn 95 571 253 092 acn 067...
TRANSCRIPT
Hawkesbury-Nepean
Flood Damages
Assessment: Final Report

MOLINO STEWART PTY LTD ABN 95 571 253 092 ACN 067 774 332
PO BOX 614, PARRAMATTA CBD BC, PARRAMATTA NSW 2124 TEL: (02) 9354 0300 FAX: (02) 9893 9806
www.molinostewart.com.au
Hawkesbury-Nepean Flood Damages Assessment
FINAL REPORT
for
Infrastructure NSW
by
Molino Stewart Pty Ltd
ACN 067 774 332
SEPTEMBER 2012

Infrastructure NSW
DOCUMENT CONTROL
Document Reference 0528 HN_Flood_Damages_Report_Draft v1.3.docx
Project Hawkesbury-Nepean Flood Damages Assessment
Document Type Draft
Author Tim Morrison; Steven Molino
REVISION HISTORY
Date Version Name Comments
15/06/2012 Ver 1.1 Tim Morrison First draft for internal review
26/06/2012 Ver 1.2 Tim Morrison Revised Draft
27/06/2012 Ver 1.3 Steven Molino Draft Report for client review
11/07/2012 Ver 1.4 Steven Molino Final Report incorporating INSW comments
26/07/2012 Ver 1.6 Steven Molino Final Report with additional information in Section 4.1
DOCUMENT APPROVAL
For Molino Stewart
Name Steven Molino
Position Principal
For Infrastructure NSW
Name Nick Saphin
Position
Hawkesbury-Nepean Flood Damages Assessment i
EXECUTIVE SUMMARY
Infrastructure NSW has decided as part of its
development of the 20 year State
Infrastructure Strategy to review the issue of
whether there is benefit in investigating the
provision of flood mitigation capacity at
Warragamba Dam.
This report sets out a preliminary investigation
which draws heavily on previous work,
particularly the 1995 Warragamba Flood
Mitigation Dam EIS. However, since the 1995
EIS was produced, a number of changes have
occurred in development on the floodplain,
data availability and flood damage estimation
techniques. These updates are reflected in the
methodology for this project.
The flood damages in the Hawkesbury-
Nepean Valley have been calculated under
existing conditions and conditions if a 23m
raising of Warragamba Dam were undertaken
for flood mitigation.
The largest flood in living memory to have
occurred in the Valley reached 15.0m above
sea level at Windsor in 1961 and has about a 1
in 40 chance of occurring again in any year.
The largest flood recorded in the Valley
occurred in 1867 and reached 19.3m at
Windsor and has roughly a 1 in 200 chance of
occurring in any year. This is a similar
probability to some of the floods in Victoria in
early 2011. There is sedimentary evidence of
even bigger floods having occurred before the
arrival of Europeans. By way of comparison,
some of the 2011 Queensland floods have
been reported to have had a 1 in 1,000 chance
of occurrence per year. A flood with that
probability would reach 21.7m above sea level.
Many of the houses built in the Valley up until
the mid 1990s have floor levels at 16m and
much older houses are even lower
A repeat of the 1867 flood, which was roughly
equivalent to a 1 in 200 year event, would
flood about 7,000 homes and cause significant
structural damage to about 1,200 of them. It
would flood more than 1,600 businesses and
cause approximately $3 billion in damages. At
least 26,000 people would occupy the
buildings exposed to flooding and more than
50,000 people would have to evacuate from
the Valley because of the risks associated with
isolation and further rises in river levels.
Numerous flood mitigation strategies were
investigated in the 1990s including structural
works such as river straightening, levees,
dredging and flood storages. Of these, a flood
mitigation dam at Warragamba was found to
be the most cost effective and have the least
environmental impacts. Other options such as
alternative spillway gate operation were found
to have minimal flood mitigation benefit.
Modifying assets in the floodplain including
houses and infrastructure to make them less
susceptible to flooding were found to be only
worthwhile for new development or
redevelopments. There have been significant
investments in improved emergency planning
to reduce risk to lives but significant life and
property risks remain.
Were a flood mitigation dam to proceed with
an additional 23 m of air space, the cost of the
1867 flood would be reduced to less than $200
million dollars and place less than 1,000
people at risk.
When the full range of floods and their
probabilities are considered, the average
annual damages of flooding is the Valley is
expected to be in the order of $70 million. This
estimate does not include the cost of complete
building failure, which in a repeat of the 1867
flood may be the outcome for more than 1,200
homes. Should development within the valley
continue, as is planned, then these flood
damages will increase.
A 23m raising of Warragamba Dam to provide
flood mitigation would reduce the annual
average damages to less than $20m. When
these annualised damages are reduced to a
present value using a 7% discount rate and a
50 year benefit period, the total benefits of
constructing the mitigation dam are estimated
to be approximately $760 million.
In addition to the tangible benefits, there are a
range of intangible benefits that have not been
included in the benefit cost ratio. These include
reducing:
the population at risk, with the average number of at risk people per year reducing from 560 to 50.
ii Infrastructure NSW
the probability of mass evacuations would reduce from about a 1 in 100 chance per year to less than 1 in 800.
untreated sewage discharging into the River for weeks from about a 1 in 500 chance per year at Penrith and a 1 in 100 chance per year at Richmond and Windsor to less than a 1 in 1,000 chance per year at both of these locations.
the number of commercial and industrial premises that are flooded in a repeat of the 1867 flood from more than 1,600 to less than 100. Many flood businesses are unlikely to recover after the flood and will go into liquidation, it is also likely that many of the employees will also reside in the valley and are likely to lose their job as a result.
Dam construction cost estimates from 1995
were inflated to December 2011 dollars and it
was estimated that the 23m concrete raising of
Warragamba Dam would cost $411 million.
Using a conservative payment schedule over
five years would result in a present cost of
$346 million and a benefit cost ratio of 2.2.
In an extreme flood, with a probability similar to
some of the 2011 Queensland floods,
damages could exceed $8 billion, which would
create a significant cash flow and balance
sheet problem for the state economy.
An average annual insurance premium of more
than $1,000 would need to be paid by each of
the 19,000 households below the PMF just to
cover their own flood losses, excluding the
cost of rebuilding dwellings which fail
structurally.
Sensitivity analyses using lower benefits,
higher costs and various discount rates
suggest that the project is likely to have a
benefit cost ratio of greater than 1.0. When
building failures are accounted for in the cost
of damages the benefit cost ratio is estimated
to exceed 3.0. These are summarised in the
table on the following pages.
The economic worth of the project will increase
if committed and planned development above
the current planning level in the floodplain
proceeds. Conversely, the reduced flood
damages and other benefits will be eroded
should future development be permitted below
the current planning level after the mitigation
dam is built. However the additional
development would carry other benefits which
would need to be weighed up against the
reduction in flood damage benefits.
The dam would also deliver some significant
intangible social, economic and environmental
benefits because of the reduced risk of
extended failure of critical electricity, sewerage
and other assets. It would also have some
intangible costs including the periodic,
temporary flooding of up to 75km2 of national
parks and wilderness areas in the Blue
Mountains World Heritage Area upstream of
the dam, increased durations of minor flooding
downstream which could have environmental
impacts and construction impacts on
Warragamba Village and surrounding areas
during its 5 year construction.
This project represents a ‘first pass’ at
calculating the benefits of a mitigation dam.
Due to the timing constraints, a number of
assumptions have been made and data has
limited the precision of many of the
calculations. Should a flood mitigation dam be
investigated further, it is recommended that
data and modelling be updated to provide
more accurate estimates of the likely costs and
benefits.
Hawkesbury-Nepean Flood Damages Assessment i
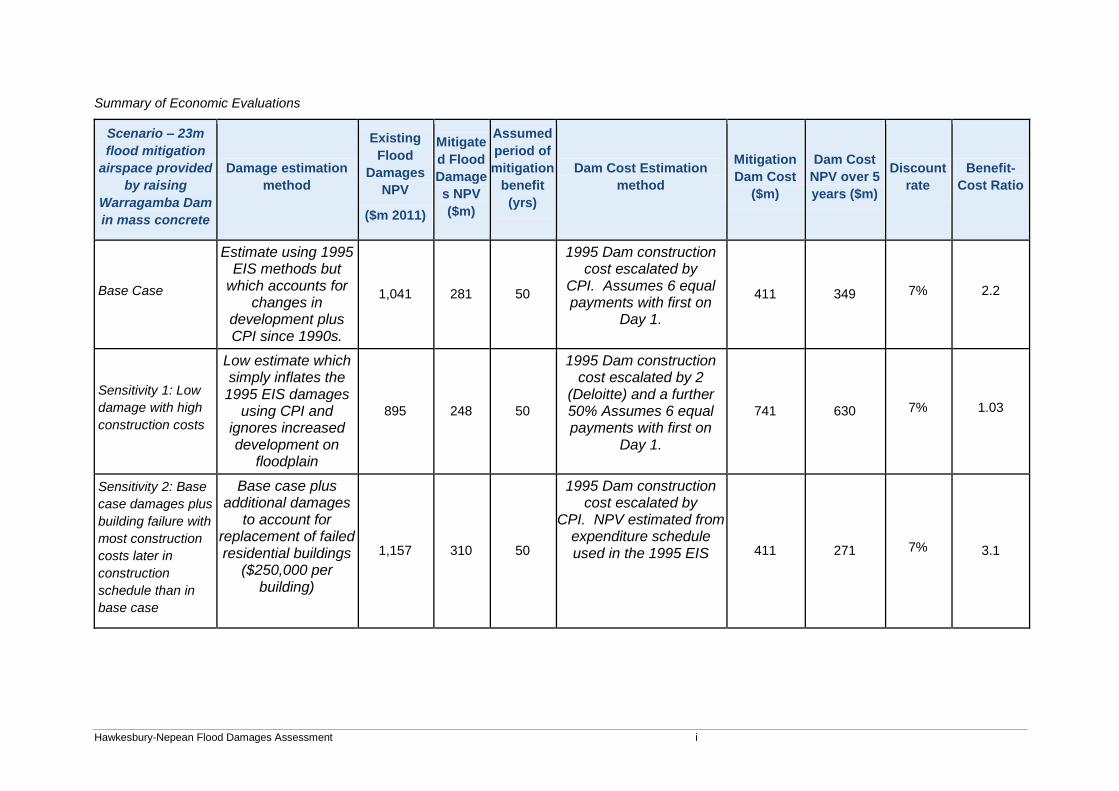
Summary of Economic Evaluations
Scenario – 23m
flood mitigation
airspace provided
by raising
Warragamba Dam
in mass concrete
Damage estimation
method
Existing
Flood
Damages
NPV
($m 2011)
Mitigate
d Flood
Damage
s NPV
($m)
Assumed
period of
mitigation
benefit
(yrs)
Dam Cost Estimation
method
Mitigation
Dam Cost
($m)
Dam Cost
NPV over 5
years ($m)
Discount
rate
Benefit-
Cost Ratio
Base Case
Estimate using 1995 EIS methods but
which accounts for changes in
development plus CPI since 1990s.
1,041 281 50
1995 Dam construction cost escalated by
CPI. Assumes 6 equal payments with first on
Day 1.
411 349 7% 2.2
Sensitivity 1: Low
damage with high
construction costs
Low estimate which simply inflates the 1995 EIS damages
using CPI and ignores increased development on
floodplain
895 248 50
1995 Dam construction cost escalated by 2
(Deloitte) and a further 50% Assumes 6 equal payments with first on
Day 1.
741 630 7% 1.03
Sensitivity 2: Base
case damages plus
building failure with
most construction
costs later in
construction
schedule than in
base case
Base case plus additional damages
to account for replacement of failed residential buildings
($250,000 per building)
1,157 310 50
1995 Dam construction cost escalated by
CPI. NPV estimated from expenditure schedule used in the 1995 EIS 411 271 7% 3.1

ii Infrastructure NSW
Scenario – 23m
flood mitigation
airspace provided
by raising
Warragamba Dam
in mass concrete
Damage estimation
method
Existing
Flood
Damages
NPV
($m 2011)
Mitigate
d Flood
Damage
s NPV
($m)
Assumed
period of
mitigation
benefit
(yrs)
Dam Cost Estimation
method
Mitigation
Dam Cost
($m)
Dam Cost
NPV over 5
years ($m)
Discount
rate
Benefit-
Cost Ratio
Sensitivity 3:
Applying 4%
discount rate to
Base Case
Damages and Dam
cost
Estimate using 1995 EIS methods but
which accounts for changes in
development plus CPI since 1990s.
1,582 426 50
1995 Dam construction cost escalated by
CPI. Assumes 6 equal payments with first on
Day 1.
411 373 4% 3.1
Sensitivity 4:
Applying 11%
discount rate to
Base Case
Damages and Dam
cost
Estimate using 1995 EIS methods but
which accounts for changes in
development plus CPI since 1990s.
706 190 50
1995 Dam construction cost escalated by
CPI. Assumes 6 equal payments with first on
Day 1.
411 321 11% 1.6
Hawkesbury-Nepean Flood Damages Assessment iii
CONTENTS
1 INTRODUCTION 1
1.1 Project Background 1
1.2 The Hawkesbury-Nepean Catchment 1
1.3 Flooding in the Valley 1
1.4 Development History 5
1.5 This Report 5
2 FLOOD DAMAGE ASSESSMENT 6
2.1 Flood Damages 6
2.1.1 Damage Categories 6
2.1.2 Stage Damage Curves 6
2.1.3 General Approach 6
2.1.4 Data Sources 8
2.1.5 Assumptions and Limitations 9
2.2 Asset Categories 10
2.2.1 Residential Properties 10
2.2.2 Commercial & Industrial Properties 11
2.2.3 Caravans 12
2.2.4 Motor Vehicles 12
2.2.5 Agriculture 12
2.2.6 Roads & Bridges 16
2.2.7 Railways 17
2.2.8 Water & Sewerage 17
2.2.9 Electricity 22
2.2.10 Telephone 22
2.2.11 Gas & Oil 24
2.2.12 Sand & Gravel 24
2.2.13 Defence 24
2.2.14 Erosion 24
2.2.15 Emergency Services 25
2.3 Intangible damages 25
3 HAWKESBURY NEPEAN FLOOD DAMAGES 27
3.1 Direct Tangible Damages 27
3.2 Indirect Tangible Damages 27
3.3 Total Tangible Damages 31
3.4 Intangible Damages 31
3.4.1 Population at Risk 32
3.4.2 Intangible Damages Proportional to PAR 34
3.4.3 Intangible Socio-Economic Damages 34
3.4.4 Environmental Damages 35
iv Infrastructure NSW
4 FLOOD MITIGATION 38
4.1 Mitigation Options 38
4.1.1 Alternative Strategies 38
4.1.2 Warragamba Mitigation Dam Options 39
4.2 Changes in Flooding 41
4.2.1 Reduction in Downstream Flood Levels 41
4.2.2 Increase in downstream flood durations 41
4.2.3 Change in Downstream ARIs 44
4.2.4 Increase in upstream flood levels and durations 44
4.3 Changes in Damages 46
4.3.1 Tangible Damages 46
4.3.2 Intangible Damages 46
4.3.3 Intangible Costs 47
4.3.4 Potential Environmental Impacts 47
5 PRELIMINARY ECONOMIC ANALYSIS 50
5.1 Mitigation Dam Benefits 50
5.2 Dam Costs 50
5.3 Other Costs 51
5.4 Economic Worth 51
5.5 Sensitivity Analyses 51
5.5.1 Sensitivity 1 51
5.5.2 Sensitivity 2 51
5.5.3 Sensitivity 3 52
5.5.4 Sensitivity 4 52
5.6 Discussion 52
6 CONCLUSIONS AND RECOMMENDATIONS 55
APPENDICES
Appendix A – Intangible Damages Summary
Appendix B - Glossary
Hawkesbury-Nepean Flood Damages Assessment v
LIST OF TABLES
Table 1 Flood History 3
Table 2 Flood Damage Categories 7
Table 3 Direct Damages ($m 2011) 28
Table 4 Indirect Damages ($m 2011) 29
Table 5 Residential Flooding Summary 30
Table 6 Event total damage and AAD 31
Table 7 Population at Risk 32
Table 8 Population at risk who are unable to evacuate 33
Table 9 Commercial Premises Flooded (1988 Development) 35
Table 10: Premises without electricity 2010 36
Table 11: Restoration of Treatment Plants 37
Table 12: ML of untreated or partially treated effluent 37
Table 13 Mitigation Option (1995 EIS) 40
Table 14 Reduction in Flood Levels - Penrith 41
Table 15 Reduction in Flood Levels - Windsor 41
Table 16 Unmitigated ARI equivalent 44
Table 17 Mitigated ARI equivalent 44
Table 18 Mitigation Dam Flood Damages 46
Table 19 Mitigation Dam PAR 47
Table 20 Benefit Cost Ratios for the base case and sensitivity scenarios tested. 53
LIST OF FIGURES
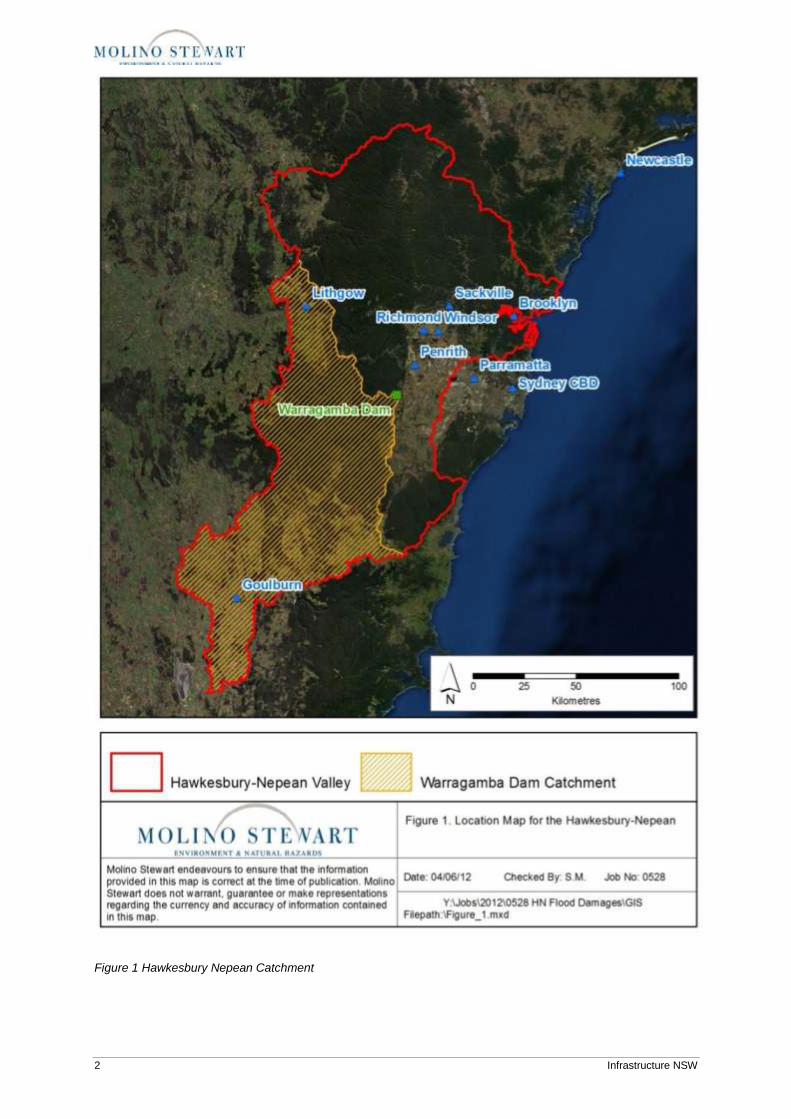
Figure 1 Hawkesbury Nepean Catchment 2
Figure 2: Flood Extents 4
Figure 3 Typical Residential Stage Damage Curve (Extract from the OEH standard residential calculator with default values applied) 7
Figure 4 Changes to Rural and Urban Development since 1988 (Southern Extent including Emu Plains, Penrith, St Marys and Riverstone) 13
Figure 5 Changes to Rural and Urban Development since 1988 (Northern Extent including Richmond and Windsor) 14
Figure 6 Future Development 15
Figure 7 Evacuation Routes and Future Road Proposals 18
Figure 8 Rail infrastructure located on the floodplain 19
Figure 9 Sydney Water Potable Water Network 20
Figure 10 Sydney Water, Hawkesbury City Council and ADF Sewerage Infrastructure 21
Figure 11 Terrestrial Telecommunications infrastructure on the floodplain 23
Figure 12 Emergency Service facilities located on the floodplain 26
Figure 13: Comparison of flood flows 42
Figure 14: Impacts of mitigation on Downstream levels and durations 43
Figure 15: Impact on upstream flood levels 45
Figure 16: Changes in tangible flood damages 48
Figure 17. Simulated Water Level at Windsor Bridge, 1956. Extracted from the 1995 EIS. 49


Hawkesbury-Nepean Flood Damages Assessment 1
1 INTRODUCTION
1.1 PROJECT BACKGROUND
Warragamba Dam is the largest concrete dam
in Australia and supplies the majority of
Sydney’s drinking water supply. Downstream
of the dam, in the Hawkesbury-Nepean
floodplain, significant development has
occurred that will be flooded in large rainfall
events.
The Hawkesbury-Nepean is arguably one of
the most over-developed and at risk
floodplains in Australia. A repeat of the 1867
flood in the Valley is expected to flood around
7,000 homes of which 1,000 would be likely to
fail. The SES has plans to evacuate more than
60,000 people in an extreme flood.
The upgrade of Warragamba Dam to
incorporate flood mitigation was proposed and
investigated in the early 1990’s. These
investigations culminated in a comprehensive
Environmental Impact Statement in 1995
(1995 EIS), data from which showed a
significant reduction in flood extents could be
achieved.
The State Government decided not to proceed
with the mitigation dam but rather construct a
side-spillway to ensure the existing dam’s
structural integrity in large floods. It was
proposed to manage the residual flood risks
downstream through town planning and
emergency planning and the upgrading of
evacuation routes to provide more time for
evacuation. The 1997 Warragamba Dam
Auxiliary Spillway EIS (1997 EIS) updated the
previous flood damages work completed in the
1995 EIS.
Infrastructure NSW is again looking at the
feasibility of a Warragamba Flood Mitigation
Dam. One of the initial steps in this feasibility
assessment is estimating the benefits which
would be delivered by providing flood
mitigation. These benefits will be a reduction in
flood damages which will include both tangible
economic benefits as well as intangible, but
measurable, benefits (such as reduced risk to
life).
1.2 THE HAWKESBURY-NEPEAN CATCHMENT
The Hawkesbury-Nepean Catchment covers
approximately 21,000 square kilometres. It
falls on the eastern side of the Great Dividing
Range and almost completely surrounds the
Sydney Basin. The headwaters of the
catchment lie almost 50 km south of Goulburn,
almost 10 km to the west of Lithgow and as far
north as Newcastle (Figure 1). Approximately
9,050 square kilometres of the catchment is
upstream of Warragamba Dam.
The catchment upstream of Warragamba Dam
lies within the Southern Highlands and the
Blue Mountains and the terrain is relatively
mountainous with river channels in deep
gorges. The Nattai, Wollondilly, Coxs and
Kowmung rivers drain this part of the
catchment and flow into the Warragamba River
which is completely flooded by Lake
Burragorang, the reservoir formed by
Warragamba Dam. .
A few kilometres below the Dam, the
Warragamba River flows into the Nepean
River which itself has a catchment of about
2,000 square kilometres upstream of their
junction. The confluence of the two rivers is in
the Nepean Gorge. The Nepean River widens
out into a wide channel with a broad floodplain
at Regentville, less than 2 km upstream of the
M4 Motorway Bridge. The river flows past
Penrith, Richmond and then Windsor, where
the river virtually reaches sea level.
Downstream of Windsor, the river flows back
into a deep gorge at Sackville and continues to
wind its way through the gorge until it reaches
the estuary mouth downstream of Brooklyn. It
is about 100km by river from Windsor to
Brooklyn.
1.3 FLOODING IN THE VALLEY
During a flood upstream of Warragamba Dam,
the water is generally confined to the deep
gorges that are relatively un-developed. Below
Warragamba Dam and the Nepean Gorge, the
floodwaters can spread out across the
2 Infrastructure NSW
Figure 1 Hawkesbury Nepean Catchment
Hawkesbury-Nepean Flood Damages Assessment 3
floodplain, inundating large sections of Penrith
and Emu Plains and Richmond and Windsor.
When the floodwaters reach Sackville, the
River has reached sea level and the
floodwaters which have spread out over the
floodplain need to pass through the narrower
gorge. These two effects combine to cause
the floodwaters to flow out of the floodplain
much more slowly than they are flowing in.
The floodplain around Richmond and Windsor
can therefore fill to quite extraordinary depths.
This type of flooding is roughly analogous to a
bathtub where the inflow from the tap is far
greater than the outflow from the drain plug.
This then causes floodwaters to flow back up
the River’s tributaries, particularly South,
Rickabys and Eastern creeks. This causes
further inundation around Richmond and
Windsor as well as several other suburbs,
including Bligh Park, McGraths Hill,
Riverstone, Marsden Park and Londonderry. It
takes several days for this ponded water to
flow out to sea.
Downstream of Sackville, the flow rate is
decreased and the flooding is confined to the
lower levels of the gorge, the area is mostly
undeveloped, however low lying caravan parks
and access roads as well as some isolated
houses can become inundated. By the time a
flood reaches Brooklyn, it has almost no
impacts.
The largest flood on record in the Hawkesbury-
Nepean Valley occurred in 1867 when the river
level reached 19.3m AHD at Windsor. This
essentially means that the water level was
19.2m above mean sea level compared to the
normal river level at Windsor which is less than
0.5m above sea level. This flood is estimated
to have about a 1 in 200 chance of occurrence
in any year (1 in 170 at Penrith and 1 in 220 at
Windsor).
Analysis of sediment within the Nepean Gorge
shows that prior to European settlement, but
under current climatic conditions, at least one
flood reached or exceeded the level of a flood
with about a 1 in 500 chance of occurrence in
any year. Such a flood would reach 20.2m
AHD at Windsor.
The Probable Maximum Flood (PMF), which is
the largest flood that could theoretically occur,
would reach a level of approximately 26.3m
AHD. Figure 2 shows the extent of a flood
similar to the 1867 flood and also the extent of
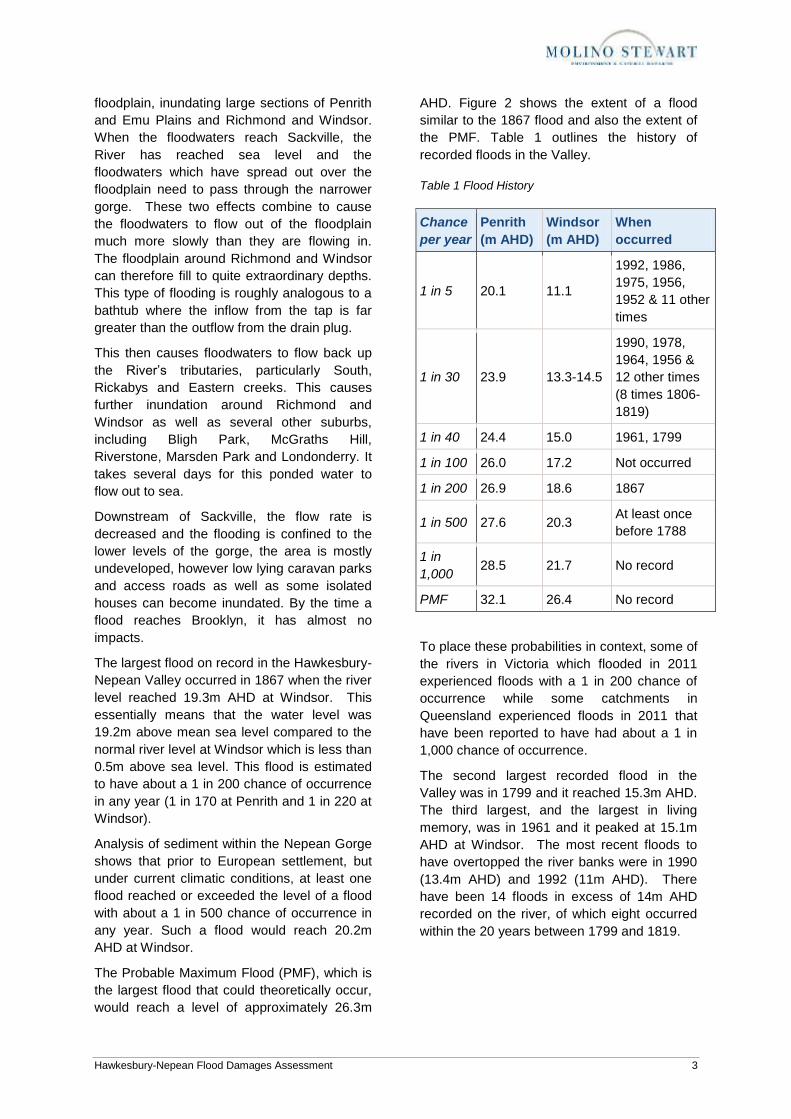
the PMF. Table 1 outlines the history of
recorded floods in the Valley.
Table 1 Flood History
Chance
per year
Penrith
(m AHD)
Windsor
(m AHD)
When
occurred
1 in 5 20.1 11.1
1992, 1986,
1975, 1956,
1952 & 11 other
times
1 in 30 23.9 13.3-14.5
1990, 1978,
1964, 1956 &
12 other times
(8 times 1806-
1819)
1 in 40 24.4 15.0 1961, 1799
1 in 100 26.0 17.2 Not occurred
1 in 200 26.9 18.6 1867
1 in 500 27.6 20.3 At least once
before 1788
1 in
1,000 28.5 21.7 No record
PMF 32.1 26.4 No record
To place these probabilities in context, some of
the rivers in Victoria which flooded in 2011
experienced floods with a 1 in 200 chance of
occurrence while some catchments in
Queensland experienced floods in 2011 that
have been reported to have had about a 1 in
1,000 chance of occurrence.
The second largest recorded flood in the
Valley was in 1799 and it reached 15.3m AHD.
The third largest, and the largest in living
memory, was in 1961 and it peaked at 15.1m
AHD at Windsor. The most recent floods to
have overtopped the river banks were in 1990
(13.4m AHD) and 1992 (11m AHD). There
have been 14 floods in excess of 14m AHD
recorded on the river, of which eight occurred
within the 20 years between 1799 and 1819.

4 Infrastructure NSW
Figure 2: Flood Extents
Hawkesbury-Nepean Flood Damages Assessment 5
1.4 DEVELOPMENT HISTORY
The devastating floods in the early days of the
Colony moved Governor Macquarie to order
that development should not take place on the
low lying floodplains. To encourage
development on the high ground he
established the five Macquarie towns of
Richmond, Windsor, Pitt Town, Wilberforce
and Castlereagh. Little did he realise that all of
Richmond and Windsor, most of Pitt Town and
much of Wilberforce can be completely
overwhelmed by floodwaters.
There are some older buildings on the Windsor
floodplain which are constructed with floors as
low as 11m AHD but most homes are built
above 14m AHD. In the 1970s 16m AHD was
adopted as the minimum floor level for new
dwellings in the belief that this corresponded to
the 1 in 100 year average recurrence interval
(ARI) level at Windsor. Similar building
controls were imposed elsewhere along the
river and its tributaries.
Following the Warragamba Dam flood safety
investigations in the 1990s, councils revised
their minimum floor levels upwards to align
with the new understanding of the 1 in 100 ARI
flood level which is 17.2m AHD at Windsor.
Some set their minimum habitable floor levels
at the 1 in 100 ARI level while others added a
freeboard of up to 0.5m on top of that.
Since that time development has continued in
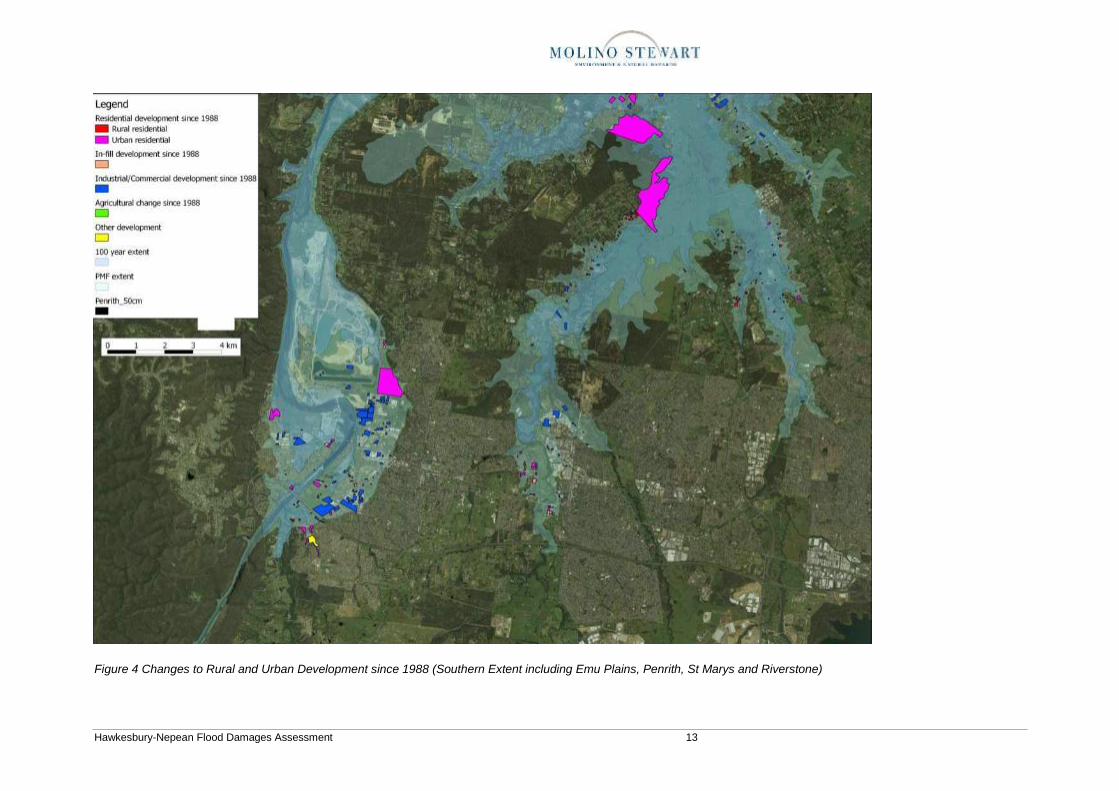
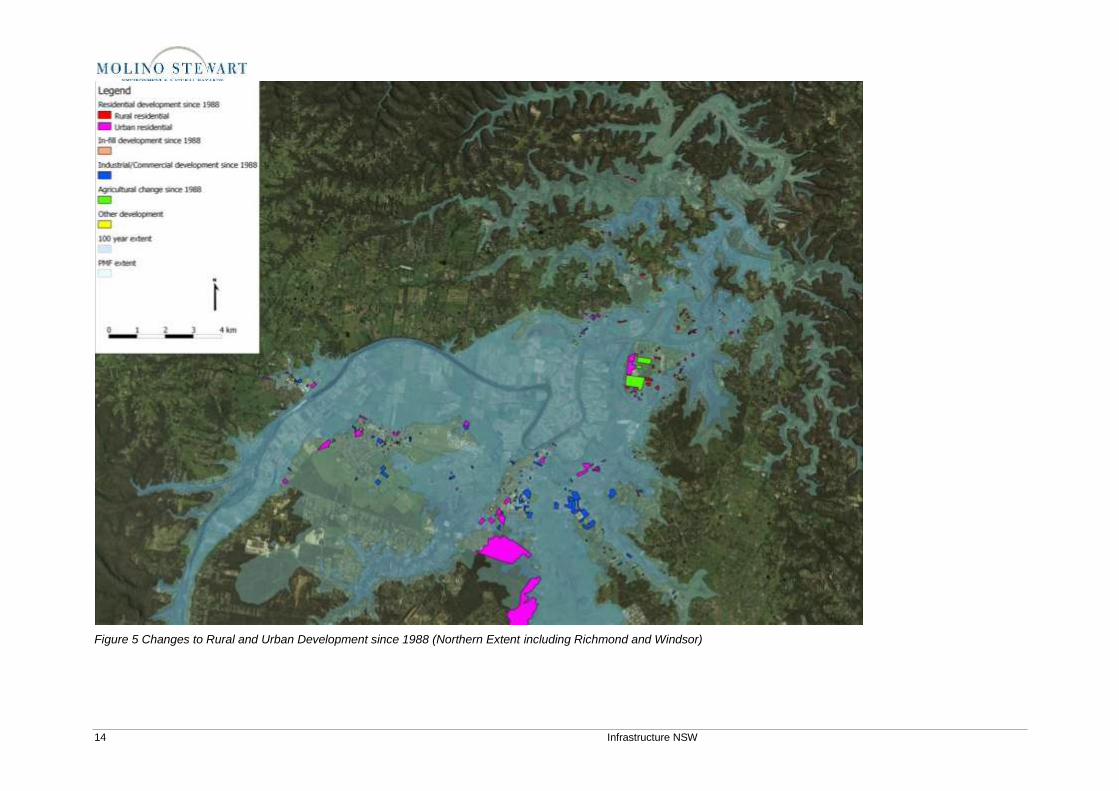
the Valley (see Figure 4 and Figure 5). There
has been considerable infill development as
well as some new subdivisions. In some
instances evacuation and life safety
considerations have constrained or prevented
new subdivision but planning controls have
generally permitted infill development without
consideration of flood risk to life. In some
suburbs, detached dwellings on quarter acre
blocks have been replaced by several
townhouses placed on that same block.
New urban development continues with
houses built with a floor level at the current 1 in
100 ARI level could expect to be flooded to
almost ceiling level in a repeat of the 1867
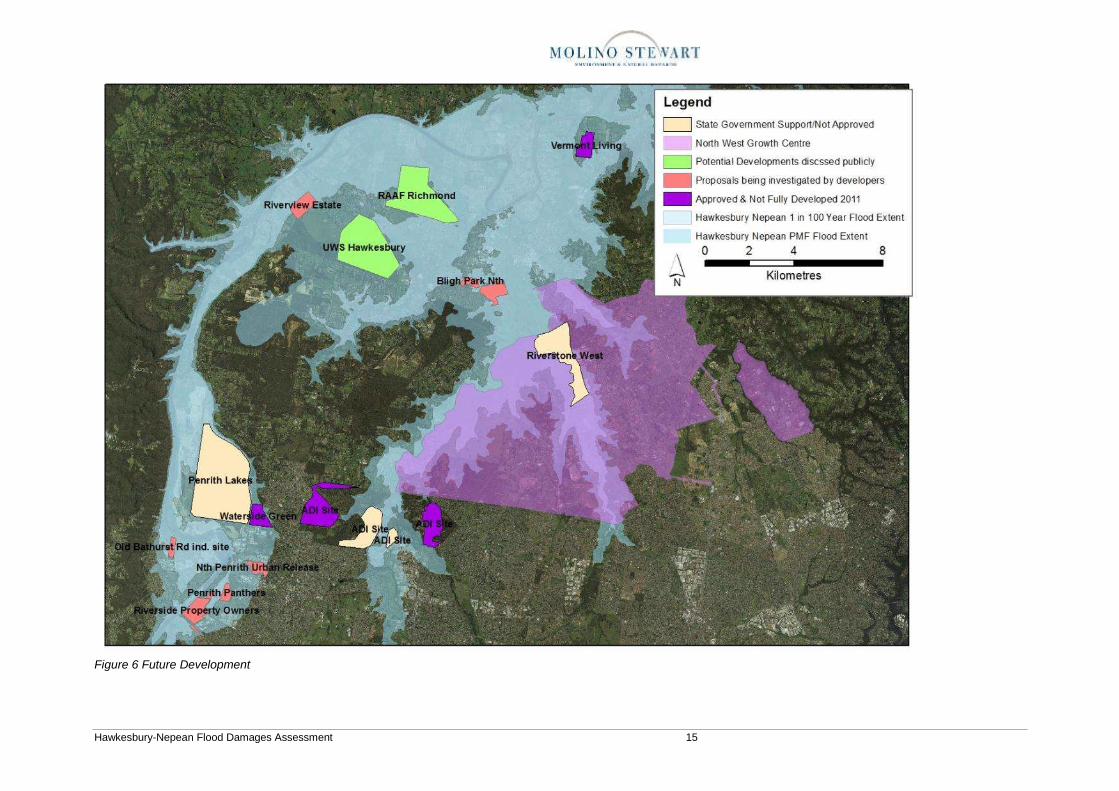
flood. Further development is planned (Figure
6).
The SES has developed a comprehensive
flood emergency response plan for the Valley
which caters for the evacuation of more than
60,000 who could be overwhelmed or isolated
by floodwaters but recent studies suggest the
number could be closer to 90,000 people.
A particular challenge with implementing the
plan is that many of the evacuation routes
have low points below the level of the
premises which need to be evacuated.
Despite hundreds of millions of dollars having
been spent raising sections of these
evacuation routes it would still be necessary to
order people to evacuate long before they can
see any threat to their buildings or their lives.
Failure to evacuate in a repeat of the 1867
flood could result in significant loss of life.
Along with the urban development and rural
residential development which has taken place
in the Valley, there has also been a
corresponding increment in utilities,
infrastructure and essential services to meet
the needs of the increased population.
While all of the service providers have taken
flood risks into consideration in their planning
and design, many have not thought about the
implications of a flood larger than the 1 in 100
year ARI event. This has resulted in assets
which are vulnerable to considerable damage
in larger floods and the potential extended loss
of service to many people who would
otherwise not be affected by the flooding.
1.5 THIS REPORT
This report builds upon earlier work done for
the Warragamba Dam EISs and subsequent
investigations undertaken for NSW
government agencies and local councils. It
provides a more up to date estimate of the
impacts and costs of flooding (flood damages)
in the Valley and the potential reduction that
could be achieved by flood mitigation capacity
at Warragamba Dam.
Chapter 2 sets out how the flood damages
were estimated and Chapter 3 summarises
those estimates. Chapter 4 sets out the
estimated damages were flood mitigation in
place and Chapter 5 provides a preliminary
economic analysis of flood mitigation.
Conclusions and recommendations are
provided in Chapter 6.
6 Infrastructure NSW
2 FLOOD DAMAGE ASSESSMENT
2.1 FLOOD DAMAGES
2.1.1 Damage Categories
Flood damages can be loosely divided into
four categories, made up of a combination of
two variables. The first variable is whether the
damage is direct or indirect, where direct
damage is defined as that which results from
contact with the flood waters and indirect
damage that which occurs as a consequence
of the direct damages. The second variable is
whether the damage is tangible or intangible,
where tangible damage is defined as that
which is able to be easily given a dollar value
while intangible damages are those which are
more difficult to value. Table 2 shows how the
two variables interact to create the four
categories and provides some examples of
each.
The method of calculating flood damages
varies between the four damage categories but
within each category it will also vary between
different types of development as each will be
affected in different ways by a flood.
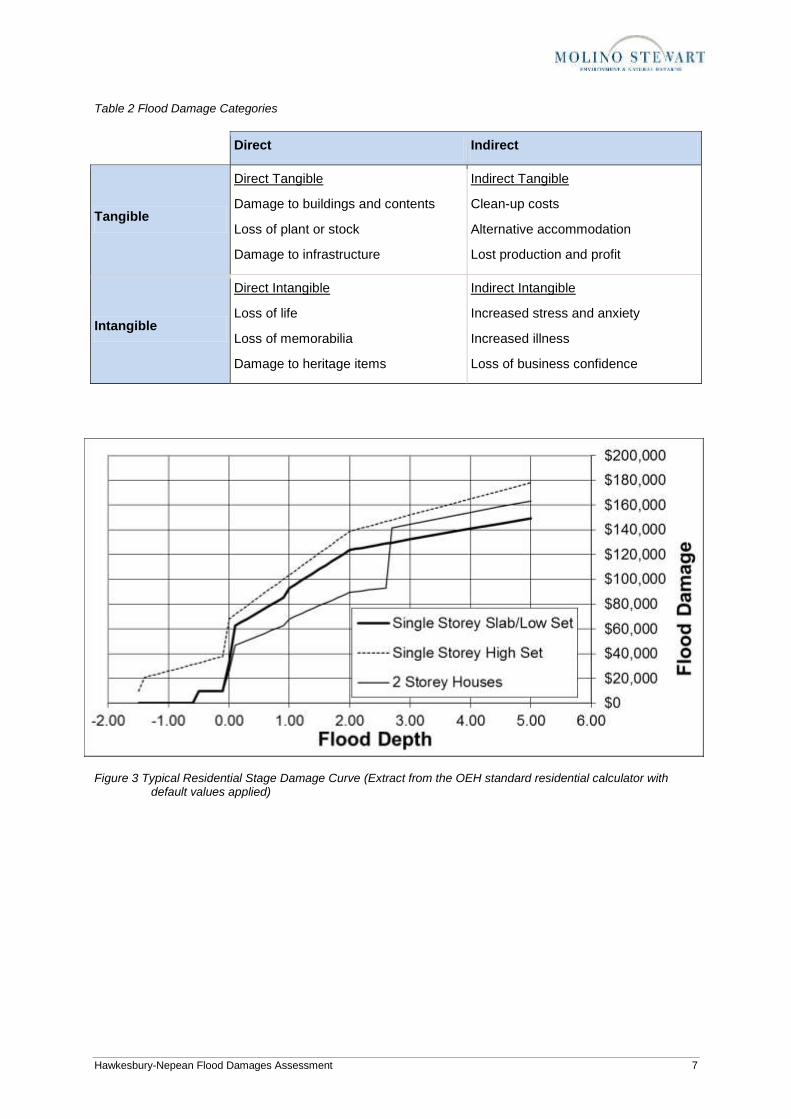
2.1.2 Stage Damage Curves
The majority of the tangible direct flood
damages are in residential, commercial and
industrial developments. Typically these are
calculated using stage damage curves. A
stage damage curve represents the cost per
square metre of floor area for a given depth of
inundation.
The stage damage curve is typically linear with
a number of steps, these steps represent
thresholds where large additional damages
take place. For example, once flood waters
exceed the height of a standard table, then
additional damage will occur as most residents
place their contents on tables to prevent flood
damage.
There are also given depths at which it is
assumed that a building will have considerable
structural damage or is likely to fail. Building
failure is not limited to a structural collapse but
may also be damage such that major repairs
or demolition are required after the flood.
Figure 3 is a typical set of stage damage
curves for residential buildings.
2.1.3 General Approach
The flood damages for the Hawkesbury-
Nepean have been previously calculated a
number of times, most recently in 1997. In
these assessments the tangible damages have
been calculated for the different development
types discussed in Section 2.2. Since these
calculations were made, a number of changes
to the floodplain have occurred, particularly in
developing new residential, commercial and
industrial buildings. Additionally, as
construction methods and contents have
changed, the stage damage curves have
changed.
Updated stage damage curves have been
used for the residential and commercial and
industrial development types because there
has been a significant increase in the
vulnerability and value of building contents.
However, for many of the other types of
development there have been no significant
changes on the floodplain and re-calculation of
the damages would be inefficient for a
preliminary study such as this. For these
development types the Consumer Price Index
(CPI) increase from December 1997 to
December 2011 was applied to account for
inflation over that time. If it was warranted,
additional adjustments were made to account
for changes in the magnitude of development.
These have been documented as part of
Section 2.2.
Indirect tangible damages are generally
calculated as a proportion of direct damages.
These will generally range from around 10% to
over 150% depending on the development
type and the scale of flooding. As part of the
1995 EIS, a literature review was undertaken
to determine the most appropriate means of
estimating indirect tangible damages for each
development type. Generally those same
methods have been applied for this study.
Hawkesbury-Nepean Flood Damages Assessment 7
Table 2 Flood Damage Categories
Direct Indirect
Tangible
Direct Tangible
Damage to buildings and contents
Loss of plant or stock
Damage to infrastructure
Indirect Tangible
Clean-up costs
Alternative accommodation
Lost production and profit
Intangible
Direct Intangible
Loss of life
Loss of memorabilia
Damage to heritage items
Indirect Intangible
Increased stress and anxiety
Increased illness
Loss of business confidence
Figure 3 Typical Residential Stage Damage Curve (Extract from the OEH standard residential calculator with default values applied)

8 Infrastructure NSW
For details about original damage estimation
methodologies the original EISs should be
referred to. The following sections focus
mainly on the methodologies used to update
the damage estimates.
2.1.4 Data Sources
The data for this project has been derived from
a number of sources as follows.
a) ANUFLOOD Location and Elevation Data
The ANUFLOOD Flood Damages program
was previously used to calculate flood
damages within the Hawkesbury-Nepean
Valley in the 1990s. The program relied upon a
database of property information that was
gathered by two methods.
The first involved field surveys of urban areas
by university students in 1988. The students
logged information about building type, size,
condition and use and estimated co-ordinates
and floor levels from maps and survey
benchmarks. By comparison to the data
currently available, these data have low
precision, however, the ANUFLOOD data is
the only near-complete geo-referenced
property database for the Hawkesbury-Nepean
floodplain and includes more than 20,000
buildings. Therefore these data were used as a
starting point for the commercial, industrial and
residential flood damage estimates.
The second method involved logging rural
residential properties by reviewing topographic
maps of the floodplain. This dataset has since
been mislaid within government but was never
particularly accurate because the topographic
maps were based on airphotos from the 1970s
and it was difficult to interpret from the maps
whether building were houses, let alone what
floor level they had baed on contour intervals
of up to 10m.
The ANUFLOOD software itself was not
utilised as there are more powerful computer
programs now available. For this study
ArcGIS and WaterRIDE were used to
undertake the tasks previously performed by
ANUFLOOD as well as other, more advanced,
analyses.
b) Google Earth and Street View for New Properties
Google Earth, including its ‘street view’, was
used to locate all of the additional residential
properties and calculate their size and assess
whether each new property was one or two
storeys. While the Google Earth software
utilises a number of satellite images, a January
2009 image was predominately the latest
available image in the catchment. Additionally,
the Google Street data was predominately
collected in late 2009.
c) Elevation Data
Recent Airborne Laser Survey (ALS) data was
provided by the Sydney Catchment Authority
for the majority of the floodplain. These data
are highly accurate, however they were
provided to the nearest metre and are
therefore not very precise. It is believed that
the raw ALS data would have sub metre
precision, however it was not available within
the timeframe of this project and it is
considered that the data available would be
accurate overall.
Additionally, where there were gaps in the ALS
data, the freely available Shuttle Radar
Topography Mission (SRTM) elevation data
were applied, it was found that these data
aligned to the ALS Data and were therefore
acceptable for use.
d) Flood Model Data
Flood modelling data has been provided by
Penrith City Council and Hawkesbury City
Council for the Hawkesbury Nepean. In
particular, time series flood extents and
velocities were provided in WaterRIDE native
formats and used to extract peak flood
surfaces for the design events. The combined
flood extents cover the floodplain from
Regentville to Sackville.
e) Stage-Damage Curves
Two stage damage curves have been applied
in this assessment. For the residential
properties the Office of Environment and
Heritage’s standard residential flood damage
calculator was used with its embedded stage
damage curve. This is based on the

Hawkesbury-Nepean Flood Damages Assessment 9
Residential Flood Damages guideline within
the New South Wales Floodplain Development
Manual. The second stage damage curve
applied was based upon the Worley Parsons
(2008) stage curve for commercial and
industrial properties. This is based upon a
range of literature and community surveys and
has been widely used in Floodplain Risk
Management Studies and Plans in NSW.
These provide more realistic estimates of
building contents damage than the stage
damage curves used in the 1990s and which
were thought to underestimate damages even
then. This is explained further in Section 2.2.1.
f) Existing Studies
A variety of published literature has been used
in the production of this report. These sources
include:
Mitchell McCotter (1995) ‘Warragamba Flood Mitigation Dam EIS’, prepared for Sydney Water and the NSW Government
Hawkesbury-Nepean Flood Management Advisory Committee (1997) ‘Achieving a Hawkesbury-Nepean Floodplain Management Strategy’
Mitchell McCotter (1996) ‘Proposed Warragamba Auxiliary Spillway EIS’, prepared for Sydney Water
Molino Stewart (1997) ‘Hawkesbury-Nepean River Impacts of Flooding on Communities and Infrastructure’
Molino Stewart (2012) ‘Hawkesbury Nepean Flooding Impacts Review’, prepared for NSW SES
2.1.5 Assumptions and Limitations
The data used in ANUFLOOD was created before GPS recording was available. This has meant that each point is not necessarily marking the centre of each house, but is frequently offset, sometimes by up to 50 m. On sloping land this may mean the depth of inundation for those houses is over or under estimated, depending on the position of the data point relative to the house.
Similarly, the floor level estimates in the ANUFLOOD dataset were based on field estimates of floor heights above ground
levels which were estimated from surveyed benchmarks. There is likely to be inaccuracies in these estimated levels but there is no reason to suspect that they would consistently underestimate or overestimate floor levels.
The floor levels of new urban residential dwellings and all of the rural residential dwellings were estimated by assuming a height above the ALS level for the location of the dwelling. New urban residential floors were assumed to be 300 mm above ground level and rural residential floors 500 mm.
All residential properties were categorised as either; small, medium or large. Small houses were assumed to 150 m
2,
medium 240 m2 and large houses 300m
2.
House sizes were categorised as the damages calculator does not have the functionality to have a size for each individual house. While some houses will be under-estimated in size, and therefore damage, it is expected that some houses will be over-estimated and therefore the overall damages will remain accurate.
For the vast majority of properties, the SCA ALS data has been used to estimate the ground height. While the collected data would generally be accurate to within 100 mm, the data which has been provided is only reported to the nearest metre. This will lead to both over and underestimations of individual house floor heights, but it is expected that this will still be accurate across the catchment. Where the ALS data was not available, the less accurate SRTM data was utilised, checking of this data where it overlapped with the ALS showed that it still remained fairly accurate, with no consistent over or under estimation.
The stage-damage curves used make a number of assumptions regarding the cost of repairs and replacing house and commercial/industrial contents. In reality these may be greater or smaller than those estimated by the stage-damage curves. This study has applied industry best practice stage-damage curves and is expected to be as accurate as possible.
The residential and commercial and industrial stage-damage curve do not take into account the cost of completely replacing a failed building and therefore may underestimate damages, particularly
10 Infrastructure NSW
in the more extreme events where building failure is likely to be widespread.
The developed proportions of new commercial and industrial land have been estimated using aerial imagery. It has been assumed that 53% of commercial and industrial areas are buildings’ floor space which contributes to flood damages. The remainder is roads, parking and open space. This number has been derived by checking approximately 5% of the new commercial and industrial land areas and floor areas within the GIS.
It has not been possible to estimate the number of commercial and industrial premises now affected by flooding without undertaking a similar ground level survey as was undertaken in 1988. Suffice to say that there are considerably more businesses affected than 25 years ago.
Where there has been no change in the level of development, it is assumed that the cost of flood damages (other than commercial, industrial and residential) has increased at the same rate as the CPI index. The value utilised for December 2011 is 179.40 and December 1997 is 120.00.
Flood modelling data which was available for this study only covered the floodplain between Regentville and Sackville. This covers the vast majority of development but there is some development upstream and downstream of these locations which would make a small contribution to flood damages. Also there were no flood surfaces available for the Penrith floodplain below the 1 in 100 year ARI event. This means that there is a slight underestimate of residential, commercial and industrial damages due to the exclusion of these areas and events.
The flood model provided for the Penrith floodplain conformed to a 2008 configuration of the proposed Penrith Lakes Scheme finished form. There have been other proposed finished forms for Penrith Lakes since that time but as no decision has been made as to what final form it would take, it was determined that the 2008 model would be adequate for the purposes of this investigation.
Flood modelling assumes that Warragamba Dam will not fail in any flood but that the auxiliary spillway will operate
in floods exceed a 1 in 500 year ARI event.
Damage estimates are for the amount of development on the floodplain in 2011. Should that increase in the future, as is planned, then flood damages will increase.
2.2 ASSET CATEGORIES
2.2.1 Residential Properties
Residential properties are single dwelling
houses, duplexes, town houses and apartment
complexes. Residential damage includes the
structural damage to the building as well as
damage to the contents of the building.
The majority of the urban residential buildings
within the floodplain were located by field
survey in 1988. Rural residential buildings
were generally identified from orthophoto or
topographic maps in 1992 although the
photographic bases for the maps generally
dated from the 1970s. The 1988 field survey
data was available digitally for this study and
was imported into a geographic information
system (GIS). The other data had been
mislaid over time.
It was known that additional development had
occurred since the previous data was collected
and so additional residences were located
using recent aerial images (see Figure 4 and
Figure 5). This same method was also used to
log all rural residential buildings as the older
data had been lost and there were new homes
built since. These dwellings were digitised and
added to the GIS. The size of the new
buildings was estimated using aerial images
and the GIS and the number of storeys
determined using Google Street View.
The areas downstream of Sackville were not
included because of time and budget
constraints, the limited flood model data
available for that section of the River and the
minor contribution to total losses that these
properties make.
A total of 21,142 residential buildings within the
floodplain were located. This is nearly 5,000
more dwellings than previously estimated. The
work in the 1990s used a computer program
Hawkesbury-Nepean Flood Damages Assessment 11
called ANUFlood to estimate residential
damages using stage damage curves which
were built into the program. The 1995 EIS
suggested that this may have grossly
underestimated residential building damages
because the values of contents were based on
surveys which dated back to the 1974
Brisbane flood.
Subsequent studies by Risk Frontiers at
Macquarie University found that residential
damages are far greater than had been
estimated by ANUFlood. The NSW
Government has since issued a standard
calculator to be used in estimating residential
flood damages which has a much more
realistic and up to date set of residential stage
damage curves which accounts for significant
quantities of high value electronic goods in
homes today.
For this assessment, the rural residential
properties have been combined with urban
residential properties. All residential damages
have been calculated using the Office of
Environment and Heritage’s standard
Residential Flood Damage Calculator (OEH,
2012). The size of the properties has been
divided into three categories for use in the
calculator:
Small: assumed 150 m2 floor plan area
Medium: assumed 240 m2 floor plan area
Large: assumed 300 m2 floor plan area
It should be noted that the calculator does not
make allowance for the cost of replacing
buildings that have failed. Therefore it is
expected that the damage estimates are
potentially on the low side for a floodplain such
as the Hawkesbury Nepean where significant
flood depths and, in some locations, velocities,
could see many homes destroyed by
floodwaters. A sensitivity analysis was
undertaken by making an additional allowance
for the reconstruction of severely damaged
homes.
ANUFlood had previously been used to
estimate whether buildings would be
structurally damaged. This time an inbuilt
hazard function in WaterRIDE calculated peak
depth and velocity combinations to determine
whether building failure was likely. From the
results it would appear that WaterRIDE
estimates buildings to be more robust that
ANUFlood had done.
Indirect damages were previously estimated in
two parts. The first part was a percentage of
the direct damages with the percentage being
higher for more extreme floods. Those
percentages were maintained for this study.
The second part was based on the cost of
temporary accommodation for properties which
were evacuated and the duration of
evacuation. Evacuation duration was
estimated to depend on whether the building
was isolated, flooded or structurally damaged
by floodwaters and how widespread the
flooding would be.
The same durations for absence were used as
previously but it was assumed that alternative
accommodation would cost $375 per week
which is about equivalent to CPI being applied
to previous alternative accommodation
estimates.
2.2.2 Commercial & Industrial Properties
Commercial and industrial properties are all
other properties not used as residential
dwellings, including major public buildings
such as hospitals and schools as well as
private hospitals, schools, nursing homes and
child care facilities.
Commercial and industrial development was
also catalogued through field survey in 1988
and this information was imported into the GIS
for this project.
A recent airphoto was compared to a 1988
airphoto to identify areas new commercial and
industrial development since then. An
estimated additional 143 hectares of
commercial and industrial floor space has
been added to the floodplain since 1988 (see
Figure 4 and Figure 5).
The original commercial and industrial
damages were calculated using stage damage
curves built into ANUFlood. For this
assessment the flood damages from the 1997
EIS were used for the commercial and
industrial areas that were developed at that
time and then inflated using the CPI. The
damages for the additional areas were
12 Infrastructure NSW
calculated using the WaterRIDE Floodplain
Manager software, utilising the Worley
Parsons Industrial and Commercial Damage
Curves, which are derived from Water Studies
(1992). These values were then inflated using
CPI to December 2011 values.
Indirect damages were calculated as a
percentage of direct damages with the
percentage increasing for more extreme and
widespread flooding as was done in 1997.
2.2.3 Caravans
There are many caravan parks along the
Hawkesbury River, particularly downstream of
Pitt Town. Many are small facilities used only
at weekends or holiday times.
In the 1997 EIS, caravan flood damage costs
were developed using Smith et al. (1990). The
following assumptions were made:
all caravans were family holiday style units, 5 to 6 metres long
temporary sites were 50 per cent occupied
there would be no opportunity to remove vans or contents, so actual damages would equal potential damages
caravan damages were increased by 20 per cent to allow for facilities provided by the caravan park such as amenities and laundries
In the 1997 EIS total damages for caravans
were relatively minor thus more detailed
investigations were not warranted.
In this assessment the caravan damages from
the 1997 EIS have been inflated using the CPI.
2.2.4 Motor Vehicles
When the original damage estimates were
undertaken a comprehensive flood emergency
plan for the Valley did not exist and it was
assumed that in the larger floods most motor
vehicles would suffer some flood damage and
half would be written off. The degree of
damage was estimated based on the depth of
flooding at the home where it was usually
parked.
Today, there is a plan to evacuate, by motor
vehicle, all residents at risk and so even in the
larger floods the proportion of cars which
remain in the floodplain is likely to be much
less than assumed in previous studies.
However, because of the increase in
electronics in vehicles in the past 20 years, it is
more likely that a car that suffers any above
floor flooding will be written off. Additionally,
the number of vehicles per capita has
increased by over 13% during this time.
Therefore it is believed that our estimates are
conservatively low.
In a flood, it is expected that the residents and
persons at commercial and industrial sites will
evacuate using their vehicles. Previous studies
by Molino Stewart, using the SES Timeline
Evacuation Model, have estimated the number
of vehicles that are likely to be unsuccessful in
a flood with the same rate of rise as a PMF
event (Molino Stewart, 2012).
Despite all of these changes, motor vehicles
make a very minor contribution to the total
damages. For this study the 1997 estimates
were simply inflated by CPI.
2.2.5 Agriculture
Non-urban areas of the floodplain are mainly
used for agriculture.
Direct agricultural damages are caused by the
inundation of farm plant and improvements,
loss of livestock, damage to livestock fodder
reserves and loss of crops in production.
Indirect damages include loss of production
during re-establishment of the enterprise after
flooding.
In the 1997 EIS flood damages per hectare
were calculated from the value of plant and
improvements used in agricultural production
and gross margin data for each activity. Gross
margin is the sale price of produce minus
production and transport costs. The flood
damages are an average year cost for the
planting and harvesting seasons. They
included some production costs but excluded
harvesting and transport costs.
Hawkesbury-Nepean Flood Damages Assessment 13
Figure 4 Changes to Rural and Urban Development since 1988 (Southern Extent including Emu Plains, Penrith, St Marys and Riverstone)
14 Infrastructure NSW
Figure 5 Changes to Rural and Urban Development since 1988 (Northern Extent including Richmond and Windsor)
Hawkesbury-Nepean Flood Damages Assessment 15
Figure 6 Future Development
16 Infrastructure NSW
Since this time, the value of plant and
equipment in the floodplain is likely to have
increased, however the total agricultural area
and output is likely to have decreased. There
have also been changes in the type of
agricultural production on the floodplain.
Some of this was clear from airphotos (see
Figure 4 and Figure 5). The level at which
these have occurred is difficult to estimate and,
given the small contribution of these damages
to the overall total, it was considered not worth
more detailed analysis for this project.
In this assessment agricultural damages from
the 1997 EIS have been applied and updated
using the CPI.
2.2.6 Roads & Bridges
There are numerous urban communities
throughout the valley, surrounded by intensive
agriculture. They are connected by a network
of roads including a state highway and two
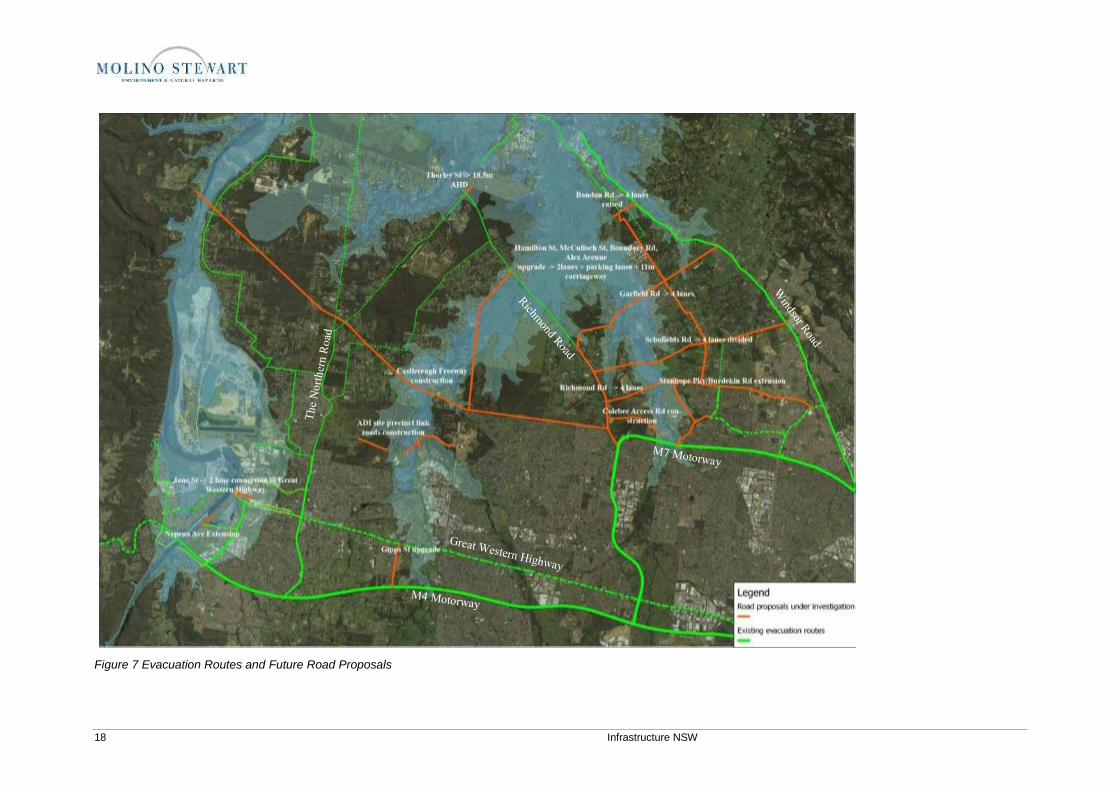
motorways (see Figure 7).
The three principal roads crossing flood-
affected areas are the M4 (Western
Motorway), State Highway 44 (Great Western
Highway) and the M7 (Westlink). The M4
Motorway parallels the Highway and provides
a link from Sydney to the Blue Mountains and
western parts of NSW that by-passes urban
settlements in the western suburbs. The M7
connects the M2 at Blacktown, the M4 at
Eastern Creek and the M5 at Casula.
The Great Western Highway is the major road
transport link between Sydney and its western
suburbs. Regional links through the area
connect Singleton to Campbelltown,
Parramatta to Lithgow, and Liverpool to
Richmond.
The main transport routes affected by
moderate to extreme flooding are the roads
crossing the Windsor/Richmond/Castlereagh
area. They include:
Richmond/Blacktown Road
Windsor Road
Castlereagh Road
Bells Line of Road
Putty Road
Some of these cross the Hawkesbury-Nepean
River. Hawkesbury Road crosses at
Yarramundi Bridge south of Richmond and
Bells Line of Road links Richmond and Lithgow
via Richmond Bridge. Windsor Road crosses
the river at Windsor Bridge just north of
Windsor and continues north as the Putty
Road to Singleton. In the Penrith area the M4
Motorway crosses the river on the Regentville
Bridge and the Great Western Highway
crosses on Victoria Bridge.
Roads may be damaged by flooding in two
ways. Where water velocities are high they
may be scoured or undermined, with damaged
sections requiring subsequent reconstruction.
Bridge approaches and sections of road along
river banks are particularly susceptible to this
type of damage. Roads may also be damaged
by traffic loadings. When flood waters are
deep and the period of inundation is long, the
subgrade under roads may become saturated.
In this state they are weak and significant
traffic loads may cause the pavement to fail. It
may take several days after flooding before a
road can return to full strength.
Flood damage to bridges depends on the
structural design of each bridge. North
Richmond, Windsor and Yarramundi bridges
were designed to be submerged. Victoria and
Regentville bridges were intended to be above
design flood levels. They could potentially fail
if overtopped in more extreme flood events.
Bridges can also be damaged by erosion
around abutments, which can remove
structural support and lead to the collapse of
the bridge. Damage can occur from debris
striking the bridge structure.
In the 1997 EIS total lengths of main, rural and
arterial roads in the study area were measured
from 1:4,000 orthophotomaps. Residential
roads were estimated from the number of
properties in urban areas and an average
length of road per property which was
calculated from three sample suburbs.
Since the 1997 EIS data were collected,
additional roads and bridges have been
constructed to service the additional houses
and commercial areas, it has been estimated
that this has increased the total road lengths
within the floodplain by approximately 10%

Hawkesbury-Nepean Flood Damages Assessment 17
In this assessment roads and bridges
damages have been calculated by inflating the
1997 estimates by the CPI and adding an
additional 10% to account for new road
infrastructure.
2.2.7 Railways
The study area is crossed by the Main
Western Railway, which runs through Penrith
and Emu Plains, and the Blacktown to
Richmond line which joins the main Western
line at Blacktown. Both lines are electrified
and are major commuter routes serving the
western suburbs and Blue Mountains areas,
and the North West Sector respectively.
The main Western line also serves western
NSW and is part of the rail link to Western
Australia. The line crosses the Nepean River
on a rail bridge adjacent to Victoria Bridge (see
Figure 8).
Floods with a 1 in 10 chance of occurrence per
year can disrupt traffic on both lines. Traffic
can be suspended for between 10 and 24
hours due to the effects of water on signalling,
communications and power facilities.
In the 1997 EIS it was assumed that:
rolling stock trapped in the affected area would be moved to higher ground and would not be damaged by rising flood waters;
Signalling, electrical assets and stations would be damaged by floodwaters;
20% of overtopped sections of the Western Line would be scoured. This is because the line acts as a control across the floodplain and is perpendicular to the direction of flow;
only the section of the Richmond Line between Richmond and Mulgrave would be subject to scouring as the remainder of the line is in a low velocity area. It was assumed that 10% of the inundated length of this line would scour;
the rail bridge over the river would fail when flood waters exceed 28m AHD.
Direct damages to rail were based on the cost
of replacing or repairing the damaged assets
listed above.
Failure of the rail bridge and scour of the rail
embankment (the embankment washing away)
at Penrith would severely disrupt commuter
services from the Blue Mountains and wheat
and coal exports from Western NSW for about
six months.
Indirect rail damages included the loss of
revenue from commuter rail ticket sales and
the cost of diverting exports via Port Kembla
and Newcastle.
In this assessment, damages have been calculated using the 1997 EIS damages inflated to the December 2011 value, using the CPI. This is likely to underestimate the damages because of the increase in passenger numbers and coal freight.
2.2.8 Water & Sewerage
Sydney Water supplies Sydney, the Blue
Mountains and the Illawarra Region. Most of
this water comes from the Hawkesbury-
Nepean river system.
There has not been a significant increase in
major water supply infrastructure in the
floodplain since 1997 (see Figure 9).
There are eight Sewerage Treatment Plants
(STPs) potentially affected by flooding. They
are St Marys, Penrith, North Richmond,
Richmond, McGraths Hills, South Windsor,
Riverstone and Quakers Hill (see Figure 10).
Several of these have had significant upgrades
since 1997 and since they, by necessity, are at
low points in the floodplain, they are very
susceptible to flood damage.
In this assessment water and sewerage
damages have been calculated using the 1997
EIS damages inflated using CPI and then
multiplied by 1.5 to principally account for the
additional sewerage assets.
18 Infrastructure NSW
Figure 7 Evacuation Routes and Future Road Proposals

Hawkesbury-Nepean Flood Damages Assessment 19
Figure 8 Rail infrastructure located on the floodplain

20 Infrastructure NSW
Figure 9 Sydney Water Potable Water Network

Hawkesbury-Nepean Flood Damages Assessment 21
Figure 10 Sydney Water, Hawkesbury City Council and ADF Sewerage Infrastructure
22 Infrastructure NSW
2.2.9 Electricity
Five TransGrid high voltage transmission lines
cross the river or its floodplain:
Eraring to Kemps Creek double circuit 500kV line (line No. 5A1/5A2)
Sydney West to Central Coast double circuit 330kV line (25/26)
Sydney West to Sydney North 330kV line (20)
Sydney North to Kemps Creek 330kV line (14)
Bayswater to Sydney West double circuit 330kV line (31/32)
All these lines are supported on steel lattice
towers and supply regional substations. Only
part of Vineyard regional substation is
potentially affected in the more extreme floods.
Endeavour Energy has numerous lower
voltage transmission and distribution lines
which cross the floodplain and several
substations which are at risk of flooding.
In the 1997 EIS flood damages were provided
by the Electricity Transmission Authority and
Prospect Electricity. In this assessment direct
damages have been calculated using the 1997
EIS damages inflated by the CPI.
Indirect damages are potentially more
significant because of the tens of thousands of
non-flooded customers who could be without
power should substations or transmission lines
be damaged. Most of these customers are
outside of the floodplain. In more severe
floods power outages could last for weeks or
months.
Because there has been a significant increase
in the number of customers supplied by the
vulnerable assets, indirect electricity damages
have been recalculated for this study.
This has been calculated by inflating the 1997
estimates of the sale price per KWh, which
was calculated in 1992 as the revenue of the
electricity supplier, and multiplying this by the
current number of residences affected (both
flooded and non-flooded residences without
power) and the estimated time that the
residents would be in alternative
accommodation.
The reason that the sale price of electricity was
used rather than the suppliers profit margin is
that in NSW most electricity is supplied from
generators in NSW and so the loss of
electricity sales will be felt throughout the
economy right back to the primary producers.
The value of the unsupplied electricity to the
customers who are not flooded is an additional
indirect cost. It was treated as an intangible
damage because each KWh can be used for a
number of different purposes and therefore
have a different value to different customers.
There is currently not enough data to quantify
its value and so the damage was quantified as
the number of unsupplied, non-flooded
premises.
2.2.10 Telephone
The telecommunications market has changed
significantly since the 1990s. The technology
has also radically changed with greater use of
digital technology and fibre optic cables as well
as much greater use of mobile phones, other
mobile devices and the internet. The
telecommunications companies were less
forthcoming with information about their
systems than Telstra was in the 1990s and
much of the flood impact assessment for
telecommunications has been based on earlier
investigations.
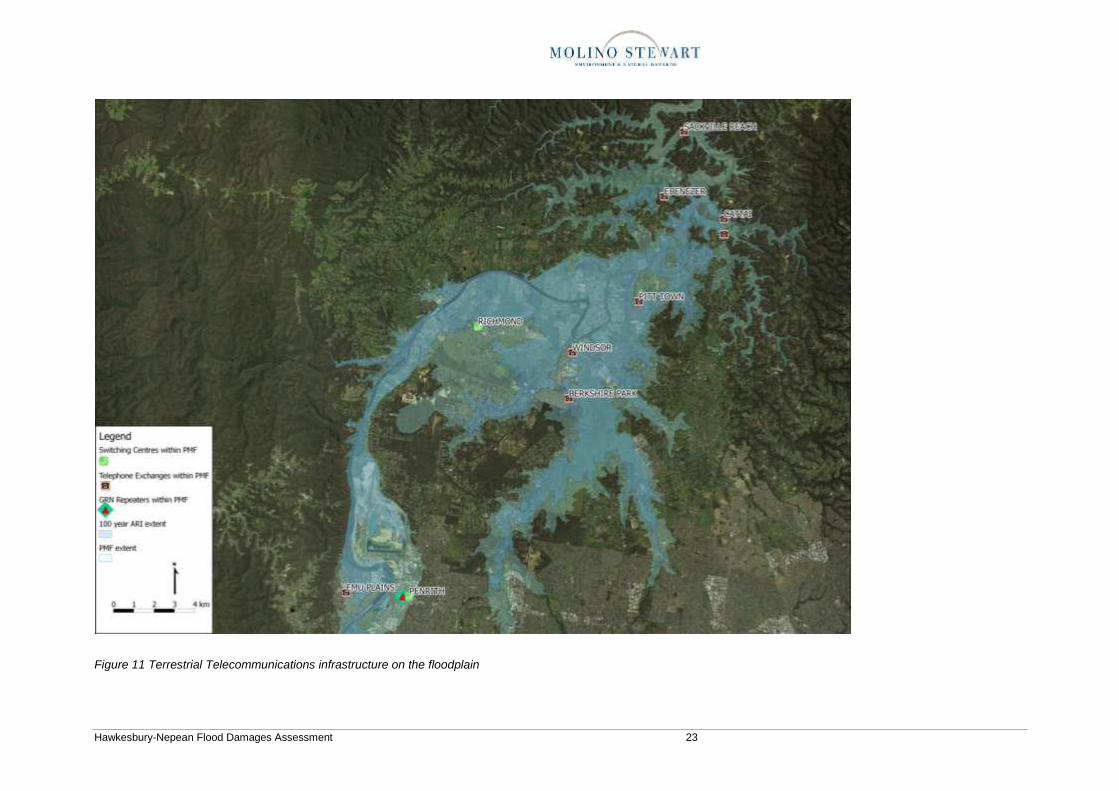
These advances also mean a greater number
of towers and infrastructure in the floodplain,
however the extent of infrastructure
development is unknown. Known
infrastructure is presented in Figure 11.
Due to the ambiguity around the changes in
telecommunications infrastructure in the
Valley, the damage calculations have been
estimated by inflating the 1997 EIS damages
using CPI.
Hawkesbury-Nepean Flood Damages Assessment 23
Figure 11 Terrestrial Telecommunications infrastructure on the floodplain
24 Infrastructure NSW
2.2.11 Gas & Oil
The natural gas supply to Sydney,
Wollongong, the Central Coast and Newcastle
comes by transmission pipeline from South
Australia via Wilton. The line runs north east
from Wilton to Windsor before crossing the
Hawkesbury River downstream of Wisemans
Ferry. The line lies below the bed of the river
and is covered by rock ballast to protect it from
scouring.
Caltex Oil Australia Pty Limited has a
petroleum products pipeline which crosses the
eastern part of the study area. The pipeline
delivers gasoline, distillate and jet fuel from the
Kurnell Refinery to Newcastle.
At Plumpton there is a remotely operated
pump station. From Plumpton the line extends
north west along the gas pipeline easement
and consists of a 300mm diameter steel pipe
buried about one metre below the surface.
The Sydney to Newcastle Gas Pipeline and
the Caltex Oil Pipeline would be susceptible to
flood damage at the Hawkesbury River
crossing. Erosion of the river banks or the bed
itself could rupture the pipes or destroy a 400
to 600 metre section of each pipeline.
In the 1990s the then owner of the gas
pipeline, AGL, suggested that this might be a
possibility in extreme floods. More recently,
the current owners, Jemena, advised that even
in the most extreme floods it would be unlikely
that this line would be lost.
In the absence of greater certainty, this report
used the gas and oil damages calculated in
1997 and inflated them using the CPI.
2.2.12 Sand & Gravel
The Nepean/Hawkesbury floodplain is the
main source of sand and gravel for Sydney's
construction industry.
The gravels and sands are obtained from
deposits either adjacent to the river or, in the
case of sand, within the river channel.
The Penrith Lakes Scheme is the largest sand
and gravel quarry in Australia, is operated by
three shareholders, Boral, Holcim and Hanson
(Heidelberg) and supplies over 50% of the
Sydney market with sand and aggregate.
Quarry activities will cease in the near future
and planning for the remediation of the Penrith
Lakes site is well underway.
In 1992, data on damage costs for the industry
were obtained from Pioneer Concrete, Boral
and the Quarry Masters Association. The
Quarry Masters Association provided details
on the value of all other extractive industries
including the major CSR Readymix facility at
Penrith Lakes and several smaller operations.
Since the 1992 data was collected, the
quarrying component and associated plant of
the Penrith Lakes Scheme has been
significantly reduced.
In this assessment damages have been
calculated as 50% of the 1997 EIS damages
and inflated using CPI.
2.2.13 Defence
Previously there had been two Defence
facilities at risk: the RAAF base at Richmond
and the St Marys munitions filling factory.
The latter has since closed and is being
redeveloped for housing.
Richmond Air Base remains a principal
transport facility for the RAAF and has
developed into a large establishment with
several hundred buildings..
In the 1997 EIS, likely damages at Richmond
were assessed for all major buildings.
Allowances were made in the damage
assessment for building failure and the loss of
aircraft which would be in maintenance and not
able to be flown out.
In this report, damages to defence have been
calculated by subtracting the St Marys
munitions factory damages from the 1997 EIS
values and then inflating using CPI.
2.2.14 Erosion
Erosion and sedimentation occurs after rainfall
or flooding events. Soil and sediment is
washed into rivers, creeks and streams, and
can clog stormwater drains.
Hawkesbury-Nepean Flood Damages Assessment 25
Large amounts of sediment are moved during
floods. Erosion of material in one location
results in sedimentation in another. Damage
to the river channel and floodplain caused by
erosion and sedimentation can be substantial.
Types of damage which may occur include:
collapse or undermining of river banks through erosion, which may then threaten structures such as houses, bridges, weirs, buried pipelines and roads
erosion of local areas in the floodplain, particularly at points of hydraulic control, such as road formations
clean-up costs for deposited materials
In the 1997 EIS damage estimates from
erosion and sedimentation were only indicative
due to a lack of available information. For
estimation purposes, damages were assumed
to be 2.2% of total direct damages for all
events.
In this assessment damages have been
calculated using the 1997 values updated with
the current CPI.
2.2.15 Emergency Services
During and after a flood there would be an
increased demand for emergency services.
These services include:
Police
Ambulance
Fire Brigade
State Emergency Service
possibly the armed forces
In the 1997 EIS it was reasoned that these
services are provided for emergencies such as
flooding and their cost is committed anyway.
There are emergency service facilities in the
floodplain which are impacted by flooding (see
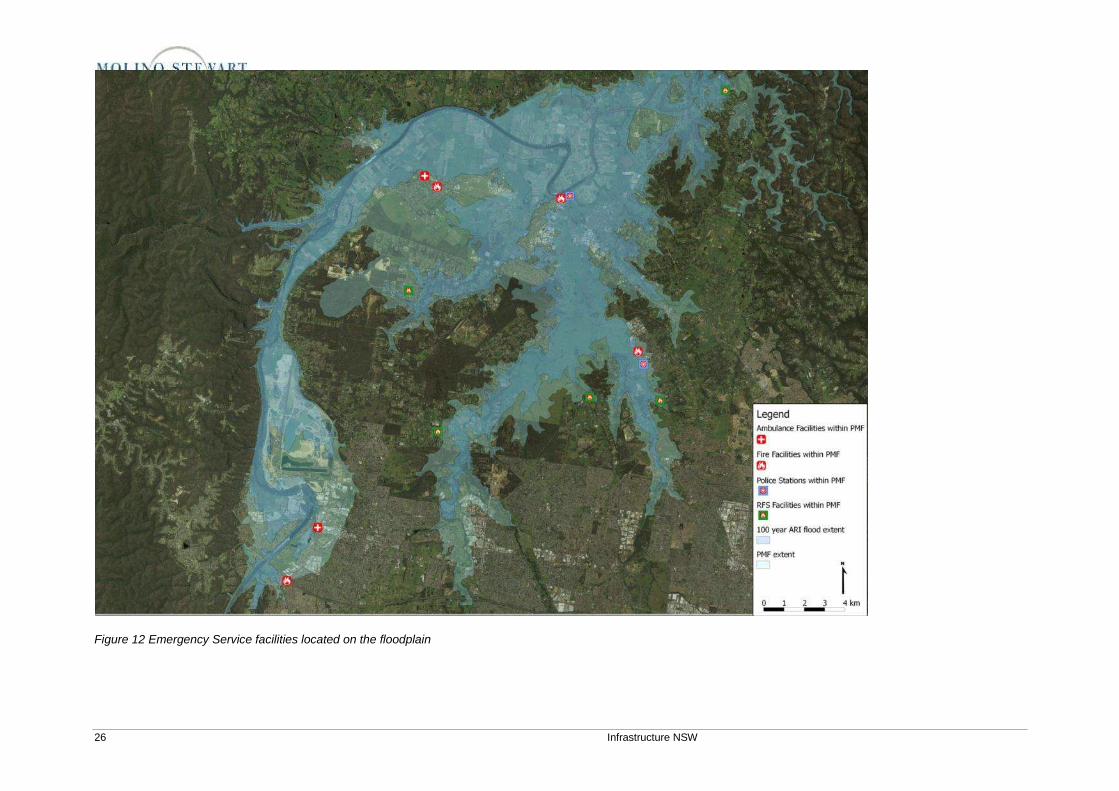
Figure 12 ) but damage to these is accounted
for in the commercial and industrial damage
estimates.
Indirect damages for emergency services were
assessed as the cost of mobilising these
services in a flood. In 1997 this was estimated
as a cost per flood affected property with the
cost per property decreasing as the number of
affected properties increased. For this study
the indirect emergency service costs for
residential premises were calculated by
inflating the 1997 cost per affected residence
using the CPI and multiplying by the new total
number of residences. To account for the
contribution of new commercial premises the
1997 estimates for commercial premises were
inflated by CPI and multiplied by 1.25.
2.3 INTANGIBLE DAMAGES
Although it is not realistic to place a monetary
value on intangible damages, it is desirable to
quantify them in some way if that is possible.
Some effort was made in the 1995 EIS to
estimate some intangibles such as loss of life,
illnesses, loss of pets, loss of memorabilia and
business failures. Each was calculated as a
function of the number of residential and
commercial properties flooded and the scale of
flooding.
Research in the past decade suggests that
some of the relationships which were
previously widely used to calculate such
impacts were too simplistic. They could
significantly underestimate or overestimate
these losses. For this preliminary study we
have decided to quantify the number of
buildings affected by flooding and the number
of people living and working on the floodplain.
This gives a sense of the intangible personal
losses which may ensue including loss of life,
illness and injury, loss of pets and memorabilia
and financial hardship.
We have estimated the number of flooded
commercial and industrial buildings and the
number of non-flooded properties which will
not be supplied with electricity as these
provides a sense of the impacts on individuals
and the local economy.
The volumes of raw sewage likely to be
discharged to the river after the flood have also
been estimated to give a sense of the
environmental impacts of flooding.
26 Infrastructure NSW
Figure 12 Emergency Service facilities located on the floodplain
Hawkesbury-Nepean Flood Damages Assessment 27
3 HAWKESBURY NEPEAN FLOOD DAMAGES
3.1 DIRECT TANGIBLE DAMAGES
The direct flood damages for each category
are summarised per event in Table 3. As
would be expected, agricultural and road
damages dominate in the smaller events. For
larger events, the greatest direct damages will
be to residential properties, followed by
commercial/industrial development. These
represent around two thirds of the direct
damage. Water, sewerage, electricity and
defence infrastructure. are all significant
contributors to the total direct damages.
A repeat of the 1867 flood could be expected
to flood nearly 7,000 homes, structurally
damaging 1,200 of them and causing total
direct damages in the order of $1.7 billion.
This compares to the 2011 Brisbane River
flood in which more than 20,000 homes were
flooded and it cost Brisbane City Council more
than $440 million in infrastructure repairs.
Of special consideration is the number of
residential properties affected by each event.
These are summarised in Table 5. It can be
seen that progressively larger events will result
in more properties that have above ground and
above floor flooding. Similarly, the number of
buildings likely to suffer significant structural
damage will increase markedly as the floods
become more severe.
For economic analyses the total damages in
each event are reduced to average annual
damages (AAD) which takes into account the
probability of the damages being repeated
over a long period of time. This is discussed
further in Section 3.3 and is used for the
economic analyses in Chapter 5.
However, it is also worth considering the
financial implications of flood damages on
individuals. Research suggests that there is a
‘threshold of affordability’ of flood damages
that households can afford to recover from
over time (Hawkesbury Nepean Floodplain
Management Steering Committee, 2006). This
varies greatly between households depending
on household incomes, whether renting or
owning, years remaining of mortgage, age of
occupants and the time after purchase that the
flood occurs. The research suggests than an
average value of about $60,000 was the
threshold of affordability in 2001 dollars.
Inflating this by CPI to December 2011 dollars
results in a threshold of approximately
$80,0000. Table 5 includes an estimate of the
number of properties that would suffer
damages to a greater value than $80,000
dollars. It shows that were a repeat of the 1867
flood to occur (1 in 200 year event) than
approximately 5,000 residences would not be
able to afford the cost of the flood damages.
Residential flood insurance was generally not
available in Australia prior to 2007 but is now
being offered by insurance companies to
residents of the Hawkesbury Nepean Valley.
While insurance would be one way in which
households could mitigate their risk of
unaffordable flood losses, the affordability of
premiums is also a consideration. The AAD
for residential direct and indirect damages
alone is about $20 million. This would require
an average annual insurance premium of more
than $1,000 to be paid by each of the 19,000
households below the PMF just to cover the
flood losses let alone the insurance
companies’ administrative and reinsurance
costs.
It should also be noted that these damage
estimates exclude the cost of rebuilding
dwellings which fail structurally. Were those
costs included then the number of households
unable to afford the flood damages and the
cost of insurance premiums would increase
substantially.
3.2 INDIRECT TANGIBLE DAMAGES
The indirect flood damages for each category
are summarised per event in Table 4. As with
direct damages, the greatest indirect damages
in larger events will be to residential properties
followed by commercial and industrial
properties. Agriculture and infrastructure
categories contribute greater proportions in
smaller events.
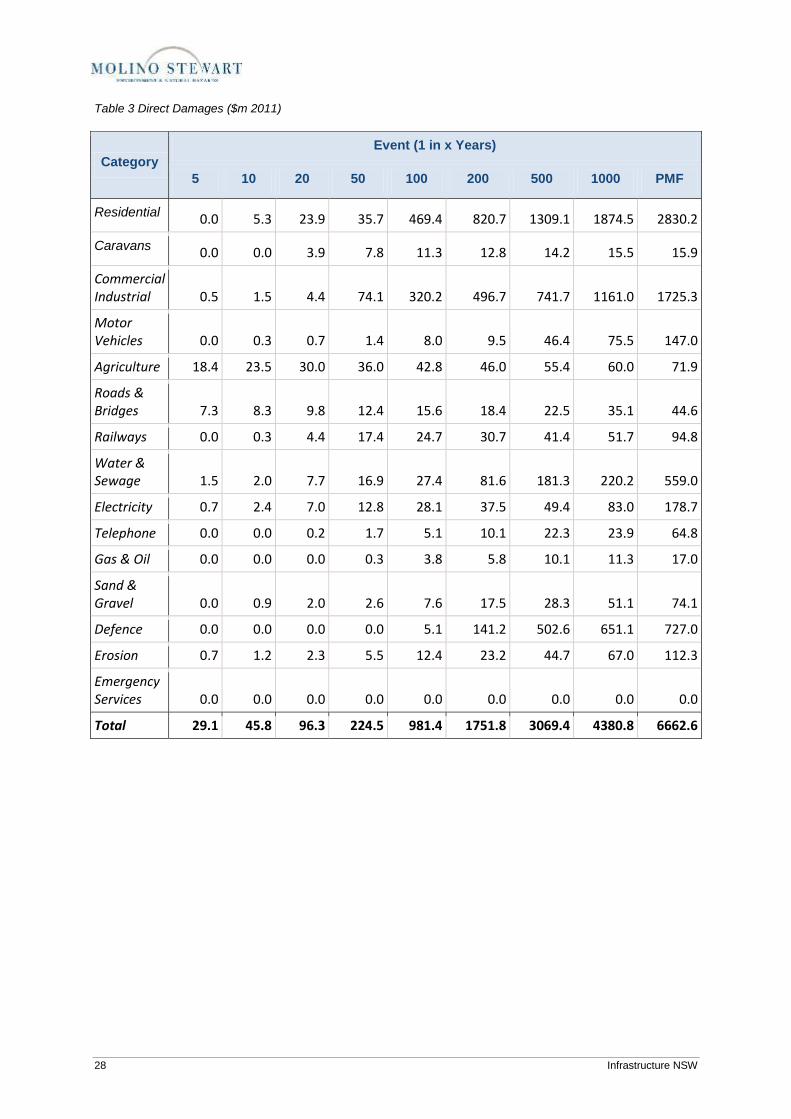
28 Infrastructure NSW
Table 3 Direct Damages ($m 2011)
Category
Event (1 in x Years)
5 10 20 50 100 200 500 1000 PMF
Residential 0.0 5.3 23.9 35.7 469.4 820.7 1309.1 1874.5 2830.2
Caravans 0.0 0.0 3.9 7.8 11.3 12.8 14.2 15.5 15.9
Commercial Industrial 0.5 1.5 4.4 74.1 320.2 496.7 741.7 1161.0 1725.3
Motor Vehicles 0.0 0.3 0.7 1.4 8.0 9.5 46.4 75.5 147.0
Agriculture 18.4 23.5 30.0 36.0 42.8 46.0 55.4 60.0 71.9
Roads & Bridges 7.3 8.3 9.8 12.4 15.6 18.4 22.5 35.1 44.6
Railways 0.0 0.3 4.4 17.4 24.7 30.7 41.4 51.7 94.8
Water & Sewage 1.5 2.0 7.7 16.9 27.4 81.6 181.3 220.2 559.0
Electricity 0.7 2.4 7.0 12.8 28.1 37.5 49.4 83.0 178.7
Telephone 0.0 0.0 0.2 1.7 5.1 10.1 22.3 23.9 64.8
Gas & Oil 0.0 0.0 0.0 0.3 3.8 5.8 10.1 11.3 17.0
Sand & Gravel 0.0 0.9 2.0 2.6 7.6 17.5 28.3 51.1 74.1
Defence 0.0 0.0 0.0 0.0 5.1 141.2 502.6 651.1 727.0
Erosion 0.7 1.2 2.3 5.5 12.4 23.2 44.7 67.0 112.3
Emergency Services 0.0 0.0 0.0 0.0 0.0 0.0 0.0 0.0 0.0
Total 29.1 45.8 96.3 224.5 981.4 1751.8 3069.4 4380.8 6662.6
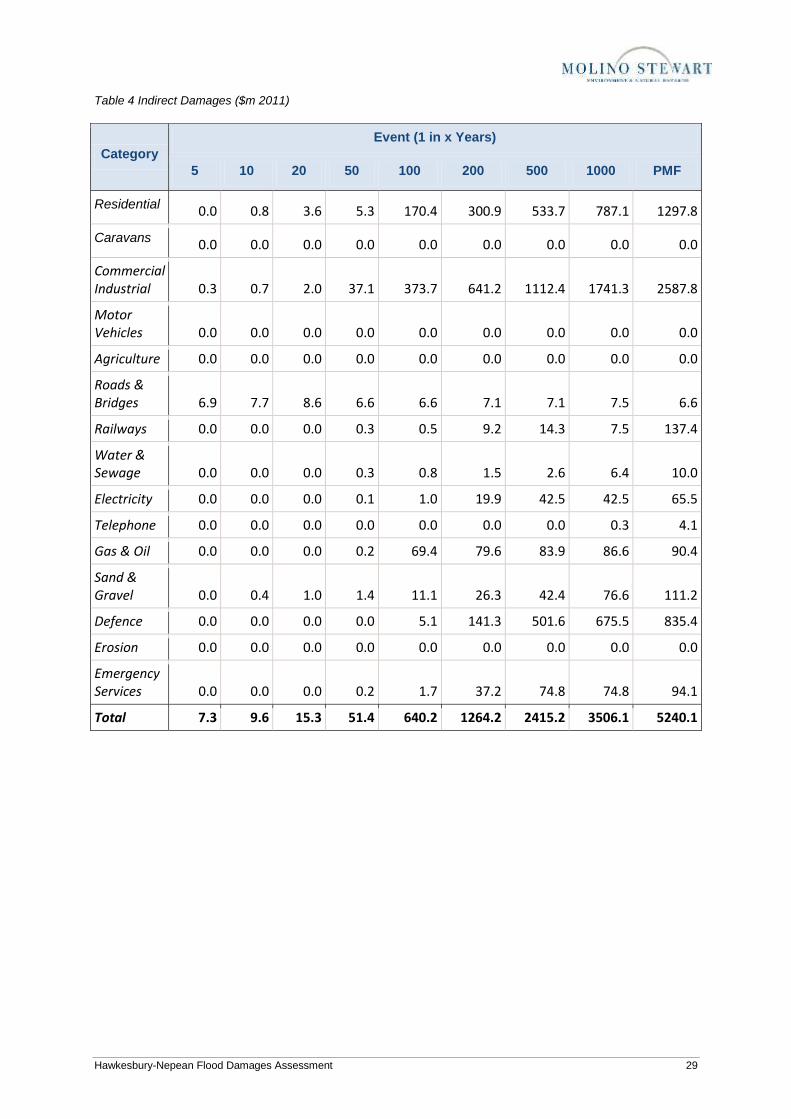
Hawkesbury-Nepean Flood Damages Assessment 29
Table 4 Indirect Damages ($m 2011)
Category
Event (1 in x Years)
5 10 20 50 100 200 500 1000 PMF
Residential 0.0 0.8 3.6 5.3 170.4 300.9 533.7 787.1 1297.8
Caravans 0.0 0.0 0.0 0.0 0.0 0.0 0.0 0.0 0.0
Commercial Industrial 0.3 0.7 2.0 37.1 373.7 641.2 1112.4 1741.3 2587.8
Motor Vehicles 0.0 0.0 0.0 0.0 0.0 0.0 0.0 0.0 0.0
Agriculture 0.0 0.0 0.0 0.0 0.0 0.0 0.0 0.0 0.0
Roads & Bridges 6.9 7.7 8.6 6.6 6.6 7.1 7.1 7.5 6.6
Railways 0.0 0.0 0.0 0.3 0.5 9.2 14.3 7.5 137.4
Water & Sewage 0.0 0.0 0.0 0.3 0.8 1.5 2.6 6.4 10.0
Electricity 0.0 0.0 0.0 0.1 1.0 19.9 42.5 42.5 65.5
Telephone 0.0 0.0 0.0 0.0 0.0 0.0 0.0 0.3 4.1
Gas & Oil 0.0 0.0 0.0 0.2 69.4 79.6 83.9 86.6 90.4
Sand & Gravel 0.0 0.4 1.0 1.4 11.1 26.3 42.4 76.6 111.2
Defence 0.0 0.0 0.0 0.0 5.1 141.3 501.6 675.5 835.4
Erosion 0.0 0.0 0.0 0.0 0.0 0.0 0.0 0.0 0.0
Emergency Services 0.0 0.0 0.0 0.2 1.7 37.2 74.8 74.8 94.1
Total 7.3 9.6 15.3 51.4 640.2 1264.2 2415.2 3506.1 5240.1
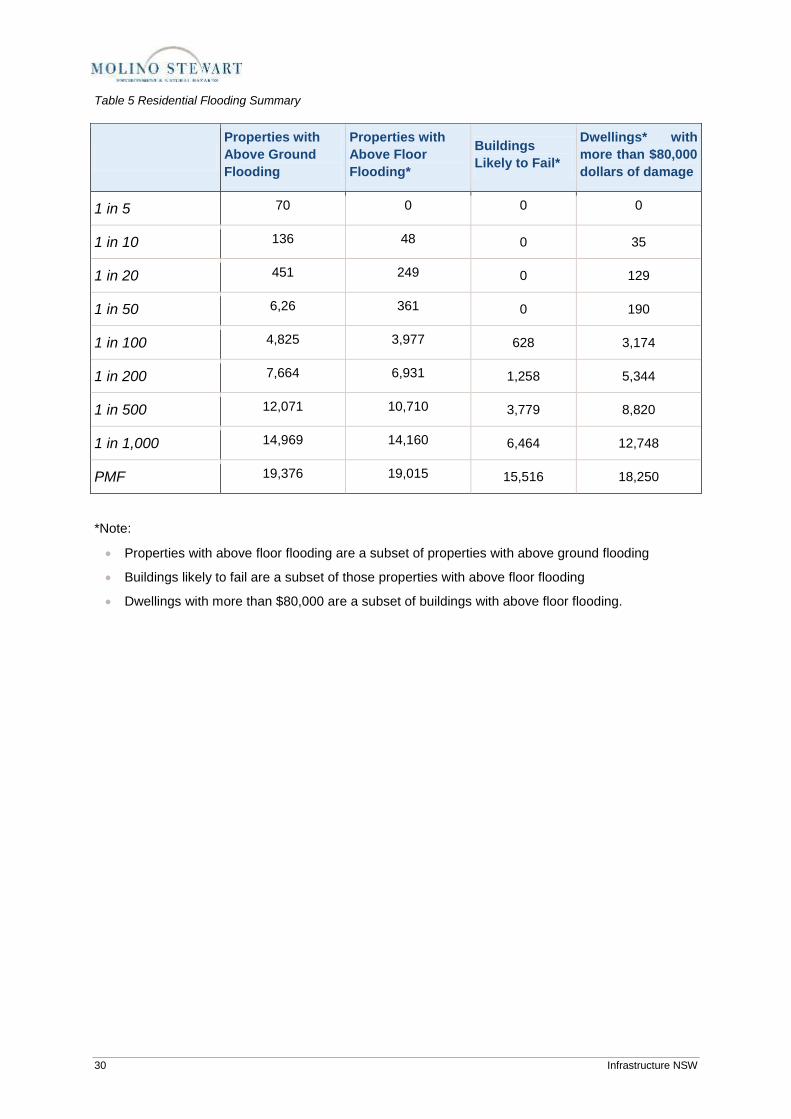
30 Infrastructure NSW
Table 5 Residential Flooding Summary
Properties with
Above Ground
Flooding
Properties with
Above Floor
Flooding*
Buildings
Likely to Fail*
Dwellings* with
more than $80,000
dollars of damage
1 in 5 70 0 0 0
1 in 10 136 48 0 35
1 in 20 451 249 0 129
1 in 50 6,26 361 0 190
1 in 100 4,825 3,977 628 3,174
1 in 200 7,664 6,931 1,258 5,344
1 in 500 12,071 10,710 3,779 8,820
1 in 1,000 14,969 14,160 6,464 12,748
PMF 19,376 19,015 15,516 18,250
*Note:
Properties with above floor flooding are a subset of properties with above ground flooding
Buildings likely to fail are a subset of those properties with above floor flooding
Dwellings with more than $80,000 are a subset of buildings with above floor flooding.
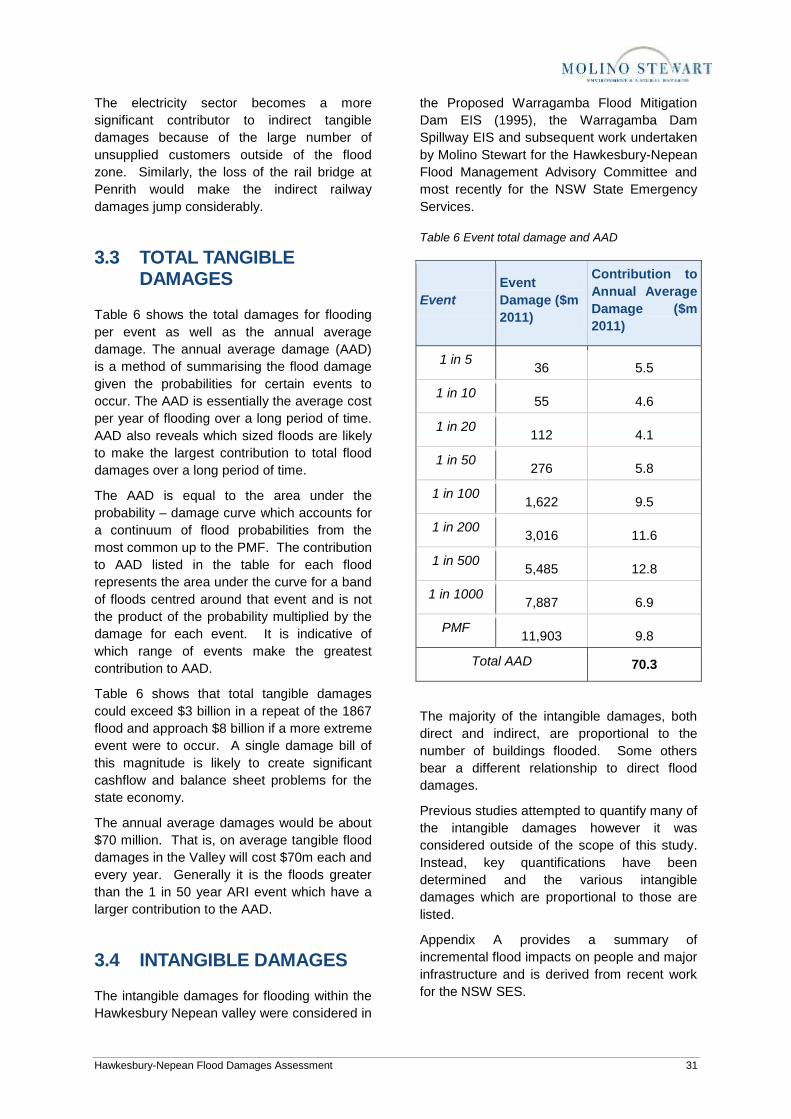
Hawkesbury-Nepean Flood Damages Assessment 31
The electricity sector becomes a more
significant contributor to indirect tangible
damages because of the large number of
unsupplied customers outside of the flood
zone. Similarly, the loss of the rail bridge at
Penrith would make the indirect railway
damages jump considerably.
3.3 TOTAL TANGIBLE DAMAGES
Table 6 shows the total damages for flooding
per event as well as the annual average
damage. The annual average damage (AAD)
is a method of summarising the flood damage
given the probabilities for certain events to
occur. The AAD is essentially the average cost
per year of flooding over a long period of time.
AAD also reveals which sized floods are likely
to make the largest contribution to total flood
damages over a long period of time.
The AAD is equal to the area under the
probability – damage curve which accounts for
a continuum of flood probabilities from the
most common up to the PMF. The contribution
to AAD listed in the table for each flood
represents the area under the curve for a band
of floods centred around that event and is not
the product of the probability multiplied by the
damage for each event. It is indicative of
which range of events make the greatest
contribution to AAD.
Table 6 shows that total tangible damages
could exceed $3 billion in a repeat of the 1867
flood and approach $8 billion if a more extreme
event were to occur. A single damage bill of
this magnitude is likely to create significant
cashflow and balance sheet problems for the
state economy.
The annual average damages would be about
$70 million. That is, on average tangible flood
damages in the Valley will cost $70m each and
every year. Generally it is the floods greater
than the 1 in 50 year ARI event which have a
larger contribution to the AAD.
3.4 INTANGIBLE DAMAGES
The intangible damages for flooding within the
Hawkesbury Nepean valley were considered in
the Proposed Warragamba Flood Mitigation
Dam EIS (1995), the Warragamba Dam
Spillway EIS and subsequent work undertaken
by Molino Stewart for the Hawkesbury-Nepean
Flood Management Advisory Committee and
most recently for the NSW State Emergency
Services.
Table 6 Event total damage and AAD
Event
Event
Damage ($m
2011)
Contribution to
Annual Average
Damage ($m
2011)
1 in 5 36 5.5
1 in 10 55 4.6
1 in 20 112 4.1
1 in 50 276 5.8
1 in 100 1,622 9.5
1 in 200 3,016 11.6
1 in 500 5,485 12.8
1 in 1000 7,887 6.9
PMF 11,903 9.8
Total AAD 70.3
The majority of the intangible damages, both
direct and indirect, are proportional to the
number of buildings flooded. Some others
bear a different relationship to direct flood
damages.
Previous studies attempted to quantify many of
the intangible damages however it was
considered outside of the scope of this study.
Instead, key quantifications have been
determined and the various intangible
damages which are proportional to those are
listed.
Appendix A provides a summary of
incremental flood impacts on people and major
infrastructure and is derived from recent work
for the NSW SES.
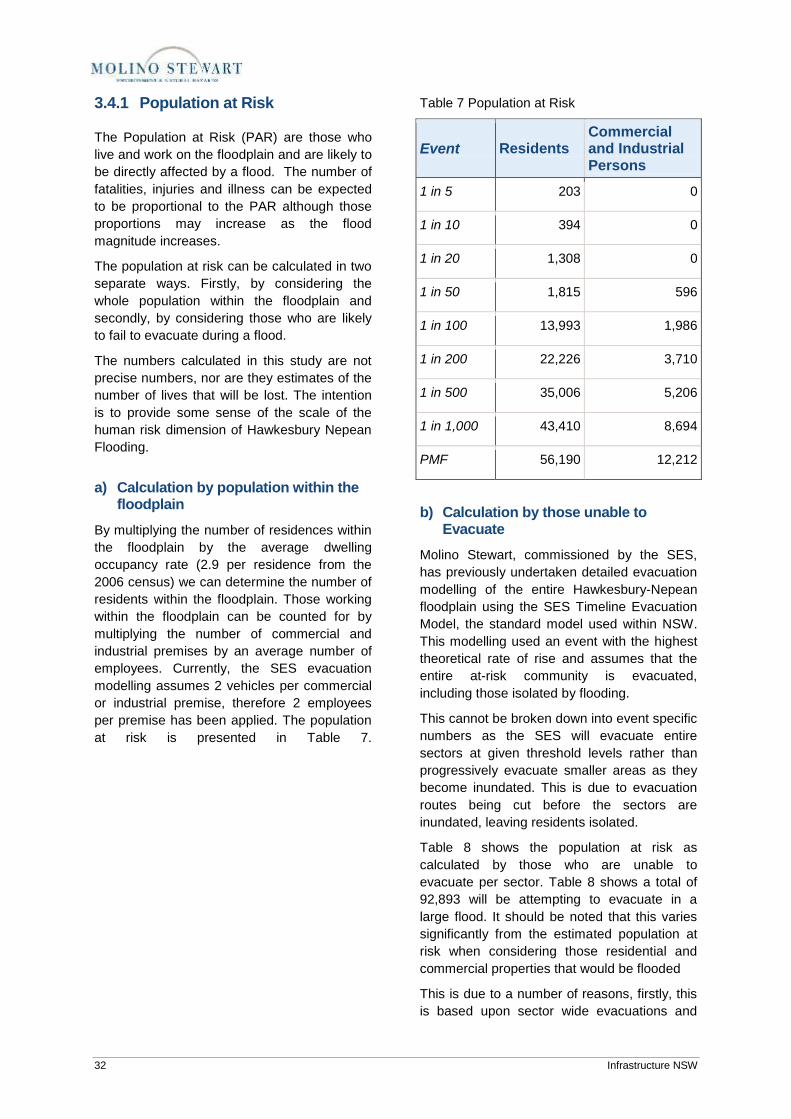
32 Infrastructure NSW
3.4.1 Population at Risk
The Population at Risk (PAR) are those who
live and work on the floodplain and are likely to
be directly affected by a flood. The number of
fatalities, injuries and illness can be expected
to be proportional to the PAR although those
proportions may increase as the flood
magnitude increases.
The population at risk can be calculated in two
separate ways. Firstly, by considering the
whole population within the floodplain and
secondly, by considering those who are likely
to fail to evacuate during a flood.
The numbers calculated in this study are not
precise numbers, nor are they estimates of the
number of lives that will be lost. The intention
is to provide some sense of the scale of the
human risk dimension of Hawkesbury Nepean
Flooding.
a) Calculation by population within the floodplain
By multiplying the number of residences within
the floodplain by the average dwelling
occupancy rate (2.9 per residence from the
2006 census) we can determine the number of
residents within the floodplain. Those working
within the floodplain can be counted for by
multiplying the number of commercial and
industrial premises by an average number of
employees. Currently, the SES evacuation
modelling assumes 2 vehicles per commercial
or industrial premise, therefore 2 employees
per premise has been applied. The population
at risk is presented in Table 7.
Table 7 Population at Risk
Event Residents Commercial and Industrial Persons
1 in 5 203 0
1 in 10 394 0
1 in 20 1,308 0
1 in 50 1,815 596
1 in 100 13,993 1,986
1 in 200 22,226 3,710
1 in 500 35,006 5,206
1 in 1,000 43,410 8,694
PMF 56,190 12,212
b) Calculation by those unable to Evacuate
Molino Stewart, commissioned by the SES,
has previously undertaken detailed evacuation
modelling of the entire Hawkesbury-Nepean
floodplain using the SES Timeline Evacuation
Model, the standard model used within NSW.
This modelling used an event with the highest
theoretical rate of rise and assumes that the
entire at-risk community is evacuated,
including those isolated by flooding.
This cannot be broken down into event specific
numbers as the SES will evacuate entire
sectors at given threshold levels rather than
progressively evacuate smaller areas as they
become inundated. This is due to evacuation
routes being cut before the sectors are
inundated, leaving residents isolated.
Table 8 shows the population at risk as
calculated by those who are unable to
evacuate per sector. Table 8 shows a total of
92,893 will be attempting to evacuate in a
large flood. It should be noted that this varies
significantly from the estimated population at
risk when considering those residential and
commercial properties that would be flooded
This is due to a number of reasons, firstly, this
is based upon sector wide evacuations and
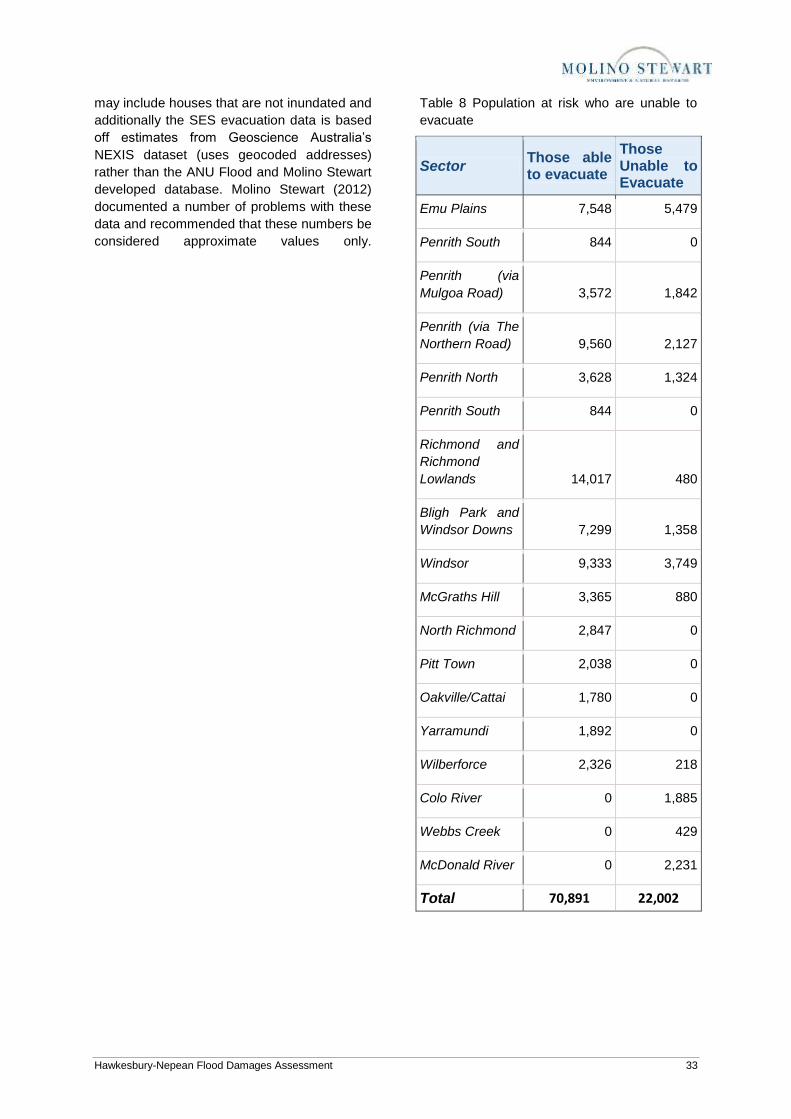
Hawkesbury-Nepean Flood Damages Assessment 33
may include houses that are not inundated and
additionally the SES evacuation data is based
off estimates from Geoscience Australia’s
NEXIS dataset (uses geocoded addresses)
rather than the ANU Flood and Molino Stewart
developed database. Molino Stewart (2012)
documented a number of problems with these
data and recommended that these numbers be
considered approximate values only.
Table 8 Population at risk who are unable to
evacuate
Sector Those able to evacuate
Those Unable to Evacuate
Emu Plains 7,548 5,479
Penrith South 844 0
Penrith (via
Mulgoa Road) 3,572 1,842
Penrith (via The
Northern Road) 9,560 2,127
Penrith North 3,628 1,324
Penrith South 844 0
Richmond and
Richmond
Lowlands 14,017 480
Bligh Park and
Windsor Downs 7,299 1,358
Windsor 9,333 3,749
McGraths Hill 3,365 880
North Richmond 2,847 0
Pitt Town 2,038 0
Oakville/Cattai 1,780 0
Yarramundi 1,892 0
Wilberforce 2,326 218
Colo River 0 1,885
Webbs Creek 0 429
McDonald River 0 2,231
Total 70,891 22,002

34 Infrastructure NSW
3.4.2 Intangible Damages Proportional to PAR
a) Pets and Memorabilia
Pets are generally considered as another
member of the family and previous studies
have shown that approximately one in three
residences have a cat and one in three
residences have a dog. While most of those
who evacuate are likely to take their pets with
them, it is highly likely that many pets will be
stranded and overwhelmed by flood waters or
lost.
Similarly, it is likely that memorabilia such as
photo albums, awards etc. that have a high
sentimental value will be taken with those
residents that evacuate. However it is likely
that in a larger sized event, much memorabilia
would be lost.
b) Fatalities
The number of fatalities directly attributable to
flooding, by drowning, electrocution and
accidents is mainly a function of water velocity
and depth, particularly along transport routes.
Other contributing factors include warnings,
the preparedness of the community, the
vulnerability of the population and temperature.
Various studies have been undertaken over
the years to estimate the number of fatalities
as a proportion of PAR but no reliable, simple
relationship has been identified.
About 90% of flood fatalities in Australia in
recent decades are a result of people
deliberately entering floodwaters. However,
the recent Queensland floods resulted in about
one third of the nearly 40 fatalities being
caused by people being swept from their
homes. This shows that extreme flood events
with little warning can have very different
fatality consequences to other floods.
There are methods available for placing a
value on human life but these are not
universally accepted. Since it is not realistic to
put a figure on the number of lives which could
be lost in floods in the Valley is was decided
for this study to quantify risk to life in terms of
population at risk and no attempt was made to
put a monetary value on flood risk to life.
c) Health Effects
Direct contact with flood waters can cause
some residents to suffer illness, injury or
possibly death. Far more widespread,
however, is the trauma and stress which arises
from being evacuated, losing property,
cleaning up and having to cope with severely
disrupted living conditions. This can lead to
the onset of stress induced illnesses, the
aggravation of existing illnesses and in some
cases premature death.
These damages vary with the number of
people exposed, the velocity and depth of
flood waters and the extent of community
preparedness.
There is also a linkage between stressful
events such as floods, and ill health. The
degree to which flooding affects the health of
those inundated depends on flood
preparedness, personal experience, the extent
of flooding and a range of individual family and
social factors influencing peoples' ability to
cope.
It is recognised that flood-induced stress may
also cause premature death but it is not
possible to place a realistic figure on this.
3.4.3 Intangible Socio-Economic Damages
a) Business Liquidations
If a commercial or industrial building
undergoes significant inundation, structural
damage or both as a result of a flood, it is likely
that many of the businesses that operate out of
the building will not be able to recover after the
flood and will need to be liquidated.
Research in the US shows that approximately
30% of businesses go out of business
following a natural disaster. It is likely that
most of the employees of these businesses
reside within the Hawkesbury Valley and are
likely to lose their job as a result of the
business failure. Table 9 shows the number of
commercial and industrial premises that would
flood under different events with the 1988 level
of development. Unfortunately no data was
available to update these numbers but it does
provide a lower bound for what would be the
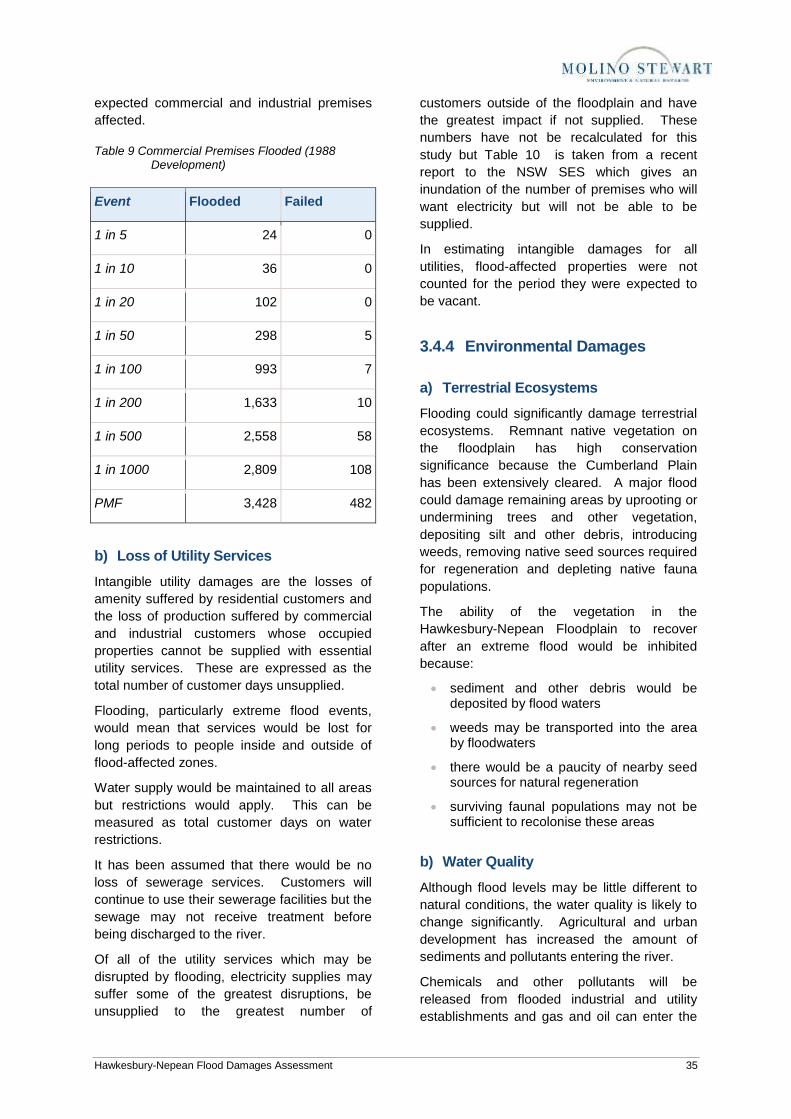
Hawkesbury-Nepean Flood Damages Assessment 35
expected commercial and industrial premises
affected.
Table 9 Commercial Premises Flooded (1988 Development)
Event Flooded Failed
1 in 5 24 0
1 in 10 36 0
1 in 20 102 0
1 in 50 298 5
1 in 100 993 7
1 in 200 1,633 10
1 in 500 2,558 58
1 in 1000 2,809 108
PMF 3,428 482
b) Loss of Utility Services
Intangible utility damages are the losses of
amenity suffered by residential customers and
the loss of production suffered by commercial
and industrial customers whose occupied
properties cannot be supplied with essential
utility services. These are expressed as the
total number of customer days unsupplied.
Flooding, particularly extreme flood events,
would mean that services would be lost for
long periods to people inside and outside of
flood-affected zones.
Water supply would be maintained to all areas
but restrictions would apply. This can be
measured as total customer days on water
restrictions.
It has been assumed that there would be no
loss of sewerage services. Customers will
continue to use their sewerage facilities but the
sewage may not receive treatment before
being discharged to the river.
Of all of the utility services which may be
disrupted by flooding, electricity supplies may
suffer some of the greatest disruptions, be
unsupplied to the greatest number of
customers outside of the floodplain and have
the greatest impact if not supplied. These
numbers have not be recalculated for this
study but Table 10 is taken from a recent
report to the NSW SES which gives an
inundation of the number of premises who will
want electricity but will not be able to be
supplied.
In estimating intangible damages for all
utilities, flood-affected properties were not
counted for the period they were expected to
be vacant.
3.4.4 Environmental Damages
a) Terrestrial Ecosystems
Flooding could significantly damage terrestrial
ecosystems. Remnant native vegetation on
the floodplain has high conservation
significance because the Cumberland Plain
has been extensively cleared. A major flood
could damage remaining areas by uprooting or
undermining trees and other vegetation,
depositing silt and other debris, introducing
weeds, removing native seed sources required
for regeneration and depleting native fauna
populations.
The ability of the vegetation in the
Hawkesbury-Nepean Floodplain to recover
after an extreme flood would be inhibited
because:
sediment and other debris would be deposited by flood waters
weeds may be transported into the area by floodwaters
there would be a paucity of nearby seed sources for natural regeneration
surviving faunal populations may not be sufficient to recolonise these areas
b) Water Quality
Although flood levels may be little different to
natural conditions, the water quality is likely to
change significantly. Agricultural and urban
development has increased the amount of
sediments and pollutants entering the river.
Chemicals and other pollutants will be
released from flooded industrial and utility
establishments and gas and oil can enter the

36 Infrastructure NSW
river environs where supply mains are
ruptured. Although the quantities of pollutants
released will be significant, they will be small
relative to the volume of flood waters. They
are therefore not considered to have a
significant environmental cost.
However untreated sewage discharging to the
river will be a significant long term pollution
problem following extreme floods. Plants will
fail and may take many months to be brought
back into service.
Table 11 shows how long it would take to
restore each STP following a flood and Table
12 provides an indication of how many
megalitres of untreated sewage could be
discharged to the River for many months.
Table 10: Premises without electricity 2010
Transmission
Substation
Flood Level (m
AHD)
Days without power
supply Total premises
Total premises
not flooded
Hawkesbury 13.6 2 <1,100* <200*
15.7 2 <700* <3,000*
17.4 14 3,600 2,400
18.2 14 3,600 2,100
19 14 10,200 5,900
2 25,900 20,300
19.6 14 10,200 5,400
2 25,900 19,200
20 90 36,100 23,800
22.1 90 36,100 20,800
26.1 180 36,100 12,700
Penrith 24.9 2 6,200 6,000
26.3 14 6,200 4,900
2 13,700 12,300
27 90 30,639 26,875
29 90 30,639 25,612
33.8 90 30,639 19,498
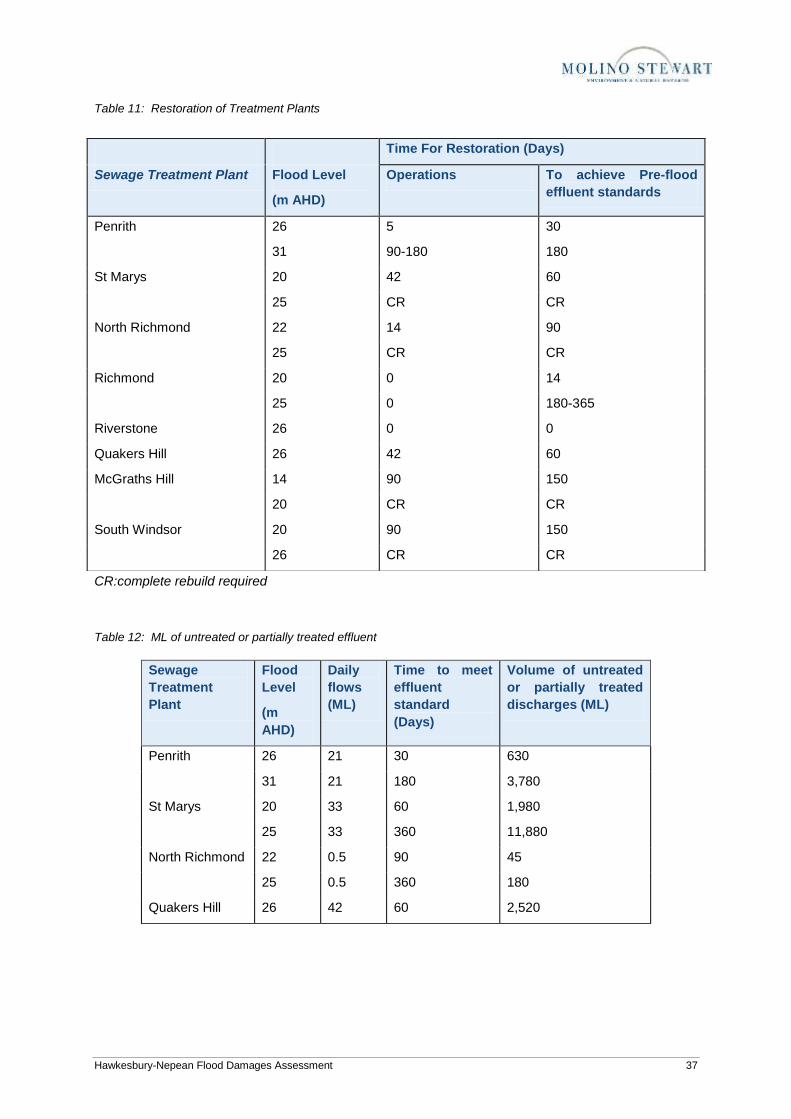
Hawkesbury-Nepean Flood Damages Assessment 37
Table 11: Restoration of Treatment Plants
CR:complete rebuild required
Table 12: ML of untreated or partially treated effluent
Sewage
Treatment
Plant
Flood
Level
(m
AHD)
Daily
flows
(ML)
Time to meet
effluent
standard
(Days)
Volume of untreated
or partially treated
discharges (ML)
Penrith 26 21 30 630
31 21 180 3,780
St Marys 20 33 60 1,980
25 33 360 11,880
North Richmond 22 0.5 90 45
25 0.5 360 180
Quakers Hill 26 42 60 2,520
Time For Restoration (Days)
Sewage Treatment Plant Flood Level
(m AHD)
Operations To achieve Pre-flood
effluent standards
Penrith 26 5 30
31 90-180 180
St Marys 20 42 60
25 CR CR
North Richmond 22 14 90
25 CR CR
Richmond 20 0 14
25 0 180-365
Riverstone 26 0 0
Quakers Hill 26 42 60
McGraths Hill 14 90 150
20 CR CR
South Windsor 20 90 150
26 CR CR
38 Infrastructure NSW
4 FLOOD MITIGATION
4.1 MITIGATION OPTIONS
4.1.1 Alternative Strategies
When flood mitigation for the Valley was first
investigated in the early 1990s, several broad
strategies and specific options were identified
and investigated to a level of detail that
allowed unviable options to be eliminated and
the others to be investigated further. Many of
these, and some additional options, were
again reviewed in 1997 as part of the
investigations of the Hawkesbury-Nepean
Flood Management Advisory Committee.
Six groups of strategies were considered:
non structural strategies: these do not alter flood levels but reduce the effects of flooding;
asset modifications. These remove vulnerable assets from the floodplain or make them more flood resistant;
floodplain works: localised physical works in the floodplain could be used to divert floodwaters from properties;
drainage strategies: these lower flood levels by assisting floodwaters to escape from the floodplain;
flood detention strategies: these temporarily store floodwaters on contributing rivers and thereby lower peak levels downstream; and
combined strategies: these combine some of the above approaches.
The following summarises the assessment,
and in some cases implementation, of these
options
a) Non- structural strategies
These included:
Flood insurance –neither cost effective nor practical
Flood emergency planning – NSW government has invested heavily in improvements to evacuation infrastructure, improved emergency planning and community education
Town planning - local councils have been encouraged to develop comprehensive floodplain risk management plans. None have done so although all have revised minimum floor levels for new development. This will only mitigate impacts on new development
b) Asset modifications
Property purchase – neither cost effective nor practical
House raising – many buildings are not suitable for this and risk to life would not be significantly reduced for those which are raised
Flood resistant buildings – Australian Building Codes Board has draft standard on exhibition but this will only mitigate impacts on new development
Relocation of infrastructure – not always practical or affordable. Some electricity infrastructure has been recently relocated to a more flood prone area contrary to best practice.
Reconstruction of infrastructure – some sewerage and electricity infrastructure has been reconstructed to be less flood prone
c) Floodplain Works
Levees – would need to be several metres high to exclude 1867 flood, would have significant visual impacts, require demolition of many existing buildings and would increase flooding of buildings outside of the levees. Possibly beneficial in a few selected locations where such impacts are less.
Deflection walls – could reduce flood velocities in some selected locations. Localised benefits only.
d) Drainage Strategies
Dredging – dredging the river bed between Sackville and Wisemans Ferry by 10m would reduce 1867 flood level at Windsor by 2.3m but have no benefits at Penrith. Would require removal and disposal of 20-30 million cubic metres of dredged materials. Was estimated in 1995 to cost more than $350m and would have ongoing costs to prevent resilting.

Hawkesbury-Nepean Flood Damages Assessment 39
River straightening – 23km of meanders between Sackville and Wisemans Ferry could be removed by excavating about 50 million cubic metres of ridgelines. This would lower the 1867 flood by about 1.1m and was estimated to cost $730m in 1995.
e) Flood Detention Strategies
Upstream Dams – dry detention dams on the Wollondilly River and Coxs River upstream of Lake Burragorang could detain enough floodwater to reduce the 1867 flood to about 15m at Windsor. These were estimated to cost about $500m in 1995 but would have a more significant impact on the Blue Mountains World Heritage Area than mitigation storage at Warragamba Dam
Downstream Dams – flood mitigation dams on the Nepean, Grose or Colo rivers were all investigated. They would reduce the 1867 flood by between 0m and 0.7m but each would require a new dam in an environmentally sensitive area.
Change Gate Operation – changing the operation of the spillway gates on Warragamba Dam may be able to slightly mitigate the more frequent floods but would have negligible impact on the 1867 flood. It would reduce the time for emergency response and also run the risk of reducing the secure water supply yield of the Dam.
Deplete Warragamba Storage – Lowering the full supply level by 12m to current spillway crest would reduce the Dam’s water supply storage capacity by 40%. To bring the 1867 flood level down to 16m AHD at Windsor, 90% of the Dam’s water storage capacity would be lost.
Warragamba Wall Raising – identified as the most cost effective flood detention strategy with the least environmental impacts. Carried through for more detailed investigations.
f) Composite Strategies
It was perceived that composite options
combining some of the above strategies could
potentially give a better outcome than any one
strategy on its own.
It became apparent that a combined strategy
would not overcome the major limitations of
any of the individual strategies but would have
total costs and impacts greater than any
strategy considered on its own.
4.1.2 Warragamba Mitigation Dam Options
The 1995 EIS presented a number of options
for building mitigation capacity into
Warragamba Dam. The summary details for
these are presented in Table 13 with each
option being described in terms of the height of
mitigation airspace which could be provided
above full supply level.
The 15 m option required the construction of
an auxiliary spillway in order to pass the PMF
while the other options would pass the PMF
without a spillway. Since the EIS was
produced, the auxiliary spillway has been
constructed and it is expected that the 15
metre option would therefore have a lower cost
and therefore an increased benefit cost ratio to
that which is presented in Table 13.
Based upon the benefit cost ratios, the 1995
EIS chose the 23 m option as the preferred
option and presented detailed analysis only for
this option. This information was required for
this assessment, and so only the 23 m option
was assessed for flood damages at that time.
This has meant that only the mitigated flood
levels for the 23m option have been available
for this study and are discussed in this section.
It is expected that the other options would
have a similar change in benefit cost ratio as
the 23 m option has and the 23m option would
remain the optimal mitigation option.
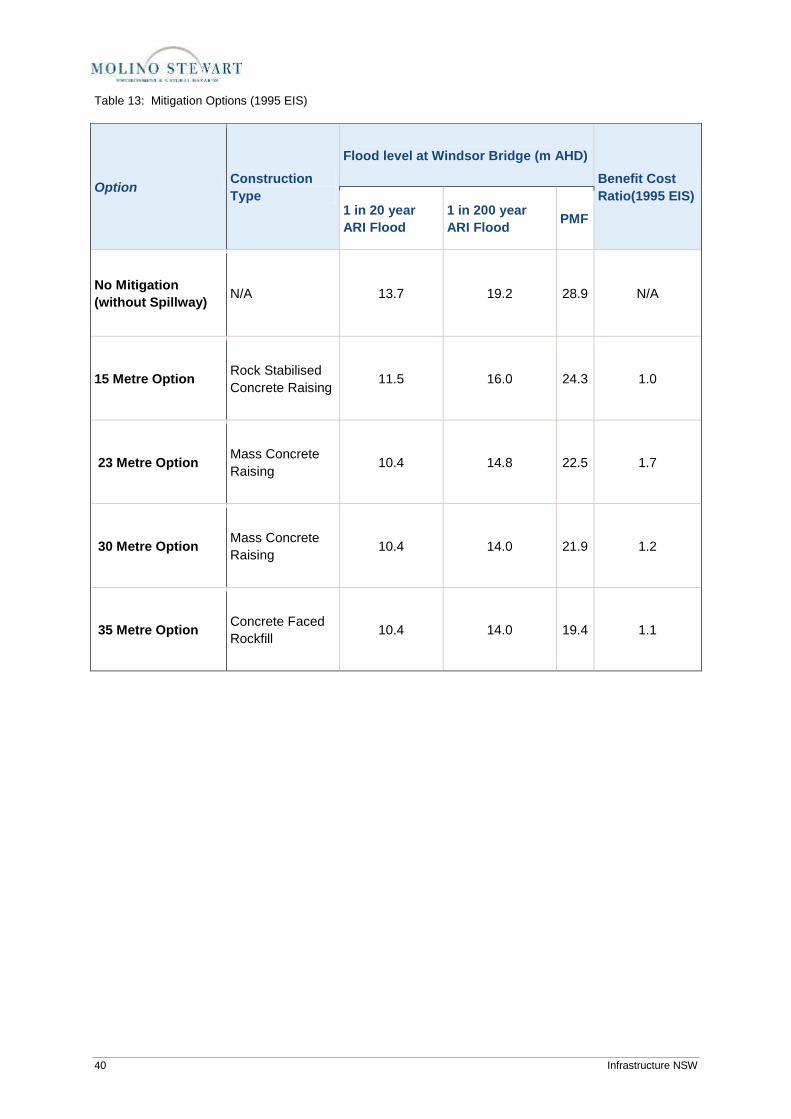
40 Infrastructure NSW
Table 13: Mitigation Options (1995 EIS)
Option Construction
Type
Flood level at Windsor Bridge (m AHD)
Benefit Cost
Ratio(1995 EIS) 1 in 20 year
ARI Flood
1 in 200 year
ARI Flood PMF
No Mitigation
(without Spillway) N/A 13.7 19.2 28.9 N/A
15 Metre Option Rock Stabilised
Concrete Raising 11.5 16.0 24.3 1.0
23 Metre Option Mass Concrete
Raising 10.4 14.8 22.5 1.7
30 Metre Option Mass Concrete
Raising 10.4 14.0 21.9 1.2
35 Metre Option Concrete Faced
Rockfill 10.4 14.0 19.4 1.1
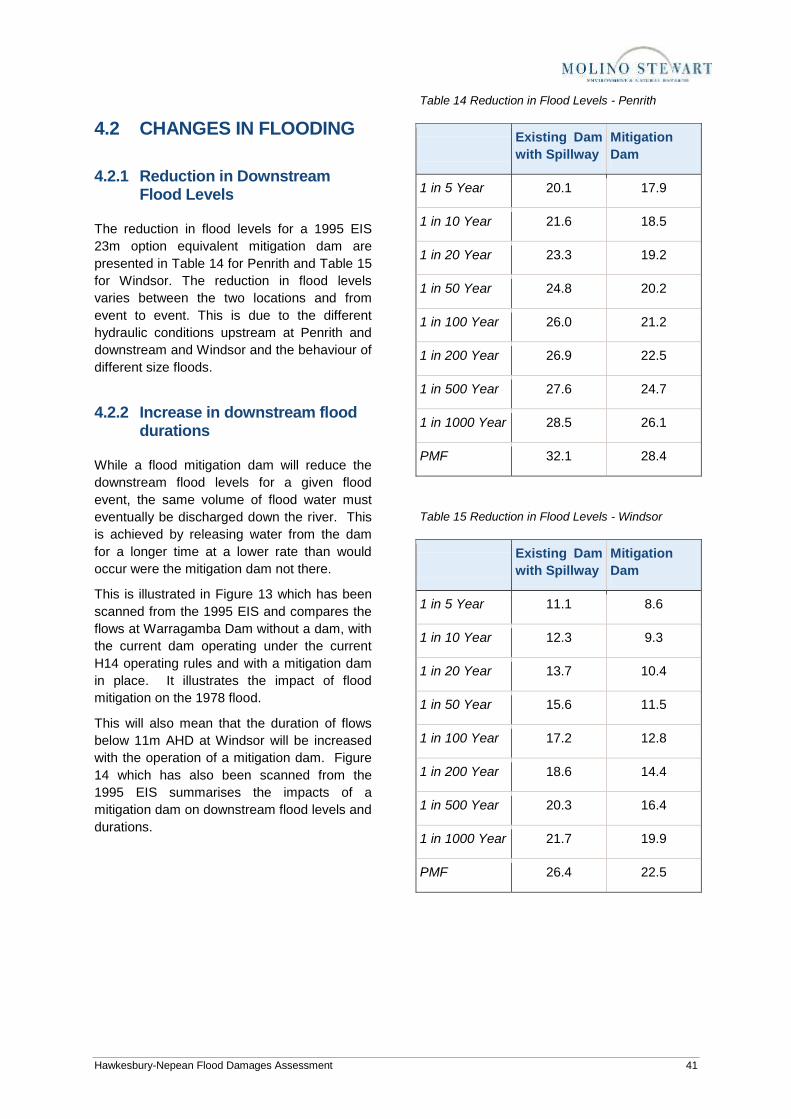
Hawkesbury-Nepean Flood Damages Assessment 41
4.2 CHANGES IN FLOODING
4.2.1 Reduction in Downstream Flood Levels
The reduction in flood levels for a 1995 EIS
23m option equivalent mitigation dam are
presented in Table 14 for Penrith and Table 15
for Windsor. The reduction in flood levels
varies between the two locations and from
event to event. This is due to the different
hydraulic conditions upstream at Penrith and
downstream and Windsor and the behaviour of
different size floods.
4.2.2 Increase in downstream flood durations
While a flood mitigation dam will reduce the
downstream flood levels for a given flood
event, the same volume of flood water must
eventually be discharged down the river. This
is achieved by releasing water from the dam
for a longer time at a lower rate than would
occur were the mitigation dam not there.
This is illustrated in Figure 13 which has been
scanned from the 1995 EIS and compares the
flows at Warragamba Dam without a dam, with
the current dam operating under the current
H14 operating rules and with a mitigation dam
in place. It illustrates the impact of flood
mitigation on the 1978 flood.
This will also mean that the duration of flows
below 11m AHD at Windsor will be increased
with the operation of a mitigation dam. Figure
14 which has also been scanned from the
1995 EIS summarises the impacts of a
mitigation dam on downstream flood levels and
durations.
Table 14 Reduction in Flood Levels - Penrith
Existing Dam
with Spillway
Mitigation
Dam
1 in 5 Year 20.1 17.9
1 in 10 Year 21.6 18.5
1 in 20 Year 23.3 19.2
1 in 50 Year 24.8 20.2
1 in 100 Year 26.0 21.2
1 in 200 Year 26.9 22.5
1 in 500 Year 27.6 24.7
1 in 1000 Year 28.5 26.1
PMF 32.1 28.4
Table 15 Reduction in Flood Levels - Windsor
Existing Dam
with Spillway
Mitigation
Dam
1 in 5 Year 11.1 8.6
1 in 10 Year 12.3 9.3
1 in 20 Year 13.7 10.4
1 in 50 Year 15.6 11.5
1 in 100 Year 17.2 12.8
1 in 200 Year 18.6 14.4
1 in 500 Year 20.3 16.4
1 in 1000 Year 21.7 19.9
PMF 26.4 22.5
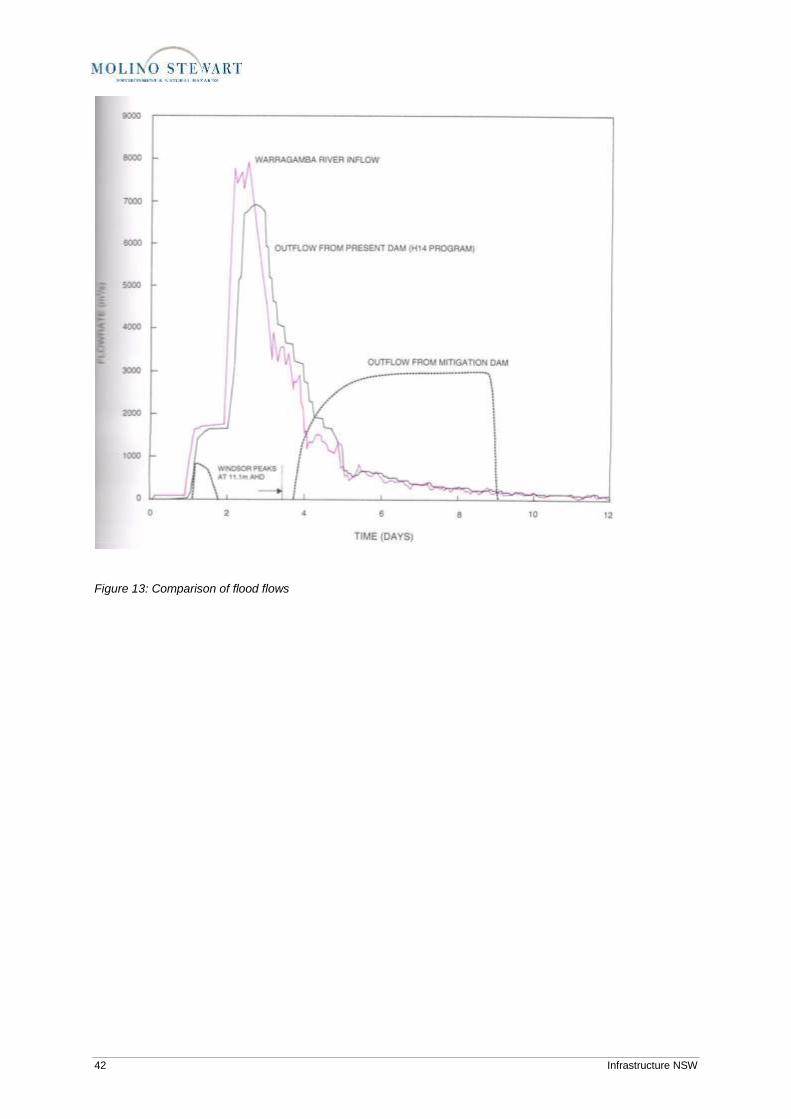
42 Infrastructure NSW
Figure 13: Comparison of flood flows
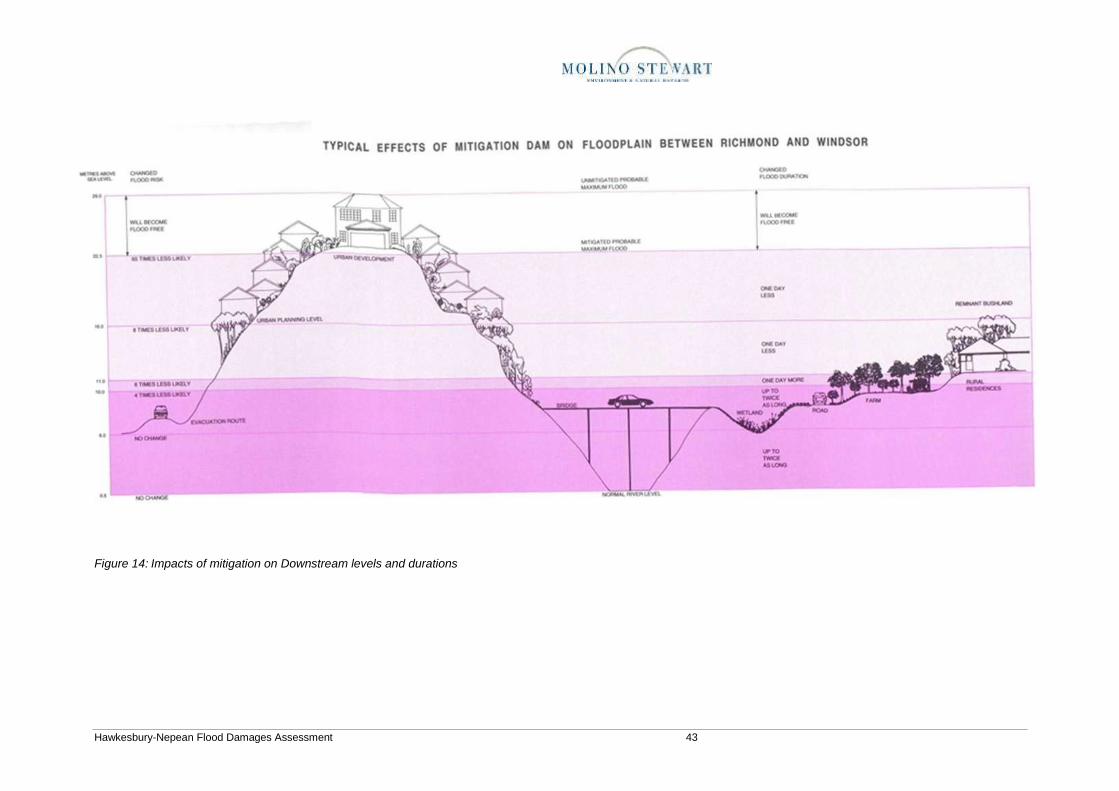
Hawkesbury-Nepean Flood Damages Assessment 43
Figure 14: Impacts of mitigation on Downstream levels and durations
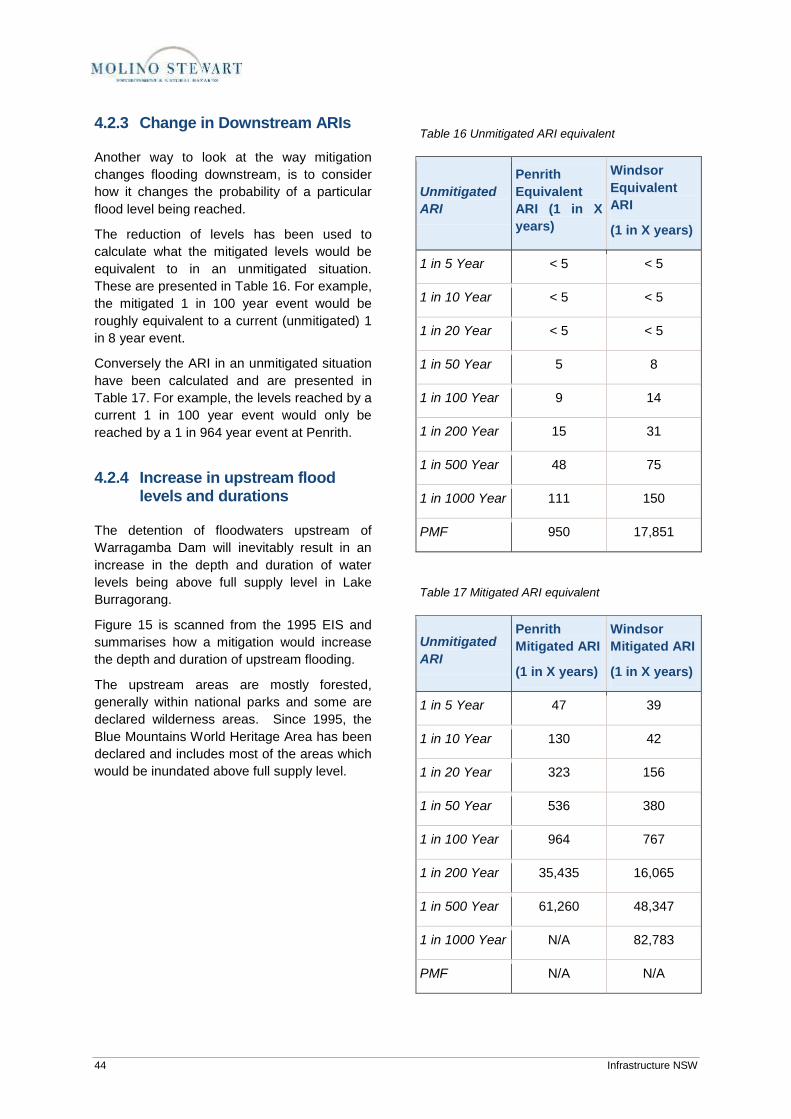
44 Infrastructure NSW
4.2.3 Change in Downstream ARIs
Another way to look at the way mitigation
changes flooding downstream, is to consider
how it changes the probability of a particular
flood level being reached.
The reduction of levels has been used to
calculate what the mitigated levels would be
equivalent to in an unmitigated situation.
These are presented in Table 16. For example,
the mitigated 1 in 100 year event would be
roughly equivalent to a current (unmitigated) 1
in 8 year event.
Conversely the ARI in an unmitigated situation
have been calculated and are presented in
Table 17. For example, the levels reached by a
current 1 in 100 year event would only be
reached by a 1 in 964 year event at Penrith.
4.2.4 Increase in upstream flood levels and durations
The detention of floodwaters upstream of
Warragamba Dam will inevitably result in an
increase in the depth and duration of water
levels being above full supply level in Lake
Burragorang.
Figure 15 is scanned from the 1995 EIS and
summarises how a mitigation would increase
the depth and duration of upstream flooding.
The upstream areas are mostly forested,
generally within national parks and some are
declared wilderness areas. Since 1995, the
Blue Mountains World Heritage Area has been
declared and includes most of the areas which
would be inundated above full supply level.
Table 16 Unmitigated ARI equivalent
Unmitigated
ARI
Penrith
Equivalent
ARI (1 in X
years)
Windsor
Equivalent
ARI
(1 in X years)
1 in 5 Year < 5 < 5
1 in 10 Year < 5 < 5
1 in 20 Year < 5 < 5
1 in 50 Year 5 8
1 in 100 Year 9 14
1 in 200 Year 15 31
1 in 500 Year 48 75
1 in 1000 Year 111 150
PMF 950 17,851
Table 17 Mitigated ARI equivalent
Unmitigated
ARI
Penrith
Mitigated ARI
(1 in X years)
Windsor
Mitigated ARI
(1 in X years)
1 in 5 Year 47 39
1 in 10 Year 130 42
1 in 20 Year 323 156
1 in 50 Year 536 380
1 in 100 Year 964 767
1 in 200 Year 35,435 16,065
1 in 500 Year 61,260 48,347
1 in 1000 Year N/A 82,783
PMF N/A N/A
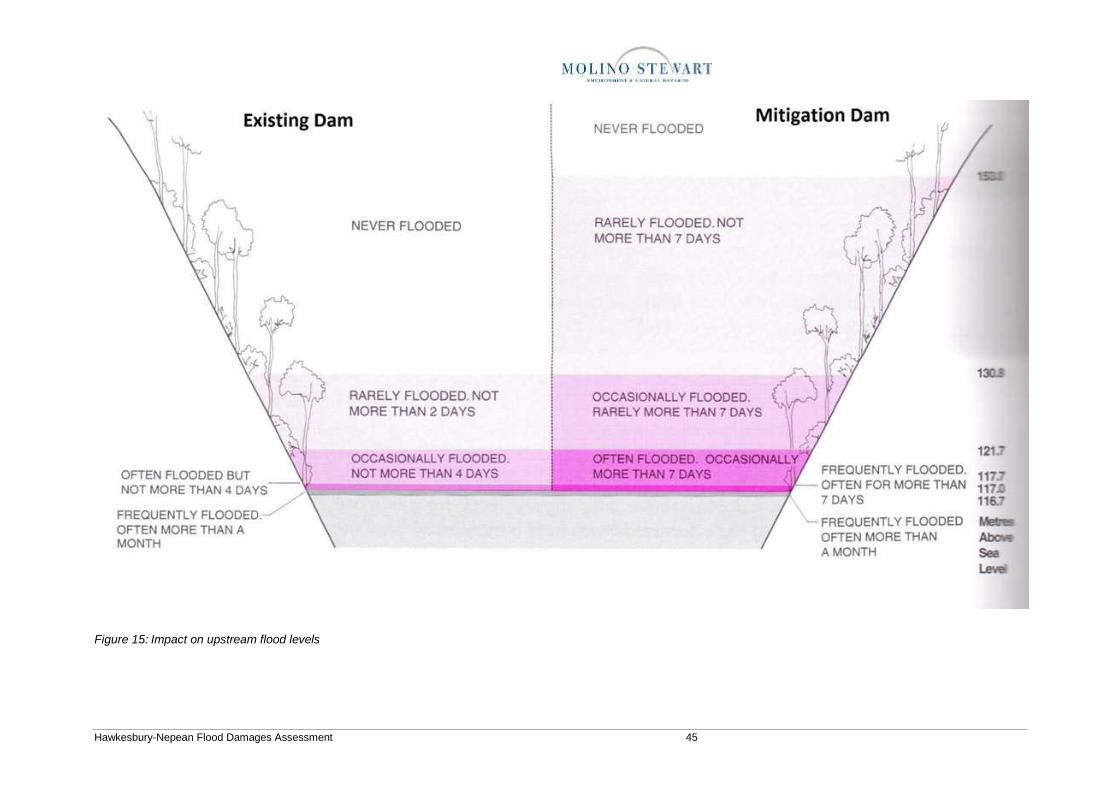
Hawkesbury-Nepean Flood Damages Assessment 45
Figure 15: Impact on upstream flood levels
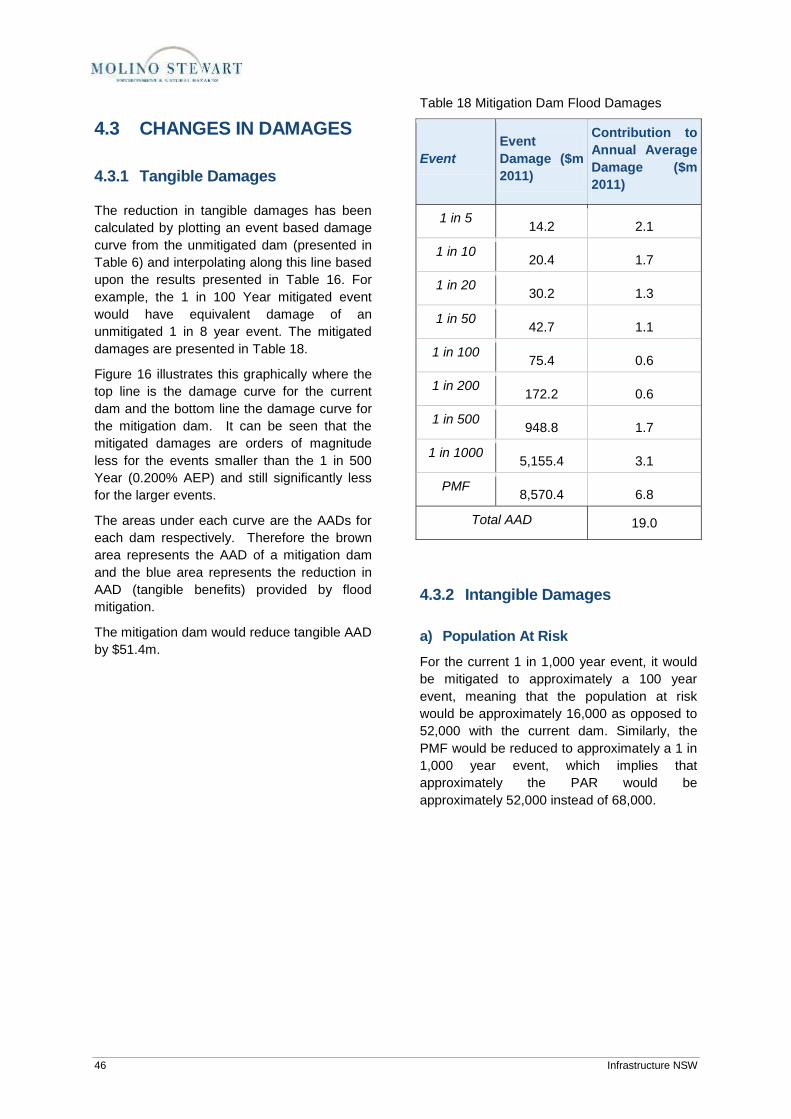
46 Infrastructure NSW
4.3 CHANGES IN DAMAGES
4.3.1 Tangible Damages
The reduction in tangible damages has been
calculated by plotting an event based damage
curve from the unmitigated dam (presented in
Table 6) and interpolating along this line based
upon the results presented in Table 16. For
example, the 1 in 100 Year mitigated event
would have equivalent damage of an
unmitigated 1 in 8 year event. The mitigated
damages are presented in Table 18.
Figure 16 illustrates this graphically where the
top line is the damage curve for the current
dam and the bottom line the damage curve for
the mitigation dam. It can be seen that the
mitigated damages are orders of magnitude
less for the events smaller than the 1 in 500
Year (0.200% AEP) and still significantly less
for the larger events.
The areas under each curve are the AADs for
each dam respectively. Therefore the brown
area represents the AAD of a mitigation dam
and the blue area represents the reduction in
AAD (tangible benefits) provided by flood
mitigation.
The mitigation dam would reduce tangible AAD
by $51.4m.
Table 18 Mitigation Dam Flood Damages
Event
Event
Damage ($m
2011)
Contribution to
Annual Average
Damage ($m
2011)
1 in 5 14.2 2.1
1 in 10 20.4 1.7
1 in 20 30.2 1.3
1 in 50 42.7 1.1
1 in 100 75.4 0.6
1 in 200 172.2 0.6
1 in 500 948.8 1.7
1 in 1000 5,155.4 3.1
PMF 8,570.4 6.8
Total AAD 19.0
4.3.2 Intangible Damages
a) Population At Risk
For the current 1 in 1,000 year event, it would
be mitigated to approximately a 100 year
event, meaning that the population at risk
would be approximately 16,000 as opposed to
52,000 with the current dam. Similarly, the
PMF would be reduced to approximately a 1 in
1,000 year event, which implies that
approximately the PAR would be
approximately 52,000 instead of 68,000.
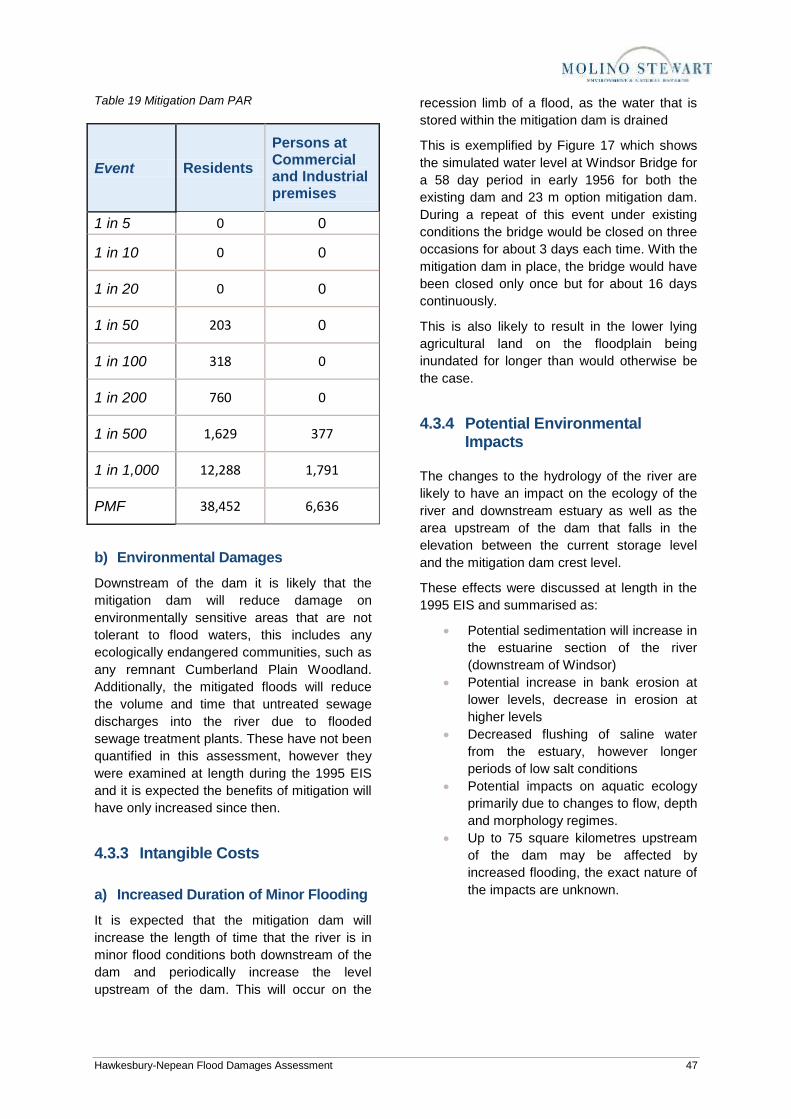
Hawkesbury-Nepean Flood Damages Assessment 47
Table 19 Mitigation Dam PAR
Event Residents
Persons at Commercial and Industrial premises
1 in 5 0 0
1 in 10 0 0
1 in 20 0 0
1 in 50 203 0
1 in 100 318 0
1 in 200 760 0
1 in 500 1,629 377
1 in 1,000 12,288 1,791
PMF 38,452 6,636
b) Environmental Damages
Downstream of the dam it is likely that the
mitigation dam will reduce damage on
environmentally sensitive areas that are not
tolerant to flood waters, this includes any
ecologically endangered communities, such as
any remnant Cumberland Plain Woodland.
Additionally, the mitigated floods will reduce
the volume and time that untreated sewage
discharges into the river due to flooded
sewage treatment plants. These have not been
quantified in this assessment, however they
were examined at length during the 1995 EIS
and it is expected the benefits of mitigation will
have only increased since then.
4.3.3 Intangible Costs
a) Increased Duration of Minor Flooding
It is expected that the mitigation dam will
increase the length of time that the river is in
minor flood conditions both downstream of the
dam and periodically increase the level
upstream of the dam. This will occur on the
recession limb of a flood, as the water that is
stored within the mitigation dam is drained
This is exemplified by Figure 17 which shows
the simulated water level at Windsor Bridge for
a 58 day period in early 1956 for both the
existing dam and 23 m option mitigation dam.
During a repeat of this event under existing
conditions the bridge would be closed on three
occasions for about 3 days each time. With the
mitigation dam in place, the bridge would have
been closed only once but for about 16 days
continuously.
This is also likely to result in the lower lying
agricultural land on the floodplain being
inundated for longer than would otherwise be
the case.
4.3.4 Potential Environmental Impacts
The changes to the hydrology of the river are
likely to have an impact on the ecology of the
river and downstream estuary as well as the
area upstream of the dam that falls in the
elevation between the current storage level
and the mitigation dam crest level.
These effects were discussed at length in the
1995 EIS and summarised as:
Potential sedimentation will increase in
the estuarine section of the river
(downstream of Windsor)
Potential increase in bank erosion at
lower levels, decrease in erosion at
higher levels
Decreased flushing of saline water
from the estuary, however longer
periods of low salt conditions
Potential impacts on aquatic ecology
primarily due to changes to flow, depth
and morphology regimes.
Up to 75 square kilometres upstream
of the dam may be affected by
increased flooding, the exact nature of
the impacts are unknown.

48 Infrastructure NSW
Figure 16: Changes in tangible flood damages

Hawkesbury-Nepean Flood Damages Assessment 49
Figure 17. Simulated Water Level at Windsor Bridge, 1956. Extracted from the 1995 EIS.
50 Infrastructure NSW
5 PRELIMINARY ECONOMIC ANALYSIS
5.1 MITIGATION DAM BENEFITS
Standard practice in flood damage economic
analyses is to determine the Net Present Value
(NPV) of the AAD to determine a present day
value of flood damages which can be
compared to a present day cost of mitigation
options. OEH (2012) recommends a period of
50 years and NSW Treasury recommends real
discount rates of 4, 7 and 11 per cent be
considered.
While many of the costs and benefits have
been explicitly escalated at CPI to calculate
present day values, the economic analysis,
which is done in real terms, keeps AAD
constant into the future.
For this assessment we have applied the 7 per
cent discount rate for a 50 year period and
used the 4 and 11 per cent discount rates in
sensitivity analyses.
The AAD under the existing case are $70.3
million and with a mitigation dam in place are
$19.0. At a 7 per cent discount rate over 50
years the NPV of tangible damages with the
existing dam are $1,041 million. Using the
same methodology the NPV of tangible
damages with a flood mitigation dam are
calculated as $280 million. The NPV of the
tangible benefits of the flood mitigation dam is
the difference in the NPV of flood damages,
which is $761 million.
In additional to these tangible benefits, there
are also intangible benefits. For example:
The number of people at risk during a repeat of the 1867 flood would be reduced from about 26,000 people to less than 1,000 people.
The average number of people at risk from flooding each year would reduce from 560 to 50 (calculated on the same basis as tangible AAD).
Other intangible losses such as loss of life, injury, illness, loss of memorabilia and loss of pets is likely to reduce
proportionally to the reduction in people at risk.
The probability of having to mass evacuate 50,000 people or more would reduce from about a 1 in 100 chance per year to less than a 1 in 800 chance year.
The probability of more than 10,000 non-flooded premises being without electricity for two weeks would reduce for about 1 in 200 chance to less than a 1 in 1,000 chance per year.
The probability of more than 50,000 non-flooded premises being without electricity for three months would reduce for about 1 in 500 chance to much less than a 1 in 1,000 chance per year.
The probability of untreated sewage being discharged to the River from several sewerage treatment plants for weeks would reduce from about a 1 in 500 chance per at Penrith and a 1 in 100 chance per year at Richmond and Windsor to less than a 1 in 1,000 chance per year in both locations.
5.2 DAM COSTS
The 1995 EIS estimated that the option to
raise Warragamba Dam 23m in mass concrete
to provide flood mitigation would cost a total of
$243 million. This cost estimate was based on
detailed preliminary designs by NSW Public
Works.
At the time, there was no auxiliary spillway
around Warragamba Dam to enable it to safely
pass the PMF but a 23m mass concrete
raising would not only provide downstream
flood mitigation but it would also make the dam
PMF safe. In order to determine the additional
cost of providing flood mitigation in 1995, the
cost of an auxiliary spillway was subtracted
from the total dam cost. The construction
costs were applied over a five year
construction period and the present value of
the mitigation costs determined. The
estimated construction program and resultant
payment schedule is not presented in the 1995
EIS and was not available for this study.
For this assessment, the 1995 total estimate
($243 million) was taken and inflated by CPI
(1.6) to provide a 2011 total cost, this resulted
in $411 million. This total cost was used

Hawkesbury-Nepean Flood Damages Assessment 51
because the auxiliary spillway is now built and
is a sunk cost so a 23m raising of the dam
would not provide any dam safety benefit as it
would have in 1995.
The total $411 million cost was assumed to be
spread across a five year construction period
with six equal payments with the first payment
made on day one. This resulted in a present
value of approximately $350 million.
5.3 OTHER COSTS
As explained in Chapter 4, the changes
brought about by flood mitigation do come with
some other costs, most of which are intangible.
This includes:
Increased risk of periodic, temporary inundation of 75km
2 of national parks,
wilderness areas and Blue Mountains World Heritage Area above Warragamba Dam’s full supply level
Longer durations of minor flood levels downstream resulting in:
- Low lying agricultural land being under water for longer
- Low roads and bridges being closed for longer
- Potential increased sedimentation in the River downstream of Windsor
- Potential increase in bank erosion at lower levels
- Longer periods of low salt conditions in the estuary
- Potential impacts on aquatic ecology primarily due to changes to flow, depth and morphology regimes.
In addition, there will be the environmental and
socio-economic impacts on Warragamba
Village and surrounding areas during the five
years of dam construction.
5.4 ECONOMIC WORTH
The benefit cost ratio can then be calculated
as the total benefits divided by the total costs.
For this project the benefit cost ratio is 2.2.
This has been summarised in Table 20. It is
generally considered that a benefit cost ratio
greater than one implies that a project is
economically worthwhile.
5.5 SENSITIVITY ANALYSES
A number of sensitivity analyses have been
undertaken in order to determine how robust
the results of the economic evaluations are.
The results of the sensitivity analyses are
summarised in Table 20 and explained in the
following sections.
5.5.1 Sensitivity 1
This was undertaken to see how lower than
expected flood damages and higher than
expected dam costs would affect the results.
The flood damages were calculated using the
1995 EIS estimates and inflating by CPI only.
This does not take into account the increased
value and vulnerability of house and business
contents across the floodplain nor the
substantial new development on the floodplain
since 1992.
Additionally, the cost of the dam was inflated
by two based on some preliminary construction
inflation indices provided by Deloitte and then
increased by a further 50% to allow for
potential underestimates in the original cost.
Taking all of these factors into account, the
resulting benefit cost ratio is 1.03.
5.5.2 Sensitivity 2
This analysis examined whether the base case
analysis was underestimating the damages
and overestimating the costs.
The flood damages were increased by adding
an additional cost of $250,000 per house for
replacing failed homes.
The dam construction costs were held at $411
million but the present value of the
constructions costs was decreased to reflect
the apparent payment scheduled used in the
1995 EIS.
The resulting benefit cost ratio was 3.1

52 Infrastructure NSW
5.5.3 Sensitivity 3
The discount rate for the present value of the
flood damages and the construction cost of the
dam were changed to 4%. The result was an
increase the present value of the flood
damages and the dam construction, which
results in a benefit cost ratio of 3.1.
5.5.4 Sensitivity 4
A discount rate 11% was applied. The result
was a decrease in the present value of both
the flood damages and the dam construction,
which results in a benefit cost ratio of 1.6
5.6 DISCUSSION
The preliminary economic assessment
suggests that a 23m mass concrete raising of
Warragamba Dam to provide flood mitigation is
economically worthwhile. The analysis is
sensitive to assumptions regarding flood
damages, construction costs and discount
rates but even significant unfavourable
changes in these assumptions suggest that it
would still be economically worthwhile.
Furthermore, should planned development
above the current planning level continue in
the Valley, then the benefits will increase over
time. This has not been accounted for in the
preceding analyses.
Conversely, should a mitigation dam be built
and then the planning levels in the Valley be
lowered to allow for further urban development
below the current planning level, the flood
damage reduction benefits of the flood
mitigation dam would be eroded and this would
need to be considered against the benefits of
the additional development.
While the analyses demonstrate that a flood
mitigation dam would be worthwhile on purely
economic considerations, the intangible
benefits and costs also need to be considered
in determining the overall worth of proceeding
with the project.
Hawkesbury-Nepean Flood Damages Assessment 53
Scenario – 23m
flood mitigation
airspace provided
by raising
Warragamba Dam
in mass concrete
Damage estimation
method
Existing
Flood
Damages
NPV
($m 2011)
Mitigate
d Flood
Damage
s NPV
($m)
Assumed
period of
mitigation
benefit
(yrs)
Dam Cost Estimation
method
Mitigation
Dam Cost
($m)
Dam Cost
NPV over 5
years ($m)
Discount
rate
Benefit-
Cost Ratio
Base Case
Estimate using 1995 EIS methods but
which accounts for changes in
development plus CPI since 1990s.
1,041 281 50
1995 Dam construction cost escalated by
CPI. Assumes 6 equal payments with first on
Day 1.
411 349 7% 2.2
Sensitivity 1: Low
damage with high
construction costs
Low estimate which simply inflates the 1995 EIS damages
using CPI and ignores increased development on
floodplain
895 248 50
1995 Dam construction cost escalated by 2
(Deloitte) and a further 50% Assumes 6 equal payments with first on
Day 1.
741 630 7% 1.03
Sensitivity 2: Base
case damages plus
building failure with
most construction
costs later in
construction
schedule than in
base case
Base case plus additional damages
to account for replacement of failed residential buildings
($250,000 per building)
1,157 310 50
1995 Dam construction cost escalated by
CPI. NPV estimated from expenditure schedule used in the 1995 EIS 411 271 7% 3.1
Table 20 Benefit Cost Ratios for the base case and sensitivity scenarios tested.
54 Infrastructure NSW
Scenario – 23m
flood mitigation
airspace provided
by raising
Warragamba Dam
in mass concrete
Damage estimation
method
Existing
Flood
Damages
NPV
($m 2011)
Mitigate
d Flood
Damage
s NPV
($m)
Assumed
period of
mitigation
benefit
(yrs)
Dam Cost Estimation
method
Mitigation
Dam Cost
($m)
Dam Cost
NPV over 5
years ($m)
Discount
rate
Benefit-
Cost Ratio
Sensitivity 3:
Applying 4%
discount rate to
Base Case
Damages and Dam
cost
Estimate using 1995 EIS methods but
which accounts for changes in
development plus CPI since 1990s.
1,582 426 50
1995 Dam construction cost escalated by
CPI. Assumes 6 equal payments with first on
Day 1.
411 373 4% 3.1
Sensitivity 4:
Applying 11%
discount rate to
Base Case
Damages and Dam
cost
Estimate using 1995 EIS methods but
which accounts for changes in
development plus CPI since 1990s.
706 190 50
1995 Dam construction cost escalated by
CPI. Assumes 6 equal payments with first on
Day 1.
411 321 11% 1.6
Hawkesbury-Nepean Flood Damages Assessment 55
6 CONCLUSIONS AND RECOMMENDATIONS
This preliminary investigation has confirmed
that a flood mitigation dam at Warragamba
would:
significantly reduce flood risks in the Hawkesbury Nepean Valley
significantly reduce the damages caused by major floods ranging up to the largest flood on record and beyond
provide economic benefits well in excess of the cost of dam construction
significantly reduce the risk to life and deliver other intangible social, economic and environmental benefits
increase the risk of periodic, temporary inundation of natural areas upstream of the dam
increase the duration of minor flood flows in the river downstream of the dam which would have social, economic and environmental impacts
have local social, economic and environmental impacts on Warragamba Village and surrounding areas during its construction
It is recommended that should a decision be
made to investigate a Warragamba Flood
Mitigation Dam further that:
flood modelling be updated using:
- current rainfall and runoff estimation techniques
- current dam gate and auxiliary spillway configurations and operating rules
- the latest and most accurate floodplain survey data
- modern two dimensional flood modelling for the entire river length below the Dam
built asset databases be updated to accurately reflect current conditions
committed and planned future development be included in flood damage estimates
building failure and replacement costs be included in damage estimates
the environmental effects of changed flood levels upstream of the dam and changed flow regimes downstream be investigated further.

56 Infrastructure NSW
REFERENCES
Mitchell McCotter (1995) ‘Warragamba Flood
Mitigation Dam EIS’, prepared for Sydney
Water and the NSW Government.
Hawkesbury-Nepean Flood Management
Advisory Committee (1997) ‘Achieving a
Hawkesbury-Nepean Floodplain
Management Strategy’.
Hawkesbury-Nepean Flood Management
Advisory Committee (2006) Managing
Flood Risk Through Planning Opportunities:
Guidance on Land Use Planning in Flood
Prone Aeas.
Mitchell McCotter (1996) ‘Proposed
Warragamba Auxiliary Spillway EIS’,
prepared for Sydney Water.
Molino Stewart (1997) ‘Hawkesbury-Nepean
River Impacts of Flooding on Communities
and Infrastructure’.
Molino Stewart (2012) ‘Hawkesbury Nepean
Flooding Impacts Review’, prepared for
NSW SES.
Office of Environment and Heritage (OEH).
2012. Residential Flood Damage and
supporting calculation spreadsheet.
Water Studies (1992) Forbes Flood Damage
Study, August 1990 Flood. Report for the
NSW Department of Water Resources by
Water Studies Pty Ltd.
APPENDIX A – INTANGIBLE DAMAGES SUMMARY

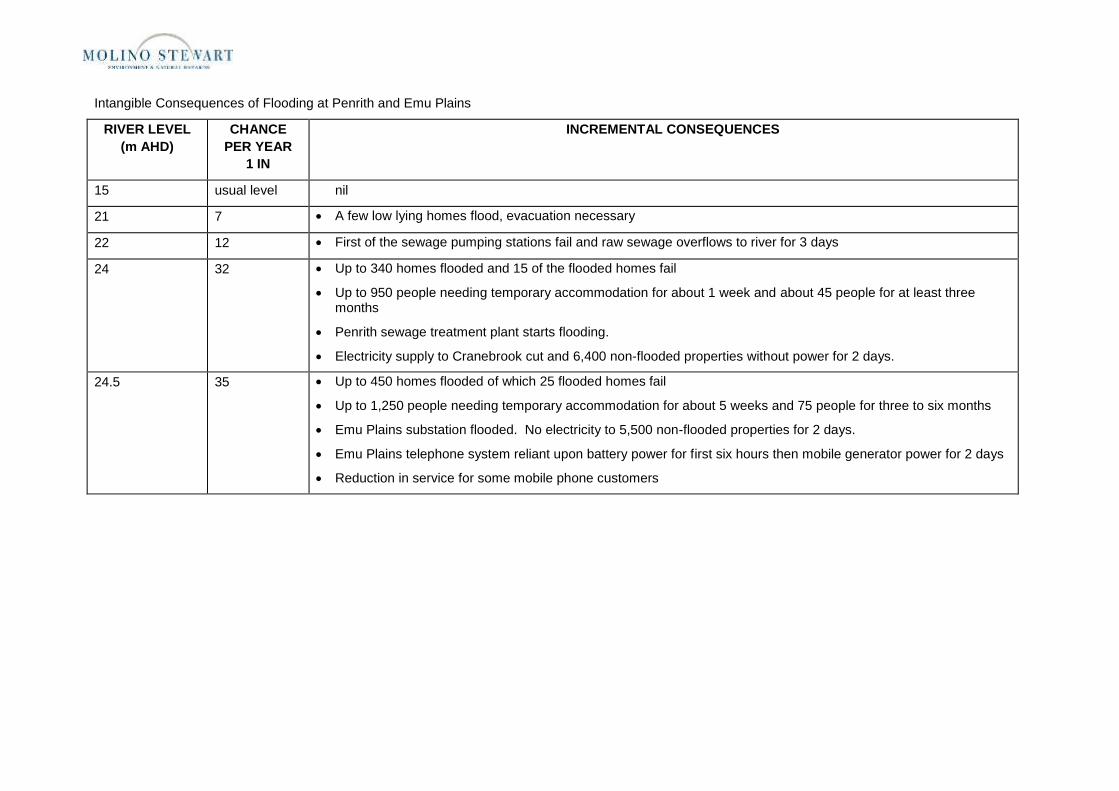
Intangible Consequences of Flooding at Penrith and Emu Plains
RIVER LEVEL
(m AHD)
CHANCE
PER YEAR
1 IN
INCREMENTAL CONSEQUENCES
15 usual level nil
21 7 A few low lying homes flood, evacuation necessary
22 12 First of the sewage pumping stations fail and raw sewage overflows to river for 3 days
24 32 Up to 340 homes flooded and 15 of the flooded homes fail
Up to 950 people needing temporary accommodation for about 1 week and about 45 people for at least three months
Penrith sewage treatment plant starts flooding.
Electricity supply to Cranebrook cut and 6,400 non-flooded properties without power for 2 days.
24.5 35 Up to 450 homes flooded of which 25 flooded homes fail
Up to 1,250 people needing temporary accommodation for about 5 weeks and 75 people for three to six months
Emu Plains substation flooded. No electricity to 5,500 non-flooded properties for 2 days.
Emu Plains telephone system reliant upon battery power for first six hours then mobile generator power for 2 days
Reduction in service for some mobile phone customers

2 Infrastructure NSW
RIVER LEVEL
(m AHD)
CHANCE
PER YEAR
1 IN
INCREMENTAL CONSEQUENCES
26 100
River breaks
its banks
A total of more than 2,000 homes now flooded of which about 300 homes fail
Up to 5,000 people needing temporary accommodation for about 5 weeks and up to 900 for three to six months
Up to 5,000 people who may need to evacuate from Emu Plains if floodwater continue to rise will not be able to because their evacuation route has been cut and they will not have had sufficient warning time to escape before it does.
Penrith electricity substation shuts down and 7,100 additional non-flooded properties without power for two days and 4,900 without power for 14 days.
190 private hospital and nursing home beds evacuated and 130 reliant upon emergency generator power for two days
Telephone system for Emu Plains and Penrith reliant upon emergency battery and generator power for two days
Penrith Sewage Treatment Plant damaged. One week shut down with 630 ML of untreated sewage discharged.
27 200 Up to 2,600 homes flooded of which almost 1,000 homes fail
Up to 4,600 people needing temporary accommodation for about three to six months and a further 3,000 for 12 months
Penrith electricity substation damaged and more than 26,800 non-flooded properties without power for three months
130 nursing home beds reliant upon emergency generator power for three months
Telephone system in Emu Plains and Penrith reliant upon emergency battery and generator power for three months.
Sewage pumping stations and treatment plant reliant upon emergency generators to keep them operational for three months

Hawkesbury-Nepean Flood Damages Assessment 3
RIVER LEVEL
(m AHD)
CHANCE
PER YEAR
1 IN
INCREMENTAL CONSEQUENCES
28 900 Up to 3,200 homes flooded of which 1,850 homes fail
Up to 3,900 people needing temporary accommodation for about three to six months and 5,400 for 12 months
Retirement Village evacuated including 49 nursing home beds
Penrith electricity substation severely damaged and a total of 26,000 non-flooded properties without power for up to three months
Governor Philip Hospital will have to rely upon emergency generator power for up to 3 months
Telephone system for 047 area code east of Lapstone reliant upon emergency battery and generator power for up to 3 months
Victoria Bridge (Great Western Highway) fails taking out rail, gas, telephone, water and sewage lines across the river as well as cutting major road access.
No rail passenger service across Nepean River for 6 months
Rail Freight from west of Nepean River (principally wheat and coal) will need to be transported via long routes to Newcastle and Port Kembla for at least 6 months
No gas supply west of river for three months
Possible reductions in telephone services in and out of Sydney
Raw sewage from any occupied dwellings in Emu Plains discharged to river for three months
Sewage pumping stations and Penrith treatment plant reliant upon emergency generators to keep them operational for three months

4 Infrastructure NSW
RIVER LEVEL
(m AHD)
CHANCE
PER YEAR
1 IN
INCREMENTAL CONSEQUENCES
31 20,000 More than 4,000 homes now flooded of which 2,000 fail
Up to 6,000 people needing temporary accommodation for about three to six months and 6,000 for 12 months
Penrith electricity substation destroyed and a total of 25,000 non-flooded properties without power for 3 to 6 months
Governor Philip Hospital will have to rely upon emergency generator power for up to 6 months
Telephone system for Penrith and Emu Plains fails due to flooding of Penrith Switching Centre. Up to one month to restore system then reliant upon emergency battery and generator power for up to 5 more months.
Penrith Sewage Treatment Plant severely damaged. At least 3 months to repair with untreated sewage being discharged to river. A further three months until licensed effluent standards can be achieved. About 3,800ML of untreated or partially treated sewage discharged to the River.
32 100,000 Up to a total of 7,200 homes flooded and 5,000 of the flooded homes fail
Up to 6,400 people needing temporary accommodation for about three to six months and 14,500 for 12 months
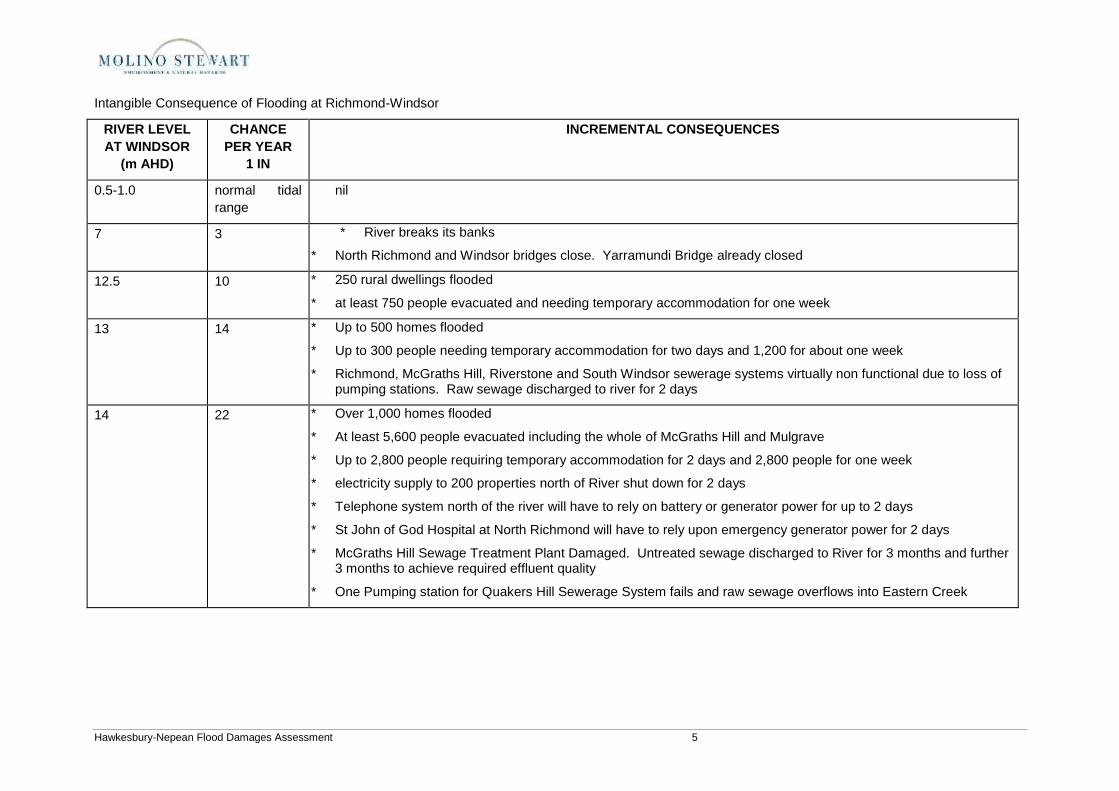
Hawkesbury-Nepean Flood Damages Assessment 5
Intangible Consequence of Flooding at Richmond-Windsor
RIVER LEVEL
AT WINDSOR
(m AHD)
CHANCE
PER YEAR
1 IN
INCREMENTAL CONSEQUENCES
0.5-1.0 normal tidal
range
nil
7 3 * River breaks its banks
* North Richmond and Windsor bridges close. Yarramundi Bridge already closed
12.5 10 * 250 rural dwellings flooded
* at least 750 people evacuated and needing temporary accommodation for one week
13 14 * Up to 500 homes flooded
* Up to 300 people needing temporary accommodation for two days and 1,200 for about one week
* Richmond, McGraths Hill, Riverstone and South Windsor sewerage systems virtually non functional due to loss of pumping stations. Raw sewage discharged to river for 2 days
14 22 * Over 1,000 homes flooded
* At least 5,600 people evacuated including the whole of McGraths Hill and Mulgrave
* Up to 2,800 people requiring temporary accommodation for 2 days and 2,800 people for one week
* electricity supply to 200 properties north of River shut down for 2 days
* Telephone system north of the river will have to rely on battery or generator power for up to 2 days
* St John of God Hospital at North Richmond will have to rely upon emergency generator power for 2 days
* McGraths Hill Sewage Treatment Plant Damaged. Untreated sewage discharged to River for 3 months and further 3 months to achieve required effluent quality
* One Pumping station for Quakers Hill Sewerage System fails and raw sewage overflows into Eastern Creek
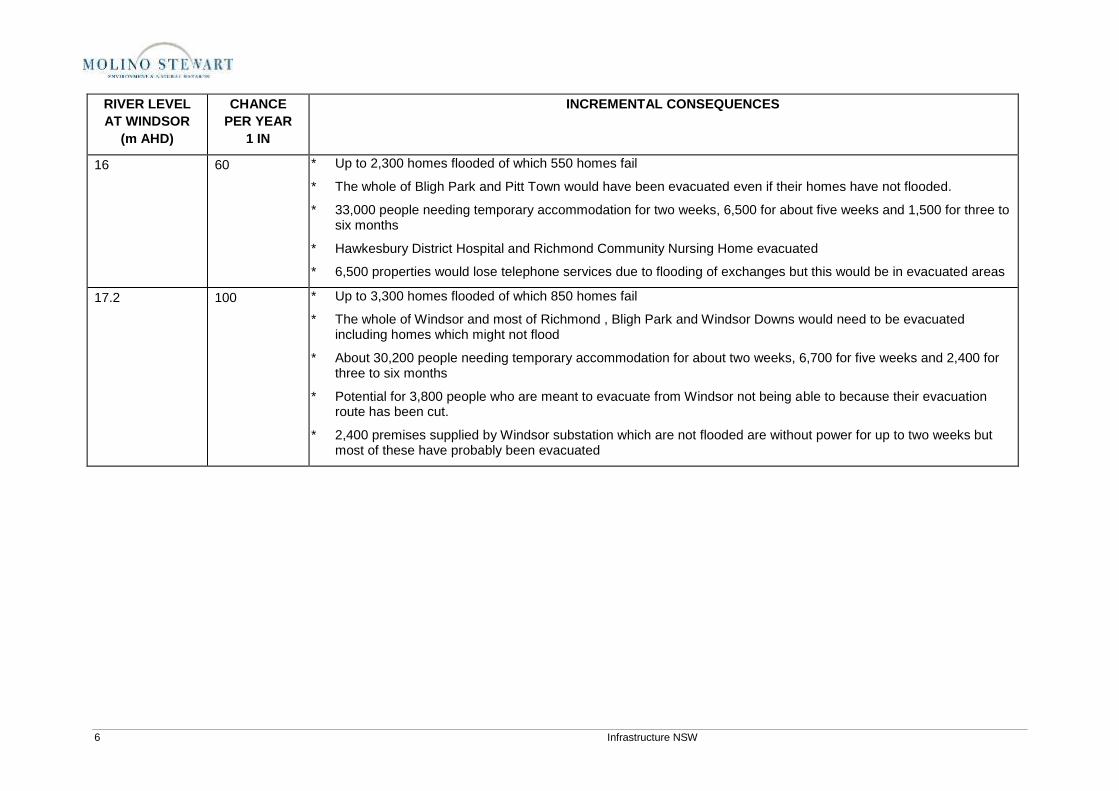
6 Infrastructure NSW
RIVER LEVEL
AT WINDSOR
(m AHD)
CHANCE
PER YEAR
1 IN
INCREMENTAL CONSEQUENCES
16 60 * Up to 2,300 homes flooded of which 550 homes fail
* The whole of Bligh Park and Pitt Town would have been evacuated even if their homes have not flooded.
* 33,000 people needing temporary accommodation for two weeks, 6,500 for about five weeks and 1,500 for three to six months
* Hawkesbury District Hospital and Richmond Community Nursing Home evacuated
* 6,500 properties would lose telephone services due to flooding of exchanges but this would be in evacuated areas
17.2 100 * Up to 3,300 homes flooded of which 850 homes fail
* The whole of Windsor and most of Richmond , Bligh Park and Windsor Downs would need to be evacuated including homes which might not flood
* About 30,200 people needing temporary accommodation for about two weeks, 6,700 for five weeks and 2,400 for three to six months
* Potential for 3,800 people who are meant to evacuate from Windsor not being able to because their evacuation route has been cut.
* 2,400 premises supplied by Windsor substation which are not flooded are without power for up to two weeks but most of these have probably been evacuated

Hawkesbury-Nepean Flood Damages Assessment 7
RIVER LEVEL
AT WINDSOR
(m AHD)
CHANCE
PER YEAR
1 IN
INCREMENTAL CONSEQUENCES
18.6 200 * Up to 8,500 homes flooded and 900 homes fail
* 15,600 people needing temporary accommodation for about two weeks, 21,300 for five weeks and 2,500 for three to six months
* Major sewage pumping station in St Marys Sewerage System flooded and half of system’s sewage discharging untreated to South Creek for about one week
* Electricity supply into Hawkesbury Transmission Substation cut. 20,300 non-flooded properties without power for two days, many (but by no means all) of these have been evacuated
* Telephone system in whole area with 45 prefixes would be reliant upon emergency battery and generator power for two days. Continued operation of generator at Richmond terminal exchange critical to operation of entire system
* Significant reduction in mobile telephone service
* All sewerage systems reliant upon emergency generators for two days
* Possible rupture of gas and oil pipelines at Hawkesbury River crossing (Jemena does not believe so). 36,000 residential and commercial gas users at Newcastle and Central Coast without gas supply for 5 months. Petroleum products transported by road for 12 months.
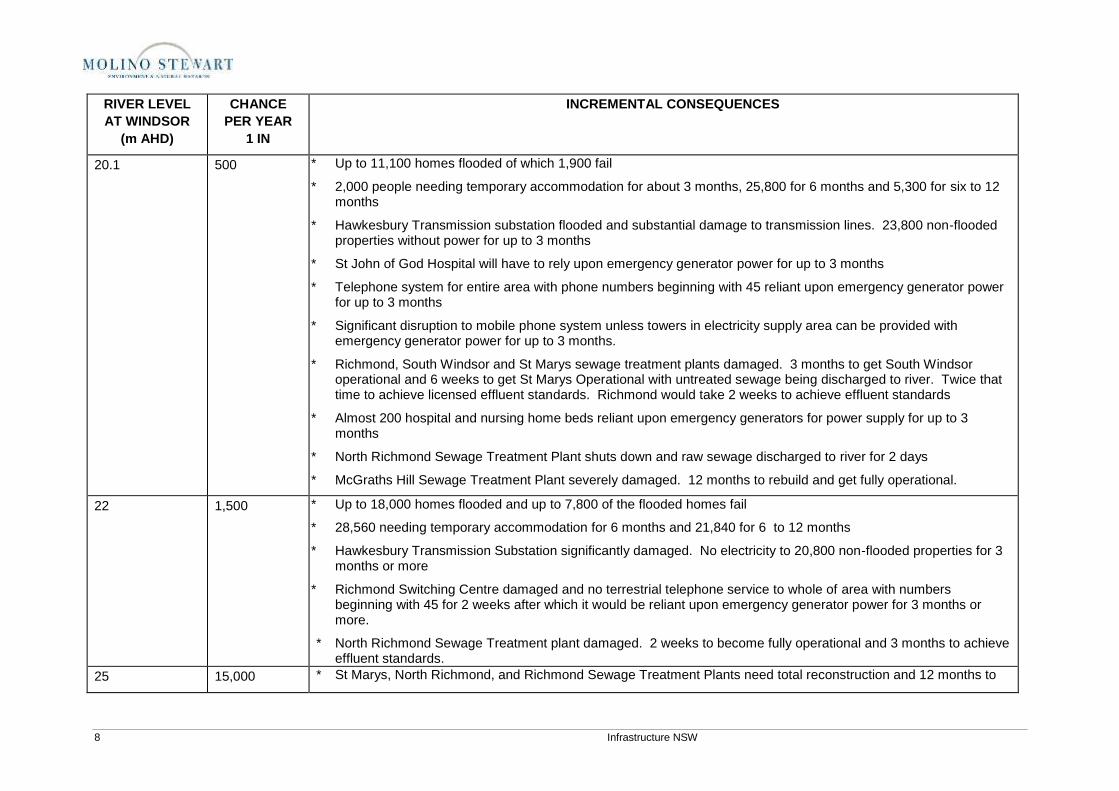
8 Infrastructure NSW
RIVER LEVEL
AT WINDSOR
(m AHD)
CHANCE
PER YEAR
1 IN
INCREMENTAL CONSEQUENCES
20.1 500 * Up to 11,100 homes flooded of which 1,900 fail
* 2,000 people needing temporary accommodation for about 3 months, 25,800 for 6 months and 5,300 for six to 12 months
* Hawkesbury Transmission substation flooded and substantial damage to transmission lines. 23,800 non-flooded properties without power for up to 3 months
* St John of God Hospital will have to rely upon emergency generator power for up to 3 months
* Telephone system for entire area with phone numbers beginning with 45 reliant upon emergency generator power for up to 3 months
* Significant disruption to mobile phone system unless towers in electricity supply area can be provided with emergency generator power for up to 3 months.
* Richmond, South Windsor and St Marys sewage treatment plants damaged. 3 months to get South Windsor operational and 6 weeks to get St Marys Operational with untreated sewage being discharged to river. Twice that time to achieve licensed effluent standards. Richmond would take 2 weeks to achieve effluent standards
* Almost 200 hospital and nursing home beds reliant upon emergency generators for power supply for up to 3 months
* North Richmond Sewage Treatment Plant shuts down and raw sewage discharged to river for 2 days
* McGraths Hill Sewage Treatment Plant severely damaged. 12 months to rebuild and get fully operational.
22 1,500 * Up to 18,000 homes flooded and up to 7,800 of the flooded homes fail
* 28,560 needing temporary accommodation for 6 months and 21,840 for 6 to 12 months
* Hawkesbury Transmission Substation significantly damaged. No electricity to 20,800 non-flooded properties for 3 months or more
* Richmond Switching Centre damaged and no terrestrial telephone service to whole of area with numbers beginning with 45 for 2 weeks after which it would be reliant upon emergency generator power for 3 months or more.
* North Richmond Sewage Treatment plant damaged. 2 weeks to become fully operational and 3 months to achieve effluent standards.
25 15,000 * St Marys, North Richmond, and Richmond Sewage Treatment Plants need total reconstruction and 12 months to
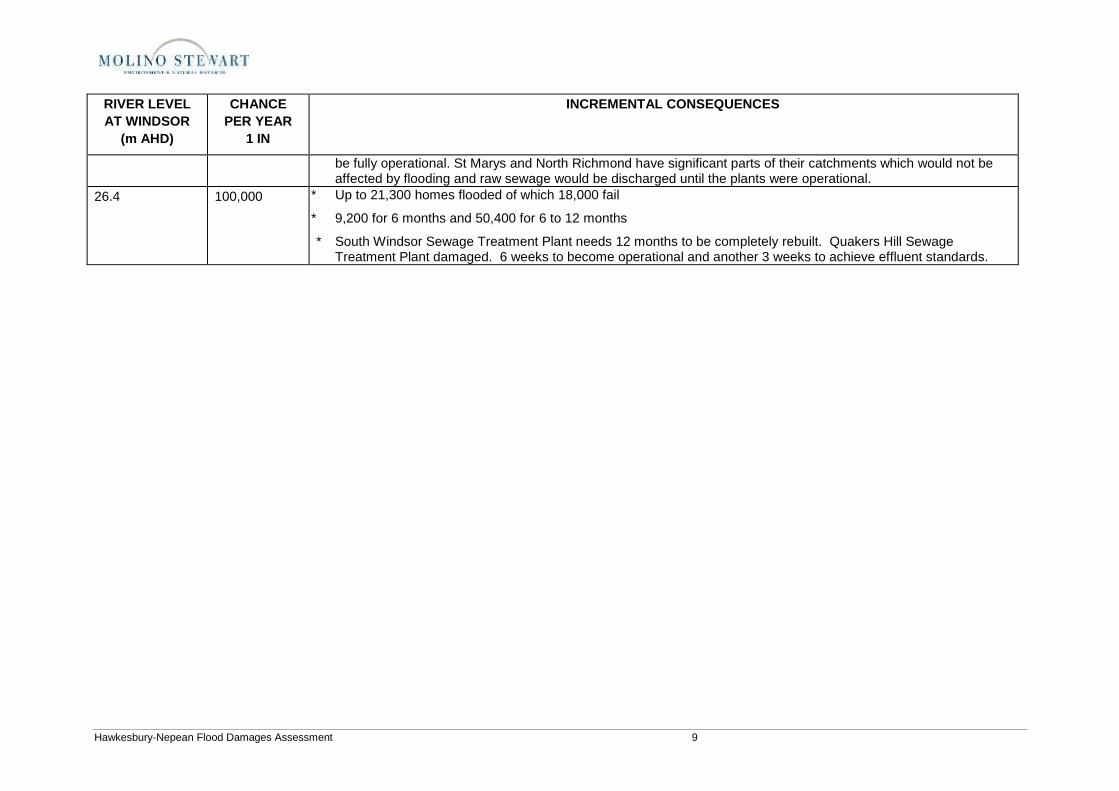
Hawkesbury-Nepean Flood Damages Assessment 9
RIVER LEVEL
AT WINDSOR
(m AHD)
CHANCE
PER YEAR
1 IN
INCREMENTAL CONSEQUENCES
be fully operational. St Marys and North Richmond have significant parts of their catchments which would not be affected by flooding and raw sewage would be discharged until the plants were operational.
26.4 100,000 * Up to 21,300 homes flooded of which 18,000 fail
* 9,200 for 6 months and 50,400 for 6 to 12 months
* South Windsor Sewage Treatment Plant needs 12 months to be completely rebuilt. Quakers Hill Sewage Treatment Plant damaged. 6 weeks to become operational and another 3 weeks to achieve effluent standards.


APPENDIX B - GLOSSARY

Hawkesbury-Nepean Flood Damages Assessment - Final Report i
ALLUVIAL - Deposited by river processes.
ANNUAL EXCEEDANCE PROBABILITY (AEP) - The likelihood of a flood being exceeded in any
given year. For example, a flood with an AEP of 1 in 100 has a 1 in 100 chance of being exceeded in
any given year.
AUSTRALIAN HEIGHT DATUM (AHD) - The standard reference level used to express the relative
elevation of different features. A height given in metres AHD is essentially the height above sea level.
BACKWATER - An area inundated by water from a river but outside the general flow of the river.
BANKFULL - The condition of a river when flow is so great that no river banks are exposed.
BENEFIT COST RATIO (BCR) - The ratio of the benefits derived from a project to the costs of
constructing and operating the project.
CATCHMENT - The land surface area that drains into a reservoir or to a specific point in a river
system.
DAM - A structure across a river which impounds water.
DESIGN FLOOD - A flood where the levels at all points along the river have the same chance of
occurrence. It is estimated using hydrologic and hydraulic computer models.
ENVIRONMENTAL IMPACT STATEMENT (EIS) - A formal description of a project and an
assessment of its likely impact on the physical, social and economic environment. It includes an
evaluation of alternatives and a justification of the project. The EIS is used as a vehicle to facilitate
public comment and as the basis for analysing the project when seeking approval under relevant
legislation.
FLOODPLAIN - That part of a river valley, adjacent to the river channel, over which a river flows in
times of flood.
FREEBOARD - The vertical height between the maximum flood level in a reservoir and the crest of a
dam wall.
FULL SUPPLY LEVEL (FSL) - The water level in a reservoir when it is at its full water supply storage
capacity. It only rises above this level during floods and the excess water is discharged from the
reservoir.
HYDROGRAPH - A graph showing the variation over time of water levels or flow.
MEGALITRE (ML) - One million litres.
NET PRESENT VALUE - The net difference between the present day value of future benefits and
the present day value of future costs.
PLANNING LEVEL - The level above which local government permits urban development. This level
varies from location to location.
POTABLE WATER - Water of a quality suitable for human consumption.
PROBABLE MAXIMUM FLOOD (PMF) - The largest flood likely to occur.
REACH - Section of a river between bends.
RESERVOIR - A body of stored water. Often refers to water stored behind a dam but can refer to
water stored by a tank, pit or bund.
RIVERINE - Of or pertaining to a river.
SCOURING - Erosion of materials by the passage of water.
SPILLWAY - A channel to convey overflow water from a reservoir to the downstream watercourse in a
controlled manner.