hazardous substances of specifi c concern to the baltic sea · hazardous substances of specifi c...
TRANSCRIPT

Baltic Sea Environment Proceedings No. 119
Hazardous substances of specifi c concern to the Baltic Sea
Final report of the HAZARDOUS project
Helsinki Commission
Baltic Marine Environment Protection Commission


Hazardous substances of specifi c concern to the Baltic Sea
– Final report of the HAZARDOUS project
Baltic Sea Environment Proceedings No. 119
Helsinki CommissionBaltic Marine Environment Protection Commission

Author: Jukka Mehtonen
For bibliographic purposes this document should be cited as:
HELCOM, 2009Hazardous substances of specific concern to the Baltic Sea- Final report of the HAZARDOUS project
Balt. Sea Environ. Proc. No. 119
Information included in this publication or extracts thereof is free for citing on the condition that the complete reference of the publication is given as stated above
Copyright 2009 by the Baltic Marine Environment Protection Commision - Helsinki Commission -
Language check: Howard McKee
Cover photo: Elena Bulycheva
Design & layout: Asa Butcher ([email protected])
Printed by: Erweko Painotuote Oy, Finland
ISSN 0357-2994
Summary
1 Introduction
2 Tributyltin (TBT) & triphenyltin (TPhT)2.1 Production and use2.2 Discharges, emissions and losses to environment2.3 Concentrations in biota, sediment and water of Baltic Sea & imposex in marine gastropods2.4 Substance-specifi c conclusions
3 Pentabromodiphenyl ether (pentaBDE), octabro modiphenyl ether (octaBDE) & decabro modiphenyl ether (decaBDE)
3.1 Production and use3.2 Discharges, emissions and losses to environment3.3 Concentrations in biota, sediment and water of Baltic Sea3.4 Substance-specifi c conclusions
4 Hexabromocyclododecane (HBCDD)4.1 Production and use4.2 Discharges, emissions and losses to environment4.3 Concentrations in biota, sediment and water of Baltic Sea4.4 Substance-specifi c conclusions
5 Perfl uorooctane sulfonate (PFOS) & perfl uorooctanoic acid (PFOA)
5.1 Production and use5.2 Discharges, emissions and losses to environment5.3 Concentrations in biota, sediment and water of Baltic Sea5.4 Substance-specifi c conclusions
6 Nonylphenols (NP) & nonylphenol ethoxylates (NPE)6.1 Production and use6.2 Discharges, emissions and losses to environment6.3 Concentrations in biota, sediment and water of Baltic Sea6.4 Substance-specifi c conclusions
7 Octylphenols (OP) & octylphenol ethoxylates (OPE)7.1 Production and use7.2 Discharges, emissions and losses to environment
Contents
131315
18
11
9
262629
36
3737394243
4444475055
5757606465
666669
33
24

7.3 Concentrations in biota, sediment and water of Baltic Sea7.4 Substance-specific conclusions
8 Short-chain chlorinated paraffins (SCCP or chloroalkanes, C10-13) & medium-chain chlorinated paraffins (MCCP or chloroalkanes, C14-17)
8.1 Production and use8.2 Discharges, emissions and losses to environment8.3 Concentrations in biota, sediment and water of Baltic Sea8.4 Substance-specific conclusions
9 Endosulfan9.1 Production and use9.2 Discharges, emissions and losses to environment9.3 Concentrations in biota, sediment and water of Baltic Sea9.4 Substance-specific conclusions
10 General conclusions
11 Acknowledgements
References
73737477
80
8282828385
86
88
89
7172

9
Summary
The information has been gathered and com-piled on eight organic substances or substance groups of specifi c concern to the Baltic Sea (bolded substances in Table 1). The information is originating mainly from nine HELCOM coun-tries; Denmark, Estonia, Finland, Germany, Latvia, Lithuania, Poland, Russia and Sweden. The report contains information received via a HELCOM questionnaire from the Contracting Parties and other sources (mainly scientifi c reports and articles).
The main objective in assessing the dis-charges was to compare the effl uent concen-trations to substance-specifi c Predicted No-Effect Concentrations (PNEC) in surface water. The occurrence of each hazardous substance has been considered in the Baltic marine envi-ronment. The levels in different environmental compartments of the Baltic Sea have been com-pared to Predicted No-Effect Concentrations in respective environmental compartments.
Uses of hazardous substances identifi ed in this report are not necessarily relevant for all countries or even for certain industrial sectors within same country due to the fact that proc-esses can run with a great variety of methods and chemicals. In general, it is evident that sev-eral HELCOM countries do not have suffi cient information on the use or discharges/emis-
sions of substances considered in this report. Measured data on the discharges (WWTPs, landfi lls storm water) and emissions of sub-stances considered in this report are needed.
As a general conclusion, the Baltic-wide sub-stance-fl ow analysis should be prepared for each substance as soon as possible, in order to have clear overview on how substance is “moving” in our society. Substance-fl ow anal-ysis would give information on pathways and the amounts of substance with respect to emis-sions/discharges to different environmental compartments. In general, additional informa-tion on the occurrence of the mentioned sub-stances in the Baltic Sea for biota, water and sediments, is required.
The occurrence of tributyltin (TBT), and to a lesser extent triphenyltin (TPhT), is wide-spread in the Baltic marine environment. Despite the legislative measures taken and the declining concentration trends in Baltic Sea, the current levels of TBT and TPhT pose a risk to the Baltic marine environment and especially to organisms at lower trophic levels of the food web such as sediment dwelling organisms par-ticularly near harbours and shipyards, but also near sea routes and at the disposal sites for dredged material.
© M
ETS
ÄH
ALL
ITU
S 2
006

10
The occurrence of bromodiphenyl ethers (BDEs) is widespread in the Baltic marine environment. It is likely that current legisla-tive measures (penta- and octaBDE banned in EU since 2004) have already decreased penta- and octaBDE levels in Baltic Sea. While PentaBDE and octaBDE do not seem to pose a risk to the marine environment in the Western Baltic Sea, the situation may be different in the eastern part of the Baltic Sea. DecaBDE is the dominant congener in WWTP sludge and in the Baltic Sea sediments. It can be found also in the Baltic Sea fi sh although tetraBDE is the most dominant congener in biota. The levels of decaBDE may be increasing due to fact that its use has not been restricted.
At present, information on the occurrence of hexabromocyclododecane (HBCDD) in the environment is very scarce. The results of the draft EU risk assessment (EU RAR 2006) indi-cate that there is a need to limit risks to the aquatic environment concerning the use of HBCDD. Especially, predators such as mam-mals and predatory birds are facing the risks via secondary HBCDD contamination. The PBT assessment showed that HBCDD is a persist-ent, very bioaccumulative and toxic substance. HBCDD is commonly found in fi sh along the Swedish coast of the Baltic Sea; however, the situation may be different in other parts of Baltic Sea.
The PBT assessment, which is very relevant especially with regard to the marine environ-ment, showed that perfl uorooctane sulfonate (PFOS) alike is a very persistent, bioaccumu-lative and toxic substance. PFOS is a wide-spread contaminant in the Baltic Sea wildlife, while perfl uorooctanoic acid (PFOA) was not detected commonly. As a whole, the situation regarding perfl uorooctanoic acid substances (PFAS) is complicated because the number of compounds is very large and it is not exactly known which substances have harmful proper-ties, or can degrade to PFOS and other persist-ent PFAS in the environment. The fi ndings of this compiling study imply the threat caused by PFOS and HBCDD to the Baltic Sea top preda-tors such as seals and predatory birds via sec-ondary contamination. The risks and threats of PFOA on the Baltic marine environment are currently diffi cult to estimate due to the lack of ecotoxicological information.
Nonylphenol (NP) and octylphenol (OP) are substances very toxic to aquatic organisms and not easily degraded in the environment.
Additionally, both NP, OP and nonylphenol ethoxylates (NPE) are possible endocrine-dis-rupting substances. The scarce data available data indicates that NP levels in the sea water and biota (fi sh) and OP levels in fi sh are not high; however, levels in the sediment may have adverse effects on the marine environment.
Also the levels of medium-chain chlorin-ated paraffi n (MCCP) levels in fi sh in the Baltic Sea may have unfavourable effects on the Baltic marine environment. On the other hand, short-chain chlorinated paraffi n (SCCP) lev-els in the fi sh and sediment of the Baltic Sea seems to be quite low. This difference in MCCP and SCCP concentration levels in the fi sh and sediment is likely due to a wider current use of MCCP compared to SCCP.
Endosulfan poses a risk of an endocrine-disruption and has a potential for long-range atmospheric transport. Endosulfan is classi-fi ed as a POP (Persistent Organic Pollutant) and is also potentially a PBT (Persistent, Bioaacumulative, Toxic). The transformation product of endosulfan, the endosulfan sul-phate is yet another potential endocrine-dis-rupting substance and highly persistent in the sediments and soil. While endosulfan levels are generally below the detection limit or low, endosulfan sulphate may occur particularly in the sediments as well as in fi sh.
Although in many cases detected concentra-tions are below the estimated effect levels for individual substances, it is still possible that the substances contribute to the toxic effects triggered by mixtures of biologically active substances.

11
Ba
ltic
Se
a E
nvi
ron
me
nt P
roc
ee
din
gs
No
. 119
1 Introduction
The HELCOM HAZARDOUS project was started in March 2006 in order to:
1. Identify hazardous substances of spe-cifi c concern to the Baltic Sea Nine organic substances or substance groups were selected from numerous candidate substances in the HELCOM prioritization process during April – June 2006. The issue was considered by the Eleventh Meeting of the HELCOM Land-based Pollution Group in 2006 and espe-cially by Germany, Lithuania and Sweden - the Lead Countries for the segment of Hazardous Substances of HELCOM Baltic Sea Action Plan (BSAP). At a later stage, the heavy metals mercury (Hg) and cad-mium (Cd) were prioritized to be very rel-evant hazardous substances in the Baltic Sea.
2. Collect information on the uses, discharges / emissions to the environ-ment and concentrations in the Baltic marine environment of nine selected organic substances from the HELCOM Contracting Parties. The report contains information received via a HELCOM questionnaire from the Contracting Parties and other sources (mainly sci-entifi c reports and articles). The ques-tionnaire was sent to the Contracting Parties on 20 June 2006. The question-naire collected as much updated infor-mation as possible from the Baltic Sea area.
3. Develop the indicators with targets for the segment of Hazardous Substances for the HELCOM Baltic Sea Action Plan.
4. Identify any possible necessary actions to be introduced with regard to hazard-ous substances of specifi c concern to the Baltic Sea under the HELCOM Baltic Sea Action Plan.
5. Contribute to the revision of the HELCOM COMBINE monitoring pro-gramme on hazardous substances.
This report on the HAZARDOUS project
under the HELCOM Baltic Sea Action Plan mainly contains information relating to point two above. The report has been considered by the Twelfth HELCOM Land-based Pollution Group in 2007, the Tenth and Eleventh Meetings of the HELCOM Monitoring and Assessment Group in 2007 and 2008, and approved for publish-ing by the 27th Meeting HELCOM Heads of Delegations in 2008.
The information gathered in this report has been used to develop indicators and actions for hazardous substances segment of the HELCOM Baltic Sea Action Plan. Additionally, information has been used for the development of the BSAP background material ‘Towards a Baltic Sea with life undisturbed by Hazardous Substances’ for the Ministerial Meeting on 15 November 2007 (HELCOM 2007).
The information has been gathered and compiled on eight organic substances or sub-stance groups of specifi c concern to the Baltic Sea (bolded substances in Table 1). Dioxins, furans & dioxin-like PCBs have not been assessed in this report, because information on dioxins in the Baltic Sea area can be found from the HELCOM publication “Dioxins in the Baltic Sea”. Additionally, the ongoing HELCOM Screening project will supply information on the levels of dioxins, furans and dioxin-like PCBs in Estonian, Latvian, Lithuanian, Polish and Russian coastal waters. The heavy met-als were excluded from the questionnaire as well as from this report as they have been part of the HELCOM monitoring programmes and as other information sources are avail-able. The information originates mainly from nine HELCOM countries; Denmark, Estonia, Finland, Germany, Latvia, Lithuania, Poland, Russia and Sweden.
The information on the uses covers the whole country regardless of how large a share of its area (and inhabitants) is actually located in the Baltic Sea catchment area. Thus, for example the estimation for the amounts of used PFOS in the Danish part of Baltic Sea catchment area was not carried out. Additionally, it should be mentioned that uses identifi ed in this report are not necessarily relevant in all countries or even in same country in all plants of certain sec-tor due to the fact that processes can be run

12
with a great variety of methods and chemicals. Information on the amounts of used and uses in Denmark, Finland and Sweden is mainly based on data from the national registers of chemical products. Data in these registers may be incomplete as some of the information is confi dential. Furthermore, Sternbeck et al. (2006) noted that there are no offi cial statistics on the imports of chemicals in fi nished goods in Sweden concerning organotin compounds. This group of imported fi nished goods can only be treated qualitatively in this report. It is most likely that this is also valid for other HELCOM countries and for other substances indicated in Table 1, except for the process-borne dioxins, furans & dioxin-like PCBs.
Information, e.g. on waste water treatment plants and landfi ll discharges to surface waters has been collected regardless of whether these point sources are actually located in the Baltic Sea catchment area or not. This mainly concerns Germany and Denmark, because a signifi cant share of their land area (and inhabit-ants) is located outside the Baltic Sea catch-ment area. The main objective in assessing the discharges was to compare the effl uent concentrations to substance-specifi c Predicted No-Effect Concentration (PNEC) in the surface water. The attempts to estimate actual sub-stance loads to the Baltic Sea have not been made due to scarcity of the data.
The occurrence of each hazardous substance has been assessed in the Baltic marine envi-ronment. The levels in different environmental compartments of the Baltic Sea have been com-pared to Predicted No-Effect Concentrations in respective environmental compartments. For some substances, however, the ecotoxicologi-cal data concerning the sediment and biota is lacking and the PNEC levels are not possible to estimate. This has been pointed out in the following chapters as the PNEC level plays a vital role in the assessment. This report can-not be considered as a full-scale risk assess-ment report, rather as a very preliminary risk assessment due to the lack of information on, e.g. uses and environmental information. The report has compiled information from numer-ous sources and indicates information gaps.
The detailed procedure how the PNEC levels are derived from ecotoxicological testing data on different organisms has been described in European Commission Technical Guidance Document on Risk Assessment (EC 2003).
1. Dioxins (PCDD), furans (PCDF)& dioxin-like polychlorinated biphenyls
2a. Tributyltin compounds (TBT)
2b. Triphenyltin compounds (TPhT)
3a. Pentabromodiphenyl ether (pentaBDE)
3b. Octabromodiphenyl ether (octaBDE)
3c. Decabromodiphenyl ether (decaBDE)
4a. Perfl uorooctane sulfonate (PFOS)
4b. Perfl uorooctanoic acid (PFOA)
5. Hexabromocyclododecane (HBCDD)
6a. Nonylphenols (NP)
6b. Nonylphenol ethoxylates (NPE)
7a. Octylphenols (OP)
7b. Octylphenol ethoxylates (OPE)
8a. Short-chain chlorinated paraffi ns(SCCP or chloroalkanes, C10-13)
8b. Medium-chain chlorinated paraffi ns(MCCP or chloroalkanes, C14-17)
9. Endosulfan
10. Mercury (Hg)
11. Cadmium (Cd)
Table 1:Substances or substance groups of specifi c concern to the Baltic Sea. The report contains information only on bolded substances.
13
Ba
ltic
Se
a E
nvi
ron
me
nt P
roc
ee
din
gs
No
. 119
2 Tributyltin (TBT)and triphenyltin (TPhT)
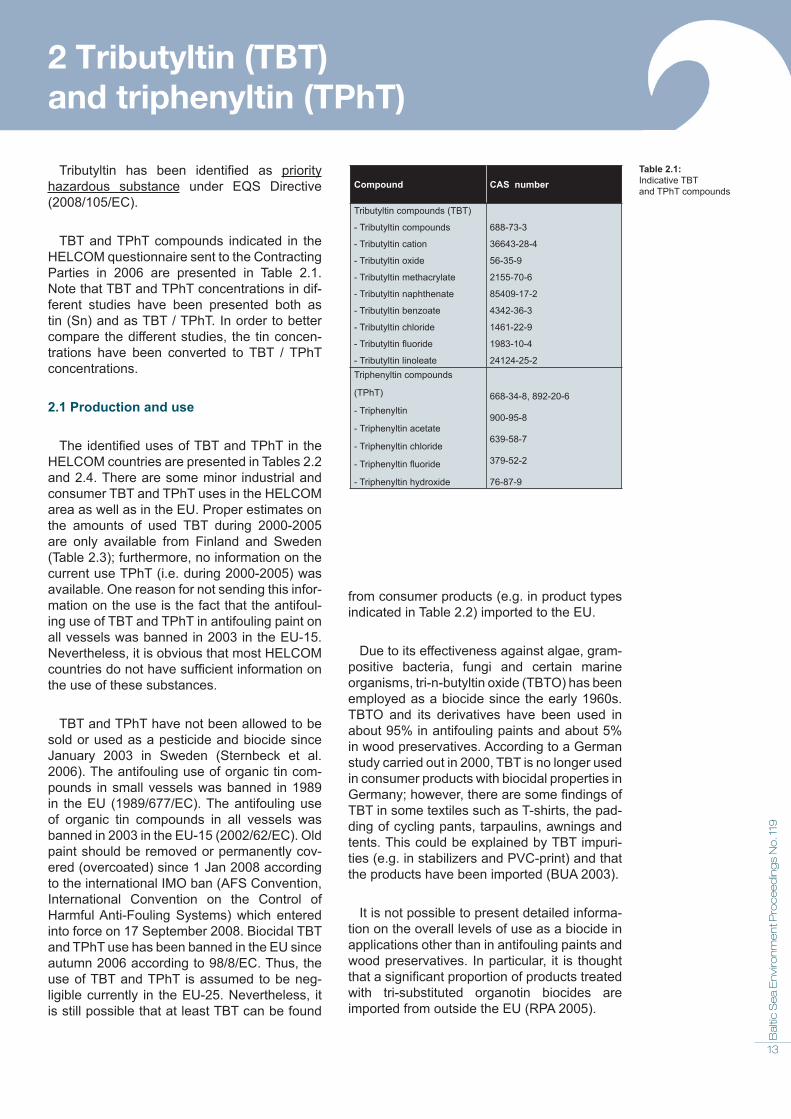
Tributyltin has been identifi ed as priority hazardous substance under EQS Directive (2008/105/EC).
TBT and TPhT compounds indicated in the HELCOM questionnaire sent to the Contracting Parties in 2006 are presented in Table 2.1. Note that TBT and TPhT concentrations in dif-ferent studies have been presented both as tin (Sn) and as TBT / TPhT. In order to better compare the different studies, the tin concen-trations have been converted to TBT / TPhT concentrations.
2.1 Production and use
The identifi ed uses of TBT and TPhT in the HELCOM countries are presented in Tables 2.2 and 2.4. There are some minor industrial and consumer TBT and TPhT uses in the HELCOM area as well as in the EU. Proper estimates on the amounts of used TBT during 2000-2005 are only available from Finland and Sweden (Table 2.3); furthermore, no information on the current use TPhT (i.e. during 2000-2005) was available. One reason for not sending this infor-mation on the use is the fact that the antifoul-ing use of TBT and TPhT in antifouling paint on all vessels was banned in 2003 in the EU-15. Nevertheless, it is obvious that most HELCOM countries do not have suffi cient information on the use of these substances.
TBT and TPhT have not been allowed to be sold or used as a pesticide and biocide since January 2003 in Sweden (Sternbeck et al. 2006). The antifouling use of organic tin com-pounds in small vessels was banned in 1989 in the EU (1989/677/EC). The antifouling use of organic tin compounds in all vessels was banned in 2003 in the EU-15 (2002/62/EC). Old paint should be removed or permanently cov-ered (overcoated) since 1 Jan 2008 according to the international IMO ban (AFS Convention, International Convention on the Control of Harmful Anti-Fouling Systems) which entered into force on 17 September 2008. Biocidal TBT and TPhT use has been banned in the EU since autumn 2006 according to 98/8/EC. Thus, the use of TBT and TPhT is assumed to be neg-ligible currently in the EU-25. Nevertheless, it is still possible that at least TBT can be found
from consumer products (e.g. in product types indicated in Table 2.2) imported to the EU.
Due to its effectiveness against algae, gram-positive bacteria, fungi and certain marine organisms, tri-n-butyltin oxide (TBTO) has been employed as a biocide since the early 1960s. TBTO and its derivatives have been used in about 95% in antifouling paints and about 5% in wood preservatives. According to a German study carried out in 2000, TBT is no longer used in consumer products with biocidal properties in Germany; however, there are some fi ndings of TBT in some textiles such as T-shirts, the pad-ding of cycling pants, tarpaulins, awnings and tents. This could be explained by TBT impuri-ties (e.g. in stabilizers and PVC-print) and that the products have been imported (BUA 2003).
It is not possible to present detailed informa-tion on the overall levels of use as a biocide in applications other than in antifouling paints and wood preservatives. In particular, it is thought that a signifi cant proportion of products treated with tri-substituted organotin biocides are imported from outside the EU (RPA 2005).
Compound CAS number
Tributyltin compounds (TBT)
- Tributyltin compounds
- Tributyltin cation
- Tributyltin oxide
- Tributyltin methacrylate
- Tributyltin naphthenate
- Tributyltin benzoate
- Tributyltin chloride
- Tributyltin fl uoride
- Tributyltin linoleate
688-73-3
36643-28-4
56-35-9
2155-70-6
85409-17-2
4342-36-3
1461-22-9
1983-10-4
24124-25-2Triphenyltin compounds
(TPhT)
- Triphenyltin
- Triphenyltin acetate
- Triphenyltin chloride
- Triphenyltin fl uoride
- Triphenyltin hydroxide
668-34-8, 892-20-6
900-95-8
639-58-7
379-52-2
76-87-9
Table 2.1:Indicative TBTand TPhT compounds

14
Type of business and/or mode of application
HELCOM country of confirmed use Remarks
Identified use
Antifouling paints / active substance (biocide)
Historical use very probably in all HELCOM countries
Main emission sources is leaching from ship hulls (still continuing) and related main activities that cause emissions are sea ship traffic, shipyards (during removal of old antifouling paints), contaminated harbour sediments / dumping of dredged material (OSPAR 2000, WFD-EAF 2004)Antifouling use of organic tin compounds in all vessels has been banned in 2003 in EU-15 (2002/62/EC). Old paint should be removed or overcoated since 1st Jan 2008
Diapers (probably as impurity) Denmark Study originates from year 2000 (Sternbeck et al. 2006)
PVC flooring & vinyl wallpapers (probably as impurity) Denmark Study originates from year 2001 (Sternbeck et al. 2006)
Earplugs (probably as impurity) Denmark Study originates from year 2003 (Sternbeck et al. 2006)
Manufacture (and use) of regular (non-antifouling) paints / fungicide Finland Year 2004, TBT naphtenate, both industrial and consumer use possible
Manufacture (and use) of aircraft / marking agent Finland Year 2004, TBT oxide, industrial use
Silicon-sealings in buildings Germany Banned in Germany since 1999 but emissions from building materials in use possible
Chemical industry / production and wide application of chemical preparations containing TBT
Poland Year 2003, TBT-naphtenate, -benzoate and –chloride, probably mainly industrial use
Rain clothes Sweden Sternbeck et al. (2006)
Glues and sealants used in construction industry Sweden Study originates from year 2000 (Sternbeck et al. 2006)
Possible uses *
Impregnation of wood / biocide
Possible in all HELCOM countries except- use ceased in 1999 in Finland- use ceased in 1990 in Germany- no registered use in Denmark since 1999
Industrial use more probable than private use (WFD-EAF 2004), biocide use banned in EU in autumn 2006 (98/8/EC)
Biocidal (antiseptic or disinfecting) use in applications such as- pillows (RPA 2005)- canvas, carpets, cuttings (OSPAR 2000, RPA 2005)- pharmaceuticals (WFD-EAF 2004)- sponges and shoe insoles (KEMI 2005, RPA 2005)- preservative for textile (in back-coating of textiles used in upholstery & in treatment of feather), paper, leather and glass (Haskoning 2002, RPA 2005)
Possibly use in HELCOM countries (e.g. in finished goods imported from non-EU countries)
Industrial use and consumer end-use possibleBiocide use banned in EU in autumn 2006 (98/8/EC)
Use as intermediate in the production of other chemicals Possible in all HELCOM countries Industrial use
Table 2.2Uses of TBT in HELCOM countries during years 2000-2005
* Possible but not identified use in HELCOM countries, occurrence possible e.g. in imported articles / final products
Country Use (ton) Remarks
2000 2001 2002 2003 2004 2005
Denmark NI NI NI NI NI NI
Estonia NI NI NI NI NI NI
Finland NI 4 0.6 0.2 confidential information
confidential information
export not taken into account, National Product Register of Chemicals
Germany NI NI NI NI NI NI
Latvia NI NI NI NI NI Not produced or imported National Chemicals Data Base
Lithuania NI NI NI NI NI NI
Poland NI NI NI Use exist NI NI No data on amountRussia NI NI NI NI NI NI No reply to questionnaire
Sweden 1.0 0.25 NI NI 0.4 NI
Table 2.3 Total amount of use for TBT in HELCOM countries during 2000-2005 (NI = no information received)
15
Ba
ltic
Se
a E
nvi
ron
me
nt P
roc
ee
din
gs
No
. 119
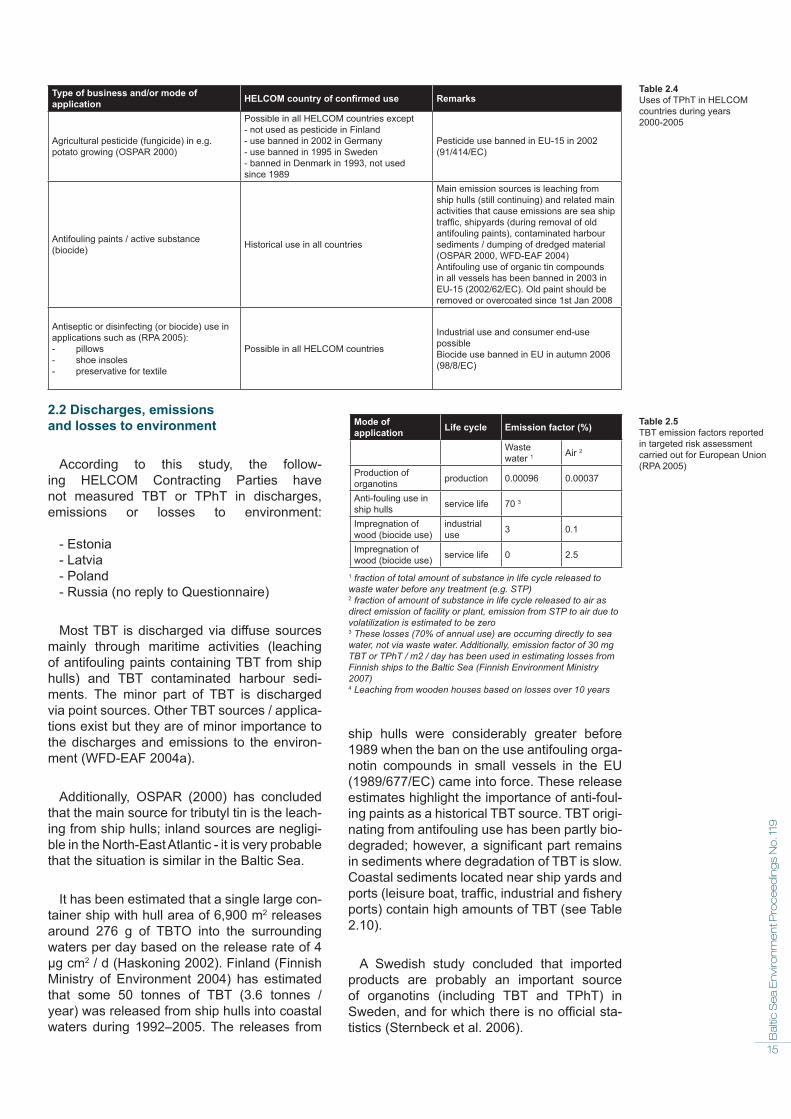
2.2 Discharges, emissions and losses to environment
According to this study, the follow-ing HELCOM Contracting Parties have not measured TBT or TPhT in discharges, emissions or losses to environment:
- Estonia- Latvia- Poland- Russia (no reply to Questionnaire)
Most TBT is discharged via diffuse sources mainly through maritime activities (leaching of antifouling paints containing TBT from ship hulls) and TBT contaminated harbour sedi-ments. The minor part of TBT is discharged via point sources. Other TBT sources / applica-tions exist but they are of minor importance to the discharges and emissions to the environ-ment (WFD-EAF 2004a).
Additionally, OSPAR (2000) has concluded that the main source for tributyl tin is the leach-ing from ship hulls; inland sources are negligi-ble in the North-East Atlantic - it is very probable that the situation is similar in the Baltic Sea.
It has been estimated that a single large con-tainer ship with hull area of 6,900 m2 releases around 276 g of TBTO into the surrounding waters per day based on the release rate of 4 µg cm2 / d (Haskoning 2002). Finland (Finnish Ministry of Environment 2004) has estimated that some 50 tonnes of TBT (3.6 tonnes / year) was released from ship hulls into coastal waters during 1992–2005. The releases from
ship hulls were considerably greater before 1989 when the ban on the use antifouling orga-notin compounds in small vessels in the EU (1989/677/EC) came into force. These release estimates highlight the importance of anti-foul-ing paints as a historical TBT source. TBT origi-nating from antifouling use has been partly bio-degraded; however, a significant part remains in sediments where degradation of TBT is slow. Coastal sediments located near ship yards and ports (leisure boat, traffic, industrial and fishery ports) contain high amounts of TBT (see Table 2.10).
A Swedish study concluded that imported products are probably an important source of organotins (including TBT and TPhT) in Sweden, and for which there is no official sta-tistics (Sternbeck et al. 2006).
Type of business and/or mode of application HELCOM country of confirmed use Remarks
Agricultural pesticide (fungicide) in e.g. potato growing (OSPAR 2000)
Possible in all HELCOM countries except- not used as pesticide in Finland- use banned in 2002 in Germany- use banned in 1995 in Sweden- banned in Denmark in 1993, not used since 1989
Pesticide use banned in EU-15 in 2002 (91/414/EC)
Antifouling paints / active substance (biocide) Historical use in all countries
Main emission sources is leaching from ship hulls (still continuing) and related main activities that cause emissions are sea ship traffic, shipyards (during removal of old antifouling paints), contaminated harbour sediments / dumping of dredged material (OSPAR 2000, WFD-EAF 2004)Antifouling use of organic tin compounds in all vessels has been banned in 2003 in EU-15 (2002/62/EC). Old paint should be removed or overcoated since 1st Jan 2008
Antiseptic or disinfecting (or biocide) use in applications such as (RPA 2005):- pillows- shoe insoles- preservative for textile
Possible in all HELCOM countries
Industrial use and consumer end-use possibleBiocide use banned in EU in autumn 2006 (98/8/EC)
Table 2.4Uses of TPhT in HELCOM countries during years 2000-2005
Mode of application Life cycle Emission factor (%)
Waste water 1 Air 2
Production of organotins production 0.00096 0.00037
Anti-fouling use in ship hulls service life 70 3
Impregnation of wood (biocide use)
industrial use 3 0.1
Impregnation of wood (biocide use) service life 0 2.5
Table 2.5TBT emission factors reported in targeted risk assessment carried out for European Union (RPA 2005)
1 fraction of total amount of substance in life cycle released to waste water before any treatment (e.g. STP)2 fraction of amount of substance in life cycle released to air as direct emission of facility or plant, emission from STP to air due to volatilization is estimated to be zero3 These losses (70% of annual use) are occurring directly to sea water, not via waste water. Additionally, emission factor of 30 mg TBT or TPhT / m2 / day has been used in estimating losses from Finnish ships to the Baltic Sea (Finnish Environment Ministry 2007)4 Leaching from wooden houses based on losses over 10 years

16
The production-related total emission into German waters is estimated to be less than 49 kg TBT / year (study made in 1997). The antifouling paints are considered to be the major introduction source of TBT into the waters (and overall into the environment) in Germany but wood preservation is considered to be of decreasing significance. Leaching of TBT from roofing strips (application ceased until 1990s) and from textiles cannot be disre-garded although it is very difficult to quantify. Quantitative information on the emission of TBT into the environment is not available; how-ever, the dust during the removal of antifouling paints can cause considerable environmental pollution (BUA 2003).
Losses to the environment from TBT use as intermediate in the production of other chemi-cals are considered to be negligible (RPA 2005).
In addition, TBT occurs as an impurity (<1 weight–%) in stabilizing agents containing
MBT and DBT used in the manufacture of plas-tics (PVC, polyurethane and polyester) and the emission pathway is via the use of the products. This pathway probably applies for all HELCOM countries, but probably is not significant source compared to antifouling and wood impregna-tion use.
Some emission factors for TBT have been reported for the EU (Table 2.5). The emis-sion factors for production and service life of impregnated wood are low. Emission factors for wood impregnation (3%) on the other hand are more significant. Nevertheless, it should be noted that high sectoral emission factors do not necessarily result as high sectoral discharges (or emissions), because the amount of sec-toral discharges (or emissions) is very much dependent on how much substance is used by each sector.
Wastewater treatment plants (WWTPs)
A Danish study (Strand et al. 2007) shows
Area Untreated waste water (ng/l as TBT or TPhT)
Treated waste water (ng/l as TBT or TPhT)
Sludge (µg/kg dry weight as TBT or TPhT)
Denmark, 7 STPs 1 <1.2-15 TBTTPhT not detected
TBT not detected (<4.9) TPhT not detected
9.0-98 TBT / median 37 TBTTPhT not detected
Finland, 6 STPs 2 - <0.5 TBT<0.3 TPhT
6.4-13 TBT / mean 9.3 TBT0.04-1.0 TPhT / mean 0.32 TPhT
Germany, 158 STPs 3 - - 12-43 TBT
Lithuania, 25 STPs 4 - TBT not detected (<1)TPhT not detected (<1)
4.3-53 TBT / median 9.3 TBT2.8 TPhT in one STP, not detected (<1) in other STPs
Sweden, 7 STPs 5a <1 – 4.1 TBT / <1 TPhT <1 TBT / <1 TPhT 17-37 TBT / <1 TPhT
Sweden, industrial waste water 5b
2 - 4 TBT<1 TPhT - -
Sweden, household waste water 5b
3 - 6 TBT<1 TPhT - -
Sweden, 2 STPs 5c - - 18-35 TBT
Sweden, 2 STPs 5d STP I: 2.0 TBTTPhT not detected STP II: TBT & TPhT not detected STP II: mean 78 TBT
TPhT not detected
Sweden, 19 STPs 5e - - 10 – 96 TBT / median 44 TBT<1 TPhT
Sweden, 1 STP 5f - 2.7 TBT / 2.3 TPhT -
PNEC AA 0.2 TBT* / MAC 1.5 TBT* / 1.0 TPhT** not available
Table 2.6TBT and TPhT concentrations in waste water and sludge of STPs. Predicted No-Effect Concentration (PNEC) in surface waters has been presented for comparison purposes.
1 Strand et al. 2007: sampled in 2004-2005, mainly 2 waste water samples and 1 sludge sample / STP2 Unpublished screening data: sampled in 2003-2004, one waste water and sludge sample / STP3 BUA 2003: sampled in 2001-20024 Dudutyte et al. 2007: sampled in 20065a Sternbeck et al. 2006: sampled mainly in 2005, time-integrated waste water and sludge (mainly digested) samples 5b Sternbeck et al. 2006: study from year 20045c Sternbeck et al. 2003: sampled in 2002, time-integrated samples from digested sludge5d Tesfalidet 2004: sampled in 2002, single waste water samples and one time-integrated (over one month) sludge sample, Sn concentrations conversed to TBT / TPhT concentrations5e Svensson 2002: sampled in 2001-2002, one integrated sample (samples from different parts of sludge storage) from recently produced and stabilized sludge from each STP5f Junestedt, et al. 2003: sampled in 2001, single sample* 2008/105/EC: EU Environmental Quality Standard for chronic effects (AA-EQS, annual average value) & for short-term eco-toxic effects (MAC-EQS, maximum allowable concentration) in inland and other surface waters for TBT** RPA 2005: Estimated PNEC for TPhT in marine waters

17
Ba
ltic
Se
a E
nvi
ron
me
nt P
roc
ee
din
gs
No
. 119
that the occurrence of organotin compounds are widespread at point sources the aquatic environments in Denmark. Butyltin compounds like TBT, DBT and MBT are the most wide-spread organotin compounds at point sources. The highest concentrations in the wastewater treatment plants were found in inflow wastewa-ter and sludge but not so much in the outflow water. This shows that the WWTPs generally have an efficient removal of organotin com-pounds from the wastewater into the sludge. TPhT was not found in wastewater (not even in untreated) of WWTPs.
According to an extensive German study (158 WWTPs), the TBT concentration in sludge was higher in bigger WWTPs of population 7–12 million inhabitants than in smaller WWTPs with a population of 300 000 inhabitants (BUA 2003).
The Lithuanian screening of dangerous sub-stances in the aquatic environment (Dudyte et al. 2007) showed that TBT was detected in sludge at nearly all WWTPs, unlike TPhT which was found only from one WWTP. However, TBT and TPhT were not detected in treated wastewater (Table 2.6). Wastewater was often contaminated by MBT and DBT; this might be explained by the microbial transformation of TBT (dealkylation and methylation) and / or by use of MBT/DBT.
TBT and TPhT are released to municipal wastewater at least from households hav-
ing different technical products with TBT as an impurity (e.g. PVC flooring) or due to the use of biocidal concumer products containing TBT as an active ingredient (see Table 2.2). The results from the HELCOM countries show that TBT and TPhT are not released in signifi-cant quantities via WWTPs to recipient aquatic environment (Table 2.6). This conclusion was also presented by a recent Swedish screening study (Sternbeck et al. 2006), which also noted that TBT is dealkylated to MBT (monobutyl tin) in WWTPs. Hoch (2001) found that in WWTPs, butyltins were significantly eliminated from wastewater by adsorption onto suspended mat-ter and further by sedimentation to the sludge.
The importance of WWTPs as source can-not be fully evaluated as none of the studies in Table 2.6 had an analytical method which was able to detect concentrations below 0.2 ng/l (the EU Environmental Quality Standard (AA-EQS) for the chronic effects of TBT).
Waste treatment & storm water
Industrial storm water seems to be a sig-nificant diffuse TBT pollution source, because very high TBT levels (10–500 ng/l TBT) were found in both the industrial storm water (Table 2.7) and sludge of all the three cities that were investigated (Sternbeck et al. 2006, Strand et al. 2007). The origin of TBT in these cases was not considered. The influence of urban runoff on the local aquatic environment partly depends on whether storm water is treated in WWTPs
Area / type of waste water Leachate / storm water (ng/l as TBT or TPhT)
Denmark / untreated leachate of industrial landfill 1 TBT not detected (<7) / TPhT not detected (<15)
Germany / untreated leachate of 5 landfills 2 <100 - 900 TBT
Sweden / untreated leachate of 3 landfills 3a TBT not detected (<1) / TPhT not detected (<1)
Sweden / untreated leachate of landfills 3b max 60 / median 10 TBT
Sweden / untreated leachate of 4 landfills 3c <1 - 60 TBT / TPhT not detected (<1)
Sweden / treated leachate of 4 landfills 3c 1 - 2 TBT / TPhT not detected (<1)
Sweden / untreated leachate of landfill 2 <100 – 200 TBT
Denmark / untreated drainage water from former industrial area 1 781-1290 TBT / TPhT not detected (<3)
Sweden / storm water from 4 industrial sites 3d 10 - 500 TBT / TPhT not detected (<1)
Sweden / storm water from airport 3d max 2.0 TBT / TPhT not detected (<1)
PNEC AA 0.2 TBT* / MAC 1.5 TBT* / 1.0 TPhT**
Table 2.7TBT and TPhT concentrations in leachate of landfills and in different kind of storm water. Predicted No-Effect Concentration (PNEC) in surface waters has been presented for comparison purposes.
1 Strand et al. 2007: sampled in 2004-20052 Mersiowsky et al. 2001: 5 landfills in Germany and one in Sweden sampled in end of 1990s, single samples3a Sternbeck et al. 2006: sampled in 2005, both time-integrated and single samples3b Harstad 2006: sampled in 20033c Junestedt, et al. 2003: sampled in 2000-2003, both time-integrated and single samples3d Junestedt, et al. 2003: 4 waste sorting places and one airport sampled in 2000-2003, mainly single samples of untreated storm water* 2008/105/EC: EU Environmental Quality Standard for chronic effects (AA-EQS, annual average value) & for short-term eco-toxic effects (MAC-EQS, maximum allowable concentration) in inland and other surface waters for TBT** RPA 2005: Estimated PNEC for TPhT in marine waters

18
or is directly discharged to the recipients. The scarce information on storm water tribultin lev-els indicates that industrial storm water may play a significant role as a TBT pollution source but not for TPhT. The information on TBT and TPhT levels in non-industrial storm water was not available. Additionally, very high TBT con-centrations (781–1290 ng/l TBT) were found in the drainage water from a former industrial area (Table 2.7).
The results in Table 2.7 indicate that landfills can also significantly contribute to the TBT pol-lution of an aquatic environment but not with regard to TPhT.
Long-range atmospheric transport has gen-erally not been considered as important for organotins. Nevertheless, it has been demon-strated under laboratory conditions that TBT forms highly volatile chloride species in seawa-ter (Mester and Sturgeon 2002). Additionally, a recent study showed the presence of orga-notins in air from rural sites, indicating that the long-range atmospheric transport of butyltins do occur (Huang and Klemm 2004).
The targeted risk assessment carried out for European Commission identified the following TBT sources with risks of concern regarding the environment; anti-fouling paints (aquatic environment) and wood treatment using TBT biocide. TPhT was identified to have risks of concern with regard to human health but not with the environment (RPA 2005).
It is obvious that at present, the leaching of antifouling paints containing TBT from sea ship hulls and especially the TBT contaminated coastal sediments located near ship yards and ports (leisure boat, traffic, industrial and fish-ing ports) are the major sources of TBT in the Baltic Sea. The load from the leaching of anti-fouling paints containing TBT from sea ship’s hulls is continuously decreasing due to the international IMO ban (AFS Convention) on the antifouling use of organotin compounds. The re-suspension of TBT from the sediment to the water phase occurs, e.g. due to the dredging and disposal of TBT contaminated sediments to the Baltic Sea as well as strong water cur-rents induced by an intensive shipping traffic . All other TBT sources/applications are of minor importance for the Baltic Sea.
2.3 Concentrations in biota, sediment and water of Baltic Sea and imposex in marine gastropods
According to this study, the following HELCOM countries have not measured TBT or TPhT in biota, sediment or in the water of the Baltic Sea:
- Estonia- Latvia- Russia (no reply to Questionnaire)
The relevant ecotoxicological and environ-mental data (e.g. on degradation in water or sediment) can be found, e.g. from studies relat-ing to Water Framework directive work (WFD
Figure 2.1TBT level in common mussel (Mytilus edulis) in Bay of Mecklenburg, Germany

19
Ba
ltic
Se
a E
nvi
ron
me
nt P
roc
ee
din
gs
No
. 119
- EAF 2005a) and a recent Swedish screening study (Sternbeck et al. 2006).
TBT oxide is the most commonly used TBT compound and is hydrolyzed in water to TBT cation (Swedish Environment protec-tion Agency 2005). Organotins are subject to microbial transformation such as dealkylation and methylation (Mersiowsky et al. 2001). TBT is dealkylated first to dibutyltin (DBT) and fur-ther on to monobutyltin (MBT) and inorganic tin (Sn4+). Respectively, TPhT is transformed into diphenyltin (DPhT) and further on monophenyl-tin (MPhT) and inorganic tin (Sn4+) in the aquatic environment. Both TBT/TPhT and their degra-dation products have been found in the marine environment (Swedish Environment protection Agency 2005, Sternbeck et al. 2006). Both of the derivates, DBT and MBT, are less toxic than TBT. At pH 8, which is common in the Baltic Sea water, the major TBT-compounds are TBT hydroxide and TBT carbonate (Hoch 2001).
Organotins are moderately hydrophobic and associate strongly to particles in natural waters. In contrast to hydrophobic pollutants such as PCBs or PAHs which favour partition to lipids in organic matter, OTCs are adsorbed to the func-tional groups of organic matter, e.g. phenolic and carboxylic groups (Sternbeck et al. 2006).
TBT and TPhT adsorb strongly to suspended matter in an aquatic environment and end up to sediment (Hoch 2001). Thus, bottom fauna can be exposed to significantly high TBT and TPhT (and DBT, MBT, DPhT, MPhT) sediment concentrations. Additionally, biodegradation of TBT and TPhT is significantly slower in sedi-ment (half-life from one to a few years, more depending on Redox conditions) than in water
(half-life from days to several weeks) (Swedish Environment protection Agency 2005, Sternbeck et al. 2006).
TBT concentrations in mussels (usually blue mussel Mytilus edulis except in one area soft-shelled clam Mya arenaria) of Danish coastal waters of the Baltic Sea and the North Sea in 2004 were generally lower than in 2003. Nevertheless, the TBT levels in mussels were so high in all marine areas that they pose a considerable risk of adverse effects in animals (Andersen et al. 2006). Strand et al. (2003) found that TBT levels in deposit-feeding bivalve Nuculana pernula showed a gradually decreas-ing trend from the Sound through the Kattegat and into the Skagerrak. Nuculana pernula was found to bioaccumulate TBT in the Sound to about one order of magnitude higher levels than the filter-feeding bivalves Arctica islan-dica, Musculus niger and Cardium echinatum. Additionally, the strong correlation between TBT levels in sediment and in Nuculana per-nula was observed. TBT was detected in all studied sediment sites in the Sound (max 19 µg/kg dw) with the strong correlation between the TBT levels and the organic content of sedi-ment. TBT levels in the sediments of Kattegat were mainly below the detection limit (1 µg/kg dw). TPhT was not detected in any of the sediment and molluscs samples in the Sound and Kattegat (detection limit of 10 µg/kg dw in sediment and biota). The bivalve Nuculana pernula was recommended to use in monitor-ing the sediment contamination caused by TBT in Kattegat. Additionally, the close relationship between maritime activities and the total butyl-tin levels in the lower trophic sedentary animals has been found (Strand et al. 2003).
Area Sea water (ng/l as TBT or TPhT)
Denmark, Sound & Kattegat 1 <2.4 TBT
Finland, Gulf of Finland, dredging sites 2 <1-13.6 TBTTPhT not detected (<1)
Lithuania, Southern Baltic Proper, harbour area 3 12 TBT / TPhT not detected (<1)
Sweden, Bothnian Sea 4 mean 11 TBT / mean 12 TPhT
Sweden, Northern Baltic Proper 4 mean 2.2 TBT / TPhT not detected
Sweden, Kattegat 4 0.24-2.2 TBT / 0.03-2.4 TPhT
Sweden, Kattegat 4 year 2001: 0.24-1.5 TBT / max 0.68 TPhTyear 1987: 29-634 TBT
PNEC AA 0.2 TBT* / MAC 1.5 TBT* / 1.0 TPhT**
Table 2.8 TBT and TPhT concentrations in Baltic Sea water. Predicted No-Effect Concentration (PNEC) has been presented for comparison purposes.
1 DMU 2007: one bay in Sound and one “fjord” in Kattegat2 Vatanen et al. 2006: 6 sites in the vicinity of harbor under construction (dredging activities), 8 samplings in 2005, unfiltered samples (include particle-bounded fraction)3 Dudutyte et al. 2007: one harbour area sampled in 20064 Tesfalidet 2004: sampled in Sweden in 2001* 2008/105/EC: EU Environmental Quality Standard for chronic effects (AA-EQS, annual average value) & for short-term eco-toxic effects (MAC-EQS, maximum allowable concentration) in inland and other surface waters for TBT** RPA 2005: Estimated PNEC for TPhT in marine waters

20
Area / species Tissue type
Biota(µg/kg wet or dry weight as TBT or TPhT)
Fish
Gulf of Finland and Gulf of Bothnia, pike Esox lucius 1 muscle 2.2 - 57 ww TBT / median 5.5 ww TBT2.4 - 83 ww TPhT / median 12 ww TPhT
Gulf of Finland, dredging sites, pike Esox lucius 2 muscle 18 - 20 ww TBT / mean 19 ww TBT25 - 52 ww TPhT / mean 39 ww TPhT
Gulf of Finland, dredging sites, pike Esox lucius 2 liver 38 - 55 ww TBT / mean 46 ww TBT128 - 318 ww TPhT / mean 223 ww TPhT
Gulf of Finland, dredging sites, pikeperch Stizostedion lucioperca 2 muscle 15 - 25 ww TBT / mean 20 ww TBT7.8 - 17 ww TPhT / mean 12 ww TPhT
Gulf of Finland, dredging sites, pike Perca fluviatilis 2 muscle 24 - 38 ww TBT / mean 30 ww TBT12 - 23 ww TPhT / mean 19 ww TPhT
Gulf of Finland, disposal sites, perch Perca fluviatilis 2 muscle 19 - 33 ww TBT / mean 24 ww TBT12 - 18 ww TPhT / mean 15 ww TPhT
Northern Baltic Proper, perch Perca fluviatilis 3 muscle 6.8 - 33 ww TBT / median 26 ww TBT39 - 102 ww TPhT / median 84 ww TPhT
Gulf of Bothnia, herring Clupea harengus 4 muscle 10-15 dw TBT / max 19 dw TPhTGreat Belt, flounder Platichthys flesus 5b liver 2.2 ww TBT / <3 ww TPhTSound, flounder Platichthys flesus 5b liver 4.1 ww TBT / 24 ww TPhTGulf of Gdansk, flounder Platichthys flesus 6 liver 15-85 ww TBT / 21-88 ww TPhTCoastal reference site to Gulf of Gdansk, flounder Platichthys flesus 6 liver 0.24 ww TBT / 8.3 ww TPhT
MusselKattegat, Great and Little Belt & Sound 1998-2003, blue mussel Mytilus edulis 5 soft tissue mean 7.3-73 ww TBT / max 12-139 TBTKattegat, Great and Little Belt & Sound 2004, blue mussel Mytilus edulis 7 soft tissue max 205 dw TBT
Kattegat & Sound, blue mussel Mytilus edulis 3 soft tissue 4.5 – 8.2 ww TBT / mean 5.9 ww TBT<0.3 – 1.3 ww TPhT
Kattegat, blue mussel Mytilus edulis 4 soft tissue 90-878 dw TBT / TPhT not detectedBay of Mecklenburg, blue mussel Mytilus edulis 8 80-122 dw TBTPolish coast, blue mussel Mytilus edulis 6 soft tissue 5.4-95 ww TBT / TPhT not detectedSouthern Baltic Proper, blue mussel Mytilus edulis 6 soft tissue 8.1-30 ww TBT / TPhT not detected
Southern Baltic Proper, Baltic clam Macoma balthica 14 soft tissue 4.6 – 12 ww TBT / mean 8.5 ww TBT
Archipelago Sea, dredging sites, Baltic clam Macoma balthica 9 soft tissue 74 - 474 ww TBT
Gulf of Finland, dredging sites, Baltic clam Macoma balthica 10 soft tissue 30 - 54 ww TBT / mean 43 ww TBT4.9 - 16 ww TPhT / mean 10 ww TPhT
Gulf of Finland, disposal sites, Baltic clam Macoma balthica 10 soft tissue 23 - 47 ww TBT / mean 35 ww TBT1.9 – 3.3 ww TPhT / mean 2.6 ww TPhT
MammalsSouthern Baltic Proper & Gulf of Gdansk, ringed seal Phoca hispida & grey seal Halichoerus grypus 11 liver 107-183 dw TBT / TPhT not detected
Southern Baltic Proper & Gulf of Gdansk, harbour porpoise Phocoena phocoena 11 liver 337-1332 dw TBT / TPhT not detected
Belt Sea & Sound, harbour porpoise Phocoena phocoena 12 liver 60 - 1890 ww TBT / mean 260 ww TBT< 10 – 62 ww TPhT
Belt Sea & Sound, harbour seal Phoca vitula 13 liver < 1 – 1.5 ww TBT / 13 – 85 ww as total BT
PNEC - 230 ww TBT in prey tissue * / 15 ww TBT in seafood* / 1 - 10 dw TBT in mussel**
1 Unpublished screening data: 5 Finnish coastal sites in 2003, 5-10 individuals / site2 Vatanen et al. 2006: 3 sites near the the harbor under construction (3-5 individuals / site, not pooled) and 5 disposal sites (5 individuals / site, not pooled) in 20053 Sternbeck et al. 2006: perches sampled from 5 sites in Stockholm archipelago in 2000-2001 (pooled), blue mussels sampled from 4 sites in Kattegat in 2005 (pooled) 4 Tesfalidet 2004: 3 kg herrings from local fisherman and mussels sampled in 20015 Boutrup et al. 2006: 28 stations in 9 Danish coastal areas of (Baltic Sea area) during 1998-2003, sampling once a year, 3 sub-samples and each sub-sample consist of 25-50 mussel individuals5b Strand et al. 2007: 2 Danish coastal sites in 2004, 5 individuals / site6 Albalat et al. 2002: flounders from 4 Polish sites in the Gulf of Gdansk and one reference site outside the bay, blue mussels from 7 sites along the Polish coast and 3 sites from open sea (“Southern Baltic Proper”) in 1998 7 Ærtebjerg et al. 2006: Danish coastal sites (Baltic Sea area) in 20048 German Environmental Specimen Bank: sampled in 2004-2005; whole time-series presented in Figure 2.19 Finnish Environment Ministry 200710 Vatanen et al. 2006: 10 dredging sites in the vicinity of harbor under construction (3 sampling times) and 3 disposal sites (single samples) in 2005 in Finland, 5 ind. / site, not pooled11 Ciesielski et al. 2004: grey seals (2 ind.) sampled in 1996 and 1999, ringed seal (1 individual) in 1999 and harbour porpoises (14 individuals) during 1999-2003 from Polish coastal area 12 Strand et al 2005. Harbour porpoises (20 ind.) sampled 1996-97 from the Inner Danish waters, i.e. Belt Sea and Sound13 Strand & Jacobsen 2005. Harbour seals (5 ind.) sampled during the major seal disease mortality in 2002 from Belt Sea and Sound14 Finnish Institute of Marine Research (FIMR), 2007. Evaluation of the environmental state of the sea area in the Lithuanian territorial waters and economic zone adjacent to the Russian oil platform D-6. Project report. Helsinki.* WFD - EAF 2005a: estimated PNEC for protection of predators such as mammals and predatory birds via secondary poisoning, expressed as concentration in prey tissue and PNEC for human health via seafood uptake** OSPAR 1997: OSPAR Eco-toxicological Assessment Criteria (EAC)
Table 2.9TBT and TPhT concentrations in biota of Baltic Sea. Predicted No-Effect Concentration (PNEC) for TBT has been presented for comparison purposes. PNEC for TPhT does not exist.

21
Ba
ltic
Se
a E
nvi
ron
me
nt P
roc
ee
din
gs
No
. 119
Another Danish study showed that TBT, TPhT and/or their breakdown products can be detected in organisms at most trophic lev-els of the marine food web from seaweed, to invertebrates, fish, birds and mammals (Strand & Jacobsen 2005). However, a high variance in accumulation levels of organotin was found between and within various spe-cies and between species at the same trophic level. The highest concentrations of TBT and its breakdown products were found in the liv-ers of harbour porpoises, where the concentra-
tions were in the range between 285 and 4605 ng/g ww, where concentrations of TBT alone were between 75 – 871 ng/g ww. Total butyltin levels exceeding 200 ng/g ww were also found in the livers of both flounder and eider duck. The lowest butyltin concentrations were found in seaweed and the mute swan - a plant feed-ing bird (Strand & Jacobsen 2005; Strand et al. 2005). TPhT or its degradation products were also detected in most of the species, with the highest concentrations in flounder, cod and the great black-backed gull, where the phenyltin
Area Sediment (µg/kg dry weight as TBT or TPhT)
Coastal and open sea
Denmark, 5 coastal and open sea areas 1 median 2.4-151 / max 7.3-366 TBT
Finland, 7 coastal sediments 2a 2.6-105 / median 20 / mean 31 TBT0.2-4.2 / median 1.7 / mean 1.8 TPhT
Bay of Mecklenburg, 4 German coastal sediments 3 18-954 / mean 306 TBTSouthern Baltic Proper, 5 German coastal sediments 3 14-72 / mean 57 TBTSouthern Baltic Proper, 9 Lithuanian coastal sediments 8 4 – 807 TBT, not detected at 6 sitesSweden, 16 open sea sediments 5a <1 – 110 TBT / <1 TPhTNorthern Baltic Proper, 14 Swedish coastal sediments 5b <5 – 224 TBT, not detected at 4 sitesSweden, 1 coastal sediment 5c 3.4 – 70 TBT
Ship yards
Denmark, 1997-99 1 220-12 200 / median 1700 TBTDenmark, 2000-02 1 1700-14 600 / median 2 400 TBTPoland 7 2 000 – 47 000 TBTFinland 2b <1 – 9 200 TBTGermany, Kiel Bight 6 251 – 45 400 / median 7535 TBTGermany, other ship yards than in Kiel Bight 6 14 - 14 500 TBT
Traffic, industrial and fishery ports
Denmark, 1997-99 1 40-4 900 / median 370 TBTDenmark, 2000-02 1 <2.4-4 900 / median 1 700 TBTFinland 2b <1 – 1 800 TBT
4 Lithuanian coastal sediments 4 13-1 920 / mean 638 TBT6.4 TPhT in one site, not detected (<1) in other sites
Leisure boat ports
Denmark, 1997-99 1 240-4 900 / median 490 TBTDenmark, 2000-02 1 <2.4-2 700 / median 850 TBTFinland 2b <1 – 3 400Germany, other leisure boat and industrial ports than Kiel 6 <12 – 7537 / median 530 TBT
Sea routes, Finland 2b <1 – 1 600 TBT
Disposal sites for dredged material, Finland 2b <1 – 580 TBT
PNEC 0.02 TBT* / 3 TBT** / 0.005-0.05 TBT***
Table 2.10TBT and TPhT levels in sediment of Baltic Sea. Note that the depth of sediment sample may vary. Predicted No-Effect Concentration (PNEC) has been presented for comparison purposes.
1 Boutrup et al. 2006: Danish coastal and open sea areas in the Inner Danish waters, 0-1 cm surface layer2a Unpublished screening data: 7 coastal sediment sites in 2003, single surface sediment samples 2b Finnish Environment Ministry 2007: sampled during 1998-2005 with varying sample depth3 Sampled during 2000-20024 Dudutyte et al. 2007: 4 Lithuanian sediments from Klaipeda port area in 2006, 0-2 cm surface layer of sediment 5a Cato 2005: 16 open sea sediment sites from Skagerrak to Bothnian Bay in 2003, 0-1 cm surface layer of sediment5b Sternbeck et al. 2003: sampling in 2002, 0-2 cm surface layer of sediment5c Tesfalidet 2004: one coastal sediment site in 2001, Sn concentrations converted to TBT / TPhT concentrations6 Finnish Environment Ministry 2007: summary for German results from year 20017 Albalat et al. 2002 8 Finnish Institute of Marine Research (FIMR), 2007. Evaluation of the environmental state of the sea area in the Lithuanian territorial waters and economic zone adjacent to the Russian oil platform D-6. Project report. Helsinki.* WFD-EAF 2005a: estimated PNEC for benthic community based on equilibrium partitioning method (no eco-toxicological data available for sediment dwelling organisms), expressed as concentration in sediment** Finnish Environment Ministry 2004: Finnish quality criteria for depositing dredged material, level 1 (PNEC) as normalized concentration, which is based on eco-toxicological data for sediment dwelling organisms and from analytical point of view could be reliably quantified *** OSPAR 1997: OSPAR Eco-toxicological Assessment Criteria (EAC)

22
concentrations were in the range between 30 and 220 ng/g ww (Strand & Jacobsen 2005).
In 2003, the Danish estuaries and coastal areas were polluted with TBT causing both imposex and intersex of bottom snails. The problem was greatest in harbours, but was also present in many coastal areas and among the most sensitive species in the open waters (Ærtebjerg et al. 2004). Imposex in marine gas-tropods and fish, which has been monitored in Danish coastal waters since 1998, is a specific effect of exposure to tributyl tin (Boutrup et al. 2006, Sternbeck et al. 2006). Imposex means that females are masculinized - a severe con-sequence because it directly influences the reproduction ability of organisms.
Since 1998, imposex and intersex have been included as biomarkers in the national monitoring programme in Denmark covering both coastal and open waters in the Belt Sea, the Sound, the Kattegat and the Skagerrak (Boutrup et al. 2006). Four key species of gas-tropods have been selected, Buccinum unda-tum, Neptunea antiqua, Hinia reticulata and Littorina littorea, but imposex development has also been found in other Danish gastro-pod species (Strand 2003). Nucella lapillus, which is the key species in most monitoring programmes in the North Sea region, does not occur in the Kattegat and other parts of the Inner Danish waters. The studies performed in NOVA have shown that imposex and intersex are widespread phenomena in all regions of the Danish waters, especially in the most sensitive species. For instance, almost all N. antiqua in the Inner Danish waters have developed impo-sex and generally in highly developed stages, VDSI = 2.6 – 4.0, but significant imposex lev-els are also present in the open waters of the Skagerrak and the North Sea, VDSI = 0.7 – 1.8. In comparison, less frequent and less devel-
oped stages are present in B. undatum in the Inner Danish waters, VDSI = 0.1 – 1.6, and in the Skagerrak and the North Sea, VDSI = 0.1 – 0.7. The highest imposex levels in B. undatum occur in the Belt Sea (Strand & Jacobsen 2002, Strand 2003, Boutrup et al. 2006). Imposex in other gastropod species like Hydrobia ulvae (Schlute-Oehlmann et al., 1997, 1998) can be included as an indicator in these types of stud-ies and so potentially the more eastern part of the Baltic Sea can also be covered. Studies on intersex in Littorina Littorea have also been carried out in the German part of the Baltic Sea (Bauer et al. 1997, Schlute-Oehlmann et al., 1998).
A recent Danish study (Strand et al. 2007) shows that the occurrence of organotin com-pounds are widespread in the aquatic environ-ments in Denmark. The occurrence of butyltin compounds including TBT in relatively high concentrations in sediment, mussel and biota from freshwater and marine environments may primarily be ascribed to the use of TBT as an antifouling agent in paints for ships. Phenyltin compounds like triphenyltin are primarily found accumulated in freshwater and marine fish, but it is not known whether the main course is the former use of TPhT as an agricultural fun-gicide or its use as antifouling agent in paints for ships. It is assessed that the found con-centration levels of the most toxic triorganotin compounds TBT and TPhT pose a risk to the aquatic environment and especially to organ-isms at the lower trophic levels of the food web. Finally, the study recommended that organotin compounds are included in future monitoring programmes for point sources, freshwater and marine environments in Denmark.
TBT level in blue mussel (Mytilus edulis) in the Bay of Mecklenburg in Germany has decreased significantly from the levels of
Substance Sources of discharges to aquatic environment Sources of emissions to atmosphere
TBT
* anti-fouling use in sea ship hulls; historically the most significant primary source for Baltic Sea, but load is continuously decreasing due to international IMO ban on antifouling use of organotin compounds * TBT contaminated coastal sediments locating near ship yards and harbours / ports (leisure boat, traffic, industrial and fishery ports). The resuspension of TBT from sediment to water phase is occurring e.g. during dredging and disposal of TBT contaminated sediments to Baltic Sea.* treatment of waste; storm water from waste sorting sites* landfills* Sewage treatment plants (STPs); the importance as source can not be excluded due to analytical reasons
preliminary results indicate that long-range atmospheric transport of butyltins may occur, this issue should be more thoroughly investigated
TPhT
* anti-fouling use in sea ship hulls; historically the most significant primary source for Baltic Sea, but load is continuously decreasing due to international IMO ban on antifouling use of organotin compounds * TPhT contaminated coastal sediments locating near ship yards and harbours / ports (leisure boat, traffic, industrial and fishery ports). The resuspension of TPhT from sediment to water phase is occurring e.g. during dredging and disposal of TPhT contaminated sediments to Baltic Sea.
Not considered important
Table 2.11Relevant sources of TBT and TPhT discharges and emissions. The industrial sector or professional use has been identified as a significant source if the emission factor is relatively high or if it has been identified as risk use in national or EU risk assessments. The significance of other activities (e.g. STPs and landfills) has been evaluated on the basis of measured effluent concentrations. It should be noted that all below mentioned sectors may not be relevant in all HELCOM countries and these should be identified at national level (e.g. within national programs under the HELCOM BSAP).

23
Ba
ltic
Se
a E
nvi
ron
me
nt P
roc
ee
din
gs
No
. 119
1996–2002 (about 250–400 ng/g dw) to a level of 80 ng/g dw in 2005 (Figure 2.1).
The Finnish sediment study found that the maximum TBT concentrations have mainly been found from the upper 10 cm sediment layer; however, in areas where the currents relocate the surface sediment and the sedi-mentation rate is high, the maximum concen-tration can locate in deeper sediment layers. TBT concentrations in the sediment of certain polluted areas of the Baltic Sea are high and may pose a risk, especially to sediment-dwell-ing organisms (Finnish Ministry of Environment 2004).
There are indications that the distribution of organotin compounds in fish differs from the sediment in a marine environment. TPhT level is about 1–13 % of TBT level in surface sedi-ment but in fish, the TPhT level is mainly equal or higher than the TBT level in Finnish coastal areas (Finnish Ministry of Environment 2007). This indicates that TPhT is bioaccumulating to fish more effectively and its metabolizing and depuration (or loss) rate in fish is slower than TBT. This was also concluded in the Swedish screening study on organotins in the Swedish environment (Sternbeck et al. 2006). According to ecotoxicological data (WFD - EAF 2005a), biomagnification does not significantly contrib-ute to the accumulation of TBT in biota and that TBT is accumulating to a slightly larger extent in invertebrates (e.g. mollusks) than in fish. TBT concentrations in the fish of certain Finnish coastal areas of the Baltic Sea are not very high and not likely pose a risk to the fish populations (Finnish Ministry of Environment 2007).
According to the Finnish dredging surveys (Finnish Ministry of Environment 2007), orga-notin levels in the Baltic clam (Macoma balth-ica) were highest in areas where levels in the sediment were also high. TBT levels have been around 30–470 µg/kg wet weight and TPhT lev-els <10–50 µg/kg wet weight in dredging sites. Furthermore, at disposal sites TBT and TPhT levels have been significantly lower (around 30–50 µg/kg TBT w.w. and 2–3 µg/kg TPhT w.w.) than in dredging sites.
The Lithuanian screening of dangerous sub-stances in the aquatic environment (Dudyte et al. 2007) showed that TBT concentration in harbour water was high, exceeding the Predicted No-Effect Concentration (PNEC). However, TPhT was not detected (Table 2.8).
Additionally, TBT levels in coastal sediments seem to be very high unlike TPhT levels (Table 2.10). The screening found that organotin com-pounds (along with phtalates) are the most problematic substances for Lithuanian the aquatic environment.
The assessment of organotin contaminants in marine mammals along the Polish coast of the Baltic Sea (Ciesielski et al. 2004) showed high TBT (and total butyltin) levels in the liv-ers of harbour porpoises, grey seals, ringed seals and striped dolphins caught or stranded during 1996–2003. TPhT was not detected. TBT levels were 2–10-fold higher in harbour porpoises compared to ringed and grey seals. Statistically significant spatial differences were not observed between the locations in the open sea (Southern Baltic Proper) and the Gulf of Gdansk. The mean percentage of TBT in total butyltin levels for porpoises, ringed seals and striped dolphins were for TBT 22%, DBT 50% and MBT 28% indicating possible metabolism of TBT in the liver. The liver has been used as a matrix for biomonitoring marine mammals as it is known to accumulate high butyltin levels. According to these preliminary results (very lit-tle data concerning the Baltic Sea is available), the grey seal, ringed seal and harbour porpoise are not ideal marine organisms for monitor-ing TBT - lower trophic sedentary animals are more suitable.
The assessment of organotin pollution along the Polish coast of the Baltic Sea (Albalat et al. 2002) showed very high TBT levels in both blue mussel and flounder. These two species were used because they are sentinel organ-isms. TPhT was not detected in mussels, but was always found in fish. Different tissues (liver, digestive tube and gills) of the flounders were analyzed separately. The bioaccumula-tion patterns of butyltin and phenyltin com-pounds varied substantially. The highest TBT concentrations were observed in the digestive tube (max 278 µg/kg ww) whereas TBT levels were similar in the liver (15–85 µg/kg ww) and gills (22–74 µg/kg ww). The highest TPhT lev-els were observed in the liver followed by the digestive tube and gills. The highest total orga-notin (sum of MBT, DBT, TBT and TPhT) con-centration was observed in the liver (max 369 µg/kg ww as Sn). High organotin levels in the digestive tube indicate the ingestion of organo-tin contaminated food as an important uptake route for flounder.
This confirmed the results from previous stud-

24
ies on organotin pollution along the Polish coast by Kannan & Falandysz (1997) and Kannan et al. (1999), which showed that considerable concentrations of butyltins occur in sediments and biota (fish, fish-eating birds, harbour por-poise) along the Polish coast, particularly in the Gulf of Gdansk. TBT was mostly the major form of butyltins present.
TBT and TPhT bioaccumulate more strongly in the liver compared to muscle in fish and marine mammals. Trisubstituted OTCs such as TBT and TPhT are more strongly bioaccumu-lated than the less lipophilic mono- and disub-stituted OTCs such as DBT, MBT, DPhT and MPhT. Most studies do not suggest that TBT is biomagnified in aquatic food-chain. However, TPhT appears to be biomagnified fairly strongly in the aquatic food chain. Furthermore, organo-tin compounds were more abundant than PCB and DDT in perch from the Stockholm area (Sternbeck et al. 2006).
The Swedish survey concluded that the measurements of organotin compounds (e.g. TBT and TPhT) will continue within the Swedish contaminant screening /monitoring programme (Swedish Environment protection Agency 2005). The tentative Swedish risk assessment showed that the levels of organotins are close to or above acceptable levels for health and the environment in certain coastal areas in Sweden (Sternbeck et al. 2006).
TBT and other organotin compounds (but not DBT and MBT) are endocrine disruptors. TBT affects the endocrine system of certain marine and freshwater mollusc species as low water concentration as 1 ng/l (WFD-EAF 2005a, Swedish Environment protection Agency 2005, Sternbeck et al. 2006). The information on TBT and TPhT concentrations in the coastal waters of Baltic Sea is scarce, but indicates that both TBT and TPhT pose a threat to aquatic marine organisms with both chronic and acute effects (Table 2.8).
The most sensitive reaction of mammals to TBT is linked to the effects on the immune sys-tem. It is supposed that TBT could increase the susceptibility of mammals to diseases such as microbial infection. It is possible that TBT acts in a synergistic way with other immune toxi-cants such as PCBs. The mass die-outs among the Baltic Seals mainly caused by morbillivirus infections may possibly be attributed to chemi-cal pollutants such as organochlorines, heavy metals and TBT (Ciesielski et al. 2004).
Organotins are also toxic by other mecha-nisms than imposex and reproduction. For instance, several organotins are strongly immu-nosuppressive, display developmental and reproductive effects and are neurotoxic. DBT may actually be more toxic than TBT to certain enzyme systems. Immunotoxic and develop-mental effects in mammals may also be more sensitive to DBT than to TBT (Sternbeck et al. 2006). Both TBT and TPhT may be classi-fied as PBT and vPvB substances according the criteria in Technical Guidance Document on risk assessment of substances in the European Union (EC 2003), whereas DBT may be classified as PBT (RPA 2005). Ecotoxicity increases dramatically in the order MBT < DBT < TBT for certain endpoints or modes of action (Sternbeck et al. 2006).
It should be noted that at least Danish, Finnish and Swedish screening studies (and risk assessments on human health and envi-ronment) include other organotin compounds than just TBT and TPhT, e.g. MBT, DBT, MPhT and DPhT. Both butyltins (MBT, DBT & TBT) and phenyltins (MPhT, DPhT & TPhT) are con-sidered among organotin compounds.
2.4 Substance-specific conclusions
It is evident that most HELCOM countries do not have sufficient information on the use of TBT and TPhT and since autumn 2006, their use has been banned in the EU–25. However, it can be concluded that currently the main source / pathway to the Baltic marine environ-ment of TBT and TPhT is the antifouling use in sea ship’s hulls. Its importance as a source will continuously decrease. Other relevant sources are, e.g. the contaminated sediments (Table 2.11).
The industrial sector or professional use has been identified as a significant source if the emission factor is relatively high or if it has been identified as a risk use in national or EU risk assessments. The significance of other activities (e.g. WWTPs and landfills) has been evaluated on the basis of measured effluent concentrations. It should be noted that all the below mentioned sectors may not be relevant in all HELCOM countries and should therefore be identified at national level (e.g. within national programmes under the HELCOM BSAP).
TBT concentrations in surface waters have significantly declined in many water bodies fol-

25
Ba
ltic
Se
a E
nvi
ron
me
nt P
roc
ee
din
gs
No
. 119
lowing the enactment of the TBT legislation in various countries, such as the coastal waters of Mediterranean. Declining trends in sediment TBT concentrations were also noticed after the TBT legislation was enacted, with the most pro-nounced trend at locations with very high initial concentrations.
The occurrence of organotin compounds is widespread in the Baltic marine environment. Despite the legislative measures taken, the current levels of the most toxic triorganotin compounds TBT and TPhT pose a risk to the marine environment and especially to organ-isms at the lower trophic levels of the food web such as sediment-dwelling fauna.
The fi ndings of this HELCOM assessment imply that the threat caused by organotin com-pounds (especially TBT and TPhT) to the Baltic Sea is highest near harbours and shipyards. The elevated levels also occur near sea routes and at the disposal sites for dredged material. The TBT levels are high in water, sediment and biota (e.g. in mussels and fi sh), whereas high levels of TPhT are mainly found in fi sh.
Thus, information on the occurrence of TBT and TPhT in Baltic Sea (e.g. in biota and sedi-ment) and in discharges (e.g. WWTPs, landfi lls and waste sorting sites) in the HELCOM coun-tries is needed. Additionally, it is crucial that information on the dredging and disposal of TBT-contaminated sediments to the Baltic Sea will be systematically collected in each Baltic Sea country, and that each country will report this information to HELCOM according to the prevailing HELCOM guidelines and schedule.
tries is needed. Additionally, it is crucial that information on the dredging and disposal of TBT-contaminated sediments to the Baltic Sea will be systematically collected in each Baltic Sea country, and that each country will report this information to HELCOM according to the prevailing HELCOM guidelines and schedule.

Pentabromodiphenyl ether has been identi-fi ed as priority hazardous substance under the Environmental Quality Standard (EQS) Directive (2008/105/EC). It is a chemi-cal for which risk management evaluations are currently prepared under the Stockholm Convention on POPs.
Tri-, tetra- and hexabromodiphenyl ether have been identifi ed as priority substances under EQS Directive 2008/105/EC. They are degradation products of, e.g. octobromodiphe-nyl ether for which a risk profi le is currently pre-pared under Stockholm Convention on POPs.
Three polybrominated diphenyl ether (PBDE) fl ame retardants are available commercially; referred as penta-, octa- and decabromodiphe-nyl ether, but actually these products are mix-ures of diphenyl ethers with varying degrees of bromination.
The commercial products of pentabro-modiphenyl ether (pentaBDE) contain penta-bromodiphenyl ether as a main component of the mixture (50–62% w/w, EU-RAR 2000). Other components are tetrabromodiphenyl ether (24–38% w/w), hexabromodiphenyl ether (4–12% w/w) and tribromodiphenyl ether (0–1% w/w) (EU-RAR 2000).
The commercial products of octabromodiphe-nyl ether (octaBDE) have an average composi-tion of 5.5% hexabromodiphenyl ether, 42.3% heptabromodiphenyl ether, 36.1% octabro-modiphenyl ether, 13.9% nonabromodiphenyl ether and 2.1% decabromodiphenyl ether. The amount of pentabromodiphenyl ether isomers is thought to be <0.5% (EU-RAR 2003).
Typical composition for modern commer-cial products of decabromodiphenyl ether (decaBDE) is 97–98% decabromodiphenyl ether with 0.3–3.0% of other brominated diphe-
nyl ethers, mainly nonabromodiphenyl ether (EU-RAR 2002a).
The eight BDE congeners out of a total of 209 were indicated in the HELCOM question-naire sent to Contracting Parties in 2006 and are presented below:
- 2,4,4’-tribromodiphenyl ether, BDE28- 2,2’,4,4’-tetrabromodiphenyl ether, BDE47- 2,2’,4,4’,5-pentabromodiphenyl ether, BDE99- 2,2’,4,4’,6- pentabromodiphenyl ether, BDE100- 2,2’,4,4’,5,5’- hexabromodiphenyl ether, BDE153- 2,2’,4,4’,5,6’- hexabromodiphenyl ether, BDE154- 2,2’,3,4,4’,5’,6-heptabromodiphenyl ether, BDE183- 2,2’,3,3’,4,4’,5,5’,6,6’-decabromodiphenyl ether, BDE209
These BDE congeners have been recom-mended by Law et al. (2006) to be used as a minimum common congener set in determining BDEs from different matrixes. These indica-tive congeners cover the penta-, octa- and decaBDE substance groups.
3.1 Production and use
The usage information of penta-, octa- and decaBDE in the HELCOM Contracting Parties is presented in Tables 3.2–3.4 and in the EU in Tables 3.5–3.7.
It can be concluded that use of penta- and octaBDE in Finland and Sweden already ended by 2000 (Table 3.3). DecaBDE has been used (and perhaps is still used) as fl ame retardant in electrical and electronic equipment, building materials and plastics (Table 3.2).
Estimates on amounts of used penta-, octa- and decaBDE during 2000–2005 are only available from Finland and Sweden (Tables 3.3 and 3.4). One reason for the Contracting Parties not sending this information is due to the fact that penta- and octaBDE were banned in August 2004 in the EU–15.
Production of pentaBDE ceased in EU–15 in 1997. There was a decline in the import and hence in the use of pentaBDE in EU–15 in 1990s. Imports were estimated to be about 500 tonnes in 1997, 300 tonnes in 1998 and 150 tonnes in 1999. The usage was estimated to be 100–125 tonnes in 2000 with a similar amount being imported to the EU–15 in fi nished goods
26
3 Pentabromodiphenyl ether (pentaBDE), octabromodiphenyl ether (octaBDE) and decabromodiphenyl ether (decaBDE)
Substance Europe (ton)
America (ton)
Asia (ton)
Rest of the world (ton)
Total (ton)
PentaBDE 150 7 100 150 100 7 500OctaBDE 610 1 500 1 500 180 3 790DecaBDE 7 600 24 500 23 000 1 050 56 100HBCDD 9 500 2 800 3 900 500 16 700
Table 3.1Usage of some brominated fl ame retardants in 2001 (Law et al. 2006).

27
Ba
ltic
Se
a E
nvi
ron
me
nt P
roc
ee
din
gs
No
. 119
Country Use (ton) Remarks2000 2001 2002 2003 2004 2005
Denmark 2.4 2.4 NI NI NI NI include also pentaBDE useEstonia NI NI NI NI NI NI
Finland 6 6 6 6 6 < 0.1
Use as chemical, export not taken into account, years 2000-2004 AMAP 2007 year 2005 National Product Register of Chemicals
Germany NI NI NI NI NI NI Use ~1 000 ton in 1999
Latvia NI NI NI NI NINot produced or imported
National Chemicals Data Base
Lithuania NI NI NI NI NI NIPoland NI NI NI NI NI NIRussia 200 200 200 200 200 NI AMAP 2007
Sweden 89 15 14 5.1 3.6 3.5 CAS 1163-19-5, National Product Register of Chemicals
Type of business (NACE or other) and/or mode of application HELCOM country of confirmed use Remarks Manufacture of plastic products / flame retardant Finland Year 2004Manufacture of insulated wire and cable / flame retardant in different electrical equipments Finland Year 2004
Building materials/ flame retardant Finland Year 2001Electrical and electronic equipment Sweden Year 2003 (AMAP 2007)
Country Use (ton) Remarks2000 2001 2002 2003 2004 2005
Denmark 2.4 2.4 NI NI NI NI pentaBDE, but include also decaBDE use
Estonia NI NI NI NI NI NI
Finland NI 0 0 0 0 0pentaBDE,CAS 32534-81-9octaBDE,CAS 32536-52-0,National Product Register of Chemicals
Germany NI NI NI NI NI NI Banned in August 2004
Latvia NI NI NI NI NINot produced or imported
National Chemicals Data Base
Lithuania NI NI NI NI NI NIPoland NI NI NI NI NI NIRussia NI NI NI NI NI NI No reply to questionnaire
Sweden 0 0 0 0 0 0 octaBDE,CAS 32536-52-0, National Product Register of Chemicals
Mode of application Life cycle Emission factor (%)Waste water 1 Air 2
Production of pentaBDE (possible in Russia) production 0.3 3 0Flexible polyurethane (main use)Only in imported finished articles/products (except in Russia also use possible) as flame retardant in products made of flexible polyurethane foam such as in furniture, mattresses, parts of cars and packing material
industrial use (polyurethane foam production)
0.05 0.05
TextilesOnly in imported finished articles/products (except in Russia also use possible) as flame retardant in different textiles used in special work wear (designed e.g. to protect humans) and special carpets
industrial use & service-life n.a. n.a.
Electrical equipmentOnly in imported finished articles/products (except in Russia also use possible) as flame retardant in plastic used in electrical equipment such as computers (e.g. in electronic circuits)
industrial use & service-life n.a. n.a.
Polymeric resinsManufacture of resins (possible only in Russia) used as raw material for above mentioned plastic polymers
industrial use & service-life n.a. n.a.
1 fraction of total amount of substance in life cycle released to waste water before any treatment (e.g. STP)2 fraction of amount of substance in life cycle released to air as direct emission of facility or plant, emission from STP to air due to volatilization is estimated to be zero3 the most likely way in which pentaBDE may reach waste water at production stage is the washing the equipment
Table 3.3Total amount of use for penta- and octaBDE in HELCOM countries during 2000-2005 (NI = no information received)
Table 3.2 ses of decaBDE in HELCOM countries during years 2000-2005
Table 3.4Total amount of use for decaBDE in HELCOM countries during 2000-2005 (NI = no information received)
Table 3.5Uses of pentaBDE and related emission factors reported in EU risk assessment (EU-RAR 2000). Note that all uses have been banned (as a substance or constituent of preparations at concentration >0.1% by mass in EU since August 2004 except by way of derogation, until 31 March 2006 ban shall not apply to aircraft emergency evacuation systems according to Directives 2003/11/EC and 2004/98/EC.n.a. = not available

and articles. These figures are rough estimates especially regarding the amount imported in finished articles (EU-RAR 2000). The use of pentaBDE was banned in the EU in August 2004.
OctaBDE production ceased in the EU–15 in 1998; the mount decreased from 2,550 tonnes in 1994 to 450 tonnes in 1999 (EU-RAR 2003). These figures exclude the amount imported in finished articles. The use of octaBDE was banned in the EU in August 2004.
DecaBDE production ceased in the EU–15 in 1999. According to the updated EU risk assess-ment (EU-RAR 2004), the current total EU–15 usage is some 8,300 tons/year, with 70% being used in plastic/polymer applications and 30% in textile applications. Regarding the domes-tic use, decaBDE is most likely to be present as a backcoating on fixed upholstery (i.e. it is nailed/stapled onto the furniture and is not intended to be removed and washed, although it may also be present on some types of remov-able seat cushions. Additionally, the European Brominated Flame Retardant Industry Panel (EBFRIP) estimates that the amount of decaBDE imported into the EU in finished articles was around 1,300 tonnes in 2002. This estimate comprises 500 tonnes/year of decaBDE present in non-television consumer electronics produced in Asia, 400 tonnes/year of decaBDE present in TVs produced in Asia, and 400 tonnes/year of decaBDE in flame retarded polystyrene produced outside the EU. It was also noted that products containing
decaBDE could also be exported out of the EU (EU-RAR 2004).
EBFRIP also indicates that there is expected to be a slow but steady increase in the con-sumption of decaBDE in the EU in the future. However, a more rapid increase in consump-tion could be expected if fire safety standards for domestic upholstered furniture within the rest of the EU are brought into line with those currently required in the United Kingdom (EU-RAR 2004).
Europe accounted for about 57% of HBCDD usage, 14% of decaBDE, 16% of octaBDE and 2% of pentaBDE (Table 3.1).
Penta-, octa- and decaBDE are flame retard-ants of the additive type, i.e. they are physically combined with the material being treated rather than chemically combined (reactive type) flame retardant. Typically, flame retardants are added at concentrations of 5–30% w/w (i.e. 1 kg poly-mer contains 5–300 g flame retardant) (EU-RAR 2000 & EU-RAR 2003).
The main use of pentaBDE in EU–15 (about 95%) is the manufacture and different applica-tions of flexible polyurethane foams for which EU Risk Assessment Report has been focused (EU-RAR 2000). The uses of pentaBDE in the EU and related emission factors are presented in Table 3.5. OctaBDE is always used in con-junction with antimony trioxide. In Europe, it is primarily (about 95% of the total use) used in
28
Mode of application Life cycle Emission factor (%)Waste water 1 Air 2
Production of octaBDE (possible in Russia) production 0.3 3 0Plastics in electrical applications (main use)Only in imported finished articles/products (except in Russia also use possible) as flame retardant in different plastic products made of mainly acrylonitrile-butadiene-styrene (ABS) used e.g. in covers and casings of electrical applications such as TVs and videos but also made of high impact polystyrene (HIPS), polybutylene terphthalate (PBT) and polyamide polymers
formulation 4 and industrial use 5 0.05 0.05
TextilesOnly in imported finished articles/products (except in Russia also use possible) as flame retardant in different textiles made of polymers PBT, polyamide (e.g. nylon), PE-LD and polycarbonate polymers
industrial use & service-life n.a. n.a.
Electrical equipmentOnly in imported finished articles/products (except in Russia also use possible) as flame retardant in insulated wires and cables used in different electronic equipment such as computers
industrial use & service-life n.a. n.a.
Polymeric resinsManufacture of resins (possible only in Russia) used as raw material for above mentioned plastic polymers
industrial use & service-life n.a. n.a.
Table 3.6Uses of octaBDE and related emission factors reported in EU risk assessment (EU-RAR 2003). Note that all uses have been banned (as a substance or constituent of preparations at concentration >0.1% by mass in EU since August 2004 according to Directive 2003/11/EC. n.a. = not available
1 fraction of total amount of substance in life cycle released to waste water before any treatment (e.g. STP)2 fraction of amount of substance in life cycle released to air as direct emission of facility or plant, emission from STP to air due to volatilization is estimated to be zero3 the most likely way in which octaBDE may reach waste water at production stage is the washing the equipment and the floors of bagging areas4 compounding i.e. blending of polymers with various additives such as brominated flame retardants5 conversion i.e. production of the finished plastic articles

29
Ba
ltic
Se
a E
nvi
ron
me
nt P
roc
ee
din
gs
No
. 119
acrylonitrile-butadiene-styrene (ABS) polymers at 12–18% weight in the finished products. Around 95% of the total octaBDE supplied in the EU is used in ABS (EU-RAR 2003). The uses of octaBDE in EU and related emission factors are presented in Table 3.6. DecaBDE is mostly used in applications in the plastics and textile industries (EU-RAR 2002a). The uses of decaBDE in EU and related emission factors are presented in Table 3.7.
3.2 Discharges, emissions and losses to environment
According to this study the following HELCOM Contracting Parties have not measured penta-, octa- or decaBDE in discharges, emissions or losses to environment:
- Estonia- Germany- Latvia- Poland- Russia (no reply to Questionnaire)
Vaara (2003) has estimated that the Finnish emissions are for decaBDE 110 kg/year to air, 85 kg/year to surface waters and 340 kg/year to soil in 2002. Respectively, the Finnish pent-aBDE emissions were calculated to be 2 kg/year to air, 400 kg/year to surface waters and 1 200 kg/year to soil in 1997. The emissions of pent-aBDE are relatively high compared to a much higher use of, e.g. HBCDD due to the higher emission factors for pentaBDE. Unfortunately, the emission factors were not presented due to reasons of confidentiality.
Some emission factors for penta-, octa- and decaBDE are presented in Tables 3.5–3.7. Emission factors are not available for all sec-tors, but they seem to be rather low. It should be noted that high sectoral emission factors do not necessarily reflect that the sectoral dis-charges (or emissions) are automatically high, because the amount of sectoral discharges (or emissions) is very much dependent on how much substance is used by the sector.
It has been estimated that pentaBDE is vol-atilizing from furniture foam products (made of polyurethane containing pentaBDE) at the rate of 0.39% in 10 years (estimated service-life of foam). These losses will be initially to the atmosphere. The potential for leaching of pentaBDE from the furniture foam during use appears to be small due to very low water solubility of substance and the type of main use (EU-RAR 2000). Respectively, octaBDE is volatilizing from plastic products (made of ABS polymer containing octaBDE) at the rate of 0.54% in 10 years (estimated service-life of plastic products). These losses will be initially to the atmosphere. The potential for leaching of octaBDE from the products during use appears to be small, because substance has very low water solubility and the main use is electrical applications (EU-RAR 2003). Furthermore, decaBDE is volatilizing from polymer / plastic products at the rate of 0.38% in 10 years (esti-mated service-life of product) and from textiles during washing into the wastewater at the rate of 3% per year (EU-RAR 2002a).
Brominated flame retardants reach the marine environment from these sources generally via rivers and the atmosphere. Due to a lack of data,
Mode of application Life cycle Emission factor (%)Waste water 1 Air 2
Production of decaBDE production 0.3 3 0Polymer / plastic applicationsBoth use and occurrence in imported products as flame retardant in different plastic products such as plastic shell structures of TVs and monitors made of HIPS (High Impact Polystyrene) or other polymers such as polypropylene, acetate copolymers such as ethylene-vinyl acetate and other ethylene copolymers, thermoplastic elastomers and polyester resins applied in electronic equipment. Electronic equipments mentioned above are e.g. computers, connectors, electrical boxes and wire and cable. Other minor uses are styrenic rubbers, polycarbonates, polyamides, terphthalates and in hotmelt adhesives
formulation 4
industrial use 5 0.05 0.05
Textiles (not in clothes)Both use and occurrence in imported textile products such as in curtains, upholstery fabrics and carpets containing polypropylene
formulation 6
industrial use 70.1exist (n.a.)
0n.a.
1 fraction of total amount of substance in life cycle released to waste water before any treatment (e.g. STP)2 fraction of amount of substance in life cycle released to air as direct emission of facility or plant, emission from STP to air due to volatilization is estimated to be zero3 the most likely way in which decaBDE may reach water at the production stage is the washing the equipment or the floors of bagging areas4 compounding i.e. blending of polymers with various additives such as brominated flame retardants5 conversion i.e. production of the finished plastic articles6 compounding i.e. blending of brominated flame retardants with other components7 manufacture of finished textile articles
Table 3.7Uses of decaBDE and related emission factors reported in EU risk assessment (EU-RAR 2002a & 2004). n.a. = not available

30
Area Treated waste water (ng/l) Sludge (µg/kg dry weight)
Denmark, 1 STP 1
0.02 BDE280.42 BDE470.25 BDE990.06 BDE100<0.05 BDE1530.02 BDE154<1.0 BDE183<1.4 BDE209
1.9 BDE2897 BDE4786 BDE9919 BDE1007.8 BDE1536.1 BDE1542.0 BDE183248 BDE209
Finland, 4 STPs 2
max for each STP 0.53-0.71 BDE28max for each STP 31-43 BDE47max for each STP 38-51 BDE99max for each STP 7.3-9.6 BDE100max for each STP 3.1-5.2 BDE153max for each STP 0.53-0.71 BDE154max for each STP 0.78-1.1 BDE183max for each STP 420-681 BDE209
Lithuania, 25 STPs 3
BDE28 not detected (<5)BDE47 not detected (<5)BDE99 not detected (<5)BDE100 not detected (<5)BDE153 not detected (<5)BDE154 not detected (<5)BDE183 not detected (<20)BDE209 not detected (<100)
BDE28 not detected (<5)18 BDE47 in one STP, not detected (<5) in other STPs5.1-30 BDE99 in 3 STPs, not detected (<5) in other STPsBDE100 not detected (<5)BDE153 not detected (<5)BDE154 not detected (<5)BDE183 not detected (<20)293 & 3410 BDE209 in 2 STPs, not detected (<100) in other STPs
Sweden, 2 STPs 4a -19-36 BDE4723-46 BDE994.8-9.8 BDE100
Sweden, 1 STP 4b7.0 BDE4730 BDE997.0 BDE100
-
Sweden, 50 STPs 4c -
7.0-100 / mean 49 BDE478.1-150 / mean 60 BDE991.5-22 / mean 11 BDE1000.8-18 / mean 6.1 BDE1530.60-10 / mean 4.1 BDE1545.6-1000 / mean 120 BDE209
PNEC 0.2 and 0.5 * not available
it has not been possible to estimate which is the dominant pathway (OSPAR 2001a). However, atmospheric deposition seems to be regionally the most significant PBDE source for the Baltic Sea according to the POPCYCLING-Baltic model and the measured environmental levels. Discharges to the surface waters are likely to have significant impact locally, but PBDEs are unlikely to be transported over great distances by seawater in the Baltic, presumably due to their strong tendency to adsorb onto particles and their subsequent deposition to sediments (Palm et al. 2004). Wastewater treatment plants (WWTPs)
Relatively few studies have been conducted
on the contamination of wastewater sludge in Europe, despite the fact that wastewater sludge is considered to be one of the main sinks for polybrominated diphenyl ethers. The applica-tion of sewage sludge to agricultural land in many countries also increases the possibility of the subsequent remobilization of these com-pounds (Law et al. 2006).
Dudutyte et al. (2007) found elevated lev-els of BDE47, BDE99 and BDE209 in sludges of three of 25 surveyed WWTPs in Lithuania. From the four HELCOM countries where infor-mation was available, the highest BDE209 level was found at a Lithuanian WWTP. BDEs were not detected in treated wastewater, but the detection limits for analysis were so high that no conclusions can be made on the possi-ble adverse effects on the aquatic environment (Table 3.8).
The wide Swedish screening study on bromi-nated flame retardants (e.g. PBDE & HBCDD) in sewage sludge at differing sizes of WWTPs
Table 3.8Brominated diphenylether concentrations in waste water and sludge of STPs. Predicted No-Effect Concentration (PNEC) for BDE99 and BDE100 in surface waters has been presented for comparison purposes.
Table 3.9Fate of penta-, octa- and decaBDE in sewage treatment plant (EPI model, EU-RAR 2002a)
Substance Bind to sludge
Degrade in treatment
Volatilize to air
Reach the surface water
pentaBDE 93% 1% 0% 6%octaBDE 93% 1% 0% 6%decaBDE 93% 1% 0% 6%
1 Christensen et al. 2003: sampled in 2003, single samples2 Unpublished screening data: sampled in 2003-2004, 2-4 sludge sample / STP3 Dudutyte et al. 2007: sampled in 2006, single samples4a Sternbeck et al. 2003: sampled in 2002, time-integrated samples from digested sludge5b Junestedt et al. 2003: sampled in 2001, single sample4c Law et al. 2006: sampled in 2000* 2008/105/EC: EU Environmental Quality Standard for chronic effects (AA-EQS, annual average value) of BDE99 and BDE100 for inland (0.5 ng/l) and other surface waters such as the Baltic Sea (0.2 ng/l), MAC-EQS for short-term eco-toxic effects not applicable

31
Ba
ltic
Se
a E
nvi
ron
me
nt P
roc
ee
din
gs
No
. 119
Area / type of waste water Leachate / storm water (ng/l)Finland / untreated leachate of landfill 1 decaBDE not detected (<20)
Finland / untreated waste water of 1 waste sorting site 1 decaBDE not detected (<20)
Sweden / untreated leachate of 2 landfills 2a
1-30 BDE47<1-40 BDE99<1-10 BDE100
Sweden / treated leachate of 2 landfills 2a
<1 BDE47<1 BDE99<1 BDE100
Sweden / storm water from 3 industrial sites (waste sorting sites) 2b
<1-70 BDE47<1-400 BDE99<1-200 BDE100
PNEC 0.2 and 0.5 *
Table 3.10Brominated diphenylether concentrations in leachate water of landfills and in storm water. Predicted No-Effect Concentration (PNEC) in surface waters has been presented for comparison purposes.
1 EU-RAR 2002a2a Junestedt, et al. 2003: sampled in 2000-2003, both time-integrated and single samples2b Junestedt, et al. 2003: sampled in 2000-2003, mainly single samples * 2008/105/EC: EU Environmental Quality Standard for chronic effects (AA-EQS, annual average value) of BDE99 and BDE100 for inland (0.5 ng/l) and other surface waters such as the Baltic Sea (0.2 ng/l), MAC-EQS for short-term eco-toxic effects not applicable
located in different parts of the country, showed that BDE209 was the compound found at the highest concentrations in most sludges. Concentrations of the lower brominated PBDEs were fairly similar in all sewage sludge samples, indicating diffuse leaching from prod-ucts into wastewater. Two to eight times higher concentrations of BDE209 and HBCDD were found in sludge samples from a few WWTPs with known, or suspected, point sources con-nected to them. These were textile industries, producers of extruded polystyrene and a com-pany that upholsters cars. Otherwise, BDE209 and HBCDD concentrations did not vary much between WWTPs. There were no correlations between PBDE and HBCDD level in sludge and the WWTP capacity. No north-south gradient in concentrations was seen, indicating that loads into WWTPs are not related to atmospheric deposition and subsequent washout into storm water streams. These results indicate that the major source of brominated flame retardants in sludge is from the diffuse leaching of these from products into the wastewater from users, households and industries generally. No corre-lations were seen between the concentrations of the different flame retardant compounds (PBDE, HBCDD & tetrabromobisphenol-A), indicating that they are being used independ-ently of one other (Law et al. 2006).
Ranking the BDE congeners according to concentration in WWTP sludges in Baltic Sea area gives the following order: BDE209 >> BDE99 > BDE47 > BDE100 > BDE153. In general, the concentrations of BDE congeners in treated wastewater exceed the estimated PNEC levels in an aquatic environment (Table 3.8).
The EPI model has been used to estimate the fate of a chemical in the WWTP. The results showed that the overall removal of penta-, octa- and decaBDE in WWTP is around 94%. The major part (93%) is expected to be adsorbed to the sludge. Only approximately 6% is expected to be released to the recipient water and evap-oration is not expected to occur at all (Table 3.9).
Waste treatment & storm water
The waste stage is one source of BDE losses to the environment. Once an item has reached the end of its service life, it can be recycled, incinerated or dumped to landfills. In most countries, large quantities of BDE occur in the plastic parts of electronic equipment.
Currently, around 88% of the plastics contain-ing brominated flame retardants end up in landfill; 10% are incinerated and less than 3% are recycled. When goods are burnt in incin-eration plants, there is a risk of the formation of halogenated dioxins, e.g. in case of penta- and octaBDE (OSPAR 2001a, EU-RAR 2003). There are insufficient monitoring or other test-ing data on the leachability of pentaBDE from foams with which to assess the magnitude of resulting emissions and discharges to the envi-ronment; however, based on physico-chemical properties of the substance (low water solu-bility, high octanol-water partition coefficient), it is considered very unlikely that significant amounts of pentaBDE will leach from landfills as the substance would be expected to adsorb strongly into soils. The movement of foam par-ticles containing pentaBDE within the landfill could provide a transport mechanism into lea-chate water hence to surface waters (EU-RAR 2000, OSPAR 2001a).
There are insufficient monitoring or other testing data also on the leachability of octaBDE from plastics in order to assess the magnitude of resulting emissions and discharges to the environment; however, based on the physico-chemical properties of the substance (e.g. low vapour pressure), it is considered very unlikely that significant amounts of octaBDE will leach from landfills as the substance would be expected to adsorb strongly into soils (EU-RAR 2003). The potential for leaching of decaBDE from the polymer / plastic products during use and from landfills also appears to be very small (EU-RAR 2002a). However, a Norwegian study showed the presence of BDEs in landfill leach-ate (Palm et al. 2004).

32
Table 3.11Brominated diphenylether levels in biota of Baltic Sea. Predicted No-Effect Concentra-tion (PNEC) has been presented for comparison purposes.
Area / species Tissue type Biota(µg/kg wet or dry or lipid weight)
BivalvesKattegat, Great and Little Belt & Sound 2004, blue mussel Mytilus edulis 1a soft tissue max 3.5 / median 0.5 dw sumBDE (BDE47+99+100+153)
Kattegat, Great and Little Belt & Sound 2000, blue mussel Mytilus edulis 1b soft tissue 0.6–5.8 / median 1.0 dw sumBDE (BDE47+99+100+153)
Kattegat, Great and Little Belt & Sound 2000, blue mussel Mytilus edulis 1a soft tissue
0.045–0.49 ww BDE470.019–0.25 ww BDE990.004–0.045 ww BDE1000.005–0.027 ww BDE153
Fish
Gulf of Finland and Gulf of Bothnia, pike Esox lucius 2 muscle
<0.0049 ww BDE280.025–0.082 ww BDE470.002–0.021 ww BDE990.0056–0.016 ww BDE100max 0.0056 ww BDE1530.0016–0.0064 ww BDE154<0.0047 ww BDE183
Bothnian Sea, perch Perca fluviatilis 3 muscle
9.0–18 / median 11 / mean 12 lw BDE471.1–2.2 / median 1.3 / mean 1.4 lw BDE992.2–4.8 / median 2.9 / mean 3.0 lw BDE1000.6–0.9 / median 0.7 / mean 0.8 lw BDE1531.2–1.9 / median 1.5 / mean 1.6 lw BDE154
Western Gotland Basin, perch Perca fluviatilis 3 muscle
3.9–6.2 / median 4.8 / mean 4.9 lw BDE47median <0.8 lw BDE99median <0.5 lw BDE100median <0.2 lw BDE153median <0.2 lw BDE154
Bothnian Bay, herring Clupea harengus 3 muscle
4.6–22 / median 13 / mean 13 lw BDE471.9–5.1 / median 3.6 / mean 3.7 lw BDE991.3–4.3 / median 3.0 / mean 3.0 lw BDE1000.26–0.76 / median 0.5 / mean 0.5 lw BDE1530.42–1.2 / median 0.8 / mean 0.8 lw BDE154
Southern Baltic Proper , herring Clupea harengus 3 muscle
12–27 / median 17 / mean 18 lw BDE474.4–7.8 / median 6.1 / mean 6.0 lw BDE992.3–5.2 / median 3.4 / mean 3.4 lw BDE1000.7–1.1 / median 0.9 / mean 0.9 lw BDE1530.8–1.6 / median 1.1 / mean 1.1 lw BDE154
Kattegat, herring Clupea harengus 3 muscle
4.5–7.2 / median 6.0 / mean 5.8 lw BDE471.2–1.8 / median 1.5 / mean 1.5 lw BDE990.8–1.6 / median 1.0 / mean 1.2 lw BDE1000.2–0.3 / median 0.2 / mean 0.2 lw BDE1530.2–0.4 / median 0.3 / mean 0.3 lw BDE154
Archipelago Sea, pike Esox lucius 4 muscle
0.42–5.0 / median 2.0 lw BDE2813–548 / median 71 lw BDE470.89–104 / median 5.6 lw BDE994.2–146 / median 22 lw BDE1000.60–36 / median 1.6 lw BDE1532.0–52 / median 8.0 lw BDE1540.001–6.0 / median 0.038 lw BDE1830.52–4.6 / median 1.7 lw BDE209
Archipelago Sea, perch Perca fluviatilis 4 muscle
0.023–0.99 / median 0.20 lw BDE280.95–58 / median 10 lw BDE470.058–31 / median 1.4 lw BDE990.051–23 / median 2.6 lw BDE1000.023–8.7 / median 0.41 lw BDE1530.094–11 / median 1.2 lw BDE1540.0028–0.069 / median 0.017 lw BDE1830.30–31 / median 1.3 lw BDE209
Archipelago Sea, roach Rutilus rutilus 4 muscle
0.041–2.5 / median 0.26 lw BDE282.6–52 / median 9.3 lw BDE470.01–0.5 / median 0.09 lw BDE990.45–8.3 / median 1.6 lw BDE1000.021–0.26 / median 0.086 lw BDE1530.18–3.4 / median 0.82 lw BDE1540.0063–0.035 / median 0.012 lw BDE1830.57–116 / median 48 lw BDE209
Table continued on opposite page...

33
Ba
ltic
Se
a E
nvi
ron
me
nt P
roc
ee
din
gs
No
. 119
Area / species Tissue type Biota(µg/kg wet or dry or lipid weight)
Bothnian Bay, Bothnian Sea & Gotland, salmon Salmo salar 5
Muscle (including skin)
1.2–3.5 / mean 2.3 ww BDE470.18–0.69 / mean 0.43 ww BDE990.19–0.68 / mean 0.43 ww BDE100BDE183 not detected
Kattegat & Southern Baltic Proper, herring Clupea harengus 5
Muscle (including skin)
0.52–2.0 / mean 1.1 ww BDE470.13–0.50 / mean 0.25 ww BDE990.08–0.35 / mean 0.19 ww BDE100BDE183 not detected
Baltic Sea, sprat Sprattus sprattus 5Muscle (including skin)
0.98–1.6 / mean 1.2 ww BDE470.14–0.33 / mean 0.20 ww BDE990.14–0.24 / mean 0.18 ww BDE100BDE183 not detected
Gotland, turbot Psetta maxima 5Muscle (including skin)
0.18–0.35 / mean 0.25 ww BDE47<0.025–0.04 ww BDE99<0.05–0.07 ww BDE100BDE183 not detected
Gulf of Riga, perch Perca fluviatilis 6 muscle 6.4–10 lw BDE47MammalsGerman part of Baltic and North Sea, harbour porpoise Phocoena phocoena 7 blubber median 138 lw ∑BDE (BDE47+99+100+153+154)
PNEC – 1 000 ww in prey tissue * / 274 ww in seafood*
1a Ærtebjerg et al. 2005 & Andersen et al. 2006: 7 Danish coastal sites in 2004, sampling once a year, 3 sub-samples and each sub-sample consist of 25-50 mussel individuals1b Christensen & Platz 2001: 15 Danish coastal sites in 2000, pooled 20 mussel individuals2 Unpublished monitoring data: 4 Finnish coastal sites in 20013 Sternbeck et al. 2004: 5 Swedish coastal background sites from Kattegat to Bothnian Bay in 2001, 8 individuals / site which were not pooled 4 Burreau et al. 2004: 25 pikes, 33 perches and 8 roaches in bay in eastern Åland, unpooled samples 5 Ankarberg et al. 2006: 134 salmons, 233 herrings, 685 sprats and 49 turbots in Swedish area of Baltic Sea in 2000-20026 Olsson et al. 1999: totally 62 perches from 3 Latvian coastal sites in 1994-1995, 2-3 samplings and 6-10 individuals / site unpooled samples 7 Beineke et al. 2004: Baltic and North Sea (altogether 30 individuals), Icelandic (12) and Norwegian waters (19)* WFD - EAF 2004c: estimated PNEC of BDE99 and BDE100 for protection of predators such as mammals and predatory birds via secondary poisoning expressed as concentration in prey tissue and PNEC for human health via food uptake expressed as concentration in seafood
The treatment of waste is currently more likely an emission source to the atmosphere for penta- and octaBDE, whereas the observed levels of decaBDE (e.g. BDE209) in the atmos-phere indicate the diffuse losses from prod-ucts still in use. The emission of BDEs to the atmosphere from waste treatment is an impor-tant source when assessing the transport of these substances in the environment (Law et al. 2006).
The results shown in Table 3.10 indicate that landfills can also significantly contribute to the BDE pollution of an aquatic environment. Additionally, very high pentaBDE concentra-tions were found from industrial storm water and exceeding the estimated PNEC levels in the recipient aquatic environment. An exten-sive EU-study indicated that polybrominated diphenyl ethers (e.g. pentaBDE) can also be found in storm water (WFD 2004b).
3.3 Concentrations in biota, sediment and water of Baltic Sea
According to this study, the following HELCOM Contracting Parties have not measured penta-, octa- or decaBDE in biota, sediment or water of the Baltic Sea:
- Estonia- Latvia- Poland- Russia (no reply to Questionnaire)
The relevant ecotoxicological and environ-mental information (e.g. degradation in water or sediment) on BDEs can be found, e.g. from studies relating to the Water Framework direc-tive work (WFD - EAF 2004c). Additionally, pentaBDE may disrupt the oestrogenic sys-tem, i.e. it is a possible endocrine-disrupting substance (OSPAR 2001a).
In Denmark, the highest contamination with BDEs was found in sediment and mussels close to populated urban areas. The con-gener BDE47 is both bioconcentrated and biomagnified to a higher degree than any other congeners, whereas the amount of BDE99 decreases at higher trophic levels. In general, marine sediments contained lower levels of BDEs than freshwater sediments, except for the high levels found in Copenhagen harbour. Ranking the BDE congeners according to the concentration in Danish sediments gives the following order: BDE209 >> BDE99 > BDE47 > BDE100 > BDE153 (Table 3.12, Christensen & Platz 2001). The sum of BDE congeners’

34
(BDE47+99+100+153) concentration in the blue mussel was lower in 2004 than in 2000 (Table 3.11, Ærtebjerg et al. 2005).
The Finnish study found low levels of BDE28, BDE47, BDE99, BDE100, BDE153, BDE154 and BDE183 in pike from the Gulf of Finland and the Gulf of Bothnia when compared to the estimated PNEC (Table 3.11).
The results for an ongoing German study on polybrominated diphenylethers in the Baltic Sea are not yet available.
Harbour porpoises from the German area of the North Sea and the Baltic Sea exhibit a higher incidence of bacterial infections com-pared to whales from less polluted Arctic waters. Beineke et al. (2005) found that thymic atrophy and splenic depletion were significantly corre-lated to increased PCB and BDE levels (Table 3.11, only the contaminant levels are presented and not the effects). This study supported the hypothesis of contaminant-induced immuno-suppression, a possible contributing factor to disease susceptibility in harbour porpoises. The potential adverse of contaminants such as PCBs and heavy metals on the immune sys-tem and the health status of marine mammals is still a controversial topic being discussed (Beineke et al. 2005).
A Latvian study (Olsson et al. 1999) found similar BDE47 levels in perch from three coastal sites with very different catchment area characteristics (one more industrialized area and two mainly forested areas, Table 3.11). It was concluded that the main BDE47 source in the region is long-range transport and atmos-pheric deposition.
A Lithuanian study (Dudutyte et al. 2007) showed that brominated diphenylethers were not detected in four Lithuanian coastal sedi-ments (Table 3.12).
A Swedish study found significant increas-ing trend from the end of 1960s until the end of 1990s followed by a decreasing trend dur-ing the last 10 years for BDE47, BDE99 and BDE100 level in the eggs of the guillemots nesting on Stora Karlsö Island west of Gotland. The spatial analysis of BDE levels in herring muscle during 1999–2004 do not show any firm geographical differences, except that the levels of BDE47, 99, 100, 153 and 154 in the Southern Baltic Proper seem to be higher than
in the other six sites from Skagerrak to Bothnian Bay. In general, BDEs seem to be more evenly distributed in the Swedish marine environment compared to, e.g. PCBs (Bignert et al. 2006). Ankarberg et al. (2006) found that by removing the skin and subcutaneous lipids, the levels of BDEs and HBCDD in herring muscle decrease significantly (38–57%). Additionally, the BDE47 congener is the major congener contributing to the sum of BDEs in Sweden.
PentaBDE (BDE99 and BDE100) and tetraBDE (BDE47) concentrations in guille-mot eggs increased during 1970–89 but have decreased since 1990 (Bignert et al. 2005). PentaBDE concentrations in biota (e.g. in her-ring and seal blubber) are higher in the Baltic Sea compared to the west coast of Sweden in the 1980s. Furthermore, concentrations increased with the age of the fish and were higher in seals than in fish in the Baltic Sea, indicating bioaccumulation and biomagnifica-tion (EU-RAR 2000).
It has been argued that highly brominated BDE congeners, especially BDE209, due to their large molecular size would show negligible bioavailability. Therefore, despite high levels in abiotic matrices in the environment, highly bro-minated BDEs do not pose an environmental threat. However, Burreau et al. (2004) showed highly conflicting results as the BDE209 lev-els in roach are high (median 48 µg/kg lipids) and it was also found in perch (median 1.3 µg/kg lipids) and pike (median 1.7 µg/kg lip-ids). However, BDE209 was detected in only three out of eight roach individuals; 12 out of 33 perch and 4 out of 25 pike. The variation in BDE209 levels in fish was thus significant. Law et al. (2006) estimated that high BDE209 lev-els in roach may be related to their association with sediments, which are known, in general, to have higher BDE209 concentrations than the lower brominated congeners and the fact that BDE209 has been shown to be bioavailable from the fish gut. Additionally, it was concluded that also octa-, nona- and decaBDE are bio-available and were found in fish muscle but not biomagnified. Tri- to heptaBDE was observed to biomagnify with maximum biomagnification for pentaBDE. BDE47 was the major conge-ner found in pike (median 71 µg/kg lipids) and perch (median 10 µg/kg lipids) (Burreau et al. 2004).
The concern is the formation of tetra- and pentaBDE via debromination (degradation) from highly brominated BDEs (e.g. octa- and

35
Ba
ltic
Se
a E
nvi
ron
me
nt P
roc
ee
din
gs
No
. 119
decaBDE) in the environment. Tetra- and pentaBDE are more toxic and bioaccumula-tive and have been found more extensively in the environment than the parent compounds. Laboratory experiments have showed that decaBDE (BDE209) in fish is degrading via debromination to form penta to octaBDEs (e.g. BDE153 and BDE154) and that BDE209 has been observed to debrominate photolytically. In addition, significant debromination of BDE99 (10% debrominated) and BDE183 (17% debro-minated) in the intestinal tract of several fish species has been reported. The environmen-tal significance of the both biotic and abiotic debromination of highly brominated BDEs still remains under debate and further investigation (Law et al. 2006).
Law et al. (2006) found that some data on BDE47 levels (the dominant congener) in fish
are similar in the Baltic Sea and the North Sea. The BDE47 and BDE100 levels in the livers of dab and flounder are even higher in the Central North Sea (although near oil and gas produc-tion area) and off the British coast than in the Baltic Sea (Kiel Bight & north of Ruegen Island) in 2002. This is in contrast to the situation for PCBs, for which levels are about five times higher in the Baltic Sea and indicates that the sources and inputs of these substance groups are quite different. On the other hand, the other study showed higher levels in fish (herring, sprat and salmon) in the Baltic Sea compared to the North Sea. It was also concluded that in general, BDE209 levels are lower in water birds compared to terrestrial birds as water may act as a barrier in the transfer of BDE209 from suspended particulate matter and sediment to aquatic organisms (Law et al. 2006).
Substance Sources of discharges to aquatic environment Sources of emissions to atmosphere
pentaBDE
* treatment of waste; storm water from waste sorting sites* landfills* Sewage treatment plants (STPs)* industrial waste water (e.g. possible pentaBDE production in Russia, textile industry)
* treatment of waste * losses from products during service-life
octaBDE
* treatment of waste; storm water from waste sorting sites (measured data not yet available)* industrial waste water (e.g. possible octaBDE production in Russia, textile industry)
* treatment of waste * losses from products during service-life
decaBDE* industrial waste water (e.g. polymer and textile industry) * treatment of waste; storm water from waste sorting sites (measured data not yet available)
* losses from products during service-life* treatment of waste
Area Sediment (µg/kg dry weight)
Kattegat, Great and Little Belt & Sound, 10 Danish coastal and open sea sediments 1
<0.03-1.1 BDE470.03-2.1 BDE99<0.02-0.38 BDE100<0.02-0.08 BDE153<0.9-22 BDE209
Gulf of Finland & Bothnian Bay, 2 Finnish coastal sediments 2
BDE28 not detected0.09-0.11 BDE470.05-0.15 BDE990.02-0.03 BDE1000.02 BDE153, not detected at one siteBDE154 not detected0.01 BDE183, not detected at one site0.48-7.0 BDE209
Southern Baltic Proper, 4 Lithuanian coastal sediments 3
BDE28 not detected (<5)BDE47 not detected (<5)BDE99 not detected (<5)BDE100 not detected (<5)BDE153 not detected (<5)BDE154 not detected (<5)BDE183 not detected (<20)BDE209 not detected (<100)
Sweden, 16 open sea sediments 4a<0.02-0.44 BDE47<0.02-0.62 BDE99<0.02-0.08 BDE100
Northern Baltic Proper, 14 Swedish coastal sediments 4b0.015-0.39 BDE47 / mean 0.10<0.04-0.48 BDE99 / mean 0.14<0.03-0.18 BDE100, not detected at 8 sites
PNEC 62 *
1 Christensen & Platz 2001: sediments (Baltic Sea area) sampled in 2000, 0-2 cm surface layer of sediment2 Unpublished screening data: sampled once or twice in 2003, single surface sediment samples 3 Dudutyte et al. 2007: 4 Lithuanian sediments from Klaipeda port area in 2006, 0-2 cm surface layer of sediment 4a Cato 2005: sampled from Skagerrak to Bothnian Bay in 2003, 0-1 cm surface layer of sediment4b Sternbeck et al. 2003: sampled in 2002, 0-2 cm surface layer of sediment* WFD-EAF 2004c: estimated PNEC of BDE99 and BDE100 for benthic community based on eco-toxicological data for sediment dwelling organisms, expressed as concentration in sediment
Table 3.12Brominated diphenylether concentrations in sediment of the Baltic Sea. Predicted No-Effect Concentration (PNEC) has been presented for comparison purposes.
Table 3.13Relevant sources of penta-, octa- and decaBDE discharges and emissions. The industrial sector or professional use has been identified as a relevant source if the emission factor is relatively high or if it has been identified as risk use in national or EU risk assessments. The significance of other activities (e.g. STPs and landfills) has been evaluated on the basis of measured effluent concentrations. It should be noted that all below mentioned sectors may not be relevant in all HELCOM countries and these should be identified at national level (e.g. within national programs under the HELCOM BSAP).

In general, the results show that BDE47 is the dominant congener in biota of the Baltic Sea. Ranking the BDE congeners according to the concentration in biota of the Baltic Sea gives the following order: BDE47 > BDE99 & BDE100. The levels in biota are, in general, low and always lower than the PNEC level (Table 3.11). The high BDE209 levels found in roach muscle (Burreau et al. 2004) are alarming and more information on the BDE209 levels in biota of the Baltic Sea is needed.
In general, BDE209 is the dominant BDE con-gener in the sediment of the Baltic Sea. Ranking the BDE congeners according to concentration in the Baltic Sea sediments gives the following order: BDE209 >> BDE99 > BDE47. In gen-eral, the levels in the sediment are low and do not exceed the PNEC level (Table 3.12).
There is a little measured data on BDE concentrations in Baltic Sea water. The only measurement made in one Lithuanian har-bour (Dudutyte et al. 2007) indicated that the concentrations were under the detection limit (BDE28, 47, 99, 100, 153 and 154 <5 ng/l, BDE183 <20 ng/l, BDE209 <100 ng/l). The detection limit is too high to draw any conclu-sions (e.g. comparison to PNEC). On the other hand, sediment and biota are better environ-mental compartments to be measured than water phase as indicated in Table 3.9.
3.4 Substance-specifi c conclusions
It is evident that most HELCOM countries do not have proper information on the use of penta-, octa- and decaBDE; however, since 2004, only decaBDE is allowed to be used in EU-25. The relevant sources for discharges to an aquatic environment and emissions to the atmosphere are shown in Table 3.13. The dif-fuse leaching of penta-, octa- and decaBDE from products during their service-life into wastewater from households and industries, and the respective losses to atmosphere are considered to be important. Additionally, waste treatment (leachate water from landfi lls and storm water from waste sorting sites) for pent-aBDE, but possibly also to octa- and decaBDE, is considered to be a relevant source. In gen-eral, the main pathways to the marine environ-ment of penta-, octa- and decaBDE are via riv-ers and the atmosphere.
PentaBDE is a possible endocrine-disrupting substance.
The occurrence of BDEs is widespread in the Baltic marine environment. It is probable that current legislative measures (penta- and octaBDE banned in the EU since 2004) have already decreased penta- and octaBDE lev-els in the Baltic Sea. While PentaBDE and octaBDE do not seem to pose a risk to the marine environment in the Western Baltic Sea, the situation may be different in the eastern part of Baltic Sea. Information on the occurrence of penta-, octa- and decaBDE in the eastern Baltic Sea (e.g. in biota) and in discharges (e.g. WWTPs) and emissions, especially from eastern HELCOM contracting Parties, is thus greatly needed. More information on the occur-rence of penta-, octa- and decaBDE discharges from landfi lls and waste sorting sites is needed from the whole Baltic Sea area.
DecaBDE is the dominant congener in WWTP sludge and in Baltic Sea sediments; it can also be found in Baltic Sea fi sh, although tetraBDE is the most dominant congener in biota. Levels of decaBDE may be increasing because its use has not been restricted. The environmen-tal signifi cance of both biotic and abiotic debro-mination of highly brominated BDEs, such as decaBDE, still remains under debate and fur-ther investigation.
36

37
Ba
ltic
Se
a E
nvi
ron
me
nt P
roc
ee
din
gs
No
. 119
4 Hexabromocyclododecane (HBCDD)
HBCDD has been proposed to be added to the list of substances subject to authorization under the REACH regulation (EC1907/2006).
HBCDD is an aliphatic brominated fl ame retardant. Technical HBCDD contains about 70–90% γ-HBCDD and 10–30% of α- and β-HBCDD. HBCDD has been on the world mar-ket since the 1960s (EU-RAR 2006).
The surveyed HBCDD compounds are pre-sented in Table 4.1.
4.1 Production and use
The usage information of HBCDD in HEL-COM Contracting Parties and the EU are pre-sented in Tables 4.2–4.5.
HBCDD has been used, at least, in Denmark,
Finland, Russia and Sweden during 2000–2004 (Table 4.3). HBCDD has been used (and per-haps is still being used) as a fl ame retardant in building insulation materials (in Expandable Polystyrene - EPS and Extruded Polystyrene - XPS), and electrical and electronic equipment (Table 4.2). Estimates on the amounts of HB-CDD used during 2000–2005 are only available from Denmark, Finland, Russia and Sweden.
HBCDD is presently only produced at one site in the EU-15, located in the Netherlands. The total production of HBCDD in 2005 is assumed to be 6,000 tonnes. HBCDD is imported to and probably exported from the
Country Use (ton) Remarks2000 2001 2002 2003 2004 2005
Denmark 52 52 52 52 52 NIUse ~52 ton in 1997; assumed to be same during 2000-2004 (AMAP 2007)
Estonia NI NI NI NI NI NI
Finland 400 400 400 400 400 NI
exportin manufactured products (about 90%) not taken into account, (AMAP 2007)
Germany NI NI NI NI NI NI Use ~2 500 ton in 1999, no production in Germany
Latvia NI NI NI NI NI Not produced or imported
National Chemicals Data Base
Lithuania NI NI NI NI NI NIPoland NI NI NI NI NI NIRussia 120 120 120 120 120 NI AMAP 2007
Sweden 3.2 58 29 1.9 2.5 0CAS 3194-55-6 & 25637-99-4, National Product Register of Chemicals
Type of business and/or mode of application HELCOM country of confi rmed use Remarks
Electrical and electronic equipment Denmark Year 1997, 6% of total national use (AMAP 2007)Furniture Denmark Year 1997, 8% of total national use (AMAP 2007)Transportation Denmark Year 1997, 38% of total national use (AMAP 2007)Insulation Denmark Years 1997, 48% of total national use (AMAP 2007)Building insulation concerning XPS and EPS / manufacturing of XPS plates Finland Years 2000-2004, >10% of total national use (AMAP 2007)
Polystyrene Germany Year 1999, 90% of total national useTextile Germany Year 1999, 8% of total national useHIPS plastic Germany Year 1999, 2% of total national use
Building insulation Sweden Years 2003-2004, >10% of total national use (AMAP 2007 & National Product Register of Chemicals)
Table 4.2Uses of HBCDD in HELCOM countries during years 2000-2005
Table 4.3Total amount of used HBCDD in HELCOM countries during 2000-2005 (NI = no information received)
Table 4.1Indicative HBCDD compounds
1 indicated in HELCOM questionnaire sent to Contracting Parties in 20062 identifi ed afterwards
Compound CAS number- Hexabromocyclododecane
- 1,2,5,6,9,10-Hexabromocyclododecane - α-Hexabromocyclododecane- β-Hexabromocyclododecane- γ-Hexabromocyclododecane
25637-99-4 1
& 25495-98-1 2 3194-55-6 2
134237-50-6 2
134237-51-7 2
134237-52-8 2

EU, both as a chemical (as pure substance or in formulations) and in articles. In a draft EU risk assessment report (EU-RAR 2006), the total consumption of HBCDD was estimated to be about 9,600 tonnes. The import and export of articles containing HBCDD is not included in this estimation. While the import and export of HBCDD in goods is likely to occur, it is not pos-sible to quantify.
The consumption of HBCDD in eastern Europe, for instance Poland, is a consider-able amount. The estimated market for flame retarded EPS for construction is around 30,000 tonnes/year in western Europe and around 17,000 tonnes/year in eastern Europe. Additionally, there is no market for non-flame retarded EPS in eastern Europe. The estimated market for flame retarded XPS is 5,000,000 m3/year in western Europe and around 500,000 m3/year in eastern Europe. However, no infor-mation is available on from where and in what form HBCDD is delivered to eastern Europe (EU-RAR 2006).
The import of HBCDD to Sweden, as a raw material and in chemical products, increased from around 50 tonnes in 1993 to 120 tonnes in 1997. Imports have now almost ceased to be less than 10 tonnes in 2000. Approximately 60 tonnes of HBCDD were imported in 2001 and 30 tonnes in 2002. During the 2003 and 2004, imports had decreased further to approximately two tonnes. Nevertheless, the usage trend is not necessarily the same in the other countries in the Baltic Sea catchment area. Information on the worldwide production and consump-tion of HBCDD is not yet available (EU-RAR 2006).
HBCDD made up for about 14% of the consumption of brominated flame retard-ants in western Europe during the late 1990s (Sternbeck et al. 2001). The main downstream uses of HBCDD are in the polymer and textile industries. HBCDD can be used on its own or in combination with other flame retardants, e.g. antimony trioxide and decabromodiphenyl ether (EU-RAR 2006).
HBCDD is used in four principal product types (EU-RAR 2006):
• Expandable Polystyrene (EPS)• Extruded Polystyrene (XPS)• High Impact Polystyrene (HIPS)• Polymer dispersion for textiles
The main use (90%) of HBCDD is in poly-styrene (PS). The predominant use of PS is in rigid insulation panels/boards for the con-struction industry (EPS and XPS). About 2% of the total use of HBCDD is in high impact polystyrene (HIPS). Examples of end-products containing HBCDD are given in Table 4.4 (EU-RAR 2006).
While some other minor uses have been reported, it is not clear whether they are rel-evant in the EU and have not been included in the EU risk assessment (EU-RAR 2006). These minor uses are in;
• polypropylene (PP), adhesives, latex binders and unsaturated polyester
• SAN resins (styrene-acrylonitrile copolymer)
• PVC (wires, cables and textile coatings)
38
Material Use/Function End-products(Examples)
EPS Insulation
• Construction, insulation boards, (packaging material)• Packaging material (minor use and not in food packaging)• Insulation boards (against cold or warm) of transport vehicles e.g. lorries and caravans• Insulation boards in building constructions e.g. houses’ walls, cellars and indoor ceilings and ”inverted roofs” (outdoor)• Insulation boards against frost heaves of road and railway embankments
XPS Insulation
• Construction, insulation boards,• Insulation boards (against cold or warm) of transport vehicles e.g. lorries and caravans• Insulation boards in building constructions e.g. houses’ walls, cellars and indoor ceilings and ”inverted roofs” (outdoor)• Insulation boards against frost heaves of road and railway embankments
HIPS Electrical and electronic parts• Electric housings for video cassette recorder• Electrical and electronic equipment e.g. distribution boxes for electrical lines• Refrigerator lining
Polymer dispersion on cotton or cotton/synthetic blends
Textile coating agent
• Upholstery fabric• Bed mattress ticking• Flat and pile upholstered furniture (residential and commercial furniture), • Upholstery seatings in transportation, • Draperies, and wall coverings,• Interior textiles e.g. roller blinds• Automobile interior textiles
Table 4.4Uses and end-products of HBCDD (EU-RAR 2006)
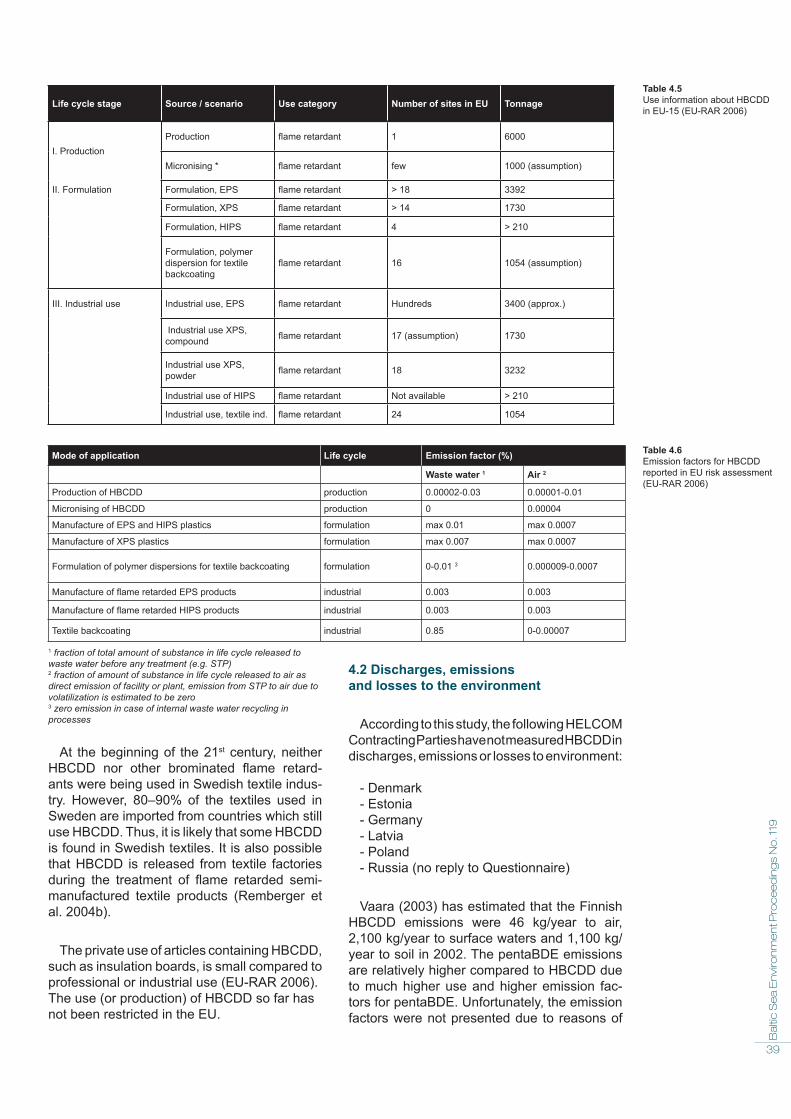
39
Ba
ltic
Se
a E
nvi
ron
me
nt P
roc
ee
din
gs
No
. 119
At the beginning of the 21st century, neither HBCDD nor other brominated flame retard-ants were being used in Swedish textile indus-try. However, 80–90% of the textiles used in Sweden are imported from countries which still use HBCDD. Thus, it is likely that some HBCDD is found in Swedish textiles. It is also possible that HBCDD is released from textile factories during the treatment of flame retarded semi-manufactured textile products (Remberger et al. 2004b).
The private use of articles containing HBCDD, such as insulation boards, is small compared to professional or industrial use (EU-RAR 2006). The use (or production) of HBCDD so far has not been restricted in the EU.
4.2 Discharges, emissions and losses to the environment
According to this study, the following HELCOM Contracting Parties have not measured HBCDD in discharges, emissions or losses to environment:
- Denmark- Estonia- Germany- Latvia- Poland- Russia (no reply to Questionnaire)
Vaara (2003) has estimated that the Finnish HBCDD emissions were 46 kg/year to air, 2,100 kg/year to surface waters and 1,100 kg/year to soil in 2002. The pentaBDE emissions are relatively higher compared to HBCDD due to much higher use and higher emission fac-tors for pentaBDE. Unfortunately, the emission factors were not presented due to reasons of
Life cycle stage Source / scenario Use category Number of sites in EU Tonnage
I. ProductionProduction flame retardant 1 6000
Micronising * flame retardant few 1000 (assumption)
II. Formulation Formulation, EPS flame retardant > 18 3392
Formulation, XPS flame retardant > 14 1730
Formulation, HIPS flame retardant 4 > 210
Formulation, polymer dispersion for textile backcoating
flame retardant 16 1054 (assumption)
III. Industrial use Industrial use, EPS flame retardant Hundreds 3400 (approx.)
Industrial use XPS, compound flame retardant 17 (assumption) 1730
Industrial use XPS, powder flame retardant 18 3232
Industrial use of HIPS flame retardant Not available > 210
Industrial use, textile ind. flame retardant 24 1054
Mode of application Life cycle Emission factor (%)
Waste water 1 Air 2
Production of HBCDD production 0.00002-0.03 0.00001-0.01
Micronising of HBCDD production 0 0.00004
Manufacture of EPS and HIPS plastics formulation max 0.01 max 0.0007
Manufacture of XPS plastics formulation max 0.007 max 0.0007
Formulation of polymer dispersions for textile backcoating formulation 0-0.01 3 0.000009-0.0007
Manufacture of flame retarded EPS products industrial 0.003 0.003
Manufacture of flame retarded HIPS products industrial 0.003 0.003
Textile backcoating industrial 0.85 0-0.00007
1 fraction of total amount of substance in life cycle released to waste water before any treatment (e.g. STP)2 fraction of amount of substance in life cycle released to air as direct emission of facility or plant, emission from STP to air due to volatilization is estimated to be zero3 zero emission in case of internal waste water recycling in processes
Table 4.5Use information about HBCDD in EU-15 (EU-RAR 2006)
Table 4.6Emission factors for HBCDD reported in EU risk assessment (EU-RAR 2006)

40
confidentiality. Nevertheless, some emission factors are reported for several industrial sec-tors and they seem to be very low (Table 4.6). Nevertheless, it should be noted that high sec-toral emission factors do not necessarily mean that the sectoral discharges (or emissions) would be automatically high. The amount of sectoral discharges (or emissions) is more dependent on how much substance is being used by the certain sector.
The presence of HBCDD in remote back-ground regions, e.g. in northern Finland, shows that it has potential for long-range atmospheric transport (Sternbeck et al. 2001, Remberger et al. 2004b).In general, brominated flame retardants, such as HBCDD, reach the marine environment via rivers and the atmosphere. However, due to the lack of data, it has not been possible to estimate which is the dominant pathway (OSPAR 2001a). Losses from end-products during service-life
HBCDD has been used for several decades. Assuming a constant annual consumption, of more than 9 000 tonnes of HBCDD incorpo-rated in articles made of polystyrene and in coating layers for textile backcoating for the EU market. The amount of HBCDD in the society is accumulating, since the service life of these end-products are estimated to be generally longer than 1 year varying between 1 year and more than 100 years (Table 4.7 and 4.8).
HBCDD is added to the matrix, not chemi-cally bound, and does not seem to be degraded in the matrix. The release of HBCDD from the end-products depends on both the chemical and physical processes. Physical processes determining the loss of HBCDD from the poly-mer matrix are: (1) migration of HBCDD in the polymer; (2) the loss of HBCDD from the sur-face; and (3) the emission of particles lost dur-ing the processing of the material or because of weathering and abrasion. The migration rate depends on the diffusion rate and the solubility of substance in the polymer. The loss from the surface depends on the volatility and/or physi-cal conditions, e.g. temperature and the solubil-ity of HBCDD in a contacting media. The con-centration in the polymer varies between 0.7% (EPS) and 25% (textile backcoating). Polymers are various kinds of polystyrene (EPS, XPS, HIPS), latex, acrylics etc. The surrounding media are air (most uses), water (outdoor uses, e.g. inverted roofs flushed by precipitation) and soil (buried construction material).
The emission factor for the service life for textiles (containing HBCDD) with lifetime of 10–30 years has been estimated to be 0.05%. The release of HBCDD mainly occurs during the washing of the textile. Emissions to water from polystyrene boards are not assumed to take place at all during the service life. The loss factor to air from polystyrene boards has
1 - 10 years 10 - 30 years 30 - 100 years > 100 years
motor vehicles, electrical and electronic equipment
interior textile, furniture, bed mattress ticking
buildingsroads and railways, constructions
Applications Service Life (years)Building and construction >10
Electronic 0 to 5Electrical 10 to 20Furniture 5 to 10
Housewares 0 to 5Packaging 2
Table 4.7Service life of some HBCDD-containing end-products
Table 4.8Life expectancy of plastics
Area Treated waste water (ng/l)
Sludge (µg/kg dry weight)
Lithuania, 25 STPs 1 not detected (<200) not detected (<200)
Sweden, 1 STP 2a <1 -
Sweden, 50 STPs 2b - 3.8-650 / mean 45
Sweden, 3 STPs 2c -primary 6.9 / anaerobically treated <1
Sweden, laundry 2c 31 (untreated) 30-33
PNEC 30 * not available
Bind to sludge
Degrade in treatment
Volatilize to air
Reach the surface water
79% 0% 0% 21%
Area / type of waste water Leachate / storm water (ng/l)
Sweden / untreated leachate of 2 landfills 1a <1 & 60
Sweden / treated leachate of 2 landfills 1a <1
Sweden / untreated leachate of landfill 1c 3-9
Sweden / storm water from 3 industrial sites (waste sorting sites) 1b <1
PNEC 30 *
Table 4.9Concentrations of HBCDD in municipal and industrial waste water and sludge. Predicted No-Effect Concentration (PNEC) in surface waters has been presented for comparison purposes.
Table 4.10Fate of HBCDD in aerobic waste water treatment plant based on active sludge (Simple Treat model, EU-RAR 2006).
Table 4.11HBCDD concentrations in leachate water of landfills and in storm water. Predicted No-Effect Concentration (PNEC) in surface waters has been presented for comparison purposes.
1 Dudutyte et al. 2007: sampled in 2006, single samples2a Junestedt, et al. 2003: sampled in 2001, single sample2b Law et al. 2006: sampled in 20002c Sternbeck et al. 2001: sampled in 2000-2001, results for “laundry sludge” from STP receiving both laundry and municipal waste water* EU-RAR 2006: estimated draft PNEC for marine waters
1a Junestedt, et al. 2003: landfill for construction waste sampled in 2000-2003, both time-integrated and single samples1b Junestedt et al. 2003: sampled in 2000-2003, mainly single samples1c Sternbeck et al. 2001: sampled in 2000, 2 single samplings* EU-RAR 2006: estimated draft PNEC for marine waters

41
Ba
ltic
Se
a E
nvi
ron
me
nt P
roc
ee
din
gs
No
. 119
been estimated to be about 0.002% (EU-RAR 2006).
There are also indications that diffuse emis-sions of HBCDD occur in the urban environ-ment. The diffuse leaching of HBCDD from products can be expected to be higher in urban areas, where the population density, and thus consumption, is higher. HBCDD may be emit-ted from point sources such as the production of flame retarded plastics from washing flame retarded textiles. However, during the waste disposal stage, emissions to air and water appear to be limited. It is evident that HBCDD emissions are ongoing, despite the fact that its use has decreased significantly in Sweden. One possible explanation is that certain imported textiles (raw material or semi-products) that are further processed in Sweden contain HBCDD (Remberger et al. 2004b).
Wastewater treatment plants (WWTPs)
The estimation on the importance of WWTP / municipal wastewater as HBCDD source is not possible to make due to the lack of meas-ured data or due to analytical reasons (i.e. too high detection limit, see Table 4.9). Anaerobic treatment of sludge seems to remove HBCDD from sludge by biodegradative debromination (Remberger et al. 2004b).
The Simple Treat model which is a part of the EUSES risk assessment programme is used to estimate the fate of a chemical in the WWTP. The results showed that the overall removal of HBCDD in WWTP is approximately 80%. The major part is expected to be adsorbed to the sludge. Around 21% is expected to be released to the recipient water. HBCDD is not expected to evaporate (Table 4.10). The modelling results have been supported by the monitor-ing studies (i.e. measured values) on HBCDD levels in influents and effluents in WWTPs (EU-RAR 2006). Waste treatment and storm water
The amount of waste containing HBCDD wThe amount of waste containing HBCDD will increase in the future. Until today, most end products with a service life shorter than 20 years have been discarded. It is not known to what extent products containing HBCDD are dumped to landfills, incinerated, left in the environment or recycled. Municipal waste is likely to be dumped to landfills or incinerated. Construction material used on or under the soil can be left or is used as filling material, e.g. for road construction. In the case of incineration, the generation of polybrominated dibenzofurans and dibenzo-p-dioxins is possible (EU-RAR 2006).
Area / species Tissue type Biota(µg/kg wet or dry or lipid weight)
Years 2000-2002
Bothnian Bay, Bothnian Sea & Gotland, salmon Salmo salar 1c muscle (including skin) 1.1-4.4 / mean 2.4 ww
Kattegat & Southern Baltic Proper, herring Clupea harengus 1c muscle (including skin) 0.95-2.6 / mean 1.6 ww
Baltic Sea, sprat Sprattus sprattus 1c muscle (including skin) 1.3-1.7 / mean 1.4 ww
Gotland, turbot Psetta maxima 1c muscle (including skin) 0.05-0.08 / mean 0.06 ww
Year 2001
Bothnian Sea, perch Perca fluviatilis 1a muscle 4.5-9.8 / median 6.9 / mean 6.7 lw
Western Gotland Basin, perch Perca fluviatilis 1a muscle <2.4 / median <1.3 lw
Bothnian Bay, herring Clupea harengus 1a muscle 5.8-17 / median 13 / mean 12 lw
Southern Baltic Proper , herring Clupea harengus 1a muscle 21-38 / median 29 / mean 30 lw
Kattegat, herring Clupea harengus 1a muscle 5.9-9.1 / median 7.1 / mean 7.4 lw
Years 1999-2000Bothnian Bay, herring Clupea harengus 1b muscle mean 180 lw
Bothnian Sea, herring Clupea harengus 1b muscle mean 58 lw
Northern Baltic Proper, herring Clupea harengus 1b muscle mean 34 lwSouthern Baltic Proper, herring Clupea harengus 1b muscle mean 58 lw
Kattegat, herring Clupea harengus 1b muscle 26 lw
PNEC not specified 1 530 ww in in prey tissue * 1a Sternbeck et al. 2004: 5 Swedish coastal background sites from Kattegat to Bothnian Bay in 2001, 8 individuals / site which were not pooled 1b Sternbeck et al. 2001: 5 Swedish coastal background sites from Kattegat to Bothnian Bay in 1999-2000, 10 individuals / site which were pooled1c Ankarberg et al. 2006: 134 salmons, 233 herrings, 685 sprats and 49 turbots in Swedish area of Baltic Sea in 2000-2002* EU-RAR 2006: estimated draft PNEC for protection of predators such as mammals and predatory birds via secondary poisoning expressed as concentration in prey tissue
Table 4.12HBCDD levels in biota of the Baltic Sea. Predicted No-Effect Concentration (PNEC) has been presented for comparison purposes.

Waste containing HBCDD is generated at each life cycle step. The consumption of plas-tics as insulation in the construction sector, which is the main use of HBCDD, is estimated to increase. However, the quantities of plastic waste will increase quicker than consumption, since only the products, which have a serv-ice lifetime shorter than 20 years, have so far
reached the waste stage. Therefore, in the future, we can expect an increasing amount of HBCDD to enter the waste-handling sec-tor which, in turn, means that the amounts of HBCDD incinerated, accumulating on landfills, possibly leaking, and left in the environment will increase (EU-RAR 2006). Nevertheless, the incineration should not be a major emission source as HBCDD starts to degrade at 240°C (Remberger et al. 2004b).
Landfills containing deposited construc-tion and demolition waste are possible emis-sion sources of HBCDD to surface waters, for example (Remberger et al. 2004b). The levels in leachate water on the landfills in Sweden (no information available from other HELCOM Contracting Parties) are low except in one land-fill (Table 4.11) and in Europe they have gener-ally ranged between 0.00035 – 0.15 μg/l (EU-RAR 2006). Thus, landfills may significantly contribute to HBCDD pollution of the aquatic environment.
There is only one survey on HBCDD in indus-trial storm water (waste sorting sites) in the Baltic Sea catchment area, which showed very low HBCDD concentrations. Nevertheless, as the amount of waste containing HBCDD will increase in the future, the importance of waste sorting sites as emission sources may increase.
4.3 Concentrations in biota, sediment and water of Baltic Sea
According to this study, the following HELCOM Contracting Parties have not measured HBCDD in biota, sediment or the water of the Baltic Sea:
- Denmark- Estonia- Finland(some results exist but not yet published)- Germany- Latvia- Poland- Russia (no reply to Questionnaire)
The draft EU risk assessment report on HBCDD (EU-RAR 2006) has concluded that HBCDD meets the P-criterion due to slow transformation (sequential debromination) leading to the formation of cyclododecatriene, which itself is a PBT candidate. The ubiquitous presence of HBCDD in the environment further supports the conclusion of HBCDD being a P-substance. HBCDD meets the vB criterion and the T-criterion according to available data. The relevant ecotoxicological and environmental information (e.g. degradation in water or sedi-ment) on HBCDD can be found from the draft EU risk assessment report on HBCDD (EU-RAR 2006).
HBCDD was not detected in either Baltic Sea water or sediments in Lithuania; however, the detection limits were too high to draw any con-clusions (Tables 4.13 and 4.14, Dudutyte et al. 2007).
The spatial analysis of HBCDD levels in her-ring muscle during 1999–2004 does not show any firm geographical differences, except that the level in the Southern Baltic Proper seems to be higher than another six sites from Skagerrak to Bothnian Bay. In general, HBCDD seems to be more evenly distributed in the Swedish marine environment compared to, e.g. PCBs (Bignert et al. 2006). The direct comparison is complicated by the fact that the individuals analysed were of different ages and
42
SubstanceSources of discharges to aquatic environment
Sources of emissions to atmosphere
HBCDD
* industrial waste water (e.g. textile industry 1 and laundries)* landfills 2
* production of HBCDD
Area Sediment (µg/kg dry weight)
Southern Baltic Proper, 4 Lithuanian coastal sediments 1
not detected (<200)
Sweden, 14 coastal sediments 2 <1.7 (not detected at all sites)
PNEC 170 *
Area Sea water (ng/l)
Lithuania, Southern Baltic Proper, harbour area 1
Not detected (<200)
PNEC 30 *
Table 4.13HBCDD concentrations in Baltic Sea water. Predicted No-Effect Concentration (PNEC) has been presented for comparison purposes.
Table 4.14HBCDD levels in Baltic Sea sediments. Predicted No-Effect Concentration (PNEC) has been presented for comparison purposes.
Table 4.15Relevant sources of HBCDD discharges and emissions. The industrial sector or professional use has been identified as a relevant source if the emission factor is relatively high or if it has been identified as risk use in national or EU risk assessments. The significance of other activities (e.g. STPs and landfills) has been evaluated on the basis of measured effluent concentrations. It should be noted that all below mentioned sectors may not be relevant in all HELCOM countries and these should be identified at national level (e.g. within national programs under the HELCOM BSAP).
1 Dudutyte et al. 2007: one harbour sampled in 2006* EU-RAR 2006: estimated draft PNEC for marine waters
1 Dudutyte et al. 2007: 4 Lithuanian sediments from Klaipeda port area in 2006, 0-2 cm surface layer of sediment2 Sternbeck et al. 2003: sampling in 2002, 0-2 cm surface layer of sediment* EU-RAR 2006: estimated draft PNEC for benthic community based on eco-toxicological data for sediment dwelling organisms, expressed as concentration in sediment
1 using the chemicals or imported semi-manufactured textile products containing HBCDD 2 waste containing HBCDD has been estimated to increase in the future

43
Ba
ltic
Se
a E
nvi
ron
me
nt P
roc
ee
din
gs
No
. 119
sex for 1999–2000 as presented in Table 4.12. Ankarberg et al. (2006) found that by removing the skin and subcutaneous lipids, the levels of BDEs and HBCDD in herring muscle decrease signifi cantly (38–57%).
HBCDD levels in eggs of guillemots nesting in Stora Karlsö Island (west from Gotland) have been continuously increasing by 3% annually since the beginning of the 1980s (Bignert et al. 2006).
Lundstedt-Enkel et al. (2006) did not fi nd any correlation between the HBCDD levels and dif-ferent biological variables (e.g. thickness and weight of shell, weight and width of egg) in guil-lemot eggs.
The Swedish results, presented in Table 4.12, show that HBCDD levels in Baltic Sea fi sh are generally low and always lower than the esti-mated PNEC level. Also, the levels in the sedi-ments of the Swedish coastal area are very low compared to the estimated PNEC level (Table 4.14).
The measured data on HBCDD concentra-tion in Baltic Sea water is very scarce and the detection limit has been too high to draw any conclusions (Table 4.13).
The Swedish survey concluded that the measurements of HBCDD, concerning both discharges/emissions and occurrence in the environment, will continue within the Swedish contaminant screening/monitoring programme (Swedish Environment protection Agency 2005).
A temporal analysis (EU-RAR 2006) showed that HBCDD levels in seals in the Baltic Sea have increased. The median levels in the 1980s ranged between 16 and 35 µg/kg lw with a median concentration of 28 µg/kg lw (n=7). In the 1990s, the levels ranged between 34 and 177 g/kg lw with a median of 73 µg/kg lw (n=12). From 2000, data from only one seal are available and has a HBCDD concentration of 64 µg/kg lw. However, another study found that the HBCDD level in the blubber of 30 grey seals during 2000–2002 ranged from 31–554 µg/kg lw with a mean of 101 µg/kg lw. The results indicate that the HBCDD levels in seals have not decreased.
The spatial analysis (EU-RAR 2006) showed that the levels of HBCDD are higher close to local sources, e.g. production and industrial use, and decrease with increasing distance from sources. Additionally, the HBCDD con-centrations in moss and livers of cod in general decreased from south to north in the northern hemisphere. The concentrations of HBCDD in the European arctic are higher as compared with the North American Arctic. The authors proposed that that some combination of atmos-pheric and oceanic transport from western Europe and eastern North America may be an important pathway for transporting HBCDD to the marine food webs in the Arctic (EU-RAR 2006).
4.4 Substance-specifi c conclusions
It is evident that most HELCOM countries do not have information on the use of HBCDD.
The relevant sources of HBCDD discharges and emissions are shown in Table 4.15. The reported emission factors for several industrial sectors are very low. In general, the main path-ways to the marine environment of HBCDD are via rivers and the atmosphere.
At present, information on the occurrence of HBCDD in the environment is very scarce (Remberger et al. 2004b). Information on HBCDD in this study mainly originates from Sweden.
The results of the draft EU risk assessment (EU-RAR 2006) indicate that there is a need to limit risks to the aquatic environment con-cerning the use of HBCDD. Especially, preda-tors such as mammals and predatory birds are facing the risks via secondary HBCDD poison-ing. PBT assessment, which is very relevant especially with regard to the marine environ-ment, showed that HBCDD is a persistent, very bioaccumulative and toxic substance (PBT substance)
The results presented in this assessment show that HBCDD can commonly be found in fi sh from the Swedish coastal area of the Baltic Sea. However, the situation may be different in other parts of the Baltic Sea. Thus, information on the occurrence of HBCDD in the Baltic Sea (e.g. in biota) and in discharges (e.g. WWTPs, landfi lls and waste sorting sites) and emissions in the HELCOM countries is greatly needed.

Compound CAS number
Perfl uorooctane sulfonate anion (PFOS) and related compounds (at least 96 compounds), which potentially degrade to PFOS but only parent sulphonic acid and some of its commercially important salts are listed below (see more e.g. OECD 2002, OECD 2005, OSPAR 2005):- Perfl uorooctane sulphonic acid- Potassium salt for perfl uorooctane sulphonic acid- Diethanolamine salt for perfl uorooctane sulphonic acid- Ammonium salt for perfl uorooctane sulphonic acid- Lithium salt for perfl uorooctane sulphonic acid
1763-23-12795-39-370225-14-829081-56-929457-72-5
Perfl uorooctanoic acid (PFOA) and PFOA-related substances such as its salts and derivatives but a few are listed below (see more e.g. OECD 2005, Poulsen et al. 2005):- Ammonium salt for PFOA- Sodium salt for PFOA- Potassium salt for PFOA- Silver salt for PFOA- Fluoride salt for PFOA- Methyl ester for PFOA- Ethyl ester for PFOA
335-67-1
3825-26-1335-95-52395-00-8335-93-3335-66-0376-27-23108-24-5
5 Perfl uorooctane sulfonate (PFOS) & perfl uorooctanoic acid (PFOA)
Perfl uorooctane sulfonate (PFOS) is a chem-ical for which risk management evaluations are currently prepared under the Stockholm Convention on POPs.
Perfl uorooctane sulfonate (PFOS), per-fl uorooctanoic acid (PFOA) and other related compounds belog to chemical family called fl uorinated surfactants (i.e. surface-active agent). A surfactant is a substance which, even at low concentrations, effectively lowers the sur-face tension of its medium by selective adsorp-tion on the interface. In fl uorinated surfactants, the hydrophobic part of the surfactant molecule contains fl uorine. At least one hydrogen atom in the hydrophobic part of the molecule has been replaced with fl uorine. Perfl uorinated sur-factants, such as PFOS and PFOA, are fully fl uorinated surfactants, where all hydrogens in the hydrophobic part of the molecule have been replaced by fl uorine. Perfl uorinated surfactants have the unique ability to dramatically lower aqueous surface tension, improve wetting and levelling, and remain chemically stable under harsh use conditions. Fluorinated surfactants are stable to heat (fi re resistant), acids, bases as well as reducing and oxidising agents. Thus, due to these unique properties, they are often irreplaceable in many applications (Poulsen et al. 2005).
PFOS related substances and PFOA are members of the larger family of perfl uoro-alkylated substances (PFAS). Perfl uorooctanyl sulfonate compounds are members of a large family of anthropogenic chemicals that are all derivatives of and can degrade to PFOS (also
called as PFOS-related compounds). The abbreviation PFOA is used as a group name for perfl uorooctanoic acid and its salts. Some 100–200 PFOS-related compounds have been identifi ed (KEMI 2006). PFOS and PFOA related-compounds indicated in the HELCOM questionnaire sent to the Contracting Parties in 2006 are presented in Table 5.1.
5.1 Production and use
The usage information of PFOS in the HELCOM Contracting Parties is presented in Tables 5.2 and 5.3 and in the EU in Table 5.4. The usage information of PFOA in the HELCOM Contracting Parties has been pre-sented in Tables 5.5 and 5.6.
PFOS has been used at least in Denmark, Finland, Germany and Sweden during 2002–2004 (Table 5.3). PFOS has been used for example in the impregnation of textiles and leather, the impregnation of paper and card-board, cleaning products, fi re-fi ghting foams and the electrical and electroplating industries (Table 5.2).
PFOA has been used at least in Denmark, Germany, Poland and Sweden during 2002–2004 (Table 5.6). PFOA has been used, for example, in the PTFE fl uoroplastics industry (Table 5.5).
Estimates on the amounts of used PFOS and PFOA during 2000–2005 are available only from Denmark, Finland, Germany, Poland and Sweden.
Table 5.1Indicative PFOS and PFOA related compounds
44

45
Ba
ltic
Se
a E
nvi
ron
me
nt P
roc
ee
din
gs
No
. 119
Country Use (ton) Remarks
2000 2001 2002 2003 2004 2005Denmark NI NI 5-50 5-50 NI NI Poulsen et al. 2005Estonia NI NI NI NI NI NI
Finland NI NI NI in products / mixtures imported ∼1.10.2 + storage of 1.2-1.9 tons as fire fighting foam
NI No production OECD 2005 Korkki 2006)
Germany NI NI NI
a.) as pure chemical imported 10-30 & manufactured 10-30b.) in products / mixtures manufactured ∼80
NI NI OECD 2005
Latvia NI NI NI NI NI Not produced or imported National Chemicals Data Base
Lithuania NI NI NI NI NI NIPoland NI NI NI 0 NI NI OECD 2005Russia NI NI NI NI NI NI No reply to questionnaire
Sweden NI NI 0.9 > 650 > 0.7 NI KEMI 2004, OECD 2005 & KEMI2006b
Type of business and/or mode of application HELCOM country of confirmed use Remarks
Impregnation of textiles and leather / water and oil repellent Denmark Main (the largerst) use, years 2002-2003 (Poulsen et al. 2005)
Impregnation of paper and cardboard / water and grease repellent Denmark Main use, years 2002-2003 (Poulsen et al. 2005)Cleaning products (general cleaning products and products used for cleaning of metal surfaces or carpets) / surfactant Denmark Main use, years 2002-2003 (Poulsen et al. 2005)
Waxes and floor polishes for e.g. shoes, furniture and floors / surfactant Denmark Main use, years 2002-2003 (Poulsen et al. 2005)Fire-fighting foams Denmark Years 2002-2003 (Poulsen et al. 2005)Photographic industry: manufacturing of photo film, paper and plates and developing photos / dirt rejecter, friction control agent, surfactant and antistatic agent Denmark Years 2002-2003 (Poulsen et al. 2005)
Semiconductor industry: use in photo-acid generators, antireflective coatings, etch mixtures and photo-resists / surfactant (PFOS able to resist strongly acidic conditions)
DenmarkPFOS are functioning as process chemicals and are not incorporated into final products, years 2002-2003 (Poulsen et al. 2005
Hydraulic fluids of both civil and military airplanes / flame retardant, corrosion inhibitor and surface-active agent Denmark Years 2002-2003 (Poulsen et al. 2005
Metal surface treatment: chromium bath used in e.g. chromium plating, important applications / final products are e.g. aircraft and vehicles Denmark Years 2002-2003 (Poulsen et al. 2005
Metal plating, electronic etching baths Finland Years 2003-2004 (OECD 2005, Korkki 2006)Fire fighting foams Finland Year 2004 (Korkki 2006)Hydraulic fluids of both civil and military airplanes / flame retardant Finland Year 2004 (Korkki 2006)Semiconductor industry: manufacture of semiconductors and printing circuit boards Finland Year 2004 (Korkki 2006)Floor waxes Finland Year 2004 (Korkki 2006)Chemical industry – intermediate in the production of PFOS related substances Germany Year 2003 (OECD 2005)Electroplating industry – mist suppressant Germany Main use, year 2003 (OECD 2005)Photographic processing solutions - surfactant Germany Year 2003 (OECD 2005)Fire fighting foams Germany Year 2003 (OECD 2005)Impregnation of textiles and leather / water and oil repellent Sweden Main (the largerst) use, year 2002 (KEMI 2004)Fire fighting foams Sweden Year 2002 (KEMI 2004)Metal surface treatment Sweden Year 2002 (KEMI 2004)Semiconductor industry Sweden Year 2002 (KEMI 2004)Hydraulic fluids of airplanes Sweden Year 2002 (KEMI 2004)Galvano-technical agents Sweden Years 2003-2004 (OECD 2005, KEMI 2006b)
Wax & other polishing preparations, cleaning agents Sweden Years 2002-2004 (KEMI 2004, OECD 2005, KEMI 2006b)
Anti-corrosion materials Sweden Year 2004 (KEMI 2006b)Flooring materials Sweden Year 2004 (KEMI 2006b)Paints and varnishes Sweden Year 2004 (KEMI 2006b)
Table 5.2Uses of PFOS in HELCOM countries during years 2000-2005
Table 5.3Total amount of use for PFOS in HELCOM countries during 2000-2005 (NI = no information received)

Global production of PFOS-related chemicals has been estimated to be about 4,500 tonnes in 2000 (RPA & BRE 2004); however, it is more likely that the production was more than 5,000 tonnes (Poulsen et al. 2005).
Perfluorinated alkylated substances (PFAS) are a large group of chemicals which have been used in industry and consumer products since the 1950s (e.g. Lehmler 2005). PFOS and many PFOS-related compounds are used in numerous industrial products and consumer products because of their special chemical properties, for instance the ability to repel both water and oils (Poulsen et al. 2005).
PFOA is primarily used in the form of its salts (mainly, the ammonium and sodium salts) as non-reactive processing aids in the production
of fluoropolymers and fluoroelastomers and in other surfactant use. Normally, PFOA is not usually part of the products; rather, it can be formed through the transformation or metabo-lism of other perfluorochemicals, e.g. telomer alcohols, which are the most commonly used perfluorinated substances (Poulsen et al. 2005, KEMI 2006a).
PFOA is used as a processing aid in the manufacture of fluoropolymers such as poly-tetrafluoroethylene (PTFE), but not in Denmark. In Denmark, only the ammonium salt of PFOA was found in very small quantities in a few products. The PFOA ammonium salt was used in fluxing agents (in plumbing) and in a primer and topcoat used for fluoroplastic coating. The use in fluxing agents is very limited and ceased after leaded plumbing was banned in 2006 as lead-free plumbing does not require the use of
46
Type of business and/or mode of application HELCOM country of confirmed use Remarks
PTFE fluoroplastics industry / fluoroplastic coatings – primer and topcoat Denmark Ammonium salt, years 2002-2003 (Poulsen et al. 2005)
Emulsifier for polymerization of fluoropolymers Germany Year 2003 (OECD 2005)
Reagent Poland Year 2003 (OECD 2005)
Plastics industry / fluoropolymers used in coatings Sweden Year 2004 (KEMI 2006a)
Cooling agent Sweden Year 2004 (KEMI 2006b)
Surfactant Sweden Year 2004 (KEMI 2006b)
Industrial / use sector Application Amount used (kg/year) and share of total use
A. Current uses
Metal Plating Chromium plating (decorative * and non-decorative)Anodising and acid pickling *
10 000 (82%)20-30 (0.2%)
Photographic industryPaper productsPrinting platesFilm products
<50 (0.4%)<100 (0.8%)>850 (6.9%)
Semiconductor industry
PhotoresistsEdge bead removers *Top antireflective coatingsBottom antireflective coatingsDevelopers (surfactant) *
46 (0.4%)86 (0.7%)136 (1.1%)8 (0.07%)195 (1.6%)
Aviation industry Hydraulic fluids 730 (6.0%)
Total 12 231
Fire fighting foams * - storage for emergency use (not annual usage) 122 000
B. Historical uses
Fabric treatment (impregnation)*
TextilesCarpetsUpholstery & furnishing fabricsApparel and leather
Paper and packaging protection* Impregnation of paper and cardboard (e.g grease proof paper, food cartons)
Coatings and coating additives* No information
Industrial and household cleaning and maintenance, personal care *
Alkaline cleaners, denture cleaners, shampoos, floor polishes and waxes
Pesticides and insecticides * Active ingredient
Table 5.4Uses of PFOS in EU-15 in the beginning of 21st century according to UK risk assessment on PFOS (RPA & BRE 2004).
The uses marked with * banned (as a substance or constituent of preparations at concentration ≥0.005% by mass and in semi-finished products or articles ≥0.1% by mass) in EU since 27th June 2008 according to Directive 2006/122/EC (existing storage of fire fighting foams containing PFOS allowed to use until 27th June 2011).
Table 5.5Uses of PFOA in HELCOM countries during years 2000-2005
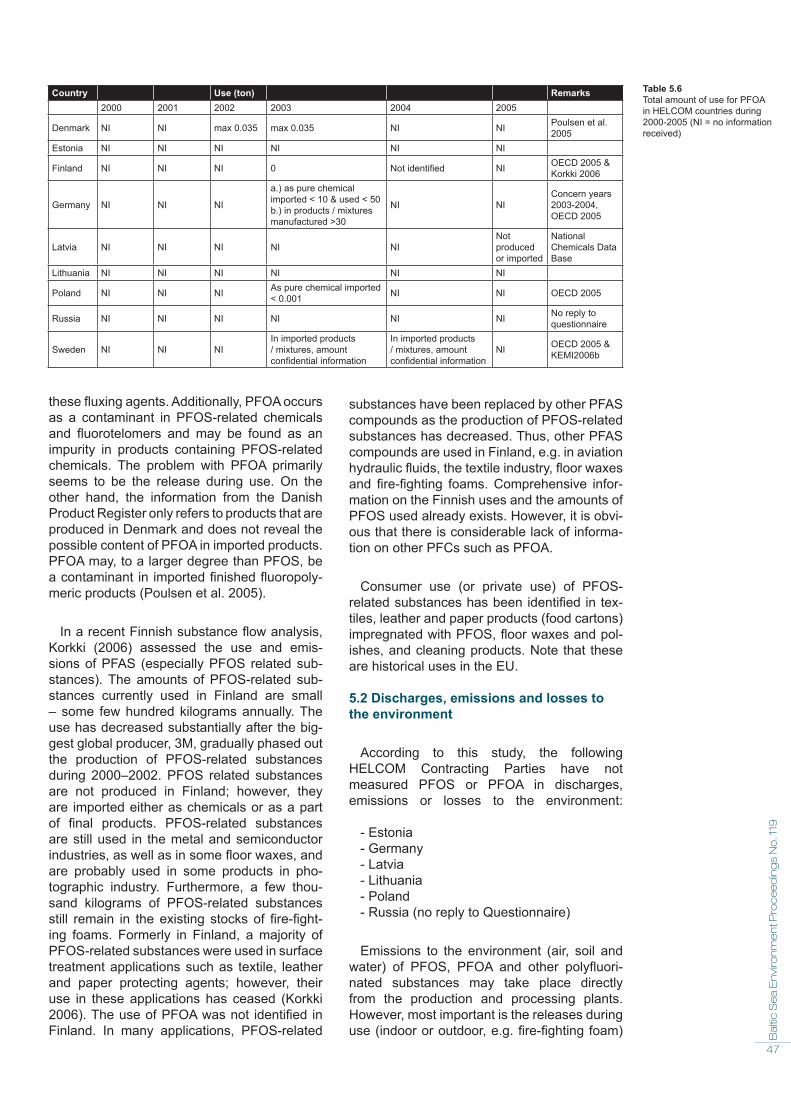
47
Ba
ltic
Se
a E
nvi
ron
me
nt P
roc
ee
din
gs
No
. 119
these fluxing agents. Additionally, PFOA occurs as a contaminant in PFOS-related chemicals and fluorotelomers and may be found as an impurity in products containing PFOS-related chemicals. The problem with PFOA primarily seems to be the release during use. On the other hand, the information from the Danish Product Register only refers to products that are produced in Denmark and does not reveal the possible content of PFOA in imported products. PFOA may, to a larger degree than PFOS, be a contaminant in imported finished fluoropoly-meric products (Poulsen et al. 2005).
In a recent Finnish substance flow analysis, Korkki (2006) assessed the use and emis-sions of PFAS (especially PFOS related sub-stances). The amounts of PFOS-related sub-stances currently used in Finland are small – some few hundred kilograms annually. The use has decreased substantially after the big-gest global producer, 3M, gradually phased out the production of PFOS-related substances during 2000–2002. PFOS related substances are not produced in Finland; however, they are imported either as chemicals or as a part of final products. PFOS-related substances are still used in the metal and semiconductor industries, as well as in some floor waxes, and are probably used in some products in pho-tographic industry. Furthermore, a few thou-sand kilograms of PFOS-related substances still remain in the existing stocks of fire-fight-ing foams. Formerly in Finland, a majority of PFOS-related substances were used in surface treatment applications such as textile, leather and paper protecting agents; however, their use in these applications has ceased (Korkki 2006). The use of PFOA was not identified in Finland. In many applications, PFOS-related
substances have been replaced by other PFAS compounds as the production of PFOS-related substances has decreased. Thus, other PFAS compounds are used in Finland, e.g. in aviation hydraulic fluids, the textile industry, floor waxes and fire-fighting foams. Comprehensive infor-mation on the Finnish uses and the amounts of PFOS used already exists. However, it is obvi-ous that there is considerable lack of informa-tion on other PFCs such as PFOA.
Consumer use (or private use) of PFOS-related substances has been identified in tex-tiles, leather and paper products (food cartons) impregnated with PFOS, floor waxes and pol-ishes, and cleaning products. Note that these are historical uses in the EU.
5.2 Discharges, emissions and losses to the environment
According to this study, the following HELCOM Contracting Parties have not measured PFOS or PFOA in discharges, emissions or losses to the environment:
- Estonia- Germany- Latvia- Lithuania- Poland- Russia (no reply to Questionnaire)
Emissions to the environment (air, soil and water) of PFOS, PFOA and other polyfluori-nated substances may take place directly from the production and processing plants. However, most important is the releases during use (indoor or outdoor, e.g. fire-fighting foam)
Country Use (ton) Remarks2000 2001 2002 2003 2004 2005
Denmark NI NI max 0.035 max 0.035 NI NI Poulsen et al. 2005
Estonia NI NI NI NI NI NI
Finland NI NI NI 0 Not identified NI OECD 2005 & Korkki 2006
Germany NI NI NI
a.) as pure chemical imported < 10 & used < 50b.) in products / mixtures manufactured >30
NI NIConcern years 2003-2004, OECD 2005
Latvia NI NI NI NI NINot produced or imported
National Chemicals Data Base
Lithuania NI NI NI NI NI NI
Poland NI NI NI As pure chemical imported < 0.001 NI NI OECD 2005
Russia NI NI NI NI NI NI No reply to questionnaire
Sweden NI NI NIIn imported products / mixtures, amount confidential information
In imported products / mixtures, amount confidential information
NI OECD 2005 & KEMI2006b
Table 5.6Total amount of use for PFOA in HELCOM countries during 2000-2005 (NI = no information received)

and the disposal of products containing these substances (Poulsen et al. 2005).
Some reported emission factors for PFOS have been reported (Table 5.7). The PFOS emission factors for metal plating, the semi-conductor and photographic industries (film developing), fire-fighting foams and paper and packaging protection are high, thus indicat-ing their high importance as pollution sources. Nevertheless, it should be noted that high sec-toral emission factors do not necessarily reflect that the sectoral discharges (or emissions) are automatically high, as the amount of sectoral discharges (or emissions) is very much depen-dent on how much substance is used by the certain sector.
According to a Finnish substance flow analy-sis (Korkki 2006), PFAS compounds can end up to the environment at all stages of the life cycle. Considering the uses, the substances are most likely to end up to the environment mainly through WWTPs (both industrial and household wastewater) and landfills. Textile and paper/cardboard (extensive historical use) and film etc. products containing PFOS may end up to landfills and later can be found in leachates. Additionally, the use of fire-fighting foams can cause direct emissions to soil and the aquatic environment.
While emissions from manufacturing plants and other point sources have gradually decreased in significance, they are still one
source of perfluorinated substances in the environment. The manufacture of fluoropoly-mers has, at least historically, been a large source of PFCA (e.g. PFOA) emissions (KEMI 2006). The more recent use of telomere-based compounds and especially fluorotelomer alco-hols (FTOH) in different products may be a significant source of PFCA found in the envi-ronment. Telomer alcohols have been shown to be degraded to PFCA (e.g. PFOA), both through aerobic biodegradation (Dinglasan et al. 2004) and atmospheric degradation (Ellis et al. 2004).
OSPAR (2005) has assessed that, given the wide range of applications and products in which PFOS compounds are used, other sources which could result in emissions to the environment include: leachates from landfills, atmospheric losses during combustion and from certain domestic and commercial uses, and wash-off from various applications such as in fire-fighting foams. Emissions to the environment may also result from the use of PFOS treated materials, e.g. carpets, textiles and leather. At installations such as military bases and commercial airports, the runoff of fire-fighting foams from fire training exercises are understood to be one of the main routes of entry of PFOS to the environment. PFOS reaches the marine environment generally from the above mentioned sources via rivers and via atmosphere.
48
Mode of application Life cycle Emission factor (%)Waste water 1 Air 2 Waste 3
Metal plating industrial use 100 0 0
Semiconductor industry - photoresists- antireflective coatings
industrial useindustrial use
53>53
1n.a.
46<46
Photographic industry - film papers formulation 4
industrial use 50.25-10 6
0.01n.a.
n.a.n.a.
Aviation industry - hydraulic fluids industrial use 0.6 0 98
Fire fighting foams formulation 7
professional use2100
0.10
n.a.0
Fabric treatment - textiles industrial use 1.4 0 n.a.Paper and packaging protection industrial use 5 0 95Coatings and coating additives industrial use 0.5 0 n.a.
Table 5.7PFOS emission factors according to UK risk assessment (RPA & BRE 2004). n.a. = not available
1 fraction of total amount of substance in life cycle released to waste water before any treatment (e.g. STP)2 fraction of amount of substance in life cycle released to air as direct emission of facility or plant, emission from STP to air due to volatilization is estimated to be zero3 fraction of amount of substance remaining in waste subjected to e.g. incineration / landfill4 film paper production5 film developing6 developing solutions are usually classified as hazardous waste and collected for special treatment. Thus, this fraction ends up as waste and not enter STP / surface waters7 foam production

49
Ba
ltic
Se
a E
nvi
ron
me
nt P
roc
ee
din
gs
No
. 119
Wastewater treatment plants (WWTPs)
The measured PFOS and PFOA levels in municipal wastewater and sludge are pre-sented in Table 5.8. The PFOS and PFOA con-centrations in wastewater are low; however, it should be noted that values shown in Table 5.8 represent only PFOS and PFOA substances themselves, not PFOS- and PFOA-related sub-stances. Thus, concentrations can be signifi-cantly higher if PFOS and PFOA related sub-stances are taken into account. For instance, Higgins et al. (2005) found that the levels of PFOS-related substances are higher than the PFOS levels in both sludges and recipient sed-iments in the USA.
The Simple Treat model showed that the overall removal of PFOS in WWTPs is approxi-mately 28% due to adsorption to the sludge. As much as 72% is expected to be released to the recipient water. PFOS is not expected to degrade in treatment or evaporate (Table 5.9).
Higgins et al. (2005) concluded that PFAS (e.g. PFOS and PFOA) most probably end up to sewage sludges and recipient sediments. Additionally, the levels of PFOS are consist-ently higher than the PFOA levels in sewage sludge. The levels of PFOS and PFOA in sedi-ments are substantially lower than in sludge, and the PFOS levels are usually higher than PFOA levels.
According to a Nordic sreening study on PFAS in the environment (Kallenborn et al. 2004), the PFOS concentration ranges in sew-age sludge were relatively similar for Denmark, Finland and Sweden. Usually, PFOA and PFOS were the predominant PFAS residues found in sewage sludge in all Nordic countries. PFOA dominated in sewage samples from less popu-lated countries (Iceland, the Faroe Islands) and Finland, where PFOS was more prevalent in Denmark, Sweden and Norway. No direct cor-relation between the between population size contributing to the wastewater treatment plant (person equivalents) or specific wastewater treatment procedures with the PFAS pattern in sewage sludge samples was found.
Area Untreated waste water (ng/l) Treated waste water (ng/l) Sludge (µg/kg wet / dry weight)
Denmark, 7 STPs 1 <1.5-10 PFOS / <2.0-24 PFOA
<1.5-18 PFOS / <2.0- 24 PFOA
5.1-74 / median 12 dw PFOS0.8-20 / median 1.2 dw PFOA
Denmark, 3 STPs 2 0.32-1.0 ww PFOS / 0.31-0.68 ww PFOA-
Finland, 2-3 STPs 2 - 8.8-63 PFOS / 20-23 PFOA 0.035-0.93 ww PFOS / <LOQ-0.75 ww PFOA-
Sweden, 3 STPs 2 - - 0.17-2.6 ww PFOS / <LOQ-0.78 ww PFOA-
Sweden, 4 STPs 3a - 9-100 PFOS 4-42 dw PFOS
Sweden, 2 STPs 3b - <LOQ-20 PFOS / <LOQ PFOA 8-33 dw PFOS / <LOQ-0.5 dw PFOA-
Sweden, 19 STPs 3c - - <20-1000 dw PFOSSweden, 2 STPs 3d - - 12-33 dw PFOS
PNEC - 2500 PFOS * not available
1 Strand et al. 2007: sampled in 2004-2005, mainly 2 waste water samples and 1 sludge sample / STP2 Kallenborn et al. 2004: spot samples taken in 2003, note that sludge levels expressed as ww!3a Järnberg et al. 2006: sampled in 20033b Swedish Environment Protection Agency 2005: time-integrated (one month) sampling performed in 20013c Svensson 2002: sampled in 2001-2002, one integrated sample (from different parts of sludge storage) from recently produced and stabilized sludge from each STP3d Svensson 2002: sampled in 2001, two time-integrated samples of one month / STPLOQ = Level of Quantification* OSPAR 2005: estimated PNEC for effects on marine aquatic organisms
Area / type of waste water Leachate / storm water (ng/l)
Denmark / untreated leachate of industrial landfill 1
PFOS not detected (<1.5) / 5.8 PFOA
Denmark / untreated drainage water from former industrial area 1
<1.5-3.8 PFOS / PFOA not detected (<2)
Finland / untreated leachate of 1 landfill 2 30-35 PFOS / 300-399 PFOA
Sweden / leachate of 2 landfills 3 38-152 PFOS / <6 PFOA
PNEC 2500 PFOS *
Bind to sludge
Degrade in treatment
Volatilize to air
Reach the surface water
28% 0% 0% 72%
1 Strand et al. 2007: sampled in 2004-20052 Kallenborn et al. 2004: spot sample taken in 20033 Swedish Environment Protection Agency 2005: sampled in 2001 and 2002* OSPAR 2005: estimated PNEC for effects on marine aquatic organisms
Table 5.8PFOS and PFOA concentrations in waste water and sludge of STPs. Predicted No-Effect Concentration (PNEC) in surface waters has been presented for comparison purposes.
Table 5.9Fate of PFOS in aerobic waste water treatment plant based on active sludge (Simple Treat model, Brooke et al. 2004).
Table 5.10PFOS and PFOA concentrations in leachate water of landfills and and in different kind of storm water. Predicted No-Effect Concentration (PNEC) in surface waters has been presented for comparison purposes.

50
Studies from wastewater treatment plants, based on active sludge process, have shown that levels of PFCA (e.g. PFOA) are often higher in treated than in untreated wastewater (Sinclair and Kannan 2006). This mass flow analysis (6 WWTPs in USA) showed also that PFOA levels were significantly higher (7–166 times) than PFOS levels in treated wastewa-ter, which was further supported by a Danish study of five WWTPs (PFOA levels about 2–5 times higher than PFOS) but not by Finnish study (only two WWTPs showed higher PFOA than PFOS levels) (Table 5.8). The relative sig-nificance of domestic and professional (both commercial and industrial) uses or influences on PFAS contamination to WWTPs is still unclear. The distribution and fate of PFAS dur-ing the wastewater treatment process (aerobic activated sludge treatment) is not well docu-mented; however, it is assumed that:
• The fully fluorinated nature of PFOS and PFOA prevents their aerobic degradation;
• The biotransformation of some more highly substituted PFAS are able to degrade to PFOS; and
• Telomer alcohols are able to degrade to PFCA (e.g. PFOA) through biological degradation.
In conclusion, PFOS and PFOA concentra-tions can actually increase during wastewater treatment.
Landfills and storm water
The PFOS and PFOA concentrations in land-fill leachate in Finland and Norway (no samples from other Nordic countries) are considerably higher (around 10 times) than in sewage efflu-ents. Altough the flow rate for landfill leachate is generally smaller than for wastewater, landfills can have a significant effect on the recipient, mainly regarding PFOA, but also PFOS. PFOA was found to be the dominating PFAS in both Finnish and Norwegian landfill leachates.
The levels in leachate of a few landfills in Denmark, Finland and Sweden (no information available from the other HELCOM Contracting Parties) are lower than PNEC (Table 5.10); however, it should be noted that the values shown only represent PFOS and PFOA sub-stances themselves, not PFOS and PFOA-related substances. Thus, the concentrations can be significantly higher if PFOS and PFOA
related substances are taken into account. Landfills may, therefore, significantly contribute to the PFOS and PFOA pollution of the aquatic environment.
There is only one measurement available on PFAS in storm water in the Baltic Sea catchment area, which showed low PFOS concentrations. PFOA was not detected at all (Table 5.10).
5.3 Concentrations in biota, sediment and water of Baltic Sea
According to this study, the following HELCOM Contracting Parties have not measured PFOS or PFOA in biota, sediment or water of Baltic Sea:
- Estonia- Latvia- Lithuania- Russia (no reply to Questionnaire)
When compared to typical persistent organic pollutants (POPs), some PFOS- and PFOA-related substances are much more water-solu-ble and a little more volatile. PFOS and PFOA will not accumulate in fatty tissues – but more likely to proteins, and will often occur as dis-sociated anions, which interact with polar sites in membranes and in sediments (Higgins et al 2005, Poulsen et al. 2005). PFOS-related com-pounds are bioaccumulating into liver and blood unlike most POP compounds, which accumu-late into fat (Korkki 2006). Nevertheless, the water phase (e.g. sea water) is believed to be the target compartment for PFOA (Yamashita et al. 2005, Prevedouros et al. 2006). It is expected that PFAS is present in the envi-ronment primarily in the form of the final sta-ble degradation products PFOS and PFOA (Poulsen et al. 2005).
A UK risk assessment on PFOS (RPA & BRE 2004) has concluded that PFOS meets the P (Persistent) and vP (very Persistent) criteria due to slow degradation. PFOS also meets the B (Bioaccumulative) criterion and the T (Toxicity) criterion according to available data. Relevant information on the physical-chemical, ecotoxicological and environmental proper-ties (e.g. degradation in water or sediment) of PFOS can be found from a UK risk assessment on PFOS (RPA & BRE 2004) and, for example, on PFOA from a Danish study (Poulsen et al. 2005). The information on the ecotoxicologi-cal and environmental properties of PFOA is scarcer than for PFOS.
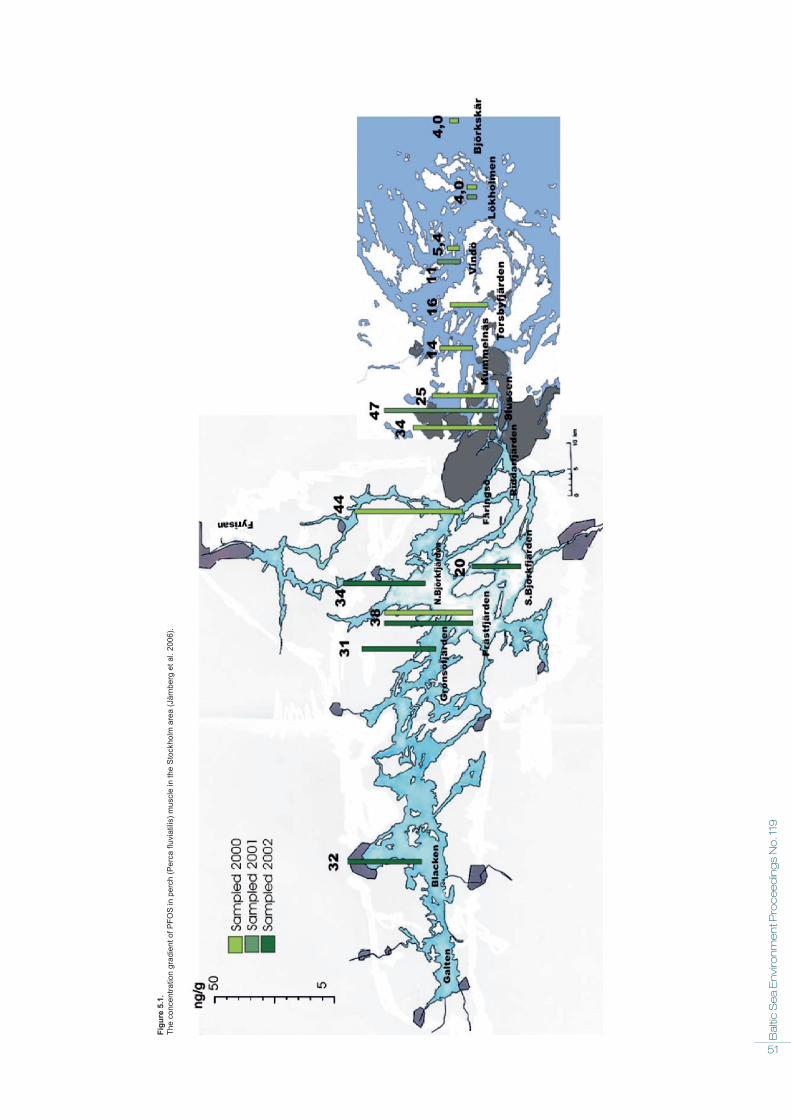
51
Ba
ltic
Se
a E
nvi
ron
me
nt P
roc
ee
din
gs
No
. 119
Figu
re 5
.1.
The
conc
entra
tion
grad
ient
of P
FOS
in p
erch
(Per
ca fl
uvia
tilis
) mus
cle
in th
e S
tock
holm
are
a (J
ärnb
erg
et a
l. 20
06).

52
Binding to water and low volatility make it less likely that PFOS and PFOA will be spread long-range by air by ‘grass-hopping’ and cold condensation mechanisms as persistent organic pollutants (POPs) are able in general. The pathways of PFOS and PFOA to remote locations such as the Arctic are unknown. However, the prevailing hypothesis is that long-range transport to the Arctic occurs via volatile precursors of both PFOS and PFOA, with subsequent degradation to these stable substances. Volatile PFOS-precursors are, e.g. N-Methyl perfluorooctane sulfonamidoeth-anol (MeFOSE) and N-Ethyl perfluorooctane sulfonamidoethanol (EtFOSE) (Poulsen et al. 2005). Additionally, recent studies suggest that fluorotelomer alcohols (FTOHs), which are volatile and can be more readily transported to remote locations, can be degraded to PFOA in the environment, and hence explain the occur-rence of PFOA in remote locations (Ellis et al. 2004, Dinglasan et al. 2004). Other potential sources of PFOS and PFOA are the direct use of fire-fighting foams in the Arctic; also, a recent hypothesis is that the long-range trans-port of PFOS and PFOA is via ocean currents (Poulsen et al. 2005).
The problem with different perfluorochemi-clas, including a large number of PFOS- and PFOA-related compounds is that the chemi-cals may degrade in the environment to PFOS and PFOA respectively; however, no further degradation of PFOS or PFOA will occur, as they are chemically and biologically inert and very stable. Furthermore, these substances are found to bioaccumulate in wildlife and in humans (Poulsen et al. 2005).
A Danish screening study (Strand et al. 2007) shows that the occurrence of several perfluor-ated alkylated substances (PFAS) are wide-spread at point sources and in the aquatic envi-ronments in Denmark. PFOS and PFOA are generally the most dominating components of the measured PFAS. Municipal and industrial wastewater treatment plants can also be sig-nificant sources of PFAS in the environment. PFAS seem to pose an environmental risk - to a higher degree with fish-eating birds and mam-mals at the higher trophic levels - because the PFOS level in most of the analysed fish samples was above the PNEC level for secondary poi-soning in food (17 µg/kg ww). However, it has to be noticed that only liver samples and not whole fish were analysed. It is recommended that PFAS is included in future monitoring pro-grammes for point sources, freshwater and marine environments in Denmark.
A German study on PFCs, including PFOS and PFOA (Theobald et al., 2007), was carried out between 2003 and 2005 to analyse marine water, surface sediments and biota (fish). About 90 water samples were taken at 55 representa-tive stations in the North and Baltic Seas (12 stations). Additional sampling was carried out at 20 stations in the Greenland Sea during a research cruise in 2004. All nine investigated PFCs were found to be present in the waters of the western Baltic Sea. Sediment samples from six stations show, for PFOS in particular, a strong influence of sediment properties such as TOC content or the proportion of fine-grained material. Biota samples taken from two areas indicate different bioaccumulation factors for dab liver (Kiel Bight) and cod liver (Arkona Sea) for PFOS (67.000 in dab and as mean 18.000 for cod) but not for PFOA (about 1.200); thus the concentrations of PFOS range from 24–26 µg/kg ww for dab liver and 5.5–7.7 µg/kg ww for cod liver, for PFOA < 0.5–0.84 µg/kg ww for dab liver and about 0.7 µg/kg ww for cod liver. Concentrations in muscle are much lower, ranging for PFOS from 3–4 µg/kg ww for dab and 0.7–7 µg/kg ww for cod, and < 0.5 µg/kg ww for PFOA in both species.
A Swedish study on PFAS (Järnberg et al. 2006) showed the clear ten–fold decreasing gradient of PFOS level in perch muscle from the central Stockholm area to the most outer part of Stockholm archipelago as can be seen in Figure 5.1. Additionally, another Swedish study (Holmström et al. 2005) found that the PFOS level in guillemot (Uria aalge) eggs col-lected from the western coast of Gotland Island increased by more than 30-fold from 25 µg/kg ww in 1968 to 614 µg/kg ww in 2003, with annual average increases of 7–11%. The peak concentration was found during 1997–2000 (1260 µg/kg ww) followed by decreasing con-centration up to 2002.
Varied sources can explain the higher levels of perfluorinated substances found in Swedish urban environments, e.g. emissions from industrial and municipal wastewater, training areas for fire-fighting (military bases and air-ports) and leachate from landfill (KEMI 2006). The Swedish survey concluded that PFOS is currently widely distributed and suspected to be causing significant environmental pollution in the Swedish environment. More measure-ments concerning both discharges/emissions and occurrence in environment will be carried out within the Swedish contaminant screening /monitoring programme (Swedish Environment Protection Agency 2005).

Certain perfluorinated substances are ubiq-uitous in the Nordic environment. High lev-els were found in sewage sludge and leach-ate from landfills, and in top-predators such as the grey seal. Also for marine fish species (e.g. Baltic flounder, eelpout, herring and cod), PFOS represents, in most cases, the predomi-nant representative of the PFAS contamina-tion. Marine mammals are considerably higher contaminated than marine and freshwater fish, and were found to be the most contaminated of all Nordic biota (including terrestrial fauna) studied. Swedish and Danish grey seals are the highest contaminated with PFAS residues. The highest PFOS values were found in the Danish Harbour seal samples (977 µg/kg ww). Usually, PFOS is the dominating PFAS resi-due also in marine mammals. A Nordic study found that large amounts of PFAS-related con-taminants have been deposited in sediment. Whether remobilisation from the sediments into the water column and the food web also is important still remains unknown. PFOS was found to be the dominating PFAS in the Finnish and Faroe Island sea sediment. The study concluded that significant amounts of PFAS, mostly dominated by PFOS, are accumulating in the marine and freshwater food web into the top predating organisms, and reaching surpris-ingly high concentration levels (Kallenborn et al. 2004).
The PFOS levels in biota (Table 5.11) show that the PFOS levels in many fish species and sub-regions of the Baltic Sea are higher than the estimated PNEC level for the pro-tection of predators such as mammals and predatory birds via secondary poisoning. The measured data on PFOS and PFOA in the Baltic Sea waters are very few (four sites from Denmark, Germany and Finland), but indi-cate that PFOS concentrations are low when compared to the estimated PNEC level (Table 5.12). Furthermore, information on PFOS and PFOA in sediment (six sites from Denmark, six sites from Germany and two sites from Finland) show that PFOS levels are lower than the esti-mated PNEC level (Table 5.13).
Ther PFOS levels in the blood of the ringed seal are significantly higher than in the blood of grey seals in the Baltic Sea. Additionally, the PFOS level in the blood of both male ringed seals and grey seals was almost two-fold greater than in females, which contradicts the conclusions from previous studies; this shows that the gender has no implication to the PFOS level in seals (Kannan et al. 2001). The rela-tionship between PFOS levels and the age
of ringed or grey seals (or any other studied marine mammals), which has been confirmed for neutral lipophilic contaminants (e.g. PCBs), was not found (Kannan et al. 2001, Kannan et al. 2002). PFOS concentration in seal livers was 5.5 times higher than in the blood. It was stated that blood could be used for the nonlethal monitoring of PFOS in seals. The trend analy-sis of PFOS levels in the livers of white-tailed sea eagles from eastern Germany and Poland showed an increase in levels during the 1990s. PFOS and PFOA were not found in Atlantic sal-mons. The overall conclusion was that PFOS is a widespread contaminant in Baltic Sea wild-life, while PFOA was only detected in certain locations (Kannan et al. 2002).
The marine part of the chemical risk evalu-ation is involved two steps. First, prepare the PBT assessment to ascertain whether the sub-stance is so hazardous that measures should be developed solely on the basis of the informa-tion available on sources and pathways to the marine environment. Second, take a traditional risk-assessment approach, where the predicted environmental concentrations (PECs) were compared with the predicted no effect concen-trations (PNECs) to give a PEC/PNEC ratio for various scenarios (OSPAR 2005). The OSPAR risk assessment on marine compartments con-cluded that PFOS is a PBT substance accord-ing to the criteria of the EC Technical Guidance Document on risk assessment. Additionally, the risk assessment indicated that the major area of concern is the secondary poisoning of top predators. All the considered use patterns lead to a risk for secondary poisoning in relevant scenarios for marine and marine top predators (as well as for the freshwater environment).
Giesy & Kannan (2002) summarised the global results for PFOS levels in biota in the 1990s. PFOS was detectable in most of the samples, including those from remote marine locations such as the Arctic Ocean, at levels >1 µg/kg ww. The studies indicated that PFOS is distributed in remote regions, including polar areas, but that the levels found in more popu-lated and industrial areas (e.g. Baltic Sea and Mediterranean Sea) are several times higher. There was no difference between levels in male and female animals as for the lipophilic POPs, such as PCBs, but is similar to those of protein-binding compounds such as TBT. PFOS is also found in bird (up to 3 350 µg/kg ww for Caspian tern) and fish eggs (up to 250 µg/kg ww for brown trout and whitefish) suggesting possible maternal transfer during yolk formation
53
Ba
ltic
Se
a E
nvi
ron
me
nt P
roc
ee
din
gs
No
. 119

54
PFOS, PFOA and other perfluorinated com-pounds are now considered as global environ-mental contaminants. They have been found in indoor air, outdoor air, soil, ground water, sur-face waters and even at a depth of 1,000 m in the Pacific Ocean. Perfluorinated compounds are widely distributed in wildlife. PFOS has been detected in blood and liver samples from various species of aquatic animals (seal, otter, sea lion, dolphin, polar bear and mink), birds, fish and amphibians (Poulsen et al. 2005).
Houde et al. (2006) global analysis concluded that PFOA levels are remarkably similar in dif-ferent geographical areas, even far away from the sources of emission and densely populated areas. Nevertheless, the measured levels of other perfluorinated substances in different organisms tend to be higher the closer they are to industrialised / urban areas. Perfluorinated substances (e.g. PFOS and PFOA) occur in all organism groups and trophic levels, but the quantities are generally higher in the upper
Area / species Tissue type Concentration in biota(µg/kg wet /dry weight /lipid or ng/ml blood)
Mussels & fishKattegat, Great Belt & Sound, blue mussel Mytilus edulis 1a soft tissue <0.2 ww PFOS / <1.2 ww PFOAKattegat, eel Anguilla anguilla 1a liver 40 ww PFOS / 6.5 ww PFOAKattegat, eelpout Zoarces viviparous 1b liver 60 ww PFOS / 1.0 ww PFOAKattegat, herring Clupea harengus 1b liver 15 ww PFOS / 5.4 ww PFOAKattegat, herring Clupea harengus 11 liver mean 6.3 ww PFOSGreat Belt, eel Anguilla anguilla 1a liver 54 ww PFOS / 9.8 ww PFOAGreat Belt, flounder Platichthys flesus 1a liver 25 ww PFOS / 3.3 ww PFOASound, flounder Platichthys flesus 1a liver 9.5 ww PFOS / 1.9 ww PFOASound, flounder Platichthys flesus 1b liver 19-20 ww PFOS / <LOD PFOASound, eelpout Zoarces viviparous 11 muscle 1.5 ww PFOS / <LOD PFOAKiel Bight, dab, Limanda limanda 13 liver 24-26 ww PFOS / < 0.5-0.84 ww PFOA Kiel Bight, dab, Limanda limanda 13 muscle 3.0-4.0 ww PFOS / < 0.5 ww PFOASouthern Baltic Proper, cod Gadus morhua 2 liver 23-62 ww PFOS / <LOD PFOAArkona Sea, Gadus morhua 12 liver 5.5-7.7 ww PFOS / 0.7 ww PFOAArkona Sea, Gadus morhua 12 muscle 0.7 ww PFOS / < 0.5 ww PFOA(Western) Gotland Basin, cod Gadus morhua 2 liver 6.4-20 ww PFOS / <LOD PFOAGulf of Gdansk, cod Gadus morhua 10 whole blood 6.1-52 ng/ml PFOS / 0.05-0.07 ng/ml PFOAGulf of Finland, pike Esox lucius 3 liver 204-551 ww PFOS / <LOD-1.4 ww PFOAGulf of Finland & Bothnian Bay, salmon Salmo salar 6 liver <8 ww PFOS / <19 ww PFOABothnian Sea, perch Perca fluviatilis 11 muscle 5.0-5.3 ww PFOS / <LOD PFOABothnian Bay, perch Perca fluviatilis 11 muscle 1.4-4.9 ww PFOS / <LOD PFOAMammals & birdsKattegat, Great Belt & Sound, Harbour seal Phoca vitulina 4 liver 565-977 ww PFOS / 0.3-1.3 ww PFOASouthern Baltic Proper & Bothnian Sea, grey seal Halichoerus grypus 5 liver 331-537 ww PFOS / 0.6-1.8 ww PFOA
Bothnian Bay, ringed seal Phoca hispida 6 liver 130-1100 / mean 460 ww PFOS <19-39 ww PFOA (2 observations above LOD)
Bothnian Bay, grey seal Halichoerus grypus 6 liver 140-360 / mean 217 ww PFOS <19 ww PFOA
Bothnian Bay, ringed seal Phoca hispida 7 blood plasma 92-242 ng/ml PFOSBothnian Bay, grey seal Halichoerus grypus 7 blood plasma 26-44 ng/ml PFOSBaltic Sea, ringed seal Phoca hispida 8 blood plasma 16-230 / mean 110 ng/ml PFOSBaltic Sea, grey seal Halichoerus grypus 8 blood plasma 14-76 / mean 37 ng/ml PFOS
Western Gotland Basin, guillemot Uria aalge 9 eggyear 1968: 25 ww PFOS /<3 ww PFOAyear 1997: 1324 ww PFOS /<3 ww PFOAyear 2003: 614 ww PFOS /<3 ww PFOA
Gulf of Gdansk, eider duck Sommateria mollisima 10 whole blood 12-38 ng/ml PFOS / 0.06-0.10 ng/ml PFOAPNEC - 17 ww PFOS in prey tissue * / not available for PFOA
Table 5.11PFOS and PFOA levels in biota of Baltic Sea. Predicted No-Effect Concentration (PNEC) has been presented for comparison purposes. LOD = Level of Detection.
1a Strand et al. 2007: 2-3 Danish coastal sites for fish in 2004 (5-10 individuals/site, pooled), 7 sites for mussel in 2004-20051b Kallenborn et al. 2004: 2 Danish coastal sites (1-2 individuals / site) in 20032 Kallenborn et al. 2004: 2 Swedish coastal sites (2-6 individuals / site) in 20033 Kallenborn et al. 2004: 1 Finnish coastal site in 2003, 8 individuals / site, unpooled4 Kallenborn et al. 2004: 3 Danish coastal sites (1 individual / site) in 20035 Kallenborn et al. 2004: 3 Swedish coastal sites (1 individual /site) in 20036 Kannan et al. 2002: altogether 22 salmons (female adults) sampled during spawning from two rivers; altogether 25 ringed seals and 27 grey seals from Bothnian Bay7 Kannan et al. 2001: 29 ringed seals and 26 grey seals from the Bothnian Bay in 1996-988 Giesy & Kannan 2001: 18 ringed seals and 26 grey seals from Baltic Sea in 1990s9 Holmström et al. 2005: 8-9 eggs / year, time series from year 1968 on10 Falandysz et al. 2006: 1 Polish area, 18 cod and 16 eider duck individuals in 200311 Swedish Environment Protection Agency 2005: 4 Swedish sites (3-10 individuals / site) in 2001-200212Theobald et al. 2007: sampled in September 200313 Theobald et al. 2007: sampled in September 2004* Brooke et al. 2004: estimated PNEC of PFOS for protection of top predators such as mammals and predatory birds via secondary poisoning expressed as concentration in prey tissue

levels of food chains (e.g. in dolphins in the Atlantic and arctic polar bears). PFOS and PFOA levels in different organisms have con-tinually increased during the 1990s (Houde et al. 2006). The apparent downwards trend of PFOS in wildlife since 2000 is currently under investigation. It seems unclear whether the studied species were able to excrete or metab-olize PFOS so rapidly, or that concentrations in water would have decreased so rapidly even if the atmospheric PFOS deposition has declined as a result of emission reductions (Prevedouros et al. 2006).
As a whole, the situation regarding PFAS compounds is complicated because of the large number of substances, and the fact that it is not known exactly which substances or poly-mers have harmful properties or can degrade to PFOS and other persistent PFAS in the envi-ronment (Korkki 2006).
In general, the findings of this study imply the threat caused by PFOS to the Baltic Sea’s top predators, such as seals and predatory birds, is via secondary poisoning. The effects of PFOA on the Baltic marine environment is difficult to estimate due to the lack of ecotoxicological information (i.e. the PNEC value has not been comprehensively assessed). 5.4 Substance-specific conclusions
It is evident that the HELCOM countries do not have even basic information on the use of PFOS and PFOA.
The relevant sources of discharges and emis-sions are shown in Table 5.14. The reported PFOS emission factors for industrial sectors shown in Table 5.14 are high (5–100%). In gen-eral, the main pathways to the marine environ-ment of PFOS and PFOA are via rivers and via the atmosphere.
PBT assessment, which is very relevant especially with regard to the marine environ-ment, showed that PFOS is a very persistent, bioaccumulative and toxic substance (PBT substance). PFOS is a widespread contami-nant in the Baltic Sea wildlife, while PFOA was only detected in certain locations (Kannan et al. 2002). On the whole, the situation regarding PFAS compounds is complicated because of the large number of substances, and it is not exactly known which substances have harmful properties, or can degrade to PFOS and other
persistent PFASs in the environment (Korkki 2006).
The findings of this study imply that the threat caused by PFOS to the Baltic Sea’s top preda-tors, such as seals and predatory birds, is via secondary poisoning. The risks and threats of PFOA on the Baltic marine environment are currently difficult to estimate due to the lack of ecotoxicological information (i.e. PNEC value has not been comprehensively assessed).
More information on the occurrence of PFOS- and PFOA-related substances in the Baltic Sea in sea water, biota and sediment, as well as in discharges (e.g. WWTPs and landfills) in Baltic Sea catchment area is required.
55
Ba
ltic
Se
a E
nvi
ron
me
nt P
roc
ee
din
gs
No
. 119
Area Sea water (ng/l)Little Belt, 1 Danish coastal site 1 1.5 PFOS / 7.7 PFOA
Sound, 1 Danish coastal site 1 0.72 PFOS / 6.2 PFOAOder, 1 German coastal site² 0.9 PFOS / 1.05 PFOAUsedom, 1 German coastal site² 0.58 PFOS / 0.89 PFOA
Arkona Sea, 2 German open sea sites² 0.35 PFOS / 0.49 PFOA
Darß Sill, 1 German open sea site² 0.41 PFOS/ 0.59 PFOA
Mecklenburg Bight, 1 German coastal site² 0.36 PFOS / 0.58 PFOA
Gulf of Finland, 2 Finnish coastal sites 1 0.86-22 PFOS / 4.0-5.6 PFOA
PNEC 2500 PFOS *
Area Sediment (µg/kg dry or wet weight)
Kattegat, Great Belt & Sound, 6 Danish coastal sediments 1
<1.0 dw PFOS / <0.4 dw PFOA
Eckernfoerde Bight, 1 German coastal sediment 2 0.58 dw PFOS / 0.29 dw PFOA
Kiel (inner) Bight, 2 German coastal sediments 2 0.32 dw PFOS / 0.11 dw PFOA
Mecklenburg Bight, 1 German coastal sediment 2 0.67 dw PFOS / 0.68 dw PFOA
Arkona Sea, 1 German open sea sediment 2 0.03 dw PFOS / 0.06 dw PFOA
Ruden, 1 German open sea sediment 2 0.13 dw PFOS / 0.20 dw PFOA
Stettin, 1 German open sea sediment 2 0.03 dw PFOS / 0.06
Gulf of Finland, 2 Finnish coastal sediments 3
0.22-1.0 ww PFOS / <LOQ ww PFOA
PNEC 6.7 ww PFOS *
Table 5.12PFOS and PFOA concentrations in water of Baltic Sea. Predicted No-Effect Concentration values (PNEC) has been presented for comparison purposes.
Table 5.13PFOS and PFOA levels in sediment of Baltic Sea. Predicted No-Effect Concentration (PNEC) has been presented for comparison purposes. LOQ = Level of Quantification.
1 Kallenborn et al. 2004: sampled in 2003² Theobald et al. 2007: sampled in June 2005* Brooke et al. 2004: estimated PNEC for effects on marine aquatic organisms
1 Strand et al. 2007: sampled in 2003-20042 Theobald et al. 2007: sampled in June 20053 Kallenborn et al. 2004: sampled in 2003, note that concentrations expressed as ww!* Brooke et al. 2004: estimated PNEC for benthic community based on using Kd value indicating the mobility of substance in soil (no eco-toxicological data available for sediment dwelling organisms), expressed as concentration in sediment

56
There is also need for ecotoxicological data for sediment dwelling organisms, in order to defi ne better the PFOS and PNEC estimates for the benthic community. Additionally, more information on the relevant ecotoxicological data on PFOA should be searched or pro-duced in order to derive the PNEC values in the marine environment.
Substance Sources of discharges to aquatic environment Sources of emissions to atmosphere
PFOS & PFOS related substances, which degrade to PFOS
* landfi lls* Sewage treatment plants (STPs)* industrial waste water from - metal plating factories- semiconductor industry 1
- photographic industry- manufacture and use of fi re fi ghting foams 1
- paper and packaging protection industry 1
* semiconductor industry 1
PFOA
* use of PFOA related substances which degrade to PFOA (e.g. fl uorotelomer alcohols, FTOH)* landfi lls* Sewage treatment plants (STPs)* fl uoropolymer production (e.g. polytetrafl uoroethylene, PTFE)
* use of PFOA related substances which degrade to PFOA (e.g. fl uorotelomer alcohols, FTOH)* fl uoropolymer production (e.g. polytetrafl uoroethylene, PTFE)
Table 5.14Relevant sources of PFOS and PFOA discharges and emissions. The industrial sector or professional use has been identifi ed as a relevant source if the emission factor is relatively high or if it has been identifi ed as risk use in national or EU risk assessments. The signifi cance of other activities (e.g. STPs and landfi lls) has been evaluated on the basis of measured effl uent concentrations. It should be noted that all below mentioned sectors may not be relevant in all HELCOM countries and these should be identifi ed at national level (e.g. within national programs under the HELCOM BSAP).
1 Use banned (as a substance or constituent of preparations at concentration ≥0.005% by mass and in semifi nished products or articles ≥0.1% by mass) in EU since 27th June 2008 (2006/122/EC). Existing storage of fi re fi ghting foams containing PFOS are allowed to use until 27th June 2011. Concerning the semiconductor industry, the ban is only on developers and edge bead removers, not on photoresists and antirefl ective coatings, which are having high emission factors to waste water and air

57
Ba
ltic
Se
a E
nvi
ron
me
nt P
roc
ee
din
gs
No
. 119
6 Nonylphenols (NP)and nonylphenol ethoxylates (NPE)
Nonylphenol has been identifi ed as priority hazardous substance under the EQS Directive (2008/105/EC).
The term ‘nonylphenol’ can apply to a large number of isomeric compounds of the general formula C6H4(OH)C9H19. Nonylphenols may vary in two ways: the substitution position of the nonyl group on the phenol molecule; and the degree of branching of the nonyl group. Since the nonyl moiety is formed by polymeris-ing the propylene, the degree of branching may be considerable and varied. Many of the indi-vidual branched isomers have their own CAS numbers (EU-RAR 2002b).
NP and NPE compounds indicated in the HELCOM questionnaire sent to the Contracting Parties in 2006 are presented in Table 6.1. Additionally, Sweden reported on NPs with CAS number 11066-49-2 and 90481-04-2, and NPE with CAS number 127087-87-0; Finland reported on NP with CAS number 90481-04-2 and NPEs with CAS number 127087-87-0, 68584-47-4 and 51811-79-1.
6.1 Production and use
The usage information of NP in the HELCOM Contracting Parties is presented in Tables 6.2 and 6.3 and in the EU in Table 6.4.
NP has been used, at least in Finland, Latvia, Poland and Sweden during 2000–2005 (Table 6.3). NP has been used, for example, in the paint and plastic industries, and in the produc-tion of washing agents (Table 6.2). Estimates on the amounts of used NP during 2000–2005
are only available from Finland, Latvia, Poland and Sweden.
NP production was 73,500 tonnes; exports 3,500 tonnes; and import 8,500 tonnes in the EU-15 in 1997. The total use of NP in the EU-15 in 1997 was some 78,500 tonnes (EU-RAR 2002b). Very little, if any, straight chain nonylphenol is produced. It is only likely to be present at very low levels in commercial mix-tures. The commercially produced nonylphe-nols are predominantly 4-nonylphenol with a varied and undefi ned degree of branching in the alkyl group (EU-RAR 2002b).
Nonylphenol is used in three main applica-tions; in the production of NPE (main use); in the manufacture of resins, plastics and stabilis-ers; and in the manufacture of phenolic oximes (EU-RAR 2002b).
Nonylphenol ethoxylates are produced by the ethoxylation of nonylphenol. In the plastics industry, NP is mainly used as a monomer in the production of phenol / phenol / formaldehyde resins. Other uses are: as an intermediate in the production of tri-(4-nonylphenyl) phosphite (TNPP) and as a catalyst in the curing of epoxy resins (Table 6.3). To the existing knowledge
Compound CAS numberNonylphenols (NP)- Nonylphenol mixture- 4-nonylphenol- 4-nonylphenol, branched
25154-52-3104-40-584852-15-3
Nonylphenol ethoxylates (NPE)- Nonylphenol ethoxylates
- Nonylphenol monoethoxylate- Nonylphenol diethoxylate
e.g. 9016-45-9, 26027-38-3, 37205-87-1, 68412-54-4not availablee.g. 20427-84-3, 27176-93-8
Type of business and/or mode of application HELCOM country of confi rmed use Remarks
Paints / stabiliser and emulsifying agent Finland Years 2002-2004 (main use in 2006)Plastic industry / adhesive or binding agent, process regulator, stabiliser and hardener for epoxy resin in manufacture of plastic products such as construction materials / soldering agent in insulated wires and cables
Finland Years 2002-2004
Manufacture of plastics / Stabilizing agent Poland Year 2003, CAS 25154-52-3, industrial use
Chemical industry / production of solvents and washing agents for household use Poland Year 2003, CAS 25154-52-3
Cosmetic industry Poland Year 2003, CAS 25154-52-3, mainly consumer use
Construction and plastic industry - hardener in plastics and paint / fl oor covering material & sealing compounds Sweden Main use in year 2000, year 2004 (e.g.
Remberger et al. 2003)Chemical industry – raw material for chemical syhthesis Sweden Year 2000
Table 6.1Indicative NP and NPE compounds
Table 6.2Uses of NP in HELCOM countries during years 2000-2005

58
the NP is not used as a free additive in resins, plastics or stabilisers. Nonylphenol is used in nonylphenol/formaldehyde resins, either alone or mixed with other phenols. There is a poten-tial for consumer exposure due to the con-sumer use of epoxy resins. TNPP is used as a secondary antioxidant in polymer formulations. It is widely used in the stabilisation of natural and synthetic rubbers, vinyl polymers, polyole-fins and styrenics. TNPP is used as an additive in plastics used for food packaging. It may con-tain up to 3% free nonylphenol. In some epoxy resins, NP is used as an accelerator or curing agent in the hardening component. In the hard-ening process, NP is irreversibly encapsulated in the final resins. Curing agents cause cross-linking in the resins and so can be considered co-monomers (i.e. NP is reacted into the poly-mer structure) in the polymerisation process. It is assumed that NP is used in the production of plastic stabilisers rather than the use as a plastic stabiliser itself. Phenolic oximes con-taining nonylphenol are used as a reagent for
the extraction and purification of copper from ore (Table 6.3).
The usage information of NPE in the HELCOM area is presented in Tables 6.5 and 6.6 and in the EU in Table 6.7.
NPE has been used, at least in Finland, Latvia, Lithuania, Poland and Sweden, during 2000–2005 (Table 6.6). NPE has been used, for example, in paints and adhesives, treat-ment and coating of metal, air transport and the removal of stains (Table 6.5). Estimates on amounts of used NPE during 2000–2005 are available from Finland, Latvia, Lithuania, Poland and Sweden.
The production was NPE was 118,000 tonnes, exports 46,000 tonnes and imports 5,600 tonnes in the EU-15 in 1997. The total use of NPE in the EU-15 in 1997 was around 77,600 tonnes (EU-RAR 2002b).
NPEs represent 90–95% of all alkylphenol ethoxylates in tonnage used in Europe. The wetting properties of NPE surfactants are of particular importance for degreasing (i.e. clean-ing), where the surface tension of the cleaning solution has to be low enough in order to wet the entire surface of the material to be degreased. Likewise, NPEs are important in situations where chemical or cleaning formulations need to be dispersed to every part of the component or product (OSPAR 2001b). It should be noted that alkylphenol ethoxylates (e.g. nonylphe-
Mode of application Amount used (tons/year) and share of total use
Production of NPE 47 000 (60%)Manufacture of resins, plastics, stabilisers etc.- Phenolic (nonylphenol/formaldehyde) resins - Tri-(4-nonylphenyl) phosphite (TNPP)- Epoxy resins- Use in other plastic stabilisers
29 000 (37%)- 22 500- 4 000- 1 500- 1 000
Manufacture of phenolic oximes 2 500 (3%)
Total use 78 500
Country Use (ton) Remarks2000 2001 2002 2003 2004 2005
Denmark NI NI NI NI NI NIEstonia NI NI NI NI NI NI
Finland NI 13 16 9 5 10
Export not taken into account, National Product Register of Chemicals
Germany NI NI NI NI NI NI
Latvia NI NI NI 0.007-0.021 0.003-0.009 Not produced or imported
National Chemicals Data Base
Lithuania NI NI NI NI NI NIPoland NI NI NI 12 NI NI
Russia NI NI NI NI NI NI No reply to questionnaire
Sweden 66 31 NI NI 25 NI
Export not taken into account, National Product Register of Chemicals
Table 6.3Total amount of use for nonylphenols (NP) in HELCOM countries during 2000-2005 (NI = no information received)
Table 6.4Use of NP in EU-15 in 1997(EU-RAR 2002b)

59
Ba
ltic
Se
a E
nvi
ron
me
nt P
roc
ee
din
gs
No
. 119Country Use (ton) Remarks
2000 2001 2002 2003 2004 2005Denmark NI NI NI NI NI NIEstonia NI NI NI NI NI NI
Finland NI 421 955 700 441 224Export not taken into account, National Product Register of Chemicals
Germany NI NI NI NI NI NILatvia NI NI NI 2.4-3.8 6.4-11 5.4-10 National Chemicals Data BaseLithuania NI NI NI NI 13.7 NIPoland NI NI NI Use exist NI Use exist No data on amountRussia NI NI NI NI NI NI No reply to questionnaireSweden 338 261 115 77 104 NI
Type of business and/or mode of applicationHELCOM country of confirmed use
Remarks
Growing of crops; market gardening; horticulture / solvent for pesticide applied in agriculture and horticulture Finland Years 2002-2004
Manufacture of pulp / aid agent in pre-treatment of wooden fibre mass and removal of lignin Finland Industrial use classified as risk use
(Finnish Environment Ministry 2006), years 2002-2004Photochemicals / stabiliser and developer agent Finland Years 2002-2004
Paints / stabiliser and emulsifying agent FinlandManufacture of paints (formulation) classified as risk use (Finnish Environment Ministry 2006), years 2002-2004 (main use in 2006)
Manufacture of pharmaceuticals / surface-active agent Finland Years 2002-2004
Manufacture of cleaning preparations and use by industry and households / cleaning agent Finland
Professional use (e.g. industrial cleaning, chemical laundries) classified as risk use(Finnish Environment Ministry 2006), years 2002-2004
Treatment and coating of metal / metal working fluids Finland Industrial use classified as risk use(Finnish Environment Ministry 2006), years 2002-2004
Manufacture of electronic valves and tubes and other electronic components / soldering agent in Finland Years 2002-2004
Laboratory chemical Finland Years 2002-2004Air transport / anti-icing agent in aircrafts (see more details in Corsi et al. (2003) Finland Professional use in airports classified as risk use
(Finnish Environment Ministry 2006), 2002-2004Technical testing / liquids designed to detect damages / cracks in different objects Finland Years 2002-2004
Manufacture of mastics Latvia Year 2005Industrial cleaning Latvia Year 2005Removal of stains Latvia Main use, year 2005Maintenance and repair of motor vehicles Latvia Year 2005Manufacture of veneer sheets; manufacture of plywood, laminboard, particle board, fibre board and other panels and boards
Latvia Main use, year 2005
Manufacture of builders carpentry and joinery Latvia Year 2005Sale, maintenance and repair of motor vehicles and motorcycles; retail sale of automotive fuel Latvia Year 2005
Manufacture of dyes and pigments Latvia Year 2005NACE 15.10, 15.20, 15.30, 15.50, 15.80, 15.90, 90.00, 55.00 & 85.00 - Detergent - disinfectant Latvia Main use, year 2005
Manufacture of chemicals and chemical products / Consumer and industrial chemical Lithuania Year 2004
Manufacture of soap and detergents, cleaning and polishing preparations / Consumer and industrial chemical Lithuania Year 2004
Manufacture of perfume and toilet preparations / Consumer and industrial chemical Lithuania Year 2004
Textile industry / Dyeing processes Poland Year 2005Tanning industry / Washing of hides and furs Poland Year 2005Chemical industry (artificial fibre production) / washing agent amid fibres Poland Year 2005
Engineering industry / washing agent in surface treatment processes Poland Year 2005
Paints and adhesives / e.g. binder Sweden Main use, year 2004Degreasing and cleaning agent Sweden year 2004Metal working - lubricant Sweden year 2004Pesticide and biocide Sweden year 2004
Table 6.5Uses of NPE in HELCOM countries during years 2000-2005
Table 6.6Total amount of use for NPE in HELCOM countries during 2000-2005(NI = no information received)

60
nol ethoxylates) have been identified in air-craft deicing and anti-icing fluid formulations in Finland (Finnish Ministry of Environment 2006) and USA (Corsi et al. 2003). This use has not been identified by EU Risk Assessment Report (EU-RAR 2002b).
6.2 Discharges, emissionsand losses to environment
According to this study, the follow-ing HELCOM Contracting Parties have not measured NP or NPE in discharges, emissions or losses to environment:
- Estonia- Germany- Latvia- Poland- Russia (no reply to Questionnaire)
Releases of NP from production processes are estimated to be very low. Thus, very little NP enters into the environment directly. The primary source of NP found in the environment is considered to be NPEs, which can break down into NP in wastewater treatment works or in the environment. The wide variety in use makes products containing NPEs very poten-tial sources for diffuse emissions of NPEs and NP. This is mainly the case during use and waste management. During the incineration of wastes, neither NPs nor NPEs are released. The main environmental compartments to which releases occur are surface waters that receive municipal and industrial wastewater, air, and soil via the spreading of sewage sludge containing NP/NPE (HELCOM 2002a).
The reported emission factors for NP are low (<1%, Table 6.8). Some reported emis-
Mode of application Amount used (tons/year) and share of total use
Captive use (synthesis of NP ether sulphates and NP ether phosphates used as emulsifier in chemical industry) 7 000 (9%)
Industrial and institutional cleaning (laundries, floor and surface cleaning in buildings, vehicle cleaners, anti-static cleaners and metal cleaning) * 23 000 (30%)
Textile auxiliaries (e.g. wool scouring, fibre lubrication and dye smoothing)* 8 000 (10%)Leather auxiliaries (degreasing agent in treatment of animal hides)* 6 000 (8%)Agriculture - Solvent/wetting agent for pesticide applied in agriculture and horticulture *- Surface-active agent in veterinary medicines (teat dips in treatment of mastitits) *
5 000 (6%)
Emulsion polymerization (processing aid in the formulation of emulsion polymers including polyvinyl acetates and acrylic acids which have further end applications like paints, paper, inks, adhesives and carpet backings)
9 000 (12%)
Paints (in manufacture of paint resins (polyvinyl acetates – PVA) and also present in paints as a stabiliser/emulsifier), coatings and inks 4 000 (5%)
Pulp and paper (dispersing agent in defoamers and retention agents, wetting agent for pulp fibres, de-lignification of wood and claning agent) * 1 000 (1%)
Metal industry (in metal cleaning processes of iron and steel manufacture, steel phosphating, electronics cleaning for metal contacts, cleaning of metal products prior to storage and in cutting and drilling oils) * 2 000 (3%)
Other uses- Electronic industry (in fluxes in the manufacture of printed circuit boards, dyes to identify cracks in printed circuit boards, chemical baths used in the etching of circuit boards and cleaning products for electrical components- Mineral fuel and oil industry (additive in lubrication oils of particularly for military use and in fuels- Photographic industry (wetting agent in developing of photographic film)- Civil and mechanical engineering industry (increase porosity of cement and bitums used in road construction)- Cosmetic products (as surfactant) *- Non-agricultural pesticides *- Office products such as correction fluids and inks
7 000 (9%)
Total use (not include the imported volume of 5 600 tons) 72 500
Mode of application Life cycle Emission factor (%)Waste water 1 Air 2
Production of NP production n.a. n.a.
Production of NPE industrial use 0.7 NP0.3 NPE
0.001 NP0 NPE
Manufacture of resins, plastics, stabilisers etc.- Phenolic (nonylphenol/formaldehyde) resins - Tri-(4-nonylphenyl) phosphite (TNPP)- Epoxy resins- Other plastic stabilisers
industrial useindustrial useindustrial useindustrial use
0.00100.010.05
0.00100.010
Manufacture of phenolic oximes industrial use n.a. 0
Table 6.7Use of NPE in EU-15 in 1997 (EU-RAR 2002b), uses marked with asterisk (*) have been banned (as a substance or constituent of preparations at concentration >0.1% by mass) in EU since Jan 2005 (2003/53/EC).
Table 6.8NP emission factors in EU-15 (EU-RAR 2002b). n.a. = not available
1 fraction of total amount of substance in life cycle released to waste water before any treatment (e.g. STP)2 fraction of amount of substance in life cycle released to air as direct emission of facility or plant, emission from STP to air due to volatilization is estimated to be zero

sion factors for NPE are presented in Table 6.9. The emission factors for cleaning, textile and leather auxiliaries, agricultural pesticide use, retention agents use in the pulp and paper industry, metal cutting, photographic industry (both professional and private use) and civil and mechanical engineering industry are high (up to 100%), indicating their high importance as pollution sources. The emission factor on anti-icing use at airports for wastewater has
been estimated to be 100% (Finnish Ministry of Environment 2006). Nevertheless, it should be noted that high sectoral emission factors do not necessarily indicate that the sectoral dis-charges (or emissions) are automatically high, because the amount of sectoral discharges (or emissions) depends on how much substance is used by the certain sector.
61
Ba
ltic
Se
a E
nvi
ron
me
nt P
roc
ee
din
gs
No
. 119
Mode of application Life cycle Emission factor (%)Waste water 1 Air 2
Formulation of NPE for uses mentioned below formulation 0.3 0.25Captive use industrial use 0.7 0Industrial and institutional cleaning industrial use 90 0.25Textile auxiliaries industrial use 85 5Leather auxiliaries industrial use 90 0.1Agriculture – pesticide use * industrial use 10 5Emulsion polymerisation industrial use very low 0
Paints industrial useprivate use
0.50.5
00
Coatings industrial use 0.5 n.a.Pulp and paper – retention agent use industrial use 100 0Metal industry – metal cutting fluid use industrial use 3.2-32 0.02Electronic industry industrial use 0.5 0.05
Mineral fuel and oil industry formulationindustrial use
n.a.0
n.a.0
Photographic industry professional useprivate use
0-80100
0.00350
Civil and mechanical engineering industry industrial use 10 0.1
Area Untreated waste water (µg/l) Treated waste water (µg/l) Sludge (mg/kg dry weight)
Denmark, 38 STPs 1a - mean 0.3 / 95% percentile 0.6 mean 17 / 95% percentile 46
Denmark, 9 STPs 1b - 5% percentile 0.06 / mean 0.52 / 95% percentile 1.6 mean 12 / 95% percentile 30
Finland, 10 STPs 2a - < 0.2 – 0.73 / median < 0.2 < 2 – 13 / median 2.2 – 7.7Finland, 2 STPs 2b - 0.13 - 0.54 -Germany 3 40 < 0.1 10
Lithuania, 25 STP 4 - 0.06-1.8, not detected (<0.05) in 16 STPs 0.15-52, not detected (<0.05) in 2 STPs
Sweden, 6 STPs 5a 1.0-3.4 - -Sweden, 4 STPs 5a - 0.03-5.5 -Sweden, 16 STPs 5a - - 1.7-437Sweden, 2 STPs 5b - - 31-43Sweden, many STPs 5c - - mean 17Sweden, 19 STPs 5d - - 0.1-17 / median 2.5PNEC / limit value - 0.3 / 2.0 * 50-100 **
Table 6.9NPE emission factors in EU-15 (EU-RAR 2002b). n.a. = not available
Table 6.10Nonylphenol concentrations in waste water and sludge of STPs. Predicted No-Effect Concentration value (PNEC) in surface waters has been presented for comparison purposes.
1a Boutrup et al. 2006: sampled during 1998-2003, 211 waste water and 74 sludge samples1b Andersen et al. 2006: sampled in 2004, 4 waste water and one sludge sample from each STP2a Unpublished screening data: sampled in 2003-2004, 1-4 waste water and 1-3 sludge samples from each STP2b Nakari 2003: sampled in 19993 OSPAR 2001b: sampled in 19984 Dudutyte et al. 2007: sampled in 2006, one waste water and sludge sample / STP5a Remberger et al. 2004a: influent samples from 6 STPs in 2003, effluent samples from 4 STPs in 2004 (not from same STPs as influent samples) and sludge samples from 16 STPs in 2003-20045b Sternbeck et al. 2003: sampled in 2002, time-integrated samples from digested sludge5c Remberger et al. 2004a: Swedish national average of about 400 sludge samples in 20025d Svensson 2002: sampled in 2001-2002, one integrated sample (samples from different parts of sludge storage) from recently produced and stabilized sludge from each STP* 2008/105/EC: EU Environmental Quality Standard for chronic effects (AA-EQS, annual average value, 0.3 µg/l) and for short-term eco-toxic effects (MAC-EQS, maximum allowable concentration, 2.0 µg/l) for both inland surface waters and other surface waters (e.g. Baltic Sea)** Gawlik & Bidoglio 2004: proposal for the EU limit / guide value for sum of NP and NPE in sludge subjected to spreading into the agricultural soil
1 fraction of total amount of substance in life cycle released to waste water before any treatment (e.g. STP)2 fraction of amount of substance in life cycle released to air as direct emission of facility or plant, emission from STP to air due to volatilization is estimated to be zero* 85% of applied amount is estimated to end-up into soil

62
Area / substance Untreated waste water (µg/l) Treated waste water (µg/l) Sludge (mg/kg dry weight)
Denmark38 STPs, NP1EO 1a - mean 0.07 / 95% percentile 0.2 mean 2.8 / 95% percentile 7.438 STPs, NP2EO 1a - mean 0.05 / 95% percentile 0.1 mean 0.54 / 95% percentile 2.69 STPs, NP1EO 1b - mean 0.56 / 95% percentile 2.5 -9 STPs, NP2EO 1b - mean 0.18 / 95% percentile 0.8 -Finland10 STPs, NP1EO 2a - < 0.2 – 1.6 / median 0.28 – 1.5 3.7 – 58 / median 14 – 302 STPs, NP1EO 2b - 0.71 -2 STPs, NP2EO 2b - 0.15 – 0.69 -Lithuania
25 STPs, NP1EO 3 - 0.41 & 2.2 in 2 STPs, not detected (<0.1) in other STPs
0.40-95 in 22 STPs, not detected (<0.1) 2 STPs
25 STPs, NP2EO 3 - not detected (<0.1) 0.20-52 in 22 STPs, not detected (<0.1) 5 STPs
Sweden6 STPs NP1EO 4 <5.8 - -6 STPs, NP2EO 4 <1.0 - -4 STPs, NP1EO 4 0.003-2.5 -4 STPs, NP2EO 4 - max 0.12 -16 STPs, NP1EO 4 - - 1.6-16016 STPs, NP2EO 4 - - 0.18-18
Substance Bind to sludge Degrade in treatment Volatilize to air Reach thesurface water
NP 34% 24% 7% 35%
NPE 19.5% 45% 0
2.5% NP*25% NP1EO/NP2EO8% NPnEO (n>3)
Area / type of waste water Leachate / storm water (µg/l)
Sweden / untreated leachate of landfills 1a
median 2.6 / mean 4.1 /max 17 NPmedian 5.4 / mean 5.3 /max 15 NP1EO
Sweden / untreated leachate of 2 landfills 1b1.5-4.1 NP5.4-6.0 NP1EOmax 0.7 NP2EO
Sweden / untreated leachate of 3 landfills 1c 3.0-22 NP3.0-8.0 NP1EO
Denmark / storm water from residential area 2a 0.43-14 / mean 5.8 NP+NP1EO+NP2EODenmark / storm water from motorway 2a 0.79-15 / mean 5.6 NP+NP1EO+NP2EODenmark / storm water 2b 0.1-0.35 / mean 0.19 NP
Sweden / storm water from 2 residential areas 3a0.05-0.26 NP<0.1 NP1EO<0.03 NP2EO
Sweden / storm water from 1 industrial area 3a 0.18 NP0.06 NP2EO
Sweden / storm water from 3 industrial sites(waste sorting sites) 3b
0.2-4.5 NP0.2-14 NP1EO0.3-10 NP2EO
PNEC 0.3 NP / 2.0 NP *
Table 6.11Nonylphenol ethoxylate concentrations in waste water and sludge of STPs. NP1EO = nonylphenol monoethoxylate. NP2EO = nonylphenol diethoxylate
Table 6.12 ate of NP and NPE in aerobic waste water treatment plant based on active sludge (Simple Treat model, EU-RAR 2002b)
Table 6.13Nonylphenol and nonylphenol ethoxylate concentrations in leachate of landfills and storm water. Predicted No-Effect Concentration (PNEC) in surface waters has been presented for comparison purposes.
1a Boutrup et al. 2006: sampled during 1998-2003, 185-190 waste water samples and 54 sludge samples1b Andersen et al 2006: sampled in 2004, 4 waste water samples from each STP2a Unpublished screening data: sampled in 2003-2004, 1-4 waste water and 1-3 sludge samples from each STP, median values are measured specifically for each STP 2b Nakari 2003: sampled in June 19993 Dudutyte et al. 2007: sampled in 20064 Remberger et al. 2004a: influent samples from 6 STPs taken in 2003, effluent samples from 4 STPs in 2004 (not from same STPs as influent samples) and sludge samples from 16 STPs in 2003-2004
* NP formed due the degradation of NPE, worst case estimation
1a Harstad 2006: sampled in 20031b Junestedt, et al. 2003: sampled in 2000-2003, both time-integrated and single samples1c Paxeus 2000: sampled three times in 19962a Kjolholt et al. 1997: 6 single samples during 1995-962b Boutrup et al. 2006: sampled during 2001-20033a Remberger et al. 2004a: sampled in 20033b Junestedt, et al. 2003: sampled in 2000-2003, mainly single samples * 2008/105/EC: EU Environmental Quality Standard for chronic effects (AA-EQS, annual average value, 0.3 µg/l) and for short-term eco-toxic effects (MAC-EQS, maximum allowable concentration, 2.0 µg/l) for both inland surface waters and other surface waters (e.g. Baltic Sea)

OSPAR (2001b) concluded that NP/NPE reaches the marine environment generally via industrial wastewater from different industrial activities, e.g. the production of NP and NPE, using NP and NPE in the formulation of dif-ferent chemical products and articles and via municipal wastewater. The importance of each NP/NPE use / sector as a polluter is deter-mined by how big a share of the amount of NP/NPE used is released to the water and/or air (e.g. detergents) or incorporated in the prod-uct/process (e.g. paint). This explains why the industrial and institutional cleaning, textile and leather industries alone contribute some 65% of the total continental burden, compared to their 48% contribution to the uses. Also, NPE production itself contributes significantly to the burden. It is significant that more than 90% of the emissions are associated with the final use of NPE-based products.
Wastewater treatment plants (WWTPs)
It is likely and widely recognized that house-holds (i.e. private use) contribute to the dis-charges of alkylphenols (e.g. octyl- and nonyl-phenols and their ethoxylates) to WWTPs (e.g. water-based paints) and further discharges to the aquatic environment via WWTPs. Nonylphenol ethoxylates (as well as octylphenol ethoxylates) are assumed to degrade to large extent to octyl- and nonylphenols (Remberger et al. 2003). Additionally, households discharge these substances to the aquatic environment directly as diffuse pollution.
The measured NP and NPE levels in munici-pal wastewater and sludge in the HELCOM countries are presented in Tables 6.10 and 6.11.
Nonylphenol was one of most frequently detected substance in WWTPs’ effluent in Denmark in 2004 (Andersen et al. 2006). Nonylphenol levels have been bigger than nonylphenol ethoxylate levels in treated waste-water and sludge in Denmark (Boutrup et al. 2006).
A Finnish screening study showed that non-ylphenol levels in treated wastewater have sometimes exceeded the PNEC for chronic effects, but have never exceeded the PNEC for acute effects. Thus, nonylphenol may cause chronic effects in the Finnish aquatic environ-ment (Table 6.10).
Likewise, a Lithuanian screening study showed that nonylphenol levels in treated waste-water have sometimes exceeded the PNEC for chronic effects but have never exceeded the PNEC for acute effects (Dudutyte et al. 2007).
A Swedish screening study showed that nonylphenol levels in treated wastewater have sometimes been so high that the ecotoxicologi-cal effects on the aquatic environment are pos-sible (Swedish Environment Protection Agency 2005).
In general, NP levels in treated wastewater donot cause acute effects in recipient water, but chronic effects are possible.
The Simple Treat model showed that the overall removal of NP in WWTPs is approxi-mately 58% due to the adsorption to the sludge and biodegradation. Nevetheless, as much as 35% is expected to be released to the recipi-ent water. NP is expected to evaporate to
some extent (7%, Table 6.12). NPE is largely expected to degrade and bind to sludge in wastewater treatment based on active sludge. As a result, from the degradation of different
63
Ba
ltic
Se
a E
nvi
ron
me
nt P
roc
ee
din
gs
No
. 119
Area Sea water (µg/l)
Finland, 4 coastal waters 1 < 0.2 NP< 0.2 – 0.30 NP1EO
Lithuania, Southern Baltic Proper, harbour area 2
NP not detected (<0.05)NP1EO not detected (<0.1)NP2EO not detected (<0.1)
PNEC 0.3 NP / 2.0 NP *
Area / species Tissue typeBiota (µg/kg wet or dry weight or lipid)
Kattegat, herring Clupea harengus 1 muscle
<10 NP<20 NP1EO<10 NP2EO
Sound, flounder Platichthys flesus 1 muscle
<10 NP<20 NP1EO<10 NP2EO
PNEC -10 000 ww in prey tissue * / 8 700 ww in seafood*
Table 6.14Nonylphenol and nonylphenol ethoxylate concentrations in water of Baltic Sea. Predicted No-Effect Concentration value (PNEC) has been presented for comparison purposes.
Table 6.15Nonylphenol and nonylphenol ethoxylate concentrations in biota of Baltic Sea. Predicted No-Effect Concentration (PNEC) has been presented for comparison purposes.
1 Unpublished screening data: sampling during 2003-2004, single samples2 Dudutyte et al. 2007: one harbour site sampled in 2006* 2008/105/EC: EU Environmental Quality Standard for chronic effects (AA-EQS, annual average value, 0.3 µg/l) and for short-term eco-toxic effects (MAC-EQS, maximum allowable concentration, 2.0 µg/l) for both inland surface waters and other surface waters (e.g. Baltic Sea)
1 Remberger et al. 2004a: 1 coastal background site in Kattegat (3 herrings which were not pooled) and one urban coastal site in Sound (1 flounder), sampling in 2002* WFD - EAF 2005b: estimated PNEC for protection of predators such as mammals and predatory birds via secondary poisoning expressed as concentration in prey tissue (10 000 µg/kg ww) and PNEC for human health via food uptake expressed as concentration in seafood (8 700 µg/kg ww)

NPE, different degradation products (NP1EO and NP2EO as dominating) will occur in waste-water also reaching the recipient water (Table 6.12).
In general, the ranking of nonylphenol and nonylphenol ethoxylates (NP1EO and NP2EO), according to the concentration in treated munic-ipal wastewater and sludge, gives the following order: NP > NP1EO > NP2EO (Table 6.10).
Landfills and storm water
The NP concentrations are similar in landfill leachate and in sewage effluents in Sweden, and often exceed the PNEC for both acute and chronic effects (Table 6.13). Altough the flow rate for landfill leachate is generally smaller than for sewage water, the landfills can have a significant effect on the recipient water.
The most recent study on NP concentra-tions in residential storm water shows that NP concentrations in storm water from residential areas seldom exceed the PNEC for acute and chronic effects. Nevertheless, the NP concen-trations in storm water from waste sorting sites exceed the PNEC for both acute and chronic effects (Table 6.13).
NPnEO and its degradation product NP were identified in airport runoff (storm water) and in recipient stream water in the USA. This was due to use of NPnEO in aircraft deicing and antiicing fluid formulations in the USA. It was estimated that NP was formed via the degrada-tion of NPnEO in runoff and recipient surface water (Corsi et al. 2003).
6.3 Concentrations in biota,sediment and water of Baltic Sea
According to this study, the following HELCOM Contracting Parties have not meas-ured NP or NPE in biota, sediment or water of the Baltic Sea:
- Estonia- Germany- Latvia- Poland- Russia (no reply to Questionnaire)
With regard to the PBT assessment, NP is very toxic to aquatic organisms (fulfills the T criterion). Additionally, both NP and NPE pose estrogenic effects on aquatic organisms (EU-RAR 2002b). The relevant information on the physical-chemical, ecotoxicological and envi-ronmental properties (e.g. degradation in water or sediment) of NP can be found from the EU risk assessment (EU-RAR 2002b).
In Denmark, nonylphenol levels in sediment were higher in the Belt Sea and Århus Bay than in Kattegat (open sea area) in 2003. It was also observed that the bigger the organic content
Area Sediment (µg/kg dry weight)Denmark, 5 coastal and open sea sediments 1
max 60-280 / median 15-100 NP
Southern Baltic Proper, 4 Lithuanian coastal sediments
2
129 NP at one site, not detected (<50) at other sitesNP1EO not detected (<100)NP2EO not detected (<100)
Sweden, 16 open sea sediments 3a
<3-65 NP,not detected at 10 sites
Sweden, 1 coastal harbour sediment 3b
560 NP300 NP1EO240 NP2EO
Northern Baltic Proper, 14 Swedish coastal sediments 3c
<20-380 NP,not detected at 4 sites
PNEC 180 NP *
Substance Sources of discharges to aquatic environment
Sources of emissions to atmosphere
NP * use of NPE-based products (via degradation)* sewage treatment plants (STPs)* landfills* storm water at least from waste sorting sites
* not considered important
NPE * industrial waste water from - pulp and paper industry 1
- paint industry (production of paints)- production (and use) of detergents and cleaning agents 1
- metal working industry 1
- textile and leather industry 1
- photographic industry- civil and mechanical engineering industry* air transport (anti-icing use)* agriculture (pesticide use) 1
* sewage treatment plants (STPs)* landfills* storm water at least from waste sorting sites
* not considered important
Table 6.16Nonylphenol and nonylphenol ethoxylate concentrations in sediment of Baltic Sea. Predicted No-Effect Concentration (PNEC) has been presented for comparison purposes.
Table 6.17Relevant sources of NP and NPE discharges and emissions. The industrial sector or professional use has been identified as a relevant source if the emission factor is relatively high or if it has been identified as risk use in national or EU risk assessments. The significance of other activities (e.g. STPs and landfills) has been evaluated on the basis of measured effluent concentrations. It should be noted that all below mentioned sectors may not be relevant in all HELCOM countries and these should be identified at national level (e.g. within national programs under the HELCOM BSAP).
1 Boutrup et al. 2006: sediments (Baltic Sea area) sampled in 2003, areas of sedimentation rate 1-2 mm/year and sample represent the 5-10 years sedimentation that is corresponding about 0-1 cm surface layer of sediment2 Dudutyte et al. 2007: 4 Lithuanian sediments from Klaipeda port area in 2006, 0-2 cm surface layer of sediment3a Cato 2005: 16 open sea sediment sites from Skagerrak to Bothnian Bay in 2003, 0-1 cm surface layer of sediment3b Remberger et al. 2004a: sampled in 2003, 0-2 cm surface layer of sediment3c Sternbeck et al. 2003: sampling (water depth 30-78 m except one site 2 m) in 2002, 0-2 cm surface layer of sediment* WFD-EAF 2005b: estimated PNEC for benthic community based on equilibrium partitioning method (no eco-toxicological data available for sediment dwelling organisms), expressed as concentration in sediment
64
1 Use banned (as a substance or constituent of preparations at concentration >0.1% by mass) in EU since Jan 2005 (2003/53/EC)
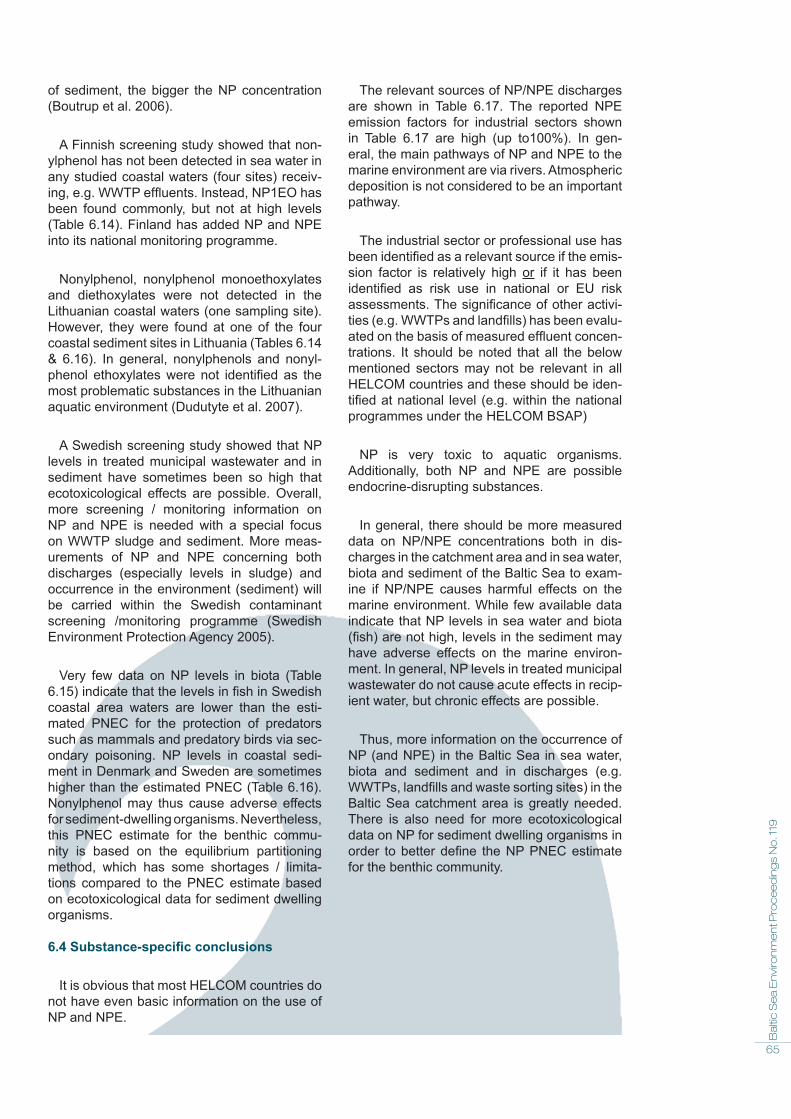
65
Ba
ltic
Se
a E
nvi
ron
me
nt P
roc
ee
din
gs
No
. 119
of sediment, the bigger the NP concentration (Boutrup et al. 2006).
A Finnish screening study showed that non-ylphenol has not been detected in sea water in any studied coastal waters (four sites) receiv-ing, e.g. WWTP effl uents. Instead, NP1EO has been found commonly, but not at high levels (Table 6.14). Finland has added NP and NPE into its national monitoring programme.
Nonylphenol, nonylphenol monoethoxylates and diethoxylates were not detected in the Lithuanian coastal waters (one sampling site). However, they were found at one of the four coastal sediment sites in Lithuania (Tables 6.14 & 6.16). In general, nonylphenols and nonyl-phenol ethoxylates were not identifi ed as the most problematic substances in the Lithuanian aquatic environment (Dudutyte et al. 2007).
A Swedish screening study showed that NP levels in treated municipal wastewater and in sediment have sometimes been so high that ecotoxicological effects are possible. Overall, more screening / monitoring information on NP and NPE is needed with a special focus on WWTP sludge and sediment. More meas-urements of NP and NPE concerning both discharges (especially levels in sludge) and occurrence in the environment (sediment) will be carried within the Swedish contaminant screening /monitoring programme (Swedish Environment Protection Agency 2005).
Very few data on NP levels in biota (Table 6.15) indicate that the levels in fi sh in Swedish coastal area waters are lower than the esti-mated PNEC for the protection of predators such as mammals and predatory birds via sec-ondary poisoning. NP levels in coastal sedi-ment in Denmark and Sweden are sometimes higher than the estimated PNEC (Table 6.16). Nonylphenol may thus cause adverse effects for sediment-dwelling organisms. Nevertheless, this PNEC estimate for the benthic commu-nity is based on the equilibrium partitioning method, which has some shortages / limita-tions compared to the PNEC estimate based on ecotoxicological data for sediment dwelling organisms.
6.4 Substance-specifi c conclusions
It is obvious that most HELCOM countries do not have even basic information on the use of NP and NPE.
The relevant sources of NP/NPE discharges are shown in Table 6.17. The reported NPE emission factors for industrial sectors shown in Table 6.17 are high (up to100%). In gen-eral, the main pathways of NP and NPE to the marine environment are via rivers. Atmospheric deposition is not considered to be an important pathway.
The industrial sector or professional use has been identifi ed as a relevant source if the emis-sion factor is relatively high or if it has been identifi ed as risk use in national or EU risk assessments. The signifi cance of other activi-ties (e.g. WWTPs and landfi lls) has been evalu-ated on the basis of measured effl uent concen-trations. It should be noted that all the below mentioned sectors may not be relevant in all HELCOM countries and these should be iden-tifi ed at national level (e.g. within the national programmes under the HELCOM BSAP)
NP is very toxic to aquatic organisms. Additionally, both NP and NPE are possible endocrine-disrupting substances.
In general, there should be more measured data on NP/NPE concentrations both in dis-charges in the catchment area and in sea water, biota and sediment of the Baltic Sea to exam-ine if NP/NPE causes harmful effects on the marine environment. While few available data indicate that NP levels in sea water and biota (fi sh) are not high, levels in the sediment may have adverse effects on the marine environ-ment. In general, NP levels in treated municipal wastewater do not cause acute effects in recip-ient water, but chronic effects are possible.
Thus, more information on the occurrence of NP (and NPE) in the Baltic Sea in sea water, biota and sediment and in discharges (e.g. WWTPs, landfi lls and waste sorting sites) in the Baltic Sea catchment area is greatly needed. There is also need for more ecotoxicological data on NP for sediment dwelling organisms in order to better defi ne the NP PNEC estimate for the benthic community.

66
Country Use (ton) Remarks2000 2001 2002 2003 2004 2005
Denmark NI NI NI NI NI NIEstonia NI NI NI NI NI NI
Finland NI 0 0 0 0 0National Product Register of Chemicals
Germany NI NI NI NI NI NIUse exist but not specifi ed, No production
Latvia NI NI NI NI NI Not produced or imported
National Chemicals Data Base
Lithuania NI NI NI NI NI NIPoland NI NI NI NI NI NI
Russia NI NI NI NI NI NI No reply to questionnaire
Sweden 5.1 3.4 11 6.9 3.9 5.8
CAS 140-66-9, National Product Register of Chemicals
7 Octylphenols (OP)and octylphenol ethoxylates (OPE)
Octylphenol has been identifi ed as a priority substance under EQS Directive (2008/105/EC).
The term ‘octylphenol’ represents a large number of isomeric compounds of the gen-eral formula C8H17C6H4(OH). The octyl group (C8H17) may be branched in a variety of ways or be a straight chain and may be located at either the 2-, 3- or 4-position of the benzene ring. Of these potential isomers, 4-tertoctylphe-nol (CAS No. 140-66-9) is commercially the most important (OSPAR 2003).
The OP and OPE compounds indicated in the HELCOM questionnaire sent to the Contracting Parties in 2006 are presented in Table 7.1.
Additionally, Sweden reported on OPE with CAS number 9063-89-2 and Finland on OPEs with CAS number 9004-87-9 and 9063-89-2.
7.1 Production and use
The usage information of OP in the HELCOM Contracting Parties is presented in Tables 7.2 and 7.3 and in the EU in Table 7.4.
OP has been used, at least in Germany and Sweden, during 2000–2005 (Table 7.3). OP has been used, for example, in the rubber and plastics industry (Table 7.2). Estimates on the amounts of used OP during 2000–2005 are available only from Finland and Sweden.
According to the OSPAR assessment (OSPAR 2003), OP production was around 23,000 tonnes in 2001, export 150 tonnes and import 375 tonnes in the EU-15 in 2001. The total use of OP in the EU-15 in 2001 was some 23,000 tonnes.
The main use of OP is as an intermediate in the production of phenol/formaldehyde resins (around 22 500 tonnes, 98% of total use). It is also used as an intermediate in the manufac-ture of OPEs (around 22 500 tonnes, 2% of total use) in the EU-15 in 2001. A small amount of OPEs is used to produce ether sulphates. The end uses from the manufacture of OP resins, OPEs and ether sulphates are various such as rubber tyres and textiles/leather (Tables 7.4
Table 7.1Indicative OP and OPE compounds
Table 7.2Uses of OP in HELCOM countries during years 2000-2005
Table 7.3Total amount of use for OP in HELCOM countries during 2000-2005(NI = no information received)
Compound CAS numberOctylphenols (OP)- Octylphenols- Para-tert-octylphenol- Octylphenol
1806-26-4140-66-967554-50-1, 27193-28-8
Octylphenol ethoxylates (OPE) 9002-93-1, 9036-19-5
Type of business and/or mode of application
HELCOM country of confi rmed use Remarks
TyresGermany (and probably in whole EU)
Rubber and plastics industry – raw material for chemical synthesis
Sweden Year 2000

67
Ba
ltic
Se
a E
nvi
ron
me
nt P
roc
ee
din
gs
No
. 119
and 7.7). Based on different assumptions (no direct measurements), it has been estimated that OP may be present as an impurity in com-mercial-grade nonylphenol at a concentration up to 10% although it is typically 3–5% (OSPAR 2003); however, a more recent Swedish survey (Remberger et al. 2004a) found that the OP level was <0.004% in the technical (i.e. com-mercial) grade of nonylphenol products thus contradicting the OSPAR conclusion.
A very high proportion (up to 98%) of the octylphenol resin manufactured is used in rub-ber compounding for tyre manufacture in the EU. Resins are reported to be added to rubber at concentrations of up to 10%, which results in a maximum concentration in tyres of 0.3%. OP resins in printing inks enable toxic aromatic sol-vents to be replaced by far less toxic aliphatic alternatives. The inks are manufactured in high temperature processes where the resins are reacted with other resins, oils, etc., thus leav-ing no significant trace of free octylphenol, and are then diluted in ink solvents and pigmented. No substitutes to alkylphenolic resins are cur-rently available for this use. OP resins are used
as an emulsifier in the separation of oil from water on offshore production platforms, where they are added in very small amounts (as low as a few parts per million) to the produced oil/water emulsions (OSPAR 2003).
A Swedish study (Remberger et al. 2004a) pointed out that there is very limited informa-tion on the Swedish use of OP and OPE; how-ever, the situation is probably similar in other HELCOM countries, see Tables 7.2 and 7.3.
The usage information of OPE in the HELCOM Contracting Parties is presented in Tables 7.5 and 7.6 and in the EU in Table 7.7.
OPE has been used at least in Denmark, Finland, Latvia, Lithuania and Sweden dur-ing 2000–2005 (Table 7.6). OPE has been used, for example, in the manufacture of pho-tographic chemical material and glass fibres, and in the rubber and plastics industries (Table 7.5). Estimates on the amounts of used OPE during 2000–2005 are available from Denmark, Finland, Latvia, Lithuania and Sweden.
Type of business and/or mode of application HELCOM country of confirmed use Remarks
Paints, lacquers and varnishes Denmark Year 2002Surface treatment Denmark Year 2002Manufacture of photographic chemical material / photochemical / stabiliser and developer in developing photos Finland Main use, year 2004
Industrial cleaning - surface-active agent in cleaning preparations used e.g. in service of motor vehicles, compressors and other industrial cleaning Finland Year 2004
Plastic industry - adhesive and glue in manufacture of plastic products Finland Year 2004Metal industry - water based emulsion for removing of testing solution Finland Year 2004Manufacture of glass fibres Latvia Main use, year 2005Wholesale of other household goods Latvia Year 2005NACE 52.48 - Other retail sale in specialized stores Latvia Year 2005
Manufacture of pharmaceutical preparations / Industrial chemical Lithuania Year 2003, CAS number 9002-93-1
Rubber and plastics industry Sweden Main use, year 2000
Mode of application Amount used (tons/year) and share of total amount used
Production of OP resins – raw material * 22498 (98%)Rubber industry – OP resins are used as tackifier in rubber for tyres * 18 458 (81%)Electronic industry – OP resins are used as electrical insulating varnishes for secondary insulation of electric windings (e.g. in motors and transformers) to improve insulation and to bond windings together
2 000 (9%)
Inks – OP resins are used as in printing ink formulations for most modern printing processes * 1 000 (4%)Oil industry – OPE resins (but contain low residues of OP) are used as emulsifier in separating water from oil in oil recovery on offshore production platforms 200 (1%)
Other uses- Paper industry - OP resins are used as paper coating *- Metal industry - OP resins are used in foundries (further use information not available)- Special paints in marine applications - OP resins are used because of they provide high resistance to saline waters
800 (3%)
Production of OPE – raw material * 440 (2%)Total use 22 898Veterinary medicine (identified use in United Kingdom) ** Not known
Table 7.4Use of OP in EU-15 in 2001 (OSPAR 2003)
Table 7.5Uses of OPE in HELCOM countries during years 2000-2005
* classified as Category 1 source / pathway: may contribute to potential failure of WFD objectives (WFD-EAF 2004d)** UK-EPA 2005, use not identified in OSPAR (2003) and EU (WFD-EAF 2004d) assessments
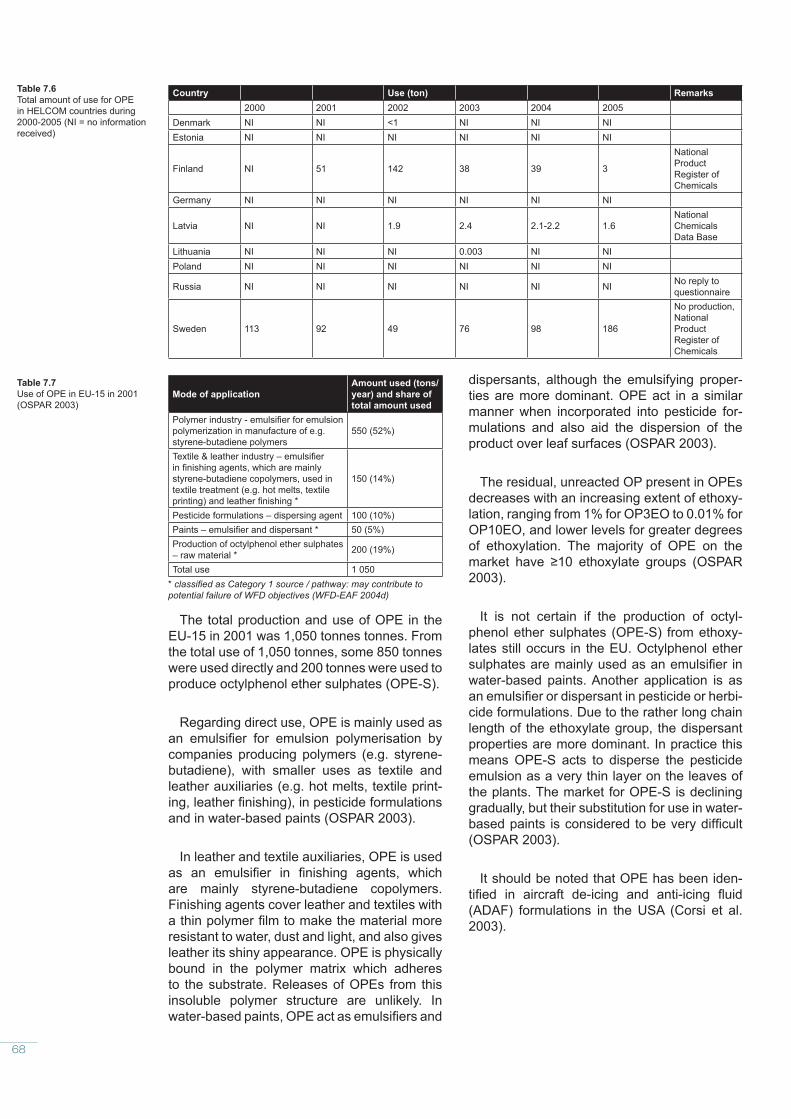
68
The total production and use of OPE in the EU-15 in 2001 was 1,050 tonnes tonnes. From the total use of 1,050 tonnes, some 850 tonnes were used directly and 200 tonnes were used to produce octylphenol ether sulphates (OPE-S).
Regarding direct use, OPE is mainly used as an emulsifier for emulsion polymerisation by companies producing polymers (e.g. styrene-butadiene), with smaller uses as textile and leather auxiliaries (e.g. hot melts, textile print-ing, leather finishing), in pesticide formulations and in water-based paints (OSPAR 2003).
In leather and textile auxiliaries, OPE is used as an emulsifier in finishing agents, which are mainly styrene-butadiene copolymers. Finishing agents cover leather and textiles with a thin polymer film to make the material more resistant to water, dust and light, and also gives leather its shiny appearance. OPE is physically bound in the polymer matrix which adheres to the substrate. Releases of OPEs from this insoluble polymer structure are unlikely. In water-based paints, OPE act as emulsifiers and
dispersants, although the emulsifying proper-ties are more dominant. OPE act in a similar manner when incorporated into pesticide for-mulations and also aid the dispersion of the product over leaf surfaces (OSPAR 2003).
The residual, unreacted OP present in OPEs decreases with an increasing extent of ethoxy-lation, ranging from 1% for OP3EO to 0.01% for OP10EO, and lower levels for greater degrees of ethoxylation. The majority of OPE on the market have ≥10 ethoxylate groups (OSPAR 2003).
It is not certain if the production of octyl-phenol ether sulphates (OPE-S) from ethoxy-lates still occurs in the EU. Octylphenol ether sulphates are mainly used as an emulsifier in water-based paints. Another application is as an emulsifier or dispersant in pesticide or herbi-cide formulations. Due to the rather long chain length of the ethoxylate group, the dispersant properties are more dominant. In practice this means OPE-S acts to disperse the pesticide emulsion as a very thin layer on the leaves of the plants. The market for OPE-S is declining gradually, but their substitution for use in water-based paints is considered to be very difficult (OSPAR 2003).
It should be noted that OPE has been iden-tified in aircraft de-icing and anti-icing fluid (ADAF) formulations in the USA (Corsi et al. 2003).
Country Use (ton) Remarks2000 2001 2002 2003 2004 2005
Denmark NI NI <1 NI NI NIEstonia NI NI NI NI NI NI
Finland NI 51 142 38 39 3
National Product Register of Chemicals
Germany NI NI NI NI NI NI
Latvia NI NI 1.9 2.4 2.1-2.2 1.6National Chemicals Data Base
Lithuania NI NI NI 0.003 NI NIPoland NI NI NI NI NI NI
Russia NI NI NI NI NI NI No reply to questionnaire
Sweden 113 92 49 76 98 186
No production, National Product Register of Chemicals
Mode of applicationAmount used (tons/year) and share of total amount used
Polymer industry - emulsifier for emulsion polymerization in manufacture of e.g. styrene-butadiene polymers
550 (52%)
Textile & leather industry – emulsifier in finishing agents, which are mainly styrene-butadiene copolymers, used in textile treatment (e.g. hot melts, textile printing) and leather finishing *
150 (14%)
Pesticide formulations – dispersing agent 100 (10%)Paints – emulsifier and dispersant * 50 (5%)Production of octylphenol ether sulphates – raw material * 200 (19%)
Total use 1 050
Table 7.6Total amount of use for OPE in HELCOM countries during 2000-2005 (NI = no information received)
Table 7.7Use of OPE in EU-15 in 2001 (OSPAR 2003)
* classified as Category 1 source / pathway: may contribute to potential failure of WFD objectives (WFD-EAF 2004d)

69
Ba
ltic
Se
a E
nvi
ron
me
nt P
roc
ee
din
gs
No
. 119
Area Untreated waste water (µg/l) Treated waste water (µg/l) Sludge (mg/kg dry weight)
Denmark, 38 STPs 1 - OP detected only in one of 191 samples
OP detected in 20 of 45 samples mean 0.049 OP95% percentile 0.35 OP
Finland, 10 STPs 2 - < 0.2 – 0.53 OPmedian < 0.2 OP
< 2 – 2.7 OPmedian < 2 OP
Lithuania, 25 STPs 3 -
0.02-0.12 OP at 7 STPs, not detected (<0.01) at other STPs0.02 OP1EO at one STP, not detected (<0.01) at other STPs0.01 OP2EO at one STP, not detected (<0.01) at other STPs
0.017-1.1 OP at 20 STPs, not detected (<0.01) at other STPs0.030-0.34 OP1EO at 11 STPs, not detected (<0.01) at other STPs0.015-0.088 OP2EO at 4 STPs, not detected (<0.01) at other STPs
Sweden, 6 STPs 4a0.03-0.16 OP0.057-0.096 OP1EO<0.01-0.089 OP2EO
- -
Sweden, 4 STPs 4a -0.005-0.22 OP<0.0003-0.056 OP1EO0.00093-0.01 OP2EO
-
Sweden, 16 STPs 4a - -0.08-8.7 OPOP1EO detected in 6 of 16 STPs: 0.17-5.0OP2EO detected in 12 of 16 STPs: 0.003-0.54
Sweden, 2 STPs 4b - - 0.78-0.96 OPSweden, 19 STPs 4c - - 0.004-0.52 / median 0.15 OPPNEC - 0.01 OP and 0.1 OP * not available
Table 7.8OP and OPE concentrations in waste water and sludge of STPs. Predicted No-Effect Concentration value (PNEC) in surface water has been presented for comparison purposes.
1 Boutrup et al. 2006: sampled during 1998-2003, 191 one waste water and 45 sludge samples2 Unpublished screening data: sampled during 2003-2004, 1-4 waste water and 1-3 sludge samples from each STP 3 Dudutyte et al. 2007: sampled in 2006, single samples4a Remberger et al. 2004a: influent samples taken from 6 STPs in 2003, effluent samples from 4 STPs in 2004 (not from same STPs as influent samples) and sludge samples from 16 STPs in 2003-20044b Sternbeck et al. 2003: sampled in 2002, time-integrated samples from digested sludge4c Svensson 2002: sampled in 2001-2002, one integrated sample (samples from different parts of sludge storage) from recently produced and stabilized sludge from each STP* 2008/105/EC: EU Environmental Quality Standard for chronic effects (AA-EQS, annual average value) for both inland surface waters (0.1 µg/l OP) and other surface waters such as Baltic Sea (0.01 µg/l OP), MAC-EQS for short-term eco-toxic effects not applicable
7.2 Discharges, emissionsand losses to environment
According to this study, the follow-ing HELCOM Contracting Parties have not measured OP or OPE in discharges, emissions or losses to the environment:
- Estonia- Germany- Latvia- Poland- Russia (no reply to Questionnaire)
The sectoral emission factors for OP and OPE have not been identified.
A Swedish study (Remberger et al. 2004a) found that due to a lack of information, it is not possible to produce even a qualitative emission assessment concerning Sweden. Nevertheless, it was noted that OP and OPE emissions do occur as a result of certain indus-trial activities and/or waste disposal. The occur-rence of OP in chemical products and goods used in households is also poorly known. Thus, the likelihood of diffuse emissions caused by households cannot be estimated. It is very probable that there are very few data and infor-mation on emissions and discharges of OP and
OPE also in the other HELCOM countries. The survey (Remberger et al. 2004a) found that the OP level in technical (i.e. commercial) grades of nonylphenol is insignificant (<0.004%), con-tradicting the OSPAR conclusion.
The OSPAR (2003) report concluded that octylphenol is likely to reach the marine envi-ronment via one main route - industrial waste-waters from different land-based industrial activities where it is used as an intermediate. Other likely pathways are the use of OP resins, the breakdown of OPE to OP and the signifi-cant presence of OP as an impurity in com-mercially produced nonylphenol. A possible pathway to the marine environment based on older reported uses is discharge waters from offshore production facilities. However, there are no current data which indicate that this is still a significant route because OP is not used by the offshore industry. It is also probable that atmospheric concentrations will be extremely low and OP is unlikely to be transported a long distance from its point emission source.
Wastewater treatment plants (WWTPs)
The measured OP levels in municipal waste-water and sludge in the HELCOM countries have been presented in Table 7.8.

70
Octylphenol was only detected in one out of 191 samples for WWTP effluent and also found at relatively low levels in sludge of WWTPs in Denmark during 1998–2003. OP levels have been bigger than OPE levels in treated wastewater and sludge in Denmark (Table 7.8, Boutrup et al. 2006).
A Finnish screening study showed that OP levels in treated wastewater have sometimes exceeded the PNEC for both chronic and acute effects. Thus, OP may cause acute and chronic effects in the Finnish aquatic environment (Table 7.8).
Likewise, a Lithuanian screening study showed that OP levels in treated wastewater have sometimes exceeded the PNEC for both chronic and acute effects. Thus, OP may cause acute and chronic effects in the Lithuanian aquatic environment. Additionally, OP levels have been somewhat bigger than OPE levels in treated wastewater and sludge in Lithuania (Table 7.8).
A Swedish screening study showed that OP levels in treated wastewater do sometimes exceed the PNEC for both chronic and acute effects. Thus, OP may cause acute and chronic effects in the Swedish aquatic environment (Table 7.8).
In general, the measured OP levels in treated municipal wastewater may cause both acute and chronic effects in recipient waters.
In general, the ranking of octylphenol (OP) and octylphenol ethoxylates (OP1EO and OP2EO) according to the concentration in treated municipal wastewater and sludge gives the following order: OP > OP1EO > OP2EO (Table 7.8). The order is similar with nonyl-phenol and nonylphenol ethoxylates (see the chapter/section on Nonylphenol).
It is likely, and widely recognized, that house-holds (i.e. private use) contribute with discharges of alkylphenols (e.g. octyl- and nonylphenols and their ethoxylates) to WWTPs (e.g. water-based paints) and further discharges to the aquatic environment via WWTPs. Octylphenol ethoxylates are assumed to degrade to a large extent to octylphenols (Remberger et al. 2003). Additionally, households discharge these sub-stances to the aquatic environment directly as diffuse pollution.
Landfills and storm water
The only study on OP in landfill leachate shows that OP concentrations exceed the PNEC for chronic effects (Table 7.9).
Only few available studies on OP in storm water show that OP concentrations in storm water from waste sorting sites (but not from residential area) exceed the PNEC for chronic effects (Table 7.9).
Area / species Tissue type
Biota(µg/kg wet or dry weight or lipid)
Kattegat, herring Clupea harengus 1 muscle
OP not detected (<0.5 ww)OP1EO not detected (<2 ww)OP2EO not detected (<2 ww)
Sound, flounder Platichthys flesus 1 muscle
OP not detected (<0.3 ww)OP1EO not detected (<2 ww)OP2EO not detected (<2 ww)
PNEC - 1 000 OP ww in prey tissue *
Area / type of waste water Leachate / storm water (µg/l)
Sweden / untreated leachate of 2 landfills 1a
max 0.3 OP0.04-0.2 OP1EOOP2EO not detected
Sweden / storm water from 2 residential areas 1b
0.003-0.007 OP0.002-0.01 OP1EO0.001-0.003 OP2EO
Sweden / storm water from 1 industrial area 1b
0.011 OP<0.004 OP1EO0.006 OP2EO
Sweden / storm water from 3 industrial sites (waste sorting sites) 1c
0.06-0.7 OP0.2-1.4 OP1EOmax 0.7 OP2EO
PNEC 0.01 OP and 0.1 OP *
Table 7.9OP and OPE concentrations in leachate of landfills and storm water. Predicted No-Effect Concentration (PNEC) in surface waters has been presented for comparison purposes.
Area Sea water (µg/l)Finland, four coastal surface waters 1 OP not detected (<0.2)
Lithuania, Southern Baltic Proper, harbour area 2
OP not detected (<0.01)OP1EO not detected (<0.01)OP2EO not detected (<0.01)
PNEC 0.01 and 0.1 *
Table 7.10OP and OPE concentrations in water of Baltic Sea. Predicted No-Effect Concentration value (PNEC) has been presented for comparison purposes.
Table 7.11OP and OPE levels in biota of the Baltic Sea. Predicted No-Effect Concentration (PNEC) has been presented for comparison purposes.
1a Junestedt, et al. 2003: sampled in 2000-2003, both time-integrated and single samples1b Remberger et al. 2004a: sampled in 20031c Junestedt, et al. 2003: sampled in 2000-2003, mainly single samples * 2008/105/EC: EU Environmental Quality Standard for chronic effects (AA-EQS, annual average value) for both inland surface waters (0.1 µg/l OP) and other surface waters such as Baltic Sea (0.01 µg/l OP), MAC-EQS for short-term eco-toxic effects not applicable
1 Unpublished screening data: single samples during 2003-20042 Dudutyte et al. 2007: one harbour site sampled in 2006* 2008/105/EC: EU Environmental Quality Standard for chronic effects (AA-EQS, annual average value) for both inland surface waters (0.1 µg/l OP) and other surface waters such as Baltic Sea (0.01 µg/l OP), MAC-EQS for short-term eco-toxic effects not applicable
1 Remberger et al. 2004a: 1 coastal background site in Kattegat (3 herrings which were not pooled) and one urban coastal site in Sound (1 flounder), sampling in 2002* WFD-EAF 2004e: estimated PNEC for protection of predators such as mammals and predatory birds via secondary poisoning expressed as concentration in prey tissue

71
Ba
ltic
Se
a E
nvi
ron
me
nt P
roc
ee
din
gs
No
. 119
7.3 Concentrations in biota,sediment and water of Baltic Sea
According to this study, the following HELCOM Contracting Parties have not measured OP or OPE in biota, sediment or water of the Baltic Sea:
- Denmark- Estonia- Germany- Latvia- Poland- Russia (no reply to Questionnaire)
Octylphenol is very toxic to aquatic organ-isms, not easily degraded in the environment, and has the potential to cause significant endo-crine disruption effects (OSPAR 2003).
The atmospheric long-range transport of OP and OPE is unlikely, based on environmen-tal partitioning modelling (Remberger et al. 2004a).
A Finnish screening study showed that octyl-phenol and octylphenol ethoxylates were not detected in any studied coastal waters (four sites) receiving, e.g. WWTP effluents (Table 7.10).
Octylphenol, octylphenol monoethoxylates and diethoxylates were not detected in coastal waters (one sampling site) and sediments (four sampling sites) in Lithuania (Tables 7.10 & 7.12, Dudutyte et al. 2007).
A Swedish screening study showed that OP and OPE occur commonly in the Swedish envi-ronment and more information on the levels of OP and OPE is needed with a special focus on WWTP sludge and sediment. More meas-urements of OP and OPE, concerning both discharges (especially levels in sludge) and occurrence in the environment (sediment), will be carried out within the Swedish contaminant screening /monitoring programme (Swedish Environment Protection Agency 2005).
Very few measured data on OP and OPE levels in biota (Table 7.11) indicate that levels are lower than the detection limit and that the levels in fish in the Swedish coastal areas are lower than the estimated PNEC for the protec-tion of predators, such as mammals and preda-tory birds, via secondary poisoning.
The OP levels in some Swedish coastal sedi-ments are higher than the estimated PNEC (Table 7.12). Thus, OP may cause adverse effects for sediment dwelling organisms. Nevertheless, this PNEC estimate for the ben-thic community is based on the equilibrium par-titioning method, which has some shortages / limitations compared to PNEC estimate based on ecotoxicological data for sediment dwelling organisms.
Area Sediment (µg/kg dry weight)
Southern Baltic Proper, 4 Lithuanian coastal sediments 1a
OP not detected (<10)OP1EO not detected (<10)OP2EO not detected (<10)
Southern Baltic Proper, 2 Lithuanian coastal sediments 1b OP not detected (<5)
Sweden, 16 open sea sediments 2a
<3-110 OP, not detected at 6 sites
Sweden, 1 coastal harbour sediment 2b
43 OP<0.8 OP1EO9.0 OP2EO
Northern Baltic Proper, 14 Swedish coastal sediments 2c
<1-9.1 OP, not detected at 7 sites
PNEC 17 OP *
Table 7.12OP and OPE levels in sediment of Baltic Sea. Predicted No-Effect Concentration (PNEC) has been presented for comparison purposes.
1a Dudutyte et al. 2007: 4 Lithuanian sediments from Klaipeda port area in 2006, 0-2 cm surface layer of sediment1b Finnish Institute of Marine Research (FIMR), 2007. Evaluation of the environmental state of the sea area in the Lithuanian territorial waters and economic zone adjacent to the Russian oil platform D-6. Project report. Helsinki.2a Cato 2005: 16 open sea sediment sites from Skagerrak to Bothnian Bay in 2003, 0-1 cm surface layer of sediment2b Remberger et al. 2004a: sampled in 2003, 0-2 cm surface layer of sediment2c Sternbeck et al. 2003: sampling (water depth 30-78 m except one site 2 m) in 2002, 0-2 cm surface layer of sediment* WFD-EAF 2004e: estimated PNEC for benthic community based on equilibrium partitioning method (no eco-toxicological data available for sediment dwelling organisms), expressed as concentration in sediment
Substance
Sources of discharges to aquatic environment
Sources of emissions to atmosphere
OP
* use of OPE products (via degradation)* industrial wastewater possibly 1
* sewage treatment plants (STPs)* landfills* storm water at least from waste sorting sites
not considered important
OPE
* industrial waste water possibly 1
* sewage treatment plants (STPs)* landfills* storm water at least from waste sorting sites
not considered important
Table 7.13Relevant sources of OP and OPE discharges and emissions. The industrial sector or professional use has been identified as a relevant source if it has been identified as risk use in national or EU risk assessments. The significance of other activities (e.g. STPs and landfills) has been evaluated on the basis of measured effluent concentrations. It should be noted that all below mentioned sectors may not be relevant in all HELCOM countries and these should be identified at national level (e.g. within national programs under the HELCOM BSAP).
1 the more accurate sectoral identification is not possible due to lack of information

72
7.4 Substance-specifi c conclusions
It is evident that several HELCOM countries do not have information on the use of OP and OPE.
Due to the lack of information e.g. on emis-sion factors, it is not possible to produce even qualitative emission assessment. Nevertheless, it was noted that OP and OPE emissions do occur as a result of certain industrial activities and/or waste disposal. The likelihood of diffuse emissions caused by households cannot be estimated. The relevant sources of OP/OPE discharges are shown in Table 7.13.
Octylphenol is very toxic to aquatic organ-isms and it is not easily degraded in the envi-ronment. Additionally, OP is a possible endo-crine-disrupting substance.
In general, there should be more measured data on OP/OPE levels both in discharges in
the catchment area, and in sea water, biota and sediment of the Baltic Sea to examine if OP/OPE causes harmful effects on the marine environment. While few available data indicate that the OP levels in biota (fi sh) are not high, the levels in the sediment may have adverse effects on the Baltic marine environment. In general, the measured OP levels in treated municipal wastewater may cause both acute and chronic effects in recipient waters.
Thus, information on both the occurrence of OP (and OPE) in the in sea water , biota and sediment of the Baltic Sea and its presence in discharges (e.g. WWTPs, landfi lls and waste sorting sites) in the Baltic Sea catchment area is greatly needed.
There is also need for ecotoxicological data on sediment dwelling organisms in order to better defi ne the OP PNEC estimate for the benthic community.
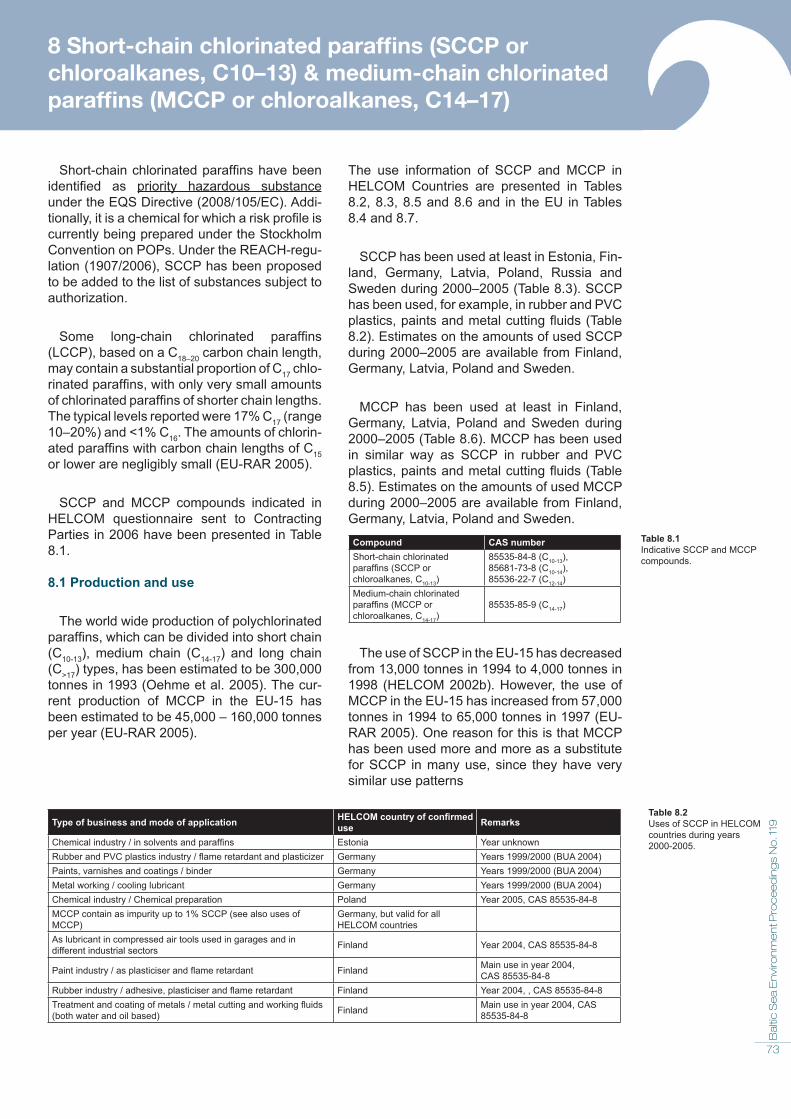
73
Ba
ltic
Se
a E
nvi
ron
me
nt P
roc
ee
din
gs
No
. 119
8 Short-chain chlorinated paraffi ns (SCCP or chloroalkanes, C10–13) & medium-chain chlorinated paraffi ns (MCCP or chloroalkanes, C14–17)
Short-chain chlorinated paraffi ns have been identifi ed as priority hazardous substance under the EQS Directive (2008/105/EC). Addi-tionally, it is a chemical for which a risk profi le is currently being prepared under the Stockholm Convention on POPs. Under the REACH-regu-lation (1907/2006), SCCP has been proposed to be added to the list of substances subject to authorization.
Some long-chain chlorinated paraffi ns (LCCP), based on a C18–20 carbon chain length, may contain a substantial proportion of C17 chlo-rinated paraffi ns, with only very small amounts of chlorinated paraffi ns of shorter chain lengths. The typical levels reported were 17% C17 (range 10–20%) and <1% C16. The amounts of chlorin-ated paraffi ns with carbon chain lengths of C15 or lower are negligibly small (EU-RAR 2005).
SCCP and MCCP compounds indicated in HELCOM questionnaire sent to Contracting Parties in 2006 have been presented in Table 8.1.
8.1 Production and use
The world wide production of polychlorinated paraffi ns, which can be divided into short chain (C10-13), medium chain (C14-17) and long chain (C>17) types, has been estimated to be 300,000 tonnes in 1993 (Oehme et al. 2005). The cur-rent production of MCCP in the EU-15 has been estimated to be 45,000 – 160,000 tonnes per year (EU-RAR 2005).
The use information of SCCP and MCCP in HELCOM Countries are presented in Tables 8.2, 8.3, 8.5 and 8.6 and in the EU in Tables 8.4 and 8.7.
SCCP has been used at least in Estonia, Fin-land, Germany, Latvia, Poland, Russia and Sweden during 2000–2005 (Table 8.3). SCCP has been used, for example, in rubber and PVC plastics, paints and metal cutting fl uids (Table 8.2). Estimates on the amounts of used SCCP during 2000–2005 are available from Finland, Germany, Latvia, Poland and Sweden.
MCCP has been used at least in Finland, Germany, Latvia, Poland and Sweden during 2000–2005 (Table 8.6). MCCP has been used in similar way as SCCP in rubber and PVC plastics, paints and metal cutting fl uids (Table 8.5). Estimates on the amounts of used MCCP during 2000–2005 are available from Finland, Germany, Latvia, Poland and Sweden.
The use of SCCP in the EU-15 has decreased from 13,000 tonnes in 1994 to 4,000 tonnes in 1998 (HELCOM 2002b). However, the use of MCCP in the EU-15 has increased from 57,000 tonnes in 1994 to 65,000 tonnes in 1997 (EU-RAR 2005). One reason for this is that MCCP has been used more and more as a substitute for SCCP in many use, since they have very similar use patterns
Compound CAS numberShort-chain chlorinated paraffi ns (SCCP or chloroalkanes, C10-13)
85535-84-8 (C10-13),85681-73-8 (C10-14),85536-22-7 (C12-14)
Medium-chain chlorinated paraffi ns (MCCP or chloroalkanes, C14-17)
85535-85-9 (C14-17)
Table 8.1Indicative SCCP and MCCP compounds.
Table 8.2Uses of SCCP in HELCOM countries during years 2000-2005.
Type of business and mode of application HELCOM country of confi rmed use Remarks
Chemical industry / in solvents and paraffi ns Estonia Year unknownRubber and PVC plastics industry / fl ame retardant and plasticizer Germany Years 1999/2000 (BUA 2004)Paints, varnishes and coatings / binder Germany Years 1999/2000 (BUA 2004)Metal working / cooling lubricant Germany Years 1999/2000 (BUA 2004)Chemical industry / Chemical preparation Poland Year 2005, CAS 85535-84-8MCCP contain as impurity up to 1% SCCP (see also uses of MCCP)
Germany, but valid for all HELCOM countries
As lubricant in compressed air tools used in garages and in different industrial sectors Finland Year 2004, CAS 85535-84-8
Paint industry / as plasticiser and fl ame retardant Finland Main use in year 2004,CAS 85535-84-8
Rubber industry / adhesive, plasticiser and fl ame retardant Finland Year 2004, , CAS 85535-84-8Treatment and coating of metals / metal cutting and working fl uids (both water and oil based) Finland Main use in year 2004, CAS
85535-84-8

74
The MCCP content of PVC plastic product is estimated to be 6–15% by weight of the PVC. The higher medium-chain chlorinated paraffin contents of 15% by weight of the PVC are usu-ally found in extrusion compounds, with lower levels in PVC for coating processes (EU-RAR 2005).
As stated above, some long-chain chlorin-ated paraffins based on a C18–20 carbon chain length may contain a substantial proportion of C17 chlorinated paraffins. Thus, it is important to acknowledge that Long-chain chlorinated paraffins are mainly used in PVC plastic appli-cations, paints and leather fat liquors (EU-RAR 2005).
8.2 Discharges, emissionsand losses to environment
According to this study, the following HELCOM countries have not measured SCCPs or MCCPs in discharges, emissions or losses to environment:
- Estonia- Germany- Latvia- Poland- Russia (no reply to Questionnaire)
The reported emission factors for SCCP are quite high (4–18%) for metal cutting, the man-ufacture of fat liquoring products, and their use in the leather industry for leather tanning and dressing; for other uses, the emission factors are quite low (Table 8.8). The emis-sion factors for MCCP are high (2–50%) for
Country Use (ton) Remarks2000 2001 2002 2003 2004 2005
Denmark NI NI NI NI NI NI
Estonia NI NI NI NI NI NIUse exist, but amount has not been specified
Finland NI confidential information 16 14 4 0.6
Export not taken into account, National Product Register of Chemicals
Germany 400 (imported) NI NI NI NI NINo production in Germany since 1998
Latvia NI NI NI 0.29 NI NINational Chemicals Data Base
Lithuania NI NI NI NI NI NIPoland NI NI NI about 60 NI NI
Russia NI NI NI Use exist NI NI No data on amount
Sweden 26 39 24 16 16 16
National Product Register of Chemicals
Mode of application Amount used (tons/year) and share of total amount usedMetal working fluids 2 018 (50%)Paints, coatings and sealants 726 (18%)Rubber / flame retardants 638 (16%)Leather fat liquors 45 (1%)Other 648 (15%)
Type of business and/or mode of application
HELCOM country of confirmed use Remarks
Rubber and PVC plastics industry / flame retardant and plasticizer Germany Years 1999/2000 (BUA 2004)Paints, varnishes and coatings / binder Germany Years 1999/2000 (BUA 2004)Metal working / cooling lubricant Germany Years 1999/2000 (BUA 2004)Chemical industry / Chemical preparation Poland Year 2005Manufacture of plastic products / plasticiser and flame retardant Finland Year 2005 (main use in 2007)Treatment and coating of metals / metal cutting and working fluids Finland year 200524.30 - Manufacture of mastics Latvia Main use in year 200545.45 - Other building completion Latvia Year 200545.32 - Insulation work activities Latvia Main use, year 2005
Table 8.3Total amount of use for SCCP in HELCOM countries during 2000-2005 (NI = no information received)
Table 8.4Use of SCCP in EU in 1998 (results of EuroChlor in OSPAR 2001c & HELCOM 2002b).
Table 8.5Uses of MCCP in HELCOM countries during years 2000-2005.

75
Ba
ltic
Se
a E
nvi
ron
me
nt P
roc
ee
din
gs
No
. 119
Country Use (ton) Remarks2000 2001 2002 2003 2004 2005
Denmark NI NI NI NI NI NIEstonia NI NI NI NI NI NI
Finland NI 0 0 0 Confidential information
Confidential information
Export not taken into account (used 12 tons in 2006), National Product Register of Chemicals
Germany
4 000 (produced)3 300 (imported)
NI NI NI NI NI
Production include production of LCCP (BUA 2004), 2 production sites in Germany
Latvia NI NI 160-220 350-470 600-820 530-920National Chemicals Data Base
Lithuania NI NI NI NI NI NIPoland NI NI NI about 1 NI 1.1
Russia NI NI NI NI NI NI No reply to questionnaire
Sweden About 110 About 135 About 90 About 135 About 130 NI
National Product Register of Chemicals
Application Industry category Use category Quantity used (t/year)
(Percentage of total use given in brackets)1994 1995 1996 1997
PVC plastic 11 (polymers industry) 47 (softeners) or 22 (flame retardant and fire preventing agents)
45 476 (80.2%)
48 640 (82.9%)
49 240 (83.0%)
51 827 (79.4%)
Metal working/ cutting
8 (metal extraction, refining and processing industry 35 (lubricants and additives) 2 611
(4.6%) 2 765 (4.7%)
3 302 (5.6%)
5 953 (9.1%)
Paints, adhesives and sealants
14 (paints, lacquers and varnishes industry) and 15 (others)
47 (softeners) or 22 (flame retardant and fire preventing agents)
3 079 (5.4%)
2 392 (4.1%)
2 638 (4.4%)
3 541 (5.4%)
Rubber/polymers (other than PVC) 11 (polymers industry)
47 (softener) or 22 (flame retardant and fire preventing agents)
2 497 (4.4%)
2 767 (4.7%)
2 324 (3.9%)
2 146 (3.3%)
Leather fat liquors 7 (leather processing industry) 47 (softeners) or 31 (impregnation agents)
1 614 (2.8%)
1 270 (2.2%)
1 172 (2.0%)
1 048 (1.6%)
Carbonless copy paper
12 (pulp, paper and board industry) 48 (solvent) 1 296
(2.3%) 837 (1.4%)
630 (1.1%)
741 (1.1%)
Total 56 673 58 671 59 306 65 256
Table 8.6Total amount of use for MCCP in HELCOM countries during 2000-2005 (NI = no information received)
Table 8.7Use of MCCP in EU in 1994-98 (EU-RAR 2005).
Mode of application Life cycle Emission factor (%)Waste water 1 Air 2 Soil 3
24.00 - Chemical industry/ production of SCCP 4 production 0.01 0 0.01
28.50 - Metal cutting and working fluids (both water and oil based) * 4 formulationindustrial use
0.254-18
n.a.2
n.a.n.a.
25.10 - Rubber industry / plasticiser and flame retardant in rubber products such as high density conveyor belts, hoses and gaskets
formulationindustrial use
n.a.0.001
n.a.n.a.
n.a.n.a.
24.30 – Paint industry / plasticizer and flame retardant, improving the water and chemical resistance in paints (e.g. in marine primer, fire retardant and road markings paints) and other coatings
formulationindustrial and private use
n.a. / negligible
n.a. / negligible
n.a. / negligible
Sealing compounds / plasticiser and flame retardant in sealing compounds (e.g. polysulphide, polyurethane, acrylic) for use in building, automotive and industrial applications
formulation, industrial
n.a. / negligible
n.a. / negligible
n.a. / negligible
19.10 – Tanning and dressing of leather / fat liquoring agent * 4 formulationindustrial use
25
0.0010.1
n.a.n.a.
17.00 & 18.00 - Textile industry / flame resistant, water repellent and rot-preventing agent in textiles (e.g. in sail cloths, industrial protective clothing and lorry tarpaulins)
formulationindustrial use
n.a. / negligible
n.a. / negligible
n.a. / negligible
1 fraction of total amount of substance in life cycle released to waste water before any treatment (e.g. STP)2 fraction of amount of substance in life cycle released to air as direct emission of facility or plant, emission from STP to air due to volatilization is estimated to be zero3 fraction of amount of substance released to soil via sludge application 4 classified as Category 1 source / pathway, i.e. may contribute to potential failure of WFD objectives (WFD-EAF 2004f)
Table 8.8Emission factors for SCCP reported in the EU risk assessment (EU-RAR 1999).Uses marked with * have been banned (as a substance or constituent of preparations at concentration >1% by mass) in the EU since Jan 2004 according to Directive 2002/45/EC (NA = not available).

76
metal cutting, leather tanning and the dressing and recycling of carbonless copy paper; for other uses, the emission factors are quite low (Table 8.9). Nevertheless, it should be noted that high sectoral emission factors do not nec-essarily reflect that the sectoral discharges (or emissions) are automatically high as the amount of sectoral discharges (or emissions) is very much dependent on how much sub-stance is used by the certain sector.
Losses from end-productsduring the service life
Although MCCPs have low vapour pressure at ambient temperatures, the vapour pressure is not so low as to preclude the possibility of volatilization from plastics and other polymers during their service life. This is particularly true of the MCCPs with lower chlorine con-tents (EU-RAR 2005). Estimated volatilisation losses of MCCPs from polymeric materials are presented in Table 8.10. Additionally, MCCPs are leaching from polymeric products to some extent as presented in Table 8.11.
If SCCPs reach the marine environment, they will generally do so via rivers and the atmo-sphere from the main compartments to which releases occur. The latter are sediment and surface waters in rivers, lakes and seas, air, and soil spread with sewage sludge. Further-more, recent reports indicate that these chem-icals are effectively transported over long dis-tances (OSPAR 2001c).
Wastewater treatment plants (WWTPs)
The measured SCCP and MCCP levels in municipal wastewater and sludge in HELCOM countries are presented in Table 8.12.
A Finnish screening study showed that nei-ther SCCP nor MCCP was detected from treated municipal wastewater (Table 8.12).
Mode of application Life cycle Emission factor (%)Waste water 1 Air 2 Soil 3
24.00 - Chemical industry/ production of MCCP production 0.3 0 n.a.
24.16 – Manufacture of PVC plastics / plasticiserformulationindustrial useindustrial use
00.10.15-0.75
0.014-0.0310.015-0.075* / 0.15-0.75**
n.a.n.a.n.a.
28.50 - Metal cutting and working fluids formulationindustrial use
0.25a.) oil-based 4-18b.) water-based 6-50
00
n.a.n.a.
24.16 – Manufacture of plastics other than PVC (e.g. polystyrene) / flame retardant & 25.10 - Rubber industry / flame retardant in rubber used in conveyor belts and in building and automotive applications
formulationindustrial useindustrial use
0.0050.05-0.10.05
0.0050-10.005*-0.05**
n.a.n.a.n.a.
24.30 - Paint industry / plasticizer, improving the corrosion or weather resistant in some organic solvent-based paints and coatings used in steel constructions, ships, industrial flooring, containers, swimming pools, facades and road markings
formulationprofessional & private use
0.30.1
0.10
n.a.n.a.
Sealants / adhesives (minor use compared to sealants) / plasticiser and flame retardant
formulation & industrial use 0 0 n.a.
19.10 – Tanning and dressing of leather / fat liquoring agent formulationindustrial use
0.32
0.10
n.a.n.a.
Carbonless copy paper / solvent for colour formersindustrial usewaste disposal (i.e. recycling)
negligible10
negligible0
n.a.n.a.
Use Release factor to air
PVC 0.05% over lifetimea
Paints 0.4%/year over a 7 year lifetimeb
Sealants 0.05% over lifetime
Rubber/polymers 0.05% over lifetime
Use Release factor to water
PVC 0.05% over lifetime
Paints 0.15%/year over 5-7 year lifetime
Sealants 0.15%/year over 10-30 year lifetime
Table 8.9Emission factors for MCCP reported in EU risk assessment (EU-RAR 2005). n.a. = not available
Table 8.10Estimated volatilisation losses of MCCPs from polymeric materials (EU-RAR 2005)
Table 8.11Estimated leaching losses of MCCPs from polymeric materials (EU-RAR 2005)
1 fraction of total amount of substance in life cycle released to waste water before any treatment (e.g. STP)2 fraction of amount of substance in life cycle released to air as direct emission of facility or plant, emission from STP to air due to volatilization is estimated to be zero3 fraction of amount of substance released to soil via sludge application * air emission control exist** no air emission control

77
Ba
ltic
Se
a E
nvi
ron
me
nt P
roc
ee
din
gs
No
. 119
Likewise, a Lithuanian screening study showed that SCCP was not detected from treated municipal wastewater of 25 WWTPs (Table 8.12).
Few existing data indicate that SCCP and MCCP levels in municipal wastewater do not cause any acute or chronic effects in recipient water.
The Simple Treat model showed that the overall removal of SCCP and MCCP in WWTP is approximately 93% due to adsorption to the sludge. Biodegradation and volatilization will unlikely occur. The modelling indicates that about 7% is expected to be released via WWTP to recipient water (Table 8.13).
Landfills and storm water
There are no measured data on SCCP or MCCP concentrations (or fluxes) of leachate from landfills and storm water from the HEL-COM Countries.
Since MCCPs are not generally reacted or changed during their lifecycle, ultimately the majority of MCCPs used in products will be dis-posed of at the end of their useful life. Such waste could include erosion/particulate losses of polymeric products, paints and sealants. Dis-posal by landfill or incineration is likely to be the ultimate destination of much of the chlorinated paraffin. For some applications, e.g. metal working fluids, some of the chlorinated paraffin could be destroyed in processes such as recy-
cling metal swarf. For other processes, e.g. the recycling of carbonless copy paper, most of the MCCPs present is likely to end up in the sludge produced in the process, which will again most likely be disposed of by incineration or land-fill. The vast majority of MCCPs is likely to be present in PVC articles, as this is the main use of MCCPs. Of the possible disposal methods, incineration is likely to completely destroy the MCCPs. In landfills, chlorinated paraffins may be expected to be relatively stable for many years and so could be subject to leaching or volatilisation. As releases of MCCPs from land-fills are essentially bound within a polymer matrix, the actual bioavailability and environ-mental behaviour of MCCPs is unknown. There are no studies available on leaching of MCCPs from landfills and it is currently not possible to quantify these releases. However, MCCPs are expected to adsorb strongly onto soil and so leaching and volatilisation from landfill would not be expected to be significant processes compared with other sources (EU-RAR 2005).
8.3 Concentrations in biota,sediment and water of Baltic Sea
According to this study, the following HELCOM Contracting Parties have not measured SCCPs or MCCPs in biota, sediment or water of Baltic Sea:
- Estonia- Finland- Latvia- Poland- Russia (no reply to Questionnaire)
Area Untreated waste water (µg/l) Treated waste water (µg/l) Sludge (mg/kg dry weight)C10-13 C14-17 C10-13 C14-17 C10-13 C14-17
Finland: 3 STPs 1 - - Not detected (<0.10)
Not detected (<0.10)
Not detected (<0.30)
Not detected (<0.30)
Lithuania, 25 STPs 2 - - <0.40 - Not detected (<1.0) -
Sweden, 3 STPs 3a - - - - 0.23-0.30 0.23-0.30
Sweden, 1 STP 3a - - - -unprocessed 0.52processed 0.28
unprocessed 0.52processed 0.28
Sweden, 2 STPs 3b - - - - 2.3 -Sweden, 19 STPs 3c - - - - <2 -PNEC - - 0.4 & 1.4 * 1.0 ** not available not available
Table 8.12SCCP and MCCP concentrations in waste water and sludge of STPs. Predicted No-Effect Concentration value (PNEC) in surface waters has been presented for comparison purposes.
1 Unpublished screening data: single samplings in 2003-20042 Dudutyte et al. 2007: sampled in 2006, single samples3a Swedish Environment Protection Agency 2006: single sampling in 2003, note that the result mean total sum concentration for all chlorinated paraffins (short chain, medium chain and long chain types)3b Sternbeck et al. 2003: sampled in 2002, time-integrated samples from digested sludge3c Svensson 2002: sampled in 2001-2002, one integrated sample (samples from different parts of sludge storage) from recently produced and stabilized sludge from each STP* 2008/105/EC: EU Environmental Quality Standard for chronic effects (AA-EQS, annual average value, 0.4 µg/l) and for short-term eco-toxic effects (MAC-EQS, maximum allowable concentration, 1.4 µg/l) for both inland surface waters and other surface waters (e.g. Baltic Sea)** EU-RAR 2005: PNEC for the surface waters
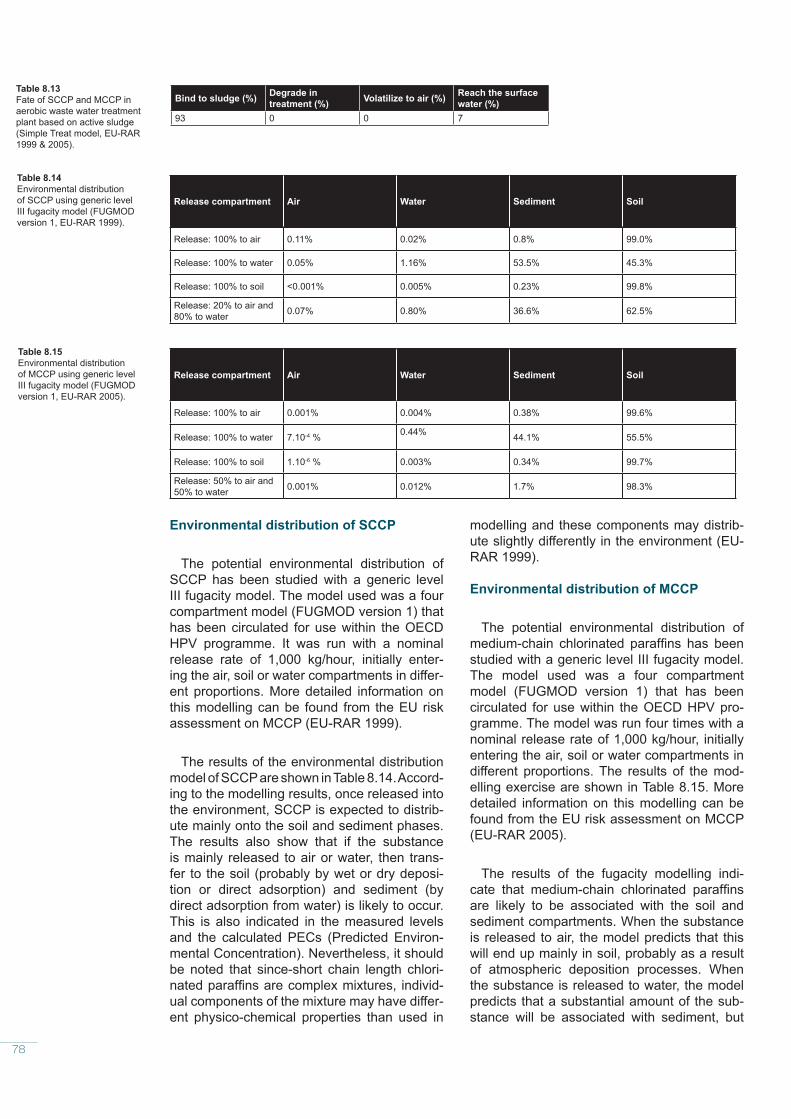
78
Environmental distribution of SCCP
The potential environmental distribution of SCCP has been studied with a generic level III fugacity model. The model used was a four compartment model (FUGMOD version 1) that has been circulated for use within the OECD HPV programme. It was run with a nominal release rate of 1,000 kg/hour, initially enter-ing the air, soil or water compartments in differ-ent proportions. More detailed information on this modelling can be found from the EU risk assessment on MCCP (EU-RAR 1999).
The results of the environmental distribution model of SCCP are shown in Table 8.14. Accord-ing to the modelling results, once released into the environment, SCCP is expected to distrib-ute mainly onto the soil and sediment phases. The results also show that if the substance is mainly released to air or water, then trans-fer to the soil (probably by wet or dry deposi-tion or direct adsorption) and sediment (by direct adsorption from water) is likely to occur. This is also indicated in the measured levels and the calculated PECs (Predicted Environ-mental Concentration). Nevertheless, it should be noted that since-short chain length chlori-nated paraffins are complex mixtures, individ-ual components of the mixture may have differ-ent physico-chemical properties than used in
modelling and these components may distrib-ute slightly differently in the environment (EU-RAR 1999).
Environmental distribution of MCCP
The potential environmental distribution of medium-chain chlorinated paraffins has been studied with a generic level III fugacity model. The model used was a four compartment model (FUGMOD version 1) that has been circulated for use within the OECD HPV pro-gramme. The model was run four times with a nominal release rate of 1,000 kg/hour, initially entering the air, soil or water compartments in different proportions. The results of the mod-elling exercise are shown in Table 8.15. More detailed information on this modelling can be found from the EU risk assessment on MCCP (EU-RAR 2005).
The results of the fugacity modelling indi-cate that medium-chain chlorinated paraffins are likely to be associated with the soil and sediment compartments. When the substance is released to air, the model predicts that this will end up mainly in soil, probably as a result of atmospheric deposition processes. When the substance is released to water, the model predicts that a substantial amount of the sub-stance will be associated with sediment, but
Release compartment Air Water Sediment Soil
Release: 100% to air 0.11% 0.02% 0.8% 99.0%
Release: 100% to water 0.05% 1.16% 53.5% 45.3%
Release: 100% to soil <0.001% 0.005% 0.23% 99.8%
Release: 20% to air and 80% to water 0.07% 0.80% 36.6% 62.5%
Release compartment Air Water Sediment Soil
Release: 100% to air 0.001% 0.004% 0.38% 99.6%
Release: 100% to water 7.10-4 % 0.44% 44.1% 55.5%
Release: 100% to soil 1.10-6 % 0.003% 0.34% 99.7%
Release: 50% to air and 50% to water 0.001% 0.012% 1.7% 98.3%
Bind to sludge (%) Degrade in treatment (%) Volatilize to air (%) Reach the surface
water (%)93 0 0 7
Table 8.13Fate of SCCP and MCCP in aerobic waste water treatment plant based on active sludge (Simple Treat model, EU-RAR 1999 & 2005).
Table 8.14Environmental distribution of SCCP using generic level III fugacity model (FUGMOD version 1, EU-RAR 1999).
Table 8.15Environmental distribution of MCCP using generic level III fugacity model (FUGMOD version 1, EU-RAR 2005).

79
Ba
ltic
Se
a E
nvi
ron
me
nt P
roc
ee
din
gs
No
. 119
some would also be expected to occur in the water phase. A substantial amount of the sub-stance released to water is predicted to enter the soil phase, presumably as a result of vol-atilisation to the atmosphere and subsequent deposition. When the substance is released to soil, it is predicted to remain mainly in the soil compartment, but a small amount may also enter the sediment compartment, possibly as a result of wash-off from the soil to water (EU-RAR 2005). Measured SCCP and MCCPlevels in environment
A German study indicated that MCCP lev-els wA German study indicated that MCCP levels were higher than SCCP levels in many fish samples from the Baltic Sea (in particu-larly in Kiel Bight). The sum concentrations of SCCP and MCCP in fish of the Baltic Sea (90–3170 µg/kg lipid, mean 615 µg/kg lipid) were comparable for the North Sea (54–3880 µg/kg lipid, mean 985 µg/kg lipid). The sum concentrations of SCCP and MCCP in the liv-ers of cod in the Baltic Sea were consider-ably higher than in Lofoten and Iceland. SCCP and MCCP levels in fish showed no species-specific concentration dependence. Gener-ally, C11 and C12 chlorinated paraffins were the most abundant SCCP carbon lengths in fish.
Respectively, C14 chlorinated paraffin domi-nated MCCP in fish (59–100%) and other car-bon chain lengths were of minor importance (Oehme et al. 2005).
MCCP concentrations were always higher than SCCP concentrations in the sediment of the Baltic Sea. The ratio of MCCP/SCCP was between 1.7 and 3.2. The concentrations of SCCP and MCCP in the sediment of the Bal-tic Sea (13–128 and 36–303 µg/kg dw) were higher than in North Sea (18–79 and 54–250 µg/kg dw; in addition, 10 out of 16 samples or sites were below the quantification limit). Gen-erally, C12 and C13 chlorinated paraffins were the main SCCP carbon lengths (50–87%) in the sediment. Respectively, C14 chlorinated paraffin dominated MCCP in the sediment (56–81%) and all other carbon chain lengths were of minor importance. C17 chlorinated paraffin was not detected in any sediments (Oehme et al. 2005). SCCP and MCCP concentrations have been reported only from very few sites world-wide and comparison of levels is ham-pered by different quantification methods. Nev-ertheless, Oehme et al. (2005) concluded that total sum of SCCP, MCCP and LCCP in sedi-ments of Baltic Sea and North Sea is about in the same range as non-contaminated sites.
Area / species Tissue type / its lipid content
Biota(µg/kg wet weight or µg/kg lipid)C10-13 C14-17
Southern Baltic Proper, cod Gadus morhua 1 Liver / 49-56% 19-143 / median 73 ww39-289 / median 143 lipid
25-121 / median 75 ww50-226 / median 145 lipid
Kiel Bight, cod Gadus morhua 1 Liver / 23-57% 24-408 / median 34 ww54-773 / median 127 lipid
41-1265 / median 60 ww72-2393 / median 122 lipid
Southern Baltic Proper, flounder Platichthys flesus 1 Liver / 33-34% 99-221 ww296-660 lipid
31-206 ww 93-614 lipid
Kiel Bight, dab Limanda limanda 1 Liver / 41-56% 47-48 ww / 83-115 lipid 71-130 ww / 126-310 lipidKattegat, herring Clupea hargenus 2a muscle <2 ww <2 wwSouthern Baltic Proper, herring Clupea hargenus 2a muscle <2 ww <2 wwWestern Gotland Basin, herring Clupea hargenus 2a muscle <2 ww <2 wwBothnian Sea, herring Clupea hargenus 2a muscle <2 ww <2 wwBothnian Bay, herring Clupea hargenus 2a muscle <2 ww <2 wwBothnian Sea, herring Clupea hargenus 2b Muscle / 5.4% 1 400 lipid -Baltic Proper, herring Clupea hargenus 2b Muscle / 4.4% 1 500 lipid -Kattegat, herring Clupea hargenus 2b Muscle / 3.2% 1 600 lipid -Kongsfjorden, Svalbard, ringed seal Pusa hispida 3 Blubber / 88% 130 lipid -Baltic Sea, grey seal Halichoerus grypus 3 Blubber / 74% 280 lipid -PNEC - 16 600 ww in prey tissue * 170 ww in prey tissue **
Table 8.16SCCP and MCCP levels in fish of Baltic Sea. Predicted No-Effect Concentration value (PNEC) has been presented for comparison purposes.
1 Oehme et al. 2005: two coastal locations (Kiel Bight and Southern Baltic Proper) of Germany in August/September in 2002 and in August 2003, three flounder, one dab and 10 cod samples of which some were single and some pooled. Note that regarding MCCP only C14-15 chloroalkanes were measured.2a Swedish Environment Protection Agency 2006: 5 Swedish coastal background sites from Kattegat to Bothnian Bay and one affected site in coastal area of Bothnian Sea in 2002-2003, values are sum for SCCP, MCCP & LCCP2b EU-RAR 1999: Bothnian Sea in 1986, in Southern Baltic Proper and Kattegat in 1987. 60-100 pooled samples. Note that paraffins of 6-16 chlorine atoms have been measured and values may contain other paraffins than C10-13.3 EU-RAR 1999: ringed seal in 1981 (7 samples) and grey seal during 1979-85 (8 samples). Note that paraffins with 6-16 chlorine atoms have been measured and so values may contain other paraffins than C10-13.* WFD – EAF 2005c: estimated PNEC for protection of predators such as mammals and predatory birds via secondary poisoning expressed as concentration in prey tissue ** EU-RAR 2005: estimated PNEC for protection of predators such as mammals and predatory birds via secondary poisoning expressed as concentration in prey tissue

80
In a Swedish screening study, no measur-able concentrations, or very low concentra-tions, of chlorinated paraffins were found in the sediment and fish. The measured concentra-tions in WWTP sludge can be assumed to stem from the use of products containing chlorinated paraffins. Environmental concentrations are so low that chlorinated paraffins cannot be con-sidered to pose any risk to the aquatic environ-ment at present. Thus, more measurements of chlorinated paraffins were not recommended to be carried out within the Swedish contami-nant screening /monitoring programme (Swed-ish Environment Protection Agency 2006).
There are very few measured data on SCCP or MCCP concentrations in Baltic Sea water. The only measurement made in one Lithua-nian harbour indicated that SCCP concentra-tion was under the detection limit (< 0.4 µg/l, Dudutyte et al. 2007). On the other hand, the sediment (and biota) is a much better environ-mental compartment to be measured than the water phase as indicated in Tables 8.14 and 8.15.
SCCP concentrations in fish in the Baltic Sea were lower than the estimated PNEC for the protection of predators such as mammals and predatory birds via secondary poisoning. On the other hand, MCCP concentrations in cod and flounder were higher than the estimated PNEC value in fish, which causes concern. MCCP levels are higher than SCCP levels in fish, which is reflects the wider current use of MCCP (Table 8.16).
SCCP and MCCP concentrations in the sed-iment were lower than the estimated PNEC value in the sediment. MCCP levels are higher than SCCP levels in the sediment due to the wider current use of MCCP compared to SCCP (Table 8.17).
8.4 Substance-specific conclusions
It is evident that several HELCOM countries do not have information on the use of SCCP and MCCP.
The significant sources for discharges to the aquatic environment and emissions to atmos-phere are shown in Table 8.18. The reported
Area / species TOC content Sediment µg/kg dry weightC10-13 C14-17
German coast, Eckernförde Bight 1 4.0 29 70German coast, Oder estuary 1 - 18 42German coast, Ruden 1 2.8 25 58German coast, Kiel Bight 1 0.48-5.3 13-128 36-303German coast, Lübeck Bight 1 2.9-3.1 35-48 51-91German coast, Mecklenburg Bight 1 3.8 21-82 48-141Southern Baltic Proper 1 4.9-6.0 44-105 74-153Southern Baltic Proper, 4 Lithuanian coastal sediments 2 - Not detected (<1000) -Bothnian Sea, 1 Swedish coastal sediment 3a - Not detected (<8) Not detected (<8)Northern Baltic Proper, 14 Swedish coastal sediments 3b - <0.3-1000 / mean 115 -PNEC - 1 000 * 23 000 **
Substance
Sources of discharges to aquatic environment
Sources of emissions to atmosphere
SCCP
* industrial waste water from - metal cutting - manufacture of fat liquoring products and their use in leather industry- sewage treatment plants (STPs); the importance as source can not excluded due to scarce data
* industrial waste water from metal cutting industry
MCCP
* industrial waste water from- metal cutting - leather industry - recycling of carbonless copy paper- sewage treatment plants (STPs); the importance as source can not excluded due to scarce data
* industrial waste water from - plastics (e.g. PVC and polystyrene)- rubber industry
Table 8.18Relevant sources of SCCP and MCCP discharges and emissions. The industrial sector or professional use has been identified as a relevant source if the emission factor is relatively high or if it has been identified as risk use in national or EU risk assessments. The significance of other activities (e.g. STPs and landfills) has been evaluated on the basis of measured effluent concentrations. It should be noted that all below mentioned sectors may not be relevant in all HELCOM countries and these should be identified at national level (e.g. within national programs under the HELCOM BSAP).
Table 8.17SCCP and MCCP levels in sediment of Baltic Sea. Predicted No-Effect Concentration value (PNEC) has been presented for comparison purposes.
1 Oehme et al. 2005: sampled in 2001-2004, 2 cm surface layer. Regarding MCCP only C14-15 chloroalkanes were measured.2 Dudutyte et al. 2007: 4 Lithuanian sediments from Klaipeda port area in 2006, 0-2 cm surface layer of sediment3a Swedish Environment Protection Agency 2006: affected site in 2003, values are sum for SCCP, MCCP & LCCP3b Sternbeck et al. 2003: sampled in 2002, 0-2 cm surface layer of sediment* WFD-EAF 2005c: estimated PNEC for benthic community based on equilibrium partitioning method (no eco-toxicological data available for sediment dwelling organisms), expressed as concentration in sediment** EU-RAR 2005: estimated PNEC for benthic community based on eco-toxicological data for sediment dwelling organisms, expressed as concentration in sediment

81
Ba
ltic
Se
a E
nvi
ron
me
nt P
roc
ee
din
gs
No
. 119
SCCP and MCCP emission factors for industrial sectors shown in Table 8.18 are high (SCCP 4–18% and MCCP 2–50%). In general, the main pathways to the marine environment of SCCP and MCCP are via rivers and the atmosphere.
The measured SCCP and MCCP data in municipal wastewater and sludge in the HEL-COM countries is so scarce that the impor-tance of WWTPs as source cannot be evalu-ated. There is no measured data on SCCP or MCCP in landfi ll leachates and storm water from the HELCOM Countries.
Few available data indicate that MCCP levels in fi sh may have adverse effects on the Baltic marine environment. On the other hand, SCCP levels in fi sh and sediment seems to be quite low. MCCP levels are higher than SCCP levels in fi sh and the sediment due to a wider current use of MCCP compared to SCCP.
In general, there should be more measured data on SCCP and MCCP concentrations both in discharges (e.g. from WWTPs and landfi lls), in catchment areas and in biota and sediment, to conclude if SCCP/MCCP causes harmful effects on the Baltic marine environment.

82
9 Endosulfan
Endosulfan has been identifi ed as priority hazardous substance under EQS Directive (2008/105/EC).
Technical grade endosulfan contains two isomers, α- and β-endosulfan, in the ratio of 7:3 making up 94% of the content. The total European use of endosulfan in 1999 was esti-mated to be 470 tonnes (Cousins et al. 2005).
Endosulfan compounds indicated in the HELCOM questionnaire sent to the Contracting Parties in 2006 are presented in Table 9.1.
9.1 Production and use
Some usage information of endosulfan in HELCOM Countries is presented in Table 9.2. Endosulfan has not been used in Sweden since 1996 (OSPAR 2002, Cousins et al. 2005, Swedish Environment protection Agency 2006). Endosulfan has not been used (at least no more sales) in Denmark since 1995 and in Germany at least not since 1994 (OSPAR 2002). The use of endosulfan as an agricultural pesticide has decreased within last decade in Finland. Very restricted use of endosulfan in the cultivation of strawberry and current plants was allowed during 2001–2005. Since autumn
2005, the use of endosulfan was totally forbid-den in Finland.
The main endosulfan uses are in agriculture; non-agricultural uses have ceased (OSPAR 2002). Endosulfan is an insecticide and a miti-cide applied in cultivating, e.g. fruits, vegeta-bles, maize and rice. The compound is also used as a wood preservative; however, its use is restricted to high pressure impregnation in closed systems (Swedish Environment protec-tion Agency 2006).
The total European use of endosulfan in 1999 was estimated to 479 tonnes (Cousins et al. 2005).
9.2 Discharges, emissionsand losses to environment
According to this study, the follow-ing HELCOM Contracting Parties have not measured endosulfan in discharges, emissions or losses to environment:
- Germany- Latvia- Poland- Russia (no reply to Questionnaire)
Endosulfan was very rarely detected (found in about 1% of sampled rivers) in Danish rivers during 2000–2003 (Boutrup et al. 2006).
Country Use (ton) Remarks2000 2001 2002 2003 2004 2005
Denmark 0 0 0 0 0 0 OSPAR 2002Estonia NI NI NI NI NI NI
Finland 0.11 Use exist Use exist Use exist Use exist Use exist Amounts used not known
Germany 0 0 0 0 0 0
2 production sites in Germany,OSPAR 2002
Latvia NI NI NI NI NI Not produced or imported
National Chemicals Data Base
Lithuania NI NI NI NI NI NIPoland NI NI NI NI NI NI
Russia NI NI NI NI NI NI No reply to questionnaire
Sweden 0 0 0 0 0 0
National Product Register of Chemicals
Table 9.2Total amount of use for endosulfan in HELCOM countries during 2000-2005. NI = no information received
Compound CAS numberEndosulfan, α-isomer 959-98-8Endosulfan, β-isomer 33213-65-9
Table 9.1Indicative endosulfan compounds

83
Ba
ltic
Se
a E
nvi
ron
me
nt P
roc
ee
din
gs
No
. 119
α-endosulfan was found at a level of 0.01–0.5 µg/l from some industrial effluents in 2001 in Estonia.
According to a Finnish screening study on pesticides in river water and sediment during 2004–2005, the concentration of endosulfan in river water was always below the quantitifi-cation limit (<0.02 µg/l). Endosulfan-sulphate, the metabolite of endosulfan, was detected only at one sampling site out of 44 studied riv-ers, brooks or ditches. The study estimated that endosulfan will primarily end up to river sediments where it degrades very slowly. Unfortunately, the used analytical method was not as sensitive as the EU Environmental Quality Standards (Table 9.3). After all, it was concluded that the endosulfan load to the Baltic Sea via Finnish rivers is not likely to take place in detectable concentrations.
In Sweden, α- and β-endosulfan and endosul-fan sulphate were not detected from the sludge of three wastewater treatment plants (<7 µg / kg dry weight for each substance, sample from anaerobic chamber) in 2004 and from leach-ate water of one landfill (<0.001 µg/l for α- and β-endosulfan and <0.0002 µg/l for endosulfan sulphate) in 2005. α- and β-endosulfan were not detected from the leachate water of two composting areas (<0.003 µg / l and <0.002 µg / l, respectively) but endosulfan sulphate was found at a level of 0.00022–0.0016 µg / l in 2004. Landfills and composting areas do not seem to be significant emission sources of endosulfan. Endosulfan has been detected at similar lev-els in the air and deposition, both in urban and background areas. The presence of endosul-fan sulphate in leachate from compost and in higher concentrations in urban sediments than in background areas may indicate other pos-sible non-point source discharges, for example via wastewater treatment plants or storm water systems (Cousins et al. 2005). Additionally, Junestedt et al. (2003) found that α-endosulfan concentration in treated wastewater was lower than the detection limit (<0.001 µg/l).
Swedish experts have estimated that long-range atmospheric transport is the main trans-portation route of endosulfan to the Swedish environment. Another significant route can be foodstuffs containing endosulfan (Cousins et al. 2005, Swedish Environment protection Agency 2006).
9.3 Concentrations in biota,sediment and water of the Baltic Sea
According to this study, the following HELCOM Contracting Parties have not measured SCCPs or MCCPs in biota, sediment or water of Baltic Sea:
- Finland- Latvia- Poland- Russia (no reply to Questionnaire)
Endosulfan can pose an endocrine-disrupt-ing effect, has a potential for long-range atmos-pheric transport (semi-volatile substance, exist in both vapour and particulate phases of the atmosphere) and can potentially be a PBT (Persistent, Bioaccumulative, Toxic) substance and classified as a POP (Persistent Organic Pollutant). Also, endosulfan sulphate is a poten-tially endocrine-disrupting substance and highly persistent in sediment and soil (OSPAR 2002, Cousins et al. 2005, Swedish Environment pro-tection Agency 2006).
β-endosulfan has been reported to slowly rearrange in the environment to the more sta-ble form α-endosulfan. Endosulfan sulphate is an oxidation product found in technical endo-sulfan but is also the main microbial oxidation product of α- and β-endosulfan. In the aquatic environment, endosulfan mainly adsorbs to suspended solids and deposits to sediments; however, a certain proportion is likely to remain in the water column due to relatively high water solubility. It should be noted that the histori-cal use of endosulfan has been as a pesticide in agriculture, which implies that air and soil have been the primary receiving environmental media in the past in Sweden, and still are in some countries (Cousins et al. 2005).
According to a German study (Oehme et al. 2005), endosulfan concentrations in the Baltic Sea and the North Sea were very low with a median of 0.000025 µg/l, which is lower than PNEC for both chronic effects (AA-EQS) and for short-term ecotoxic effects (MAC-EQS) (Table 9.3). β-endosulfan levels were gener-
PNEC chronic effects Baltic Sea surface waterµg/l
PNEC acute effects Baltic Sea surface waterµg/l
0.0005 * 0.004 *
Table 9.3Predicted No-Effect Concentration values (PNEC) in surface waters for comparison purposes. Note that PNECs are valid to sum of α- and β-endosulfan and endosulfan sulphate. Endosulfan sulphate is similarly toxic than the parent compounds α- and β-endosulfan (WFD-EAF 2005d)
* 2008/105/EC: EU Environmental Quality Standard for chronic effects (AA-EQS, annual average value, 0.0005 µg/l) and for short-term eco-toxic effects (MAC-EQS, maximum allowable concentration, 0.004 µg/l) for other surface waters (e.g. Baltic Sea)

84
ally lower than for α-endosulfan and often not detectable in water. Endosulfan concentrations in the surface layer (0–2 cm) of German coastal sediments and one sediment site in the Baltic Proper were very low with a median of 0.02 µg/kg dw. Endosulfan concentrations in fish liver of German coastal waters were very low with a median of 0.44 µg/kg ww (or 1.9 µg/kg lipids), which is significantly lower than PNEC for the protection of predators (mammals and preda-tory birds) via secondary poisoning (1,000 µg/kg ww) and for the protection of humans via sea food (365 µg/kg ww, Table 9.4).
According to a Lithuanian screening study carried out in 2005–2006, the α- and β-endosul-fan concentrations in Lithuanian coastal waters (Curonian Lagoon & Southern Baltic Proper) were always lower than the detection limits (α-endosulfan <0.5 and β-endosulfan <2.0 µg/l). Thus, the comparison to PNEC for the water of Baltic Sea is difficult to carry out. The study covered four sampling sites in Curonian Lagoon and 11 other sites in the Baltic Sea’s surface water. Endosulfan α and β concen-trations in Lithuanian coastal sediments were always lower than the detection limits (<0.3 and 0.4 µg/kg dw, respectively). The study covered nine sampling sites for sediment in the Baltic Sea. Endosulfan α and β were not detected (<0.1 µg/kg ww) in the muscles of flounder and cod from Lithuanian coastal waters in 2005. Nevertheless, endosulfan α was found in the muscle of herring at a level of 0.2–0.5 µg/kg ww, which is significantly lower than the PNEC values presented in Table 9.4.
Falandysz et al. (2001) analysed the soft tissues of blue mussel (Mytilus edulis), whole crab (Carcinus means) and whole fish (cod, herring, pikeperch, perch, round goby, greater sand-eel, lesser sand-eel, lamprey, flounder and three-spined stickleback) collected from several sites in the Gulf of Gdańsk in 1992. α- and β-endosulfan were not detected (< 3 µg / kg lipids) at all. Thus, the levels are significantly lower than the PNEC presented in Table 9.4.
The number of sampled individuals was 700 for blue mussel, 3 for crab and 3–120 for fish.
Endosulfan α and β were not detected (<7 and <9 µg/kg lipids) from the herrings of six Swedish coastal sites (background areas) from Skagerrak to the Southern Bothnian Sea in 2003. Endosulfan sulphate was found from one site at a level of 7.7 µg/kg lipids. The results indicate that the transformation prod-ucts of endosulfan may occur in fish in distant (background area) coastal areas of the Baltic Sea (Cousins et al. 2005). Endosulfan α and β were not detected (<0.5 and <1 µg / kg dw) from the surface sediment (sediment depth of 0–1 cm) of four Swedish coastal sites (back-ground areas with water depth of 77–403 m) in the Gotland basin and the Northern Baltic Proper in 2004. On the other hand, endosulfan sulphate was found at all four sites at levels of 0.09–0.14 µg / kg dw (Cousins et al. 2005). Cato (2005) surveyed 16 open sea sediment sites (0–1 cm surface layer) from Skagerrak to Bothnian Bay in 2003, but endosulfan was not detected (< 0.8 µg / kg dw).
The Swedish results indicate that concentra-tions of endosulfan in the aquatic environment are generally below the detection limit; how-ever, endosulfan sulphate (a transformation product of endosulfan) may occur especially in sediment and also in the fish in the coastal background areas of the Baltic Sea (Cousins et al. 2005). It was concluded that endosulfan will be further examined within the Swedish con-taminant monitoring / screening programme, especially concerning atmospheric concentra-tions and deposition as well as treated waste-water, sludge and various potentially contami-nated foods (Swedish Environment protection Agency 2006).
OSPAR (2002) concluded that the pollution of surface waters via the use of endosulfan as wood preservative was considered either to be “unlikely” (professional use) or of “minor importance” (domestic or private use). On the other hand, the distribution and occurrence of endosulfan and its metabolites in the environ-ment, especially in rivers and ultimately in the sea as well as the possible long-range atmos-pheric transport, give reason for considerable concern regarding marine waters.
Although in many cases the detected con-centrations are below the estimated effect levels for individual substances, it is still pos-sible that the substances contribute to the toxic
PNEC sediment (µg/kg dry weight)
PNEC biota (µg/kg wet weight )
Not clearly defined 1 000 in prey tissue / 365 in seafood *
* WFD-EAF 2005d: estimated PNEC for protection of predators such as mammals and predatory birds via secondary poisoning expressed as concentration in prey tissue (1 000 µg/kg ww) and PNEC for human health via food uptake expressed as concentration in seafood (365 µg/kg ww)
Table 9.4Predicted No-Effect Concentration values (PNEC) in biota for comparison purposes. Note that PNECs are valid to sum of α- and β-endosulfan and endosulfan sulphate. Endosulfan sulphate is similarly toxic than the parent compounds α- and β-endosulfan (WFD-EAF 2005d & EC 2006)

85
Ba
ltic
Se
a E
nvi
ron
me
nt P
roc
ee
din
gs
No
. 119
effects triggered by mixtures of biologically active substances.
9.4 Substance-specifi c conclusions
Signifi cant source of endosulfan for leach-ing from soil and emissions to the atmosphere is more likely due to the historical and current agricultural pesticide use. The use of endosul-fan is possible in Russia, but it is banned in plant protection products and wood impregna-tion in the EU.
The main pathways of endosulfan to the Baltic marine environment are via rivers receiv-ing leaching waters from agricultural land and via the atmosphere mainly due to the historical application of endosulfan-based agricultural pesticides.
Endosulfan can pose an endocrine-disrupt-ing effect, has a potential for long-range atmos-pheric transport and can potentially be a PBT (Persistent, Bioaccumulative, Toxic) substance
and classifi ed as a POP (Persistent Organic Pollutant). Also, endosulfan sulphate (transfor-mation product of endosulfan) is a potentially endocrine-disrupting substance and highly per-sistent in sediment and soil.
Endosulfan levels are generally below the detection limit or low; however, endosulfan sul-phate may occur especially in sediment as well as in fi sh in the Baltic Sea.
In general, there should be more measured data on endosulfan and endosulfan sulphate in sea water, biota and the sediment of the Baltic Sea to examine if it has harmful effects on the Baltic marine environment. Additionally, there should be more measured data on endosulfan and endosulfan sulphate especially concerning atmospheric concentrations and deposition.
There is also need for ecotoxicological data for sediment-dwelling organisms in order to defi ne PNEC estimate for the benthic community.

86
This chapter focuses on the general conclu-sions. More detailed substance-specifi c con-clusions have been presented in the end of each substance chapter.
The uses identifi ed in this report are not nec-essarily relevant in all of the countries or even within the same country throughout all plants of certain sector. This is because processes can be run with a great variety of methods and chemicals. However, it is evident that several HELCOM countries do not have suffi cient infor-mation on the use or discharges / emissions of substances considered in this report. The attempts to estimate actual substance loads to the Baltic Sea have not been made due to the scarcity of data. Instead, the effl uent concentra-tions were compared to the substance-specifi c Predicted No-Effect Concentrations (PNEC) in surface water. Additional measurements on the discharges (WWTPs, landfi lls, storm water) and emissions of substances considered in this report are needed.
As a general conclusion, a Baltic-wide sub-stance-fl ow analysis should be prepared for each substance as soon as possible in order to get a clear overview on how a substance ‘moves’ in our society. Substance-fl ow analy-sis would give information, for example, on the pathways and the amounts of substances and respective emissions / discharges to different environmental compartments.
In general, information on the occurrence of hazardous substances in the whole Baltic Sea (biota, water and sediment) is needed.
The occurrence of TBT, and to a lesser extent TPhT’s, is widespread in the Baltic marine environment. Despite the legislative measures taken into action and the declining concentra-tions in the Baltic Sea, the current levels of TBT and TPhT pose a risk to the Baltic marine envi-ronment and especially to organisms at lower trophic levels. Sediment-dwelling organisms near harbours and shipyards are especially under threat, as are organisms with a habi-tat range near sea routes and at the disposal sites for dredged material. It is crucial that information on dredging and the disposal of TBT-contaminated sediments to the Baltic Sea will be systematically collected in each Baltic Sea country and reported to HELCOM accord-ing to the prevailing HELCOM guidelines and schedule.
The occurrence of BDEs in the Baltic marine environment is widespread. It is apparent that current legislative measures (penta- and octaBDE banned in the EU since 2004) have already decreased penta- and octaBDE levels in the Baltic Sea. PentaBDE and octaBDE do not seem to pose a risk to the marine environ-ment in the western Baltic Sea, but may be different in the eastern parts. DecaBDE is the dominant congener in WWTP sludge and in the Baltic Sea sediments, but can also be found in Baltic Sea fi sh. TetraBDE on the other hand, is the most dominant congener in biota. Levels of decaBDE may be further increasing due to fact that its use has not been restricted.
At present, information on the occurrence of HBCDD in the environment is very limited. The
10 General conclusions
© P
hoto
by
Ele
na B
ulyc
heva

87
Ba
ltic
Se
a E
nvi
ron
me
nt P
roc
ee
din
gs
No
. 119
results of the draft EU risk assessment indicate that there is a need to limit risks to the aquatic environment concerning the use of HBCDD. Especially higher trophic level predators, such as mammals and predatory birds, are facing the risks via secondary HBCDD poisoning. The assessment on persistent, bioaccumula-tive and toxic substances (PBT assessment), particularly with a regard to the marine environ-ment, showed that HBCDD is a PBT substance. The results presented in this assessment show HBCDD is being commonly found in fi sh along the Swedish coastal areas of the Baltic Sea. However, the situation may be different in other parts of the Baltic Sea.
The PBT assessment also showed that PFOS (perfl uorooctane sulfonate) is a very per-sistent, bioaccumulative and toxic substance (PBT substance). PFOS is a widespread con-taminant in the Baltic Sea wildlife, whilst PFOA (perfl uorooctanoic acid) was not common. As a whole, the situation regarding PFAS com-pounds is complicated because the number of substances is great and it is not exactly known which substances have harmful proper-ties, or can degrade to PFOS and persistent PFAS in the environment. The fi ndings of this study imply that the threat caused by PFOS to the Baltic Sea’s top predators, such as seals and predatory birds, is via secondary poison-ing. The occurrence of PFOA in the Baltic marine environment is diffi cult to estimate due to the lack of ecotoxicological information (i.e. PNEC value has not been comprehensively assessed). There is a need to gather ecotoxi-cological data for sediment dwelling organisms in order to better defi ne the PFOS PNEC esti-mate for the benthic community. Additionally, more information on the relevant ecotoxicologi-cal data on PFOA should be gathered or pro-duced in order to obtain the PNEC values in the marine environment.
Nonylphenols (NP) are very toxic to aquatic organisms. Additionally, both NP and NPE (nonylphenol ethoxylates) are possible endo-crine-disrupting substances. Some available data indicate that NP levels in the sea water and biota (fi sh) are not high, but the levels in sediment may have adverse effects on the marine environment. In general, NP levels in treated municipal wastewater do not cause acute effects in recipient water, but chronic effects are possible. There is a requirement for more ecotoxicological data on NP for sedi-ment-dwelling organisms in order to better defi ne the NP PNEC estimates for the benthic community.
Octylphenol (OP) is very toxic to aquatic organisms and it is not easily degraded in the environment. Additionally, OP is a possible endocrine-disrupting substance. The scarce available data indicate that OP levels in biota (fi sh) are not high, but the levels in sediment may have adverse effects on the Baltic marine environment. In general, the measured OP levels in treated municipal wastewater are high enough to possibly cause both acute and chronic effects in recipient waters. There is also a need for more ecotoxicological data for sediment-dwelling organisms in order to better defi ne the OP PNEC estimate for the benthic community.
Available data suggests that the MCCP (medium-chain chlorinated paraffi n) levels in fi sh in the Baltic Sea may have adverse effects on the Baltic marine environment. On the other hand, SCCP (short-chain chlorinated paraffi n) levels in fi sh and the sediment of the Baltic Sea seem to be quite low. MCCP levels are higher than SCCP levels in fi sh and the sediment of the Baltic Sea due to a wider current use of MCCP compared to SCCP.
Endosulfan can pose an endocrine-dis-rupting effect, has a potential for long-range atmospheric transport and is a potential PBT (Persistent, Bioaccumulative, Toxic) sub-stance, also classifi ed as a POP (Persistent Organic Pollutant). Endosulfan sulphate, which is a transformation product of endosulfan, is yet another potential endocrine-disrupting sub-stance and highly persistent in sediment and soil. Endosulfan levels are generally below the detection limit or low, but endosulfan sulphate is found in sediments as well as in the fi sh of the Baltic Sea. With regards to endosulfan and endosulfan sulphate, there is also a require-ment for ecotoxicological data, especially con-cerning sediment-dwelling organisms in order to defi ne the PNEC estimate for the benthic community.
Although in many cases the detected con-centrations are below the estimated effect levels for individual substances, it is still pos-sible that the substances contribute to the toxic effects triggered by mixtures of biologically active substances.
88
11 Acknowledgements
Helsinki Commission wishes to express its sincere thanks to Sweden for providing the fi nancial support for the work of the HAZARDOUS Project.
HELCOM also expresses its cordial gratitude to Mr. Jakob Strand and Ms. Susanne Boutroup, Danish National Environmental Research Institute, Mr Jaakko Mannio, Finnish Environment Institute, Ms. Ulrike Pirntke, German Federal Environment Agency, Mr Michael Haarich, Johann Heinrich von Thünen-Institut (Germany), Ms. Galina Garnaga, Lithuanian Center of Marine Research, Ms. Britta Hedlund, Swedish Environmental Protection Agency, Ms. Tove Lundeberg, Swedish Environmental Protection Agency and Mr. Bo Nyström, Swedish Chemicals Agency for providing valuable information and comments on the assessment.
HELCOM also wishes to thank the HELCOM Land based Pollution Group and Monitoring and Assessment Groups for their invaluable support during the preparation of the report, and for their considerable patience and understanding and particularly the
following representatives of HELCOM LAND and MONAS have contributed signifi cantly for providing valuable information on the assessment: Ms. Madli Sarv, Estonian Ministry of Environment, Mr. Juris Aigars, Latvian Institute of Aquatic Ecology, Ms. Evelina Cuzanauskiene, Lithuanian Ministry of Environment and Ms. Anna Bakierowska, Polish Secretariat for the Helsinki Convention in Gdansk (under Chief Inspectorate for Environmental Protection).
HELCOM also extends its gratitude to Ms. Susan Londesborough, Finnish Environment Institute, for providing review of the Report and her valuable comments both on the scope and contents of the assessment and to Ms. Reetta Ljungberg for providing comments on the assessment, language correction and editorial improvements.
Helsinki Commission also wishes to express the sincere thanks to Mr. Jukka Mehtonen, representing both Finnish Environment Institute and HELCOM Secretariat, for his dedicated work on coordination of the HELCOM HAZARDOUS Project, putting a lot of his efforts for compilation of this Report.

89
Ba
ltic
Se
a E
nvi
ron
me
nt P
roc
ee
din
gs
No
. 119
* Albalat, A., Potrykus, J., Pempkowiak, J. & Porte, C. 2002. Assessment of organotin pol-lution along the Polish coast (Baltic Sea) by using mussels and fi sh as sentinel organisms. Chemosphere 47: 165-171.
* AMAP 2007. Final report of phase I of the ACAP project on brominated fl ame retardants (BFRs). AMAP Report 2007:6 & SFT Report TA-2440/2008. 52 p.
* Andersen, J. M., Boutrup, S., van der Bilj, L., Svendsen, L. M., Bøgestrand, J., Grant, R., Lauridsen, T. L., Ellermann, T., Ǽrtebjerg, G., Nielsen, K. E., Søgard, B., Jørgensen, L. F. & Dahlgren, K. 2006. Aquatic and terrestrial environment 2004: State and trends – techni-cal summary. 136 p. NERI technical report 579. National Environment Research Institute.
* Ankarberg, E., Aune, M., Darnerud, P.O. & Glynn, A. 2006. Level of fl ame retardants in fi sh from the Baltic Sea, Sweden - Report to the Swedish Environmental Protection Agency. National Food Administration. 12 p.
* Bauer B, Fioroni P, SchulteOehlmann U, et al., 1997. The use of Littorina littorea for trib-utyltin (TBT) effect monitoring results from the German TBT survey 1994/1995 and laboratory experiments. Environmental Pollution 96 (3): 299-309.
* Beineke, A., Siebert, U., Mclachlan, M., Bruhn, R., Thron, K., Failing, K., Müller, G. & Baumgärtoner, W. 2005. Investigations of the potential infl uence of environmental contami-nants on the thymus and spleen of harbour porpoises (Phocoena phocoena). Environ. Sci. Technol. 39: 3933-3938.
* Bignert, A., Nyberg, E., Asplund, L., Eriksson, U. & Wilander, A. 2006. Metals and organic hazardous substances in marine biota, trend and spatial monitoring (Metaller och orga-niska miljögifter i marin biota, trend- och områ-desövervakning). 122 p. Swedish Museum of Natural History.
* Boutrup, S., Fauser, P., Thomsen, M., Dahlöff, I., Larsen, M. M., Strand, J., Sortkjær,
O., Ellermann, T., Rasmussen, P., Jørgensen, L. F., Pedersen, M. W. & Munk, L. M. 2006. Miljøfremmede stoffer og tungmetaller i vand-miljøet – Tilstand og udvikling (Environmentally hazardous substances and heavy metals in Danish aquatic environment - State and trends), 1998-2003. In Danish. 140 p. DMU (NERI) Rapport 585. Danmarks Miljøundersøgelser.
* Brooke, D., Footitt, A. & Nwaogu, T.A. 2004. Environmental Risk Evaluation Report: Perfl uorooctanesulphonate (PFOS). UK Environment Agency. 96 p.
* BUA 2003. BUA report 238 – supplementary report for tributyl tin oxide. German Chemical Society. 108 p.
* BUA 2004. BUA report 237 – supplemen-tary report for chlorinated paraffi ns. German Chemical Society. 33 p.
* Burreau, S., Zebühr, Y., Broman, D. & Ishaq, R. 2004. Biomagnifi cation of polychlorinated biphenyls (PCBs) and polybrominated diphe-nyl ethers (BDEs) studied in pike (Esox lucius), perch (Perca fl uviatilis) and roach (Rutilus rutilus) from the Baltic Sea. Chemosphere 55: 1043-1052.
* Cato, I. & Kjellin B. 2005. The National Swedish Status and Trend Monitoring Programme based on Chemical Contamination in Offshore Sediment – an overview of the results from 2003. SGU-report 2005:25. Geological Survey of Sweden. 19 p.
* Christensen, J. H. & Platz, J. 2001. Screening of polybrominated diphenyl ethers in blue mus-sels, marine and freshwater sediments in Denmark. Journal of Environmental Monitoring (3): 543-547.
* Christensen, J. H., Groth, B. S., Vikelsøe, J. & Vorkamp, K. 2003. Polybrominated diphenyl ethers (BDEs) in sewage sludge and wastewa-ter. 28 p. NERI technical report 481. National Environment Research Institute.
References

90
* Ciesielski, T., Wasik, A., Kuklik, I., Skora, K., Namieśnik, J. & Szefer, P. 2004. Organotin compounds in the liver tissue of marine mam-mals from the Polish coast of the Baltic Sea. Environ. Sci. Technol. 38: 1415-1420.
* Corsi, S. H., Zitomer, D. H., Field, J. A. & Cancilla, D. A. 2003. Nonylphenol ethoxylates and other additives in aircraft deicers, antiicers, and waters receiving airport runoff. Environ. Sci. Technol. 37: 4031-4037.
* Cousins, A. P., Remberger, M., Andersson, J., Kaj, L., Strömberg, K., Ekheden, Y., Dusan, B., Brorström-Lundén, E. & Cato, I. 2005. Results from the Swedish National Screening Programme 2004 – Sub-report 5: Mirex and Endosulfan. IVL report B1641. 40 p. IVL Swedish Environmental Research Institute Ltd.
* Dinglasan, M.J.A., Ye, Y., Edwards, E.A, & Mabury, S.A. 2004. Fluorotelomer alcohol bio-degration yields poly- and perfluorinated acids. Environ. Sci. Technol. 38: 2857-2864.
* DMU 2007. Dansk opfyldelse af forpligtelsen til overvågning af Vandrammedirektivets priori-terede stoffer i overfladevand. 3. oktober 2006, rev. 21. september 2007. 28 p. Danmarks Miljøundersøgelser.
* Dudutyte, Z., Manusadţianas, L. & Đčeponavičiűte, R. 2007. Report on danger-ous substances in the aquatic environment of Lithuania. 53 p.
* EC 2003. Technical Guidance Document in support of Commission Directive 93/67/EEC on Risk Assessment for new notified substances, Commission Regulation (EC) No 1488/94 on Risk Assessment for existing substances and Directive 98/8/EC of the European Parliament and of the Council concerning the placing of biocidal products on the market - part II. 328 p. European Chemicals Bureau.
* Ellis, D.A., Martin, J.W., De Silva, A.O., Mabury, S.A., Hurley, M.D., Andersen, M.P.S. & Wallington, T.J. 2004. Degradation of fluoro-telomer alcohols: a likely atmospheric source of perfluorinated carboxylic acids. Environ. Sci. Technol. 38: 3316-3321.
* EU-RAR 1999. European Union Risk Assessment on alkanes, C10-13, chloro. Final
report. European Union Risk assessment report 4. 163 p. European Chemicals Bureau.
* EU-RAR 2000. European Union Risk assess-ment on pentabromodiphenyl ether. Final report. European Union Risk assessment report 5. 277 p. European Chemicals Bureau.
* EU-RAR 2002a. European Union Risk assessment on bis(pentabromophenyl) ether. Final report. European Union Risk assess-ment report 17. 279 p. European Chemicals Bureau.
* EU-RAR 2002b. European Union Risk assessment on 4-nonylphenol (branched) and nonylphenol. Final report. European Union Risk assessment report 10. 227 p. European Chemicals Bureau.
* EU-RAR 2003. European Union Risk assess-ment on diphenyl ether, octabromo derive. Final report. European Union Risk assess-ment report 16. 259 p. European Chemicals Bureau.
* EU-RAR 2004. European Union Risk assess-ment on decabromodiphenyl ether. Update of the risk assessment - final environmental draft of May 2004. 114 p. European Chemicals Bureau.
* EU-RAR 2005. European Union Risk Assessment on alkanes, C14-17, chloro. Final report. European Union Risk assessment report 58. 257 p. European Chemicals Bureau.
* EU-RAR 2006. European Union Risk assess-ment on hexabromocyclododecane. Draft October 2006. European Union Risk assess-ment report 58. 356 p. European Chemicals Bureau.
* Falandysz, J., Strandberg, L., Puzyn, T., Gucia, M. & Rappe, C. 2001. Chlorinated cyclodiene pesticide residues in blue mussel, crab, and fish in the Gulf of Gdańsk, Baltic Sea. Environ. Sci. Technol. 35: 4163-4169.
* Falandysz, J., Taniyasu, S., Gulkowska, A., Yamashita, N. & Schulte-Oehlmann, U. 2006. Is fish a major source of fluorinated surfactants in humans living on the Baltic coast? Environ. Sci. Technol. 40: 748-751.

91
Ba
ltic
Se
a E
nvi
ron
me
nt P
roc
ee
din
gs
No
. 119
* Finnish Ministry of Environment. 2004. Sedimenttien ruoppaus- ja läjitysohje (Instructions for dredging and depositing dredged materials). In Finnish and Swedish. 121 p. Environmental Guide 117.
* Finnish Ministry of Environment. 2006. Vesiympäristölle haitalliset ja vaaralliset ain-eet pintavesissä - Ympäristöministeriön työry-hmän mietintö (Harmful and dangerous sub-stances for surface waters) - Task force report for Ministry of Environment). In Finnish. 202 p. Ympäristöministeriön monistesarja 159
* Finnish Ministry of Environment. 2007. Orgaaniset tinayhdisteet Suomen vesial-ueilla – Ympäristöministeriön työryhmän mietintö (Organic tin compounds in Finnish aquatic environment - Task force report for Ministry of Environment). In Finnish. 85 p. Ympäristöministeriön raportteja 11/2007
* Gawlik, B. M. & Bidoglio, G. (eds.) 2004. Evaluation of the relevance of organic micro-pollutants in sewage sludge. Provisional report for commenting: results of a JRC-coordinated survey on background values. 47 p. European Commission, DG JRC.
* Giesy, J.P. & Kannan, K. 2001. Global distri-bution of perfluorooctane sulfonate in wildlife. Environ. Sci. Technol. 35: 1339–1342.
* Giesy, J.P. & Kannan, K. 2002. Perfluorochemical surfactants in the envi-ronment. Environ. Sci. Technol. April 2002: 147A–152A.
* Harstad, K. 2006. Handling and assessment of leachates from municipal solid waste landfills in the Nordic Countries. TemaNord 2006:594. 173 p. Nordic Council of Ministers.
* Haskoning 2002. Haskoning fact sheet on tributyltin compounds. Final draft. 18 p.
* HELCOM 2002a. Guidance document on nonylphenol / nonylphenolethoxylates (NP/NPEs). 25 p. Helsinki Commission.
* HELCOM 2002b. Guidance document on short chained chlorinated paraffins (SCCP). 20 p. Helsinki Commission.
* HELCOM 2007. Towards a Baltic Sea
Unaffected by Hazardous Substances - HELCOM Overview 2007. Background Document for HELCOM Ministerial Meeting in Krakow, Poland, 15 November 2007. 48 p. Helsinki Commission.
* Higgins, C.P., Field, J.A., Criddle, C.S. & Luthy, R.G. 2005. Quantitative determination of perfluorochemicals on sediments and domestic sludge. Environ. Sci. Technol. 39: 3946–3956.
* Hoch, M. 2001. Organotin compounds in the environment – an overview. Applied Geochemistry 16: 719-743.
* Holmström, K.E., Järnberg, U. & Bignert, A. 2005. Temporal trends of PFOS and PFOA in guillemot eggs from the Baltic Sea, 1968–2003. Environ. Sci. Technol. 39: 80–84.
* Houde, M., Martin, J.W., Letcher, R.J., Solomon, K.R., Muir, D.C.G. 2006. Biological monitoring of polyfluoroalkyl substances: a review. Environ. Sci. Technol. 40: 3463-3473.
* Huang, J.H. & Klemm, O. 2004. Atmospheric speciation of ionic organotin, organolead and organomercury compounds in NE Bavaria (Germany). Atmos. Environ. 38: 5013-5023.
* Junestedt, C., Ek, M., Solyom, P., Palm, A., Öman, C. & Cerne, O. 2003. Karakterisering av utsläpp - jämförelse
av olika utsläpp till vatten. IVL B1544. 140 p.
* Järnberg, U., Holmström, K., van Bavel, B. & Kärrman, A. 2006. Perfluoroalkylated acids and related compounds (PFAS) in the Swedish environment- Chemistry, sources & exposure. Report to Swedish Environment Protection Agency. 65 p.
* Kallenborn, R., Berger, U. & Järnberg, U. 2004. Perfluorinated alkylated substances (PFAS) in the Nordic environment. TemaNord 2004:552. 107 p. Nordic Council of Ministers.
* Kannan, K. & Falandysz, J. 1997. Butyltin residues in sediment, fish, fish-eating birds, harbour porpoise and human tissues from the Polish coast of the Baltic Sea. Marine Pollution Bulletin 34: 203-207.

92
* Kannan, K., Senthilkumar, K., Duda, C.A., Villeneuve, D.L., Falandysz, J. & Giesy, J. 1999. Butyltin compounds in sediment and fish from the Polish coast of the Baltic Sea. Environmental Science Pollution Research 6: 200-206.
* Kannan, K., Koistinen, J., Beckmen, K., Evans, T., Gorzelany, J.F., Hansen, K.J., Jones, P.D., Helle, E., Nyman, M. & Giesy, J.P. 2001. Accumulation of perfluorooctane sulfonate in marine mammals. Environ. Sci. Technol. 35: 1593–1598.
* Kannan, K., Corsolini, S., Falandysz, J., Oehme, G., Focardi, S. & Giesy, J. 2002. Perfluorooctanesulfonate and related fluori-nated hydrocarbons in marine mammals, fishes, and birds from coasts of the Baltic and the Mediterranean Seas. Environ. Sci. Technol. 36: 3210–3216.
* KEMI 2004. PFOS-relaterade ämnen - Strategi för utfasning (PFOS Related Substances – the Strategy for Phase-out). In Swedish. Kemikalieinspektionen (Swedish Chemical Agency). 90 p.
* KEMI 2005. Antibakteriella substanser och azofärgämnen i varor. In Swedish. Kemikalieinspektionen (Swedish Chemical Agency) 5/05. 15 p.
* KEMI 2006a. Perfluorinated substances and their uses in Sweden. Swedish Chemical Agency (KEMI) Report 7/06. 58 p.
* KEMI 2006b. Swedish answer to OECD Survey of Production and Use Information on PFOS, PFAS, PFOA, PFCA, their related substances and products/mixtures containing these substances. Swedish Chemical Agency (KEMI). 18 p.
* Kjølholt, J. & Jensen, F. K. 1997. Miljøfremmede stoffer i overfladeafstrømning fra befæstede arealer (Environmentally hazardous sub-stances in storm water). Miljøprojekt nr. 355. 97 p. In Danish. Miljø- og Energiministeriet.
* Korkki, K. 2006. Perfluorattujen alkyyliaineiden (PFAS) aiheuttamat ympäristöriskit Suomessa (Use of perfluorinated alkylated substances (PFAS) and identification of environmental emission risks in Finland). In Finnish. Suomen Ympäristo 14. 79 p.
* Law, R. J., Allchin, C. R., de Boer, J., Covacu, A., Herzke, D., Lepom, P., Morris, S., Tronczynski, J. & de Wit, C. A. Chemosphere. 2006. Chemosphere 64: 187-208
* Lehmler, H.-J. 2005. Synthesis of environ-mentally relevant fluorinated surfactants - a review. Chemosphere 58: 1471–1496.
* Lundstedt-Enkel, K., Asplund, L., Nylund, K., Bignert, A., Tysklind, M., Olsson, M. & Örberg, J. 2006. Multivariate data analysis of organo-chlorines and brominated flame retardants in Baltic Sea guillemot (Uria aalge) egg and mus-cle. Chemosphere 65: 1591–1599.
* Mersiowsky, I., Brandsch, R. & Ejlertsson, J. 2001. Screening for organotin compounds in European Landfill leachates. J. Environ. Qual. 30: 1604-1611.
* Mester, Z. & Sturgeon, R. 2002. Detection of volatile organometal chloride species in model atmosphere above seawater and sediment. Environ. Sci. Technol. 36: 1198-1201.
* Nakari, T. 2003. Kunnallisten jätevesien hor-monaalinen aktiivisuus (Estrogenicity of efflu-ents of municipal sewage treatment plants). Suomen ympäristö 626. 20 s. In Finnish. Suomen ympäristökeskus.
* OECD 2002. Hazard Assessment of per-fluorooctane sulfonate (PFOS) and its salts. Environmental directorate, Joint meeting of the chemicals committee and the working party on chemicals, pesticides and biotechnology. Report JT00135607, ENV/JM/RD(2002)17/ FINAL. 363 p.
* OECD 2005. Results of survey on production and use of PFOS, PFAS and PFOA, related substances and products/mixtures contain-ing these substances. OECD Environment, Health and Safety Publications. Series on Risk Management No. 19. 59 p.
* OECD 2006. Preliminary lists of PFOS, PFAS, PFOA and related compounds and chemicals that may degrade to PFCA. OECD Environment, Health and Safety Publications. Series on Risk Management No. 21. Report JT03207450, ENV/JM/MONO(2006)15. 194 p.

93
Ba
ltic
Se
a E
nvi
ron
me
nt P
roc
ee
din
gs
No
. 119
* Oehme, M., Theobald, N., Baaβ, A.-C., Hüttig, J., Reth, M., Weigelt-Krentz, S., Zencak, Z. & Haarich, M. 2005. Identification of organic compounds in the North and Baltic Seas. Final report. 148 p. German Federal Environmental Agency.
* Olsson, A., Vitinsh, M., Plikshs, M. & Bergman, Å. 1999. Halogenated environmen-tal contaminants in perch (Perca fluviatilis) from Latvian coastal areas. The Science of the Total Environment 239: 19-30.
* OSPAR 1997. Agreed ecotoxicological assessment criteria for trace metals, PCBs, PAHs, TBT and some organochlorine pesti-cides. Joint Meeting of the OSLO and Paris Commissions, Brussels: 2-5 September 1997.
* OSPAR 2000 (updated in 2004). OSPAR background document on organic tin com-pounds. 18 p. OSPAR Commission.
* OSPAR 2001a (updated in 2004). OSPAR background document on certain brominated flame retardants – polybrominated diphe-nylethers, polybrominated biphenyls, hexabro-mocyclododecane. 23 p. OSPAR Commission.
* OSPAR 2001b (updated in 2004). OSPAR background document on nonylphenol / nonyl-phenolethoxylates. 20 p. OSPAR Commission.
* OSPAR 2001c. OSPAR background docu-ment on short chain chlorinated paraffins. 18 p. OSPAR Commission.
* OSPAR 2002 (updated in 2004). OSPAR background document on endosulfan. 42 p. OSPAR Commission.
* OSPAR 2003 (updated in 2006). OSPAR background document on octylphenol. 32 p. OSPAR Commission.
* OSPAR 2005 (updated in 2006). OSPAR background document on perfluorooctane sul-phonate. 46 p. OSPAR Commission.
* Palm, A., Brorström-Lunden, E. & Breivik, K. 2004. Transport and fate of polybrominated diphenyl ethers in the Baltic and Arctic regions. TemaNord 2004:554. 77 p. Nordic Council of Ministers.
* Paxeus, N. 2000. Organic compounds in municipal landfill leachates. Water Science and Technology Vol. 42 Nos 7.8: 323-333.
* Poulsen, P., Jensen, A. & Wallström, E. 2005. More environmentally friendly alternatives to PFOS-compounds and PFOA. Environmental Project No. 1013. 162 p. Danish Environmental Protection Agency.
* Prevedouros, K., Cousins, I.T., Buck, R.C. & Korzeniowski, S.H. 2006. Sources, fate and transport of perfluorocarboxylates. Environ. Sci. Technol. 40: 32-44.
* Remberger, M., Kaj, L., Palm, A., Sternbeck, J., Kvernes, E. & Brorström-Lunden, E. 2004a. Screening tertiary butylphenols, methyl-phenols, and long-chain alkylphenols in the Swedish environment. IVL report B1594. 93 p. IVL Swedish Environmental Research Institute Ltd.
* Remberger, M., Sternbeck, J., Palm, A., Kaj, L., Strömberg, K. & Brorström-Lunden, E. 2004b. The environmental occurrence of hexabromo-cyclododecane in Sweden. Chemosphere 54: 9-21.
* RPA & BRE 2004. Perfluorooctane Sulphonate – Risk reduction strategy and analysis of advantages and drawbacks. Final Report prepared for Department for Environment, Food and Rural Affairs and the Environment Agency for England and Wales. RPA (Risk & Policy Analysts Ltd.) in association with BRE Environment. 266 p.
* RPA 2005. Risk assessment studies on tar-geted consumer applications of certain organo-tin compounds. Final report – September 2005. Risk & Policy analysts Limited - prepared for the European Commission. 128 p.
* Schulte-Ohehlmann, U., Oehlmann, J., Fioroni, P., Bauer, B. 1997. Imposex and repro-ductive failure in Hydrobia ulvae (Gastropoda: Prosobranchia). Marine biology, 128: 257–266.
Schulte-Ohehlmann, U., Oehlmann, J., Bauer, B., Fioroni, P., Leffler, U-S. 1998. Toxico-kinetic and -dynamic aspects of TBT-induced imposex in Hydrobia ulvae compared with intersex in Littorina littorea (Gastropoda, Prosobranchia). Hydrobiologia, 378: 215–225.

94
* Sinclair, E. & Kannan, K. 2006. Mass loading and fate of perfluoroalkyl surfactants in waste-water treatment plants. Environ. Sci. Technol. 40: 1408-1414.
* Sternbeck, J., Remberger, M., Lennart, K., Strömberg, K., Palm, A. & Brorström-Lundén, E. 2001. HBCD i Sverige – screening av ett bromerat flamskyddsmedel. IVL report B1434. IVL Swedish environmental research institute.
* Sternbeck, J., Brorström-Lundén, E., Remberger, M., Lennart, K., Palm, A., Junedahl, E. & Cato, I. 2003. WFD priority substances in sediments from Stockholm and the Svealand coastal region. 82 s. IVL report B1538. IVL Swedish environmental research institute.
* Sternbeck, J., Lennart, K., Remberger, M., Palm, A., Junedahl, E., Bignert, A., Haglund, P., Lindkvist, K., Adolfsson-Erici, M., Nylund, K. & Asplund, L. 2004. Organiska miljögifter i fisk från svenska bakgrundslokaler. 47 p. IVL report B1576. IVL Swedish environmental research institute.
* Sternbeck, J., Fäldt, J. & Österås, A. H. 2006. Screening of organotin compounds in the Swedish environment. Report for Swedish Environment protection Agency. 53 p.
* Strand, J., and Jacobsen, J.A. 2002. Imposex in Two Sublittoral Neogastropods from the Kattegat and Skagerrak: the Common Whelk Buccinum undatum and the Red Whelk Neptunea antiqua. Marine Ecology Progress Series, 244: 171–177. Strand, J. 2003: Coupling marine monitoring and risk assessment by inte-grating exposure, bioaccumulation and effect studies . A case study using the contamination of organotin compounds in the Danish marine environment. PhD thesis. Roskilde University. 92 pp + papers. Available at: http://hdl.handle.net/1800/571
* Strand, J., Jacobcen, J.A., Pedersen, B. & Granmo, Å. 2003. Butyltin compounds in sedi-ment and molluscs from the shipping strait between Denmark and Sweden. Environmental Pollution 124: 7-15.
* Strand, J. & Jacobsen, J.A. 2005: Accumulation and trophic transfer of organotins in a marine food web from the Danish coastal waters. Science of the Total Environment 350: 72-85.
Strand, J., Larsen, M.M. & Lockyer, C. 2005: Accumulation af organotin compounds and mercury in harbour porpoises (Phocoena phocoena) from the Danish waters and West Greenland. Science of the Total Environment 350: 59-71.
* Strand, J., Bossi, R., Sortkjær, O., Landkildehus, F. & Larsen, M.M. 2007. PFAS og organotinforbindelser i punktkilder og det akvatiske miljø (PFAS and organotin com-pounds in point source effluents and in aquatic environment). In Danish. 49 p. DMU (NERI) Rapport 608. Danmarks Miljøundersøgelser.
* Swedish Environment Protection Agency. 2005. Höga halter av miljöfarliga ämnen i miljön? – resultat från Miljöövervakningens Screeningprogram 1996-2003 (High con-centrations of hazardous substances in the environment? - results from the Swedish Screening Programme 1996-2003). 147 p. Naturvårdsverket rapport 5449.
* Swedish Environment Protection Agency. 2006. Vilka halter av miljöfarliga ämnen hitter vi i miljön? – resultat från Miljöövervakningens Screeningprogram 2003-2004 (What concen-trations of hazardous substances do we find in the environment? - results from the Swedish Screening Programme 2003 – 2004). 124 p. Naturvårdsverket rapport 5524.
* Svensson, A. 2002. Miljögifter i avloppsslam – en studie omfattande 19 reningsverk i Västra Götaland. 47 p. Länstyrelsen Västra Götaland rapport 2002:39.
* Tesfalidet, S. 2004. Screening of organotin compounds in the Swedish environment. 23 p.
* Theobald, N., Gerwinski, W., Caliebe, C. & Haarich, M. (2007): Development and vali-dation of a method for the determination of polyfluorinated organic substances in sea water, sediments and biota - Occurrence of these Compounds in the North and Baltic Seas. Project 202 22 213 of the Federal Environmental Agency, Germany. Report available: http://www. umweltbundesamt.de/uba-info-medien/dateien/3509.htm. 133 p. (in German; Executive summary in English)
* UK-EPA 2005. Briefing note – Octylphenol and its ethoxylates. June 2005. UK Environment Agency. 3 p.

* Vaara, M. 2003. Use of selected brominated flame retardants and organic phosphates – estimation of import, use and emissions in Finland. 10 p.
* Vatanen, S., Niinimäki, J. & Haikonen, A. (eds.) 2006. Vuosaaren satamahankkeen vesistö- ja kalatalousseuranta 2005 (Water pollution control for construction of Vuosaari Harbour - results of year 2005). Vuosaaren satamahankkeen julkaisuja 1/2006. In Finnish. 120 p.
* WFD-EAF. 2004a. Expert Advisory Forum on priority substances under Water Framework Directive. Source screening of priority sub-stances under the WFD - Tributyltin. Version 4. 2 p.
* WFD-EAF. 2004b. Expert Advisory Forum on priority substances under Water Framework Directive. Source screening of priority sub-stances under the WFD – Brominated diphe-nylethers. Version 4. 3 p.
* WFD-EAF 2004c. Expert Advisory Forum on priority substances under Water Framework Directive. Substance Data Sheet on penta-BDE, draft of 1st March 2004. 12 p.
* WFD-EAF. 2004d. Expert Advisory Forum on priority substances under Water Framework Directive. Source screening of priority sub-stances under the WFD – Octylphenols. Version 4. 2 p.
* WFD-EAF 2004e. Expert Advisory Forum on priority substances under Water Framework Directive. Substance Data Sheet on octylphe-nols, draft of 1st March 2004. 13 p.
* WFD-EAF. 2004f. Expert Advisory Forum on priority substances under Water Framework Directive. Source screening of priority sub-stances under the WFD – C10-13-chloroalkanes. Version 4. 3 p.
* WFD-EAF 2005a. Expert Advisory Forum on priority substances under Water Framework Directive. Substance Data Sheet on tributyl-tin compounds (TBT-ion), final version 15th January 2005. 15 p.
* WFD-EAF 2005b. Expert Advisory Forum on priority substances under Water Framework Directive. Substance Data Sheet on 4-nonyl-
phenol (branched) and nonylphenol, final ver-sion 31st July 2005. 18 p.
* WFD-EAF 2005c. Expert Advisory Forum on priority substances under Water Framework Directive. Substance Data Sheet on C10-13-chlo-roalkanes, final version 31st July 2005. 16 p.
* WFD-EAF 2005d. Expert Advisory Forum on priority substances under Water Framework Directive. Substance Data Sheet on endosul-fan, final version 15th January 2005. 19 p.
* Yamashita, N., Kannan, K., Taniyasu, S., Horii, Y., Petrick, G. & Gamo, T. 2005. A glo-bal survey of perfluorinated acids in oceans. Marine Pollution Bulletin 51: 658-668.
* Ærtebjerg, G. & Andersen, J.H. (eds.), Bendtsen, J., Carstensen, J., Christiansen, T., Dahl, K., Dahllöf, I., Ellermann, T., Fossing, H., Greve, T.M., Gustafsson, K., Hansen, J.L.S., Henriksen, P., Josefson, A.B., Krause-Jensen, D., Larsen, M.M, Markager, S., Nielsen, T.G., Ovesen, N.B., Petersen, J.K., Riemann, B., Risgaard-Petersen, N., Ambelas Skjøth, C., Stedmon, C., Strand, J., Nielsen, S.P., Jensen, J.B & Madsen, H.B. 2004. Marine områder 2003 – Miljøtilstand og udvikling (in Danish). Marine områder 2003 – Miljøtilstand og udvik-ling. NERI Scientific Report No. 513. 97p.
* Ærtebjerg, G., Bendtsen, J., Carstensen, J., Christiansen, T., Dahl, K., Dahllöf, I., Ellermann, T., Gustafsson, K., Hansen, J.L.S., Henriksen, P., Josefson, A.B., Krause-Jensen, D., Larsen, M.M., Markager, S.S., Ovesen, N.B., Skjøth, C.A., Strand, J., Söderkvist, J., Mouritsen, L.T., Bråten, S., Hoffmann, E. & Richardson, K. 2005. Marine områder 2004 - Tilstand og udvikling i miljø- og naturkvaliteten (in Danish). NERI Scientific Report No. 551. 94p.
95
Ba
ltic
Se
a E
nvi
ron
me
nt P
roc
ee
din
gs
No
. 119


Helsinki CommissionBaltic Marine Environment Protection Commission

HELSINKI COMMISSIONBaltic Marine Environment Protection Commission
Katajanokanlaituri 6 BFI-00160 Helsinki
Finland
ISSN 0357-2994