hb-leds and solid state lighting: challenges and opportunities · • recent market slowdown due to...
TRANSCRIPT

HB-LEDs and Solid State Lighting: Challenges and Opportunities
Tom MorrowExecutive Vice President
SEMI

Agenda
• About SEMI• LEDs and Solid State Lighting
– Why the excitement?• Current Market Outlook for
LEDs and SSL • Focus 2020
– Manufacturing Cost Reduction– The Role of Manufacturing
Standards in Long-Term Cost Reduction
• Focus 2020– Accelerating Consumer
Acceptance

About SEMI
• Global industry association• ~2000 members• Established in 1970 to serve
the semiconductor supply chain• Today serves members interests
in the following industries:– Semiconductor– Flat Panel Display– Photovoltaic/Tech-Energy– LEDS– MEMS
BangaloreBerlin
BrusselsGrenobleMoscow
ShanghaiSeoul
San JoseSingapore
TaipeiWashington DC

Current SEMI LED Activities • Major Events:
– 6th Annual LED Korea, co-located with SEMICON Korea (Feb. 7-9, 2012)
– China HB LED Manufacturing Forum and Pavilion, SEMICON China (March 20-22)
– LED/SSL Market Forum, SEMICON Russia, Moscow, (May 15-16, 2012)
– LED Manufacturing Forum, SEMICON West (July 11, 2002)
– LED Pavilion and Manufacturing Forum, SEMICON Taiwan (Sept 5-7, 2012)
– Japan New Technologies Pavilion, LED Symposium, SEMICON Japan (Dec 5-7, 2012)
– SSL Summit, India (Sept 3-5, 2012)• Industry Research-Opto/LED Fab Watch
and Forecast• Manufacturing Standards development• Public Policy
LED Manufacturing Seminar, Taiwan, 2011
LED Korea, 2011LED Day, SEMICON West, 2010
LED Manufacturing Forum, SEMICON China
Standards Workshop, China SSL, Nov. 2011
LED Forum, Taiwan,
5
SEMI LED Advisory CommitteesNorth American and EuropeChinaIndiaKorea
Participating Companies (partial list)

Solid State Lighting:Why the Excitement

Industry Transformation

Solid State Lighting (SSL)
• Over 1/3 of the electricity for lighting could realistically be saved: nearly 900 billion kWh (OSRAM)
• Japan IEE report estimates Japan electricity consumption can be reduced 9% with LED lighting
• SSL can save by 2025*:– I billion barrels of oil– Reduce the need for 250
nuclear power plants– Annual energy savings in US
alone of 1.5 Peta (1015)W/h– Reduce CO2 emissions by 952
metric tons
*Rensselaer Polytechnic Institute, Smart Lighting Center, SSL Summit, 2011

LED/Solar Lighting Systems
“Renewable Energy based Solid State Lighting is arguably themost important Agent of Change available to the DevelopingWorld in the past 100 years!”
Light Up the World
India Off Grid LED/Solar Lighting SystemsSource: Light Up the World
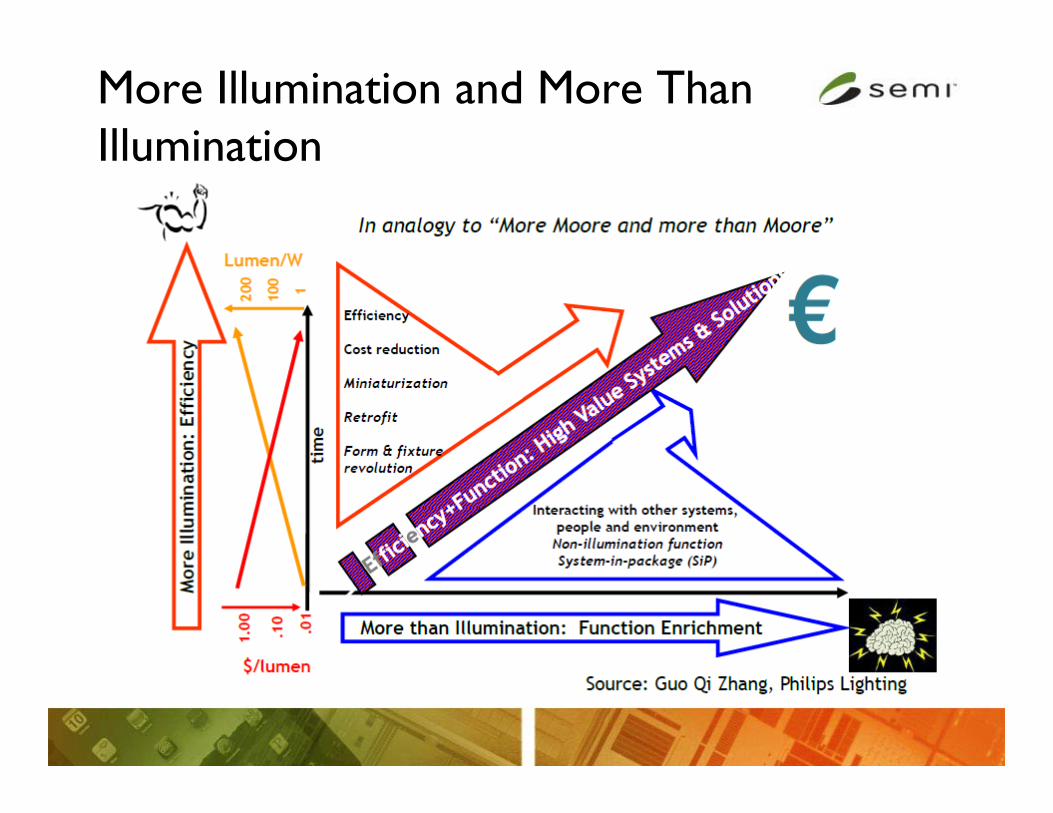
More Illumination and More Than Illumination

Revolution in Smart Lighting
• Fully integrated systems with sensors and controls
• Any color, any time• Data with illumination• Illumination with video• Pollution and health
monitoring• Biochemical sensing and
mitigation• Circadian corrected lighting• Adaptive lighting

LEDs and SSL: Where we are today

LED Market Size and Growth
5.6
10.311.2
13.3
5.7
8.2 8
10
0
2
4
6
8
10
12
14
2009 2010 2011 2012
Strategies Un. IMS Research
-6%
GaN LED Only
Revenue in Billions

LED Market Sizing – Lighting as the Key Driver
Source: DOE, Goldman Sachs

15
Source: SEMI Opto/LED Fab Forecast, Nov. 2011
LED Dedicated FabsChanging LED Landscape
4 5 8
7 16 59
1 2 6
7 9 13
China
Japan
S. Korea 3 8 13
SEAsia 0 0 3
Taiwan 14 24 40
2001
36
127,124
Year (begin operation)
Total count of LED fabs
Capacity in 4-inch EQs w/m
2006
64
376,400
2011 (est)
142
~1,570,000
Americas Europe/Mideast

LED Fab Capacity by Region, 2012
Japan20%
Taiwan22%
SE Asia4%
China 24%
Americas7%
Europe & ME3%
Korea20%
LED Fab CapacityWorldwide LED Capacity2.33M in 2012 (4” equivalent per month) Top 10 Pkg LED Suppliers
1. Nichia 2. Samsung LED 3. Osram4. LG Innotek5. Seoul Semiconductor 6= Cree* 6= Philips Lumileds* 8. Sharp 9. Toyoda Gosei10. EverlightSource: Strategies Unlimited
Source: SEMI Opto/LED Fab Watch Nov. 2011

LED Equipment Spending
482
110
621
437
108
0
21
475
330
423
929
167
31
60
260
300
321
719
138
132
99
0 200 400 600 800 1,000
Korea
Japan
Taiwan
China
Americas
SE Asia
EU and Mideast
2012 2011 2010
1,779
2,415
1,969
0
500
1,000
1,500
2,000
2,500
3,000
Eq Spending
US$ millions
2010 2011 2012
Source: SEMI Opto/LED Fab Watch Nov. 2011
In $US Millions

Market Situation Summary• Recent market slowdown due to weaker demand for LCD panels
and less LEDs per panel:– New TV models, and purchasing schedules expected to drive demand pick
up from 1Q12 onwards
• 2011 LED ASP decline ~25-40%• Rapid capacity increase followed by low fab utilization (~50-80%)• Solid state lighting to become key market driver in 2012 and
beyond• MOCVD shipment is expected to slow down significantly next year
after two years of aggressive investment• Opportunities increasing for larger wafers and non-MOCVD
equipment

Challenges to 2020Manufacturing Cost Reduction Consumer Acceptance

$302
$231
$185
$140
$101
$77
$48$32
$22 $16 $13 $61317
2229
35
41
65
81
88
100
115
120
0
20
40
60
80
100
120
140
$0
$50
$100
$150
$200
$250
$300
$350
2000 2001 2002 2003 2004 2005 2006 2007 2008 2009 2010 2011
$/Klm
Average lm/1W pkg
Typical High Performance1W Cool White LED Package
$/K
lm
Ave
rage
lm/lW
pkg
Cost/Performance History
Source: Strategies Unlimited, SiL 2012

LED Cost Reduction Roadmap
Solid State Lighting Cost Reduction Roadmap
LED Package Cost Reduction Roadmap
Manufacturing standards are essential to meet the industry’s long term cost reduction needs

Importance of Manufacturing Standards
• Effective global standards allow manufacturers to buy equipment and materials from multiple vendors with minimal adaption
• Effective global standards allows suppliers to focus on innovation and critical price and performance variables
LED Manufacturers
LED Suppliers
Standards: Passport to Global Innovation

SEMI Standards• Standards Development for over 35
years• ~1800 standards , 4000 volunteers, 20
Technical Committees and 200 Task Forces
• Formed HB-LED Standards Committee in November 2010
• 150 participants• Current Status
• Wafer Task Force- 6” Sapphire Wafer Standard in Ballot
• Factory Automation Task Force• Environmental Health & Safety Task Force• Sapphire Defects and Impurities Task Force

Why 6” Wafer Standards?Wafer Size and CoO
1. Investment♦ Capacity
A = n••r2
A(4“)/A(2“) = 1 => same capacity
♦ with 3mm edge exclusionA = n••(r-e)2
A(4“)/A(2“) = 1.14 => +14% capacity
♦ System investment$/1.14 = 0.88
=> 88%
56x2” 14x4” 56x2” 8x6” 56x2” 5x8”
1. Investment♦ Capacity
A = n••r2
A(6“)/A(2“) = 1.29 => +29% capacity
♦ with 3mm edge exclusionA = n••(r-e)2
A(6“)/A(2“) = 1.53 => +53% capacity
♦ System investment$/1.53 = 0.65
=> 65%
1. Investment♦ Capacity
A = n••r2
A(8“)/A(2“) = 1.43 => +43% capacity
♦ with 3mm edge exclusionA = n••(r-e)2
A(8“)/A(2“) = 1.74 => +74% capacity
♦ System investment$/1.74 = 0.58
=> 58%
2. Running Cost$/1.14 => 88%
3. Chip ProcessAssume 150% processing time of 4“ compared to 2“:(42/1.5)/(22/1) = 2.7x Throughput
2. Running Cost$/1.53 => 65%
3. Chip ProcessAssume 200% processing time of 6“ compared to 2“:(62/2)/(22/1) = 4.5x Throughput
2. Running Cost$/1.74 => 58%
3. Chip ProcessAssume 250% processing time of 8“ compared to 2“:(82/2.5)/(22/1) = 6.4x Throughput
Source: AIXTRON

Substrate Trends
Source: Yole Developpment

150 mm Wafer Standards
• Critical for factory automation and other standards
• Currently in ballot• Covers 4 150 mm wafer
geometry options– Flat and Notched– 2 thickness options
• 17 Key Parameters•Total Impurity Content •Wafer ID Marking •Front Surface Condition •Edge Surface Condition •Back Surface Condition •Diameter •Fiducial Type •Fiducial Dimensions •Flat Length
•Fiducial Notch Depth & Notch Angle •Fiducial Orientation •Edge Profile Template•Thickness, Center Point •Total Thickness Variation, Max. •Bow and Warp, Max. •Inclusions or Bubbles •Dislocations •Thermal Conductivity Uniformity
[n] [m]

Factory Automation Interfaces
• Critical Requirements:• Cassette
– Open cassette– Process tray cassette
• Load Port • Automated tracking
– Cassette/wafer– Process Tray
• Shipping Carrier
Cassette Specifications Identified for Industry Standard
PitchCapacityLoadport couplingMaterialID type and location (for automated tracking)Wafer supportEnd effector exclusionFirst wafer heightPocket volumeWindows / open sidewallsWafer planeOverall dimensionsManual gripsElectrical continuityAutomated gripping featuresWafer orientation featuresMapping
Ballot Expected Mid Year 2012

Challenges to Market Acceptance
• SSL Lamps are complex systems• Quality of light is subjective• Quality of products will vary• Cost competiveness in many
segments will remain a challenge
• Consumers resist change/complexity

Compact Fluorescent Lighting: Lessons Learned
• Introduced in 1970’s—Market Share 2000: 0.6%• Early consumer experience generated bad
reputation:– Too big– Buzz and flicker– High cost– Poor color quality (high CCT, low CRI)
• Marketing Mistakes by fractionated industry– Exaggerated life expectancy claims– Inconsistent incandescent equivalency claims– Inconsistent specifications and terminology
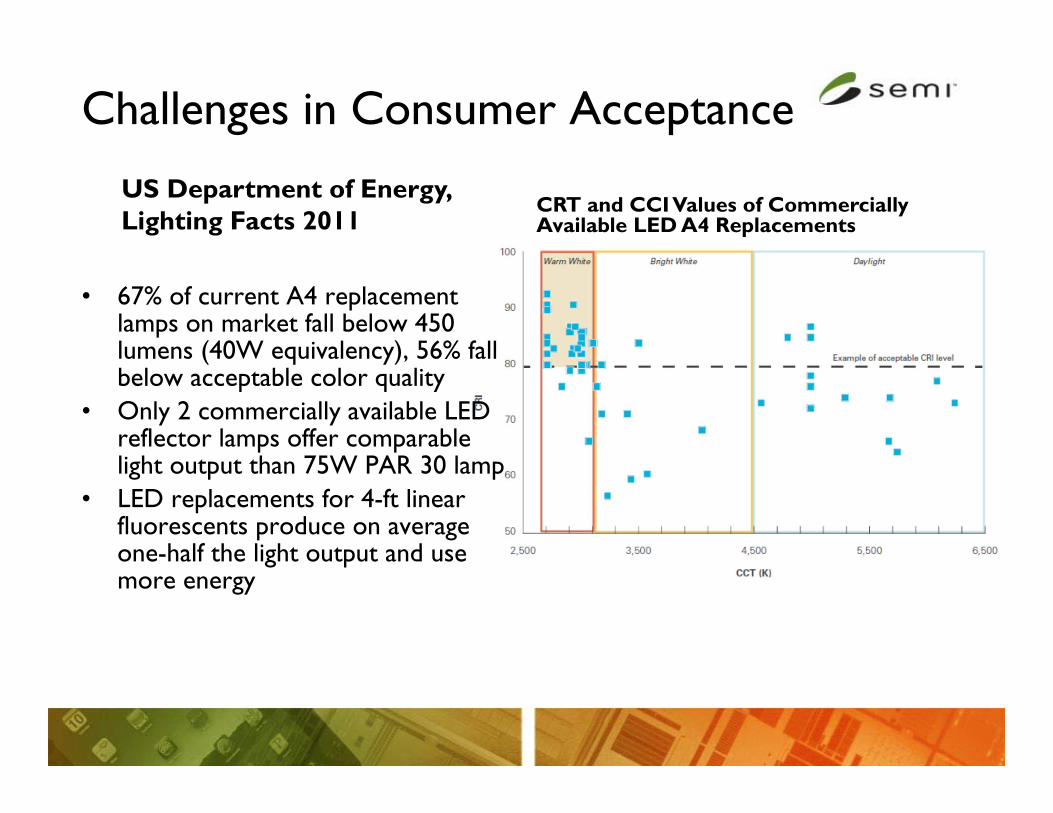
Challenges in Consumer Acceptance
US Department of Energy, Lighting Facts 2011
CRT and CCI Values of Commercially Available LED A4 Replacements
• 67% of current A4 replacement lamps on market fall below 450 lumens (40W equivalency), 56% fall below acceptable color quality
• Only 2 commercially available LED reflector lamps offer comparable light output than 75W PAR 30 lamp
• LED replacements for 4-ft linear fluorescents produce on average one-half the light output and use more energy

Complex Regulatory/StandardsEnvironment
International Standards Organizations Certifications/Labeling

Summary• SSL is a new industry with enormous
economic potential and environmental benefit
• A 10X improvement in $/klm at the packaged LED level is required to support widespread adoption of solid state lighting
• The majority of this cost reduction will occur through yield, throughput, productivity, and materials cost reduction
• Manufacturing Standards will accelerate cost reduction in packaged LEDs and will become the platform for advanced, automated LED manufacturing in the future
• Consumer labeling, quality certifications, and consumer education just beginning.