hbrmonthlyindicators_2011-07
TRANSCRIPT
8/6/2019 HBRMonthlyIndicators_2011-07
http://slidepdf.com/reader/full/hbrmonthlyindicators2011-07 1/13
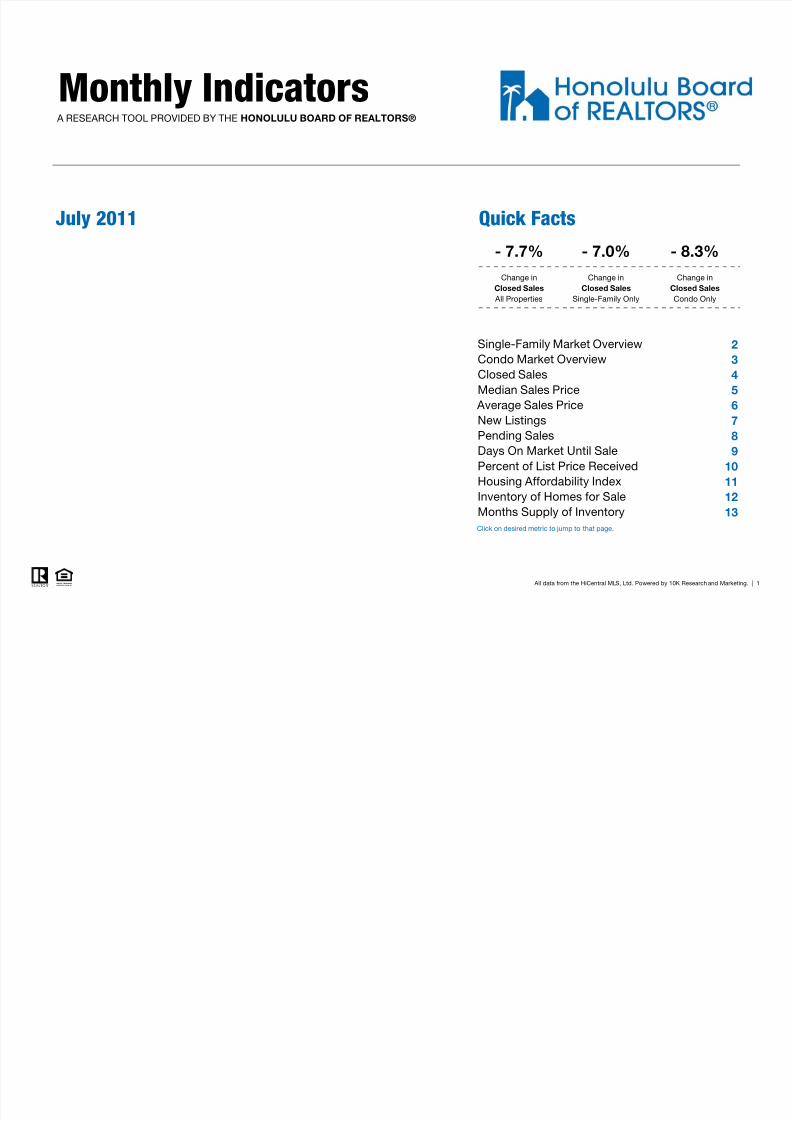
Monthly IndicatorsA RESEARCH TOOL PROVIDED BY THE HONOLULU BOARD OF REALTORS®
July 2011 Quick Facts
- 7.0%
Change in
Closed Sales
Single-Family Only
- 8.3%
Change in
Closed Sales
Condo Only
- 7.7%
Change in
Closed Sales
All Properties
2
3
4
5
6
7
8
9
10
11
12
13Click on desired metric to jump to that page.
Percent of List Price Received
Housing Affordability Index
Inventory of Homes for Sale
Months Supply of Inventory
All data from the HiCentral MLS, Ltd. Powered by 10K Research and Marketing. | 1
Single-Family Market Overview
Condo Market Overview
Closed Sales
Median Sales Price
Average Sales Price
New Listings
Pending Sales
Days On Market Until Sale

8/6/2019 HBRMonthlyIndicators_2011-07
http://slidepdf.com/reader/full/hbrmonthlyindicators2011-07 2/13
Single-Family Market OverviewKey market metrics for the current month and year-to-date figures for Single-Family Homes Only.
Key Metrics Historical Sparklines 7-2010 7-2011 + / – YTD 2010 YTD 2011 + / –
- 10.5% 32 36 + 12.5%
- 7.1%
268 300 + 11.9% 1,852 1,823 - 1.6%
3,102488 443 - 9.2% 3,340
- 7.0% 1,748
New Listings
Pending Sales
Closed Sales
Days on Market Until Sale
1,630 - 6.8%
38 34
270 251
7-2008 7-2009 7-2010 7-2011
7-2008 7-2009 7-2010 7-2011
7-2008 7-2009 7-2010 7-2011
7-2008 7-2009 7-2010 7-2011
66
--
-- --
--
--
+ 6.5%
- 12.5%
- 11.1%
1,511
6.0
All data from the HiCentral MLS, Ltd. Powered by 10K Research and Marketing. | Click for Cover Page | 2
- 2.2% $585,000 $575,000
- 0.6%- 0.9% 95.7% 95.1%
Months Supplyof Homes for Sale
$752,600 + 3.0%
94.9%
Housing Affordability Index
Inventory of Homes for Sale
6.7
68
- 1.7%Median Sales Price
Average Sales Price
Percent of Original
List Price Received
$730,763
95.8%
64
1,727
70 + 6.0%
--
$689,507 $704,914 + 2.2%
$604,500 $591,000
7-2008 7-2009 7-2010 7-2011
7-2008 7-2009 7-2010 7-2011
7-2008 7-2009 7-2010 7-2011
7-2008 7-2009 7-2010 7-2011
7-2008 7-2009 7-2010 7-2011
7-2008 7-2009 7-2010 7-2011
8/6/2019 HBRMonthlyIndicators_2011-07
http://slidepdf.com/reader/full/hbrmonthlyindicators2011-07 3/13
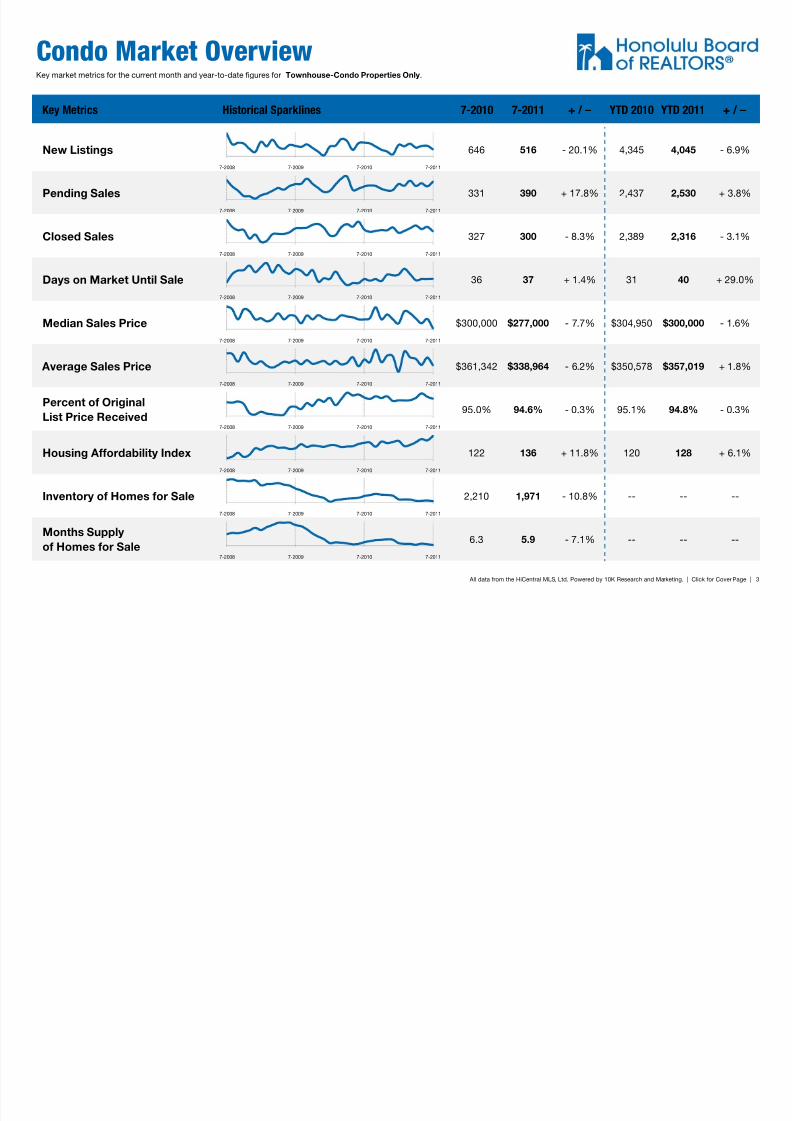
Condo Market OverviewKey market metrics for the current month and year-to-date figures for Townhouse-Condo Properties Only.
Key Metrics Historical Sparklines 7-2010 7-2011 + / – YTD 2010 YTD 2011 + / –
- 3.1%
Days on Market Until Sale 36 37 + 1.4% 31 40 + 29.0%
Closed Sales 327 300 - 8.3% 2,389 2,316
- 6.9%
Pending Sales 331 390 + 17.8% 2,437 2,530 + 3.8%
New Listings 646 516 - 20.1% 4,345 4,045
7-2008 7-2009 7-2010 7-2011
7-2008 7-2009 7-2010 7-2011
7-2008 7-2009 7-2010 7-2011
7-2008 7-2009 7-2010 7-2011
-- --
Inventory of Homes for Sale 2,210 1,971 - 10.8% -- --
Months Supplyof Homes for Sale
6.3 5.9 - 7.1% --
All data from the HiCentral MLS, Ltd. Powered by 10K Research and Marketing. | Click for Cover Page | 3
- 0.3%
Housing Affordability Index 122 136 + 11.8% 120 128 + 6.1%
Percent of Original
List Price Received95.0% 94.6% - 0.3% 95.1% 94.8%
--
- 1.6%
Average Sales Price $361,342 $338,964 - 6.2% $350,578 $357,019 + 1.8%
Median Sales Price $300,000 $277,000 - 7.7% $304,950 $300,000
7-2008 7-2009 7-2010 7-2011
7-2008 7-2009 7-2010 7-2011
7-2008 7-2009 7-2010 7-2011
7-2008 7-2009 7-2010 7-2011
7-2008 7-2009 7-2010 7-2011
7-2008 7-2009 7-2010 7-2011

8/6/2019 HBRMonthlyIndicators_2011-07
http://slidepdf.com/reader/full/hbrmonthlyindicators2011-07 4/13
Closed SalesA count of the actual sales that have closed in a given month.
Single-
Family
YoY
Chg.Condo
YoY
Chg.
8-2010 231 - 2.9% 294 - 15.5%
9-2010 273 + 7.9% 306 - 13.6%
10-2010 245 - 15.5% 319 - 19.2%
11-2010 248 - 3.9% 316 - 22.5%
12-2010 312 + 14.7% 357 + 2.0%
1-2011 200 + 11.7% 280 + 15.7%
2-2011 186 + 5.1% 306 + 25.4%
3-2011 255 0.0% 345 - 4.2%
4-2011 233 - 18.2% 386 - 4.9%
5-2011 254 - 11.5% 334 - 9.2%
6-2011 251 - 14.9% 365 - 17.4%
7-2011 251 - 7.0% 300 - 8.3%
266
343
270
327
251
300
July
201120102009 201120102009
1,377
1,7191,748
2,389
1,630
2,316
Year to Date
201120102009 201120102009
Total 2,939 - 3.9% 3,908 - 7.9%
All data from the HiCentral MLS, Ltd. Powered by 10K Research and Marketing. | Click for Cover Page | 4
Single-Family Condo
0
200
400
600
800
1,000
1,200
1,400
1,600
1,800
1-1990 1-1992 1-1994 1-1996 1-1998 1-2000 1-2002 1-2004 1-2006 1-2008 1-2010
Historical Closed Sales Activity Single-Family Condo
-8.3%-4.7%-7.0%+1.5%
Single-Family Condo-3.1%+39.0%-6.8%+26.9%

8/6/2019 HBRMonthlyIndicators_2011-07
http://slidepdf.com/reader/full/hbrmonthlyindicators2011-07 5/13
Median Sales PriceMedian price point for all closed sales, not accounting for seller concessions, in a given month.
Single-
Family
YoY
Chg.Condo
YoY
Chg.
8-2010 $641,277 + 14.5% $303,000 + 4.5%
9-2010 $620,000 + 2.5% $330,000 + 6.6%
10-2010 $592,500 - 2.0% $300,000 0.0%
11-2010 $574,500 - 2.6% $312,000 + 0.5%
12-2010 $585,000 + 5.4% $300,000 - 0.8%
1-2011 $570,000 - 4.2% $290,000 - 3.0%
2-2011 $570,000 - 1.0% $320,000 + 7.0%
3-2011 $550,000 - 8.3% $315,000 + 1.6%
4-2011 $585,000 + 3.5% $302,000 - 1.6%
5-2011 $595,000 - 0.8% $290,000 - 4.9%
6-2011 $575,000 - 1.3% $301,000 + 0.3%
7-2011 $591,000 - 2.2% $277,000 - 7.7%
$595,000
$307,250
$604,500
$300,000
$591,000
$277,000
July
201120102009 201120102009
$574,500
$305,000
$585,000
$304,950
$575,000
$300,000
Year to Date
201120102009 201120102009
Average $585,000 0.0% $305,000 + 0.5%
All data from the HiCentral MLS, Ltd. Powered by 10K Research and Marketing. | Click for Cover Page | 5
Single-Family Condo
$100,000
$200,000
$300,000
$400,000
$500,000
$600,000
$700,000
1-1990 1-1992 1-1994 1-1996 1-1998 1-2000 1-2002 1-2004 1-2006 1-2008 1-2010
Historical Median Sales Price Single-Family Condo
-7.7%-2.4%-2.2%+1.6%
Single-Family Condo-1.6%-0.0%-1.7%+1.8%
8/6/2019 HBRMonthlyIndicators_2011-07
http://slidepdf.com/reader/full/hbrmonthlyindicators2011-07 6/13
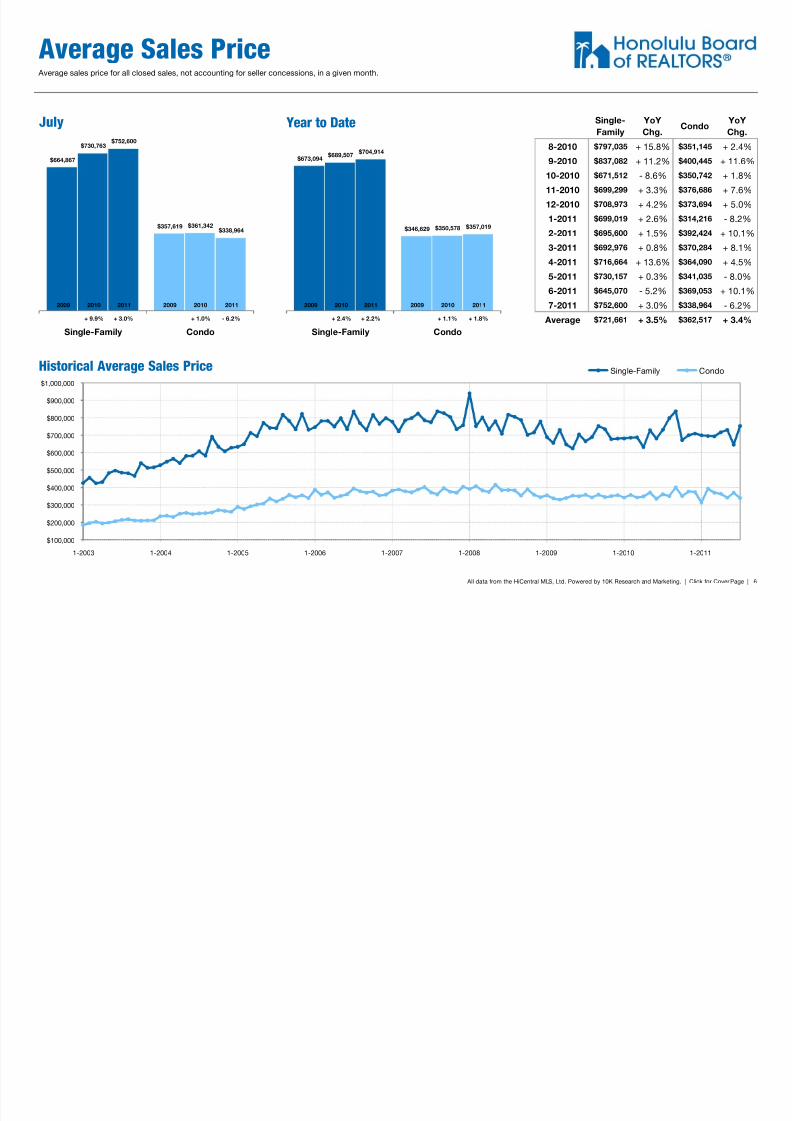
Average Sales PriceAverage sales price for all closed sales, not accounting for seller concessions, in a given month.
Single-
Family
YoY
Chg.Condo
YoY
Chg.
8-2010 $797,035 + 15.8% $351,145 + 2.4%
9-2010 $837,082 + 11.2% $400,445 + 11.6%
10-2010 $671,512 - 8.6% $350,742 + 1.8%
11-2010 $699,299 + 3.3% $376,686 + 7.6%
12-2010 $708,973 + 4.2% $373,694 + 5.0%
1-2011 $699,019 + 2.6% $314,216 - 8.2%
2-2011 $695,600 + 1.5% $392,424 + 10.1%
3-2011 $692,976 + 0.8% $370,284 + 8.1%
4-2011 $716,664 + 13.6% $364,090 + 4.5%
5-2011 $730,157 + 0.3% $341,035 - 8.0%
6-2011 $645,070 - 5.2% $369,053 + 10.1%
7-2011 $752,600 + 3.0% $338,964 - 6.2%
$664,867
$357,619
$730,763
$361,342
$752,600
$338,964
July
201120102009 201120102009
$673,094
$346,629
$689,507
$350,578
$704,914
$357,019
Year to Date
201120102009 201120102009
Average $721,661 + 3.5% $362,517 + 3.4%
All data from the HiCentral MLS, Ltd. Powered by 10K Research and Marketing. | Click for Cover Page | 6
Single-Family Condo
$100,000
$200,000
$300,000
$400,000
$500,000
$600,000
$700,000
$800,000
$900,000
$1,000,000
1-2003 1-2004 1-2005 1-2006 1-2007 1-2008 1-2009 1-2010 1-2011
Historical Average Sales Price Single-Family Condo
- 6.2%+ 1.0%+ 3.0%+ 9.9%
Single-Family Condo+ 1.8%+ 1.1%+ 2.2%+ 2.4%

8/6/2019 HBRMonthlyIndicators_2011-07
http://slidepdf.com/reader/full/hbrmonthlyindicators2011-07 7/13
New ListingsA count of the properties that have been newly listed on the market in a given month.
Single-
Family
YoY
Chg.Condo
YoY
Chg.
8-2010 458 + 19.0% 632 + 11.9%
9-2010 439 + 13.1% 573 - 6.4%
10-2010 403 - 0.2% 512 - 6.1%
11-2010 386 + 21.8% 475 + 0.6%
12-2010 275 - 5.5% 422 + 5.0%
1-2011 401 - 12.8% 602 + 5.6%
2-2011 409 - 5.1% 579 - 1.7%
3-2011 480 - 12.2% 626 - 12.4%
4-2011 450 - 14.8% 553 - 18.7%
5-2011 446 + 6.2% 582 + 14.3%
6-2011 473 + 1.5% 587 - 7.7%
7-2011 443 - 9.2% 516 - 20.1%
446
586
488
646
443
516
July
201120102009 201120102009
3,188
4,229
3,340
4,345
3,102
4,045
Year to Date
201120102009 201120102009
Average 5,063 - 1.2% 6,659 - 4.1%
All data from the HiCentral MLS, Ltd. Powered by 10K Research and Marketing. | Click for Cover Page | 7
Single-Family Condo
0
250
500
750
1,000
1,250
1,500
1,750
2,000
2,250
1-1990 1-1992 1-1994 1-1996 1-1998 1-2000 1-2002 1-2004 1-2006 1-2008 1-2010
Historical New Listing Activity Single-Family Condo
-20.1%+10.2%-9.2%+9.4%
Single-Family Condo-6.9%+2.7%-7.1%+4.8%
8/6/2019 HBRMonthlyIndicators_2011-07
http://slidepdf.com/reader/full/hbrmonthlyindicators2011-07 8/13
Pending SalesA count of the properties on which contracts have been accepted in a given month.
Single-
Family
YoY
Chg.Condo
YoY
Chg.
8-2010 296 + 19.4% 344 - 5.2%
9-2010 242 - 15.7% 337 - 20.9%
10-2010 282 + 10.2% 304 - 16.3%
11-2010 220 - 3.1% 283 - 9.3%
12-2010 203 + 4.1% 288 + 9.1%
1-2011 234 + 4.9% 360 + 29.5%
2-2011 230 - 2.5% 340 - 4.2%
3-2011 263 - 15.4% 401 - 5.6%
4-2011 236 - 27.8% 337 - 25.4%
5-2011 260 + 8.8% 370 + 27.1%
6-2011 300 + 21.0% 332 + 8.9%
7-2011 300 + 11.9% 390 + 17.8%
286
359
268
331
300
390
July
201120102009 201120102009
1,625
2,051
1,852
2,437
1,823
2,530
Year to Date
201120102009 201120102009
Average 3,066 + 0.0% 4,086 - 1.9%
All data from the HiCentral MLS, Ltd. Powered by 10K Research and Marketing. | Click for Cover Page | 8
Single-Family Condo
0
200
400
600
800
1,000
1,200
1,400
1,600
1,800
1-1997 1-1998 1-1999 1-2000 1-2001 1-2002 1-2003 1-2004 1-2005 1-2006 1-2007 1-2008 1-2009 1-2010 1-2011
Historical Pending Sales Activity Single-Family Condo
+17.8%-7.8%+11.9%-6.3%
Single-Family Condo+3.8%+18.8%-1.6%+14.0%
8/6/2019 HBRMonthlyIndicators_2011-07
http://slidepdf.com/reader/full/hbrmonthlyindicators2011-07 9/13
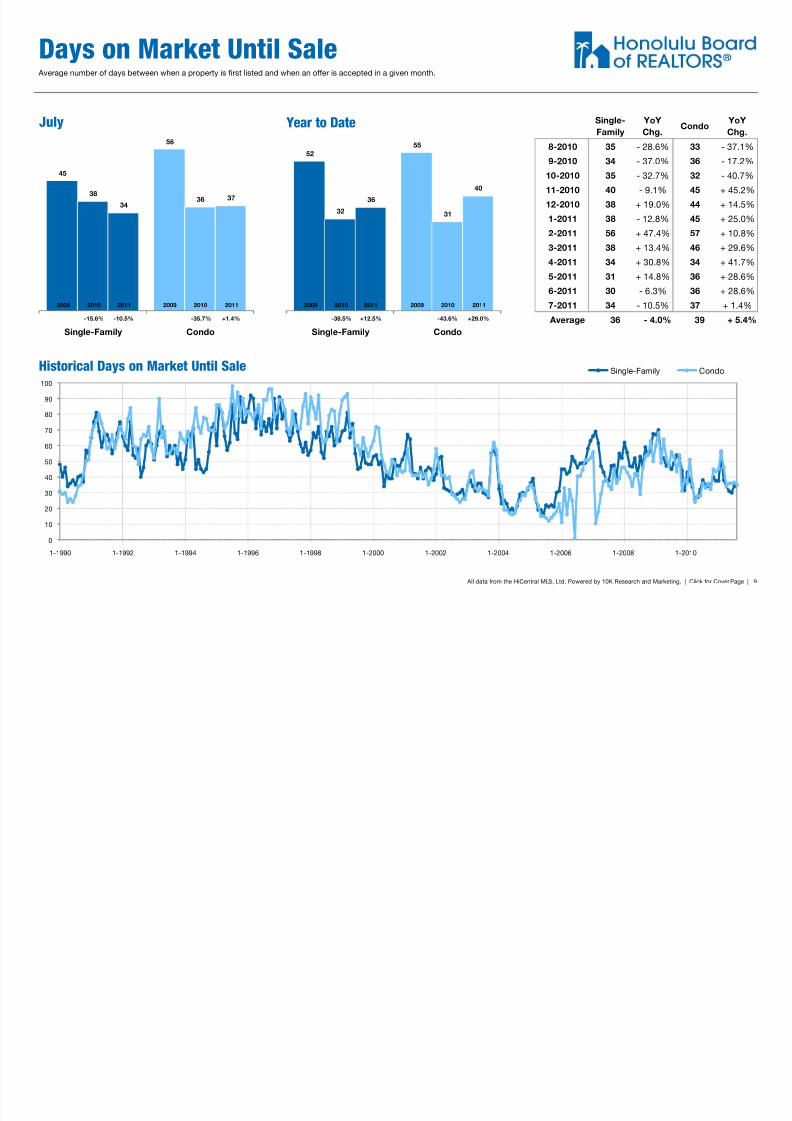
Days on Market Until SaleAverage number of days between when a property is first listed and when an offer is accepted in a given month.
Single-
Family
YoY
Chg.Condo
YoY
Chg.
8-2010 35 - 28.6% 33 - 37.1%
9-2010 34 - 37.0% 36 - 17.2%
10-2010 35 - 32.7% 32 - 40.7%
11-2010 40 - 9.1% 45 + 45.2%
12-2010 38 + 19.0% 44 + 14.5%
1-2011 38 - 12.8% 45 + 25.0%
2-2011 56 + 47.4% 57 + 10.8%
3-2011 38 + 13.4% 46 + 29.6%
4-2011 34 + 30.8% 34 + 41.7%
5-2011 31 + 14.8% 36 + 28.6%
6-2011 30 - 6.3% 36 + 28.6%
7-2011 34 - 10.5% 37 + 1.4%
45
56
3836
3437
July
201120102009 201120102009
5255
3231
36
40
Year to Date
201120102009 201120102009
Average 36 - 4.0% 39 + 5.4%
All data from the HiCentral MLS, Ltd. Powered by 10K Research and Marketing. | Click for Cover Page | 9
Single-Family Condo
0
10
20
30
40
50
60
70
80
90
100
1-1990 1-1992 1-1994 1-1996 1-1998 1-2000 1-2002 1-2004 1-2006 1-2008 1-2010
Historical Days on Market Until Sale Single-Family Condo
+1.4%-35.7%-10.5%-15.6%
Single-Family Condo
+29.0%-43.6%+12.5%-38.5%

8/6/2019 HBRMonthlyIndicators_2011-07
http://slidepdf.com/reader/full/hbrmonthlyindicators2011-07 10/13
Percent of Original List Price Received
Single-
Family
YoY
Chg.Condo
YoY
Chg.
8-2010 94.9% + 1.4% 94.6% + 2.4%
9-2010 95.2% + 2.8% 95.2% + 1.6%
10-2010 94.4% + 0.6% 94.8% + 1.8%
11-2010 96.0% + 2.3% 95.2% + 0.8%
12-2010 95.5% - 0.3% 94.1% + 0.2%
1-2011 94.7% + 0.0% 94.3% - 0.6%
2-2011 94.4% - 1.2% 94.3% + 1.1%
3-2011 95.6% - 0.0% 94.3% - 0.2%
4-2011 94.8% - 1.2% 94.8% - 1.2%
5-2011 95.6% - 0.6% 95.8% + 0.5%
6-2011 95.5% - 0.0% 95.1% - 0.5%
7-2011 94.9% - 0.9% 94.6% - 0.3%
Percentage found when dividing a property’s sales price by its original list price, then taking the average for all properties sold
in a given month, not accounting for seller concessions.
93.5% 92.9%95.8% 95.0%94.9% 94.6%
July
201120102009 201120102009
92.5% 91.8%95.7% 95.1%95.1% 94.8%
Year to Date
201120102009 201120102009
Average 95.2% + 0.2% 94.8% + 0.4%
All data from the HiCentral MLS, Ltd. Powered by 10K Research and Marketing. | Click for Cover Page | 10
Single-Family Condo
90.0%
92.5%
95.0%
97.5%
100.0%
1-2003 1-2004 1-2005 1-2006 1-2007 1-2008 1-2009 1-2010 1-2011
Historical Percent of Original List Price Received Single-Family Condo
-0.3%+2.2%-0.9%+2.5%
Single-Family Condo
-0.3%+3.5%-0.6%+3.5%
8/6/2019 HBRMonthlyIndicators_2011-07
http://slidepdf.com/reader/full/hbrmonthlyindicators2011-07 11/13
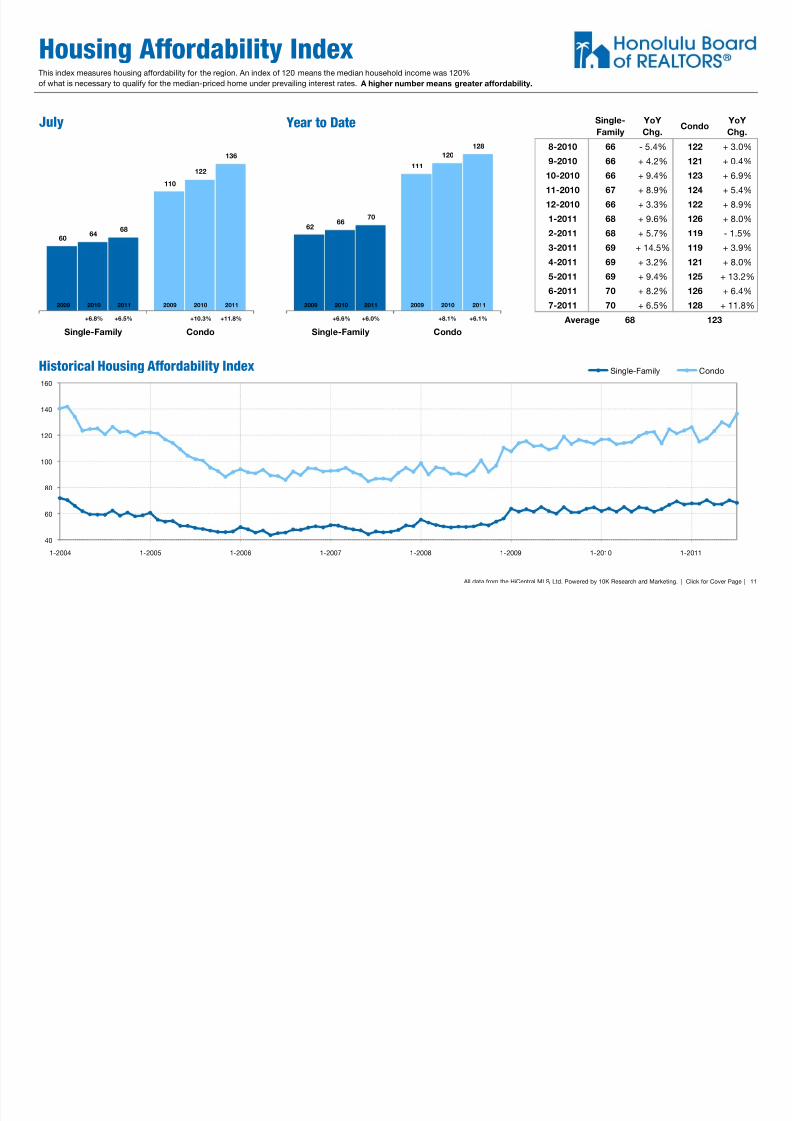
Housing Affordability Index
Single-
Family
YoY
Chg.Condo
YoY
Chg.
8-2010 66 - 5.4% 122 + 3.0%
9-2010 66 + 4.2% 121 + 0.4%
10-2010 66 + 9.4% 123 + 6.9%
11-2010 67 + 8.9% 124 + 5.4%
12-2010 66 + 3.3% 122 + 8.9%
1-2011 68 + 9.6% 126 + 8.0%
2-2011 68 + 5.7% 119 - 1.5%
3-2011 69 + 14.5% 119 + 3.9%
4-2011 69 + 3.2% 121 + 8.0%
5-2011 69 + 9.4% 125 + 13.2%
6-2011 70 + 8.2% 126 + 6.4%
7-2011 70 + 6.5% 128 + 11.8%
This index measures housing affordability for the region. An index of 120 means the median household income was 120%
of what is necessary to qualify for the median-priced home under prevailing interest rates. A higher number means greater affordability.
60
110
64
122
68
136
July
201120102009 201120102009
62
111
66
120
70
128
Year to Date
201120102009 201120102009
Average 68 123
All data from the HiCentral MLS, Ltd. Powered by 10K Research and Marketing. | Click for Cover Page | 11
Single-Family Condo
40
60
80
100
120
140
160
1-2004 1-2005 1-2006 1-2007 1-2008 1-2009 1-2010 1-2011
Historical Housing Affordability Index Single-Family Condo
+11.8%+10.3%+6.5%+6.8%
Single-Family Condo
+6.1%+8.1%+6.0%+6.6%
8/6/2019 HBRMonthlyIndicators_2011-07
http://slidepdf.com/reader/full/hbrmonthlyindicators2011-07 12/13
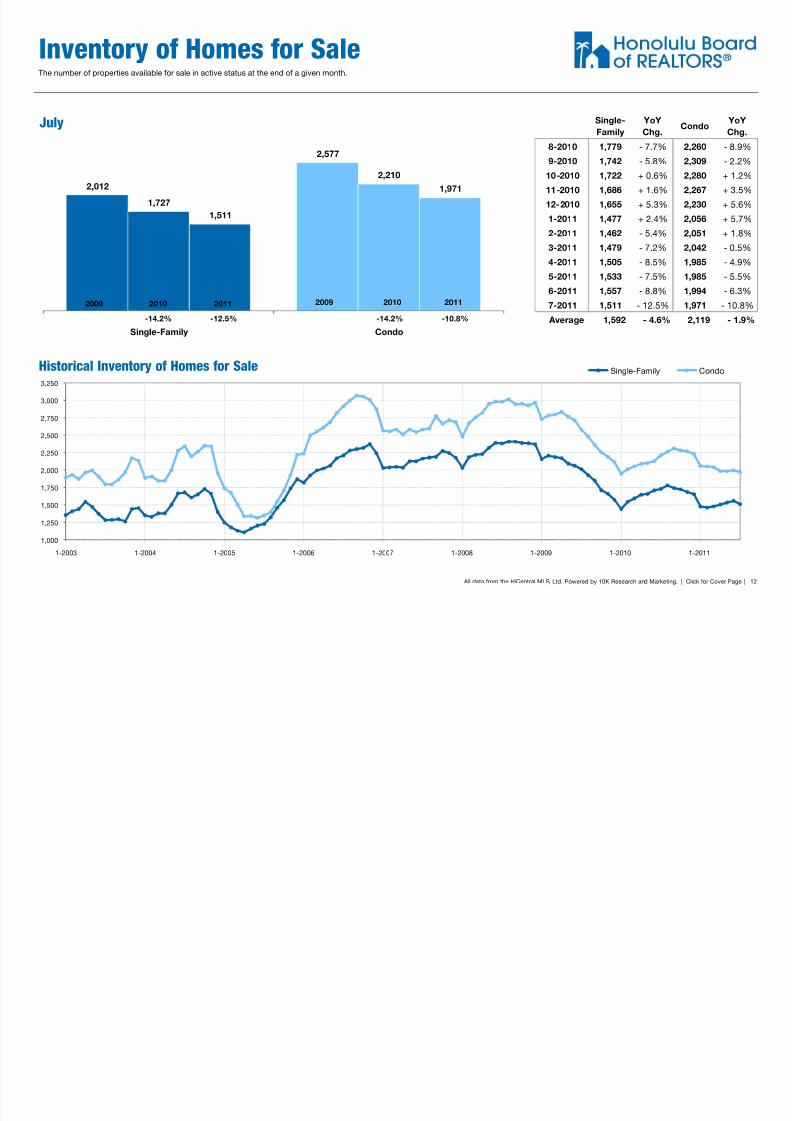
Inventory of Homes for SaleThe number of properties available for sale in active status at the end of a given month.
Single-
Family
YoY
Chg.Condo
YoY
Chg.
8-2010 1,779 - 7.7% 2,260 - 8.9%
9-2010 1,742 - 5.8% 2,309 - 2.2%
10-2010 1,722 + 0.6% 2,280 + 1.2%
11-2010 1,686 + 1.6% 2,267 + 3.5%
12-2010 1,655 + 5.3% 2,230 + 5.6%
1-2011 1,477 + 2.4% 2,056 + 5.7%
2-2011 1,462 - 5.4% 2,051 + 1.8%
3-2011 1,479 - 7.2% 2,042 - 0.5%
4-2011 1,505 - 8.5% 1,985 - 4.9%
5-2011 1,533 - 7.5% 1,985 - 5.5%
6-2011 1,557 - 8.8% 1,994 - 6.3%
7-2011 1,511 - 12.5% 1,971 - 10.8%
2,012
2,577
1,727
2,210
1,511
1,971
July
201120102009 201120102009
Average 1,592 - 4.6% 2,119 - 1.9%
All data from the HiCentral MLS, Ltd. Powered by 10K Research and Marketing. | Click for Cover Page | 12
Single-Family Condo
1,000
1,250
1,500
1,750
2,000
2,250
2,500
2,750
3,000
3,250
1-2003 1-2004 1-2005 1-2006 1-2007 1-2008 1-2009 1-2010 1-2011
Historical Inventory of Homes for Sale Single-Family Condo
-10.8%-14.2%-12.5%-14.2%
8/6/2019 HBRMonthlyIndicators_2011-07
http://slidepdf.com/reader/full/hbrmonthlyindicators2011-07 13/13
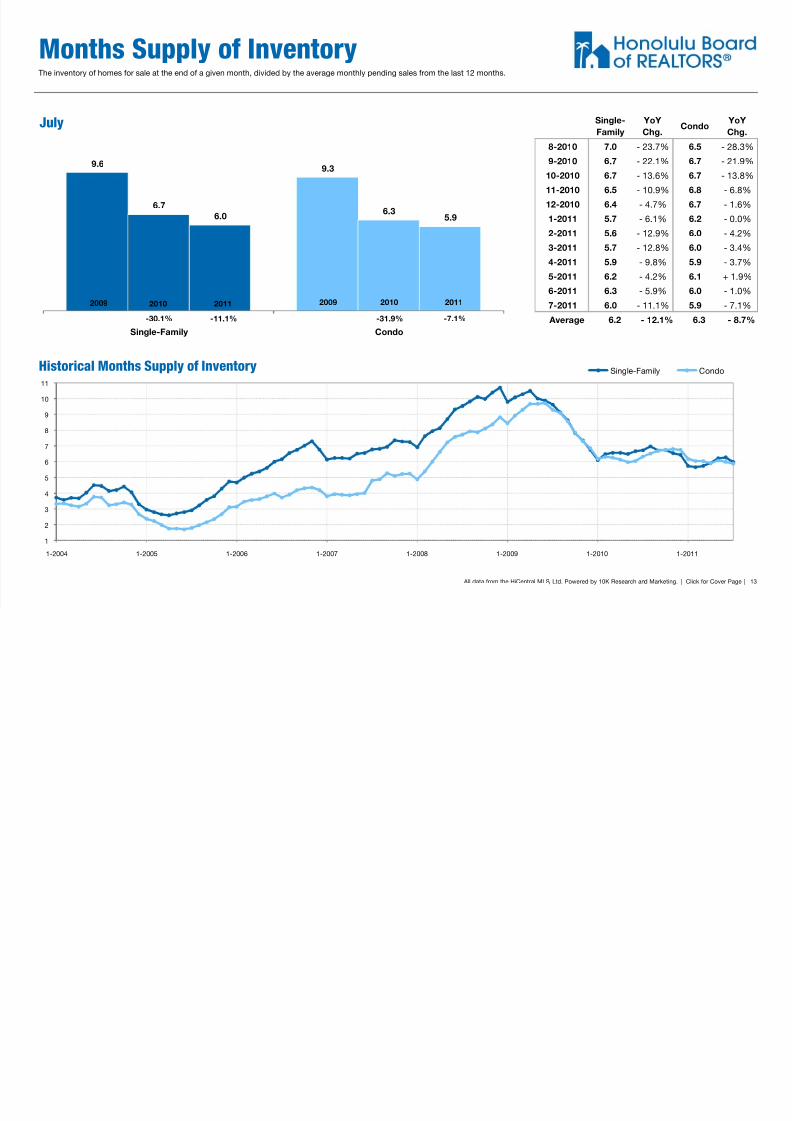
Months Supply of InventoryThe inventory of homes for sale at the end of a given month, divided by the average monthly pending sales from the last 12 months.
Single-
Family
YoY
Chg.Condo
YoY
Chg.
8-2010 7.0 - 23.7% 6.5 - 28.3%
9-2010 6.7 - 22.1% 6.7 - 21.9%
10-2010 6.7 - 13.6% 6.7 - 13.8%
11-2010 6.5 - 10.9% 6.8 - 6.8%
12-2010 6.4 - 4.7% 6.7 - 1.6%
1-2011 5.7 - 6.1% 6.2 - 0.0%
2-2011 5.6 - 12.9% 6.0 - 4.2%
3-2011 5.7 - 12.8% 6.0 - 3.4%
4-2011 5.9 - 9.8% 5.9 - 3.7%
5-2011 6.2 - 4.2% 6.1 + 1.9%
6-2011 6.3 - 5.9% 6.0 - 1.0%
7-2011 6.0 - 11.1% 5.9 - 7.1%
9.69.3
6.76.3
6.0 5.9
July
201120102009 201120102009
Average 6.2 - 12.1% 6.3 - 8.7%
All data from the HiCentral MLS, Ltd. Powered by 10K Research and Marketing. | Click for Cover Page | 13
Single-Family Condo
1
2
3
4
5
6
7
8
9
10
11
1-2004 1-2005 1-2006 1-2007 1-2008 1-2009 1-2010 1-2011
Historical Months Supply of Inventory Single-Family Condo
-7.1%-31.9%-11.1%-30.1%