hcap update - ohio hospital assoc · hcap 2019 2019 oha annual meeting june 3, 2019 16 • data...
TRANSCRIPT

HCAP UPDATE
June 3, 2019
2019 OHA Annual Meeting
Ohio Hospital Association | ohiohospitals.org |
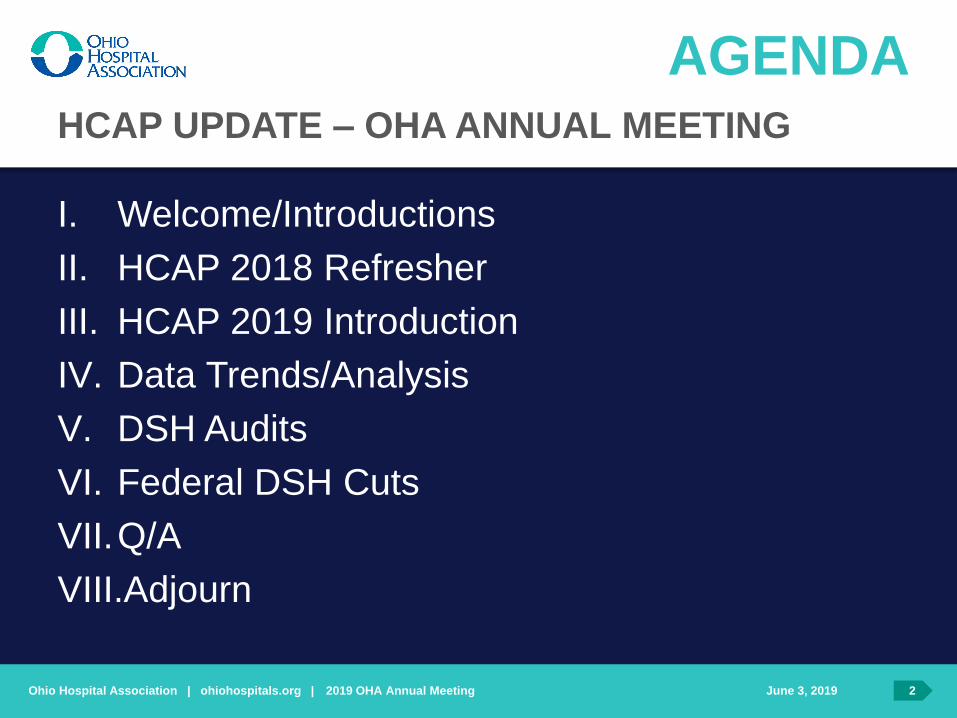
AGENDA
I. Welcome/Introductions
II. HCAP 2018 Refresher
III. HCAP 2019 Introduction
IV. Data Trends/Analysis
V. DSH Audits
VI. Federal DSH Cuts
VII.Q/A
VIII.Adjourn
June 3, 20192019 OHA Annual Meeting 2
HCAP UPDATE – OHA ANNUAL MEETING

Ohio Hospital Association | ohiohospitals.org |
HCAP 2018 REFRESHER
2019 OHA Annual Meeting
June 3, 20192019 OHA Annual Meeting 3
Ohio Hospital Association | ohiohospitals.org |
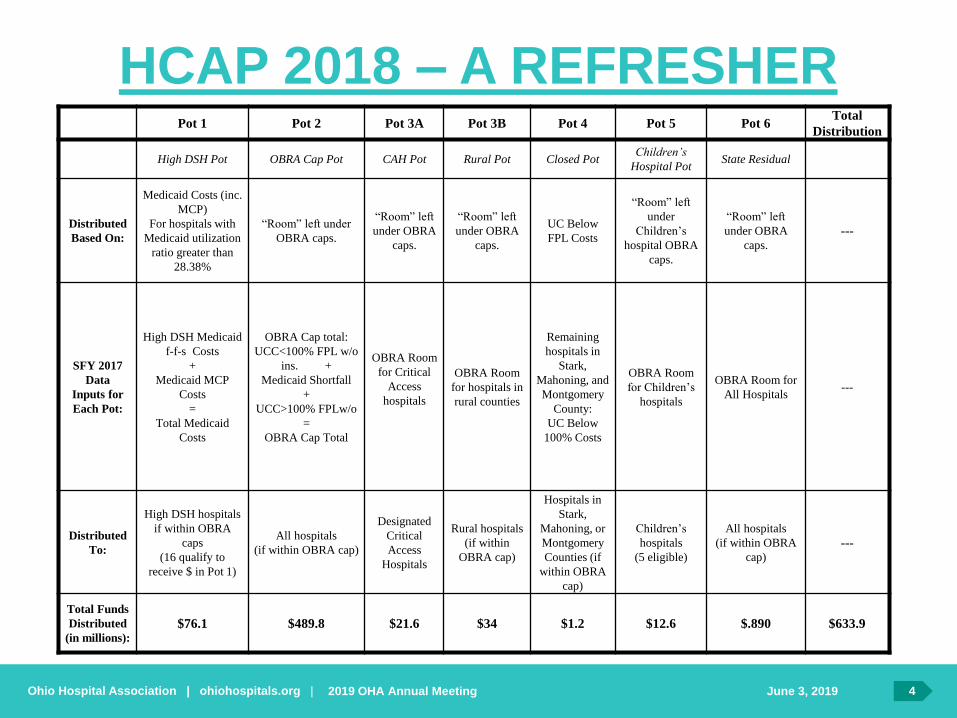
HCAP 2018 – A REFRESHER
June 3, 20192019 OHA Annual Meeting 4
Pot 1 Pot 2 Pot 3A Pot 3B Pot 4 Pot 5 Pot 6Total
Distribution
High DSH Pot OBRA Cap Pot CAH Pot Rural Pot Closed Pot Children’s
Hospital PotState Residual
Distributed
Based On:
Medicaid Costs (inc.
MCP)
For hospitals with
Medicaid utilization
ratio greater than
28.38%
“Room” left under
OBRA caps.
“Room” left
under OBRA
caps.
“Room” left
under OBRA
caps.
UC Below
FPL Costs
“Room” left
under
Children’s
hospital OBRA
caps.
“Room” left
under OBRA
caps.
---
SFY 2017
Data
Inputs for
Each Pot:
High DSH Medicaid
f-f-s Costs
+
Medicaid MCP
Costs
=
Total Medicaid
Costs
OBRA Cap total:
UCC<100% FPL w/o
ins. +
Medicaid Shortfall
+
UCC>100% FPLw/o
=
OBRA Cap Total
OBRA Room
for Critical
Access
hospitals
OBRA Room
for hospitals in
rural counties
Remaining
hospitals in
Stark,
Mahoning, and
Montgomery
County:
UC Below
100% Costs
OBRA Room
for Children’s
hospitals
OBRA Room for
All Hospitals---
Distributed
To:
High DSH hospitals
if within OBRA
caps
(16 qualify to
receive $ in Pot 1)
All hospitals
(if within OBRA cap)
Designated
Critical
Access
Hospitals
Rural hospitals
(if within
OBRA cap)
Hospitals in
Stark,
Mahoning, or
Montgomery
Counties (if
within OBRA
cap)
Children’s
hospitals
(5 eligible)
All hospitals
(if within OBRA
cap)
---
Total Funds
Distributed
(in millions):
$76.1 $489.8 $21.6 $34 $1.2 $12.6 $.890 $633.9
Ohio Hospital Association | ohiohospitals.org |
HCAP 2019 INTRODUCTION
2019 OHA Annual Meeting
June 3, 20192019 OHA Annual Meeting 5

Ohio Hospital Association | ohiohospitals.org |
HCAP DATA -
REFRESHER
FFY 2019 HCAP:
• Uses SFY 2018
Medicaid Cost Reports
• Hospital FYEs
between July, 2017
and June, 2018
• Majority CY 2017
Data
June 3, 20192019 OHA Annual Meeting 6
Ohio Hospital Association | ohiohospitals.org |
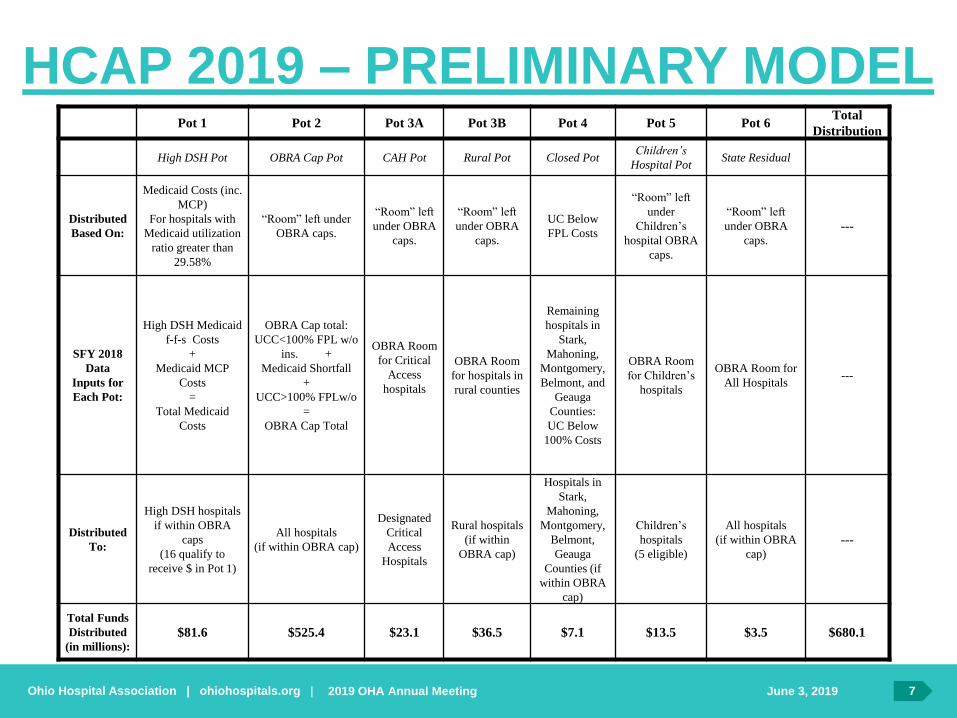
HCAP 2019 – PRELIMINARY MODEL
June 3, 20192019 OHA Annual Meeting 7
Pot 1 Pot 2 Pot 3A Pot 3B Pot 4 Pot 5 Pot 6Total
Distribution
High DSH Pot OBRA Cap Pot CAH Pot Rural Pot Closed Pot Children’s
Hospital PotState Residual
Distributed
Based On:
Medicaid Costs (inc.
MCP)
For hospitals with
Medicaid utilization
ratio greater than
29.58%
“Room” left under
OBRA caps.
“Room” left
under OBRA
caps.
“Room” left
under OBRA
caps.
UC Below
FPL Costs
“Room” left
under
Children’s
hospital OBRA
caps.
“Room” left
under OBRA
caps.
---
SFY 2018
Data
Inputs for
Each Pot:
High DSH Medicaid
f-f-s Costs
+
Medicaid MCP
Costs
=
Total Medicaid
Costs
OBRA Cap total:
UCC<100% FPL w/o
ins. +
Medicaid Shortfall
+
UCC>100% FPLw/o
=
OBRA Cap Total
OBRA Room
for Critical
Access
hospitals
OBRA Room
for hospitals in
rural counties
Remaining
hospitals in
Stark,
Mahoning,
Montgomery,
Belmont, and
Geauga
Counties:
UC Below
100% Costs
OBRA Room
for Children’s
hospitals
OBRA Room for
All Hospitals---
Distributed
To:
High DSH hospitals
if within OBRA
caps
(16 qualify to
receive $ in Pot 1)
All hospitals
(if within OBRA cap)
Designated
Critical
Access
Hospitals
Rural hospitals
(if within
OBRA cap)
Hospitals in
Stark,
Mahoning,
Montgomery,
Belmont,
Geauga
Counties (if
within OBRA
cap)
Children’s
hospitals
(5 eligible)
All hospitals
(if within OBRA
cap)
---
Total Funds
Distributed
(in millions):
$81.6 $525.4 $23.1 $36.5 $7.1 $13.5 $3.5 $680.1
Ohio Hospital Association | ohiohospitals.org |
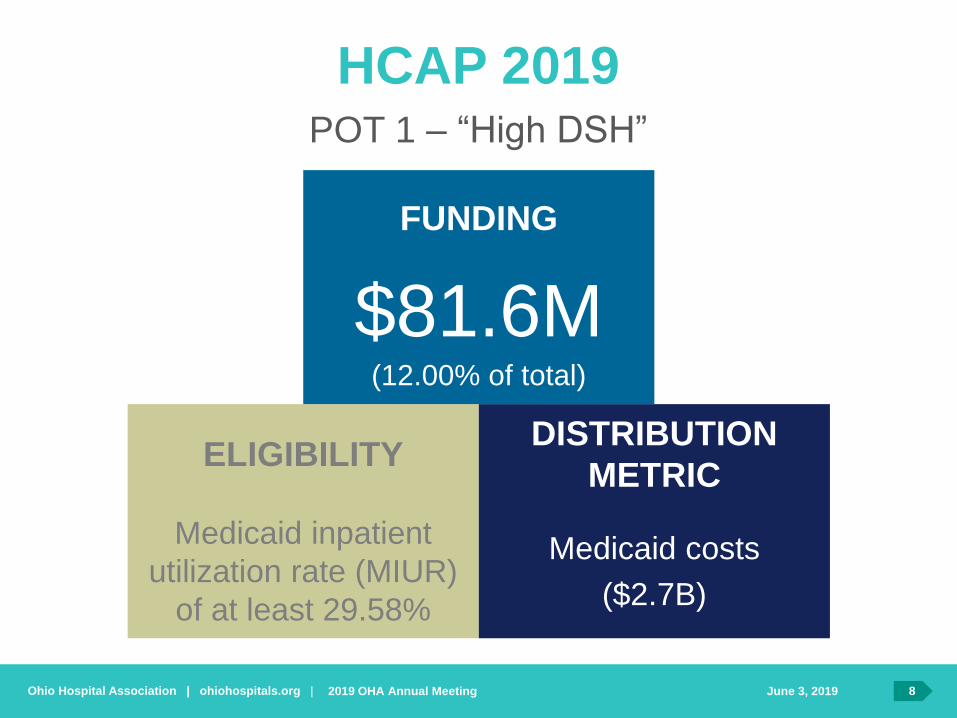
HCAP 2019
2019 OHA Annual Meeting June 3, 2019 8
POT 1 – “High DSH”
Medicaid inpatient
utilization rate (MIUR)
of at least 29.58%
$81.6M(12.00% of total)
Medicaid costs
($2.7B)
FUNDING
ELIGIBILITYDISTRIBUTION
METRIC
Ohio Hospital Association | ohiohospitals.org |
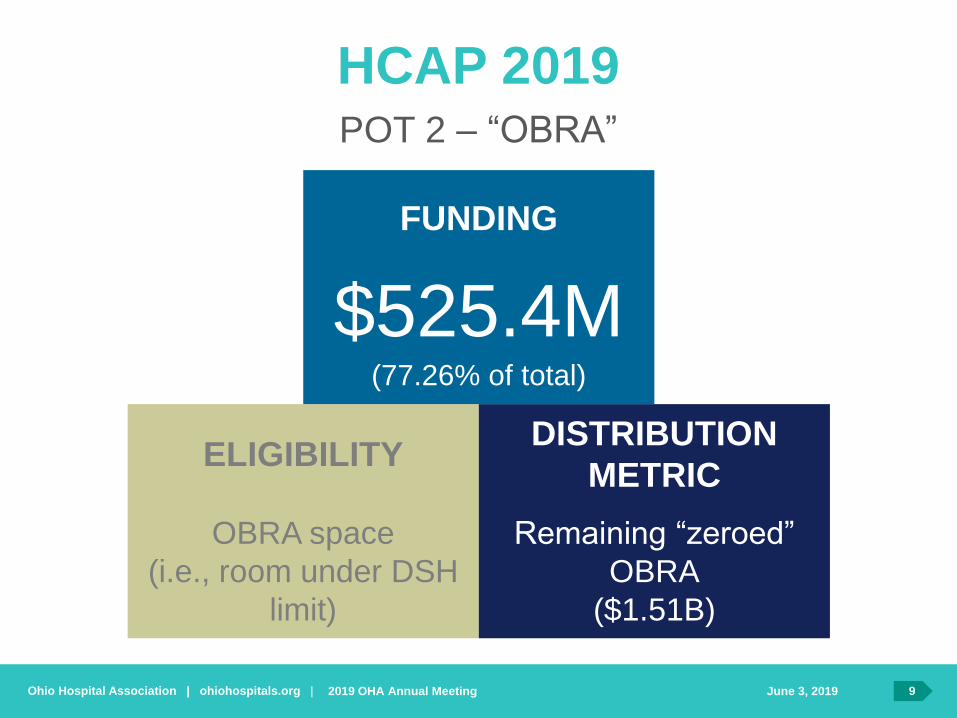
HCAP 2019
2019 OHA Annual Meeting June 3, 2019 9
POT 2 – “OBRA”
OBRA space
(i.e., room under DSH
limit)
$525.4M(77.26% of total)
Remaining “zeroed”
OBRA
($1.51B)
FUNDING
ELIGIBILITYDISTRIBUTION
METRIC
Ohio Hospital Association | ohiohospitals.org |
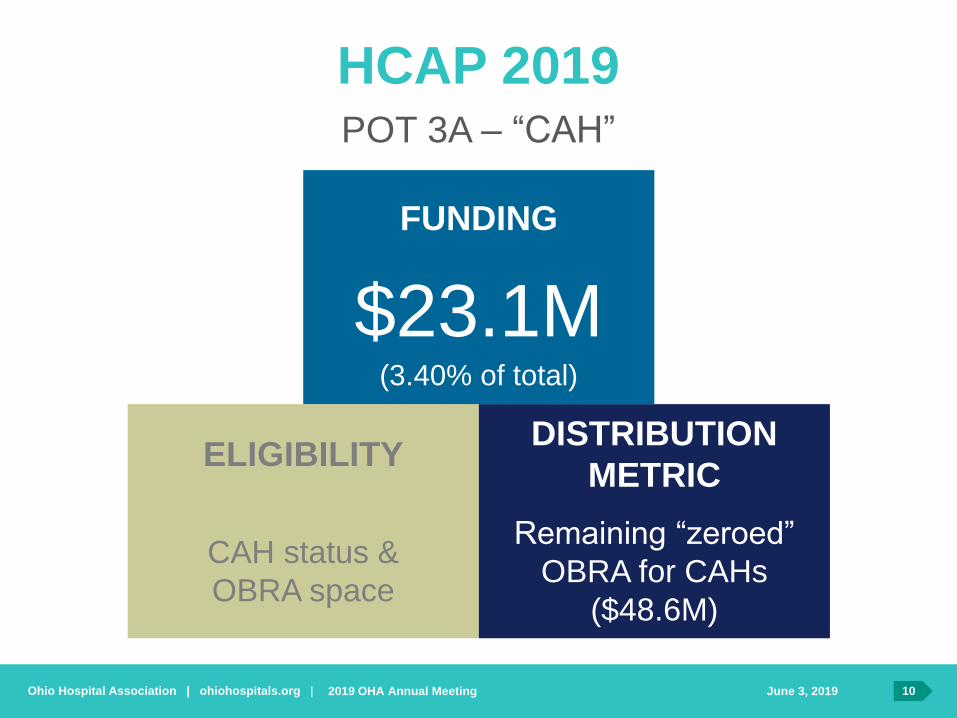
HCAP 2019
2019 OHA Annual Meeting June 3, 2019 10
POT 3A – “CAH”
CAH status &
OBRA space
$23.1M(3.40% of total)
Remaining “zeroed”
OBRA for CAHs
($48.6M)
FUNDING
ELIGIBILITYDISTRIBUTION
METRIC

Ohio Hospital Association | ohiohospitals.org |
HCAP 2019
2019 OHA Annual Meeting June 3, 2019 11
POT 3B – “Rural”
Rural status &
OBRA space
$36.5M(5.36% of total)
Remaining OBRA for
non-CAH rurals
($121.4M)
FUNDING
ELIGIBILITYDISTRIBUTION
METRIC
Ohio Hospital Association | ohiohospitals.org |
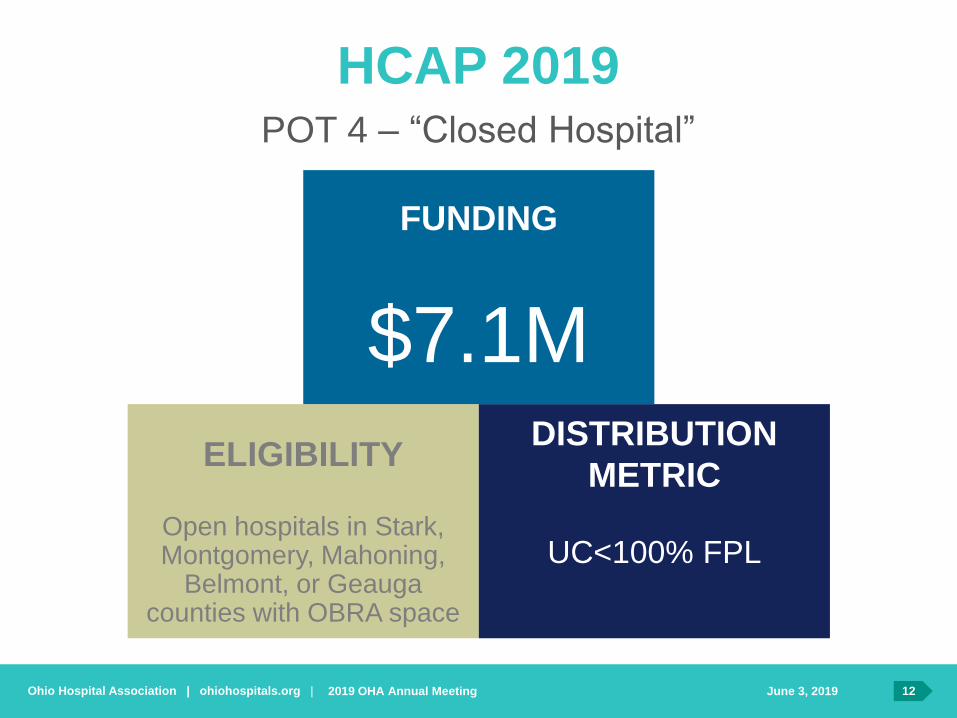
HCAP 2019
2019 OHA Annual Meeting June 3, 2019 12
POT 4 – “Closed Hospital”
Open hospitals in Stark, Montgomery, Mahoning,
Belmont, or Geauga counties with OBRA space
$7.1M
UC<100% FPL
FUNDING
ELIGIBILITYDISTRIBUTION
METRIC

Ohio Hospital Association | ohiohospitals.org |
HCAP 2019
2019 OHA Annual Meeting June 3, 2019 13
POT 5 – “Children’s Hospital”
Children’s hospital with
OBRA space
$13.5M(1.98% of total)
Remaining “zeroed”
OBRA
($162.1M)
FUNDING
ELIGIBILITYDISTRIBUTION
METRIC

Ohio Hospital Association | ohiohospitals.org |
HCAP 2019
2019 OHA Annual Meeting June 3, 2019 14
POT 6 – “Statewide Residual”
All hospitals with
OBRA space
$3.5M
Remaining “zeroed”
OBRA
($886.5M)
FUNDING
ELIGIBILITYDISTRIBUTION
METRIC

Ohio Hospital Association | ohiohospitals.org |
HCAP 2019 DATA TRENDS &
ANALYSIS
2019 OHA Annual Meeting
June 3, 20192019 OHA Annual Meeting 15
Ohio Hospital Association | ohiohospitals.org |
HCAP 2019
June 3, 20192019 OHA Annual Meeting 16
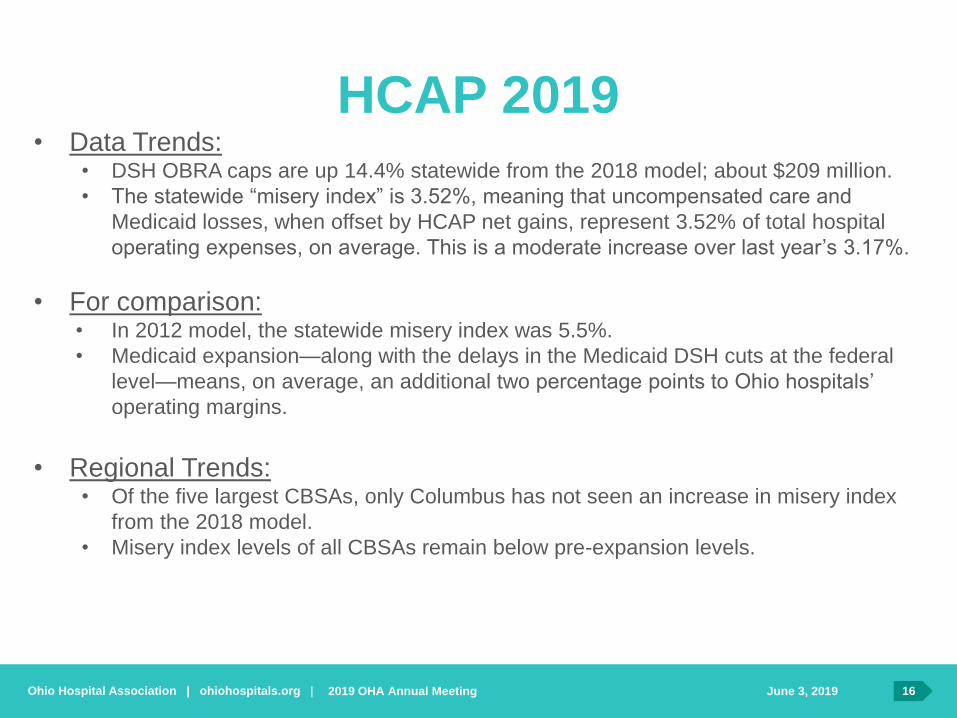
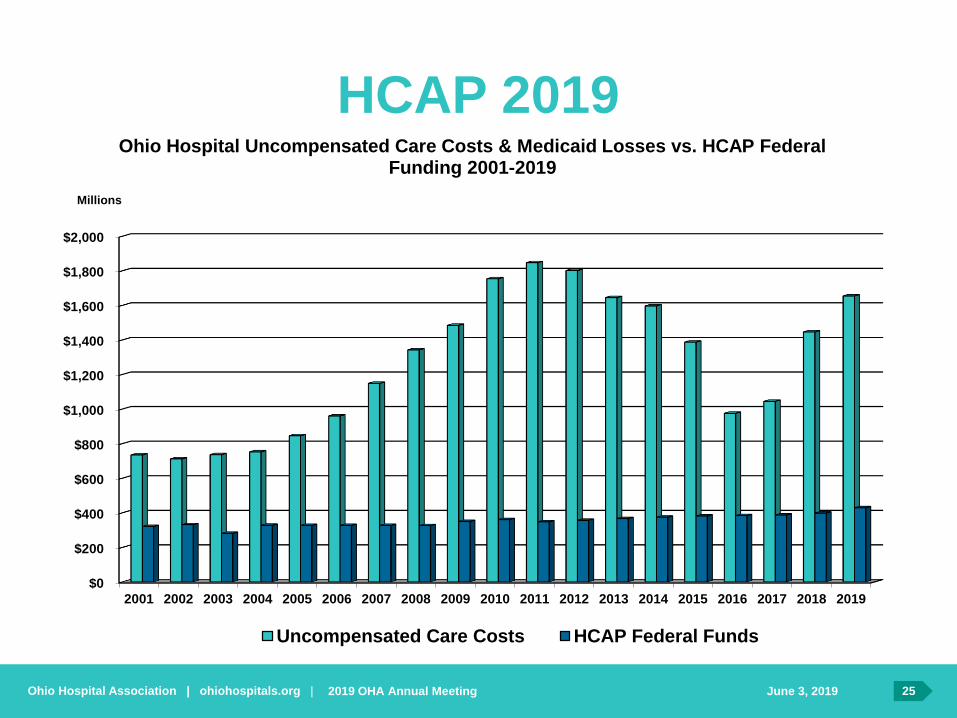
• Data Trends:• DSH OBRA caps are up 14.4% statewide from the 2018 model; about $209 million.
• The statewide “misery index” is 3.52%, meaning that uncompensated care and
Medicaid losses, when offset by HCAP net gains, represent 3.52% of total hospital
operating expenses, on average. This is a moderate increase over last year’s 3.17%.
• For comparison:• In 2012 model, the statewide misery index was 5.5%.
• Medicaid expansion—along with the delays in the Medicaid DSH cuts at the federal
level—means, on average, an additional two percentage points to Ohio hospitals’
operating margins.
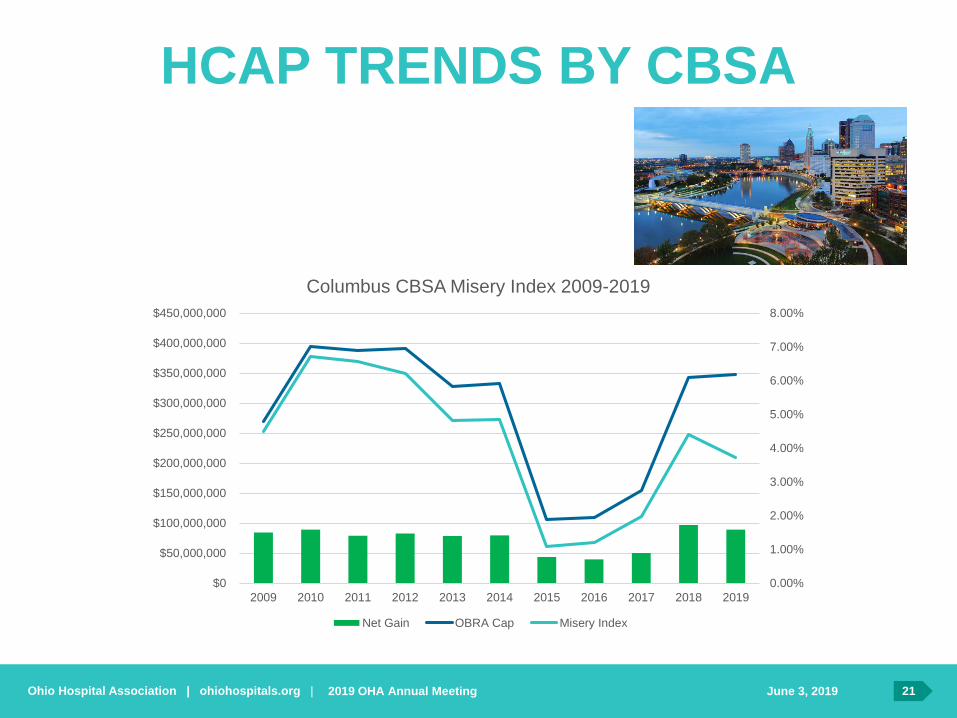
• Regional Trends:• Of the five largest CBSAs, only Columbus has not seen an increase in misery index
from the 2018 model.
• Misery index levels of all CBSAs remain below pre-expansion levels.
Ohio Hospital Association | ohiohospitals.org |
HCAP 2019 – PEER GROUP
SNAPSHOT
June 3, 20192019 OHA Annual Meeting 17
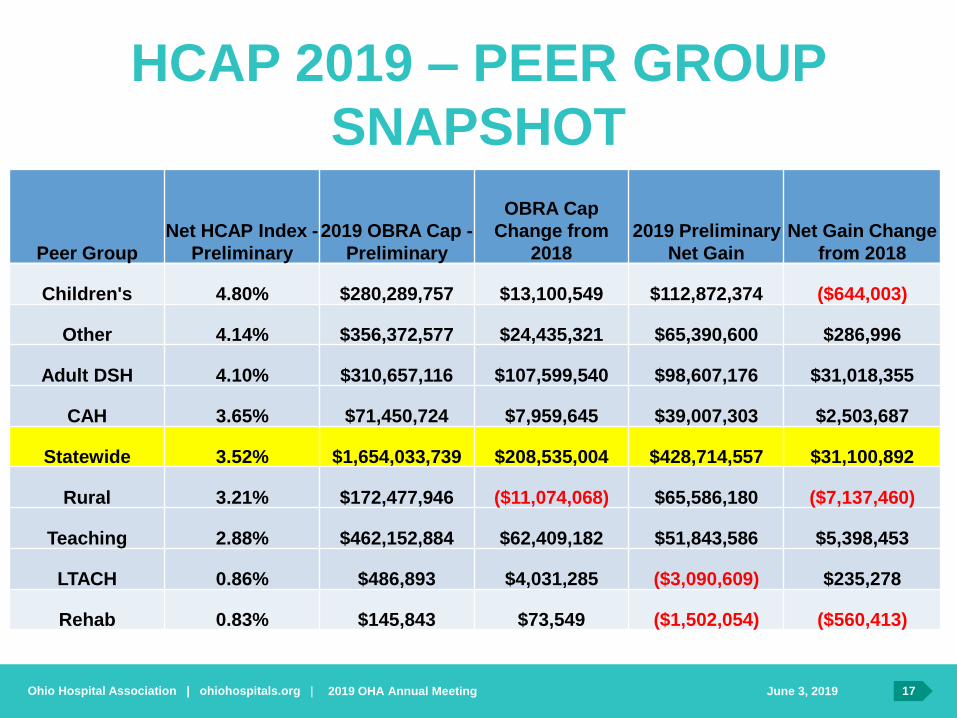
Peer Group
Net HCAP Index -
Preliminary
2019 OBRA Cap -
Preliminary
OBRA Cap
Change from
2018
2019 Preliminary
Net Gain
Net Gain Change
from 2018
Children's 4.80% $280,289,757 $13,100,549 $112,872,374 ($644,003)
Other 4.14% $356,372,577 $24,435,321 $65,390,600 $286,996
Adult DSH 4.10% $310,657,116 $107,599,540 $98,607,176 $31,018,355
CAH 3.65% $71,450,724 $7,959,645 $39,007,303 $2,503,687
Statewide 3.52% $1,654,033,739 $208,535,004 $428,714,557 $31,100,892
Rural 3.21% $172,477,946 ($11,074,068) $65,586,180 ($7,137,460)
Teaching 2.88% $462,152,884 $62,409,182 $51,843,586 $5,398,453
LTACH 0.86% $486,893 $4,031,285 ($3,090,609) $235,278
Rehab 0.83% $145,843 $73,549 ($1,502,054) ($560,413)

Ohio Hospital Association | ohiohospitals.org |
HCAP 2019 – PEER GROUP
SNAPSHOT
June 3, 20192019 OHA Annual Meeting 18
OBRA Cap Profiles by Peer Group (% of total OBRA)
Peer Group Medicaid ShortfallUncompensated
Care >100% FPL
Uncompensated
Care <100% FPL
Adult DSH 68% 26% 6%
Children's 89% 10% 1%
Critical Access 81% 18% 2%
Other 78% 19% 3%
Rural 79% 19% 2%
Teaching 67% 27% 6%
Statewide 75% 21% 4%
Ohio Hospital Association | ohiohospitals.org |
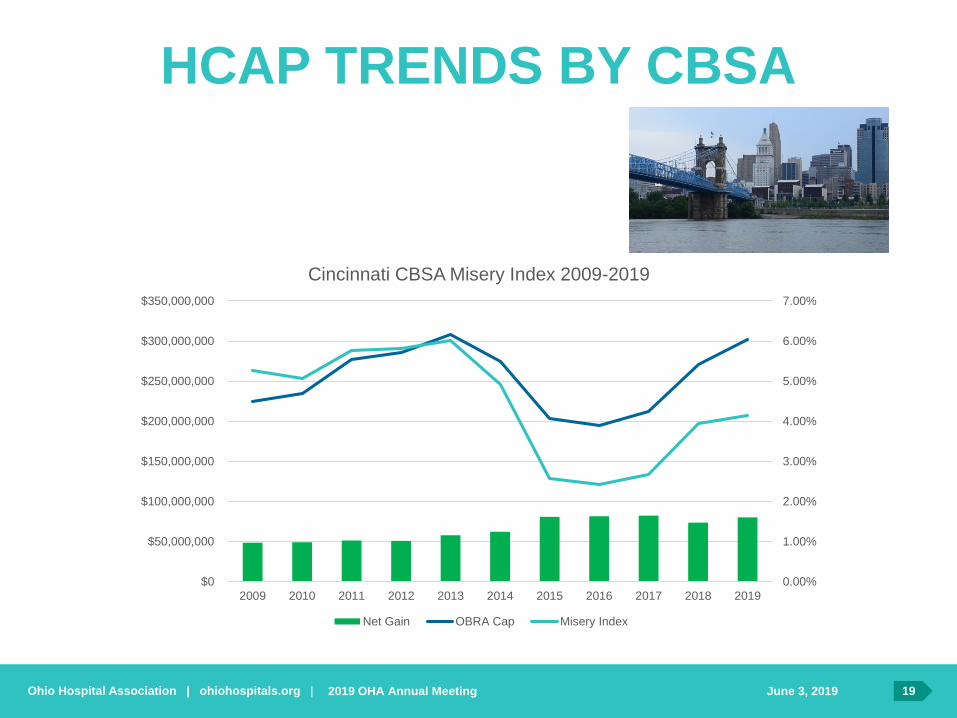
HCAP TRENDS BY CBSA
June 3, 20192019 OHA Annual Meeting 19
0.00%
1.00%
2.00%
3.00%
4.00%
5.00%
6.00%
7.00%
$0
$50,000,000
$100,000,000
$150,000,000
$200,000,000
$250,000,000
$300,000,000
$350,000,000
2009 2010 2011 2012 2013 2014 2015 2016 2017 2018 2019
Cincinnati CBSA Misery Index 2009-2019
Net Gain OBRA Cap Misery Index
Ohio Hospital Association | ohiohospitals.org |
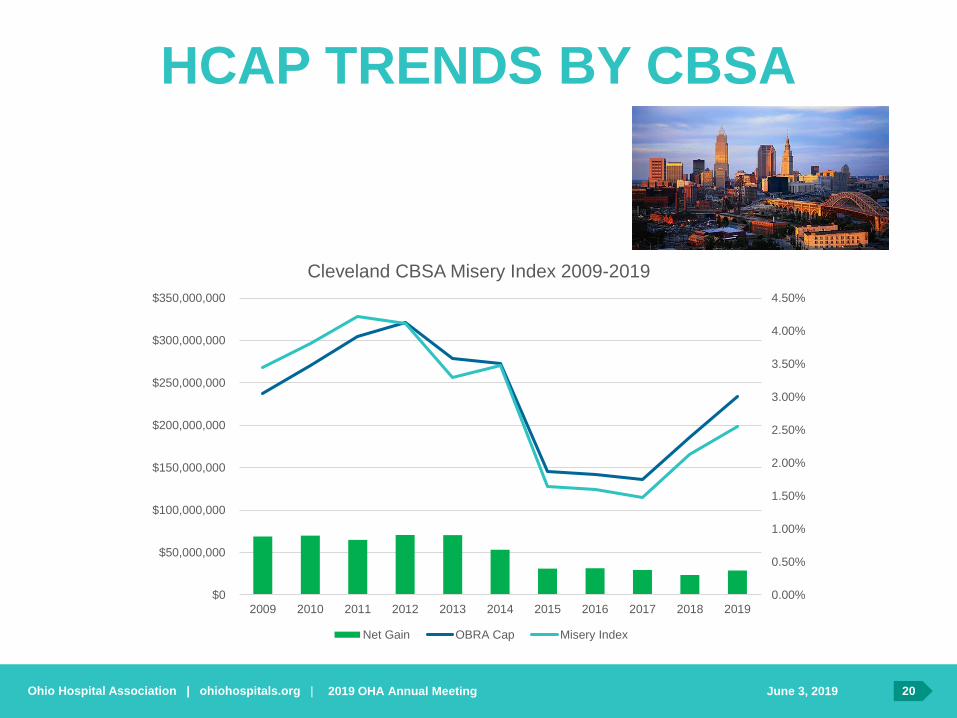
HCAP TRENDS BY CBSA
June 3, 20192019 OHA Annual Meeting 20
0.00%
0.50%
1.00%
1.50%
2.00%
2.50%
3.00%
3.50%
4.00%
4.50%
$0
$50,000,000
$100,000,000
$150,000,000
$200,000,000
$250,000,000
$300,000,000
$350,000,000
2009 2010 2011 2012 2013 2014 2015 2016 2017 2018 2019
Cleveland CBSA Misery Index 2009-2019
Net Gain OBRA Cap Misery Index
Ohio Hospital Association | ohiohospitals.org |
HCAP TRENDS BY CBSA
June 3, 20192019 OHA Annual Meeting 21
0.00%
1.00%
2.00%
3.00%
4.00%
5.00%
6.00%
7.00%
8.00%
$0
$50,000,000
$100,000,000
$150,000,000
$200,000,000
$250,000,000
$300,000,000
$350,000,000
$400,000,000
$450,000,000
2009 2010 2011 2012 2013 2014 2015 2016 2017 2018 2019
Columbus CBSA Misery Index 2009-2019
Net Gain OBRA Cap Misery Index

Ohio Hospital Association | ohiohospitals.org |
HCAP TRENDS BY CBSA
June 3, 20192019 OHA Annual Meeting 22
0.00%
1.00%
2.00%
3.00%
4.00%
5.00%
6.00%
7.00%
$0
$50,000,000
$100,000,000
$150,000,000
$200,000,000
$250,000,000
2009 2010 2011 2012 2013 2014 2015 2016 2017 2018 2019
Dayton CBSA Misery Index 2009-2019
Net Gain OBRA Cap Misery Index
Ohio Hospital Association | ohiohospitals.org |
HCAP TRENDS BY CBSA
June 3, 20192019 OHA Annual Meeting 23
0.00%
1.00%
2.00%
3.00%
4.00%
5.00%
6.00%
$0
$20,000,000
$40,000,000
$60,000,000
$80,000,000
$100,000,000
$120,000,000
2009 2010 2011 2012 2013 2014 2015 2016 2017 2018 2019
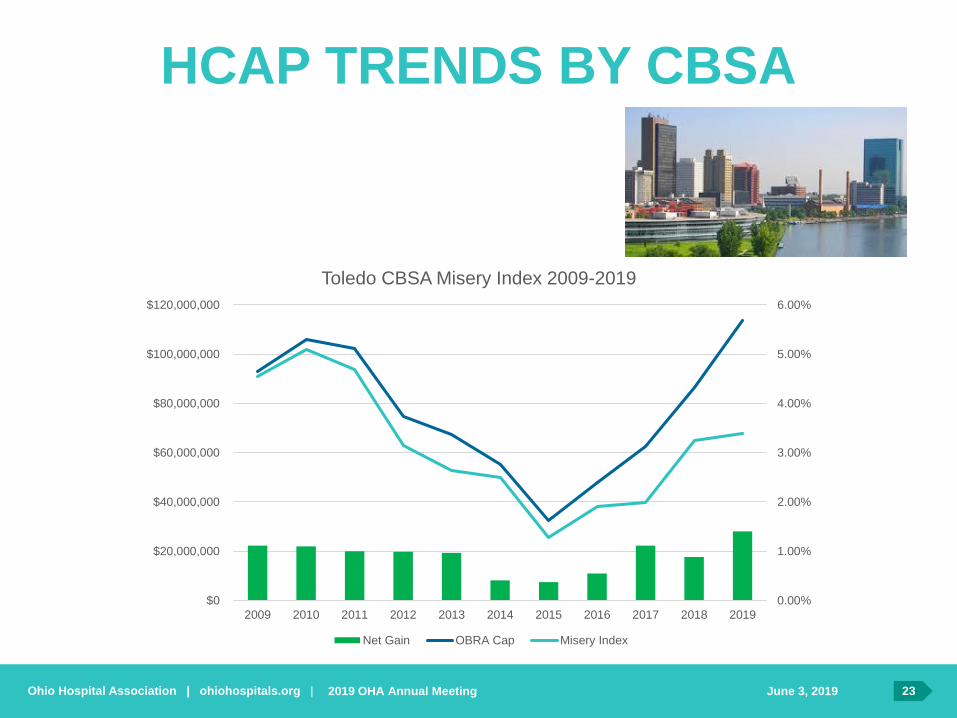
Toledo CBSA Misery Index 2009-2019
Net Gain OBRA Cap Misery Index

Ohio Hospital Association | ohiohospitals.org |
HCAP TRENDS BY CBSA
June 3, 20192019 OHA Annual Meeting 24
0.00%
1.00%
2.00%
3.00%
4.00%
5.00%
6.00%
7.00%
8.00%
$0
$50,000,000
$100,000,000
$150,000,000
$200,000,000
$250,000,000
$300,000,000
$350,000,000
$400,000,000
$450,000,000
$500,000,000
2009 2010 2011 2012 2013 2014 2015 2016 2017 2018 2019
Rural "CBSA" Misery Index 2009-2019
Net Gain OBRA Cap Misery Index
Ohio Hospital Association | ohiohospitals.org |
HCAP 2019
June 3, 20192019 OHA Annual Meeting 25
$0
$200
$400
$600
$800
$1,000
$1,200
$1,400
$1,600
$1,800
$2,000
2001 2002 2003 2004 2005 2006 2007 2008 2009 2010 2011 2012 2013 2014 2015 2016 2017 2018 2019
Millions
Ohio Hospital Uncompensated Care Costs & Medicaid Losses vs. HCAP Federal Funding 2001-2019
Uncompensated Care Costs HCAP Federal Funds

Ohio Hospital Association | ohiohospitals.org |
HCAP 2019
June 3, 20192019 OHA Annual Meeting 26
• Hospital gainers/net contributors:• 51 hospitals lose a combined $33.1M in the preliminary model;
• 44 have $0 OBRA Caps/DSH Limits—42 of those fail to meet OB requirement;
• 146 hospitals gain a combined $461.8M;
• 94 hospitals see a higher net gain in 2019 vs. 2018; 99 see a lower net gain.• 32 hospitals with a lower net gain had $0 OBRA Caps, so the lower net gain was a result of a
higher assessment.
• Closed hospital implications:• Affinity Medical Center, Good Samaritan (Dayton), Heather Hill Care Communities, and
Steward Northside closed prior to program year;
• Belmont Community Hospital closed during the program year, but are eligible to receive a payment for the time they were open;
• Remaining open hospitals in Belmont, Geauga, Mahoning, Montgomery, and Stark counties split net gain that would have gone to these hospitals during the time they were closed;
• 10 hospitals with OBRA room by Pot 4 split $7,072,927;
• Creates need for statewide residual pot.
• Rising OBRA Caps:• Both Medicaid shortfall and uncompensated care increased in 2019;
• Statewide Medicaid shortfalls have increased 15% from 2018 and 133% from 2016. Uncompensated care has increased 17% from 2018 and decreased 2% from 2016.

Ohio Hospital Association | ohiohospitals.org |
DSH AUDITS
2019 OHA Annual Meeting
June 3, 20192019 OHA Annual Meeting 27
Ohio Hospital Association | ohiohospitals.org |
DSH AUDITS
June 3, 20192019 OHA Annual Meeting 28
• Myers and Stauffer will re-run the DSH
audits for 2012-2015 after CMS withdrew
FAQs 33 and 34.
– Payments associated with dual-eligible patients
will come out of data; associated costs will not.
– All third-party payments will come out of HCAP
data
• Process to re-run audits will begin after 2016
audit is closed. Audit re-runs will start with
2012 and 2013.

Ohio Hospital Association | ohiohospitals.org |
FEDERAL DSH CUTS
2019 OHA Annual Meeting
June 3, 20192019 OHA Annual Meeting 29
Ohio Hospital Association | ohiohospitals.org |
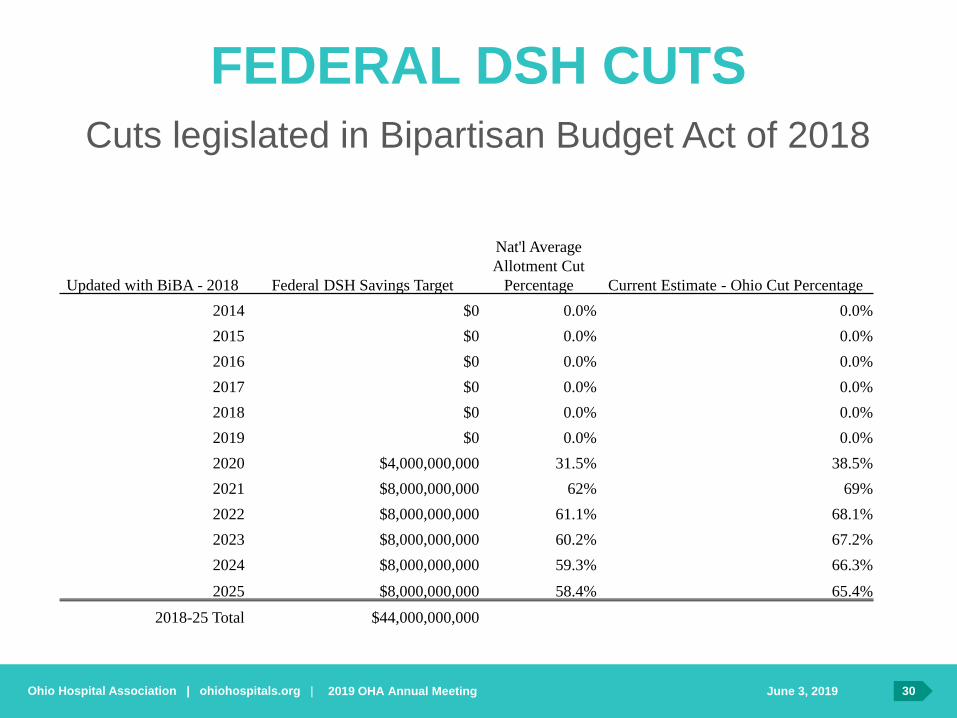
FEDERAL DSH CUTS
Updated with BiBA - 2018 Federal DSH Savings Target
Nat'l Average
Allotment Cut
Percentage Current Estimate - Ohio Cut Percentage
2014 $0 0.0% 0.0%
2015 $0 0.0% 0.0%
2016 $0 0.0% 0.0%
2017 $0 0.0% 0.0%
2018 $0 0.0% 0.0%
2019 $0 0.0% 0.0%
2020 $4,000,000,000 31.5% 38.5%
2021 $8,000,000,000 62% 69%
2022 $8,000,000,000 61.1% 68.1%
2023 $8,000,000,000 60.2% 67.2%
2024 $8,000,000,000 59.3% 66.3%
2025 $8,000,000,000 58.4% 65.4%
2018-25 Total $44,000,000,000
Cuts legislated in Bipartisan Budget Act of 2018
2019 OHA Annual Meeting 30June 3, 2019

Ohio Hospital Association | ohiohospitals.org |
QUESTIONS?
2019 OHA Annual Meeting
June 3, 20192019 OHA Annual Meeting 31

OHA collaborates with member hospitals
and health systems to ensure a healthy Ohio
—
Ohio Hospital Association
155 E. Broad St., Suite 301
Columbus, OH 43215-3640
T 614-221-7614
ohiohospitals.org
—
HelpingOhioHospitals
@OhioHospitals
www.youtube.com/user/OHA1915
Ryan Biles, Executive Vice President
Daniel Vielhaber, Manager, Health Economics & Policy