hcm signalized intersection capacity analysis 2: airport ... · hcm signalized intersection...
TRANSCRIPT

HCM Signalized Intersection Capacity Analysis2: Airport Blvd & Aviation Blvd 13/10/2011
Sonoma Airport 5:00 pm 16/12/2010 Existing + 2030 Project Increment Synchro 7 - Report%user_name% Page 1
Movement EBL EBT EBR WBL WBT WBR NBL NBT NBR SBL SBT SBRLane ConfigurationsVolume (vph) 13 373 74 197 952 675 90 46 166 191 33 28Ideal Flow (vphpl) 1900 1900 1900 1900 1900 1900 1900 1900 1900 1900 1900 1900Total Lost time (s) 3.0 4.5 3.0 4.5 3.0 3.0 3.0 3.0 3.0Lane Util. Factor 1.00 0.95 1.00 0.95 1.00 1.00 1.00 0.95 0.95Frpb, ped/bikes 1.00 1.00 1.00 1.00 0.98 1.00 0.98 1.00 1.00Flpb, ped/bikes 1.00 1.00 1.00 1.00 1.00 1.00 1.00 1.00 1.00Frt 1.00 0.98 1.00 1.00 0.85 1.00 0.85 1.00 0.97Flt Protected 0.95 1.00 0.95 1.00 1.00 0.97 1.00 0.95 0.97Satd. Flow (prot) 1752 3347 1752 3438 1532 1786 1530 1665 1645Flt Permitted 0.95 1.00 0.95 1.00 1.00 0.97 1.00 0.95 0.97Satd. Flow (perm) 1752 3347 1752 3438 1532 1786 1530 1665 1645Peak-hour factor, PHF 0.91 0.91 0.91 0.91 0.91 0.91 0.91 0.91 0.91 0.91 0.91 0.91Adj. Flow (vph) 14 410 81 216 1046 742 99 51 182 210 36 31RTOR Reduction (vph) 0 10 0 0 0 172 0 0 160 0 10 0Lane Group Flow (vph) 14 481 0 216 1046 570 0 150 22 139 128 0Confl. Peds. (#/hr) 5 5 5 5 5 5 5 5Heavy Vehicles (%) 3% 5% 3% 3% 5% 3% 3% 3% 3% 3% 3% 3%Turn Type Prot Prot pm+ov Split Perm SplitProtected Phases 1 6 5 2 7 8 8 7 7Permitted Phases 2 8Actuated Green, G (s) 2.5 54.5 18.6 70.6 86.6 13.4 13.4 16.0 16.0Effective Green, g (s) 3.5 55.5 19.6 71.6 88.6 14.4 14.4 17.0 17.0Actuated g/C Ratio 0.03 0.46 0.16 0.60 0.74 0.12 0.12 0.14 0.14Clearance Time (s) 4.0 5.5 4.0 5.5 4.0 4.0 4.0 4.0 4.0Vehicle Extension (s) 1.5 2.5 1.5 2.5 1.5 1.5 1.5 1.5 1.5Lane Grp Cap (vph) 51 1548 286 2051 1131 214 184 236 233v/s Ratio Prot 0.01 0.14 c0.12 c0.30 0.07 c0.08 c0.08 0.08v/s Ratio Perm 0.30 0.01v/c Ratio 0.27 0.31 0.76 0.51 0.50 0.70 0.12 0.59 0.55Uniform Delay, d1 57.0 20.2 47.9 14.0 6.5 50.7 47.1 48.2 47.9Progression Factor 1.00 1.00 0.96 0.91 1.42 1.00 1.00 1.00 1.00Incremental Delay, d2 1.1 0.1 7.2 0.7 0.1 8.2 0.1 2.4 1.4Delay (s) 58.1 20.3 53.4 13.4 9.4 58.9 47.2 50.6 49.3Level of Service E C D B A E D D DApproach Delay (s) 21.4 16.2 52.5 50.0Approach LOS C B D D
Intersection SummaryHCM Average Control Delay 23.9 HCM Level of Service CHCM Volume to Capacity ratio 0.58Actuated Cycle Length (s) 120.0 Sum of lost time (s) 9.0Intersection Capacity Utilization 64.0% ICU Level of Service BAnalysis Period (min) 15c Critical Lane Group

HCM Signalized Intersection Capacity Analysis2: Airport Blvd & Aviation Blvd 13/10/2011
Sonoma Airport 5:00 pm 16/12/2010 PM Existing + 2030 Project Synchro 7 - Report%user_name% Page 1
Movement EBL EBT EBR WBL WBT WBR NBL NBT NBR SBL SBT SBRLane ConfigurationsVolume (vph) 24 971 34 119 459 151 48 24 114 499 19 27Ideal Flow (vphpl) 1900 1900 1900 1900 1900 1900 1900 1900 1900 1900 1900 1900Total Lost time (s) 3.0 4.5 3.0 4.5 3.0 3.0 3.0 3.0 3.0Lane Util. Factor 1.00 0.95 1.00 0.95 1.00 1.00 1.00 0.95 0.95Frpb, ped/bikes 1.00 1.00 1.00 1.00 0.98 1.00 0.97 1.00 1.00Flpb, ped/bikes 1.00 1.00 1.00 1.00 1.00 1.00 1.00 1.00 1.00Frt 1.00 0.99 1.00 1.00 0.85 1.00 0.85 1.00 0.98Flt Protected 0.95 1.00 0.95 1.00 1.00 0.97 1.00 0.95 0.96Satd. Flow (prot) 1752 3420 1752 3438 1540 1785 1521 1665 1655Flt Permitted 0.95 1.00 0.95 1.00 1.00 0.97 1.00 0.95 0.96Satd. Flow (perm) 1752 3420 1752 3438 1540 1785 1521 1665 1655Peak-hour factor, PHF 0.91 0.91 0.91 0.91 0.91 0.91 0.91 0.91 0.91 0.91 0.91 0.91Adj. Flow (vph) 26 1067 37 131 504 166 53 26 125 548 21 30RTOR Reduction (vph) 0 2 0 0 0 44 0 0 115 0 5 0Lane Group Flow (vph) 26 1102 0 131 504 122 0 79 10 301 293 0Confl. Peds. (#/hr) 5 5 5 5 5 5 5 5Heavy Vehicles (%) 3% 5% 3% 3% 5% 3% 3% 3% 3% 3% 3% 3%Turn Type Prot Prot pm+ov Split Perm SplitProtected Phases 1 6 5 2 7 8 8 7 7Permitted Phases 2 8Actuated Green, G (s) 1.6 37.2 9.1 44.7 64.4 6.5 6.5 19.7 19.7Effective Green, g (s) 2.6 38.2 10.1 45.7 66.4 7.5 7.5 20.7 20.7Actuated g/C Ratio 0.03 0.42 0.11 0.51 0.74 0.08 0.08 0.23 0.23Clearance Time (s) 4.0 5.5 4.0 5.5 4.0 4.0 4.0 4.0 4.0Vehicle Extension (s) 1.5 2.5 1.5 2.5 1.5 1.5 1.5 1.5 1.5Lane Grp Cap (vph) 51 1452 197 1746 1136 149 127 383 381v/s Ratio Prot 0.01 c0.32 c0.07 0.15 0.02 c0.04 c0.18 0.18v/s Ratio Perm 0.05 0.01v/c Ratio 0.51 0.76 0.66 0.29 0.11 0.53 0.08 0.79 0.77Uniform Delay, d1 43.1 22.0 38.3 12.8 3.4 39.6 38.1 32.6 32.4Progression Factor 1.00 1.00 1.00 1.00 1.00 1.00 1.00 1.00 1.00Incremental Delay, d2 2.9 2.2 6.4 0.4 0.0 1.8 0.1 9.4 8.5Delay (s) 46.0 24.2 44.7 13.2 3.4 41.4 38.2 42.0 40.9Level of Service D C D B A D D D DApproach Delay (s) 24.7 16.3 39.4 41.5Approach LOS C B D D
Intersection SummaryHCM Average Control Delay 27.0 HCM Level of Service CHCM Volume to Capacity ratio 0.73Actuated Cycle Length (s) 90.0 Sum of lost time (s) 13.5Intersection Capacity Utilization 68.0% ICU Level of Service CAnalysis Period (min) 15c Critical Lane Group
HCM Signalized Intersection Capacity Analysis1: Airport Blvd & Brickway 13/10/2011
Sonoma Airport 5:00 pm 16/12/2010 Existing + 2030 Project Increment Synchro 7 - Report%user_name% Page 1
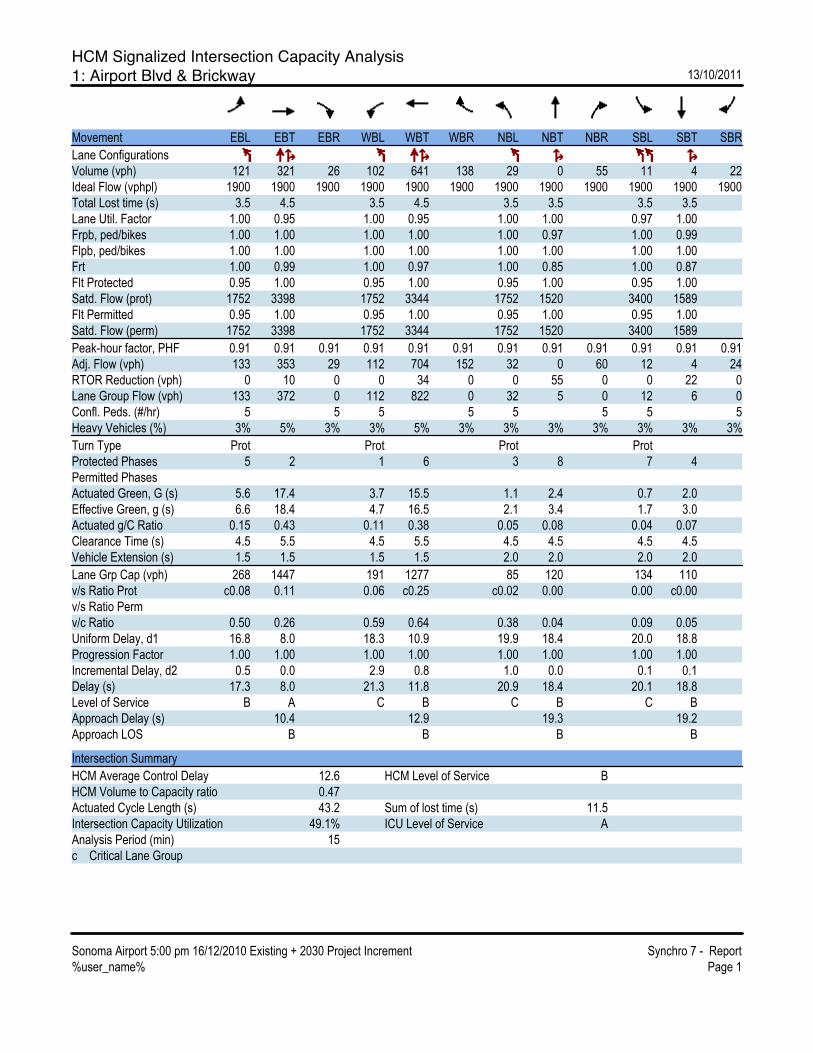
Movement EBL EBT EBR WBL WBT WBR NBL NBT NBR SBL SBT SBRLane ConfigurationsVolume (vph) 121 321 26 102 641 138 29 0 55 11 4 22Ideal Flow (vphpl) 1900 1900 1900 1900 1900 1900 1900 1900 1900 1900 1900 1900Total Lost time (s) 3.5 4.5 3.5 4.5 3.5 3.5 3.5 3.5Lane Util. Factor 1.00 0.95 1.00 0.95 1.00 1.00 0.97 1.00Frpb, ped/bikes 1.00 1.00 1.00 1.00 1.00 0.97 1.00 0.99Flpb, ped/bikes 1.00 1.00 1.00 1.00 1.00 1.00 1.00 1.00Frt 1.00 0.99 1.00 0.97 1.00 0.85 1.00 0.87Flt Protected 0.95 1.00 0.95 1.00 0.95 1.00 0.95 1.00Satd. Flow (prot) 1752 3398 1752 3344 1752 1520 3400 1589Flt Permitted 0.95 1.00 0.95 1.00 0.95 1.00 0.95 1.00Satd. Flow (perm) 1752 3398 1752 3344 1752 1520 3400 1589Peak-hour factor, PHF 0.91 0.91 0.91 0.91 0.91 0.91 0.91 0.91 0.91 0.91 0.91 0.91Adj. Flow (vph) 133 353 29 112 704 152 32 0 60 12 4 24RTOR Reduction (vph) 0 10 0 0 34 0 0 55 0 0 22 0Lane Group Flow (vph) 133 372 0 112 822 0 32 5 0 12 6 0Confl. Peds. (#/hr) 5 5 5 5 5 5 5 5Heavy Vehicles (%) 3% 5% 3% 3% 5% 3% 3% 3% 3% 3% 3% 3%Turn Type Prot Prot Prot ProtProtected Phases 5 2 1 6 3 8 7 4Permitted PhasesActuated Green, G (s) 5.6 17.4 3.7 15.5 1.1 2.4 0.7 2.0Effective Green, g (s) 6.6 18.4 4.7 16.5 2.1 3.4 1.7 3.0Actuated g/C Ratio 0.15 0.43 0.11 0.38 0.05 0.08 0.04 0.07Clearance Time (s) 4.5 5.5 4.5 5.5 4.5 4.5 4.5 4.5Vehicle Extension (s) 1.5 1.5 1.5 1.5 2.0 2.0 2.0 2.0Lane Grp Cap (vph) 268 1447 191 1277 85 120 134 110v/s Ratio Prot c0.08 0.11 0.06 c0.25 c0.02 0.00 0.00 c0.00v/s Ratio Permv/c Ratio 0.50 0.26 0.59 0.64 0.38 0.04 0.09 0.05Uniform Delay, d1 16.8 8.0 18.3 10.9 19.9 18.4 20.0 18.8Progression Factor 1.00 1.00 1.00 1.00 1.00 1.00 1.00 1.00Incremental Delay, d2 0.5 0.0 2.9 0.8 1.0 0.0 0.1 0.1Delay (s) 17.3 8.0 21.3 11.8 20.9 18.4 20.1 18.8Level of Service B A C B C B C BApproach Delay (s) 10.4 12.9 19.3 19.2Approach LOS B B B B
Intersection SummaryHCM Average Control Delay 12.6 HCM Level of Service BHCM Volume to Capacity ratio 0.47Actuated Cycle Length (s) 43.2 Sum of lost time (s) 11.5Intersection Capacity Utilization 49.1% ICU Level of Service AAnalysis Period (min) 15c Critical Lane Group

HCM Signalized Intersection Capacity Analysis1: Airport Blvd & Brickway 13/10/2011
Sonoma Airport 5:00 pm 16/12/2010 PM Existing + 2030 Project Synchro 7 - Report%user_name% Page 1
Movement EBL EBT EBR WBL WBT WBR NBL NBT NBR SBL SBT SBRLane ConfigurationsVolume (vph) 18 670 32 32 435 19 61 3 88 133 6 75Ideal Flow (vphpl) 1900 1900 1900 1900 1900 1900 1900 1900 1900 1900 1900 1900Total Lost time (s) 3.5 4.5 3.5 4.5 3.5 3.5 3.5 3.5 3.5Lane Util. Factor 1.00 0.95 1.00 0.95 1.00 0.95 0.95 0.97 1.00Frpb, ped/bikes 1.00 1.00 1.00 1.00 1.00 0.97 0.99 1.00 0.99Flpb, ped/bikes 1.00 1.00 1.00 1.00 1.00 1.00 1.00 1.00 1.00Frt 1.00 0.99 1.00 0.99 1.00 0.86 0.85 1.00 0.86Flt Protected 0.95 1.00 0.95 1.00 0.95 1.00 1.00 0.95 1.00Satd. Flow (prot) 1752 3414 1752 3416 1752 1461 1474 3400 1570Flt Permitted 0.95 1.00 0.95 1.00 0.95 1.00 1.00 0.95 1.00Satd. Flow (perm) 1752 3414 1752 3416 1752 1461 1474 3400 1570Peak-hour factor, PHF 0.91 0.91 0.91 0.91 0.91 0.91 0.91 0.91 0.91 0.91 0.91 0.91Adj. Flow (vph) 20 736 35 35 478 21 67 3 97 146 7 82RTOR Reduction (vph) 0 5 0 0 5 0 0 44 41 0 76 0Lane Group Flow (vph) 20 766 0 35 494 0 67 7 8 146 13 0Confl. Peds. (#/hr) 5 5 5 5 5 5 5 5Heavy Vehicles (%) 3% 5% 3% 3% 5% 3% 3% 3% 3% 3% 3% 3%Turn Type Prot Prot Prot pm+ov ProtProtected Phases 5 2 1 6 3 8 1 7 4Permitted Phases 8Actuated Green, G (s) 0.3 17.6 2.4 19.7 2.7 2.4 4.8 2.8 2.5Effective Green, g (s) 1.3 18.6 3.4 20.7 3.7 3.4 6.8 3.8 3.5Actuated g/C Ratio 0.03 0.42 0.08 0.47 0.08 0.08 0.15 0.09 0.08Clearance Time (s) 4.5 5.5 4.5 5.5 4.5 4.5 4.5 4.5 4.5Vehicle Extension (s) 1.5 1.5 1.5 1.5 2.0 2.0 1.5 2.0 2.0Lane Grp Cap (vph) 52 1437 135 1600 147 112 227 292 124v/s Ratio Prot 0.01 c0.22 c0.02 0.14 c0.04 0.00 0.00 c0.04 0.01v/s Ratio Perm 0.00v/c Ratio 0.38 0.53 0.26 0.31 0.46 0.06 0.03 0.50 0.11Uniform Delay, d1 21.1 9.6 19.2 7.3 19.3 18.9 15.9 19.3 18.9Progression Factor 1.00 1.00 1.00 1.00 1.00 1.00 1.00 1.00 1.00Incremental Delay, d2 1.7 0.2 0.4 0.0 0.8 0.1 0.0 0.5 0.1Delay (s) 22.8 9.7 19.6 7.3 20.1 19.0 15.9 19.8 19.0Level of Service C A B A C B B B BApproach Delay (s) 10.1 8.1 18.5 19.5Approach LOS B A B B
Intersection SummaryHCM Average Control Delay 11.6 HCM Level of Service BHCM Volume to Capacity ratio 0.43Actuated Cycle Length (s) 44.2 Sum of lost time (s) 11.5Intersection Capacity Utilization 47.3% ICU Level of Service AAnalysis Period (min) 15c Critical Lane Group

HCM Signalized Intersection Capacity Analysis7: Airport Blvd & US 101 NB Ramps 13/10/2011
Sonoma Airport 5:00 pm 16/12/2010 Existing + 2030 Project Increment Synchro 7 - Report%user_name% Page 1
Movement EBL EBT EBR WBL WBT WBR NBL NBT NBR SBL SBT SBRLane ConfigurationsVolume (vph) 103 215 0 0 659 230 880 0 34 0 0 0Ideal Flow (vphpl) 1900 1900 1900 1900 1900 1900 1900 1900 1900 1900 1900 1900Total Lost time (s) 3.0 4.5 4.5 4.5 3.5 3.5 3.5Lane Util. Factor 1.00 0.95 0.95 1.00 0.95 0.95 1.00Frt 1.00 1.00 1.00 0.85 1.00 1.00 0.85Flt Protected 0.95 1.00 1.00 1.00 0.95 0.95 1.00Satd. Flow (prot) 1719 3438 3438 1538 1633 1633 1568Flt Permitted 0.95 1.00 1.00 1.00 0.95 0.95 1.00Satd. Flow (perm) 1719 3438 3438 1538 1633 1633 1568Peak-hour factor, PHF 0.91 0.91 0.91 0.91 0.91 0.91 0.91 0.91 0.91 0.91 0.91 0.91Adj. Flow (vph) 113 236 0 0 724 253 967 0 37 0 0 0RTOR Reduction (vph) 0 0 0 0 0 165 0 0 23 0 0 0Lane Group Flow (vph) 113 236 0 0 724 88 483 484 14 0 0 0Heavy Vehicles (%) 5% 5% 2% 2% 5% 5% 5% 2% 3% 2% 2% 2%Turn Type Prot Perm Split PermProtected Phases 5 2 6 8 8Permitted Phases 6 8Actuated Green, G (s) 4.9 28.8 19.9 19.9 21.2 21.2 21.2Effective Green, g (s) 5.9 29.8 20.9 20.9 22.2 22.2 22.2Actuated g/C Ratio 0.10 0.50 0.35 0.35 0.37 0.37 0.37Clearance Time (s) 4.0 5.5 5.5 5.5 4.5 4.5 4.5Vehicle Extension (s) 3.0 3.0 3.0 3.0 3.0 3.0 3.0Lane Grp Cap (vph) 169 1708 1198 536 604 604 580v/s Ratio Prot c0.07 0.07 c0.21 0.30 c0.30v/s Ratio Perm 0.06 0.01v/c Ratio 0.67 0.14 0.60 0.16 0.80 0.80 0.02Uniform Delay, d1 26.1 8.2 16.1 13.5 16.9 16.9 12.0Progression Factor 1.01 0.50 1.00 1.00 1.00 1.00 1.00Incremental Delay, d2 9.6 0.2 2.3 0.7 7.3 7.5 0.0Delay (s) 35.9 4.3 18.4 14.2 24.2 24.5 12.0Level of Service D A B B C C BApproach Delay (s) 14.5 17.3 23.9 0.0Approach LOS B B C A
Intersection SummaryHCM Average Control Delay 19.7 HCM Level of Service BHCM Volume to Capacity ratio 0.70Actuated Cycle Length (s) 60.0 Sum of lost time (s) 11.0Intersection Capacity Utilization 58.7% ICU Level of Service BAnalysis Period (min) 15c Critical Lane Group

HCM Signalized Intersection Capacity Analysis7: Airport Blvd & US 101 NB Ramps 13/10/2011
Sonoma Airport 5:00 pm 16/12/2010 PM Existing + 2030 Project Synchro 7 - Report%user_name% Page 1
Movement EBL EBT EBR WBL WBT WBR NBL NBT NBR SBL SBT SBRLane ConfigurationsVolume (vph) 205 508 0 0 236 362 311 0 66 0 0 0Ideal Flow (vphpl) 1900 1900 1900 1900 1900 1900 1900 1900 1900 1900 1900 1900Total Lost time (s) 3.0 4.5 4.5 4.5 3.5 3.5 3.5Lane Util. Factor 1.00 0.95 0.95 1.00 0.95 0.95 1.00Frt 1.00 1.00 1.00 0.85 1.00 1.00 0.85Flt Protected 0.95 1.00 1.00 1.00 0.95 0.95 1.00Satd. Flow (prot) 1719 3438 3438 1538 1633 1633 1568Flt Permitted 0.95 1.00 1.00 1.00 0.95 0.95 1.00Satd. Flow (perm) 1719 3438 3438 1538 1633 1633 1568Peak-hour factor, PHF 0.91 0.91 0.91 0.91 0.91 0.91 0.91 0.91 0.91 0.91 0.91 0.91Adj. Flow (vph) 225 558 0 0 259 398 342 0 73 0 0 0RTOR Reduction (vph) 0 0 0 0 0 247 0 0 59 0 0 0Lane Group Flow (vph) 225 558 0 0 259 151 171 171 14 0 0 0Heavy Vehicles (%) 5% 5% 2% 2% 5% 5% 5% 2% 3% 2% 2% 2%Turn Type Prot Perm Split PermProtected Phases 5 2 6 8 8Permitted Phases 6 8Actuated Green, G (s) 14.0 39.8 21.8 21.8 10.2 10.2 10.2Effective Green, g (s) 15.0 40.8 22.8 22.8 11.2 11.2 11.2Actuated g/C Ratio 0.25 0.68 0.38 0.38 0.19 0.19 0.19Clearance Time (s) 4.0 5.5 5.5 5.5 4.5 4.5 4.5Vehicle Extension (s) 3.0 3.0 3.0 3.0 3.0 3.0 3.0Lane Grp Cap (vph) 430 2338 1306 584 305 305 293v/s Ratio Prot c0.13 c0.16 0.08 c0.10 0.10v/s Ratio Perm 0.10 0.01v/c Ratio 0.52 0.24 0.20 0.26 0.56 0.56 0.05Uniform Delay, d1 19.4 3.7 12.5 12.8 22.2 22.2 20.0Progression Factor 0.86 0.73 1.00 1.00 1.00 1.00 1.00Incremental Delay, d2 1.1 0.2 0.3 1.1 2.4 2.4 0.1Delay (s) 17.9 2.9 12.8 13.9 24.5 24.5 20.1Level of Service B A B B C C CApproach Delay (s) 7.2 13.4 23.7 0.0Approach LOS A B C A
Intersection SummaryHCM Average Control Delay 13.1 HCM Level of Service BHCM Volume to Capacity ratio 0.41Actuated Cycle Length (s) 60.0 Sum of lost time (s) 11.0Intersection Capacity Utilization 52.8% ICU Level of Service AAnalysis Period (min) 15c Critical Lane Group

HCM Signalized Intersection Capacity Analysis3: Airport Blvd & US 101 SB Off-Ramp 13/10/2011
Sonoma Airport 5:00 pm 16/12/2010 Existing + 2030 Project Increment Synchro 7 - Report%user_name% Page 1
Movement EBL EBT EBR WBL WBT WBR SBL2 SBL SBR NWL NWRLane ConfigurationsVolume (vph) 0 228 502 0 1443 96 90 0 381 0 0Ideal Flow (vphpl) 1900 1900 1900 1900 1900 1900 1900 1900 1900 1900 1900Total Lost time (s) 3.5 3.0 3.5 3.5 3.5 3.5Lane Util. Factor 0.95 1.00 0.95 1.00 0.97 0.88Frt 1.00 0.85 1.00 0.85 1.00 0.85Flt Protected 1.00 1.00 1.00 1.00 0.95 1.00Satd. Flow (prot) 3438 1568 3438 1583 3400 2760Flt Permitted 1.00 1.00 1.00 1.00 0.95 1.00Satd. Flow (perm) 3438 1568 3438 1583 3400 2760Peak-hour factor, PHF 0.91 0.91 0.91 0.91 0.91 0.91 0.91 0.91 0.91 0.91 0.91Adj. Flow (vph) 0 251 552 0 1586 105 99 0 419 0 0RTOR Reduction (vph) 0 0 0 0 0 35 0 0 54 0 0Lane Group Flow (vph) 0 251 552 0 1586 70 99 0 365 0 0Heavy Vehicles (%) 3% 5% 3% 2% 5% 2% 3% 2% 3% 2% 2%Turn Type Free Perm Prot customProtected Phases 2 6 4Permitted Phases Free 6 4Actuated Green, G (s) 39.1 60.0 39.1 39.1 11.9 11.9Effective Green, g (s) 40.1 60.0 40.1 40.1 12.9 12.9Actuated g/C Ratio 0.67 1.00 0.67 0.67 0.22 0.22Clearance Time (s) 4.5 4.5 4.5 4.5 4.5Vehicle Extension (s) 3.0 3.0 3.0 3.0 3.0Lane Grp Cap (vph) 2298 1568 2298 1058 731 593v/s Ratio Prot 0.07 c0.46 0.03v/s Ratio Perm 0.35 0.04 c0.13v/c Ratio 0.11 0.35 0.69 0.07 0.14 0.62Uniform Delay, d1 3.6 0.0 6.1 3.5 19.0 21.3Progression Factor 1.62 1.00 0.36 2.06 1.00 1.00Incremental Delay, d2 0.1 0.6 0.7 0.0 0.1 1.9Delay (s) 5.8 0.6 2.8 7.1 19.1 23.2Level of Service A A A A B CApproach Delay (s) 2.2 3.1 22.4 0.0Approach LOS A A C A
Intersection SummaryHCM Average Control Delay 6.2 HCM Level of Service AHCM Volume to Capacity ratio 0.67Actuated Cycle Length (s) 60.0 Sum of lost time (s) 7.0Intersection Capacity Utilization 59.9% ICU Level of Service BAnalysis Period (min) 15c Critical Lane Group

HCM Signalized Intersection Capacity Analysis3: Airport Blvd & US 101 SB Off-Ramp 13/10/2011
Sonoma Airport 5:00 pm 16/12/2010 PM Existing + 2030 Project Synchro 7 - Report%user_name% Page 1
Movement EBL EBT EBR WBL WBT WBR SBL2 SBL SBR NWL NWRLane ConfigurationsVolume (vph) 0 593 991 0 498 60 120 0 231 0 0Ideal Flow (vphpl) 1900 1900 1900 1900 1900 1900 1900 1900 1900 1900 1900Total Lost time (s) 3.5 3.0 3.5 3.5 3.5 3.5Lane Util. Factor 0.95 1.00 0.95 1.00 0.97 0.88Frt 1.00 0.85 1.00 0.85 1.00 0.85Flt Protected 1.00 1.00 1.00 1.00 0.95 1.00Satd. Flow (prot) 3438 1568 3438 1583 3400 2760Flt Permitted 1.00 1.00 1.00 1.00 0.95 1.00Satd. Flow (perm) 3438 1568 3438 1583 3400 2760Peak-hour factor, PHF 0.91 0.91 0.91 0.91 0.91 0.91 0.91 0.91 0.91 0.91 0.91Adj. Flow (vph) 0 652 1089 0 547 66 132 0 254 0 0RTOR Reduction (vph) 0 0 0 0 0 17 0 0 217 0 0Lane Group Flow (vph) 0 652 1089 0 547 49 132 0 37 0 0Heavy Vehicles (%) 3% 5% 3% 2% 5% 2% 3% 2% 3% 2% 2%Turn Type Free Perm Prot customProtected Phases 2 6 4Permitted Phases Free 6 4Actuated Green, G (s) 43.3 60.0 43.3 43.3 7.7 7.7Effective Green, g (s) 44.3 60.0 44.3 44.3 8.7 8.7Actuated g/C Ratio 0.74 1.00 0.74 0.74 0.14 0.14Clearance Time (s) 4.5 4.5 4.5 4.5 4.5Vehicle Extension (s) 3.0 3.0 3.0 3.0 3.0Lane Grp Cap (vph) 2538 1568 2538 1169 493 400v/s Ratio Prot 0.19 0.16 0.04v/s Ratio Perm c0.69 0.03 0.01v/c Ratio 0.26 0.69 0.22 0.04 0.27 0.09Uniform Delay, d1 2.5 0.0 2.4 2.1 22.8 22.2Progression Factor 1.00 1.00 0.35 0.87 1.00 1.00Incremental Delay, d2 0.2 2.6 0.0 0.0 0.3 0.1Delay (s) 2.8 2.6 0.9 1.9 23.1 22.3Level of Service A A A A C CApproach Delay (s) 2.6 1.0 22.6 0.0Approach LOS A A C A
Intersection SummaryHCM Average Control Delay 5.1 HCM Level of Service AHCM Volume to Capacity ratio 0.69Actuated Cycle Length (s) 60.0 Sum of lost time (s) 0.0Intersection Capacity Utilization 28.5% ICU Level of Service AAnalysis Period (min) 15c Critical Lane Group

HCM Unsignalized Intersection Capacity Analysis55: Airport Blvd & Skylane 13/10/2011
Sonoma Airport 5:00 pm 16/12/2010 Existing + 2030 Project Increment Synchro 7 - Report%user_name% Page 1
Movement EBL EBT EBR WBL WBT WBR NBL NBT NBR SBL SBT SBRLane ConfigurationsVolume (veh/h) 34 105 18 94 245 161 32 90 130 270 134 71Sign Control Free Free Stop StopGrade 0% 0% 0% 0%Peak Hour Factor 0.91 0.91 0.91 0.91 0.91 0.91 0.91 0.91 0.91 0.91 0.91 0.91Hourly flow rate (vph) 37 115 20 103 269 177 35 99 143 297 147 78Pedestrians 5 5 5 5Lane Width (ft) 12.0 12.0 12.0 12.0Walking Speed (ft/s) 4.0 4.0 4.0 4.0Percent Blockage 0 0 0 0Right turn flare (veh)Median type None NoneMedian storage veh)Upstream signal (ft)pX, platoon unblockedvC, conflicting volume 451 140 828 853 125 868 696 279vC1, stage 1 conf volvC2, stage 2 conf volvCu, unblocked vol 451 140 828 853 125 868 696 279tC, single (s) 4.1 4.1 7.1 6.5 6.2 7.1 6.5 6.2tC, 2 stage (s)tF (s) 2.2 2.2 3.5 4.0 3.3 3.5 4.0 3.3p0 queue free % 97 93 77 62 84 0 55 90cM capacity (veh/h) 1099 1431 153 262 915 148 324 751
Direction, Lane # EB 1 EB 2 EB 3 WB 1 WB 2 WB 3 NB 1 NB 2 SB 1 SB 2Volume Total 37 115 20 103 269 177 35 242 297 225Volume Left 37 0 0 103 0 0 35 0 297 0Volume Right 0 0 20 0 0 177 0 143 0 78cSH 1099 1700 1700 1431 1700 1700 153 454 148 403Volume to Capacity 0.03 0.07 0.01 0.07 0.16 0.10 0.23 0.53 2.01 0.56Queue Length 95th (ft) 3 0 0 6 0 0 21 77 584 83Control Delay (s) 8.4 0.0 0.0 7.7 0.0 0.0 35.5 21.6 526.6 24.7Lane LOS A A E C F CApproach Delay (s) 1.8 1.4 23.4 310.0Approach LOS C F
Intersection SummaryAverage Delay 111.4Intersection Capacity Utilization 57.7% ICU Level of Service BAnalysis Period (min) 15
HCM Unsignalized Intersection Capacity Analysis55: Airport Blvd & Skylane 13/10/2011
Sonoma Airport 5:00 pm 16/12/2010 PM Existing + 2030 Project Synchro 7 - Report%user_name% Page 1
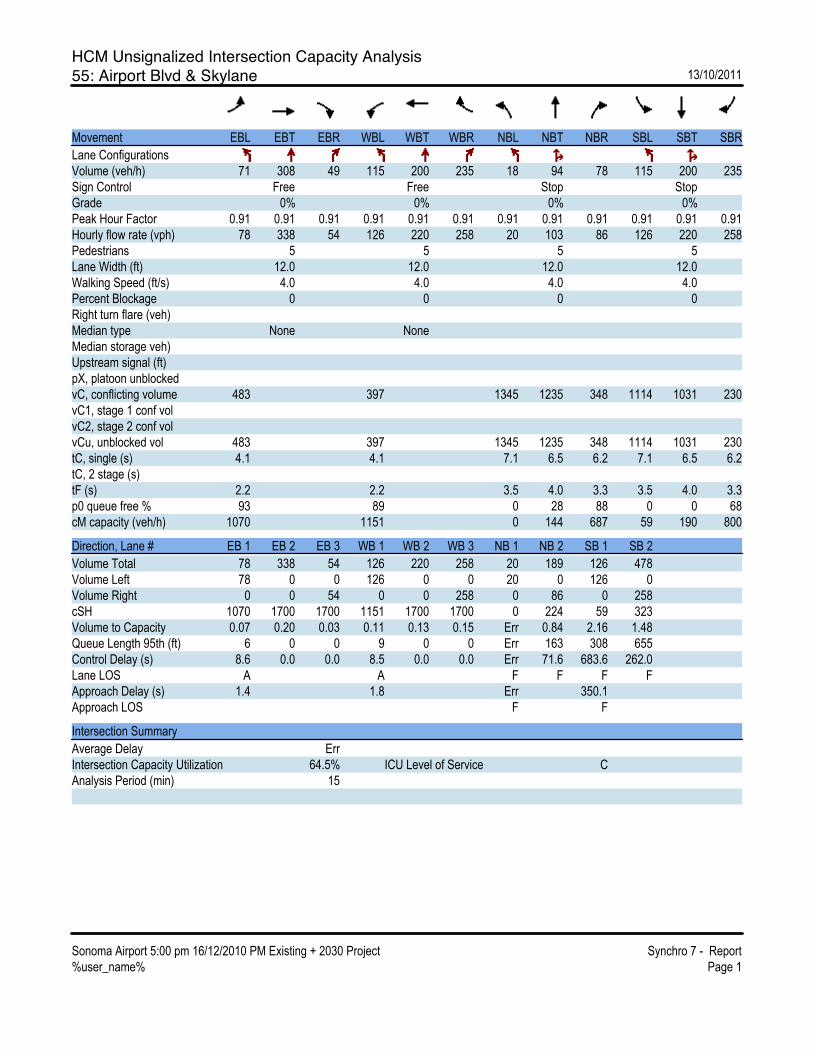
Movement EBL EBT EBR WBL WBT WBR NBL NBT NBR SBL SBT SBRLane ConfigurationsVolume (veh/h) 71 308 49 115 200 235 18 94 78 115 200 235Sign Control Free Free Stop StopGrade 0% 0% 0% 0%Peak Hour Factor 0.91 0.91 0.91 0.91 0.91 0.91 0.91 0.91 0.91 0.91 0.91 0.91Hourly flow rate (vph) 78 338 54 126 220 258 20 103 86 126 220 258Pedestrians 5 5 5 5Lane Width (ft) 12.0 12.0 12.0 12.0Walking Speed (ft/s) 4.0 4.0 4.0 4.0Percent Blockage 0 0 0 0Right turn flare (veh)Median type None NoneMedian storage veh)Upstream signal (ft)pX, platoon unblockedvC, conflicting volume 483 397 1345 1235 348 1114 1031 230vC1, stage 1 conf volvC2, stage 2 conf volvCu, unblocked vol 483 397 1345 1235 348 1114 1031 230tC, single (s) 4.1 4.1 7.1 6.5 6.2 7.1 6.5 6.2tC, 2 stage (s)tF (s) 2.2 2.2 3.5 4.0 3.3 3.5 4.0 3.3p0 queue free % 93 89 0 28 88 0 0 68cM capacity (veh/h) 1070 1151 0 144 687 59 190 800
Direction, Lane # EB 1 EB 2 EB 3 WB 1 WB 2 WB 3 NB 1 NB 2 SB 1 SB 2Volume Total 78 338 54 126 220 258 20 189 126 478Volume Left 78 0 0 126 0 0 20 0 126 0Volume Right 0 0 54 0 0 258 0 86 0 258cSH 1070 1700 1700 1151 1700 1700 0 224 59 323Volume to Capacity 0.07 0.20 0.03 0.11 0.13 0.15 Err 0.84 2.16 1.48Queue Length 95th (ft) 6 0 0 9 0 0 Err 163 308 655Control Delay (s) 8.6 0.0 0.0 8.5 0.0 0.0 Err 71.6 683.6 262.0Lane LOS A A F F F FApproach Delay (s) 1.4 1.8 Err 350.1Approach LOS F F
Intersection SummaryAverage Delay ErrIntersection Capacity Utilization 64.5% ICU Level of Service CAnalysis Period (min) 15

HCM Signalized Intersection Capacity Analysis2: Airport Blvd & Aviation Blvd 17/12/2010
Sonoma Airport 5:00 pm 16/12/2010 2030 PM Base Case Synchro 7 - Report%user_name% Page 1
Movement EBL EBT EBR WBL WBT WBR NBL NBT NBR SBL SBT SBRLane ConfigurationsVolume (vph) 32 857 40 130 487 198 55 27 125 558 25 35Ideal Flow (vphpl) 1900 1900 1900 1900 1900 1900 1900 1900 1900 1900 1900 1900Total Lost time (s) 3.0 4.5 3.0 4.5 4.5 3.0 3.0 3.0 3.0 3.0Lane Util. Factor 1.00 0.95 1.00 0.95 1.00 1.00 1.00 1.00 0.97 1.00Frpb, ped/bikes 1.00 1.00 1.00 1.00 0.97 1.00 1.00 0.97 1.00 0.99Flpb, ped/bikes 1.00 1.00 1.00 1.00 1.00 1.00 1.00 1.00 1.00 1.00Frt 1.00 0.99 1.00 1.00 0.85 1.00 1.00 0.85 1.00 0.91Flt Protected 0.95 1.00 0.95 1.00 1.00 0.95 1.00 1.00 0.95 1.00Satd. Flow (prot) 1752 3414 1752 3438 1525 1752 1845 1524 3400 1667Flt Permitted 0.95 1.00 0.95 1.00 1.00 0.95 1.00 1.00 0.95 1.00Satd. Flow (perm) 1752 3414 1752 3438 1525 1752 1845 1524 3400 1667Peak-hour factor, PHF 0.91 0.91 0.91 0.91 0.91 0.91 0.91 0.91 0.91 0.91 0.91 0.91Adj. Flow (vph) 35 942 44 143 535 218 60 30 137 613 27 38RTOR Reduction (vph) 0 4 0 0 0 110 0 0 125 0 34 0Lane Group Flow (vph) 35 982 0 143 535 108 60 30 12 613 31 0Confl. Peds. (#/hr) 5 5 5 5 5 5 5 5Heavy Vehicles (%) 3% 5% 3% 3% 5% 3% 3% 3% 3% 3% 3% 3%Turn Type Prot Prot Perm Prot Perm ProtProtected Phases 5 2 1 6 3 8 7 4Permitted Phases 6 8Actuated Green, G (s) 3.3 35.0 11.8 43.5 43.5 16.1 7.1 7.1 18.6 9.6Effective Green, g (s) 4.3 36.0 12.8 44.5 44.5 17.1 8.1 8.1 19.6 10.6Actuated g/C Ratio 0.05 0.40 0.14 0.49 0.49 0.19 0.09 0.09 0.22 0.12Clearance Time (s) 4.0 5.5 4.0 5.5 5.5 4.0 4.0 4.0 4.0 4.0Vehicle Extension (s) 1.5 2.5 1.5 2.5 2.5 1.5 1.5 1.5 1.5 1.5Lane Grp Cap (vph) 84 1366 249 1700 754 333 166 137 740 196v/s Ratio Prot 0.02 c0.29 c0.08 0.16 c0.03 0.02 c0.18 0.02v/s Ratio Perm 0.07 0.01v/c Ratio 0.42 0.72 0.57 0.31 0.14 0.18 0.18 0.09 0.83 0.16Uniform Delay, d1 41.6 22.7 36.1 13.6 12.4 30.6 37.9 37.6 33.6 35.7Progression Factor 1.00 1.00 1.00 1.00 1.00 1.00 1.00 1.00 1.00 1.00Incremental Delay, d2 1.2 3.3 2.0 0.1 0.1 0.1 0.2 0.1 7.3 0.1Delay (s) 42.9 26.0 38.0 13.7 12.4 30.7 38.1 37.7 40.9 35.8Level of Service D C D B B C D D D DApproach Delay (s) 26.6 17.3 35.9 40.4Approach LOS C B D D
Intersection SummaryHCM Average Control Delay 27.7 HCM Level of Service CHCM Volume to Capacity ratio 0.65Actuated Cycle Length (s) 90.0 Sum of lost time (s) 10.5Intersection Capacity Utilization 68.8% ICU Level of Service CAnalysis Period (min) 15c Critical Lane Group

HCM Signalized Intersection Capacity Analysis2: Airport Blvd & Aviation Blvd 17/12/2010
Sonoma Airport 5:00 pm 16/12/2010 2030 PM Base Case + Project Synchro 7 - Report%user_name% Page 1
Movement EBL EBT EBR WBL WBT WBR NBL NBT NBR SBL SBT SBRLane ConfigurationsVolume (vph) 32 1055 40 130 600 195 55 27 125 555 25 35Ideal Flow (vphpl) 1900 1900 1900 1900 1900 1900 1900 1900 1900 1900 1900 1900Total Lost time (s) 3.0 4.5 3.0 4.5 4.5 3.0 3.0 3.0 3.0 3.0Lane Util. Factor 1.00 0.95 1.00 0.95 1.00 1.00 1.00 1.00 0.97 1.00Frpb, ped/bikes 1.00 1.00 1.00 1.00 0.97 1.00 1.00 0.97 1.00 0.99Flpb, ped/bikes 1.00 1.00 1.00 1.00 1.00 1.00 1.00 1.00 1.00 1.00Frt 1.00 0.99 1.00 1.00 0.85 1.00 1.00 0.85 1.00 0.91Flt Protected 0.95 1.00 0.95 1.00 1.00 0.95 1.00 1.00 0.95 1.00Satd. Flow (prot) 1752 3418 1752 3438 1525 1752 1845 1523 3400 1667Flt Permitted 0.95 1.00 0.95 1.00 1.00 0.95 1.00 1.00 0.95 1.00Satd. Flow (perm) 1752 3418 1752 3438 1525 1752 1845 1523 3400 1667Peak-hour factor, PHF 0.91 0.91 0.91 0.91 0.91 0.91 0.91 0.91 0.91 0.91 0.91 0.91Adj. Flow (vph) 35 1159 44 143 659 214 60 30 137 610 27 38RTOR Reduction (vph) 0 3 0 0 0 104 0 0 125 0 34 0Lane Group Flow (vph) 35 1200 0 143 659 110 60 30 12 610 31 0Confl. Peds. (#/hr) 5 5 5 5 5 5 5 5Heavy Vehicles (%) 3% 5% 3% 3% 5% 3% 3% 3% 3% 3% 3% 3%Turn Type Prot Prot Perm Prot Perm ProtProtected Phases 5 2 1 6 3 8 7 4Permitted Phases 6 8Actuated Green, G (s) 3.1 37.4 10.8 45.1 45.1 14.7 6.8 6.8 17.5 9.6Effective Green, g (s) 4.1 38.4 11.8 46.1 46.1 15.7 7.8 7.8 18.5 10.6Actuated g/C Ratio 0.05 0.43 0.13 0.51 0.51 0.17 0.09 0.09 0.21 0.12Clearance Time (s) 4.0 5.5 4.0 5.5 5.5 4.0 4.0 4.0 4.0 4.0Vehicle Extension (s) 1.5 2.5 1.5 2.5 2.5 1.5 1.5 1.5 1.5 1.5Lane Grp Cap (vph) 80 1458 230 1761 781 306 160 132 699 196v/s Ratio Prot 0.02 c0.35 c0.08 0.19 c0.03 0.02 c0.18 0.02v/s Ratio Perm 0.07 0.01v/c Ratio 0.44 0.82 0.62 0.37 0.14 0.20 0.19 0.09 0.87 0.16Uniform Delay, d1 41.8 22.8 37.0 13.2 11.5 31.8 38.2 37.8 34.6 35.7Progression Factor 1.00 1.00 1.00 1.00 1.00 1.00 1.00 1.00 1.00 1.00Incremental Delay, d2 1.4 5.4 3.7 0.1 0.1 0.1 0.2 0.1 11.3 0.1Delay (s) 43.2 28.2 40.7 13.3 11.6 31.9 38.4 37.9 45.9 35.8Level of Service D C D B B C D D D DApproach Delay (s) 28.6 16.8 36.4 44.9Approach LOS C B D D
Intersection SummaryHCM Average Control Delay 28.9 HCM Level of Service CHCM Volume to Capacity ratio 0.72Actuated Cycle Length (s) 90.0 Sum of lost time (s) 10.5Intersection Capacity Utilization 71.7% ICU Level of Service CAnalysis Period (min) 15c Critical Lane Group
HCM Signalized Intersection Capacity Analysis2: Airport Blvd & Aviation Blvd 17/12/2010
Sonoma Airport 5:00 pm 16/12/2010 2030 AM Base Case + Project Synchro 7 - Report%user_name% Page 1
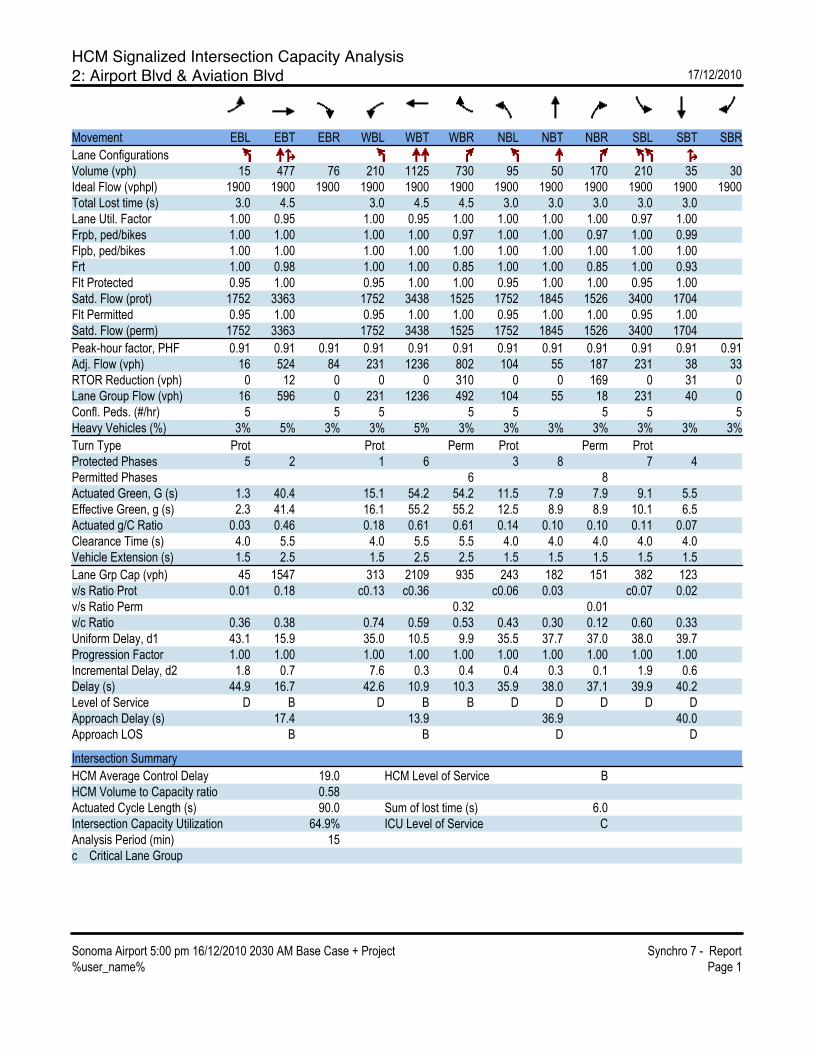
Movement EBL EBT EBR WBL WBT WBR NBL NBT NBR SBL SBT SBRLane ConfigurationsVolume (vph) 15 477 76 210 1125 730 95 50 170 210 35 30Ideal Flow (vphpl) 1900 1900 1900 1900 1900 1900 1900 1900 1900 1900 1900 1900Total Lost time (s) 3.0 4.5 3.0 4.5 4.5 3.0 3.0 3.0 3.0 3.0Lane Util. Factor 1.00 0.95 1.00 0.95 1.00 1.00 1.00 1.00 0.97 1.00Frpb, ped/bikes 1.00 1.00 1.00 1.00 0.97 1.00 1.00 0.97 1.00 0.99Flpb, ped/bikes 1.00 1.00 1.00 1.00 1.00 1.00 1.00 1.00 1.00 1.00Frt 1.00 0.98 1.00 1.00 0.85 1.00 1.00 0.85 1.00 0.93Flt Protected 0.95 1.00 0.95 1.00 1.00 0.95 1.00 1.00 0.95 1.00Satd. Flow (prot) 1752 3363 1752 3438 1525 1752 1845 1526 3400 1704Flt Permitted 0.95 1.00 0.95 1.00 1.00 0.95 1.00 1.00 0.95 1.00Satd. Flow (perm) 1752 3363 1752 3438 1525 1752 1845 1526 3400 1704Peak-hour factor, PHF 0.91 0.91 0.91 0.91 0.91 0.91 0.91 0.91 0.91 0.91 0.91 0.91Adj. Flow (vph) 16 524 84 231 1236 802 104 55 187 231 38 33RTOR Reduction (vph) 0 12 0 0 0 310 0 0 169 0 31 0Lane Group Flow (vph) 16 596 0 231 1236 492 104 55 18 231 40 0Confl. Peds. (#/hr) 5 5 5 5 5 5 5 5Heavy Vehicles (%) 3% 5% 3% 3% 5% 3% 3% 3% 3% 3% 3% 3%Turn Type Prot Prot Perm Prot Perm ProtProtected Phases 5 2 1 6 3 8 7 4Permitted Phases 6 8Actuated Green, G (s) 1.3 40.4 15.1 54.2 54.2 11.5 7.9 7.9 9.1 5.5Effective Green, g (s) 2.3 41.4 16.1 55.2 55.2 12.5 8.9 8.9 10.1 6.5Actuated g/C Ratio 0.03 0.46 0.18 0.61 0.61 0.14 0.10 0.10 0.11 0.07Clearance Time (s) 4.0 5.5 4.0 5.5 5.5 4.0 4.0 4.0 4.0 4.0Vehicle Extension (s) 1.5 2.5 1.5 2.5 2.5 1.5 1.5 1.5 1.5 1.5Lane Grp Cap (vph) 45 1547 313 2109 935 243 182 151 382 123v/s Ratio Prot 0.01 0.18 c0.13 c0.36 c0.06 0.03 c0.07 0.02v/s Ratio Perm 0.32 0.01v/c Ratio 0.36 0.38 0.74 0.59 0.53 0.43 0.30 0.12 0.60 0.33Uniform Delay, d1 43.1 15.9 35.0 10.5 9.9 35.5 37.7 37.0 38.0 39.7Progression Factor 1.00 1.00 1.00 1.00 1.00 1.00 1.00 1.00 1.00 1.00Incremental Delay, d2 1.8 0.7 7.6 0.3 0.4 0.4 0.3 0.1 1.9 0.6Delay (s) 44.9 16.7 42.6 10.9 10.3 35.9 38.0 37.1 39.9 40.2Level of Service D B D B B D D D D DApproach Delay (s) 17.4 13.9 36.9 40.0Approach LOS B B D D
Intersection SummaryHCM Average Control Delay 19.0 HCM Level of Service BHCM Volume to Capacity ratio 0.58Actuated Cycle Length (s) 90.0 Sum of lost time (s) 6.0Intersection Capacity Utilization 64.9% ICU Level of Service CAnalysis Period (min) 15c Critical Lane Group

HCM Signalized Intersection Capacity Analysis1: Airport Blvd & Brickway 17/12/2010
Sonoma Airport 5:00 pm 16/12/2010 2030 PM Base Case Synchro 7 - Report%user_name% Page 1
Movement EBL EBT EBR WBL WBT WBR NBL NBT NBR SBL SBT SBRLane ConfigurationsVolume (vph) 12 605 60 70 481 25 93 26 111 125 77 35Ideal Flow (vphpl) 1900 1900 1900 1900 1900 1900 1900 1900 1900 1900 1900 1900Total Lost time (s) 3.5 4.5 3.5 4.5 3.5 3.5 3.5 3.5 3.5Lane Util. Factor 1.00 0.95 1.00 0.95 1.00 1.00 1.00 0.97 1.00Frpb, ped/bikes 1.00 1.00 1.00 1.00 1.00 1.00 0.99 1.00 1.00Flpb, ped/bikes 1.00 1.00 1.00 1.00 1.00 1.00 1.00 1.00 1.00Frt 1.00 0.99 1.00 0.99 1.00 1.00 0.85 1.00 0.95Flt Protected 0.95 1.00 0.95 1.00 0.95 1.00 1.00 0.95 1.00Satd. Flow (prot) 1752 3390 1752 3412 1752 1845 1554 3400 1752Flt Permitted 0.95 1.00 0.95 1.00 0.95 1.00 1.00 0.95 1.00Satd. Flow (perm) 1752 3390 1752 3412 1752 1845 1554 3400 1752Peak-hour factor, PHF 0.91 0.91 0.91 0.91 0.91 0.91 0.91 0.91 0.91 0.91 0.91 0.91Adj. Flow (vph) 13 665 66 77 529 27 102 29 122 137 85 38RTOR Reduction (vph) 0 13 0 0 6 0 0 0 93 0 27 0Lane Group Flow (vph) 13 718 0 77 550 0 102 29 29 137 96 0Confl. Peds. (#/hr) 5 5 5 5 5 5 5 5Heavy Vehicles (%) 3% 5% 3% 3% 5% 3% 3% 3% 3% 3% 3% 3%Turn Type Prot Prot Prot pm+ov ProtProtected Phases 5 2 1 6 3 8 1 7 4Permitted Phases 8Actuated Green, G (s) 0.2 17.8 3.6 21.2 4.8 2.0 5.6 8.6 5.8Effective Green, g (s) 1.2 18.8 4.6 22.2 5.8 3.0 7.6 9.6 6.8Actuated g/C Ratio 0.02 0.37 0.09 0.44 0.11 0.06 0.15 0.19 0.13Clearance Time (s) 4.5 5.5 4.5 5.5 4.5 4.5 4.5 4.5 4.5Vehicle Extension (s) 1.5 1.5 1.5 1.5 2.0 2.0 1.5 2.0 2.0Lane Grp Cap (vph) 41 1250 158 1485 199 109 232 640 234v/s Ratio Prot 0.01 c0.21 c0.04 c0.16 c0.06 0.02 0.01 c0.04 c0.05v/s Ratio Perm 0.01v/c Ratio 0.32 0.57 0.49 0.37 0.51 0.27 0.13 0.21 0.41Uniform Delay, d1 24.5 12.9 22.1 9.7 21.3 22.9 18.8 17.5 20.3Progression Factor 1.00 1.00 1.00 1.00 1.00 1.00 1.00 1.00 1.00Incremental Delay, d2 1.6 0.4 0.9 0.1 0.9 0.5 0.1 0.1 0.4Delay (s) 26.1 13.3 22.9 9.8 22.2 23.4 18.9 17.6 20.7Level of Service C B C A C C B B CApproach Delay (s) 13.5 11.4 20.8 19.0Approach LOS B B C B
Intersection SummaryHCM Average Control Delay 14.5 HCM Level of Service BHCM Volume to Capacity ratio 0.61Actuated Cycle Length (s) 51.0 Sum of lost time (s) 23.0Intersection Capacity Utilization 47.9% ICU Level of Service AAnalysis Period (min) 15c Critical Lane Group

HCM Signalized Intersection Capacity Analysis1: Airport Blvd & Brickway 17/12/2010
Sonoma Airport 5:00 pm 16/12/2010 2030 PM Base Case + Project Synchro 7 - Report%user_name% Page 1
Movement EBL EBT EBR WBL WBT WBR NBL NBT NBR SBL SBT SBRLane ConfigurationsVolume (vph) 12 807 82 70 595 24 108 25 110 124 77 39Ideal Flow (vphpl) 1900 1900 1900 1900 1900 1900 1900 1900 1900 1900 1900 1900Total Lost time (s) 3.5 4.5 3.5 4.5 3.5 3.5 3.5 3.5 3.5Lane Util. Factor 1.00 0.95 1.00 0.95 1.00 1.00 1.00 0.97 1.00Frpb, ped/bikes 1.00 1.00 1.00 1.00 1.00 1.00 0.99 1.00 1.00Flpb, ped/bikes 1.00 1.00 1.00 1.00 1.00 1.00 1.00 1.00 1.00Frt 1.00 0.99 1.00 0.99 1.00 1.00 0.85 1.00 0.95Flt Protected 0.95 1.00 0.95 1.00 0.95 1.00 1.00 0.95 1.00Satd. Flow (prot) 1752 3389 1752 3418 1752 1845 1550 3400 1743Flt Permitted 0.95 1.00 0.95 1.00 0.95 1.00 1.00 0.95 1.00Satd. Flow (perm) 1752 3389 1752 3418 1752 1845 1550 3400 1743Peak-hour factor, PHF 0.91 0.91 0.91 0.91 0.91 0.91 0.91 0.91 0.91 0.91 0.91 0.91Adj. Flow (vph) 13 887 90 77 654 26 119 27 121 136 85 43RTOR Reduction (vph) 0 13 0 0 5 0 0 0 69 0 30 0Lane Group Flow (vph) 13 964 0 77 675 0 119 27 52 136 98 0Confl. Peds. (#/hr) 5 5 5 5 5 5 5 5Heavy Vehicles (%) 3% 5% 3% 3% 5% 3% 3% 3% 3% 3% 3% 3%Turn Type Prot Prot Prot pm+ov ProtProtected Phases 5 2 1 6 3 8 1 7 4Permitted Phases 8Actuated Green, G (s) 0.2 21.2 2.4 23.4 4.4 2.0 4.4 8.2 5.8Effective Green, g (s) 1.2 22.2 3.4 24.4 5.4 3.0 6.4 9.2 6.8Actuated g/C Ratio 0.02 0.42 0.06 0.46 0.10 0.06 0.12 0.17 0.13Clearance Time (s) 4.5 5.5 4.5 5.5 4.5 4.5 4.5 4.5 4.5Vehicle Extension (s) 1.5 1.5 1.5 1.5 2.0 2.0 1.5 2.0 2.0Lane Grp Cap (vph) 40 1425 113 1580 179 105 188 592 224v/s Ratio Prot 0.01 c0.28 c0.04 0.20 c0.07 0.01 0.02 0.04 c0.06v/s Ratio Perm 0.02v/c Ratio 0.33 0.68 0.68 0.43 0.66 0.26 0.27 0.23 0.44Uniform Delay, d1 25.4 12.4 24.2 9.5 22.8 23.8 21.1 18.8 21.2Progression Factor 1.00 1.00 1.00 1.00 1.00 1.00 1.00 1.00 1.00Incremental Delay, d2 1.7 1.0 12.6 0.1 7.0 0.5 0.3 0.1 0.5Delay (s) 27.1 13.4 36.8 9.6 29.8 24.3 21.4 18.8 21.7Level of Service C B D A C C C B CApproach Delay (s) 13.6 12.4 25.4 20.2Approach LOS B B C C
Intersection SummaryHCM Average Control Delay 15.3 HCM Level of Service BHCM Volume to Capacity ratio 0.59Actuated Cycle Length (s) 52.8 Sum of lost time (s) 15.0Intersection Capacity Utilization 53.2% ICU Level of Service AAnalysis Period (min) 15c Critical Lane Group

HCM Signalized Intersection Capacity Analysis1: Airport Blvd & Brickway 17/12/2010
Sonoma Airport 5:00 pm 16/12/2010 2030 AM Base Case + Project Synchro 7 - Report%user_name% Page 1
Movement EBL EBT EBR WBL WBT WBR NBL NBT NBR SBL SBT SBRLane ConfigurationsVolume (vph) 80 413 75 125 890 145 97 60 95 14 20 15Ideal Flow (vphpl) 1900 1900 1900 1900 1900 1900 1900 1900 1900 1900 1900 1900Total Lost time (s) 3.5 4.5 3.5 4.5 3.5 3.5 3.5 3.5 3.5Lane Util. Factor 1.00 0.95 1.00 0.95 1.00 1.00 1.00 0.97 1.00Frpb, ped/bikes 1.00 1.00 1.00 1.00 1.00 1.00 0.99 1.00 0.99Flpb, ped/bikes 1.00 1.00 1.00 1.00 1.00 1.00 1.00 1.00 1.00Frt 1.00 0.98 1.00 0.98 1.00 1.00 0.85 1.00 0.94Flt Protected 0.95 1.00 0.95 1.00 0.95 1.00 1.00 0.95 1.00Satd. Flow (prot) 1752 3357 1752 3364 1752 1845 1554 3400 1718Flt Permitted 0.95 1.00 0.95 1.00 0.95 1.00 1.00 0.95 1.00Satd. Flow (perm) 1752 3357 1752 3364 1752 1845 1554 3400 1718Peak-hour factor, PHF 0.91 0.91 0.91 0.91 0.91 0.91 0.91 0.91 0.91 0.91 0.91 0.91Adj. Flow (vph) 88 454 82 137 978 159 107 66 104 15 22 16RTOR Reduction (vph) 0 24 0 0 23 0 0 0 75 0 15 0Lane Group Flow (vph) 88 512 0 137 1114 0 107 66 29 15 23 0Confl. Peds. (#/hr) 5 5 5 5 5 5 5 5Heavy Vehicles (%) 3% 5% 3% 3% 5% 3% 3% 3% 3% 3% 3% 3%Turn Type Prot Prot Prot pm+ov ProtProtected Phases 5 2 1 6 3 8 1 7 4Permitted Phases 8Actuated Green, G (s) 2.5 16.5 5.2 19.2 4.0 5.9 11.1 0.3 2.2Effective Green, g (s) 3.5 17.5 6.2 20.2 5.0 6.9 13.1 1.3 3.2Actuated g/C Ratio 0.07 0.37 0.13 0.43 0.11 0.15 0.28 0.03 0.07Clearance Time (s) 4.5 5.5 4.5 5.5 4.5 4.5 4.5 4.5 4.5Vehicle Extension (s) 1.5 1.5 1.5 1.5 2.0 2.0 1.5 2.0 2.0Lane Grp Cap (vph) 131 1253 232 1449 187 271 434 94 117v/s Ratio Prot c0.05 0.15 0.08 c0.33 c0.06 0.04 0.01 0.00 c0.01v/s Ratio Perm 0.01v/c Ratio 0.67 0.41 0.59 0.77 0.57 0.24 0.07 0.16 0.20Uniform Delay, d1 21.1 10.9 19.2 11.4 19.9 17.7 12.4 22.3 20.6Progression Factor 1.00 1.00 1.00 1.00 1.00 1.00 1.00 1.00 1.00Incremental Delay, d2 10.2 0.1 2.7 2.3 2.6 0.2 0.0 0.3 0.3Delay (s) 31.3 11.0 21.8 13.6 22.5 17.9 12.4 22.6 20.9Level of Service C B C B C B B C CApproach Delay (s) 13.8 14.5 17.6 21.4Approach LOS B B B C
Intersection SummaryHCM Average Control Delay 14.9 HCM Level of Service BHCM Volume to Capacity ratio 0.60Actuated Cycle Length (s) 46.9 Sum of lost time (s) 11.5Intersection Capacity Utilization 56.4% ICU Level of Service BAnalysis Period (min) 15c Critical Lane Group

HCM Signalized Intersection Capacity Analysis55: Airport Blvd & Skylane 17/12/2010
Sonoma Airport 5:00 pm 16/12/2010 2030 PM Base Case Synchro 7 - Report%user_name% Page 1
Movement EBL EBT EBR WBL WBT WBR NBL NBT NBR SBL SBT SBRLane ConfigurationsVolume (vph) 71 272 55 35 225 336 30 91 30 217 157 79Ideal Flow (vphpl) 1900 1900 1900 1900 1900 1900 1900 1900 1900 1900 1900 1900Total Lost time (s) 3.0 3.0 3.0 3.0 3.0 3.0 3.0 3.0Lane Util. Factor 1.00 0.95 1.00 0.95 1.00 1.00 1.00 1.00Frpb, ped/bikes 1.00 1.00 1.00 0.98 1.00 1.00 1.00 0.99Flpb, ped/bikes 1.00 1.00 1.00 1.00 1.00 1.00 1.00 1.00Frt 1.00 0.97 1.00 0.91 1.00 0.96 1.00 0.95Flt Protected 0.95 1.00 0.95 1.00 0.95 1.00 0.95 1.00Satd. Flow (prot) 1752 3346 1752 3110 1752 1768 1752 1742Flt Permitted 0.95 1.00 0.95 1.00 0.95 1.00 0.95 1.00Satd. Flow (perm) 1752 3346 1752 3110 1752 1768 1752 1742Peak-hour factor, PHF 0.91 0.91 0.91 0.91 0.91 0.91 0.91 0.91 0.91 0.91 0.91 0.91Adj. Flow (vph) 78 299 60 38 247 369 33 100 33 238 173 87RTOR Reduction (vph) 0 27 0 0 299 0 0 19 0 0 27 0Lane Group Flow (vph) 78 332 0 38 317 0 33 114 0 238 233 0Confl. Peds. (#/hr) 5 5 5 5 5 5 5 5Heavy Vehicles (%) 3% 5% 3% 3% 5% 3% 3% 3% 3% 3% 3% 3%Turn Type Prot Prot Prot ProtProtected Phases 7 4 3 8 5 2 1 6Permitted PhasesActuated Green, G (s) 3.0 12.2 1.5 10.7 1.5 20.7 10.9 30.1Effective Green, g (s) 4.0 13.2 2.5 11.7 2.5 21.7 11.9 31.1Actuated g/C Ratio 0.07 0.22 0.04 0.19 0.04 0.35 0.19 0.51Clearance Time (s) 4.0 4.0 4.0 4.0 4.0 4.0 4.0 4.0Vehicle Extension (s) 3.0 3.0 3.0 3.0 3.0 3.0 3.0 3.0Lane Grp Cap (vph) 114 721 71 594 71 626 340 884v/s Ratio Prot c0.04 0.10 0.02 c0.10 0.02 0.06 c0.14 c0.13v/s Ratio Permv/c Ratio 0.68 0.46 0.54 0.53 0.46 0.18 0.70 0.26Uniform Delay, d1 28.0 21.0 28.8 22.3 28.7 13.7 23.0 8.6Progression Factor 1.00 1.00 1.00 1.00 1.00 1.00 1.00 1.00Incremental Delay, d2 15.7 0.5 7.6 0.9 4.7 0.6 6.2 0.7Delay (s) 43.7 21.4 36.4 23.3 33.5 14.3 29.2 9.3Level of Service D C D C C B C AApproach Delay (s) 25.4 24.0 18.1 18.8Approach LOS C C B B
Intersection SummaryHCM Average Control Delay 22.3 HCM Level of Service CHCM Volume to Capacity ratio 0.44Actuated Cycle Length (s) 61.3 Sum of lost time (s) 9.0Intersection Capacity Utilization 60.0% ICU Level of Service BAnalysis Period (min) 15c Critical Lane Group

HCM Signalized Intersection Capacity Analysis55: Airport Blvd & Skylane 17/12/2010
Sonoma Airport 5:00 pm 16/12/2010 2030 PM Base Case + Project Synchro 7 - Report%user_name% Page 1
Movement EBL EBT EBR WBL WBT WBR NBL NBT NBR SBL SBT SBRLane ConfigurationsVolume (vph) 117 470 75 50 353 335 39 97 55 217 157 103Ideal Flow (vphpl) 1900 1900 1900 1900 1900 1900 1900 1900 1900 1900 1900 1900Total Lost time (s) 3.0 3.0 3.0 3.0 3.0 3.0 3.0 3.0Lane Util. Factor 1.00 0.95 1.00 0.95 1.00 1.00 1.00 1.00Frpb, ped/bikes 1.00 1.00 1.00 0.99 1.00 0.99 1.00 0.99Flpb, ped/bikes 1.00 1.00 1.00 1.00 1.00 1.00 1.00 1.00Frt 1.00 0.98 1.00 0.93 1.00 0.95 1.00 0.94Flt Protected 0.95 1.00 0.95 1.00 0.95 1.00 0.95 1.00Satd. Flow (prot) 1752 3363 1752 3171 1752 1734 1752 1723Flt Permitted 0.95 1.00 0.95 1.00 0.95 1.00 0.95 1.00Satd. Flow (perm) 1752 3363 1752 3171 1752 1734 1752 1723Peak-hour factor, PHF 0.91 0.91 0.91 0.91 0.91 0.91 0.91 0.91 0.91 0.91 0.91 0.91Adj. Flow (vph) 129 516 82 55 388 368 43 107 60 238 173 113RTOR Reduction (vph) 0 21 0 0 283 0 0 32 0 0 35 0Lane Group Flow (vph) 129 577 0 55 473 0 43 135 0 238 251 0Confl. Peds. (#/hr) 5 5 5 5 5 5 5 5Heavy Vehicles (%) 3% 5% 3% 3% 5% 3% 3% 3% 3% 3% 3% 3%Turn Type Prot Prot Prot ProtProtected Phases 7 4 3 8 5 2 1 6Permitted PhasesActuated Green, G (s) 4.6 13.2 2.3 10.9 1.5 20.5 9.7 28.7Effective Green, g (s) 5.6 14.2 3.3 11.9 2.5 21.5 10.7 29.7Actuated g/C Ratio 0.09 0.23 0.05 0.19 0.04 0.35 0.17 0.48Clearance Time (s) 4.0 4.0 4.0 4.0 4.0 4.0 4.0 4.0Vehicle Extension (s) 3.0 3.0 3.0 3.0 3.0 3.0 3.0 3.0Lane Grp Cap (vph) 159 774 94 612 71 604 304 829v/s Ratio Prot c0.07 c0.17 0.03 0.15 0.02 0.08 c0.14 c0.15v/s Ratio Permv/c Ratio 0.81 0.75 0.59 0.77 0.61 0.22 0.78 0.30Uniform Delay, d1 27.5 22.1 28.5 23.6 29.1 14.2 24.4 9.7Progression Factor 1.00 1.00 1.00 1.00 1.00 1.00 1.00 1.00Incremental Delay, d2 25.9 3.9 9.0 6.0 13.7 0.9 12.4 0.9Delay (s) 53.5 26.0 37.5 29.6 42.8 15.1 36.7 10.7Level of Service D C D C D B D BApproach Delay (s) 30.9 30.2 20.7 22.5Approach LOS C C C C
Intersection SummaryHCM Average Control Delay 27.8 HCM Level of Service CHCM Volume to Capacity ratio 0.53Actuated Cycle Length (s) 61.7 Sum of lost time (s) 6.0Intersection Capacity Utilization 65.9% ICU Level of Service CAnalysis Period (min) 15c Critical Lane Group

HCM Signalized Intersection Capacity Analysis55: Airport Blvd & Skylane 17/12/2010
Sonoma Airport 5:00 pm 16/12/2010 2030 AM Base Case + Project Synchro 7 - Report%user_name% Page 1
Movement EBL EBT EBR WBL WBT WBR NBL NBT NBR SBL SBT SBRLane ConfigurationsVolume (vph) 85 212 37 62 355 385 53 90 70 324 109 119Ideal Flow (vphpl) 1900 1900 1900 1900 1900 1900 1900 1900 1900 1900 1900 1900Total Lost time (s) 3.0 3.0 3.0 3.0 3.0 3.0 3.0 3.0Lane Util. Factor 1.00 0.95 1.00 0.95 1.00 1.00 1.00 1.00Frpb, ped/bikes 1.00 1.00 1.00 0.98 1.00 0.99 1.00 0.99Flpb, ped/bikes 1.00 1.00 1.00 1.00 1.00 1.00 1.00 1.00Frt 1.00 0.98 1.00 0.92 1.00 0.93 1.00 0.92Flt Protected 0.95 1.00 0.95 1.00 0.95 1.00 0.95 1.00Satd. Flow (prot) 1752 3356 1752 3153 1752 1710 1752 1685Flt Permitted 0.95 1.00 0.95 1.00 0.95 1.00 0.95 1.00Satd. Flow (perm) 1752 3356 1752 3153 1752 1710 1752 1685Peak-hour factor, PHF 0.91 0.91 0.91 0.91 0.91 0.91 0.91 0.91 0.91 0.91 0.91 0.91Adj. Flow (vph) 93 233 41 68 390 423 58 99 77 356 120 131RTOR Reduction (vph) 0 23 0 0 322 0 0 45 0 0 60 0Lane Group Flow (vph) 93 251 0 68 491 0 58 131 0 356 191 0Confl. Peds. (#/hr) 5 5 5 5 5 5 5 5Heavy Vehicles (%) 3% 5% 3% 3% 5% 3% 3% 3% 3% 3% 3% 3%Turn Type Prot Prot Prot ProtProtected Phases 7 4 3 8 5 2 1 6Permitted PhasesActuated Green, G (s) 3.1 10.9 2.9 10.7 2.9 18.8 12.8 28.7Effective Green, g (s) 4.1 11.9 3.9 11.7 3.9 19.8 13.8 29.7Actuated g/C Ratio 0.07 0.19 0.06 0.19 0.06 0.32 0.22 0.48Clearance Time (s) 4.0 4.0 4.0 4.0 4.0 4.0 4.0 4.0Vehicle Extension (s) 3.0 3.0 3.0 3.0 3.0 3.0 3.0 3.0Lane Grp Cap (vph) 117 650 111 601 111 551 394 815v/s Ratio Prot c0.05 0.07 0.04 c0.16 0.03 0.08 c0.20 c0.11v/s Ratio Permv/c Ratio 0.79 0.39 0.61 0.82 0.52 0.24 0.90 0.23Uniform Delay, d1 28.2 21.6 28.0 23.8 27.8 15.3 23.2 9.2Progression Factor 1.00 1.00 1.00 1.00 1.00 1.00 1.00 1.00Incremental Delay, d2 30.0 0.4 9.6 8.4 4.4 1.0 23.4 0.7Delay (s) 58.2 21.9 37.6 32.2 32.2 16.3 46.5 9.9Level of Service E C D C C B D AApproach Delay (s) 31.1 32.7 20.2 31.4Approach LOS C C C C
Intersection SummaryHCM Average Control Delay 30.6 HCM Level of Service CHCM Volume to Capacity ratio 0.58Actuated Cycle Length (s) 61.4 Sum of lost time (s) 9.0Intersection Capacity Utilization 71.8% ICU Level of Service CAnalysis Period (min) 15c Critical Lane Group

HCM Signalized Intersection Capacity Analysis7: Airport Blvd & US 101 NB Ramps 17/12/2010
Sonoma Airport 5:00 pm 16/12/2010 2030 PM Base Case Synchro 7 - Report%user_name% Page 1
Movement EBL EBT EBR WBL WBT WBR NBL NBT NBR SBL SBT SBRLane ConfigurationsVolume (vph) 240 555 0 0 500 575 360 0 330 0 0 0Ideal Flow (vphpl) 1900 1900 1900 1900 1900 1900 1900 1900 1900 1900 1900 1900Total Lost time (s) 3.0 4.5 4.5 4.5 3.5 3.5 3.5Lane Util. Factor 1.00 0.95 0.95 1.00 0.95 0.95 1.00Frt 1.00 1.00 1.00 0.85 1.00 1.00 0.85Flt Protected 0.95 1.00 1.00 1.00 0.95 0.95 1.00Satd. Flow (prot) 1719 3438 3438 1538 1633 1633 1568Flt Permitted 0.95 1.00 1.00 1.00 0.95 0.95 1.00Satd. Flow (perm) 1719 3438 3438 1538 1633 1633 1568Peak-hour factor, PHF 0.93 0.93 0.93 0.93 0.93 0.93 0.93 0.93 0.93 0.93 0.93 0.93Adj. Flow (vph) 258 597 0 0 538 618 387 0 355 0 0 0RTOR Reduction (vph) 0 0 0 0 0 373 0 0 261 0 0 0Lane Group Flow (vph) 258 597 0 0 538 245 193 194 94 0 0 0Heavy Vehicles (%) 5% 5% 2% 2% 5% 5% 5% 2% 3% 2% 2% 2%Turn Type Prot Perm Split PermProtected Phases 5 2 6 8 8Permitted Phases 6 8Actuated Green, G (s) 12.0 38.8 22.8 22.8 11.2 11.2 11.2Effective Green, g (s) 13.0 39.8 23.8 23.8 12.2 12.2 12.2Actuated g/C Ratio 0.22 0.66 0.40 0.40 0.20 0.20 0.20Clearance Time (s) 4.0 5.5 5.5 5.5 4.5 4.5 4.5Vehicle Extension (s) 3.0 3.0 3.0 3.0 3.0 3.0 3.0Lane Grp Cap (vph) 372 2281 1364 610 332 332 319v/s Ratio Prot c0.15 0.17 0.16 0.12 c0.12v/s Ratio Perm c0.16 0.06v/c Ratio 0.69 0.26 0.39 0.40 0.58 0.58 0.30Uniform Delay, d1 21.7 4.1 12.9 13.0 21.6 21.6 20.3Progression Factor 1.09 0.69 1.00 1.00 1.00 1.00 1.00Incremental Delay, d2 5.4 0.3 0.9 2.0 2.6 2.6 0.5Delay (s) 29.1 3.1 13.8 15.0 24.2 24.2 20.8Level of Service C A B B C C CApproach Delay (s) 10.9 14.4 22.6 0.0Approach LOS B B C A
Intersection SummaryHCM Average Control Delay 15.5 HCM Level of Service BHCM Volume to Capacity ratio 0.52Actuated Cycle Length (s) 60.0 Sum of lost time (s) 11.0Intersection Capacity Utilization 69.3% ICU Level of Service CAnalysis Period (min) 15c Critical Lane Group

HCM Signalized Intersection Capacity Analysis7: Airport Blvd & US 101 NB Ramps 17/12/2010
Sonoma Airport 5:00 pm 16/12/2010 2030 PM Base Case + Project Synchro 7 - Report%user_name% Page 1
Movement EBL EBT EBR WBL WBT WBR NBL NBT NBR SBL SBT SBRLane ConfigurationsVolume (vph) 245 581 0 0 512 575 431 0 326 0 0 0Ideal Flow (vphpl) 1900 1900 1900 1900 1900 1900 1900 1900 1900 1900 1900 1900Total Lost time (s) 3.0 4.5 4.5 4.5 3.5 3.5 3.5Lane Util. Factor 1.00 0.95 0.95 1.00 0.95 0.95 1.00Frt 1.00 1.00 1.00 0.85 1.00 1.00 0.85Flt Protected 0.95 1.00 1.00 1.00 0.95 0.95 1.00Satd. Flow (prot) 1719 3438 3438 1538 1633 1633 1568Flt Permitted 0.95 1.00 1.00 1.00 0.95 0.95 1.00Satd. Flow (perm) 1719 3438 3438 1538 1633 1633 1568Peak-hour factor, PHF 0.93 0.93 0.93 0.93 0.93 0.93 0.93 0.93 0.93 0.93 0.93 0.93Adj. Flow (vph) 263 625 0 0 551 618 463 0 351 0 0 0RTOR Reduction (vph) 0 0 0 0 0 384 0 0 232 0 0 0Lane Group Flow (vph) 263 625 0 0 551 234 231 232 119 0 0 0Heavy Vehicles (%) 5% 5% 2% 2% 5% 5% 5% 2% 3% 2% 2% 2%Turn Type Prot Perm Split PermProtected Phases 5 2 6 8 8Permitted Phases 6 8Actuated Green, G (s) 12.1 37.8 21.7 21.7 12.2 12.2 12.2Effective Green, g (s) 13.1 38.8 22.7 22.7 13.2 13.2 13.2Actuated g/C Ratio 0.22 0.65 0.38 0.38 0.22 0.22 0.22Clearance Time (s) 4.0 5.5 5.5 5.5 4.5 4.5 4.5Vehicle Extension (s) 3.0 3.0 3.0 3.0 3.0 3.0 3.0Lane Grp Cap (vph) 375 2223 1301 582 359 359 345v/s Ratio Prot c0.15 0.18 c0.16 0.14 c0.14v/s Ratio Perm 0.15 0.08v/c Ratio 0.70 0.28 0.42 0.40 0.64 0.65 0.34Uniform Delay, d1 21.6 4.6 13.8 13.7 21.3 21.3 19.7Progression Factor 1.09 0.70 1.00 1.00 1.00 1.00 1.00Incremental Delay, d2 5.7 0.3 1.0 2.1 3.9 4.0 0.6Delay (s) 29.3 3.5 14.8 15.7 25.2 25.2 20.3Level of Service C A B B C C CApproach Delay (s) 11.2 15.3 23.1 0.0Approach LOS B B C A
Intersection SummaryHCM Average Control Delay 16.2 HCM Level of Service BHCM Volume to Capacity ratio 0.56Actuated Cycle Length (s) 60.0 Sum of lost time (s) 11.0Intersection Capacity Utilization 71.5% ICU Level of Service CAnalysis Period (min) 15c Critical Lane Group

HCM Signalized Intersection Capacity Analysis7: Airport Blvd & US 101 NB Ramps 17/12/2010
Sonoma Airport 5:00 pm 16/12/2010 2030 AM Base Case + Project Synchro 7 - Report%user_name% Page 1
Movement EBL EBT EBR WBL WBT WBR NBL NBT NBR SBL SBT SBRLane ConfigurationsVolume (vph) 125 315 0 0 962 420 1112 0 164 0 0 0Ideal Flow (vphpl) 1900 1900 1900 1900 1900 1900 1900 1900 1900 1900 1900 1900Total Lost time (s) 3.0 4.5 4.5 4.5 3.5 3.5 3.5Lane Util. Factor 1.00 0.95 0.95 1.00 0.95 0.95 1.00Frt 1.00 1.00 1.00 0.85 1.00 1.00 0.85Flt Protected 0.95 1.00 1.00 1.00 0.95 0.95 1.00Satd. Flow (prot) 1719 3438 3438 1538 1633 1633 1568Flt Permitted 0.95 1.00 1.00 1.00 0.95 0.95 1.00Satd. Flow (perm) 1719 3438 3438 1538 1633 1633 1568Peak-hour factor, PHF 0.93 0.93 0.91 0.91 0.93 0.93 0.93 0.91 0.93 0.91 0.91 0.91Adj. Flow (vph) 134 339 0 0 1034 452 1196 0 176 0 0 0RTOR Reduction (vph) 0 0 0 0 0 298 0 0 107 0 0 0Lane Group Flow (vph) 134 339 0 0 1034 154 598 598 69 0 0 0Heavy Vehicles (%) 5% 5% 2% 2% 5% 5% 5% 2% 3% 2% 2% 2%Turn Type Prot Perm Split PermProtected Phases 5 2 6 8 8Permitted Phases 6 8Actuated Green, G (s) 4.0 27.5 19.5 19.5 22.5 22.5 22.5Effective Green, g (s) 5.0 28.5 20.5 20.5 23.5 23.5 23.5Actuated g/C Ratio 0.08 0.48 0.34 0.34 0.39 0.39 0.39Clearance Time (s) 4.0 5.5 5.5 5.5 4.5 4.5 4.5Vehicle Extension (s) 3.0 3.0 3.0 3.0 3.0 3.0 3.0Lane Grp Cap (vph) 143 1633 1175 525 640 640 614v/s Ratio Prot c0.08 0.10 c0.30 c0.37 0.37v/s Ratio Perm 0.10 0.04v/c Ratio 0.94 0.21 0.88 0.29 0.93 0.93 0.11Uniform Delay, d1 27.3 9.2 18.6 14.5 17.5 17.5 11.6Progression Factor 0.94 0.57 1.00 1.00 1.00 1.00 1.00Incremental Delay, d2 55.8 0.3 9.5 1.4 20.8 20.8 0.1Delay (s) 81.5 5.5 28.1 15.9 38.4 38.4 11.7Level of Service F A C B D D BApproach Delay (s) 27.0 24.4 34.9 0.0Approach LOS C C C A
Intersection SummaryHCM Average Control Delay 29.1 HCM Level of Service CHCM Volume to Capacity ratio 0.91Actuated Cycle Length (s) 60.0 Sum of lost time (s) 11.0Intersection Capacity Utilization 74.7% ICU Level of Service DAnalysis Period (min) 15c Critical Lane Group

HCM Signalized Intersection Capacity Analysis3: Airport Blvd & US 101 SB Off-Ramp 17/12/2010
Sonoma Airport 5:00 pm 16/12/2010 2030 PM Base Case Synchro 7 - Report%user_name% Page 1
Movement EBL EBT EBR WBL WBT WBR SBL2 SBL SBR NWL NWRLane ConfigurationsVolume (vph) 0 640 900 0 580 280 155 0 235 0 0Ideal Flow (vphpl) 1900 1900 1900 1900 1900 1900 1900 1900 1900 1900 1900Total Lost time (s) 3.5 3.0 3.5 3.5 3.5 3.5Lane Util. Factor 0.95 1.00 0.95 1.00 0.97 0.88Frt 1.00 0.85 1.00 0.85 1.00 0.85Flt Protected 1.00 1.00 1.00 1.00 0.95 1.00Satd. Flow (prot) 3438 1568 3438 1583 3400 2760Flt Permitted 1.00 1.00 1.00 1.00 0.95 1.00Satd. Flow (perm) 3438 1568 3438 1583 3400 2760Peak-hour factor, PHF 0.92 0.92 0.92 0.92 0.92 0.92 0.92 0.92 0.92 0.91 0.91Adj. Flow (vph) 0 696 978 0 630 304 168 0 255 0 0RTOR Reduction (vph) 0 0 0 0 0 84 0 0 215 0 0Lane Group Flow (vph) 0 696 978 0 630 220 168 0 40 0 0Heavy Vehicles (%) 3% 5% 3% 2% 5% 2% 3% 2% 3% 2% 2%Turn Type Free Perm Prot customProtected Phases 2 6 4Permitted Phases Free 6 4Actuated Green, G (s) 42.5 60.0 42.5 42.5 8.5 8.5Effective Green, g (s) 43.5 60.0 43.5 43.5 9.5 9.5Actuated g/C Ratio 0.72 1.00 0.72 0.72 0.16 0.16Clearance Time (s) 4.5 4.5 4.5 4.5 4.5Vehicle Extension (s) 3.0 3.0 3.0 3.0 3.0Lane Grp Cap (vph) 2493 1568 2493 1148 538 437v/s Ratio Prot 0.20 0.18 0.05v/s Ratio Perm c0.62 0.14 0.01v/c Ratio 0.28 0.62 0.25 0.19 0.31 0.09Uniform Delay, d1 2.8 0.0 2.8 2.6 22.4 21.6Progression Factor 1.00 1.00 0.14 4.44 1.00 1.00Incremental Delay, d2 0.3 1.9 0.0 0.1 0.3 0.1Delay (s) 3.1 1.9 0.4 11.8 22.7 21.7Level of Service A A A B C CApproach Delay (s) 2.4 4.1 22.1 0.0Approach LOS A A C A
Intersection SummaryHCM Average Control Delay 5.7 HCM Level of Service AHCM Volume to Capacity ratio 0.62Actuated Cycle Length (s) 60.0 Sum of lost time (s) 0.0Intersection Capacity Utilization 30.9% ICU Level of Service AAnalysis Period (min) 15c Critical Lane Group

HCM Signalized Intersection Capacity Analysis3: Airport Blvd & US 101 SB Off-Ramp 17/12/2010
Sonoma Airport 5:00 pm 16/12/2010 2030 PM Base Case + Project Synchro 7 - Report%user_name% Page 1
Movement EBL EBT EBR WBL WBT WBR SBL2 SBL SBR NWL NWRLane ConfigurationsVolume (vph) 0 671 1064 0 674 269 155 0 251 0 0Ideal Flow (vphpl) 1900 1900 1900 1900 1900 1900 1900 1900 1900 1900 1900Total Lost time (s) 3.5 3.0 3.5 3.5 3.5 3.5Lane Util. Factor 0.95 1.00 0.95 1.00 0.97 0.88Frt 1.00 0.85 1.00 0.85 1.00 0.85Flt Protected 1.00 1.00 1.00 1.00 0.95 1.00Satd. Flow (prot) 3438 1568 3438 1583 3400 2760Flt Permitted 1.00 1.00 1.00 1.00 0.95 1.00Satd. Flow (perm) 3438 1568 3438 1583 3400 2760Peak-hour factor, PHF 0.92 0.92 0.92 0.92 0.92 0.92 0.92 0.92 0.92 0.91 0.91Adj. Flow (vph) 0 729 1157 0 733 292 168 0 273 0 0RTOR Reduction (vph) 0 0 0 0 0 80 0 0 230 0 0Lane Group Flow (vph) 0 729 1157 0 733 212 168 0 43 0 0Heavy Vehicles (%) 3% 5% 3% 2% 5% 2% 3% 2% 3% 2% 2%Turn Type Free Perm Prot customProtected Phases 2 6 4Permitted Phases Free 6 4Actuated Green, G (s) 42.5 60.0 42.5 42.5 8.5 8.5Effective Green, g (s) 43.5 60.0 43.5 43.5 9.5 9.5Actuated g/C Ratio 0.72 1.00 0.72 0.72 0.16 0.16Clearance Time (s) 4.5 4.5 4.5 4.5 4.5Vehicle Extension (s) 3.0 3.0 3.0 3.0 3.0Lane Grp Cap (vph) 2493 1568 2493 1148 538 437v/s Ratio Prot 0.21 0.21 0.05v/s Ratio Perm c0.74 0.13 0.02v/c Ratio 0.29 0.74 0.29 0.18 0.31 0.10Uniform Delay, d1 2.9 0.0 2.9 2.6 22.4 21.6Progression Factor 1.00 1.00 0.14 4.03 1.00 1.00Incremental Delay, d2 0.3 3.1 0.1 0.1 0.3 0.1Delay (s) 3.2 3.1 0.5 10.6 22.7 21.7Level of Service A A A B C CApproach Delay (s) 3.2 3.4 22.1 0.0Approach LOS A A C A
Intersection SummaryHCM Average Control Delay 5.7 HCM Level of Service AHCM Volume to Capacity ratio 0.74Actuated Cycle Length (s) 60.0 Sum of lost time (s) 0.0Intersection Capacity Utilization 34.1% ICU Level of Service AAnalysis Period (min) 15c Critical Lane Group

HCM Signalized Intersection Capacity Analysis3: Airport Blvd & US 101 SB Off-Ramp 17/12/2010
Sonoma Airport 5:00 pm 16/12/2010 2030 AM Base Case + Project Synchro 7 - Report%user_name% Page 1
Movement EBL EBT EBR WBL WBT WBR SBL2 SBL SBR NWL NWRLane ConfigurationsVolume (vph) 0 310 547 0 1653 421 130 0 412 0 0Ideal Flow (vphpl) 1900 1900 1900 1900 1900 1900 1900 1900 1900 1900 1900Total Lost time (s) 3.5 3.0 3.5 3.5 3.5 3.5Lane Util. Factor 0.95 1.00 0.95 1.00 0.97 0.88Frt 1.00 0.85 1.00 0.85 1.00 0.85Flt Protected 1.00 1.00 1.00 1.00 0.95 1.00Satd. Flow (prot) 3438 1568 3438 1583 3400 2760Flt Permitted 1.00 1.00 1.00 1.00 0.95 1.00Satd. Flow (perm) 3438 1568 3438 1583 3400 2760Peak-hour factor, PHF 0.91 0.91 0.91 0.91 0.91 0.91 0.91 0.91 0.91 0.91 0.91Adj. Flow (vph) 0 341 601 0 1816 463 143 0 453 0 0RTOR Reduction (vph) 0 0 0 0 0 154 0 0 36 0 0Lane Group Flow (vph) 0 341 601 0 1816 309 143 0 417 0 0Heavy Vehicles (%) 3% 5% 3% 2% 5% 2% 3% 2% 3% 2% 2%Turn Type Free Perm Prot customProtected Phases 2 6 4Permitted Phases Free 6 4Actuated Green, G (s) 39.1 60.0 39.1 39.1 11.9 11.9Effective Green, g (s) 40.1 60.0 40.1 40.1 12.9 12.9Actuated g/C Ratio 0.67 1.00 0.67 0.67 0.22 0.22Clearance Time (s) 4.5 4.5 4.5 4.5 4.5Vehicle Extension (s) 3.0 3.0 3.0 3.0 3.0Lane Grp Cap (vph) 2298 1568 2298 1058 731 593v/s Ratio Prot 0.10 c0.53 0.04v/s Ratio Perm 0.38 0.20 c0.15v/c Ratio 0.15 0.38 0.79 0.29 0.20 0.70Uniform Delay, d1 3.7 0.0 7.0 4.1 19.3 21.8Progression Factor 1.00 1.00 0.32 9.29 1.00 1.00Incremental Delay, d2 0.1 0.7 0.8 0.1 0.1 3.8Delay (s) 3.8 0.7 3.1 38.2 19.4 25.6Level of Service A A A D B CApproach Delay (s) 1.8 10.2 24.1 0.0Approach LOS A B C A
Intersection SummaryHCM Average Control Delay 10.3 HCM Level of Service BHCM Volume to Capacity ratio 0.77Actuated Cycle Length (s) 60.0 Sum of lost time (s) 7.0Intersection Capacity Utilization 66.8% ICU Level of Service CAnalysis Period (min) 15c Critical Lane Group

HCM Unsignalized Intersection Capacity Analysis47: River Rd & Slusser 13/10/2011
Sonoma Airport 5:00 pm 16/12/2010 Existing + 2030 Project Increment Synchro 7 - Report%user_name% Page 1
Movement EBL EBT WBT WBR SBL SBRLane ConfigurationsVolume (veh/h) 129 341 216 66 71 30Sign Control Free Free StopGrade 0% 0% 0%Peak Hour Factor 0.91 0.91 0.91 0.91 0.91 0.91Hourly flow rate (vph) 142 375 237 73 78 33PedestriansLane Width (ft)Walking Speed (ft/s)Percent BlockageRight turn flare (veh)Median type None NoneMedian storage veh)Upstream signal (ft)pX, platoon unblockedvC, conflicting volume 310 932 274vC1, stage 1 conf volvC2, stage 2 conf volvCu, unblocked vol 310 932 274tC, single (s) 4.1 6.4 6.2tC, 2 stage (s)tF (s) 2.2 3.5 3.3p0 queue free % 89 70 96cM capacity (veh/h) 1234 259 758
Direction, Lane # EB 1 EB 2 WB 1 SB 1Volume Total 142 375 310 111Volume Left 142 0 0 78Volume Right 0 0 73 33cSH 1234 1700 1700 322Volume to Capacity 0.11 0.22 0.18 0.35Queue Length 95th (ft) 10 0 0 37Control Delay (s) 8.3 0.0 0.0 22.0Lane LOS A CApproach Delay (s) 2.3 0.0 22.0Approach LOS C
Intersection SummaryAverage Delay 3.9Intersection Capacity Utilization 38.3% ICU Level of Service AAnalysis Period (min) 15

HCM Unsignalized Intersection Capacity Analysis47: River Rd & Slusser 13/10/2011
Sonoma Airport 5:00 pm 16/12/2010 PM Existing + 2030 Project Synchro 7 - Report%user_name% Page 1
Movement EBL EBT WBT WBR SBL SBRLane ConfigurationsVolume (veh/h) 46 330 348 58 143 113Sign Control Free Free StopGrade 0% 0% 0%Peak Hour Factor 0.91 0.91 0.91 0.91 0.91 0.91Hourly flow rate (vph) 51 363 382 64 157 124PedestriansLane Width (ft)Walking Speed (ft/s)Percent BlockageRight turn flare (veh)Median type None NoneMedian storage veh)Upstream signal (ft)pX, platoon unblockedvC, conflicting volume 446 878 414vC1, stage 1 conf volvC2, stage 2 conf volvCu, unblocked vol 446 878 414tC, single (s) 4.1 6.4 6.2tC, 2 stage (s)tF (s) 2.2 3.5 3.3p0 queue free % 95 48 80cM capacity (veh/h) 1098 300 632
Direction, Lane # EB 1 EB 2 WB 1 SB 1Volume Total 51 363 446 281Volume Left 51 0 0 157Volume Right 0 0 64 124cSH 1098 1700 1700 391Volume to Capacity 0.05 0.21 0.26 0.72Queue Length 95th (ft) 4 0 0 138Control Delay (s) 8.4 0.0 0.0 34.6Lane LOS A DApproach Delay (s) 1.0 0.0 34.6Approach LOS D
Intersection SummaryAverage Delay 8.9Intersection Capacity Utilization 50.0% ICU Level of Service AAnalysis Period (min) 15

HCM Unsignalized Intersection Capacity Analysis6: River Rd & Brickway Blvd Extn. 13/10/2011
Sonoma Airport 5:00 pm 16/12/2010 Existing + 2030 Project Increment Synchro 7 - Report%user_name% Page 1
Movement EBL EBT EBR WBL WBT WBR NBL NBT NBR SBL SBT SBRLane ConfigurationsVolume (veh/h) 135 335 1 18 275 225 1 10 35 47 5 25Sign Control Free Free Stop StopGrade 0% 0% 0% 0%Peak Hour Factor 0.91 0.91 0.91 0.91 0.91 0.91 0.91 0.91 0.91 0.91 0.91 0.91Hourly flow rate (vph) 148 368 1 20 302 247 1 11 38 52 5 27PedestriansLane Width (ft)Walking Speed (ft/s)Percent BlockageRight turn flare (veh)Median type None NoneMedian storage veh)Upstream signal (ft)pX, platoon unblockedvC, conflicting volume 549 369 1037 1254 369 1174 1131 426vC1, stage 1 conf volvC2, stage 2 conf volvCu, unblocked vol 549 369 1037 1254 369 1174 1131 426tC, single (s) 4.1 4.1 7.1 6.5 6.2 7.1 6.5 6.2tC, 2 stage (s)tF (s) 2.2 2.2 3.5 4.0 3.3 3.5 4.0 3.3p0 queue free % 85 98 99 92 94 60 97 96cM capacity (veh/h) 1005 1173 169 142 670 129 168 622
Direction, Lane # EB 1 EB 2 WB 1 WB 2 NB 1 SB 1Volume Total 148 369 20 549 51 85Volume Left 148 0 20 0 1 52Volume Right 0 1 0 247 38 27cSH 1005 1700 1173 1700 358 178Volume to Capacity 0.15 0.22 0.02 0.32 0.14 0.48Queue Length 95th (ft) 13 0 1 0 12 57Control Delay (s) 9.2 0.0 8.1 0.0 16.7 42.4Lane LOS A A C EApproach Delay (s) 2.6 0.3 16.7 42.4Approach LOS C E
Intersection SummaryAverage Delay 4.9Intersection Capacity Utilization 56.8% ICU Level of Service BAnalysis Period (min) 15

HCM Unsignalized Intersection Capacity Analysis6: River Rd & Brickway Blvd Extn. 13/10/2011
Sonoma Airport 5:00 pm 16/12/2010 PM Existing + 2030 Project Synchro 7 - Report%user_name% Page 1
Movement EBL EBT EBR WBL WBT WBR NBL NBT NBR SBL SBT SBRLane ConfigurationsVolume (veh/h) 31 472 0 23 461 42 0 4 10 270 13 113Sign Control Free Free Stop StopGrade 0% 0% 0% 0%Peak Hour Factor 0.91 0.91 0.91 0.91 0.91 0.91 0.91 0.91 0.91 0.91 0.91 0.91Hourly flow rate (vph) 34 519 0 25 507 46 0 4 11 297 14 124PedestriansLane Width (ft)Walking Speed (ft/s)Percent BlockageRight turn flare (veh)Median type None NoneMedian storage veh)Upstream signal (ft)pX, platoon unblockedvC, conflicting volume 553 519 1275 1190 519 1180 1167 530vC1, stage 1 conf volvC2, stage 2 conf volvCu, unblocked vol 553 519 1275 1190 519 1180 1167 530tC, single (s) 4.1 4.1 7.1 6.5 6.2 7.1 6.5 6.2tC, 2 stage (s)tF (s) 2.2 2.2 3.5 4.0 3.3 3.5 4.0 3.3p0 queue free % 97 98 100 97 98 0 92 77cM capacity (veh/h) 1002 1032 98 174 551 151 180 543
Direction, Lane # EB 1 EB 2 WB 1 WB 2 NB 1 SB 1Volume Total 34 519 25 553 15 435Volume Left 34 0 25 0 0 297Volume Right 0 0 0 46 11 124cSH 1002 1700 1032 1700 341 192Volume to Capacity 0.03 0.31 0.02 0.33 0.05 2.27Queue Length 95th (ft) 3 0 2 0 4 876Control Delay (s) 8.7 0.0 8.6 0.0 16.1 625.8Lane LOS A A C FApproach Delay (s) 0.5 0.4 16.1 625.8Approach LOS C F
Intersection SummaryAverage Delay 172.7Intersection Capacity Utilization 62.7% ICU Level of Service BAnalysis Period (min) 15

MITIG8 - PM Peak hour Fri Dec 17, 2010 16:12:44 Page 1-1 -------------------------------------------------------------------------------- 2030 Base Case CEQA -------------------------------------------------------------------------------- Level Of Service Computation Report FHWA Roundabout Method (Base Volume Alternative) ********************************************************************************Intersection #1 River Rd/Brickway ********************************************************************************Average Delay (sec/veh): 7.1 Level Of Service: A********************************************************************************Approach: North Bound South Bound East Bound West Bound Movement: L - T - R L - T - R L - T - R L - T - R ------------|---------------||---------------||---------------||---------------|Control: Yield Sign Yield Sign Yield Sign Yield Sign Lanes: 1 1 1 2 ------------|---------------||---------------||---------------||---------------|Volume Module:Base Vol: 1 5 11 297 14 153 49 495 1 26 480 80 Growth Adj: 1.00 1.00 1.00 1.00 1.00 1.00 1.00 1.00 1.00 1.00 1.00 1.00 Initial Bse: 1 5 11 297 14 153 49 495 1 26 480 80 User Adj: 1.00 1.00 1.00 1.00 1.00 1.00 1.00 1.00 1.00 1.00 1.00 1.00 PHF Adj: 0.90 0.90 0.90 0.90 0.90 0.90 0.90 0.90 0.90 0.90 0.90 0.90 PHF Volume: 1 6 12 330 16 170 54 550 1 29 533 89 Reduct Vol: 0 0 0 0 0 0 0 0 0 0 0 0 Reduced Vol: 1 6 12 330 16 170 54 550 1 29 533 89 PCE Adj: 1.00 1.00 1.00 1.00 1.00 1.00 1.00 1.00 1.00 1.00 1.00 1.00 MLF Adj: 1.00 1.00 1.00 1.00 1.00 1.00 1.00 1.00 1.00 1.00 1.00 1.00 FinalVolume: 1 6 12 330 16 170 54 550 1 29 533 89 ------------|---------------||---------------||---------------||---------------|PCE Module:AutoPCE: 1 5 11 307 14 158 51 511 1 27 496 83 TruckPCE: 0 0 1 25 1 13 4 41 0 2 40 7 ComboPCE: 0 0 0 13 1 7 2 22 0 1 21 4 BicyclePCE: 0 0 0 0 0 0 0 0 0 0 0 0 AdjVolume: 1 6 13 345 16 178 57 575 1 30 557 93 ------------|---------------||---------------||---------------||---------------|Delay Module: >> Time Period: 0.25 hours <<CircVolume: 976 589 391 64MaxVolume: 673 882 989 2378PedVolume: 0 0 0 0AdjMaxVol: 673 882 989 2378ApproachVol: 20 539 633 680ApproachV/C: 0.03 0.61 0.64 0.29ApproachDel: 5.5 10.3 9.9 2.1ApproachLOS: A B A A Queue: 0.1 4.3 4.8 1.2
Traffix 8.0.0715 (c) 2008 Dowling Assoc. Licensed to CRANE TRANS. GROUP, SF

MITIG8 - PM Peak hour Fri Dec 17, 2010 16:14:18 Page 1-1 -------------------------------------------------------------------------------- 2030 Base Case + Project CEQA -------------------------------------------------------------------------------- Level Of Service Computation Report FHWA Roundabout Method (Base Volume Alternative) ********************************************************************************Intersection #1 River Rd/Brickway ********************************************************************************Average Delay (sec/veh): 7.8 Level Of Service: A********************************************************************************Approach: North Bound South Bound East Bound West Bound Movement: L - T - R L - T - R L - T - R L - T - R ------------|---------------||---------------||---------------||---------------|Control: Yield Sign Yield Sign Yield Sign Yield Sign Lanes: 1 1 1 2 ------------|---------------||---------------||---------------||---------------|Volume Module:Base Vol: 1 5 11 320 14 177 57 490 1 26 473 96 Growth Adj: 1.00 1.00 1.00 1.00 1.00 1.00 1.00 1.00 1.00 1.00 1.00 1.00 Initial Bse: 1 5 11 320 14 177 57 490 1 26 473 96 User Adj: 1.00 1.00 1.00 1.00 1.00 1.00 1.00 1.00 1.00 1.00 1.00 1.00 PHF Adj: 0.90 0.90 0.90 0.90 0.90 0.90 0.90 0.90 0.90 0.90 0.90 0.90 PHF Volume: 1 6 12 356 16 197 63 544 1 29 526 107 Reduct Vol: 0 0 0 0 0 0 0 0 0 0 0 0 Reduced Vol: 1 6 12 356 16 197 63 544 1 29 526 107 PCE Adj: 1.00 1.00 1.00 1.00 1.00 1.00 1.00 1.00 1.00 1.00 1.00 1.00 MLF Adj: 1.00 1.00 1.00 1.00 1.00 1.00 1.00 1.00 1.00 1.00 1.00 1.00 FinalVolume: 1 6 12 356 16 197 63 544 1 29 526 107 ------------|---------------||---------------||---------------||---------------|PCE Module:AutoPCE: 1 5 11 331 14 183 59 506 1 27 489 99 TruckPCE: 0 0 1 27 1 15 5 41 0 2 39 8 ComboPCE: 0 0 0 14 1 8 3 22 0 1 21 4 BicyclePCE: 0 0 0 0 0 0 0 0 0 0 0 0 AdjVolume: 1 6 13 372 16 206 66 569 1 30 549 111 ------------|---------------||---------------||---------------||---------------|Delay Module: >> Time Period: 0.25 hours <<CircVolume: 1007 581 418 73MaxVolume: 656 886 974 2371PedVolume: 0 0 0 0AdjMaxVol: 656 886 974 2371ApproachVol: 20 593 636 691ApproachV/C: 0.03 0.67 0.65 0.29ApproachDel: 5.7 11.9 10.4 2.1ApproachLOS: A B B A Queue: 0.1 5.3 5.0 1.2
Traffix 8.0.0715 (c) 2008 Dowling Assoc. Licensed to CRANE TRANS. GROUP, SF

MITIG8 - AM Peak Hour Fri Dec 17, 2010 16:06:25 Page 1-1 -------------------------------------------------------------------------------- 2030 Base Case + Project CEQA -------------------------------------------------------------------------------- Level Of Service Computation Report FHWA Roundabout Method (Base Volume Alternative) ********************************************************************************Intersection #1 River Rd/Brickway ********************************************************************************Average Delay (sec/veh): 4.3 Level Of Service: A********************************************************************************Approach: North Bound South Bound East Bound West Bound Movement: L - T - R L - T - R L - T - R L - T - R ------------|---------------||---------------||---------------||---------------|Control: Yield Sign Yield Sign Yield Sign Yield Sign Lanes: 1 1 1 2 ------------|---------------||---------------||---------------||---------------|Volume Module:Base Vol: 1 11 38 66 6 50 176 346 1 23 285 313 Growth Adj: 1.00 1.00 1.00 1.00 1.00 1.00 1.00 1.00 1.00 1.00 1.00 1.00 Initial Bse: 1 11 38 66 6 50 176 346 1 23 285 313 User Adj: 1.00 1.00 1.00 1.00 1.00 1.00 1.00 1.00 1.00 1.00 1.00 1.00 PHF Adj: 0.90 0.90 0.90 0.90 0.90 0.90 0.90 0.90 0.90 0.90 0.90 0.90 PHF Volume: 1 12 42 73 7 56 196 384 1 26 317 348 Reduct Vol: 0 0 0 0 0 0 0 0 0 0 0 0 Reduced Vol: 1 12 42 73 7 56 196 384 1 26 317 348 PCE Adj: 1.00 1.00 1.00 1.00 1.00 1.00 1.00 1.00 1.00 1.00 1.00 1.00 MLF Adj: 1.00 1.00 1.00 1.00 1.00 1.00 1.00 1.00 1.00 1.00 1.00 1.00 FinalVolume: 1 12 42 73 7 56 196 384 1 26 317 348 ------------|---------------||---------------||---------------||---------------|PCE Module:AutoPCE: 1 11 39 68 6 52 182 358 1 24 295 323 TruckPCE: 0 1 3 5 1 4 15 29 0 2 24 26 ComboPCE: 0 0 2 3 0 2 8 15 0 1 13 14 BicyclePCE: 0 0 0 0 0 0 0 0 0 0 0 0 AdjVolume: 1 13 44 77 7 58 204 402 1 27 331 363 ------------|---------------||---------------||---------------||---------------|Delay Module: >> Time Period: 0.25 hours <<CircVolume: 683 359 110 218MaxVolume: 831 1006 1140 2267PedVolume: 0 0 0 0AdjMaxVol: 831 1006 1140 2267ApproachVol: 58 142 607 721ApproachV/C: 0.07 0.14 0.53 0.32ApproachDel: 4.7 4.2 6.7 2.3ApproachLOS: A A A A Queue: 0.2 0.5 3.3 1.4
Traffix 8.0.0715 (c) 2008 Dowling Assoc. Licensed to CRANE TRANS. GROUP, SF

HCM Unsignalized Intersection Capacity Analysis47: River Rd & Slusser 05/01/2011
Sonoma Airport 5:00 pm 16/12/2010 2030 PM Base Case Synchro 7 - Report%user_name% Page 1
Movement EBL EBT WBT WBR SBL SBRLane ConfigurationsVolume (veh/h) 47 348 384 66 152 114Sign Control Free Free StopGrade 0% 0% 0%Peak Hour Factor 0.91 0.91 0.91 0.91 0.91 0.91Hourly flow rate (vph) 52 382 422 73 167 125PedestriansLane Width (ft)Walking Speed (ft/s)Percent BlockageRight turn flare (veh)Median type None NoneMedian storage veh)Upstream signal (ft)pX, platoon unblockedvC, conflicting volume 495 944 458vC1, stage 1 conf volvC2, stage 2 conf volvCu, unblocked vol 495 944 458tC, single (s) 4.1 6.4 6.2tC, 2 stage (s)tF (s) 2.2 3.5 3.3p0 queue free % 95 39 79cM capacity (veh/h) 1054 273 596
Direction, Lane # EB 1 EB 2 WB 1 SB 1Volume Total 52 382 495 292Volume Left 52 0 0 167Volume Right 0 0 73 125cSH 1054 1700 1700 356Volume to Capacity 0.05 0.22 0.29 0.82Queue Length 95th (ft) 4 0 0 181Control Delay (s) 8.6 0.0 0.0 48.1Lane LOS A EApproach Delay (s) 1.0 0.0 48.1Approach LOS E
Intersection SummaryAverage Delay 11.9Intersection Capacity Utilization 53.0% ICU Level of Service AAnalysis Period (min) 15

HCM Unsignalized Intersection Capacity Analysis47: River Rd & Slusser 05/01/2011
Sonoma Airport 5:00 pm 16/12/2010 2030 PM Base Case + Project Mitigated Synchro 7 - Report%user_name% Page 1
Movement EBL EBT WBT WBR SBL SBRLane ConfigurationsVolume (veh/h) 48 350 391 66 152 116Sign Control Free Free StopGrade 0% 0% 0%Peak Hour Factor 0.91 0.91 0.91 0.91 0.91 0.91Hourly flow rate (vph) 53 385 430 73 167 127PedestriansLane Width (ft)Walking Speed (ft/s)Percent BlockageRight turn flare (veh)Median type None NoneMedian storage veh)Upstream signal (ft)pX, platoon unblockedvC, conflicting volume 502 956 466vC1, stage 1 conf volvC2, stage 2 conf volvCu, unblocked vol 502 956 466tC, single (s) 4.1 6.4 6.2tC, 2 stage (s)tF (s) 2.2 3.5 3.3p0 queue free % 95 38 78cM capacity (veh/h) 1047 268 591
Direction, Lane # EB 1 EB 2 WB 1 SB 1Volume Total 53 385 502 295Volume Left 53 0 0 167Volume Right 0 0 73 127cSH 1047 1700 1700 351Volume to Capacity 0.05 0.23 0.30 0.84Queue Length 95th (ft) 4 0 0 188Control Delay (s) 8.6 0.0 0.0 50.9Lane LOS A FApproach Delay (s) 1.0 0.0 50.9Approach LOS F
Intersection SummaryAverage Delay 12.5Intersection Capacity Utilization 53.4% ICU Level of Service AAnalysis Period (min) 15

HCM Unsignalized Intersection Capacity Analysis47: River Rd & Slusser 05/01/2011
Sonoma Airport 5:00 pm 16/12/2010 2030 AM Base Case + Project Synchro 7 - Report%user_name% Page 1
Movement EBL EBT WBT WBR SBL SBRLane ConfigurationsVolume (veh/h) 131 387 230 72 88 35Sign Control Free Free StopGrade 0% 0% 0%Peak Hour Factor 0.91 0.91 0.91 0.91 0.91 0.91Hourly flow rate (vph) 144 425 253 79 97 38PedestriansLane Width (ft)Walking Speed (ft/s)Percent BlockageRight turn flare (veh)Median type None NoneMedian storage veh)Upstream signal (ft)pX, platoon unblockedvC, conflicting volume 332 1005 292vC1, stage 1 conf volvC2, stage 2 conf volvCu, unblocked vol 332 1005 292tC, single (s) 4.1 6.4 6.2tC, 2 stage (s)tF (s) 2.2 3.5 3.3p0 queue free % 88 58 95cM capacity (veh/h) 1211 233 740
Direction, Lane # EB 1 EB 2 WB 1 SB 1Volume Total 144 425 332 135Volume Left 144 0 0 97Volume Right 0 0 79 38cSH 1211 1700 1700 289Volume to Capacity 0.12 0.25 0.20 0.47Queue Length 95th (ft) 10 0 0 59Control Delay (s) 8.4 0.0 0.0 27.9Lane LOS A DApproach Delay (s) 2.1 0.0 27.9Approach LOS D
Intersection SummaryAverage Delay 4.8Intersection Capacity Utilization 40.8% ICU Level of Service AAnalysis Period (min) 15

HCM Unsignalized Intersection Capacity Analysis45: Shiloh Rd & Conde Lane 13/10/2011
Sonoma Airport 5:00 pm 16/12/2010 Existing + 2030 Project Increment Synchro 7 - Report%user_name% Page 1
Movement EBL EBT WBT WBR SBL SBRLane ConfigurationsVolume (veh/h) 33 632 711 162 96 37Sign Control Free Free StopGrade 0% 0% 0%Peak Hour Factor 0.90 0.90 0.90 0.90 0.90 0.90Hourly flow rate (vph) 37 702 790 180 107 41PedestriansLane Width (ft)Walking Speed (ft/s)Percent BlockageRight turn flare (veh)Median type None TWLTLMedian storage veh) 2Upstream signal (ft) 658pX, platoon unblocked 0.75vC, conflicting volume 970 1656 880vC1, stage 1 conf vol 880vC2, stage 2 conf vol 776vCu, unblocked vol 970 1707 880tC, single (s) 4.1 6.4 6.2tC, 2 stage (s) 5.4tF (s) 2.2 3.5 3.3p0 queue free % 95 63 88cM capacity (veh/h) 706 290 345
Direction, Lane # EB 1 EB 2 WB 1 SB 1Volume Total 37 702 970 148Volume Left 37 0 0 107Volume Right 0 0 180 41cSH 706 1700 1700 303Volume to Capacity 0.05 0.41 0.57 0.49Queue Length 95th (ft) 4 0 0 63Control Delay (s) 10.4 0.0 0.0 27.6Lane LOS B DApproach Delay (s) 0.5 0.0 27.6Approach LOS D
Intersection SummaryAverage Delay 2.4Intersection Capacity Utilization 61.5% ICU Level of Service BAnalysis Period (min) 15

HCM Unsignalized Intersection Capacity Analysis45: Shiloh Rd & Conde Lane 13/10/2011
Sonoma Airport 5:00 pm 16/12/2010 PM Existing + 2030 Project Synchro 7 - Report%user_name% Page 1
Movement EBL EBT WBT WBR SBL SBRLane ConfigurationsVolume (veh/h) 21 770 606 159 47 24Sign Control Free Free StopGrade 0% 0% 0%Peak Hour Factor 0.90 0.90 0.90 0.90 0.90 0.90Hourly flow rate (vph) 23 856 673 177 52 27PedestriansLane Width (ft)Walking Speed (ft/s)Percent BlockageRight turn flare (veh)Median type None TWLTLMedian storage veh) 2Upstream signal (ft) 658pX, platoon unblocked 0.92vC, conflicting volume 850 1664 762vC1, stage 1 conf vol 762vC2, stage 2 conf vol 902vCu, unblocked vol 850 1679 762tC, single (s) 4.1 6.4 6.2tC, 2 stage (s) 5.4tF (s) 2.2 3.5 3.3p0 queue free % 97 82 93cM capacity (veh/h) 784 296 403
Direction, Lane # EB 1 EB 2 WB 1 SB 1Volume Total 23 856 850 79Volume Left 23 0 0 52Volume Right 0 0 177 27cSH 784 1700 1700 325Volume to Capacity 0.03 0.50 0.50 0.24Queue Length 95th (ft) 2 0 0 23Control Delay (s) 9.7 0.0 0.0 19.6Lane LOS A CApproach Delay (s) 0.3 0.0 19.6Approach LOS C
Intersection SummaryAverage Delay 1.0Intersection Capacity Utilization 52.3% ICU Level of Service AAnalysis Period (min) 15

HCM Signalized Intersection Capacity Analysis31: Shiloh Rd & NB 101 Ramps 21/10/2011
Sonoma Airport 5:00 pm 16/12/2010 Existing + 2030 Project Increment Synchro 7 - Report%user_name% Page 1
Movement EBT EBR WBL WBT NBL NBRLane ConfigurationsVolume (vph) 370 0 0 560 465 257Ideal Flow (vphpl) 1900 1900 1900 1900 1900 1900Total Lost time (s) 3.0 3.0 3.0 3.0Lane Util. Factor 0.95 1.00 1.00 0.88Frt 1.00 1.00 1.00 0.85Flt Protected 1.00 1.00 0.95 1.00Satd. Flow (prot) 3438 1810 1752 2760Flt Permitted 1.00 1.00 0.95 1.00Satd. Flow (perm) 3438 1810 1752 2760Peak-hour factor, PHF 0.90 0.92 0.92 0.90 0.90 0.90Adj. Flow (vph) 411 0 0 622 517 286RTOR Reduction (vph) 0 0 0 0 0 151Lane Group Flow (vph) 411 0 0 622 517 135Heavy Vehicles (%) 5% 2% 2% 5% 3% 3%Turn Type PermProtected Phases 4 8 2Permitted Phases 2Actuated Green, G (s) 24.6 24.6 27.4 27.4Effective Green, g (s) 25.6 25.6 28.4 28.4Actuated g/C Ratio 0.43 0.43 0.47 0.47Clearance Time (s) 4.0 4.0 4.0 4.0Vehicle Extension (s) 3.0 3.0 3.0 3.0Lane Grp Cap (vph) 1467 772 829 1306v/s Ratio Prot 0.12 c0.34 c0.30v/s Ratio Perm 0.05v/c Ratio 0.28 0.81 0.62 0.10Uniform Delay, d1 11.2 15.0 11.8 8.8Progression Factor 0.79 1.00 1.00 1.00Incremental Delay, d2 0.1 6.1 3.5 0.2Delay (s) 9.0 21.2 15.3 8.9Level of Service A C B AApproach Delay (s) 9.0 21.2 13.0Approach LOS A C B
Intersection SummaryHCM Average Control Delay 14.9 HCM Level of Service BHCM Volume to Capacity ratio 0.71Actuated Cycle Length (s) 60.0 Sum of lost time (s) 6.0Intersection Capacity Utilization 92.8% ICU Level of Service FAnalysis Period (min) 15c Critical Lane Group
HCM Signalized Intersection Capacity Analysis31: Shiloh Rd & NB 101 Ramps 21/10/2011
Sonoma Airport 5:00 pm 16/12/2010 PM Existing + 2030 Project Synchro 7 - Report%user_name% Page 1
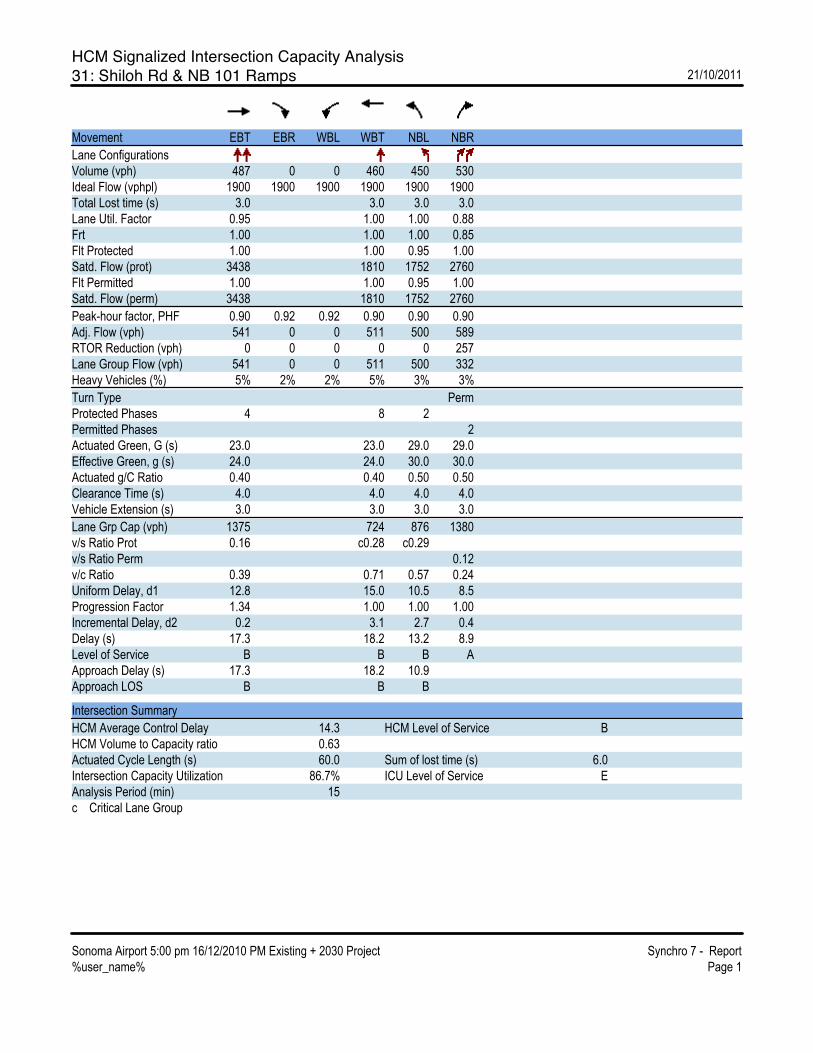
Movement EBT EBR WBL WBT NBL NBRLane ConfigurationsVolume (vph) 487 0 0 460 450 530Ideal Flow (vphpl) 1900 1900 1900 1900 1900 1900Total Lost time (s) 3.0 3.0 3.0 3.0Lane Util. Factor 0.95 1.00 1.00 0.88Frt 1.00 1.00 1.00 0.85Flt Protected 1.00 1.00 0.95 1.00Satd. Flow (prot) 3438 1810 1752 2760Flt Permitted 1.00 1.00 0.95 1.00Satd. Flow (perm) 3438 1810 1752 2760Peak-hour factor, PHF 0.90 0.92 0.92 0.90 0.90 0.90Adj. Flow (vph) 541 0 0 511 500 589RTOR Reduction (vph) 0 0 0 0 0 257Lane Group Flow (vph) 541 0 0 511 500 332Heavy Vehicles (%) 5% 2% 2% 5% 3% 3%Turn Type PermProtected Phases 4 8 2Permitted Phases 2Actuated Green, G (s) 23.0 23.0 29.0 29.0Effective Green, g (s) 24.0 24.0 30.0 30.0Actuated g/C Ratio 0.40 0.40 0.50 0.50Clearance Time (s) 4.0 4.0 4.0 4.0Vehicle Extension (s) 3.0 3.0 3.0 3.0Lane Grp Cap (vph) 1375 724 876 1380v/s Ratio Prot 0.16 c0.28 c0.29v/s Ratio Perm 0.12v/c Ratio 0.39 0.71 0.57 0.24Uniform Delay, d1 12.8 15.0 10.5 8.5Progression Factor 1.34 1.00 1.00 1.00Incremental Delay, d2 0.2 3.1 2.7 0.4Delay (s) 17.3 18.2 13.2 8.9Level of Service B B B AApproach Delay (s) 17.3 18.2 10.9Approach LOS B B B
Intersection SummaryHCM Average Control Delay 14.3 HCM Level of Service BHCM Volume to Capacity ratio 0.63Actuated Cycle Length (s) 60.0 Sum of lost time (s) 6.0Intersection Capacity Utilization 86.7% ICU Level of Service EAnalysis Period (min) 15c Critical Lane Group

HCM Signalized Intersection Capacity Analysis36: Shiloh Rd & SB 101 Ramp 21/10/2011
Sonoma Airport 5:00 pm 16/12/2010 Existing + 2030 Project Increment Synchro 7 - Report%user_name% Page 1
Movement EBL EBT WBT WBR SBL SBRLane ConfigurationsVolume (vph) 0 342 710 0 110 258Ideal Flow (vphpl) 1900 1900 1900 1900 1900 1900Total Lost time (s) 3.0 3.0 3.0 3.0Lane Util. Factor 1.00 1.00 1.00 1.00Frt 1.00 1.00 1.00 0.85Flt Protected 1.00 1.00 0.95 1.00Satd. Flow (prot) 1810 1810 1752 1568Flt Permitted 1.00 1.00 0.95 1.00Satd. Flow (perm) 1810 1810 1752 1568Peak-hour factor, PHF 0.90 0.90 0.90 0.92 0.90 0.90Adj. Flow (vph) 0 380 789 0 122 287RTOR Reduction (vph) 0 0 0 0 0 142Lane Group Flow (vph) 0 380 789 0 122 145Heavy Vehicles (%) 2% 5% 5% 2% 3% 3%Turn Type PermProtected Phases 4 8 6Permitted Phases 6Actuated Green, G (s) 32.7 32.7 19.3 19.3Effective Green, g (s) 33.7 33.7 20.3 20.3Actuated g/C Ratio 0.56 0.56 0.34 0.34Clearance Time (s) 4.0 4.0 4.0 4.0Vehicle Extension (s) 3.0 3.0 3.0 3.0Lane Grp Cap (vph) 1017 1017 593 531v/s Ratio Prot 0.21 c0.44 0.07v/s Ratio Perm c0.09v/c Ratio 0.37 0.78 0.21 0.27Uniform Delay, d1 7.3 10.2 14.1 14.5Progression Factor 1.00 1.29 1.00 1.00Incremental Delay, d2 0.2 2.9 0.8 1.3Delay (s) 7.5 16.1 14.9 15.7Level of Service A B B BApproach Delay (s) 7.5 16.1 15.5Approach LOS A B B
Intersection SummaryHCM Average Control Delay 13.9 HCM Level of Service BHCM Volume to Capacity ratio 0.59Actuated Cycle Length (s) 60.0 Sum of lost time (s) 6.0Intersection Capacity Utilization 104.2% ICU Level of Service GAnalysis Period (min) 15c Critical Lane Group

HCM Signalized Intersection Capacity Analysis36: Shiloh Rd & SB 101 Ramp 21/10/2011
Sonoma Airport 5:00 pm 16/12/2010 PM Existing + 2030 Project Synchro 7 - Report%user_name% Page 1
Movement EBL EBT WBT WBR SBL SBRLane ConfigurationsVolume (vph) 0 586 732 0 166 122Ideal Flow (vphpl) 1900 1900 1900 1900 1900 1900Total Lost time (s) 3.0 3.0 3.0 3.0Lane Util. Factor 1.00 1.00 1.00 1.00Frt 1.00 1.00 1.00 0.85Flt Protected 1.00 1.00 0.95 1.00Satd. Flow (prot) 1810 1810 1752 1568Flt Permitted 1.00 1.00 0.95 1.00Satd. Flow (perm) 1810 1810 1752 1568Peak-hour factor, PHF 0.90 0.90 0.90 0.92 0.90 0.90Adj. Flow (vph) 0 651 813 0 184 136RTOR Reduction (vph) 0 0 0 0 0 94Lane Group Flow (vph) 0 651 813 0 184 42Heavy Vehicles (%) 2% 5% 5% 2% 3% 3%Turn Type PermProtected Phases 4 8 6Permitted Phases 6Actuated Green, G (s) 34.5 34.5 17.5 17.5Effective Green, g (s) 35.5 35.5 18.5 18.5Actuated g/C Ratio 0.59 0.59 0.31 0.31Clearance Time (s) 4.0 4.0 4.0 4.0Vehicle Extension (s) 3.0 3.0 3.0 3.0Lane Grp Cap (vph) 1071 1071 540 483v/s Ratio Prot 0.36 c0.45 c0.10v/s Ratio Perm 0.03v/c Ratio 0.61 0.76 0.34 0.09Uniform Delay, d1 7.8 9.1 16.0 14.7Progression Factor 1.00 0.83 1.00 1.00Incremental Delay, d2 1.0 2.9 1.7 0.4Delay (s) 8.8 10.4 17.7 15.1Level of Service A B B BApproach Delay (s) 8.8 10.4 16.6Approach LOS A B B
Intersection SummaryHCM Average Control Delay 10.9 HCM Level of Service BHCM Volume to Capacity ratio 0.62Actuated Cycle Length (s) 60.0 Sum of lost time (s) 6.0Intersection Capacity Utilization 110.2% ICU Level of Service HAnalysis Period (min) 15c Critical Lane Group

HCM Signalized Intersection Capacity Analysis51: Shiloh Rd & Golf Course 13/10/2011
Sonoma Airport 5:00 pm 16/12/2010 Existing + 2030 Project Increment Synchro 7 - Report%user_name% Page 1
Movement EBL EBT EBR WBL WBT WBR NBL NBT NBR SBL SBT SBRLane ConfigurationsVolume (vph) 2 362 132 508 170 57 28 7 80 217 9 3Ideal Flow (vphpl) 1900 1900 1900 1900 1900 1900 1900 1900 1900 1900 1900 1900Total Lost time (s) 3.0 3.0 3.0 3.0 3.0 3.0 3.0 3.0 3.0 3.0Lane Util. Factor 1.00 1.00 1.00 1.00 1.00 1.00 1.00 1.00 1.00 1.00Frt 1.00 0.96 1.00 1.00 0.85 1.00 1.00 0.85 1.00 0.97Flt Protected 0.95 1.00 0.95 1.00 1.00 0.95 1.00 1.00 0.95 1.00Satd. Flow (prot) 1752 1746 1752 1810 1568 1752 1845 1568 1752 1781Flt Permitted 0.95 1.00 0.95 1.00 1.00 0.95 1.00 1.00 0.95 1.00Satd. Flow (perm) 1752 1746 1752 1810 1568 1752 1845 1568 1752 1781Peak-hour factor, PHF 0.90 0.90 0.90 0.90 0.90 0.90 0.90 0.90 0.90 0.90 0.90 0.90Adj. Flow (vph) 2 402 147 564 189 63 31 8 89 241 10 3RTOR Reduction (vph) 0 11 0 0 0 21 0 0 56 0 2 0Lane Group Flow (vph) 2 538 0 564 189 42 31 8 33 241 11 0Heavy Vehicles (%) 3% 5% 3% 3% 5% 3% 3% 3% 3% 3% 3% 3%Turn Type Prot Prot Perm Prot pt+ov ProtProtected Phases 7 4 3 8 5 2 2 3 1 6Permitted Phases 8Actuated Green, G (s) 1.2 41.6 36.2 76.6 76.6 4.9 6.0 42.2 17.8 18.9Effective Green, g (s) 2.2 42.6 37.2 77.6 77.6 5.9 7.0 44.2 18.8 19.9Actuated g/C Ratio 0.02 0.36 0.32 0.66 0.66 0.05 0.06 0.38 0.16 0.17Clearance Time (s) 4.0 4.0 4.0 4.0 4.0 4.0 4.0 4.0 4.0Vehicle Extension (s) 3.0 3.0 3.0 3.0 3.0 3.0 3.0 3.0 3.0Lane Grp Cap (vph) 33 632 554 1194 1035 88 110 589 280 301v/s Ratio Prot 0.00 c0.31 c0.32 0.10 c0.02 0.00 0.02 c0.14 0.01v/s Ratio Perm 0.03v/c Ratio 0.06 0.85 1.02 0.16 0.04 0.35 0.07 0.06 0.86 0.03Uniform Delay, d1 56.7 34.6 40.2 7.6 7.0 54.0 52.2 23.4 48.1 40.8Progression Factor 1.00 1.00 1.00 1.00 1.00 1.00 1.00 1.00 1.00 1.00Incremental Delay, d2 0.8 10.6 42.9 0.1 0.0 2.4 1.3 0.0 22.6 0.2Delay (s) 57.5 45.2 83.1 7.7 7.0 56.4 53.5 23.4 70.8 41.0Level of Service E D F A A E D C E DApproach Delay (s) 45.2 59.7 33.3 69.2Approach LOS D E C E
Intersection SummaryHCM Average Control Delay 54.6 HCM Level of Service DHCM Volume to Capacity ratio 0.87Actuated Cycle Length (s) 117.6 Sum of lost time (s) 12.0Intersection Capacity Utilization 83.9% ICU Level of Service EAnalysis Period (min) 15c Critical Lane Group

HCM Signalized Intersection Capacity Analysis51: Shiloh Rd & Golf Course 13/10/2011
Sonoma Airport 5:00 pm 16/12/2010 PM Existing + 2030 Project Synchro 7 - Report%user_name% Page 1
Movement EBL EBT EBR WBL WBT WBR NBL NBT NBR SBL SBT SBRLane ConfigurationsVolume (vph) 2 206 45 143 336 139 128 55 457 104 23 5Ideal Flow (vphpl) 1900 1900 1900 1900 1900 1900 1900 1900 1900 1900 1900 1900Total Lost time (s) 3.0 3.0 3.0 3.0 3.0 3.0 3.0 3.0 3.0 3.0Lane Util. Factor 1.00 1.00 1.00 1.00 1.00 1.00 1.00 1.00 1.00 1.00Frt 1.00 0.97 1.00 1.00 0.85 1.00 1.00 0.85 1.00 0.97Flt Protected 0.95 1.00 0.95 1.00 1.00 0.95 1.00 1.00 0.95 1.00Satd. Flow (prot) 1752 1767 1752 1810 1568 1752 1845 1568 1752 1793Flt Permitted 0.95 1.00 0.95 1.00 1.00 0.95 1.00 1.00 0.95 1.00Satd. Flow (perm) 1752 1767 1752 1810 1568 1752 1845 1568 1752 1793Peak-hour factor, PHF 0.90 0.90 0.90 0.90 0.90 0.90 0.90 0.90 0.90 0.90 0.90 0.90Adj. Flow (vph) 2 229 50 159 373 154 142 61 508 116 26 6RTOR Reduction (vph) 0 13 0 0 0 94 0 0 155 0 4 0Lane Group Flow (vph) 2 266 0 159 373 60 142 61 353 116 28 0Heavy Vehicles (%) 3% 5% 3% 3% 5% 3% 3% 3% 3% 3% 3% 3%Turn Type Prot Prot Perm Prot pt+ov ProtProtected Phases 7 4 3 8 5 2 2 3 1 6Permitted Phases 8Actuated Green, G (s) 1.1 14.4 9.0 22.3 22.3 4.5 16.3 25.3 4.5 16.3Effective Green, g (s) 2.1 15.4 10.0 23.3 23.3 5.5 17.3 27.3 5.5 17.3Actuated g/C Ratio 0.03 0.26 0.17 0.39 0.39 0.09 0.29 0.45 0.09 0.29Clearance Time (s) 4.0 4.0 4.0 4.0 4.0 4.0 4.0 4.0 4.0Vehicle Extension (s) 3.0 3.0 3.0 3.0 3.0 3.0 3.0 3.0 3.0Lane Grp Cap (vph) 61 452 291 701 607 160 530 711 160 515v/s Ratio Prot 0.00 0.15 c0.09 c0.21 c0.08 0.03 c0.22 0.07 0.02v/s Ratio Perm 0.04v/c Ratio 0.03 0.59 0.55 0.53 0.10 0.89 0.12 0.50 0.72 0.05Uniform Delay, d1 28.1 19.6 23.0 14.2 11.8 27.0 15.8 11.6 26.6 15.5Progression Factor 1.00 1.00 1.00 1.00 1.00 1.00 1.00 1.00 1.00 1.00Incremental Delay, d2 0.2 2.0 2.1 0.8 0.1 40.0 0.4 0.5 15.0 0.2Delay (s) 28.3 21.6 25.1 15.0 11.8 67.1 16.2 12.1 41.6 15.7Level of Service C C C B B E B B D BApproach Delay (s) 21.6 16.6 23.5 36.0Approach LOS C B C D
Intersection SummaryHCM Average Control Delay 21.6 HCM Level of Service CHCM Volume to Capacity ratio 0.56Actuated Cycle Length (s) 60.2 Sum of lost time (s) 9.0Intersection Capacity Utilization 57.6% ICU Level of Service BAnalysis Period (min) 15c Critical Lane Group

HCM Signalized Intersection Capacity Analysis45: Shiloh Rd & Conde Lane 17/12/2010
Sonoma Airport 5:00 pm 16/12/2010 2030 PM Base Case Synchro 7 - Report%user_name% Page 1
Movement EBL EBT EBR WBL WBT WBR NBL NBT NBR SBL SBT SBRLane ConfigurationsVolume (vph) 75 860 3 145 680 215 33 18 44 100 2 50Ideal Flow (vphpl) 1900 1900 1900 1900 1900 1900 1900 1900 1900 1900 1900 1900Total Lost time (s) 3.0 3.0 3.0 3.0 3.0 3.0 3.0 3.0Lane Util. Factor 1.00 1.00 1.00 1.00 1.00 1.00 1.00 1.00Frt 1.00 1.00 1.00 0.96 1.00 0.89 1.00 0.86Flt Protected 0.95 1.00 0.95 1.00 0.95 1.00 0.95 1.00Satd. Flow (prot) 1752 1809 1719 1752 1719 1618 1752 1578Flt Permitted 0.95 1.00 0.95 1.00 0.95 1.00 0.95 1.00Satd. Flow (perm) 1752 1809 1719 1752 1719 1618 1752 1578Peak-hour factor, PHF 0.91 0.91 0.91 0.91 0.91 0.91 0.91 0.91 0.91 0.91 0.91 0.91Adj. Flow (vph) 82 945 3 159 747 236 36 20 48 110 2 55RTOR Reduction (vph) 0 0 0 0 19 0 0 43 0 0 48 0Lane Group Flow (vph) 82 948 0 159 964 0 36 25 0 110 9 0Heavy Vehicles (%) 3% 5% 5% 5% 5% 3% 5% 5% 5% 3% 2% 3%Turn Type Prot Prot Prot ProtProtected Phases 7 4 3 8 5 2 1 6Permitted PhasesActuated Green, G (s) 3.0 30.2 5.3 32.5 1.5 5.6 3.0 7.1Effective Green, g (s) 4.0 31.2 6.3 33.5 2.5 6.6 4.0 8.1Actuated g/C Ratio 0.07 0.52 0.10 0.56 0.04 0.11 0.07 0.13Clearance Time (s) 4.0 4.0 4.0 4.0 4.0 4.0 4.0 4.0Vehicle Extension (s) 3.0 3.0 3.0 3.0 3.0 3.0 3.0 3.0Lane Grp Cap (vph) 117 939 180 977 72 178 117 213v/s Ratio Prot 0.05 0.52 c0.09 c0.55 c0.02 c0.02 c0.06 0.01v/s Ratio Permv/c Ratio 0.70 1.01 0.88 0.99 0.50 0.14 0.94 0.04Uniform Delay, d1 27.5 14.5 26.5 13.1 28.2 24.2 27.9 22.6Progression Factor 1.00 1.00 1.00 1.00 1.00 1.00 1.00 1.00Incremental Delay, d2 17.3 31.7 36.2 25.4 5.4 0.4 64.4 0.1Delay (s) 44.7 46.2 62.7 38.5 33.6 24.6 92.3 22.7Level of Service D D E D C C F CApproach Delay (s) 46.1 41.9 27.7 68.6Approach LOS D D C E
Intersection SummaryHCM Average Control Delay 44.9 HCM Level of Service DHCM Volume to Capacity ratio 0.88Actuated Cycle Length (s) 60.1 Sum of lost time (s) 12.0Intersection Capacity Utilization 75.7% ICU Level of Service DAnalysis Period (min) 15c Critical Lane Group

HCM Signalized Intersection Capacity Analysis45: Shiloh Rd & Conde Lane 17/12/2010
Sonoma Airport 5:00 pm 16/12/2010 2030 PM Base Case + Project Synchro 7 - Report%user_name% Page 1
Movement EBL EBT EBR WBL WBT WBR NBL NBT NBR SBL SBT SBRLane ConfigurationsVolume (vph) 82 890 3 145 686 214 33 18 44 99 2 54Ideal Flow (vphpl) 1900 1900 1900 1900 1900 1900 1900 1900 1900 1900 1900 1900Total Lost time (s) 3.0 3.0 3.0 3.0 3.0 3.0 3.0 3.0Lane Util. Factor 1.00 1.00 1.00 1.00 1.00 1.00 1.00 1.00Frt 1.00 1.00 1.00 0.96 1.00 0.89 1.00 0.85Flt Protected 0.95 1.00 0.95 1.00 0.95 1.00 0.95 1.00Satd. Flow (prot) 1752 1809 1719 1753 1719 1618 1752 1578Flt Permitted 0.95 1.00 0.95 1.00 0.95 1.00 0.95 1.00Satd. Flow (perm) 1752 1809 1719 1753 1719 1618 1752 1578Peak-hour factor, PHF 0.91 0.91 0.91 0.91 0.91 0.91 0.91 0.91 0.91 0.91 0.91 0.91Adj. Flow (vph) 90 978 3 159 754 235 36 20 48 109 2 59RTOR Reduction (vph) 0 0 0 0 19 0 0 43 0 0 51 0Lane Group Flow (vph) 90 981 0 159 970 0 36 25 0 109 10 0Heavy Vehicles (%) 3% 5% 5% 5% 5% 3% 5% 5% 5% 3% 2% 3%Turn Type Prot Prot Prot ProtProtected Phases 7 4 3 8 5 2 1 6Permitted PhasesActuated Green, G (s) 3.0 30.2 5.3 32.5 1.5 5.6 3.0 7.1Effective Green, g (s) 4.0 31.2 6.3 33.5 2.5 6.6 4.0 8.1Actuated g/C Ratio 0.07 0.52 0.10 0.56 0.04 0.11 0.07 0.13Clearance Time (s) 4.0 4.0 4.0 4.0 4.0 4.0 4.0 4.0Vehicle Extension (s) 3.0 3.0 3.0 3.0 3.0 3.0 3.0 3.0Lane Grp Cap (vph) 117 939 180 977 72 178 117 213v/s Ratio Prot 0.05 0.54 c0.09 c0.55 c0.02 c0.02 c0.06 0.01v/s Ratio Permv/c Ratio 0.77 1.04 0.88 0.99 0.50 0.14 0.93 0.05Uniform Delay, d1 27.6 14.5 26.5 13.2 28.2 24.2 27.9 22.6Progression Factor 1.00 1.00 1.00 1.00 1.00 1.00 1.00 1.00Incremental Delay, d2 25.7 41.7 36.2 27.0 5.4 0.4 61.8 0.1Delay (s) 53.3 56.2 62.7 40.2 33.6 24.6 89.8 22.7Level of Service D E E D C C F CApproach Delay (s) 55.9 43.3 27.7 65.7Approach LOS E D C E
Intersection SummaryHCM Average Control Delay 49.6 HCM Level of Service DHCM Volume to Capacity ratio 0.88Actuated Cycle Length (s) 60.1 Sum of lost time (s) 12.0Intersection Capacity Utilization 77.2% ICU Level of Service DAnalysis Period (min) 15c Critical Lane Group

HCM Signalized Intersection Capacity Analysis45: Shiloh Rd & Conde Lane 17/12/2010
Sonoma Airport 5:00 pm 16/12/2010 2030 AM Base Case + Project Synchro 7 - Report%user_name% Page 1
Movement EBL EBT EBR WBL WBT WBR NBL NBT NBR SBL SBT SBRLane ConfigurationsVolume (vph) 112 720 2 275 721 187 35 18 8 119 3 82Ideal Flow (vphpl) 1900 1900 1900 1900 1900 1900 1900 1900 1900 1900 1900 1900Total Lost time (s) 3.0 3.0 3.0 3.0 3.0 3.0 3.0 3.0Lane Util. Factor 1.00 1.00 1.00 1.00 1.00 1.00 1.00 1.00Frt 1.00 1.00 1.00 0.97 1.00 0.95 1.00 0.85Flt Protected 0.95 1.00 0.95 1.00 0.95 1.00 0.95 1.00Satd. Flow (prot) 1752 1809 1719 1761 1719 1725 1752 1577Flt Permitted 0.95 1.00 0.95 1.00 0.95 1.00 0.95 1.00Satd. Flow (perm) 1752 1809 1719 1761 1719 1725 1752 1577Peak-hour factor, PHF 0.91 0.91 0.91 0.91 0.91 0.91 0.91 0.91 0.91 0.91 0.91 0.91Adj. Flow (vph) 123 791 2 302 792 205 38 20 9 131 3 90RTOR Reduction (vph) 0 0 0 0 16 0 0 8 0 0 79 0Lane Group Flow (vph) 123 793 0 302 981 0 38 21 0 131 14 0Heavy Vehicles (%) 3% 5% 2% 5% 5% 3% 5% 5% 5% 3% 2% 3%Turn Type Prot Prot Prot ProtProtected Phases 7 4 3 8 5 2 1 6Permitted PhasesActuated Green, G (s) 4.8 26.8 11.8 33.8 1.6 4.4 4.0 6.8Effective Green, g (s) 5.8 27.8 12.8 34.8 2.6 5.4 5.0 7.8Actuated g/C Ratio 0.09 0.44 0.20 0.55 0.04 0.09 0.08 0.12Clearance Time (s) 4.0 4.0 4.0 4.0 4.0 4.0 4.0 4.0Vehicle Extension (s) 3.0 3.0 3.0 3.0 3.0 3.0 3.0 3.0Lane Grp Cap (vph) 161 798 349 973 71 148 139 195v/s Ratio Prot 0.07 0.44 c0.18 c0.56 0.02 c0.01 c0.07 0.01v/s Ratio Permv/c Ratio 0.76 0.99 0.87 1.01 0.54 0.14 0.94 0.07Uniform Delay, d1 27.9 17.5 24.3 14.1 29.6 26.7 28.9 24.4Progression Factor 1.00 1.00 1.00 1.00 1.00 1.00 1.00 1.00Incremental Delay, d2 19.1 30.1 19.5 31.0 7.6 0.4 58.7 0.2Delay (s) 47.1 47.6 43.7 45.1 37.2 27.1 87.5 24.6Level of Service D D D D D C F CApproach Delay (s) 47.6 44.8 32.8 61.4Approach LOS D D C E
Intersection SummaryHCM Average Control Delay 46.9 HCM Level of Service DHCM Volume to Capacity ratio 0.84Actuated Cycle Length (s) 63.0 Sum of lost time (s) 9.0Intersection Capacity Utilization 78.8% ICU Level of Service DAnalysis Period (min) 15c Critical Lane Group

HCM Signalized Intersection Capacity Analysis31: Shiloh Rd & NB 101 Ramps 22/10/2011
Sonoma Airport 5:00 pm 16/12/2010 2030 PM Base Case Synchro 7 - Report%user_name% Page 1
Movement EBT EBR WBL WBT NBL NBRLane ConfigurationsVolume (vph) 590 0 0 550 540 600Ideal Flow (vphpl) 1900 1900 1900 1900 1900 1900Total Lost time (s) 3.0 3.0 3.0 3.0Lane Util. Factor 0.95 1.00 1.00 0.88Frt 1.00 1.00 1.00 0.85Flt Protected 1.00 1.00 0.95 1.00Satd. Flow (prot) 3438 1810 1752 2760Flt Permitted 1.00 1.00 0.95 1.00Satd. Flow (perm) 3438 1810 1752 2760Peak-hour factor, PHF 0.91 0.92 0.92 0.91 0.91 0.91Adj. Flow (vph) 648 0 0 604 593 659RTOR Reduction (vph) 0 0 0 0 0 135Lane Group Flow (vph) 648 0 0 604 593 525Heavy Vehicles (%) 5% 2% 2% 5% 3% 3%Turn Type PermProtected Phases 4 8 2Permitted Phases 2Actuated Green, G (s) 23.0 23.0 29.0 29.0Effective Green, g (s) 24.0 24.0 30.0 30.0Actuated g/C Ratio 0.40 0.40 0.50 0.50Clearance Time (s) 4.0 4.0 4.0 4.0Vehicle Extension (s) 3.0 3.0 3.0 3.0Lane Grp Cap (vph) 1375 724 876 1380v/s Ratio Prot 0.19 c0.33 c0.34v/s Ratio Perm 0.19v/c Ratio 0.47 0.83 0.68 0.38Uniform Delay, d1 13.3 16.2 11.3 9.3Progression Factor 0.90 1.00 1.00 1.00Incremental Delay, d2 0.2 8.2 4.2 0.8Delay (s) 12.2 24.4 15.5 10.1Level of Service B C B BApproach Delay (s) 12.2 24.4 12.6Approach LOS B C B
Intersection SummaryHCM Average Control Delay 15.4 HCM Level of Service BHCM Volume to Capacity ratio 0.75Actuated Cycle Length (s) 60.0 Sum of lost time (s) 6.0Intersection Capacity Utilization 96.4% ICU Level of Service FAnalysis Period (min) 15c Critical Lane Group
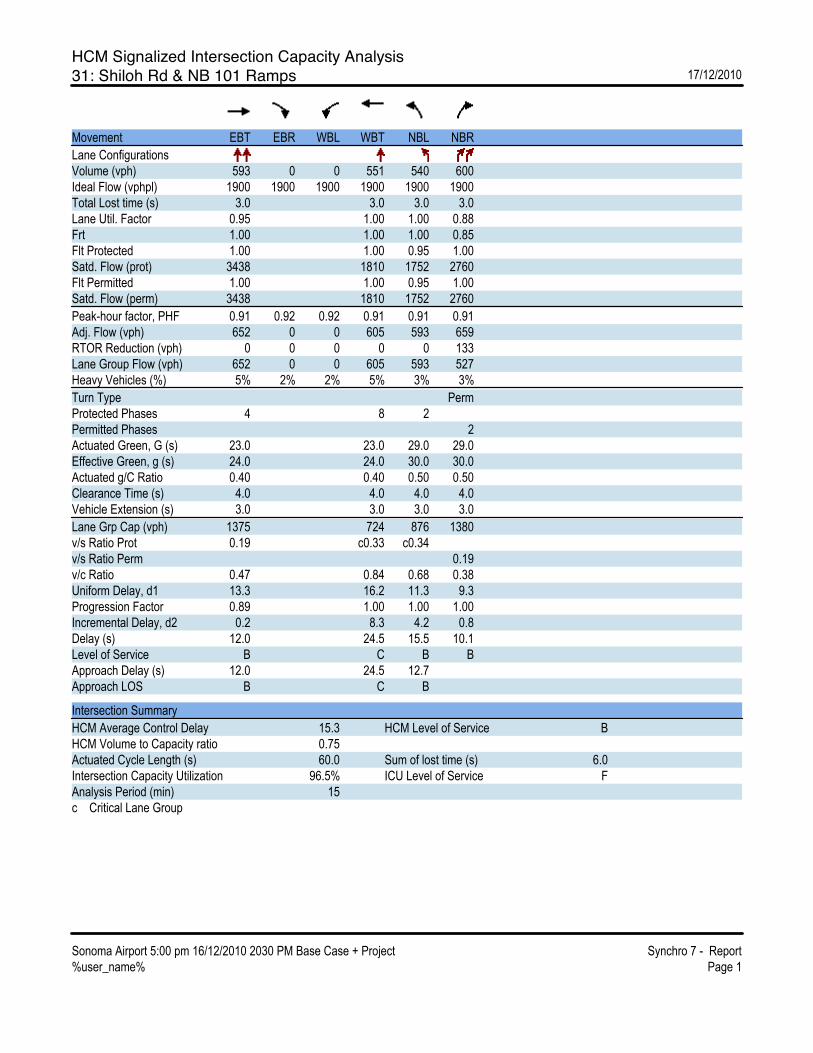
HCM Signalized Intersection Capacity Analysis31: Shiloh Rd & NB 101 Ramps 17/12/2010
Sonoma Airport 5:00 pm 16/12/2010 2030 PM Base Case + Project Synchro 7 - Report%user_name% Page 1
Movement EBT EBR WBL WBT NBL NBRLane ConfigurationsVolume (vph) 593 0 0 551 540 600Ideal Flow (vphpl) 1900 1900 1900 1900 1900 1900Total Lost time (s) 3.0 3.0 3.0 3.0Lane Util. Factor 0.95 1.00 1.00 0.88Frt 1.00 1.00 1.00 0.85Flt Protected 1.00 1.00 0.95 1.00Satd. Flow (prot) 3438 1810 1752 2760Flt Permitted 1.00 1.00 0.95 1.00Satd. Flow (perm) 3438 1810 1752 2760Peak-hour factor, PHF 0.91 0.92 0.92 0.91 0.91 0.91Adj. Flow (vph) 652 0 0 605 593 659RTOR Reduction (vph) 0 0 0 0 0 133Lane Group Flow (vph) 652 0 0 605 593 527Heavy Vehicles (%) 5% 2% 2% 5% 3% 3%Turn Type PermProtected Phases 4 8 2Permitted Phases 2Actuated Green, G (s) 23.0 23.0 29.0 29.0Effective Green, g (s) 24.0 24.0 30.0 30.0Actuated g/C Ratio 0.40 0.40 0.50 0.50Clearance Time (s) 4.0 4.0 4.0 4.0Vehicle Extension (s) 3.0 3.0 3.0 3.0Lane Grp Cap (vph) 1375 724 876 1380v/s Ratio Prot 0.19 c0.33 c0.34v/s Ratio Perm 0.19v/c Ratio 0.47 0.84 0.68 0.38Uniform Delay, d1 13.3 16.2 11.3 9.3Progression Factor 0.89 1.00 1.00 1.00Incremental Delay, d2 0.2 8.3 4.2 0.8Delay (s) 12.0 24.5 15.5 10.1Level of Service B C B BApproach Delay (s) 12.0 24.5 12.7Approach LOS B C B
Intersection SummaryHCM Average Control Delay 15.3 HCM Level of Service BHCM Volume to Capacity ratio 0.75Actuated Cycle Length (s) 60.0 Sum of lost time (s) 6.0Intersection Capacity Utilization 96.5% ICU Level of Service FAnalysis Period (min) 15c Critical Lane Group

HCM Signalized Intersection Capacity Analysis31: Shiloh Rd & NB 101 Ramps 21/10/2011
Sonoma Airport 5:00 pm 16/12/2010 2030 AM Base Case + Project Synchro 7 - Report%user_name% Page 1
Movement EBT EBR WBL WBT NBL NBRLane ConfigurationsVolume (vph) 573 0 0 765 545 265Ideal Flow (vphpl) 1900 1900 1900 1900 1900 1900Total Lost time (s) 3.0 3.0 3.0 3.0Lane Util. Factor 0.95 1.00 1.00 0.88Frt 1.00 1.00 1.00 0.85Flt Protected 1.00 1.00 0.95 1.00Satd. Flow (prot) 3438 1810 1752 2760Flt Permitted 1.00 1.00 0.95 1.00Satd. Flow (perm) 3438 1810 1752 2760Peak-hour factor, PHF 0.91 0.91 0.91 0.91 0.91 0.91Adj. Flow (vph) 630 0 0 841 599 291RTOR Reduction (vph) 0 0 0 0 0 173Lane Group Flow (vph) 630 0 0 841 599 118Heavy Vehicles (%) 5% 2% 2% 5% 3% 3%Turn Type PermProtected Phases 4 8 2Permitted Phases 2Actuated Green, G (s) 28.7 28.7 23.3 23.3Effective Green, g (s) 29.7 29.7 24.3 24.3Actuated g/C Ratio 0.49 0.49 0.41 0.41Clearance Time (s) 4.0 4.0 4.0 4.0Vehicle Extension (s) 3.0 3.0 3.0 3.0Lane Grp Cap (vph) 1702 896 710 1118v/s Ratio Prot 0.18 c0.46 c0.34v/s Ratio Perm 0.04v/c Ratio 0.37 0.94 0.84 0.11Uniform Delay, d1 9.4 14.3 16.1 11.1Progression Factor 0.77 1.00 1.00 1.00Incremental Delay, d2 0.1 16.9 11.7 0.2Delay (s) 7.3 31.2 27.9 11.3Level of Service A C C BApproach Delay (s) 7.3 31.2 22.4Approach LOS A C C
Intersection SummaryHCM Average Control Delay 21.5 HCM Level of Service CHCM Volume to Capacity ratio 0.90Actuated Cycle Length (s) 60.0 Sum of lost time (s) 6.0Intersection Capacity Utilization 108.0% ICU Level of Service GAnalysis Period (min) 15c Critical Lane Group

HCM Signalized Intersection Capacity Analysis36: Shiloh Rd & SB 101 Ramp 17/12/2010
Sonoma Airport 5:00 pm 16/12/2010 2030 PM Base Case Synchro 7 - Report%user_name% Page 1
Movement EBL EBT WBT WBR SBL SBRLane ConfigurationsVolume (vph) 0 660 870 0 240 170Ideal Flow (vphpl) 1900 1900 1900 1900 1900 1900Total Lost time (s) 3.0 3.0 3.0 3.0Lane Util. Factor 1.00 1.00 1.00 1.00Frt 1.00 1.00 1.00 0.85Flt Protected 1.00 1.00 0.95 1.00Satd. Flow (prot) 1810 1810 1752 1568Flt Permitted 1.00 1.00 0.95 1.00Satd. Flow (perm) 1810 1810 1752 1568Peak-hour factor, PHF 0.91 0.91 0.91 0.92 0.91 0.91Adj. Flow (vph) 0 725 956 0 264 187RTOR Reduction (vph) 0 0 0 0 0 122Lane Group Flow (vph) 0 725 956 0 264 65Heavy Vehicles (%) 2% 5% 5% 2% 3% 3%Turn Type PermProtected Phases 4 8 6Permitted Phases 6Actuated Green, G (s) 37.0 37.0 15.0 15.0Effective Green, g (s) 38.0 38.0 16.0 16.0Actuated g/C Ratio 0.63 0.63 0.27 0.27Clearance Time (s) 4.0 4.0 4.0 4.0Vehicle Extension (s) 3.0 3.0 3.0 3.0Lane Grp Cap (vph) 1146 1146 467 418v/s Ratio Prot 0.40 c0.53 c0.15v/s Ratio Perm 0.04v/c Ratio 0.63 0.83 0.57 0.16Uniform Delay, d1 6.7 8.6 19.0 16.8Progression Factor 1.00 0.91 1.00 1.00Incremental Delay, d2 1.1 4.4 4.9 0.8Delay (s) 7.9 12.2 23.9 17.6Level of Service A B C BApproach Delay (s) 7.9 12.2 21.3Approach LOS A B C
Intersection SummaryHCM Average Control Delay 12.7 HCM Level of Service BHCM Volume to Capacity ratio 0.75Actuated Cycle Length (s) 60.0 Sum of lost time (s) 6.0Intersection Capacity Utilization 118.2% ICU Level of Service HAnalysis Period (min) 15c Critical Lane Group

HCM Signalized Intersection Capacity Analysis36: Shiloh Rd & SB 101 Ramp 17/12/2010
Sonoma Airport 5:00 pm 16/12/2010 2030 PM Base Case + Project Synchro 7 - Report%user_name% Page 1
Movement EBL EBT WBT WBR SBL SBRLane ConfigurationsVolume (vph) 0 686 871 0 240 174Ideal Flow (vphpl) 1900 1900 1900 1900 1900 1900Total Lost time (s) 3.0 3.0 3.0 3.0Lane Util. Factor 1.00 1.00 1.00 1.00Frt 1.00 1.00 1.00 0.85Flt Protected 1.00 1.00 0.95 1.00Satd. Flow (prot) 1810 1810 1752 1568Flt Permitted 1.00 1.00 0.95 1.00Satd. Flow (perm) 1810 1810 1752 1568Peak-hour factor, PHF 0.91 0.91 0.91 0.92 0.91 0.91Adj. Flow (vph) 0 754 957 0 264 191RTOR Reduction (vph) 0 0 0 0 0 122Lane Group Flow (vph) 0 754 957 0 264 69Heavy Vehicles (%) 2% 5% 5% 2% 3% 3%Turn Type PermProtected Phases 4 8 6Permitted Phases 6Actuated Green, G (s) 37.0 37.0 15.0 15.0Effective Green, g (s) 38.0 38.0 16.0 16.0Actuated g/C Ratio 0.63 0.63 0.27 0.27Clearance Time (s) 4.0 4.0 4.0 4.0Vehicle Extension (s) 3.0 3.0 3.0 3.0Lane Grp Cap (vph) 1146 1146 467 418v/s Ratio Prot 0.42 c0.53 c0.15v/s Ratio Perm 0.04v/c Ratio 0.66 0.84 0.57 0.17Uniform Delay, d1 6.9 8.6 19.0 16.9Progression Factor 1.00 0.91 1.00 1.00Incremental Delay, d2 1.4 4.4 4.9 0.9Delay (s) 8.3 12.2 23.9 17.7Level of Service A B C BApproach Delay (s) 8.3 12.2 21.3Approach LOS A B C
Intersection SummaryHCM Average Control Delay 12.8 HCM Level of Service BHCM Volume to Capacity ratio 0.75Actuated Cycle Length (s) 60.0 Sum of lost time (s) 6.0Intersection Capacity Utilization 119.6% ICU Level of Service HAnalysis Period (min) 15c Critical Lane Group
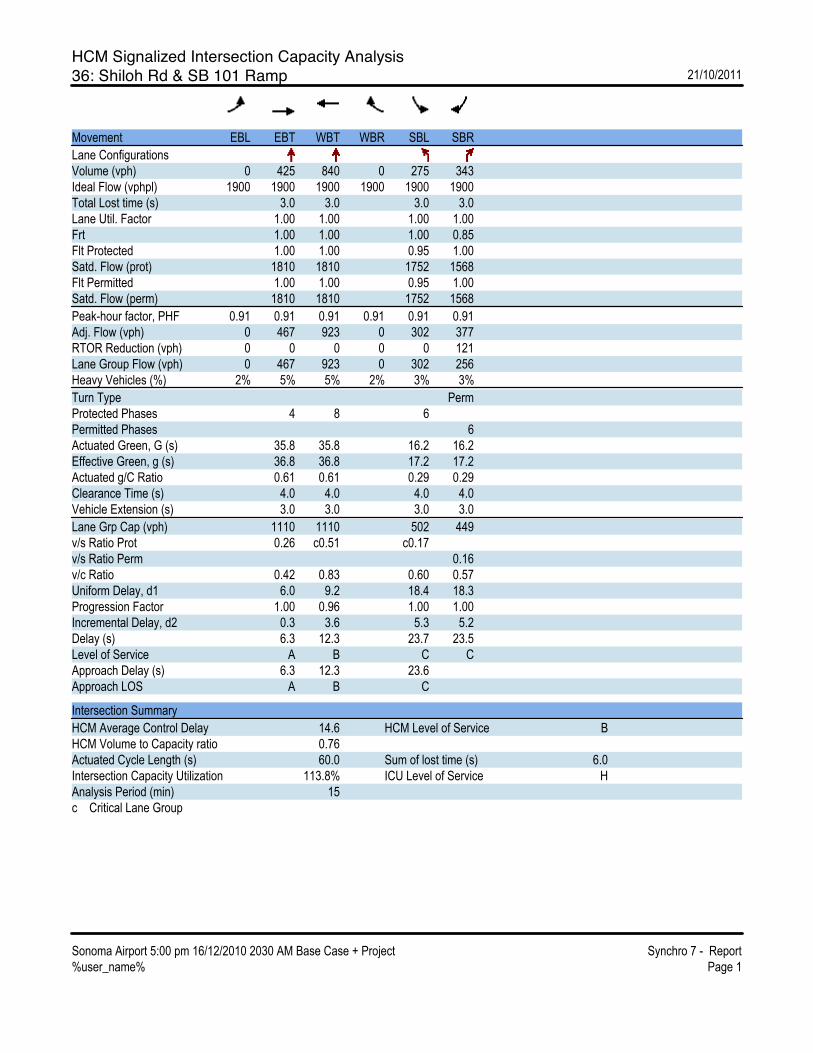
HCM Signalized Intersection Capacity Analysis36: Shiloh Rd & SB 101 Ramp 21/10/2011
Sonoma Airport 5:00 pm 16/12/2010 2030 AM Base Case + Project Synchro 7 - Report%user_name% Page 1
Movement EBL EBT WBT WBR SBL SBRLane ConfigurationsVolume (vph) 0 425 840 0 275 343Ideal Flow (vphpl) 1900 1900 1900 1900 1900 1900Total Lost time (s) 3.0 3.0 3.0 3.0Lane Util. Factor 1.00 1.00 1.00 1.00Frt 1.00 1.00 1.00 0.85Flt Protected 1.00 1.00 0.95 1.00Satd. Flow (prot) 1810 1810 1752 1568Flt Permitted 1.00 1.00 0.95 1.00Satd. Flow (perm) 1810 1810 1752 1568Peak-hour factor, PHF 0.91 0.91 0.91 0.91 0.91 0.91Adj. Flow (vph) 0 467 923 0 302 377RTOR Reduction (vph) 0 0 0 0 0 121Lane Group Flow (vph) 0 467 923 0 302 256Heavy Vehicles (%) 2% 5% 5% 2% 3% 3%Turn Type PermProtected Phases 4 8 6Permitted Phases 6Actuated Green, G (s) 35.8 35.8 16.2 16.2Effective Green, g (s) 36.8 36.8 17.2 17.2Actuated g/C Ratio 0.61 0.61 0.29 0.29Clearance Time (s) 4.0 4.0 4.0 4.0Vehicle Extension (s) 3.0 3.0 3.0 3.0Lane Grp Cap (vph) 1110 1110 502 449v/s Ratio Prot 0.26 c0.51 c0.17v/s Ratio Perm 0.16v/c Ratio 0.42 0.83 0.60 0.57Uniform Delay, d1 6.0 9.2 18.4 18.3Progression Factor 1.00 0.96 1.00 1.00Incremental Delay, d2 0.3 3.6 5.3 5.2Delay (s) 6.3 12.3 23.7 23.5Level of Service A B C CApproach Delay (s) 6.3 12.3 23.6Approach LOS A B C
Intersection SummaryHCM Average Control Delay 14.6 HCM Level of Service BHCM Volume to Capacity ratio 0.76Actuated Cycle Length (s) 60.0 Sum of lost time (s) 6.0Intersection Capacity Utilization 113.8% ICU Level of Service HAnalysis Period (min) 15c Critical Lane Group
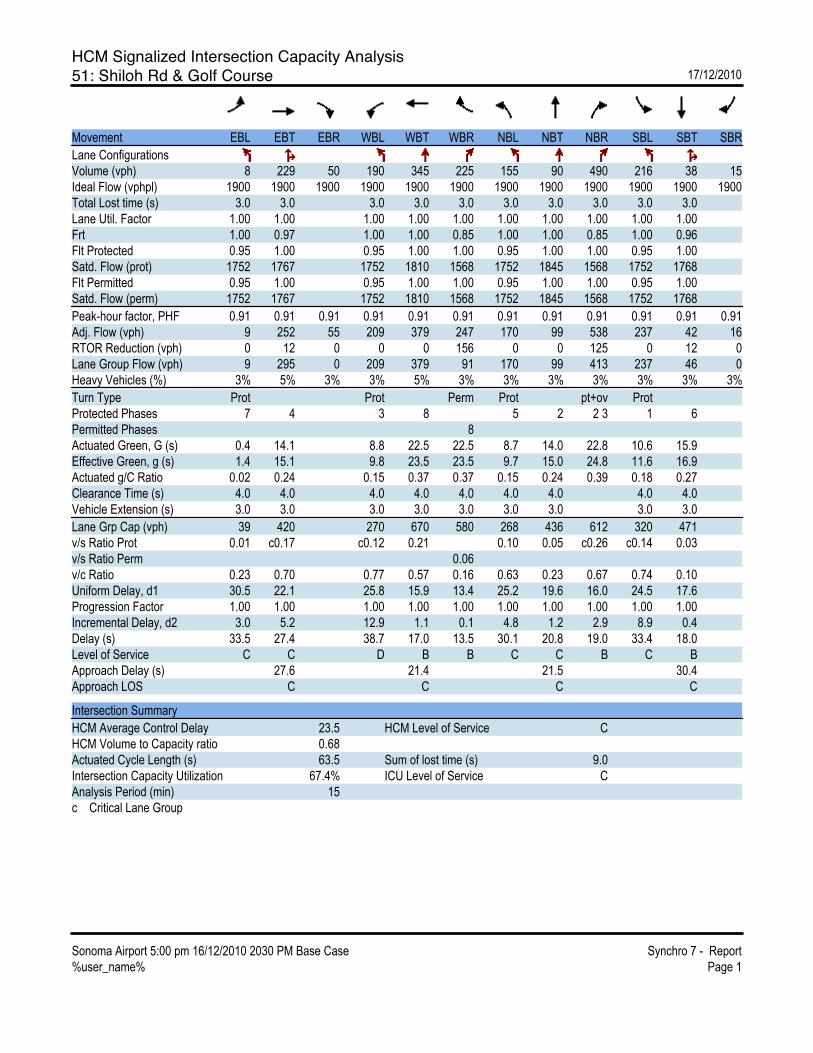
HCM Signalized Intersection Capacity Analysis51: Shiloh Rd & Golf Course 17/12/2010
Sonoma Airport 5:00 pm 16/12/2010 2030 PM Base Case Synchro 7 - Report%user_name% Page 1
Movement EBL EBT EBR WBL WBT WBR NBL NBT NBR SBL SBT SBRLane ConfigurationsVolume (vph) 8 229 50 190 345 225 155 90 490 216 38 15Ideal Flow (vphpl) 1900 1900 1900 1900 1900 1900 1900 1900 1900 1900 1900 1900Total Lost time (s) 3.0 3.0 3.0 3.0 3.0 3.0 3.0 3.0 3.0 3.0Lane Util. Factor 1.00 1.00 1.00 1.00 1.00 1.00 1.00 1.00 1.00 1.00Frt 1.00 0.97 1.00 1.00 0.85 1.00 1.00 0.85 1.00 0.96Flt Protected 0.95 1.00 0.95 1.00 1.00 0.95 1.00 1.00 0.95 1.00Satd. Flow (prot) 1752 1767 1752 1810 1568 1752 1845 1568 1752 1768Flt Permitted 0.95 1.00 0.95 1.00 1.00 0.95 1.00 1.00 0.95 1.00Satd. Flow (perm) 1752 1767 1752 1810 1568 1752 1845 1568 1752 1768Peak-hour factor, PHF 0.91 0.91 0.91 0.91 0.91 0.91 0.91 0.91 0.91 0.91 0.91 0.91Adj. Flow (vph) 9 252 55 209 379 247 170 99 538 237 42 16RTOR Reduction (vph) 0 12 0 0 0 156 0 0 125 0 12 0Lane Group Flow (vph) 9 295 0 209 379 91 170 99 413 237 46 0Heavy Vehicles (%) 3% 5% 3% 3% 5% 3% 3% 3% 3% 3% 3% 3%Turn Type Prot Prot Perm Prot pt+ov ProtProtected Phases 7 4 3 8 5 2 2 3 1 6Permitted Phases 8Actuated Green, G (s) 0.4 14.1 8.8 22.5 22.5 8.7 14.0 22.8 10.6 15.9Effective Green, g (s) 1.4 15.1 9.8 23.5 23.5 9.7 15.0 24.8 11.6 16.9Actuated g/C Ratio 0.02 0.24 0.15 0.37 0.37 0.15 0.24 0.39 0.18 0.27Clearance Time (s) 4.0 4.0 4.0 4.0 4.0 4.0 4.0 4.0 4.0Vehicle Extension (s) 3.0 3.0 3.0 3.0 3.0 3.0 3.0 3.0 3.0Lane Grp Cap (vph) 39 420 270 670 580 268 436 612 320 471v/s Ratio Prot 0.01 c0.17 c0.12 0.21 0.10 0.05 c0.26 c0.14 0.03v/s Ratio Perm 0.06v/c Ratio 0.23 0.70 0.77 0.57 0.16 0.63 0.23 0.67 0.74 0.10Uniform Delay, d1 30.5 22.1 25.8 15.9 13.4 25.2 19.6 16.0 24.5 17.6Progression Factor 1.00 1.00 1.00 1.00 1.00 1.00 1.00 1.00 1.00 1.00Incremental Delay, d2 3.0 5.2 12.9 1.1 0.1 4.8 1.2 2.9 8.9 0.4Delay (s) 33.5 27.4 38.7 17.0 13.5 30.1 20.8 19.0 33.4 18.0Level of Service C C D B B C C B C BApproach Delay (s) 27.6 21.4 21.5 30.4Approach LOS C C C C
Intersection SummaryHCM Average Control Delay 23.5 HCM Level of Service CHCM Volume to Capacity ratio 0.68Actuated Cycle Length (s) 63.5 Sum of lost time (s) 9.0Intersection Capacity Utilization 67.4% ICU Level of Service CAnalysis Period (min) 15c Critical Lane Group

HCM Signalized Intersection Capacity Analysis51: Shiloh Rd & Golf Course 17/12/2010
Sonoma Airport 5:00 pm 16/12/2010 2030 PM Base Case + Project Synchro 7 - Report%user_name% Page 1
Movement EBL EBT EBR WBL WBT WBR NBL NBT NBR SBL SBT SBRLane ConfigurationsVolume (vph) 8 225 57 203 343 224 168 91 527 215 42 15Ideal Flow (vphpl) 1900 1900 1900 1900 1900 1900 1900 1900 1900 1900 1900 1900Total Lost time (s) 3.0 3.0 3.0 3.0 3.0 3.0 3.0 3.0 3.0 3.0Lane Util. Factor 1.00 1.00 1.00 1.00 1.00 1.00 1.00 1.00 1.00 1.00Frt 1.00 0.97 1.00 1.00 0.85 1.00 1.00 0.85 1.00 0.96Flt Protected 0.95 1.00 0.95 1.00 1.00 0.95 1.00 1.00 0.95 1.00Satd. Flow (prot) 1752 1761 1752 1810 1568 1752 1845 1568 1752 1773Flt Permitted 0.95 1.00 0.95 1.00 1.00 0.95 1.00 1.00 0.95 1.00Satd. Flow (perm) 1752 1761 1752 1810 1568 1752 1845 1568 1752 1773Peak-hour factor, PHF 0.91 0.91 0.91 0.91 0.91 0.91 0.91 0.91 0.91 0.91 0.91 0.91Adj. Flow (vph) 9 247 63 223 377 246 185 100 579 236 46 16RTOR Reduction (vph) 0 14 0 0 0 153 0 0 127 0 12 0Lane Group Flow (vph) 9 296 0 223 377 93 185 100 452 236 50 0Heavy Vehicles (%) 3% 5% 3% 3% 5% 3% 3% 3% 3% 3% 3% 3%Turn Type Prot Prot Perm Prot pt+ov ProtProtected Phases 7 4 3 8 5 2 2 3 1 6Permitted Phases 8Actuated Green, G (s) 0.4 14.1 8.9 22.6 22.6 10.7 14.0 22.9 9.7 13.0Effective Green, g (s) 1.4 15.1 9.9 23.6 23.6 11.7 15.0 24.9 10.7 14.0Actuated g/C Ratio 0.02 0.24 0.16 0.38 0.38 0.19 0.24 0.40 0.17 0.22Clearance Time (s) 4.0 4.0 4.0 4.0 4.0 4.0 4.0 4.0 4.0Vehicle Extension (s) 3.0 3.0 3.0 3.0 3.0 3.0 3.0 3.0 3.0Lane Grp Cap (vph) 39 424 277 681 590 327 441 623 299 396v/s Ratio Prot 0.01 c0.17 c0.13 0.21 0.11 0.05 c0.29 c0.13 0.03v/s Ratio Perm 0.06v/c Ratio 0.23 0.70 0.81 0.55 0.16 0.57 0.23 0.73 0.79 0.13Uniform Delay, d1 30.1 21.7 25.5 15.4 13.0 23.2 19.2 16.0 24.9 19.5Progression Factor 1.00 1.00 1.00 1.00 1.00 1.00 1.00 1.00 1.00 1.00Incremental Delay, d2 3.0 4.9 15.5 1.0 0.1 2.2 1.2 4.2 12.9 0.6Delay (s) 33.1 26.7 41.0 16.4 13.1 25.4 20.4 20.2 37.9 20.1Level of Service C C D B B C C C D CApproach Delay (s) 26.8 21.9 21.4 34.2Approach LOS C C C C
Intersection SummaryHCM Average Control Delay 23.9 HCM Level of Service CHCM Volume to Capacity ratio 0.74Actuated Cycle Length (s) 62.7 Sum of lost time (s) 12.0Intersection Capacity Utilization 69.8% ICU Level of Service CAnalysis Period (min) 15c Critical Lane Group

HCM Signalized Intersection Capacity Analysis51: Shiloh Rd & Golf Course 17/12/2010
Sonoma Airport 5:00 pm 16/12/2010 2030 AM Base Case + Project Synchro 7 - Report%user_name% Page 1
Movement EBL EBT EBR WBL WBT WBR NBL NBT NBR SBL SBT SBRLane ConfigurationsVolume (vph) 9 374 151 558 180 100 126 75 190 270 23 5Ideal Flow (vphpl) 1900 1900 1900 1900 1900 1900 1900 1900 1900 1900 1900 1900Total Lost time (s) 3.0 3.0 3.0 3.0 3.0 3.0 3.0 3.0 3.0 3.0Lane Util. Factor 1.00 1.00 1.00 1.00 1.00 1.00 1.00 1.00 1.00 1.00Frt 1.00 0.96 1.00 1.00 0.85 1.00 1.00 0.85 1.00 0.97Flt Protected 0.95 1.00 0.95 1.00 1.00 0.95 1.00 1.00 0.95 1.00Satd. Flow (prot) 1752 1741 1752 1810 1568 1752 1845 1568 1752 1799Flt Permitted 0.95 1.00 0.95 1.00 1.00 0.95 1.00 1.00 0.95 1.00Satd. Flow (perm) 1752 1741 1752 1810 1568 1752 1845 1568 1752 1799Peak-hour factor, PHF 0.91 0.91 0.91 0.91 0.91 0.91 0.91 0.91 0.91 0.91 0.91 0.91Adj. Flow (vph) 10 411 166 613 198 110 138 82 209 297 25 5RTOR Reduction (vph) 0 12 0 0 0 38 0 0 96 0 5 0Lane Group Flow (vph) 10 565 0 613 198 72 138 82 113 297 25 0Heavy Vehicles (%) 3% 5% 3% 3% 5% 3% 3% 3% 3% 3% 3% 3%Turn Type Prot Prot Perm Prot pt+ov ProtProtected Phases 7 4 3 8 5 2 2 3 1 6Permitted Phases 8Actuated Green, G (s) 0.4 39.2 41.0 79.8 79.8 16.0 8.0 49.0 19.0 11.0Effective Green, g (s) 1.4 40.2 42.0 80.8 80.8 17.0 9.0 51.0 20.0 12.0Actuated g/C Ratio 0.01 0.33 0.34 0.66 0.66 0.14 0.07 0.41 0.16 0.10Clearance Time (s) 4.0 4.0 4.0 4.0 4.0 4.0 4.0 4.0 4.0Vehicle Extension (s) 3.0 3.0 3.0 3.0 3.0 3.0 3.0 3.0 3.0Lane Grp Cap (vph) 20 568 597 1187 1028 242 135 649 284 175v/s Ratio Prot 0.01 c0.32 c0.35 0.11 0.08 c0.04 0.07 c0.17 0.01v/s Ratio Perm 0.05v/c Ratio 0.50 0.99 1.03 0.17 0.07 0.57 0.61 0.17 1.05 0.15Uniform Delay, d1 60.6 41.4 40.6 8.2 7.6 49.7 55.4 22.8 51.6 50.9Progression Factor 1.00 1.00 1.00 1.00 1.00 1.00 1.00 1.00 1.00 1.00Incremental Delay, d2 18.3 36.1 43.8 0.1 0.0 3.2 18.7 0.1 65.9 1.7Delay (s) 78.9 77.5 84.4 8.3 7.7 52.9 74.0 22.9 117.5 52.7Level of Service E E F A A D E C F DApproach Delay (s) 77.6 58.9 42.3 111.5Approach LOS E E D F
Intersection SummaryHCM Average Control Delay 68.2 HCM Level of Service EHCM Volume to Capacity ratio 0.98Actuated Cycle Length (s) 123.2 Sum of lost time (s) 12.0Intersection Capacity Utilization 91.4% ICU Level of Service FAnalysis Period (min) 15c Critical Lane Group