hcmc cbd market report | jan 2014
TRANSCRIPT

JANUARY 2014 | HCMC CENTRAL BUSINESS DISTRICT
CBD MARKET REpoRTHO CHI MINH CITY
www.colliers.com/vietnam

TABLE oF CoNTENTSHCMC CBD MARKET REpoRT | JANUARY 2014
Market Highlights
oFFICE MARKET
• Market overview
• Market performance
• outlook
• Table
RETAIL MARKET
• Market overview
• Market performance
• outlook
• Table
HoTEL MARKET
• Market overview
• Market performance
• outlook
• Table
SERVICED ApARTMENT
• Market performance
• outlook
• Table
CoNTACTS
page
2-4
2
3
3
4
4-5
4
4
5
6
8-10
7
7
8
6
8-9
8
9
9
10
. . . . . . . . . . . . . . . . . . . . . . . . . . . . . . . . . . . . . . . . . . . . . . . . . . . . . . . . . . . . . . . .
. . . . . . . . . . . . . . . . . . . . . . . . . . . . . . . . . . . . . . . . . . . . . . . . . . . . . . . . . . . . . . .
. . . . . . . . . . . . . . . . . . . . . . . . . . . . . . . . . . . . . . . . . . . . . . . . . . . . . . . . . . . . . . .
. . . . . . . . . . . . . . . . . . . . . . . . . . . . . . . . . . . . . . . . . . . . . . . . . . . . . . . . . . . . . . .
. . . . . . . . . . . . . . . . . . . . . . . . . . . . . . . . . . . . . . . . . . . . . . . . . . . . . . . . . . . . . . .
. . . . . . . . . . . . . . . . . . . . . . . . . . . . . . . . . . . . . . . . . . . . . . . . . . . . . . . . . . . . . . .
. . . . . . . . . . . . . . . . . . . . . . . . . . . . . . . . . . . . . . . . . . . . . . . . . . . . . . . . . . . . . . .
. . . . . . . . . . . . . . . . . . . . . . . . . . . . . . . . . . . . . . . . . . . . . . . . . . . . . . . . . . . . . . .
. . . . . . . . . . . . . . . . . . . . . . . . . . . . . . . . . . . . . . . . . . . . . . . . . . . . . . . . . . . . . . .
. . . . . . . . . . . . . . . . . . . . . . . . . . . . . . . . . . . . . . . . . . . . . . . . . . . . . . . . . . . . . . .
. . . . . . . . . . . . . . . . . . . . . . . . . . . . . . . . . . . . . . . . . . . . . . . . . . . . . . . . . . . . . . .
. . . . . . . . . . . . . . . . . . . . . . . . . . . . . . . . . . . . . . . . . . . . . . . . . . . . . . . . . . . . . . .
. . . . . . . . . . . . . . . . . . . . . . . . . . . . . . . . . . . . . . . . . . . . . . . . . . . . . . . . . . . . . . .
. . . . . . . . . . . . . . . . . . . . . . . . . . . . . . . . . . . . . . . . . . . . . . . . . . . . . . . . . . . . . . .
. . . . . . . . . . . . . . . . . . . . . . . . . . . . . . . . . . . . . . . . . . . . . . . . . . . . . . . . . . . . . . .
. . . . . . . . . . . . . . . . . . . . . . . . . . . . . . . . . . . . . . . . . . . . . . . . . . . . . . . . . . . . . . .
. . . . . . . . . . . . . . . . . . . . . . . . . . . . . . . . . . . . . . . . . . . . . . . . . . . . . . . . . . . . . . .
. . . . . . . . . . . . . . . . . . . . . . . . . . . . . . . . . . . . . . . . . . . . . . . . . . . . . . . . . . . . . . .
. . . . . . . . . . . . . . . . . . . . . . . . . . . . . . . . . . . . . . . . . . . . . . . . . . . . . . . . . . . . . . .
. . . . . . . . . . . . . . . . . . . . . . . . . . . . . . . . . . . . . . . . . . . . . . . . . . . . . . . . . . . . . . .

Ho Chi Minh City made a breakthrough in Foreign Direct
Investment (FDI) figure in 2013, reflecting efforts of the local
authorities in improving the city’s investment environment
and obtaining investor’s interests. According to the HCMC
Statistical office, FDI has recovered strongly to achieve
US$963.1 million from 440 approved projects in the last 12
months; in which a surge in both number and value of projects
from Japanese investors.
In 2013, HCMC, Vietnam’s economic and business hub,
witnessed the closure of 20,585 existing companies due to
economic crisis. But concurrently, 25,349 new businesses had
been established, an increase of 7% y-o-y that reflects resume
of balance in enterprise numbers . From January 2014, the
city encourages to register online for business operation in
order to enhance capacity and convenience of administrative
procedures.
Last year, the city inflation rate rose 1.13% y-o-y to reach 5.2%
although the local officials claimed it is still in control. In fact,
this rate is lower than that of many other cities and provinces
with average figure at 6%.
p.1 | Colliers International
HCMC CBD MARKET REpoRTJANUARY 2014
Economic Overview
Source: Statistical Office in HCMC, Colliers International
FDI IN HCMC BY SECToRS, DECEMBER 2013
FDI IN HCMC BY MoNTH, DECEMBER 2013
Source: Statistical Office in HCMC, Colliers International
Source: Statistical Office in HCMC, Colliers International
FDI IN HCMC BY CoUNTRY, DECEMBER 2013
Source: Statistical Office in HCMC, Colliers International
FDI IN VIETNAM BY pRoNVINCE, 2013

HCMC CBD MARKET REpoRT
JANUARY 2014 | COMMERCIAL OFFICE MARKET
p.2 | Colliers International
In December, the monthly average Grade A commercial
office asking rent remained stable at US$38.2 per sq m.
occupancy rates in this segment also increased slightly to
reach 91%, a rise of 0.8% m-o-m.
Similarly, last month indicated positive signs for landlords
in Grade B office buildings in HCMC with increase in both
average rents and absorb rate indicating effective leasing
strategies from landlords. Flexible offered rates and building
functional convertion provided good results in apparent
case studies.
Maersk accquired approximately 2,800 sq m. in Zen plaza
(District 1) where retail and F&B areas had just been
converted to office spaces and pico plaza also welcomed
prudential CFC as new tenants.
Financial services and auditing firms were major sources
of office leasing enquiries and deals while relocation was
dominated trend of December.
RECENT TRANSACTIoNS
BUILDING LEASE (L) / SALE (S) TENANT / pURCHASER AREA (sq m.)
Zen plaza L Maersk 2,856pico plaza L prudential CFC 1,691Lim Tower L ASWIG 730
OutlookGrade A office segment will continue as it ended the year with
increase in occupancy rate and stable rentals.
Limited supply of premium developments is a competitive
advantage for Grade A developers to gradually bring up the
rents. Likewise, occupancy rate of current buildings maintains
growing trend from relocation demands of financial firms.
The year ahead is time to adjust rental strategy of Grade B pro-
jects as well. Those with constant taken spaces are trying to fix
the rate to secure tenants while others keep struggling to fulfil
large vacant areas by flexible rents.
Market Performance
oCCUpANCY RATE BY GRADE, DECEMBER 2013
Source: Colliers International
GRADE A pERFoRMANCE
Source: Colliers International
ZEN pLAZA
Source: Public Domain
HCMC CBD MARKET REpoRT
JANUARY 2014 | COMMERCIAL OFFICE MARKET
p.3 | Colliers International
HCMC CBD MARKET REpoRT
JANUARY 2014 | COMMERCIAL OFFICE MARKET
No Name AddressCom-pletion Year
NLA (sq m)
Service Charges (*)
occupancy rate
NFA asking rent (*)
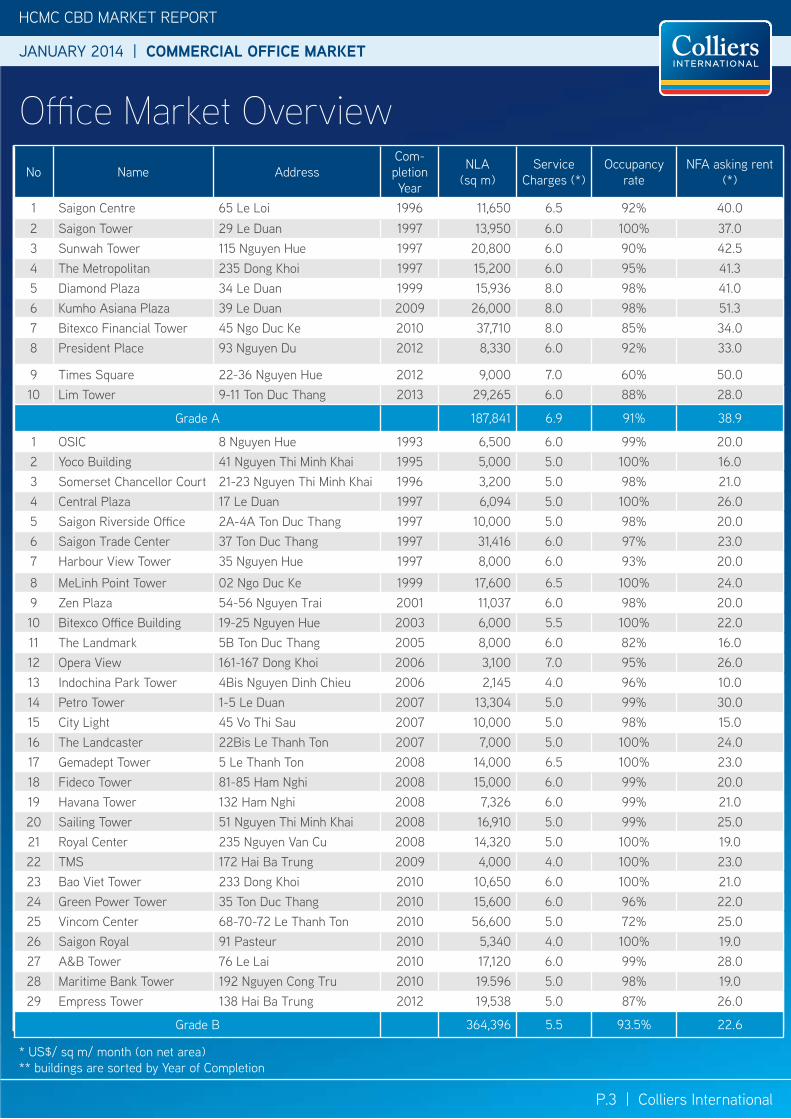
1 Saigon Centre 65 Le Loi 1996 11,650 6.5 92% 40.02 Saigon Tower 29 Le Duan 1997 13,950 6.0 100% 37.03 Sunwah Tower 115 Nguyen Hue 1997 20,800 6.0 90% 42.54 The Metropolitan 235 Dong Khoi 1997 15,200 6.0 95% 41.35 Diamond plaza 34 Le Duan 1999 15,936 8.0 98% 41.06 Kumho Asiana plaza 39 Le Duan 2009 26,000 8.0 98% 51.37 Bitexco Financial Tower 45 Ngo Duc Ke 2010 37,710 8.0 85% 34.08 president place 93 Nguyen Du 2012 8,330 6.0 92% 33.0
9 Times Square 22-36 Nguyen Hue 2012 9,000 7.0 60% 50.010 Lim Tower 9-11 Ton Duc Thang 2013 29,265 6.0 88% 28.0
Grade A 187,841 6.9 91% 38.9
1 oSIC 8 Nguyen Hue 1993 6,500 6.0 99% 20.02 Yoco Building 41 Nguyen Thi Minh Khai 1995 5,000 5.0 100% 16.03 Somerset Chancellor Court 21-23 Nguyen Thi Minh Khai 1996 3,200 5.0 98% 21.04 Central plaza 17 Le Duan 1997 6,094 5.0 100% 26.05 Saigon Riverside office 2A-4A Ton Duc Thang 1997 10,000 5.0 98% 20.06 Saigon Trade Center 37 Ton Duc Thang 1997 31,416 6.0 97% 23.07 Harbour View Tower 35 Nguyen Hue 1997 8,000 6.0 93% 20.0
8 MeLinh point Tower 02 Ngo Duc Ke 1999 17,600 6.5 100% 24.09 Zen plaza 54-56 Nguyen Trai 2001 11,037 6.0 98% 20.010 Bitexco office Building 19-25 Nguyen Hue 2003 6,000 5.5 100% 22.011 The Landmark 5B Ton Duc Thang 2005 8,000 6.0 82% 16.012 opera View 161-167 Dong Khoi 2006 3,100 7.0 95% 26.013 Indochina park Tower 4Bis Nguyen Dinh Chieu 2006 2,145 4.0 96% 10.014 petro Tower 1-5 Le Duan 2007 13,304 5.0 99% 30.015 City Light 45 Vo Thi Sau 2007 10,000 5.0 98% 15.016 The Landcaster 22Bis Le Thanh Ton 2007 7,000 5.0 100% 24.017 Gemadept Tower 5 Le Thanh Ton 2008 14,000 6.5 100% 23.018 Fideco Tower 81-85 Ham Nghi 2008 15,000 6.0 99% 20.019 Havana Tower 132 Ham Nghi 2008 7,326 6.0 99% 21.020 Sailing Tower 51 Nguyen Thi Minh Khai 2008 16,910 5.0 99% 25.021 Royal Center 235 Nguyen Van Cu 2008 14,320 5.0 100% 19.022 TMS 172 Hai Ba Trung 2009 4,000 4.0 100% 23.023 Bao Viet Tower 233 Dong Khoi 2010 10,650 6.0 100% 21.024 Green power Tower 35 Ton Duc Thang 2010 15,600 6.0 96% 22.025 Vincom Center 68-70-72 Le Thanh Ton 2010 56,600 5.0 72% 25.026 Saigon Royal 91 pasteur 2010 5,340 4.0 100% 19.027 A&B Tower 76 Le Lai 2010 17,120 6.0 99% 28.028 Maritime Bank Tower 192 Nguyen Cong Tru 2010 19.596 5.0 98% 19.029 Empress Tower 138 Hai Ba Trung 2012 19,538 5.0 87% 26.0
Grade B 364,396 5.5 93.5% 22.6
* US$/ sq m/ month (on net area)** buildings are sorted by Year of Completion
Office Market Overview

HCMC CBD MARKET REpoRT
JANUARY 2014 | RETAIL MARKET
HCMC CBD MARKET REpoRT
JANUARY 2014 | RETAIL MARKET
Reported by the City Statistics office, in 2013 Ho Chi Minh City’s
total retail sales and service revenues reached VND606,978.9
billion, a gain of 12.6% y-o-y. The revenue growth, however, was
at the lowest rate in the last five years, which are 19%, 27.9%,
23.5%, and 17.3% in 2009, 2010, 2011, and 2012 respectively. The
slow pace of this year’s retail sales resulted from low domestic
demand as customers have curbed spending except for essential
goods and services.
Many enterprises in the retail sector postponed potential business
expansion plans because of major obstacles including capital
shortage, reducing high volume of inventory, and the increasing
cost of raw materials.
The HCMC’s statistical figures showed that CpI climb by 0.39%
against the previous month in December. Given an increase
in price of gas at the beginning of last month, the index of the
housing, electricity, fuel and construction materials group posted
the highest rise by 2.91% over November.
p.4 | Colliers International
Retail Market Overview
Retail podiums and department stores located in CBD showed
the movement in average asking rents given high secured taken
areas. occupancy rate of retail podiums last month gained 2.5%
month-on-month to achieve 87.7%, mostly from new take-up
at New World Hotel and Bitexco Financial Tower. premium
department stores in city centre still enjoy high occupancy
figures.
In December, a slight drop of 2.5% in average rentals of CBD
shopping centers helped the landlords to stall vacancy rate at
25% and maintain tenants. Despite of moderate adjustment, it
showed efforts of the retail podium developers in softening rents
in order to prevent high turnover rate from tenants recently.
while other individual premium sites maintain high asking rents.
During last month, parkson inaugurated its 9th department store
in Vietnam at Cantavil premier project in District 2. The 18,000
sq m. retail spaces on 6 floors target customers in District 2
and the surrounding areas.
Lotte Cinema at Cantavil premier opened in the middle of
December while BigC supermarket will commence operations
early 2014.
Market Performance
FIRST AEoN SHoppING MALL IN VIETNAM
opening in 1st January at Tan phu District
RETAIL poDIUM @ BITEXCo FINANCIAL ToWER
Source: Colliers International
9th pARKSoN DEpARTMENT SToRE @ CANTAVIL pREMIER
Source: Colliers International
Source: Public Domain
Showed increase in tenants in December 2013
opened in December 2013

HCMC CBD MARKET REpoRT
JANUARY 2014 | RETAIL MARKET
HCMC CBD MARKET REpoRT
JANUARY 2014 | RETAIL MARKET
p.5 | Colliers International
Year End Sale off and promotion programs attracted significant
foot fall to retail malls last month. This trend is expected to
last till the end of January.
In general, without discount events, sales revenue of retail
segment has suffered a slump throughout the year. Domestic
demand for services and products remains low given uncertain
condition and unclear foresight of the economy.
Nevertheless, landlords of CBD retail developments keen on
holding high rental rates highlighting limited supply in coming
months.
There is a big gap between high asking rents and affordability
of tenants in the existing market. Although owners of shopping
malls within CBD make some adjustment in rental policy, they
need to show more good will to forestall turnover trend of
retail lessees and tenancy default.
on the New Year Day, Japanese retail developer Aeon opened
the first shopping mall, named Aeon Tan phu Celadon, in Tan
phu District, HCMC with a total floor space of 50,000 sq m.
The megamall came together with 23,000 sq m. of general
merchandise stores business section under the operation of
almost 2,000 staffs. one-third of the goods and products at
the mall are imported from Japan while another third are local
products. During this year, the market also expects a stream
of new shopping areas in suburban areas including Thao Dien
pearl and Saigon Airport plaza.
Outlook
CpI RETAIL & SERVICES REVENUE
SHoppING CENTRE
Source: Colliers International
RETAIL SALES REVENUE BY SECToRS
Source: Colliers International
Source: Colliers International
RETAIL poDIUM
Source: Colliers International
KUMHo MoNTHLY MARKET REpoRTJANUARY 2014 | RETAIL MARKET HCMC CBD MARKET REPORT
p.6 | Colliers International
No Name of project /Building Address Location Comple-
tion YearNLA
(sq m)Average Rental
(US$/sq m/month) occupancy Rate
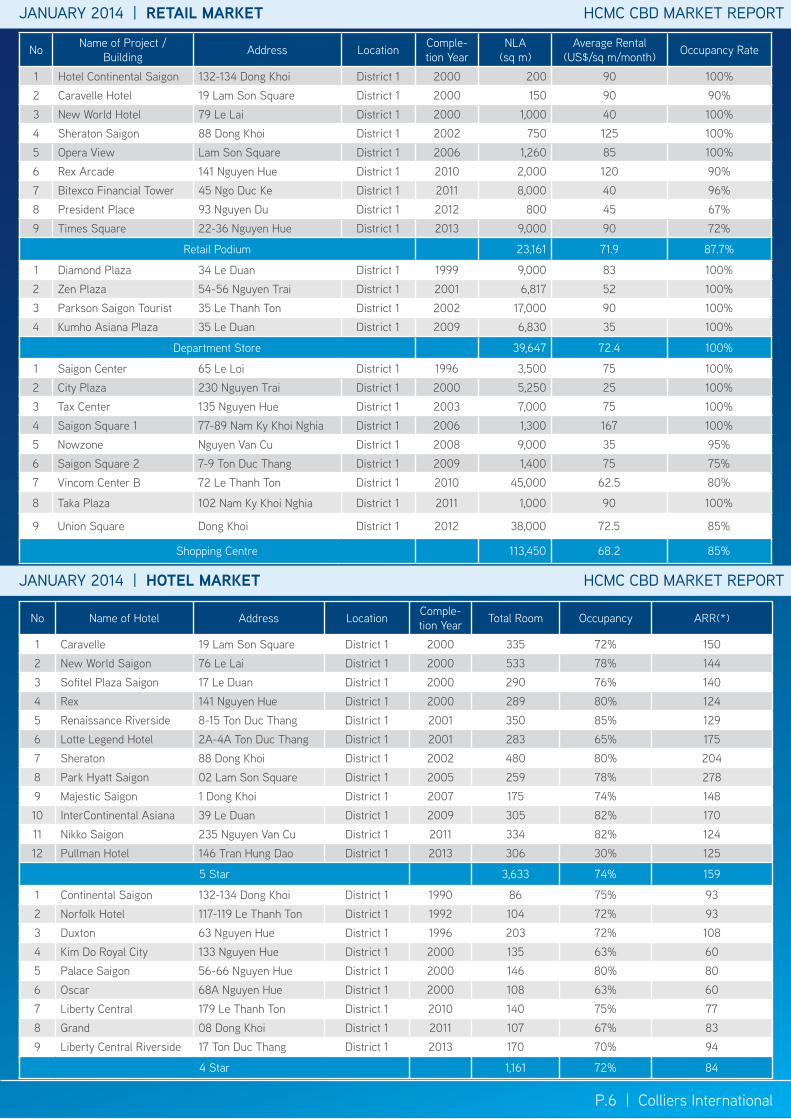
1 Hotel Continental Saigon 132-134 Dong Khoi District 1 2000 200 90 100%2 Caravelle Hotel 19 Lam Son Square District 1 2000 150 90 90%3 New World Hotel 79 Le Lai District 1 2000 1,000 40 100%4 Sheraton Saigon 88 Dong Khoi District 1 2002 750 125 100%5 opera View Lam Son Square District 1 2006 1,260 85 100%6 Rex Arcade 141 Nguyen Hue District 1 2010 2,000 120 90%7 Bitexco Financial Tower 45 Ngo Duc Ke District 1 2011 8,000 40 96%8 president place 93 Nguyen Du District 1 2012 800 45 67%9 Times Square 22-36 Nguyen Hue District 1 2013 9,000 90 72%
Retail podium 23,161 71.9 87.7%
1 Diamond plaza 34 Le Duan District 1 1999 9,000 83 100%2 Zen plaza 54-56 Nguyen Trai District 1 2001 6,817 52 100%3 parkson Saigon Tourist 35 Le Thanh Ton District 1 2002 17,000 90 100%4 Kumho Asiana plaza 35 Le Duan District 1 2009 6,830 35 100%
Department Store 39,647 72.4 100%
1 Saigon Center 65 Le Loi District 1 1996 3,500 75 100%2 City plaza 230 Nguyen Trai District 1 2000 5,250 25 100%3 Tax Center 135 Nguyen Hue District 1 2003 7,000 75 100%4 Saigon Square 1 77-89 Nam Ky Khoi Nghia District 1 2006 1,300 167 100%5 Nowzone Nguyen Van Cu District 1 2008 9,000 35 95%6 Saigon Square 2 7-9 Ton Duc Thang District 1 2009 1,400 75 75%7 Vincom Center B 72 Le Thanh Ton District 1 2010 45,000 62.5 80%
8 Taka plaza 102 Nam Ky Khoi Nghia District 1 2011 1,000 90 100%
9 Union Square Dong Khoi District 1 2012 38,000 72.5 85%
Shopping Centre 113,450 68.2 85%
No Name of Hotel Address Location Comple-tion Year Total Room occupancy ARR(*)
1 Caravelle 19 Lam Son Square District 1 2000 335 72% 1502 New World Saigon 76 Le Lai District 1 2000 533 78% 1443 Sofitel plaza Saigon 17 Le Duan District 1 2000 290 76% 1404 Rex 141 Nguyen Hue District 1 2000 289 80% 1245 Renaissance Riverside 8-15 Ton Duc Thang District 1 2001 350 85% 1296 Lotte Legend Hotel 2A-4A Ton Duc Thang District 1 2001 283 65% 1757 Sheraton 88 Dong Khoi District 1 2002 480 80% 2048 park Hyatt Saigon 02 Lam Son Square District 1 2005 259 78% 2789 Majestic Saigon 1 Dong Khoi District 1 2007 175 74% 14810 InterContinental Asiana 39 Le Duan District 1 2009 305 82% 17011 Nikko Saigon 235 Nguyen Van Cu District 1 2011 334 82% 12412 pullman Hotel 146 Tran Hung Dao District 1 2013 306 30% 125
5 Star 3,633 74% 159
1 Continental Saigon 132-134 Dong Khoi District 1 1990 86 75% 932 Norfolk Hotel 117-119 Le Thanh Ton District 1 1992 104 72% 933 Duxton 63 Nguyen Hue District 1 1996 203 72% 1084 Kim Do Royal City 133 Nguyen Hue District 1 2000 135 63% 605 palace Saigon 56-66 Nguyen Hue District 1 2000 146 80% 806 oscar 68A Nguyen Hue District 1 2000 108 63% 607 Liberty Central 179 Le Thanh Ton District 1 2010 140 75% 778 Grand 08 Dong Khoi District 1 2011 107 67% 839 Liberty Central Riverside 17 Ton Duc Thang District 1 2013 170 70% 94
4 Star 1,161 72% 84
JANUARY 2014 | HOTEL MARKET HCMC CBD MARKET REPORT

p.7 | Colliers International
HCMC CBD MARKET REpoRT
JANUARY 2014 | HOTEL MARKET
International tourist arrivals to HCMC increased 8.1% over the
same period in 2012 to an all-time high with more than 4.1
million so far this year. The number equals to 55% of total
international arrivals to Vietnam, according to the Statistical
office in HCMC.
Generally, the tourism sector made a revenue of VND81,970
billion, rising by 15% y-o-y, contributing 45% in total revenue
of national tourism.
Among international visitors to Vietnam in December, tourism
remained major purpose occurring more than half of total
number. Business travel moderately stayed second with one
third of the amount.
Hotel Market Overview
OutlookGenerally, 4- and 5-star hotels in HCMC have experienced
steady occupancy rate recently because of peak travel season.
Solid partnership with travel agencies provides reliable source
of guests for the top-tier hotels; especially tourists from Europe
who prefer luxury hospitality services.
Regarding new market supply, Le Meridien Saigon Hotel and
Reverie Times Square Hotel did not open as scheduled to catch
up holiday season. The Extension phase of Majestic Hotel is
still underway.
INTERNATIoNAL VISIToRS To HCMC
Source: Statistical Office in HCMC, Colliers International
INTERNATIoNAL ARRIVALS
Source: Statistical Office in HCMC, Colliers International
HoTEL REVENUE BY SERVICES
Source: Colliers International
KUMHo MoNTHLY MARKET REpoRT HCMC CBD MARKET REPORT
HCMC CBD MARKET REPORT
LE MERIDIEN HoTEL SLoWED IN CoNSTRUCTIoN
Source: Colliers International

HCMC CBD MARKET REpoRT
p.8 | Colliers International
HCMC CBD MARKET REpoRT
JANUARY 2014 | HOTEL MARKET
Although it is still tourist season, operators of 5-star hotels
generally made slight decrease on ARR to lift occupancy rate
4% m-o-m to reach 77% last month. pullman Saigon Centre,
Nikko Saigon and New World hotels statistically achieved highest
occupancy raise during December, mainly due to promotion and
new opening.
4-star hotels retained positive performance in both average room
rate (ARR) and occupancy rate. The ARR marked an increase of
5.8% m-o-m while occupancy rate gained to hit 72% in December.
In general, top-tier hotels in HCMC has been applying flexible
rates in order to maximise fulfilled rate.
Market Performance
pERFoRMANCE oF 4 STARS HoTEL
pERFoRMANCE oF 4 & 5 STARS HoTEL
pERFoRMANCE oF 5 STARS HoTEL
Source: Colliers International
Source: Colliers InternationalSource: Colliers International
JANUARY 2014 | SERVICED APARTMENT MARKET
JANUARY 2014 | SERVICED APARTMENT MARKET
Serviced Apartment OverviewGRADE A SERVICED ApARTMENTS
Source: Colliers International
GRADE B SERVICED ApARTMENTS
Source: Colliers International
p.9 | Colliers International
HCMC CBD MARKET REpoRTHCMC CBD MARKET REpoRT
JANUARY 2014 | HOTEL MARKET
No project Name Address Location Comple-tion Year
Total Room
Average occupancy ARR(*)
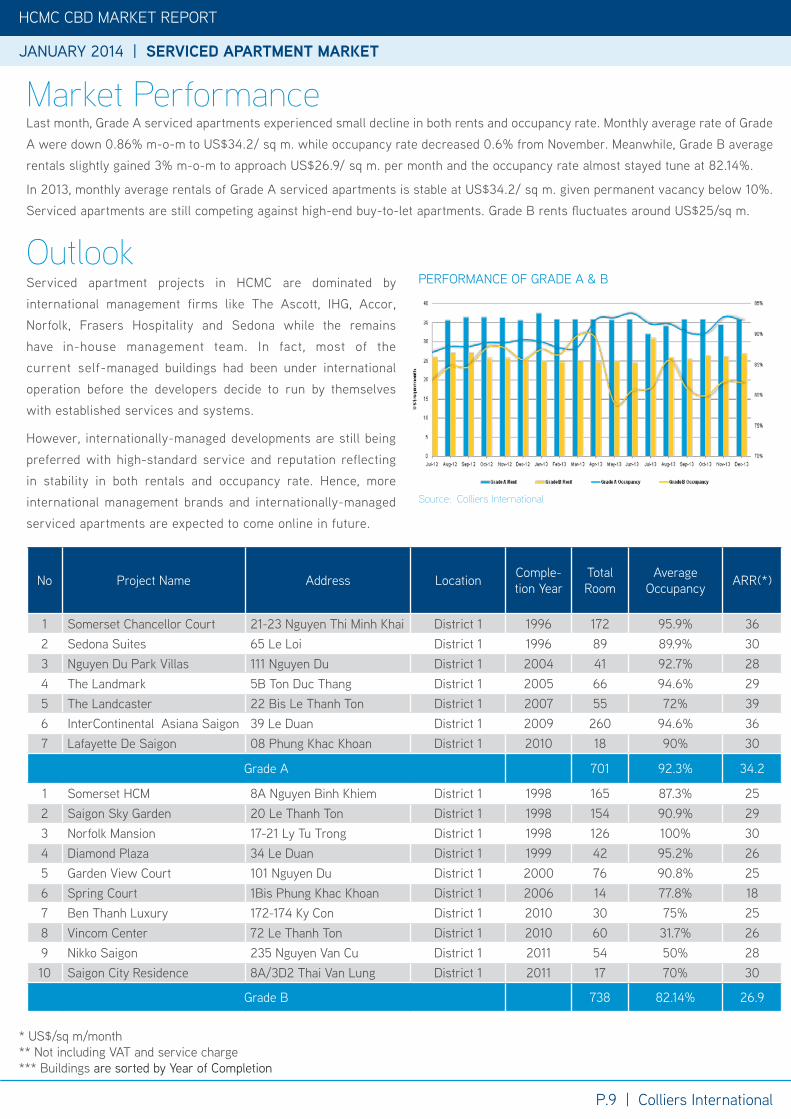
1 Somerset Chancellor Court 21-23 Nguyen Thi Minh Khai District 1 1996 172 95.9% 362 Sedona Suites 65 Le Loi District 1 1996 89 89.9% 303 Nguyen Du park Villas 111 Nguyen Du District 1 2004 41 92.7% 284 The Landmark 5B Ton Duc Thang District 1 2005 66 94.6% 295 The Landcaster 22 Bis Le Thanh Ton District 1 2007 55 72% 396 InterContinental Asiana Saigon 39 Le Duan District 1 2009 260 94.6% 367 Lafayette De Saigon 08 phung Khac Khoan District 1 2010 18 90% 30
Grade A 701 92.3% 34.2
1 Somerset HCM 8A Nguyen Binh Khiem District 1 1998 165 87.3% 252 Saigon Sky Garden 20 Le Thanh Ton District 1 1998 154 90.9% 293 Norfolk Mansion 17-21 Ly Tu Trong District 1 1998 126 100% 304 Diamond plaza 34 Le Duan District 1 1999 42 95.2% 265 Garden View Court 101 Nguyen Du District 1 2000 76 90.8% 256 Spring Court 1Bis phung Khac Khoan District 1 2006 14 77.8% 187 Ben Thanh Luxury 172-174 Ky Con District 1 2010 30 75% 258 Vincom Center 72 Le Thanh Ton District 1 2010 60 31.7% 269 Nikko Saigon 235 Nguyen Van Cu District 1 2011 54 50% 2810 Saigon City Residence 8A/3D2 Thai Van Lung District 1 2011 17 70% 30
Grade B 738 82.14% 26.9
* US$/sq m/month** Not including VAT and service charge*** Buildings are sorted by Year of Completion
JANUARY 2014 | SERVICED APARTMENT MARKET
Serviced apartment projects in HCMC are dominated by
international management firms like The Ascott, IHG, Accor,
Norfolk, Frasers Hospitality and Sedona while the remains
have in-house management team. In fact, most of the
current self-managed buildings had been under international
operation before the developers decide to run by themselves
with established services and systems.
However, internationally-managed developments are still being
preferred with high-standard service and reputation reflecting
in stability in both rentals and occupancy rate. Hence, more
international management brands and internationally-managed
serviced apartments are expected to come online in future.
Outlook
Last month, Grade A serviced apartments experienced small decline in both rents and occupancy rate. Monthly average rate of Grade
A were down 0.86% m-o-m to US$34.2/ sq m. while occupancy rate decreased 0.6% from November. Meanwhile, Grade B average
rentals slightly gained 3% m-o-m to approach US$26.9/ sq m. per month and the occupancy rate almost stayed tune at 82.14%.
In 2013, monthly average rentals of Grade A serviced apartments is stable at US$34.2/ sq m. given permanent vacancy below 10%.
Serviced apartments are still competing against high-end buy-to-let apartments. Grade B rents fluctuates around US$25/sq m.
Market Performance
pERFoRMANCE oF GRADE A & B
Source: Colliers International
JANUARY 2014 | SERVICED APARTMENT MARKET

HCMC CBD MARKET REPORT | JANUARY 2014
With more than 100 professionals in 2 offices in Vietnam, the team is market driven and has proven and successful track record with both international and local experience.
From Hanoi to Ho Chi Minh City, we provide a full range of real estate services
•Research > Market research across all sectors > Market analysis, advisory, and strategy
•Valuation & Advisory Services > Valuation for land, existing property or development sites > Feasibility studies to determine NPV, IRR and highest & best use
•Office Services > Tenant Representation > Landlord Representation
•Residential Sales & Leasing
•Retail Services
• Investment Services
•Real Estate Management Services
•Corporate Services
• Industrial Leasing
The foundation of our services is the strength and depth of our experience.
COLLIERS INTERNATIONAL
Ho CHI MINH CITYBitexco office Building, 7th Floor19-25 Nguyen Hue StreetDistrict 1, HCM City, VietnamTel: + 84 8 3827 5665
HANoICapital Tower, 10th Floor109 Tran Hung Dao Street, Hoan Kiem District, Hanoi, VietnamTel: +84 4 3941 3277
482 offices in62 countries on6 continentsUnited StatesCanadaLatin AmericaAsia pacificEMEA
Accelerating success
: 140: 42: 20: 195: 85
QUANG NGUYENResearch [email protected]+84 938 056 603
YEN NGUYENResearch [email protected]+84 915 478 778
About Colliers InternationalColliers International is a leader in global real estate services, defined by our spirit of enterprise.Through a culture of service excellence and a shared sense of initiative, we integrate the resources of real estate specialists worldwide to accelerate the success of our partners.
We connect through a shared set of values that shape a collaborative environment throughout our organization that is unsurpassed in the industry.
publication Coverage Frequency Content Availability
Research & Forecast Report
Vietnam Cities Quarterly All market sectors publicly available
CBD Report HCMC CBD Monthly office, Retail, Hotel and Serviced Apartment
publicly available
Asia pacific office Report
Asia pacific in-cluding Vietnam
Quarterly office market publicly available
Vietnam property Market Report
Vietnam cities Quarterly All market sectors on subscription
Development Recommendation
Vietnam cities At request All market sectors on subscription
$2billion in annual revenue
2.5billion square feet under management
13,500professionalsand staff
www.colliers.com/vietnam
Please contact, If you would like to recieve our other research reports
This document has been prepared by Colliers International for advertising and general information only. Colliers International makes no guarantees, representations or warranties of any kind, expressed or implied, regarding the information including, but not limited to, warranties of content, accuracy and reliability. Any interested party should undertake their own inquiries as to the accuracy of the information. Colliers International excludes unequivocally all inferred or implied terms, conditions and warranties arising out of this document and excludes all liability for loss and damages arising there from. This publication is the copyrighted property of Colliers International and/or its licensor(s). ©2013. All rights reserved.