hcpss 2013-2014 es capacity report 9_27_4_corrected per boe
TRANSCRIPT

Howard County Public School System 2013-2014 Elementary School Capacity Update
October 9, 2014
HCPSS Office of School Planning
Gilbert Architects Inc.
Bruce Gist, Acting Executive Director, Facilities Planning & Management
Danielle V. Hoffer, Vice President, Gilbert Architects
Joel A. Gallihue, AICP Manager of School Planning
Tim Rogers, Planning Analyst
Jennifer Bubenko, Planning Specialist
David O’Brochta, Graduate Student Intern
Jennifer Hopkins, Undergraduate Intern
Dan Ressler, ARL Student Intern
Katrina Hodge, ARL Student Intern

Howard County Public School System Gilbert Architects
HCPSS 2013‐14 Elementary School Capacity Update Page 2
Table of Contents
Executive Summary .................................................................................................................................. 3
Introduction ............................................................................................................................................... 3
Methodology .............................................................................................................................................. 4
Data Collection Process ............................................................................................................................ 5
Gross Capacity .......................................................................................................................................... 6
Undersized Classrooms ............................................................................................................................ 6
Accounting for Related Arts an Elective Programming ............................................................................. 7
Distributing New Capacity ......................................................................................................................... 9
Documentation of Report Findings
Individual School Narratives .......................................................................................................... 9
Elementary School Floor Plans (See separate 11x17 color packet) ........................................... 24
Table 1: One Page Capacity Summary ....................................................................................... 23
Tables 2-12: 2013-2014 Elementary School Capacity Summaries ....................................... 26-31
Regional and Specialized Programs ....................................................................................................... 32
HCPSS Official September 30, 2103 Enrollment Report ........................................................................ 33

Howard County Public School System Gilbert Architects
HCPSS 2013‐14 Elementary School Capacity Update Page 3
Executive Summary The purpose of this study is to calculate elementary school capacities to be used in capital budget planning, feasibility studies, and redistricting. This report updates the 2009 Elementary Facility Assessments by Gilbert Architects Inc. For the 2013-2014 school year, 41 Howard County elementary schools used 1,094 teaching stations to deliver the core elementary curriculum to 23,327 K-5 students. Additional space was used for related arts, gifted and talented, technology, and instrumental music classes. Other small spaces throughout each building were used for individual and small group instruction and regional programs. The study applied proven methodology through use of new technology to deliver an easy-to-update capacity analysis system. This methodology should be used to review and update school capacities following future additions or renovations. School year 2013-2014 room assignments were used as a starting point, and then adjusted to accommodate all required elementary program uses at approved staffing ratios. The result is a recommended capacity for each building. Capital planning and redistricting scenarios cannot depend upon temporary capacity; so all activities were accounted for in space within the buildings. This study is not designed to recommend a more efficient use of the floor plan to school administrators. Any administrator may adopt ideas from this report but it is assumed that their 2013-2014 room assignments reflected a reasonable use of each floor plan. The study follows approved HCPSS standards. The minimum classroom size of 660 square feet (SF) reflects the approved HCPSS Renovation Guidelines. Class size ratios of 22:1 for kindergarten, 19:1 for Grades 1-2, and 25:1 for Grades 3-5 follow Board of Education Policy. Educational program requirements reflect the approved 1994 Elementary Educational Specifications (Ed Spec) and current instructional priorities and practices. The analysis followed these steps:
1. Verify current floor plan and room uses, using data from the 2013-2014 school year. 2. Count the number of rooms meeting the minimum size of 660 SF to determine gross capacity. 3. Exclude regional programs, core spaces, and utility areas from gross capacity. 4. Identify other educational program areas sized between 400-660 SF. 5. Assign related arts and electives to other educational program area rooms as appropriate. 6. Subtract classrooms from gross capacity to satisfy any remaining needs for related arts and
electives. 7. Distribute grades to remaining net capacity rooms, guided by current usage. 8. Calculate capacity based on staffing ratios per grade.
This count excluded regional programs, early childhood education rooms, and core spaces such as the office, gym and cafeteria. When necessary, rooms were removed from the gross capacity room count to accommodate these uses. The remaining capacity rooms were assigned for use based upon 2013-2014 floor plans, and capacity was calculated using approved staffing ratios. Any remaining rooms in the net capacity count (indicated with *on the floor plan) that were not currently assigned to a K-5 classroom were assigned capacity based on their location in the building or a logical distribution of rooms across the grades. This analysis resulted in a net increase of 415 seats in elementary capacity throughout the system. This increase is not the equivalent of a “new facility,” because the results reflect marginal changes throughout existing schools. Results show eleven schools with reduced capacity, totaling 285 seats, while 25 schools show increased capacity totaling 779 seats. Five schools would maintain their existing capacity. Elementary schools with the greatest proposed capacity reductions include Cradlerock Elementary School (ES), Pointers Run ES, and Waverly ES. Hammond ES, Waterloo ES, and Thunder Hill ES are among those with the highest proposed increase in capacity. Longfellow ES, Deep Run ES, Running Brook ES, and Laurel Woods ES are currently undergoing renovation or additions that will impact their capacities. The Running Brook ES addition that opened in school year 2014-2015 is included in the calculation. Other renovations that are opening in future years are handled as stated on the present floor plan diagrams, which are included with this report.

Howard County Public School System Gilbert Architects
HCPSS 2013‐14 Elementary School Capacity Update Page 4
Introduction In August 2009, Gilbert Architects Inc. prepared a facility assessment for all forty HCPSS elementary schools operating at that time. This facility assessment had two distinct components: a programmatic assessment to identify how well each building is supporting the delivery of the educational program based on the school board adopted educational specifications for elementary schools prepared by Gilbert Architects Inc. (GAI); and a facilities condition assessment to identify the condition of the physical plant, building systems, and an estimate of the deferred maintenance costs for each building which was prepared by Facilities Engineering Associates (FEA).
Since 2009, Ducketts Lane ES has opened and a number of renovations and additions have been made in several elementary schools. This document is an update to the 2009 programmatic assessment specifically to determine the actual building capacities of each of the elementary schools. The capacity determinations made in this report will be used for long term planning by the Office of School Planning including the capital budget.
The broad based conclusion that can be drawn from this study is that there are 415 additional seats of elementary school capacity across the school system that can be considered for future planning. While a net additional capacity has been found overall, this report does propose capacity reductions at some schools, compared to what was reported in the August 2009 Facility Assessment. Where a reduced capacity is observed, it is often due to the assignment of regional programs to the facility. These regional programs may include regional early childhood centers (RECC), academic life skills (ALS) and early childhood (Pre-K) programs. For example, Waverly ES observed a reduced capacity because three rooms assigned to ALS that are appropriately sized for general education teaching stations.
Many of the changes in capacity are the result of changes in educational specifications and building use over time. Additionally, while capacity has been added in areas of growth around the county, it appears the capacity added by new capital projects was understated in some instances. When construction document reports are presented to the Board of Education they do not present the proposed capacity in the context of a system wide analysis.
Methodology School districts and state educational authorities calculate school capacity in a variety of ways but most models can be broken into three categories:
Net area model - divides the net area of the school building (entire building minus special
programs) by a square foot per student factor to determine student capacity. Instructional area model - divides instructional areas (spaces with teachers assigned to them) by
a square foot per student factor to determine the student capacity of each space. Number of classrooms model - applies a student per classroom ratio to all general education
classrooms to determine student capacity.
HCPSS uses the number of classrooms model, an approach which is common in Maryland and is used by Maryland State Department of Education. Specifically this model counts the number of grade level classrooms and applies student- to-teacher ratios which vary by elementary grade. Other rooms may directly serve educational programming but are not counted as part of capacity. These rooms are referred to as undersized rooms in this report. Examples include related arts or elective programming. A school administrator has the latitude to change room assignments as needed which can change the capacity of the school. To calculate the full potential capacity of the school, this study itemizes the building capacity based on the 2013-2014 room use to determine the gross capacity. Room assignments are then adjusted to be consistent with educational specifications and to ensure that typical staffing considerations can be

Howard County Public School System Gilbert Architects
HCPSS 2013‐14 Elementary School Capacity Update Page 5
accommodated within the building. No relocatable classrooms are used in determining building capacity per HCPSS Policy 6010. The graphic representations of floor plans in this report show what was collected for each school in 2013 on the left side and how calculations were made on the right side. The results from these calculations comprise the recommended capacity, accounting for all elementary school program requirements. The analysis followed these steps:
Methodology Summary: 1. Verify current floor plan and room uses (2013-2014 school year). 2. Count rooms meeting minimum size of 660 SF (Gross capacity). 3. Exclude regional programs, core spaces, and utility areas from gross capacity. 4. Identify other educational program areas between 400-660 SF. 5. Assign related arts and electives to other educational program area rooms, as appropriate. 6. Subtract classrooms from Gross Capacity to satisfy any remaining needs for related arts and
electives. 7. Distribute grades to remaining net capacity rooms, guided by current usage. 8. Calculate capacity based on staffing ratios per grade.
Data Collection Process The data base information prepared by the HCPSS provided an invaluable wealth of information GAI could use in the evaluation of information for the elementary schools outlined herein. Computer aided drafting (CAD) floor plans provided by GAI and other architects were digitized into the HCPSS Geographic Information System (GIS) database and spatially adjusted, preserving dimensions and scale from the original file. Each school provided a diagram from which room uses were taken and entered as attributes in the GIS. Room usage and building layout were then checked in the field during visits to each school. Onsite changes were made using an iPad with the ArcGIS Collector application installed. This information was then re-checked using ArcGIS Desktop to verify the results against any other data provided by the school and as-built construction plans. GAI was provided with a published map file and data package for use in Arc Reader. Data was displayed on a color-coded map, with each room labeled by use category and area. The use of this technology and the data collection process completed by the HCPSS provided an accurate baseline for GAI to analyze the capacity of each of school. This system remains under HCPSS ownership for continued use by school planning staff and school administrators.
The floor plans and capacity statistics in this report come from a GIS database. This system allows floor plan information to be maintained by multiple users in offices or school sites. As the backbone of the data collection process, the initiation of this system has been a valuable improvement to this study over previous capacity studies. Where in the past, difficult to use computer aided design (CAD) files were distributed between consulting architects and some staff but they were not easily accessed by other staff. The result of this project is that the HCPSS owns a centralized database of all building floor plans that can be accessed using web applications.

Howard County Public School System Gilbert Architects
HCPSS 2013‐14 Elementary School Capacity Update Page 6
Gross Capacity Room Count The building capacity for an elementary school is determined by the number of grade level classrooms available in the school that meet the minimum square footage requirements. Using the “HCPSS Guidelines Manual for Renovations and Modernizations of Existing Schools” adopted by the Board of Education in 2009, the minimum square footage for a kindergarten classroom is 750 SF. For grades 1-5, the minimum square footage for a classroom is 660 SF. These minimum square footage allowances include any support rooms, such as toilet rooms or storage rooms, which are accessed from the classroom. Any rooms that do not meet the minimum square footage requirements are determined to be undersized and are not counted toward capacity. To allow for any discrepancies in room sizes in the GIS database, for the purpose of this study we assumed a 3percent margin of error and assigned capacity if the room size met the minimum square footage as follows:
Kindergarten: 750 SF less 3% = a minimum room size of 727.5 SF Grades 1-5: 660 SF less 3% = a minimum room size of 640.2 SF
Minimum classroom square footage does not mean all classrooms are of minimum size. In fact, the average grade 1-5 classroom size found in this study is 748 SF and nearly all are over 660 SF (standard deviation is 80 SF). The risk of setting a higher minimum, such as 700 SF, is the loss of 145 capacity rooms, or over four schools worth of capacity. Schools that would be impacted by raising the minimum square footage to 700 SF, i.e. a net loss in capacity, include Cradlerock ES, Forest Ridge ES, and Guilford ES, as well as Swansfield ES and Talbott Springs ES.
Undersized Rooms Rooms meeting these descriptions were not included in the net capacity room count: Rooms below 660 SF in area. Any educational program area such as art, music (vocal, instrumental), and the media center were
not assigned capacity. Computer and Gifted and Talented (GT) classrooms were not assigned capacity. Support rooms, such as special education classrooms, English for Speakers of Other Languages (ESOL),
alternative education (Alt Ed), reading, math, speech, and occupational therapy/physical therapy (OT/PT) were not assigned capacity.
Regional and specialized programs (refer to Attachment A) were not assigned capacity. These rooms could be counted towards capacity if the program was ever relocated to another school. The capacity at that other school would be reduced to accommodate the regional program.
Building support rooms such as administration, cafeteria and kitchen, gymnasium, stage and mini auditoriums were not assigned capacity. Recreation and Parks Activities rooms were not assigned capacity.
Relocatable classrooms were not assigned capacity. Any classroom activities housed relocatable classrooms were assigned to rooms in the building for this study.
Rooms that will fulfill the expanded Pre-K needs of the new world class elementary education pilot program during the 2014-2015 school year are identified. The schools slated for this program are:
o Bryant Woods ES o Phelps Luck ES o Running Brook ES o Stevens Forest ES o Talbott Springs ES
Rooms with area between 400 SF and 660 SF are frequently used for educational programming and support spaces. The 1994 Ed Spec allows for many of these rooms to be of a smaller size but there are no specific minimum area recommendations identified in the HCPSS renovation guidelines for related arts rooms.

Howard County Public School System Gilbert Architects
HCPSS 2013‐14 Elementary School Capacity Update Page 7
Based upon observed averages and the 1994 Ed Spec, this study makes the following specifications that the minimum square footage shall be:
>660 SF for art and vocal music >or = to 400 SF for GT, instrumental music and computer lab (room)
As educational programs continue to evolve through the use of technology, so does the design of spaces within the school to accommodate these new learning opportunities. Although a few elementary schools have an “activity room”, the inclusion of a large open space, “extended learning area,” or “commons area” is not recognized as part of the current HCPSS Elementary Ed Spec. These areas can host more social learning and collaboration‐based activities but are not fully developed as part of the elementary school curriculum. Therefore, allocating space within the building for this use, which would be sizable, is beyond the scope of this capacity study and was not considered. In this study these spaces are referred to “student work areas” to differentiate them from “staff work areas.” Accounting for Related Arts and Elective Programming In order to account for all of the related arts and elective programming, it was necessary in this report to develop a method that rationalizes the educational specifications and staffing ratios. While vocal music, art, and computer lab are staffed based on school enrollment, GT and instrumental music are staffed using anticipated (elective) participation. The methodology used in this report seeks to find the minimum for each type of program offered at a school. The staffing ratio used for art and vocal music was extended to GT and instrumental music for purposes of this calculation. Staffing allocations for related arts and elective programming are made according to approved ratios or participation. Since staff assignments are made based on projected enrollment, and not considering capacity utilization, there is an assumption that space will be found for all assigned teachers. This leads to space usage (efficiency) concerns. This study applies a staffing ratio for related arts and elective programming based on the number of appropriately-sized rooms within the building. For example, in a school with fewer than 28 K-5 teachers, the staffing ratios call for one teacher for art, computer lab*, vocal music, instrumental music (combined band/strings), and gifted and talented (GT). The criteria identified below are based on staffing ratios and typical participation for schools of each size. These factors are rationalized to the gross capacity of the school in classrooms with the following three templates:
1. Small building that has less than or equal to 30 gross capacity rooms 2. Medium building that has 31-35 gross capacity rooms and at least three additional rooms larger
than 400 SF 3. Large building with greater than 36 gross capacity rooms and at least six additional rooms larger than
400 SF
*Each elementary school is assigned a technology teacher although there may not be a dedicated classroom assigned for the program. Typically technology instruction is delivered in classrooms other than the computer lab. The approach used for identifying related arts and elective programming is summarized in the diagram on the next page.

Howard County Public School System Gilbert Architects
HCPSS 2013‐14 Elementary School Capacity Update Page 8
Figure 1 ‐ Net Capacity Calculation Process
Based upon the specified sizes of greater than 660 SF for art and vocal music and at least 400 SF for instrumental music, or GT and computer lab, room assignments were made in the building for the required related arts. Where ever possible, these requirements were met using rooms that were identified as being undersized to receive capacity for K-5 classrooms but were within the size requirements assumed herein for related arts or elective programs. If necessary, classrooms were subtracted from the gross capacity count to ensure all educational programs could be met.
The first decision in assigning these classrooms was the number of gross capacity rooms. The staffing and participation formulas mostly break out into small and large schools. In the case of a small school of 30 gross capacity classrooms, five rooms are needed for related arts to cover potential staffing. Two must at least 660 SF for vocal music and art. Many art and music classrooms are obvious on the floor plan because they were built specifically for those uses. These would be difficult to convert to a K-5 classroom. Three must be at least 400 SF for instrumental music, GT, and computer lab. If such rooms are not available they are subtracted from the gross capacity. Where capacity rooms must be subtracted to account for GT or instrumental music, only the minimum is removed to meet the requirement.
Once a school reaches 36 gross capacity classrooms twice the related arts component is needed to cover potential staffing. Some fall in between the small and large categories. The limiting factor was if two art and vocal music classrooms were used in 2013-2014. Otherwise, the school should be calculated as a small school.

H
DT
Canee
IndThacccol
Ath
20
Throoas one CaThthecouis ctheandrooroo
HCPSS 2013‐14
Distributinghe approach
apacity was aeded to ach
dividual Sce following ncompany thelor format.
holton ES (A
13-2014 Sch
e 2013-2014oms (“gross a “small” bue undersized
apacity Studye room whic
e upper leveunted for GTcounted for ie relocatabled the (1) comom count. Toms were us
Elementary Sc
g Net Capah used for di
assigned to ieve a reaso
chool Narrnarratives exe attached fl
AES)
hool Use Pla
4 school yeacapacity roo
uilding, requid room each
y Use Plan ch hosted spl and there is
T to account instrumental
e classroomsmputer lab th
The result is sed as teach
Figur
chool Capacity
acity stributing ne
available caonable balan
atives xplain the inpoor plan gra
an
ar capacity foom count”), aring one cap
h to be assig
peech is cous a resourcefor the GT p
l music becas. The (1) exhat is counte19 net capa
hing stations
re 2 ‐ Distributin
y Update
et capacity is
apacity roomnce.
put and outpaphics discus
or AES was and two thatpacity room gned to instru
nted for voce room adjacprogram spaause only onxisting art, ased for instrumcity rooms. Ain 2013-201
ng Net Capacity
s summarize
s based on
put for the anssed on pag
387. The but qualify as ueach to be aumental mus
al music sincent to the mace within thne is necesss well as themental musiAs depicted 14, and rece
ed in the follo
use in the c
nalysis at eage 24 and at
uilding has 2undersized rassigned to sic, GT, and
ce it is 738 Smedia centere building. ary and to b
e (1) speechc, are subtraon the “Cap
eive capacity
owing diagra
lassrooms a
ach school. Tttached to th
22 rooms tharooms. Thesart and voca
d computer la
SF. A speecr. An under-One of the e
bring instrum that is counacted from tpacity Key”, y based on t
am:
around it, or
These narrahis report in 1
at qualify as e counts qual music, as ab.
ch room is av-sized classrexisting com
mental musicnted for vocahe gross ca18 of the neheir existing
Page 9
grade level
atives can 11”x17”
capacity alify AES well as
vailable on room is
mputer labs in from
al music pacity
et capacity g use by

HCPSS 2013‐14 Elementary School Capacity Update Page 10
grade level. The net capacity room count includes one additional room (*) receives capacity and is assigned the grade (1-2) capacity of 19 students per room because it is adjacent to other grade 2 classrooms. The resulting proposed capacity is 424. Bellows Springs ES (BSES)
2013-2014 School Use Plan The 2013-2014 school year capacity for BSES was 762. The building has 40 rooms that qualify as capacity rooms (“gross capacity room count”), and seven that qualify as undersized rooms. These counts qualify BSES as a “large” building, requiring two capacity rooms each for art and vocal music, as well as two undersized classrooms each for instrumental music, GT, and computer labs. Capacity Study Use Plan Two existing resource rooms are counted for GT freeing up the two capacity rooms which are currently assigned to GT for classrooms. The strings room is counted for instrumental music and a resource room is counted for the second instrumental music. A capacity room was hosting technology is counted for the second vocal music room. The (2) existing art, (1) existing vocal music and (1) existing computer lab, as well as the existing strings and computer lab that are counted for the (2) instrumental music and the (1) capacity room that is counted for vocal music, are subtracted from the gross capacity room count. The result is 33 net capacity rooms. As depicted on the “Capacity Key”, 30 of the net capacity rooms were used as teaching stations in 2013-2014, and receive capacity based on their existing use by grade level. The net capacity room count includes three additional rooms (*) receiving capacity: two are assigned the grade (1-2) capacity of 19 students because they are near other grade (1-2) rooms. Two are assigned the grade (3-5) capacity of 25 students per room because of their proximity to similar rooms. The resulting proposed capacity is 726. Bollman Bridge ES (BBES)
2013-2014 School Use Plan The 2013 school year capacity for BBES was 663. The building has 37 rooms that qualify as capacity rooms (“gross capacity room count”), and only three that qualify as undersized rooms. Since there are not six undersized classrooms, BBES must be classified as a “medium” building, requiring one capacity room each for art and vocal music as well as one undersized room each for instrumental music, GT, and computer lab. Capacity Study Use Plan An existing undersized room is counted for the second computer lab. A reading room is counted as the second vocal music. The (2) existing art, (1) existing vocal, (1) existing instrumental music, (1) existing GT and (1) existing computer lab, as well as the second reading room that is counted for the (1) additional vocal music, are subtracted from the gross capacity room count. The result is 30 net capacity rooms. As depicted on the “Capacity Key”, all rooms were used as teaching stations in 2013-2014, and receive capacity based on their existing use by grade level. The resulting proposed capacity is 666. Bryant Woods ES (BWES) 2013-2014 School Use Plan The 2013-2014 school year capacity for BWES was 355. The building has 19 rooms that qualify as capacity rooms (“gross capacity room count”), and two that qualify as undersized rooms. These counts qualify BWES as a “small” building, requiring one capacity room each for art and vocal music, as well as one undersized room each instrumental music, GT) and computer lab. Two Pre-K rooms were added for the implementation of the Elementary School Model Initiative. Capacity Study Use Plan A capacity room is counted for vocal music since the current vocal music will be assigned to Pre-K in 2014-2015. The (1) existing art and (1) existing computer lab, as well as the (1) capacity room that is counted for

HCPSS 2013‐14 Elementary School Capacity Update Page 11
vocal music, are subtracted from the gross capacity room count. The result is 16 net capacity rooms. As depicted on the “Capacity Key”, all rooms were used as teaching stations in 2013-2014, and receive capacity based on their existing use by grade level. The resulting proposed capacity is 361. Bushy Park ES (BPES) 2013-2014 School Use Plan The 2013-2014 school year capacity for BPES was 788. The building has 42 rooms that qualify as capacity rooms (“gross capacity room count”), and seven that qualify as undersized rooms. The building has two capacity rooms each for art and vocal music designed into the floor plan. These counts qualify BPES as a “large” building, requiring two capacity rooms each for art and vocal music, as well as two undersized rooms each for instrumental music, GT, and computer labs. Capacity Study Use Plan The (2) existing art, (2) existing vocal music, (2) existing instrumental music, and (1) existing computer lab are subtracted from the gross capacity room count. The result is 35 net capacity rooms. As depicted on the “Capacity Key”, 27 of the net capacity rooms were used as teaching stations in 2013-14, and receive capacity based on their existing use by grade level. The net capacity room count includes eight additional rooms (*) receiving capacity: one is assigned the grade (K) capacity of 22 students; three the grade (1-2) capacity of 19 students; and four the grade (3-5) capacity of 25 students per room. The resulting proposed capacity is 788. Centennial Lane ES (CLES) 2013-2014 School Use Plan The 2013 school year capacity for CLES was 628. The building has 34 rooms that qualify as capacity rooms (“gross capacity room count”), and only two that qualify as undersized rooms. The floor plan only shows one capacity room each designed for art and vocal music. These counts qualify CLES as a “medium” building, requiring one capacity room each for art and, vocal music, instrumental music, gifted and talented, and a computer lab. Capacity Study Use Plan The (1) existing art, (1) existing vocal music, (1) existing instrumental music, (1) existing GT and (1) existing computer lab are subtracted from the gross capacity room count. The result is 29 net capacity rooms. As depicted on the “Capacity Key”, 28 of the net capacity rooms were used as teaching stations in 2013-2014, and receive capacity based on their existing use by grade level. The net capacity room count includes one additional room (*) receiving capacity and is assigned the grade (1-2) capacity of 19 students per room. The resulting proposed capacity is 647. Clarksville ES (CES) 2013-2014 School Use Plan The 2013-2014 school year capacity for CES was 634. The building has 32 rooms that qualify as capacity rooms (“gross capacity room count”), and two that qualify as undersized rooms. These counts qualify CES as a “small” building, requiring one capacity room each for art and vocal music, as well as one undersized room each for instrumental music, GT) and a computer lab. Capacity Study Use Plan The (1) existing art, (1) existing vocal music, (1) existing instrumental music, (1) existing GT and (1) existing computer lab are subtracted from the gross capacity room count. The result is 27 net capacity rooms. As depicted on the “Capacity Key”, 23 of the net capacity rooms were used as teaching stations in 2013-2014, and receive capacity based on their existing use by grade level. The net capacity room count includes four additional rooms (*) receiving capacity: one is assigned the grade (1-2) capacity of 19 students; and three the grade (3-5) capacity of 25 students per room. The resulting proposed capacity is 612.

HCPSS 2013‐14 Elementary School Capacity Update Page 12
Clemens Crossing ES (CCES) 2013-2014 School Use Plan The 2013-2014 school year capacity for CCES was 522. The building has 26 rooms that qualify as capacity rooms (“gross capacity room count”), and two undersized rooms. These counts qualify CCES as a “small” building, requiring one capacity room each for art and vocal music, as well as one undersized room for instrumental music, GT, and a computer lab. Capacity Study Use Plan The (1) existing art and the (1) existing vocal music, as well as the (1) capacity room counted for GT, are subtracted from the gross capacity room count. The two undersized rooms are assigned to instrumental music and computer lab. The result is 23 net capacity rooms. As depicted on the “Capacity Key”, all rooms were used as teaching stations in 2013-2014, and receive capacity based on their existing use by grade level. The resulting proposed capacity is 521. Cradlerock ES (CRES) 2013-2014 School Use Plan The 2013-2014 school year capacity for CRES was 487. The building has 19 rooms that qualify as capacity rooms (“gross capacity room count”), and twelve that qualify as undersized rooms. These counts qualify CRES as a “small” building, requiring one capacity room each for art and vocal music, as well as one undersized room each for instrumental music, GT, and a computer lab. Capacity Study Use Plan The (1) existing art and the (1) existing vocal music are subtracted from the gross capacity room count. Undersized rooms are counted for instrumental music GT and computer lab. The result is 17 net capacity rooms. As depicted on the “Capacity Key”, 14 of the net capacity rooms were used as teaching stations in 2013-2014, and receive capacity based on their existing use by grade level. The net capacity room count includes three additional rooms (*) receiving capacity: one is assigned the grade (1-2) capacity of 19 students; and two the grade (3-5) capacity of 25 students per room. The resulting proposed capacity is 398. Dayton Oaks ES (DOES)
2013-2014 School Use Plan The 2013-2014 school year capacity for DOES was 788. The building has 42 rooms that qualify as capacity rooms (“gross capacity room count”), and seven that qualify as undersized rooms. The building has two capacity rooms each for art and vocal music designed into the floor plan. These counts qualify DOES as a “large” building, requiring two capacity rooms each for art and vocal music, as well as two undersized rooms each for instrumental music, GT, and computer labs. Capacity Study Use Plan The (2) existing art, (1) existing vocal music, (1) GT, as well as the (1) resource counted for vocal music and the (1) computer lab counted for GT, are subtracted from the gross capacity room count. The result is 35 net capacity rooms. As depicted on the “Capacity Key”, all rooms were used as teaching stations in 2013-2014, and receive capacity based on their existing use by grade level. The resulting proposed capacity is 788. Deep Run ES (DRES)
2013-2014 School Use Plan The 2013 school year capacity for DRES was 601. The building has 33 rooms that qualify as capacity rooms (“gross capacity room count”), and three that qualify as undersized rooms. These counts qualify DRES as a “medium” building. The building has one capacity room each designed for art and music in the floor plan requiring one capacity room each for art and vocal music as well as one undersized room each for instrumental music, GT, and computer lab.

HCPSS 2013‐14 Elementary School Capacity Update Page 13
Capacity Study Use Plan An undersized kindergarten room is counted for GT. An undersized grade 2 room is not counted towards capacity. A math room is counted as a capacity room. The second art room is counted as a capacity room. The (1) remaining art and (1) existing vocal music are subtracted from the gross capacity room count. The result is 30 net capacity rooms. As depicted on the “Capacity Key”, 28 of the net capacity rooms were used as teaching stations in 2013-2014, and receive capacity based on their existing use by grade level. The net capacity room count includes three additional rooms (*) receiving capacity: one is assigned the grade (1-2) capacity of 19 students; and two the grade (3-5) capacity of 25 students per room. The resulting proposed capacity is 672. Ducketts Lane ES (DLES) 2013-2014 School Use Plan The 2013-2014 school year capacity for DLES was 600. The building has 34 rooms that qualify as capacity rooms (“gross capacity room count”), and two that qualify as undersized rooms. Since there are not two vocal rooms or two art rooms that qualify as capacity rooms, these counts qualify DLES as a “medium” building, requiring one room each for art, vocal music, instrumental music, gifted and talented, and a computer lab. Capacity Study Use Plan The (1) existing art and (1) existing vocal music, (1) existing instrumental music and (1) existing computer lab are subtracted from the gross capacity room count. The result is 30 net capacity rooms. As depicted on the “Capacity Key”, 27 of the net capacity rooms were used as teaching stations in 2013-2014, and receive capacity based on their existing use by grade level. The net capacity room count includes three additional rooms (*) receiving capacity: one is assigned the grade (1-2) capacity of 19 students; and two the grade (3-5) capacity of 25 students per room. The resulting proposed capacity is 669. Elkridge ES (EES)
2013-2014 School Use Plan The 2013-2014 school year capacity for EES was 779. The building has 40 rooms that qualify as capacity rooms (“gross capacity room count”), and five that qualify as undersized rooms. These counts qualify EES as a “large” building, requiring two rooms each for art, vocal music, instrumental music, gifted and talented (GT), and computer labs. Capacity Study Use Plan An existing reading is counted for GT. An existing GT on the main level is counted as the first instrumental music and the lower level work space is counted as the second instrumental music. The (2) existing art, (2) existing vocal music, (1) existing instrumental music, and (1) existing GT are subtracted from the gross capacity room count. The result is 34 net capacity rooms. As depicted on the “Capacity Key”, all rooms were used as teaching stations in 2013-2014, and receive capacity based on their existing use by grade level. The resulting proposed capacity is 760. Forest Ridge ES (FRES) 2013-2014 School Use Plan The 2013-2014 school year capacity for FRES was 626. The building has 33 rooms that qualify as capacity rooms (“gross capacity room count”), and six that qualify as undersized rooms. Since there are two rooms designed for art and two rooms designed for vocal music, FRES must be classified as a “medium” building, requiring two capacity rooms each for art and vocal music as well as one undersized room each for instrumental music, GT, and a computer lab. Capacity Study Use Plan

HCPSS 2013‐14 Elementary School Capacity Update Page 14
An existing undersized room is counted for GT. The (2) existing art and (1) existing vocal music are subtracted from the gross capacity room count. The result is 30 net capacity rooms. As depicted on the “Capacity Key”, 28 of the net capacity rooms were used as teaching stations in 2013-2014, and receive capacity based on their existing use by grade level. The net capacity room count (*) includes two additional rooms (*) receiving capacity: one is assigned the grade (1-2) capacity of 19 students; and one is assigned the grade (3-5) capacity of 25 students per room. The resulting proposed capacity is 669. Fulton ES (FES) 2013-2014 School Use Plan The 2013-2014 school year capacity for FES was 772. The building has 40 rooms that qualify as capacity rooms (“gross capacity room count”), and six that qualify as undersized rooms. These counts qualify FES as a “large” building, requiring two rooms each for art, vocal music, instrumental music, gifted and talented (GT), and computer labs. Capacity Study Use Plan An existing computer lab is counted as the second vocal music. Two resource rooms are counted for the two GT. The (2) existing art, (1) existing vocal music, and (1) instrumental music, as well as the (1) existing computer lab that is counted as the second vocal music, are subtracted from the gross capacity room count. The result is 35 net capacity rooms. As depicted on the “Capacity Key”, 31 of the net capacity rooms were used as teaching stations in 2013-2014, and receive capacity based on their existing use by grade level. The net capacity room count includes four additional room (*) receiving capacity and are assigned the grade (3-5) capacity of 25 students per room. The resulting proposed capacity is 788. Gorman Crossing ES (GCES) 2013-2014 School Use Plan The 2013-2014 school year capacity for GCES was 713. The building has 37 rooms that qualify as capacity rooms (“gross capacity room count”), and seven that qualify as undersized rooms. These counts qualify GCES as a “large” building, requiring two rooms each for art, vocal music, instrumental music, gifted and talented (GT), and computer labs. Capacity Study Use Plan An existing computer lab is counted for the second vocal music. An undersized room is counted as the second computer lab. Two other undersized rooms are counted for GT. The (2) existing art, (1) existing vocal music, and (2) existing instrumental music, as well as the (1) existing computer lab that is counted for the second vocal music, are subtracted from the gross capacity room count. The result is 31 net capacity rooms. As depicted on the “Capacity Key”, 27 of the net capacity rooms were used as teaching stations in 2013-2014, and receive capacity based on their existing use by grade level. The net capacity room count includes four additional rooms (*) receiving capacity and are assigned the grade (3-5) capacity of 25 students per room. The resulting proposed capacity is 700. Guilford ES (GES) 2013-2014 School Use Plan The 2013-2014 school year capacity for GES was 462. The building has 24 rooms that qualify as capacity rooms (“gross capacity room count”), and two that qualify as undersized rooms. These counts qualify GES as a “small” building, requiring one room each for art, vocal music, instrumental music, gifted and talented (GT), and a computer lab. Capacity Study Use Plan A capacity room is counted for GT. The (1) existing art and (1) existing vocal music, as well as the (1) capacity room that is counted for GT, are subtracted from the gross capacity room count. The result is 21 net capacity rooms. As depicted on the “Capacity Key”, all rooms were used as teaching stations in 2013-

HCPSS 2013‐14 Elementary School Capacity Update Page 15
2014, and receive capacity based on their existing use by grade level. The resulting proposed capacity is 465. Hammond ES (HES) The 2013-2014 school year capacity for HES was 597. The building has 32 rooms that qualify as capacity rooms (“gross capacity room count”), and four that qualify as undersized rooms. Since there are not two vocal rooms that qualify as capacity rooms, these counts qualify HES as a “medium” building, requiring one room each for art, vocal music, instrumental music, gifted and talented, and a computer lab. Capacity Study Use Plan An undersized room is counted for GT and an existing GT is counted for the second vocal music. The (1) existing art and (1) existing vocal music, as well as the (1) existing GT that is counted for the second vocal music, are subtracted from the gross capacity room count. The result is 29 net capacity rooms. As depicted on the “Capacity Key”, 26 of the net capacity rooms were used as teaching stations in 2013-2014, and receive capacity based on their existing use. The net capacity room count includes three additional rooms (*) which are assigned the grade 3-5 capacity of 25 students per room. The resulting proposed capacity is 653. Hollifield Station ES (HSES) 2013-2014 School Use Plan The 2013-2014 school year capacity for HSES was 688. The building has 35 rooms that qualify as capacity rooms (“gross capacity room count”), and eight that qualify as undersized rooms. Since there are two rooms designed for art and two rooms designed for vocal music, HSES must be classified as a “medium” building, requiring two capacity rooms each for art and vocal music as well as one undersized room each for instrumental music, GT, and a computer lab. Capacity Study Use Plan A resource room is counted as the second vocal music. Two undersized rooms are counted as GT, and another undersized room counted as the second instrumental music. The (2) existing art, (1) existing vocal music, as well as the (1) existing Resource room that is counted for the second vocal music, are subtracted from the gross capacity room count. The result is 31 net capacity rooms. As depicted on the “Capacity Key”, 31 of the net capacity rooms were used as teaching stations in 2013-2014, and receive capacity based on their existing use. The net capacity room count includes four additional rooms (*) receiving capacity: one is assigned the grade (1-2) capacity of 19 students; and three the grade (3-5) capacity of 25 students per room. The resulting proposed capacity is 694. Ilchester ES (IES)
2013-2014 School Use Plan The 2013-2014 school year capacity for IES was 617. The building has 31 rooms that qualify as capacity rooms (“gross capacity room count”), and seven that qualify as undersized rooms. Since there are not two vocal rooms or two art rooms that qualify as capacity rooms, these counts qualify IES as a “medium” building, requiring one room each for art, vocal music, instrumental music, gifted and talented, and a computer lab. Capacity Study Use Plan A resource room is counted as the second instrumental music. The (1) existing art and (1) existing vocal music are subtracted from the gross capacity room count. The result is 29 net capacity rooms. As depicted on the “Capacity Key”, all 29 of the net capacity rooms were used as teaching stations in 2013-2014, and receive capacity based on their existing use. The resulting proposed capacity is 653.

HCPSS 2013‐14 Elementary School Capacity Update Page 16
Jeffers Hill ES (JHES)
2013-2014 School Use Plan The 2013-2014 school year capacity for JHES was 421. The building has 22 rooms that qualify as capacity rooms (“gross capacity room count”), and four that qualify as undersized rooms. These counts qualify JHES as a “small” building, requiring one each room for art, vocal music, instrumental music, gifted and talented (GT), and a computer lab. Capacity Study Use Plan A resource room is counted for GT. One capacity room is counted for vocal music and another capacity room counted for instrumental music. The (1) existing art, as well as the (2) capacity rooms counted for vocal and instrumental music, are subtracted from the gross capacity room count. The result is 19 net capacity rooms. As depicted on the “Capacity Key”, all 19 of the net capacity rooms were used as teaching stations in 2013-2014, and receive capacity based on their existing use by grade level. The resulting proposed capacity is 421. Laurel Woods ES (LWES)
2013-2014 School Use Plan The 2013-2014 school year capacity for LWES was 540. The building has 26 rooms that qualify as capacity rooms (“gross capacity room count”), and four that qualify as undersized rooms. These counts qualify LWES as a “small” building, requiring one capacity room each to be assigned to art and vocal music, as well as one undersized room each to be assigned to instrumental music, GT and computer lab. Capacity Study Use Plan The existing larger computer lab is counted as vocal music to bring vocal music in from the relocatable classroom. Only one computer lab is necessary which is available on the first floor. An existing undersized classroom which hosted GT is counted as instrumental music since the existing instrumental music is less than 400 SF. An existing undersized math room is counted for GT. The (1) existing art, as well and the (1) computer lab that is counted as vocal music, are subtracted from the gross capacity room count. The result is 24 net capacity rooms. As depicted on the “Capacity Key”, all 24 of the net capacity rooms were used as teaching stations in 2013-2014, and receive capacity based on their existing use by grade level. The resulting proposed capacity is 540. Lisbon ES (LES) 2013-2014 School Use Plan The 2013-2014 school year capacity for LES was 553. The building has 28 rooms that qualify as capacity rooms (“gross capacity room count”), and three that qualify as undersized rooms. These counts qualify LES as a “small” building, requiring one capacity room each to be assigned to art and vocal music, as well as one undersized room each to be assigned to instrumental music, GT and computer lab. Capacity Study Use Plan An undersized room which hosted kindergarten is counted for GT. One existing computer lab is counted as instrumental music since only one computer lab is necessary. The (1) existing art, (1) existing vocal music, (1) existing computer lab and the (1) kindergarten which is counted for GT, as well as the (1) existing computer lab that is counted as instrumental music, are subtracted from the gross capacity room count. The result is 23 net capacity rooms. As depicted on the “Capacity Key”, 18 of the net capacity rooms were used as teaching stations in 2013-2014, and receive capacity based on their existing use by grade level. The net capacity room count includes five additional rooms (*) receiving capacity: one is assigned the grade (1-2) capacity of 19 students because it is adjacent to other grade 1 classroom; and four the grade (3-5) capacity of 25 students per room because it is adjacent to other grade 3-5 classrooms. The resulting proposed capacity is 527.

HCPSS 2013‐14 Elementary School Capacity Update Page 17
Longfellow ES (LoES)
2013-2014 School Use Plan The 2013-2014 school year capacity for LoES was 418. The building has 28 rooms that qualify as capacity rooms (“gross capacity room count”), and three that qualify as undersized rooms. These counts qualify LoES as a “small” building, requiring one capacity room each to be assigned to art and vocal music, as well as one undersized room each to be assigned to instrumental music, GT and a computer lab. Capacity Study Use Plan This building is under construction to be completed August 2015. Uses shown are from construction documents and are subject to change once construction is completed. The (1) existing art, (1) existing vocal music, (1) existing instrumental music and (1) existing GT, as well as the (1) computer lab, are subtracted from the gross capacity room count. The result is 23 net capacity rooms. As depicted on the “Capacity Key”, 20 of the net capacity rooms were used as teaching stations in 2013-2014, and receive capacity based on their existing use by grade level. The net capacity room count includes three additional rooms (*) receiving capacity: one is assigned the grade (1-2) capacity of 19 students because it is between kindergarten and grade 1 classrooms; and two the grade (3-5) capacity of 25 students per room because it is between grade 2 and grades 3-5 classrooms. The resulting proposed capacity is 512. Manor Woods ES (MWES) 2013-2014 School Use Plan The 2013 school year capacity for MWES was 647. The building has 34 rooms that qualify as capacity rooms (“gross capacity room count”), and eight that qualify as undersized rooms. These counts qualify MWES as a “medium” building, but is treated as a “large”, requiring two capacity rooms each to be assigned to art and vocal music, as well as two undersized rooms each to be assigned to instrumental music, GT and computer lab. Capacity Study Use Plan Two undersized rooms are counted for the two GT and another undersized room counted as the second instrumental music. A very large computer lab (1259 SF) is assigned capacity as the 575 square foot room which hosted resource is counted as the second computer lab. The (2) existing arts and (2) existing vocal music are subtracted from the gross capacity room count. The result is 30 net capacity rooms. As depicted on the “Capacity Key”, 26 of the net capacity rooms were used as teaching stations in 2013-2014, and receive capacity based on their existing use by grade level. The net capacity room count includes four additional rooms (*) receiving capacity: one is assigned the grade (1-2) capacity of 19 students; and three the grade (3-5) capacity of 25 students per room. The resulting proposed capacity is 681. Northfield ES (NES)
2013-2014 School Use Plan The 2013-2014 school year capacity for NES was 672. The building has 37 rooms that qualify as capacity rooms (“gross capacity room count”), and four that qualify as undersized rooms. These counts qualify NES as a “large” building, requiring two capacity rooms each to be assigned to art and vocal music, as well as two undersized rooms each to be assigned to instrumental music, GT and computer lab. Capacity Study Use Plan An undersized room is counted for the second GT. The (2) existing art, (2) existing vocal music, (1) existing instrumental music, and (1) existing computer lab are subtracted from the gross capacity room count. The result is 31 net capacity rooms. As depicted on the “Capacity Key”, all 31 of the net capacity rooms were used as teaching stations in 2013-2014, and receive capacity based on their existing use by grade level. The resulting proposed capacity is 700.

HCPSS 2013‐14 Elementary School Capacity Update Page 18
Phelps Luck ES (PLES)
2013-2014 School Use Plan The 2013 school year capacity for PLES was 640. The building has 36 rooms that qualify as capacity rooms (“gross capacity room count”), and two that qualify as undersized rooms. These counts qualify PLES as a “medium” building, but is treated as a “small”, requiring one capacity room each to be assigned to art and vocal music, as well as one undersized room each to be assigned to instrumental music, GT and computer lab. A program change requires two additional Pre-K rooms for the implementation of the Elementary School Model Initiative. Capacity Study Use Plan The existing strings room is counted for instrumental music. The (2) existing art (note: the existing 700 square foot art room is used .5 for art and .5 for vocal), (1) existing vocal music, (1) existing GT and (1) existing computer lab, as well as the (1) existing strings that is counted for instrumental music, are subtracted from the gross capacity room count. The result is 30 net capacity rooms. As depicted on the “Capacity Key”, 29 of the net capacity rooms were used as teaching stations in 2013-2014, and receive capacity based on their existing use by grade level. The net capacity room count includes one additional room (*) receiving capacity which is assigned the grade (3-5) capacity of 25 students per room. The resulting proposed capacity is 663. Pointers Run ES (PRES)
2013-2014 School Use Plan The 2013-2014 school year capacity for PRES was 776. The building has 39 rooms that qualify as capacity rooms (“gross capacity room count”), and one that qualifies as an undersized room. These counts qualify PRES as a “large” building, requiring two capacity room each to be assigned to art and vocal music, as well as two undersized rooms each to be assigned to instrumental music, GT and computer labs. Capacity Study Use Plan Two existing capacity rooms hosting GT are counted for the two instrumental music rooms. There is an existing undersized GT, and a student work space that is counted for the second GT. A capacity room is counted for the second vocal music. The (1) existing art, (1) existing vocal music, and (1) existing computer lab, as well as the (2) existing GT rooms that are counted for instrumental music and the (1) capacity room that is counted for the second vocal music, are subtracted from the gross capacity room count. The result is 33 net capacity rooms. As depicted on the “Capacity Key”, all 33 of the net capacity rooms were used as teaching stations in 2013-2014, and receive capacity based on their existing use by grade level. The resulting proposed capacity is 744. Rockburn ES (RES)
2013-2014 School Use Plan The 2013 school year capacity for RES was 667. The building has 33 rooms that qualify as capacity rooms (“gross capacity room count”), and seven that qualify as undersized rooms. These counts qualify RES as a “medium” building, but is treated as a “small”, requiring one capacity room each to be assigned to art and vocal music, as well as one undersized room each to be assigned to instrumental music, GT and computer lab. Capacity Study Use Plan The (1) existing art, (1) existing vocal music, and the (1) existing instrumental music are subtracted from the gross capacity room count. The result is 30 net capacity rooms. As depicted on the “Capacity Key”, 27 of the net capacity rooms were used as teaching stations in 2013-2014, and receive capacity based on their existing use by grade level. The net capacity room count includes three additional rooms (*) receiving capacity: one is assigned the grade (1-2) capacity of 19 students because it is adjacent to other grade 1 classrooms; and two the grade (3-5) capacity of 25 students per room because it is adjacent to other higher capacity grade level classrooms. The resulting proposed capacity is 672.

HCPSS 2013‐14 Elementary School Capacity Update Page 19
Running Brook ES (RBES)
2013-2014 School Use Plan The 2013-2014 school year capacity for RBES was 505. The building has 26 rooms that qualify as capacity rooms (“gross capacity room count”), and eight that qualify as undersized rooms. These counts qualify RBES as a “small” building, requiring one capacity room each to be assigned to art and vocal music, as well as one undersized room each to be assigned to instrumental music, GT and a computer lab. Two Pre-K rooms were added for the implementation of the Elementary School Model Initiative. Capacity Study Use Plan This building is under construction to be completed August 2014. Uses shown are from construction documents and are subject to change once construction is completed. An undersized room is counted for GT. An existing GT is counted for the 2014-2015 Pre-K. The (1) existing art, (1) existing instrumental music, and the (1) existing computer lab are subtracted from the gross capacity room count. The result is 23 net capacity rooms. As depicted on the “Capacity Key”, 20 of the net capacity rooms were used as teaching stations in 2013-2014, and receive capacity based on their existing use by grade level. The net capacity room count includes three additional rooms (*) receiving capacity and are assigned the grade (1-2) capacity of 19 students per room. The resulting proposed capacity is 515. St John’s Lane ES (SJLES)
2013-2014 School Use Plan The 2013-2014 school year capacity for SJLES was 597. The building has 29 rooms that qualify as capacity rooms (“gross capacity room count”), and seven that qualify as undersized rooms. These counts qualify SJLES as a “small” building, requiring one capacity room each to be assigned to art and vocal music, as well as one undersized room each to be assigned to instrumental music, GT and computer lab. Capacity Study Use Plan An undersized room is counted for GT to account for the program in the building. The (1) existing art and (1) existing vocal music are subtracted from the gross capacity room count. The result is 27 net capacity rooms. As depicted on the “Capacity Key”, 26 of the net capacity rooms were used as teaching stations in 2013-2014, and receive capacity based on their existing use by grade level. The net capacity room count includes one room (*) receiving capacity and is assigned the grade (3-5) capacity of 25 students per room because it is adjacent to other grade 3 classrooms. The resulting proposed capacity is 612. Stevens Forest ES (SFES)
2013-2014 School Use Plan The 2013-2014 school year capacity for SFES was 433. The building has 21 rooms that qualify as capacity rooms (“gross capacity room count”), and two that qualify as undersized rooms. These counts qualify SFES as a “small” building, requiring one capacity room each for art and vocal music, as well as one undersized classroom each for instrumental music, GT, computer lab. Stevens Forest ES is also a part of the Elementary Model School Initiative. Two Pre-K classrooms are planned in rooms where vocal music and kindergarten were assigned in 2013. This required further adjustment to capacity. Capacity Study Use Plan A second existing computer lab is counted for GT. An undersized kindergarten room is counted for instrumental music. The (1) existing art and (1) existing vocal music, as well as the existing computer lab, are subtracted from the gross capacity room count as well as the (1) computer lab counted for GT. The result is 20 net capacity rooms. As depicted on the “Capacity Key”, all 20 of the net capacity rooms were used as teaching stations in 2013-2014, and receive capacity based on their existing use by grade level. The resulting proposed capacity is 443.

HCPSS 2013‐14 Elementary School Capacity Update Page 20
Swansfield ES (SES)
2013-2014 School Use Plan The 2013-2014 school year capacity for SES was 528. The building has 26 rooms that qualify as capacity rooms (“gross capacity room count”), and seven that qualify as undersized rooms. These counts qualify SES as a “small” building, requiring one capacity room each room for art and vocal music, as well as one undersized room each for instrumental music, GT, and a computer lab. GT was held in a relocatable classroom but a room was removed from the capacity calculation to account for this requirement. Instrumental music and computer lab uses are already assigned in the building. Capacity Study Use Plan An existing math is counted for vocal music. An undersized grade 2 classroom is counted for GT. The (1) existing art, (1) existing instrumental music, as well as the (1) existing math (counted for vocal music), are subtracted from the gross capacity room count. The result is 23 net capacity rooms. As depicted on the “Capacity Key”, all 23 of the net capacity rooms were used as teaching stations in 2013-2014, and receive capacity based on their existing use by grade level. The resulting proposed capacity is 521. Talbott Springs ES (TSES)
2013-2014 School Use Plan The 2013-2014 school year capacity for TSES was 443. The building has 22 rooms that qualify as capacity rooms (“gross capacity room count”), and two that qualify as undersized rooms. These counts qualify TSES as a “small” building, requiring one room for art, vocal music, instrumental music, GT, computer lab. Talbott Springs ES is also a part of the Elementary Model School Initiative. Two additional Pre-K classrooms are planned in a room where vocal music and kindergarten were assigned in 2013. This required further adjustment to capacity. Capacity Study Use Plan The existing computer lab is counted for vocal music. An undersized room is counted for a computer lab and another undersized room is counted for instrumental music. The (1) existing art and (1) existing GT, as well as the (1) computer lab counted for vocal music, are subtracted from the gross capacity room count. The result is 19 net capacity rooms. As depicted on the “Capacity Key”, 18 of the net capacity rooms were used as teaching stations in 2013-2014, and receive capacity based on their existing use by grade level. The net capacity room count includes one room (*) receiving capacity and is assigned the grade (3-5) capacity of 25 students per room. The resulting proposed capacity is 415. Thunder Hill ES (THES)
2013-2014 School Use Plan The 2013-2014 school year capacity for THES was 468. The building has 25 rooms that qualify as capacity rooms (“gross capacity room count”), and four that qualify as undersized rooms. These counts qualify THES as a “small” building, requiring one capacity room each for art, vocal music, as well as one undersized room each for instrumental music, GT, and a computer lab. Capacity Study Use Plan The (1) existing art and (1) existing vocal music are subtracted from the gross capacity room count. The result is 23 net capacity rooms. The existing GT, computer lab, and instrumental music are in undersized classrooms. One additional computer lab shown on the plan is a capacity room. As depicted on the “Capacity Key”, 22 of the net capacity rooms were used as teaching stations in 2013-2014, and receive capacity based on their existing use by grade level. The net capacity room count includes one room (*) receiving capacity and is assigned the grade (1-2) capacity of 19 students per room. The resulting proposed capacity is 509.

HCPSS 2013‐14 Elementary School Capacity Update Page 21
Triadelphia Ridge ES (TRES)
2013-2014 School Use Plan The 2013-2014 school year capacity for TRES was 544. The building has 28 rooms that qualify as capacity rooms (“gross capacity room count”), and eight that qualify as undersized rooms. These counts qualify TRES as a “small” building, requiring one room for art, vocal music, instrumental music, GT, computer lab. Capacity Study Use Plan One reading is counted for GT. One of the three computer labs is counted for instrumental music because only one computer lab is necessary The (1) existing art and (1) existing vocal music are subtracted from the gross capacity room count. The result is 26 net capacity rooms. As depicted on the “Capacity Key”, 22 of the net capacity rooms were used as teaching stations in 2013-2014, and receive capacity based on their existing use by grade level. The net capacity room count includes four additional rooms (*) receiving capacity: one is assigned the grade (K) capacity of 22 students; one is assigned the grade (1-2) capacity of 19 students; and two the grade (3-5) capacity of 25 students per room. The resulting proposed capacity is 581. Veterans ES (VES)
2013-2014 School Use Plan The 2013-2014 school year capacity for VES was 788. The building has 42 rooms that qualify as capacity rooms (“gross capacity room count”), and seven that qualify as undersized rooms. These counts qualify VES as a “large” building, requiring two rooms for art, vocal music, instrumental music, GT, and computer labs. Capacity Study Use Plan The (2) existing art, (2) existing vocal music, (2) existing GT, and (1) existing computer lab are subtracted from the gross capacity room count. The result is 35 net capacity rooms. Two rooms are devoted to Alt Ed on the second floor. One is changed to a second computer lab. As depicted on the “Capacity Key”, 34 of the net capacity rooms were used as teaching stations in 2013-2014, and receive capacity based on their existing use by grade level. The net capacity room count includes one room (*) receiving capacity and is assigned the grade (K) capacity of 22 students per room. The resulting proposed capacity is 788. Waterloo ES (WtES) 2013-2014 School Use Plan The 2013-2014 school year capacity for WtES was 594. The building has 33 rooms that qualify as capacity rooms (“gross capacity room count”), and six that qualify as undersized rooms. These counts qualify WtES as a “small” building, requiring one capacity room each for art and vocal music, as well as one undersized classroom each for instrumental music, GT, and a computer lab. Capacity Study Use Plan An undersized grade 1 class room is counted for computer lab. The (1) existing art, (1) existing vocal music, and (1) existing instrumental music are subtracted from the gross capacity room count. The result is 30 net capacity rooms. As depicted on the “Capacity Key”, 25 of the net capacity rooms were used as teaching stations in 2013-2014, and receive capacity based on their existing use by grade level. The net capacity room count includes five additional rooms (*) receiving capacity: four are assigned the grade (1-2) capacity of 19 students per room and one is assigned the grade (3-5) capacity of 25 students per room. The resulting proposed capacity is 663.
HCPSS 2013‐14 Elementary School Capacity Update Page 22
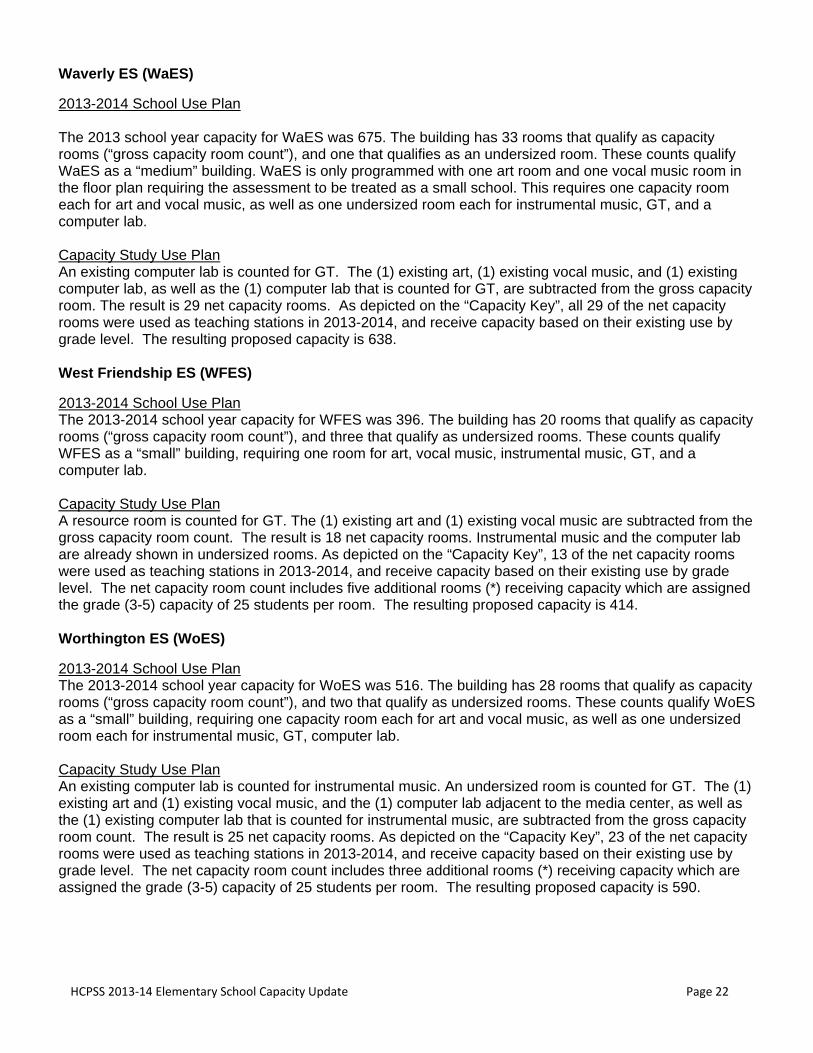
Waverly ES (WaES)
2013-2014 School Use Plan The 2013 school year capacity for WaES was 675. The building has 33 rooms that qualify as capacity rooms (“gross capacity room count”), and one that qualifies as an undersized room. These counts qualify WaES as a “medium” building. WaES is only programmed with one art room and one vocal music room in the floor plan requiring the assessment to be treated as a small school. This requires one capacity room each for art and vocal music, as well as one undersized room each for instrumental music, GT, and a computer lab. Capacity Study Use Plan An existing computer lab is counted for GT. The (1) existing art, (1) existing vocal music, and (1) existing computer lab, as well as the (1) computer lab that is counted for GT, are subtracted from the gross capacity room. The result is 29 net capacity rooms. As depicted on the “Capacity Key”, all 29 of the net capacity rooms were used as teaching stations in 2013-2014, and receive capacity based on their existing use by grade level. The resulting proposed capacity is 638. West Friendship ES (WFES)
2013-2014 School Use Plan The 2013-2014 school year capacity for WFES was 396. The building has 20 rooms that qualify as capacity rooms (“gross capacity room count”), and three that qualify as undersized rooms. These counts qualify WFES as a “small” building, requiring one room for art, vocal music, instrumental music, GT, and a computer lab. Capacity Study Use Plan A resource room is counted for GT. The (1) existing art and (1) existing vocal music are subtracted from the gross capacity room count. The result is 18 net capacity rooms. Instrumental music and the computer lab are already shown in undersized rooms. As depicted on the “Capacity Key”, 13 of the net capacity rooms were used as teaching stations in 2013-2014, and receive capacity based on their existing use by grade level. The net capacity room count includes five additional rooms (*) receiving capacity which are assigned the grade (3-5) capacity of 25 students per room. The resulting proposed capacity is 414. Worthington ES (WoES)
2013-2014 School Use Plan The 2013-2014 school year capacity for WoES was 516. The building has 28 rooms that qualify as capacity rooms (“gross capacity room count”), and two that qualify as undersized rooms. These counts qualify WoES as a “small” building, requiring one capacity room each for art and vocal music, as well as one undersized room each for instrumental music, GT, computer lab. Capacity Study Use Plan An existing computer lab is counted for instrumental music. An undersized room is counted for GT. The (1) existing art and (1) existing vocal music, and the (1) computer lab adjacent to the media center, as well as the (1) existing computer lab that is counted for instrumental music, are subtracted from the gross capacity room count. The result is 25 net capacity rooms. As depicted on the “Capacity Key”, 23 of the net capacity rooms were used as teaching stations in 2013-2014, and receive capacity based on their existing use by grade level. The net capacity room count includes three additional rooms (*) receiving capacity which are assigned the grade (3-5) capacity of 25 students per room. The resulting proposed capacity is 590.
HCPSS 2013‐14 Elementary School Capacity Update Page 23
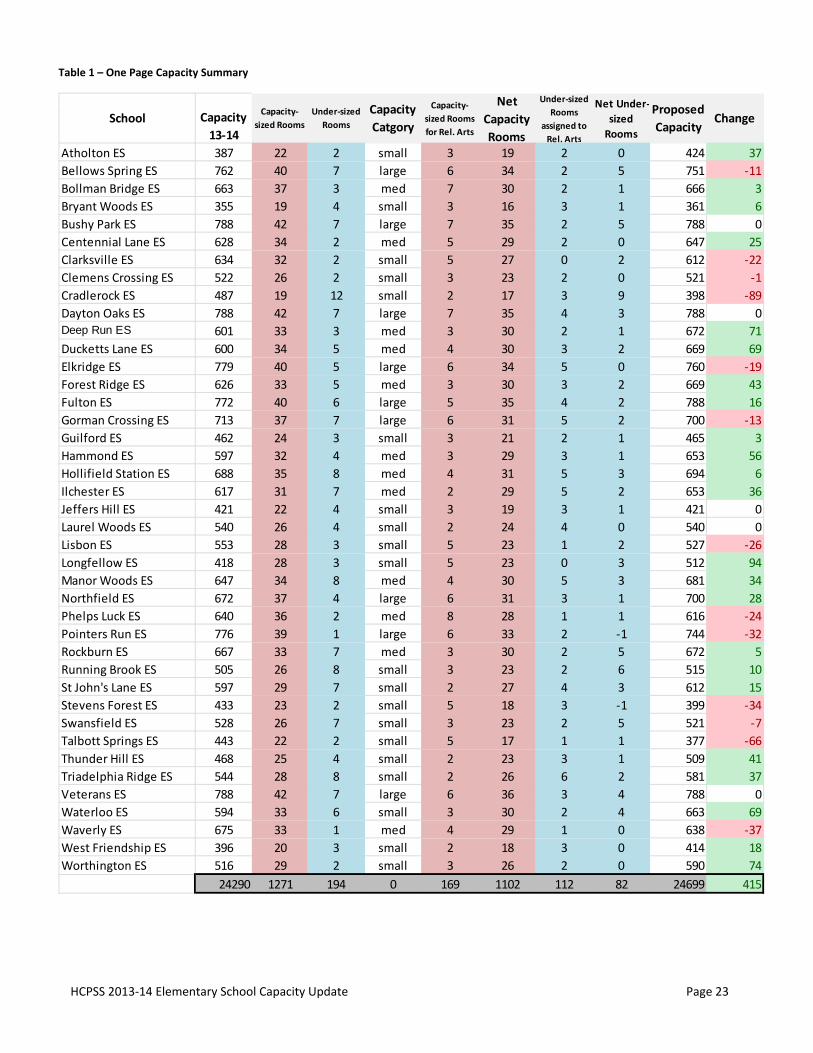
Table 1 – One Page Capacity Summary
Atholton ES 387 22 2 small 3 19 2 0 424 37
Bellows Spring ES 762 40 7 large 6 34 2 5 751 ‐11
Bollman Bridge ES 663 37 3 med 7 30 2 1 666 3
Bryant Woods ES 355 19 4 small 3 16 3 1 361 6
Bushy Park ES 788 42 7 large 7 35 2 5 788 0
Centennial Lane ES 628 34 2 med 5 29 2 0 647 25
Clarksville ES 634 32 2 small 5 27 0 2 612 ‐22
Clemens Crossing ES 522 26 2 small 3 23 2 0 521 ‐1
Cradlerock ES 487 19 12 small 2 17 3 9 398 ‐89
Dayton Oaks ES 788 42 7 large 7 35 4 3 788 0Deep Run ES 601 33 3 med 3 30 2 1 672 71
Ducketts Lane ES 600 34 5 med 4 30 3 2 669 69
Elkridge ES 779 40 5 large 6 34 5 0 760 ‐19
Forest Ridge ES 626 33 5 med 3 30 3 2 669 43
Fulton ES 772 40 6 large 5 35 4 2 788 16
Gorman Crossing ES 713 37 7 large 6 31 5 2 700 ‐13
Guilford ES 462 24 3 small 3 21 2 1 465 3
Hammond ES 597 32 4 med 3 29 3 1 653 56
Hollifield Station ES 688 35 8 med 4 31 5 3 694 6
Ilchester ES 617 31 7 med 2 29 5 2 653 36
Jeffers Hill ES 421 22 4 small 3 19 3 1 421 0
Laurel Woods ES 540 26 4 small 2 24 4 0 540 0
Lisbon ES 553 28 3 small 5 23 1 2 527 ‐26
Longfellow ES 418 28 3 small 5 23 0 3 512 94
Manor Woods ES 647 34 8 med 4 30 5 3 681 34
Northfield ES 672 37 4 large 6 31 3 1 700 28
Phelps Luck ES 640 36 2 med 8 28 1 1 616 ‐24
Pointers Run ES 776 39 1 large 6 33 2 ‐1 744 ‐32
Rockburn ES 667 33 7 med 3 30 2 5 672 5
Running Brook ES 505 26 8 small 3 23 2 6 515 10
St John's Lane ES 597 29 7 small 2 27 4 3 612 15
Stevens Forest ES 433 23 2 small 5 18 3 ‐1 399 ‐34
Swansfield ES 528 26 7 small 3 23 2 5 521 ‐7
Talbott Springs ES 443 22 2 small 5 17 1 1 377 ‐66
Thunder Hill ES 468 25 4 small 2 23 3 1 509 41
Triadelphia Ridge ES 544 28 8 small 2 26 6 2 581 37
Veterans ES 788 42 7 large 6 36 3 4 788 0
Waterloo ES 594 33 6 small 3 30 2 4 663 69
Waverly ES 675 33 1 med 4 29 1 0 638 ‐37
West Friendship ES 396 20 3 small 2 18 3 0 414 18
Worthington ES 516 29 2 small 3 26 2 0 590 74
24290 1271 194 0 169 1102 112 82 24699 415
Net
Capacity
Rooms
Under‐sized
Rooms
assigned to
Rel. Arts
Net Under‐
sized
Rooms
Proposed
CapacityChange
Capacity‐
sized Rooms
for Rel. Arts
School Capacity
13‐14
Capacity‐
sized Rooms
Under‐sized
Rooms
Capacity
Catgory
HCPSS 2013‐14 Elementary School Capacity Update Page 24
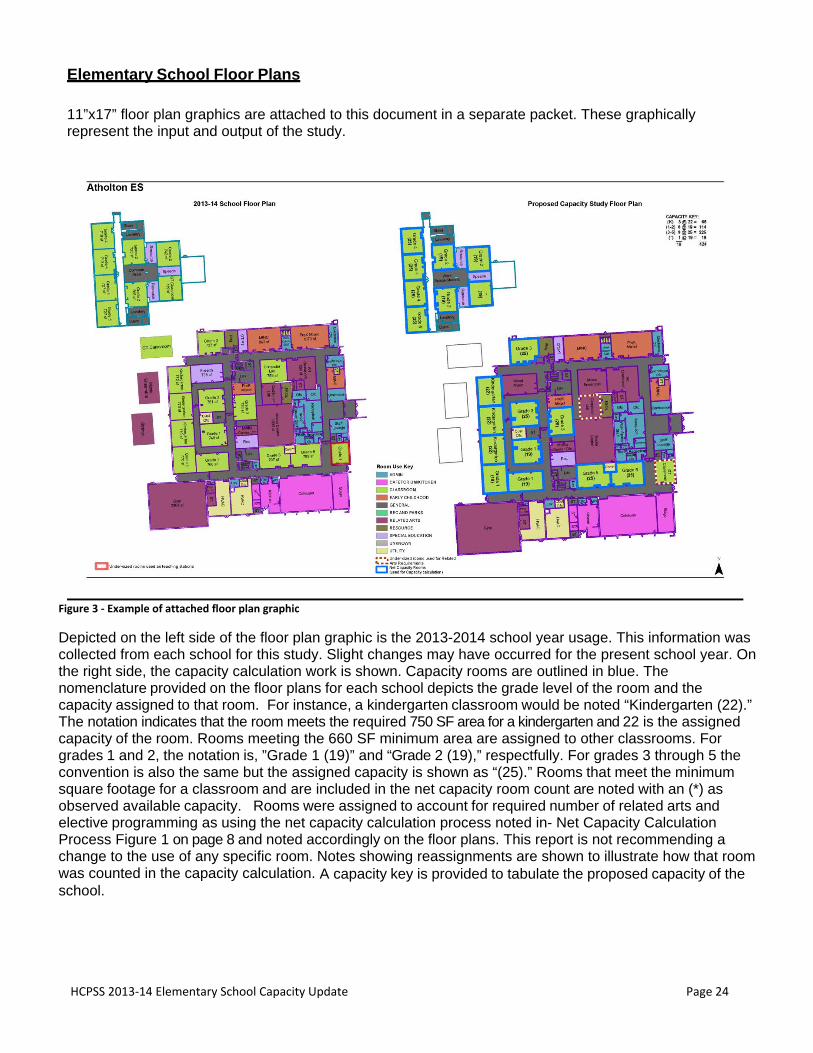
Elementary School Floor Plans 11”x17” floor plan graphics are attached to this document in a separate packet. These graphically represent the input and output of the study.
Figure 3 ‐ Example of attached floor plan graphic
Depicted on the left side of the floor plan graphic is the 2013-2014 school year usage. This information was collected from each school for this study. Slight changes may have occurred for the present school year. On the right side, the capacity calculation work is shown. Capacity rooms are outlined in blue. The nomenclature provided on the floor plans for each school depicts the grade level of the room and the capacity assigned to that room. For instance, a kindergarten classroom would be noted “Kindergarten (22).” The notation indicates that the room meets the required 750 SF area for a kindergarten and 22 is the assigned capacity of the room. Rooms meeting the 660 SF minimum area are assigned to other classrooms. For grades 1 and 2, the notation is, ”Grade 1 (19)” and “Grade 2 (19),” respectfully. For grades 3 through 5 the convention is also the same but the assigned capacity is shown as “(25).” Rooms that meet the minimum square footage for a classroom and are included in the net capacity room count are noted with an (*) as observed available capacity. Rooms were assigned to account for required number of related arts and elective programming as using the net capacity calculation process noted in- Net Capacity Calculation Process Figure 1 on page 8 and noted accordingly on the floor plans. This report is not recommending a change to the use of any specific room. Notes showing reassignments are shown to illustrate how that room was counted in the capacity calculation. A capacity key is provided to tabulate the proposed capacity of the school.

HCPSS 2013‐14 Elementary School Capacity Update Page 25
2013-2014 Elementary School Capacity Summaries
Tables 2 through 12 on pages 26 through 31 present detailed summary data for the capacity analysis. The following notations are used in these tables: CIP Capacity Elementary capacities presently reported in the current HCPSS Capital Improvement Program (CIP) in the FY2015 Capital Budget and other documents including the June 2014 Feasibility Study. Gross Capacity Rooms This measure is a count of all rooms meeting the minimum size of 660 SF. This count excludes regional programs, core spaces, and utility areas.
Undersized Classrooms Undersized classrooms are identified as those core classrooms (classrooms serving grades K-5) that do not meet the square footage requirements set forth in the HCPSS “Guidelines Manual for Renovations and Modernizations of Existing Schools” dated February 2009 (i.e. a minimum of 750 SF for kindergarten and a minimum of 660 SF for grades 1-5). Undersized classrooms do not receive capacity, but may be used to accommodate related arts requirements if they are 400 SF or greater in size. Relocatable Classrooms A modularized building type that is not a permanent structure integrated as part of the main building. They are usually installed on temporary piers versus standard foundations. Although these structures may house general instruction and meet the minimum square footage requirements, they are not assigned capacity. The number of relocatable classrooms is provided for information only. Official 9/30/2014 Enrollments The official September 30, 2013 enrollment numbers for the 2013-2014 school year have been provided for reference. State Rated Capacity The State Rated Capacity (SRC) is the number of students that the Maryland Interagency Committee (IAC) or its designee determines that an individual school has the physical capacity to enroll and can be reasonably accommodated in a facility. The SRC and the actual and projected enrollments are used by the IAC’s Designees and local jurisdictions to establish the utilization of a facility. Utilization is a criterion used by the IAC in evaluating whether a particular school is overcrowded such that relief is needed and provision of additional space through a capital project for capacity may be warranted. All permanent instructional spaces in an elementary school are counted in the SRC. These spaces include typical classrooms as well as self - contained special education classrooms that are used by the students receiving special education services outside the general classroom setting for more than 60percent of the school day. The spaces that are not counted towards the SRC include spaces used for special subject areas and used by different groups of students such as resource rooms, physical education rooms, the library media center, etc. State or locally owned relocatable classrooms are not counted towards capacity except when music and art programs located in the relocatable are provided more than 50 percent of the school week, one permanent classroom for each subject shall be deducted from the total number of classrooms before calculating the SRC. The SRC for an elementary school classroom depends upon assignment. Pre-kindergarten is 20 students per classroom. Kindergarten is 22 students per classroom. Grades 1 to 5 are 23 students per classroom. Self-Contained Special Education classroom is 10 students per classroom

HCPSS 2013‐14 Elementary School Capacity Update Page 26
Table 2 ‐ Capacity Summary: AES, BSES, BBES, BWES
Table 3 ‐ Capacity Summary: BPES, CLES, CES, CCES
2013-14 Elementary School Capacity Summary
387 762 663 355
18 33 30 16
(K) 22 / classroom 3 22 66 5 22 110 6 22 132 3 22 66
(1) 19 / classroom 3 19 57 6 19 114 6 19 114 3 19 57
(2) 19 / classroom 3 19 57 6 19 114 5 19 95 2 19 38
(3) 25 / classroom 3 25 75 4 25 100 5 25 125 2 25 50
(4) 25 / classroom 3 25 75 5 25 125 4 25 100 3 25 75
(5) 25 / classroom 3 25 75 4 25 100 4 25 100 3 25 75
(*) Observed Add'l Capacity 1 19 19 2 19 38
2 25 50
Total HCPSS Proposed Capacity (K-5) 424 751 666 361
19 34 30 16
2 0 0 7 0 0 3 0 0 4 0 0
3 0 0 5 0 0 2 0 0 3 0 0
385 626 677 334
411 685 684 365
Atholton Bellows Spring Bollman Bridge Bryant Woods
HCPSS CIP Capacity (referenced in the FY2015 Capital Budget)
2013-14 Actual Number of Teaching Stations (not including Special Education, Pre-K or Regional Programs)
Undersized Classrooms
Relocatable Classrooms
Official 9/30/2013 Enrollments (K-5; no Pre-K)
Total Number of Teaching Stations FY2015 Capacity
Total Proposed Number of Teaching Stations
State Rated Capacity (SRC)
2013-14 Elementary School Capacity Summary
788 628 634 522
35 28 28 24
(K) 22 / classroom 4 22 88 4 22 88 3 22 66 4 22 88
(1) 19 / classroom 4 19 76 5 19 95 4 19 76 3 19 57
(2) 19 / classroom 5 19 95 5 19 95 4 19 76 4 19 76
(3) 25 / classroom 5 25 125 4 25 100 3 25 75 4 25 100
(4) 25 / classroom 5 25 125 5 25 125 4 25 100 4 25 100
(5) 25 / classroom 4 25 100 5 25 125 5 25 125 4 25 100
(*) Observed Add'l Capacity 1 22 22 1 19 19 1 19 19
3 19 57 3 25 75
4 25 100
Total HCPSS Proposed Capacity (K-5) 788 647 612 521
35 29 27 23
7 0 0 2 0 0 2 0 0 2 0 0
0 0 0 5 0 0 1 0 0 3 0 0
582 699 523 502
617 640 526 525
Bushy Park Centennial Lane Clarksville Clemens Crossing
HCPSS CIP Capacity (referenced in the FY2015 Capital Budget)
2013-14 Actual Number of Teaching Stations (not including Special Education, Pre-K or Regional Programs)
Undersized Classrooms
Relocatable Classrooms
Official 9/30/2013 Enrollments (K-5; no Pre-K)
Total Number of Teaching Stations FY2015 Capacity
Total Proposed Number of Teaching Stations
State Rated Capacity (SRC)

HCPSS 2013‐14 Elementary School Capacity Update Page 27
Table 4 ‐ Capacity Summary: CRES, DOES, DRES, DLES
Table 5 ‐ Capacity Summary: EES, FRES, FES, GCES
2013-14 Elementary School Capacity Summary
487 788 601 600
22 35 28 27
(K) 22 / classroom 3 22 66 5 22 110 6 22 132 5 22 110
(1) 19 / classroom 2 19 38 6 19 114 4 19 76 5 19 95
(2) 19 / classroom 0 19 0 6 19 114 5 19 95 5 19 95
(3) 25 / classroom 3 25 75 6 25 150 4 25 100 4 25 100
(4) 25 / classroom 3 25 75 6 25 150 4 25 100 4 25 100
(5) 25 / classroom 3 25 75 6 25 150 4 25 100 4 25 100
(*) Observed Add'l Capacity 1 19 19 1 19 19 1 19 19
2 25 50 2 25 50 2 25 50
Total HCPSS Proposed Capacity (K-5) 398 788 672 669
17 35 30 30
12 0 0 7 19 0 3 0 0 5 0 0
3 0 0 0 0 0 4 0 0 0 0 0
441 596 598 595
319 800 615 616
Cradlerock Dayton Oaks Deep Run Ducketts Lane
HCPSS CIP Capacity (referenced in the FY2015 Capital Budget)
2013-14 Actual Number of Teaching Stations (not including Special Education, Pre-K or Regional Programs)
Undersized Classrooms
Relocatable Classrooms
Official 9/30/2013 Enrollments (K-5; no Pre-K)
Total Number of Teaching Stations FY2015 Capacity
Total Proposed Number of Teaching Stations
State Rated Capacity (SRC)
2013-14 Elementary School Capacity Summary
779 626 772 713
35 29 34 32
(K) 22 / classroom 6 22 132 5 22 110 5 22 110 5 22 110
(1) 19 / classroom 6 19 114 6 19 114 6 19 114 5 19 95
(2) 19 / classroom 6 19 114 4 19 76 6 19 114 5 19 95
(3) 25 / classroom 5 25 125 5 25 125 4 25 100 4 25 100
(4) 25 / classroom 6 25 150 4 25 100 4 25 100 4 25 100
(5) 25 / classroom 5 25 125 4 25 100 6 25 150 4 25 100
(*) Observed Add'l Capacity 1 19 19 4 25 100 4 25 100
1 25 25
Total HCPSS Proposed Capacity (K-5) 760 669 788 700
34 30 35 31
5 0 0 5 0 0 6 0 0 7 0 0
4 0 0 5 0 0 0 0 0 2 0 0
767 748 673 632
776 639 708 616
Elkridge Forest Ridge Fulton Gorman Crossing
HCPSS CIP Capacity (referenced in the FY2015 Capital Budget)
2013-14 Actual Number of Teaching Stations (not including Special Education, Pre-K or Regional Programs)
Undersized Classrooms
Relocatable Classrooms
Official 9/30/2013 Enrollments (K-5; no Pre-K)
Total Number of Teaching Stations FY2015 Capacity
Total Proposed Number of Teaching Stations
State Rated Capacity (SRC)

HCPSS 2013‐14 Elementary School Capacity Update Page 28
Table 6 ‐ Capacity Summary: GES, HES, HSES, IES
Table 7 ‐ Capacity Summary: JHES, LWES, LES, LoES
2013-14 Elementary School Capacity Summary
462 597 688 617
21 27 31 29
(K) 22 / classroom 4 22 88 4 22 88 5 22 110 4 22 88
(1) 19 / classroom 4 19 76 5 19 95 4 19 76 6 19 114
(2) 19 / classroom 4 19 76 5 19 95 6 19 114 4 19 76
(3) 25 / classroom 3 25 75 4 25 100 4 25 100 5 25 125
(4) 25 / classroom 3 25 75 4 25 100 4 25 100 5 25 125
(5) 25 / classroom 3 25 75 4 25 100 4 25 100 5 25 125
(*) Observed Add'l Capacity 3 25 75 1 19 19
3 25 75
Total HCPSS Proposed Capacity (K-5) 465 653 694 653
21 29 31 29
3 0 0 4 0 0 8 0 0 7 0 0
5 0 0 1 0 0 3 0 0 2 0 0
470 602 689 724
479 594 616 663
Guilford Hammond Hollifield Station Ilchester
HCPSS CIP Capacity (referenced in the FY2015 Capital Budget)
2013-14 Actual Number of Teaching Stations (not including Special Education, Pre-K or Regional Programs)
Undersized Classrooms
Relocatable Classrooms
Official 9/30/2013 Enrollments (K-5; no Pre-K)
Total Number of Teaching Stations FY2015 Capacity
Total Proposed Number of Teaching Stations
State Rated Capacity (SRC)
2013-14 Elementary School Capacity Summary
421 540 553 418
19 24 25 19
(K) 22 / classroom 2 22 44 4 22 88 2 22 44 3 22 66
(1) 19 / classroom 4 19 76 4 19 76 3 19 57 5 19 95
(2) 19 / classroom 4 19 76 4 19 76 3 19 57 3 19 57
(3) 25 / classroom 3 25 75 4 25 100 3 25 75 3 25 75
(4) 25 / classroom 3 25 75 4 25 100 4 25 100 3 25 75
(5) 25 / classroom 3 25 75 4 25 100 3 25 75 3 25 75
(*) Observed Add'l Capacity 1 19 19 1 19 19
4 25 100 2 25 50
Total HCPSS Proposed Capacity (K-5) 421 540 527 512
19 24 23 23
4 0 0 4 0 0 3 0 0 3 0 0
2 0 0 6 0 0 1 0 0 8 0 0
407 539 400 421
435 548 412 457
Jeffers Hill Laurel Woods Lisbon Longfellow
HCPSS CIP Capacity (referenced in the FY2015 Capital Budget)
2013-14 Actual Number of Teaching Stations (not including Special Education, Pre-K or Regional Programs)
Undersized Classrooms
Relocatable Classrooms
Official 9/30/2013 Enrollments (K-5; no Pre-K)
Total Number of Teaching Stations FY2015 Capacity
Total Proposed Number of Teaching Stations
State Rated Capacity (SRC)

HCPSS 2013‐14 Elementary School Capacity Update Page 29
Table 8 ‐ Capacity Summary: MWES, NES, PLES, PRES
Table 9 ‐ Capacity Summary: RES, RBES, SJLES, SFES
2013-14 Elementary School Capacity Summary
647 672 640 776
29 30 28 35
(K) 22 / classroom 5 22 110 5 22 110 4 22 88 7 22 154
(1) 19 / classroom 4 19 76 5 19 95 6 19 114 4 19 76
(2) 19 / classroom 4 19 76 5 19 95 6 19 114 6 19 114
(3) 25 / classroom 4 25 100 5 25 125 4 25 100 4 25 100
(4) 25 / classroom 4 25 100 5 25 125 4 25 100 6 25 150
(5) 25 / classroom 5 25 125 6 25 150 4 25 100 6 25 150
(*) Observed Add'l Capacity 1 19 19
3 25 75
Total HCPSS Proposed Capacity (K-5) 681 700 616 744
30 31 28 33
8 0 0 4 0 0 2 0 0 1 0 0
1 0 0 1 0 0 7 0 0 9 0 0
676 723 543 752
593 708 640 752
Phelps Luck Manor Woods Northfield Pointers Run
HCPSS CIP Capacity (referenced in the FY2015 Capital Budget)
2013-14 Actual Number of Teaching Stations (not including Special Education, Pre-K or Regional Programs)
Undersized Classrooms
Relocatable Classrooms
Official 9/30/2013 Enrollments (K-5; no Pre-K)
Total Number of Teaching Stations FY2015 Capacity
Total Proposed Number of Teaching Stations
State Rated Capacity (SRC)
2013-14 Elementary School Capacity Summary
667 505 597 433
31 22 27 19
(K) 22 / classroom 4 22 88 4 22 88 5 22 110 3 22 66
(1) 19 / classroom 4 19 76 2 19 38 5 19 95 4 19 76
(2) 19 / classroom 6 19 114 3 19 57 3 19 57 3 19 57
(3) 25 / classroom 5 25 125 3 25 75 5 25 125 2 25 50
(4) 25 / classroom 4 25 100 4 25 100 4 25 100 3 25 75
(5) 25 / classroom 4 25 100 4 25 100 4 25 100 3 25 75
(*) Observed Add'l Capacity 1 19 19 3 19 57 1 25 25
2 25 50
Total HCPSS Proposed Capacity (K-5) 672 515 612 399
30 23 27 18
7 0 0 8 0 0 7 0 0 2 0 0
1 0 0 6 0 0 3 0 0 7 0 0
654 462 681 423
617 456 593 411
Running Brook St. John's Lane Stevens Forest Rockburn
HCPSS CIP Capacity (referenced in the FY2015 Capital Budget)
2013-14 Actual Number of Teaching Stations (not including Special Education, Pre-K or Regional Programs)
Undersized Classrooms
Relocatable Classrooms
Official 9/30/2013 Enrollments (K-5; no Pre-K)
Total Number of Teaching Stations FY2015 Capacity
Total Proposed Number of Teaching Stations
State Rated Capacity (SRC)

HCPSS 2013‐14 Elementary School Capacity Update Page 30
Table 10 ‐ Capacity Summary: SES, TSES, THES, TRES
Table 11 ‐ Capacity Summary: VES, WTES, WVES, WFES
2013-14 Elementary School Capacity Summary
528 443 468 544
24 20 21 25
(K) 22 / classroom 4 22 88 4 22 88 4 22 88 4 22 88
(1) 19 / classroom 5 19 95 3 19 57 4 19 76 4 19 76
(2) 19 / classroom 2 19 38 3 19 57 4 19 76 4 19 76
(3) 25 / classroom 4 25 100 3 25 75 4 25 100 3 25 75
(4) 25 / classroom 4 25 100 2 25 50 3 25 75 4 25 100
(5) 25 / classroom 4 25 100 1 25 25 3 25 75 3 25 75
(*) Observed Add'l Capacity 1 25 25 1 19 19 1 22 22
1 19 19
2 25 50
Total HCPSS Proposed Capacity (K-5) 521 377 509 581
23 17 23 26
7 0 0 2 0 0 4 0 0 8 0 0
4 0 0 7 0 0 0 0 0 0 0 0
560 405 470 485
525 364 502 502
Swansfield Talbott Springs Triadelphia Ridge Thunder Hill
HCPSS CIP Capacity (referenced in the FY2015 Capital Budget)
2013-14 Actual Number of Teaching Stations (not including Special Education, Pre-K or Regional Programs)
Undersized Classrooms
Relocatable Classrooms
Official 9/30/2013 Enrollments (K-5; no Pre-K)
Total Number of Teaching Stations FY2015 Capacity
Total Proposed Number of Teaching Stations
State Rated Capacity (SRC)
2013-14 Elementary School Capacity Summary
788 594 675 396
35 27 30 18
(K) 22 / classroom 6 22 132 5 22 110 5 22 110 2 22 44
(1) 19 / classroom 7 19 133 4 19 76 6 19 114 3 19 57
(2) 19 / classroom 4 19 76 4 19 76 6 19 114 2 19 38
(3) 25 / classroom 6 25 150 4 25 100 4 25 100 2 25 50
(4) 25 / classroom 6 25 150 4 25 100 4 25 100 2 25 50
(5) 25 / classroom 5 25 125 4 25 100 4 25 100 2 25 50
(*) Observed Add'l Capacity 1 22 22 4 19 76 5 25 125
1 25 25
Total HCPSS Proposed Capacity (K-5) 788 663 638 414
35 30 29 18
7 0 201 6 0 0 1 0 0 3 0 0
6 0 0 4 0 0 3 0 0 0 0 0
765 563 724 287
776 570 662 297
Waterloo Waverly West Friendship Veterans
HCPSS CIP Capacity (referenced in the FY2015 Capital Budget)
2013-14 Actual Number of Teaching Stations (not including Special Education, Pre-K or Regional Programs)
Undersized Classrooms
Relocatable Classrooms
Official 9/30/2013 Enrollments (K-5; no Pre-K)
Total Number of Teaching Stations FY2015 Capacity
Total Proposed Number of Teaching Stations
State Rated Capacity (SRC)

HCPSS 2013‐14 Elementary School Capacity Update Page 31
Table 12 ‐ Capacity Summary: WoES
2013-14 Elementary School Capacity Summary
516
24
(K) 22 / classroom 4 22 88
(1) 19 / classroom 4 19 76
(2) 19 / classroom 4 19 76
(3) 25 / classroom 3 25 75
(4) 25 / classroom 4 25 100
(5) 25 / classroom 4 25 100
(*) Observed Add'l Capacity 3 25 75
Total HCPSS Proposed Capacity (K-5) 590
26
2 0 0
1 0 0
524
525
Worthington
HCPSS CIP Capacity (referenced in the FY2015 Capital Budget)
2013-14 Actual Number of Teaching Stations (not including Special Education, Pre-K or Regional Programs)
Undersized Classrooms
Relocatable Classrooms
Official 9/30/2013 Enrollments (K-5; no Pre-K)
Total Number of Teaching Stations FY2015 Capacity
Total Proposed Number of Teaching Stations
State Rated Capacity (SRC)

Gilbert Architects
HCPSS 2013‐14 Elementary School Capacity Update Page 32
Table 13 – Elementary Regional Programs
School Program Notes
Atholton ES Pre-K, Preschool, MINC Bellows Spring ES Pre-K, Preschool, MINC, EB Bollman Bridge ES Title I TAS, Pre-K, Preschool, MINC Bryant Woods ES Title I, Pilot Full-day Pre-K Bushy Park ES Pre-K, Preschool Cradlerock ES Title I, Pre-K, Preschool Dayton Oaks ES Pre-K, Preschool, MINC, EB Deep Run ES Title I TAS, Pre-K, Preschool, MINC Ducketts Lane ES Pre-K, Preschool , MINC Fulton ES Pre-K, Regional ED Gorman Crossing ES Pre-K, Preschool, MINC Guilford ES Title I, Pre-K Hollifield Station ES Pre-K, Preschool, MINC Ilchester ES Pre-K, Preschool, MINC, ES PL Laurel Woods ES Title I, Pre-K Longfellow ES Title I TAS, Pre-K Phelps Luck ES Title I, Pilot Full-day Pre-K Pointers Run ES Pre-K, Preschool, MINC, ES PL, ALS Rockburn ES Pre-K, Preschool Running Brook ES Title I, Pilot Full-day Pre-K, Preschool Stevens Forest ES Title I, Pilot Full-day Pre-K Swansfield ES Title I, Pre-K Talbott Springs ES Title I, Pilot Full-day Pre-K Thunder Hill ES ALS Triadelphia Ridge ES EB Veterans ES EB, Pre-K, Preschool, MINC Waterloo ES Pre-K, Regional ED, Preschool, MINC Waverly ES Pre-K, ALS, Preschool, MINC, ES PL West Friendship ES ALS
Notations for Table 13:
ALS Regional Academic Life Skills Preschool Preschool Program, including Parent Assisted Learning at Schools Pre-K Income qualifying Pre-K program EB Early Beginnings - SE services for very young children Title 1 State approved based upon income Regional ED Regional Emotional Disturbance Program draws from other schools Construction Swing space for year round construction project MINC Multiple Intensive Needs Classroom (Toddler, Preschool/K, and/or Early Learner) ES PL Elementary School Primary Learner Program

Gilbert Architects
HCPSS 2013‐14 Elementary School Capacity Update Page 33
Table 14 ‐ Official Enrollment Report 9/30/13
Elementary Schools PK K Gr 1 Gr 2 Gr 3 Gr 4 Gr 5 Total Count K 1-5 Total
Atholton ES 36 50 71 58 57 72 77 421 50 335 385
Bellows Spring ES 42 100 101 110 106 108 101 668 100 526 626
Bollman Bridge ES 90 114 125 96 123 110 109 767 114 563 677
Bryant Woods ES 33 48 55 54 53 70 54 367 48 286 334
Bushy Park ES 26 79 85 93 93 120 112 608 79 503 582
Centennial Lane ES 0 88 107 115 114 141 134 699 88 611 699
Clarksville ES 0 62 78 87 82 97 117 523 62 461 523
Clemens Crossing ES 0 77 82 96 80 82 85 502 77 425 502
Cradlerock ES 79 96 63 68 86 66 62 520 96 345 441
Dayton Oaks ES 40 83 93 94 98 119 109 636 83 513 596
Deep Run ES 59 128 92 105 97 90 86 657 128 470 598
Ducketts Lane ES 67 120 99 106 89 96 85 662 120 475 595
Elkridge ES 0 115 110 133 132 142 135 767 115 652 767
Forest Ridge ES 0 119 148 111 135 105 130 748 119 629 748
Fulton ES 30 102 102 114 99 110 146 703 102 571 673
Gorman Crossing ES 54 106 105 117 97 113 94 686 106 526 632
Guilford ES 27 74 76 88 72 78 82 497 74 396 470
Hammond ES 0 92 104 96 107 102 101 602 92 510 602
Hollifield Station ES 56 111 110 116 120 110 122 745 111 578 689
Ilchester ES 52 109 123 124 117 135 116 776 109 615 724
Jeffers Hill ES 0 58 68 82 76 65 58 407 58 349 407
Laurel Woods ES 33 100 83 75 94 93 94 572 100 439 539
Lisbon ES 0 67 59 52 60 88 74 400 67 333 400
Longfellow ES 36 70 58 79 74 74 66 457 70 351 421
Manor Woods ES 0 99 100 105 116 119 137 676 99 577 676
Northfield ES 0 98 112 109 127 135 142 723 98 625 723
Phelps Luck ES 19 85 109 110 91 66 82 562 85 458 543
Pointers Run ES 38 121 106 119 106 151 149 790 121 631 752
Rockburn ES 56 104 93 114 113 108 122 710 104 550 654
Running Brook ES 30 85 81 83 71 75 67 492 85 377 462
St. John's Lane ES 0 117 107 110 130 113 104 681 117 564 681
Stevens Forest ES 0 76 78 76 62 58 73 423 76 347 423
Swans field ES 34 100 92 106 88 81 93 594 100 460 560
Talbott Springs ES 36 64 70 73 77 58 63 441 64 341 405
Thunder Hill ES 0 78 89 89 85 72 57 470 78 392 470
Triadelphia Ridge ES 0 78 82 85 73 87 80 485 78 407 485
Veterans ES 56 130 123 120 131 132 129 821 130 635 765
Waterloo ES 54 107 87 92 81 95 101 617 107 456 563
Waverly ES 35 96 114 135 121 132 126 759 96 628 724
West Friends hip ES 0 43 50 39 52 49 54 287 43 244 287
Worthington ES 0 79 95 87 82 101 80 524 79 445 524
Total 1,118 3,728 3,785 3,921 3,867 4,018 4,008 24,445 3,728 19,599 23,327