he rise of corporate market power and its …
TRANSCRIPT

Wenjie Chen, Federico Díez (lead author), Romain Duval (lead author), Callum Jones, Carolina Villegas-Sanchez (consultant) with contributions from Mai Dao, Nan Li, and support from Jiayue Fan and Christopher Johns.
THE RISE OF CORPORATE MARKET POWER AND ITS
MACROECONOMIC EFFECTS
APRIL 2019 IMF WEO CHAPTER 2
ROMAIN DUVAL
ADVISOR TO THE CHIEF ECONOMIST
INTERNATIONAL MONETARY FUND
BANQUE NATIONALE DE BELGIQUE, 9TH APRIL 2019
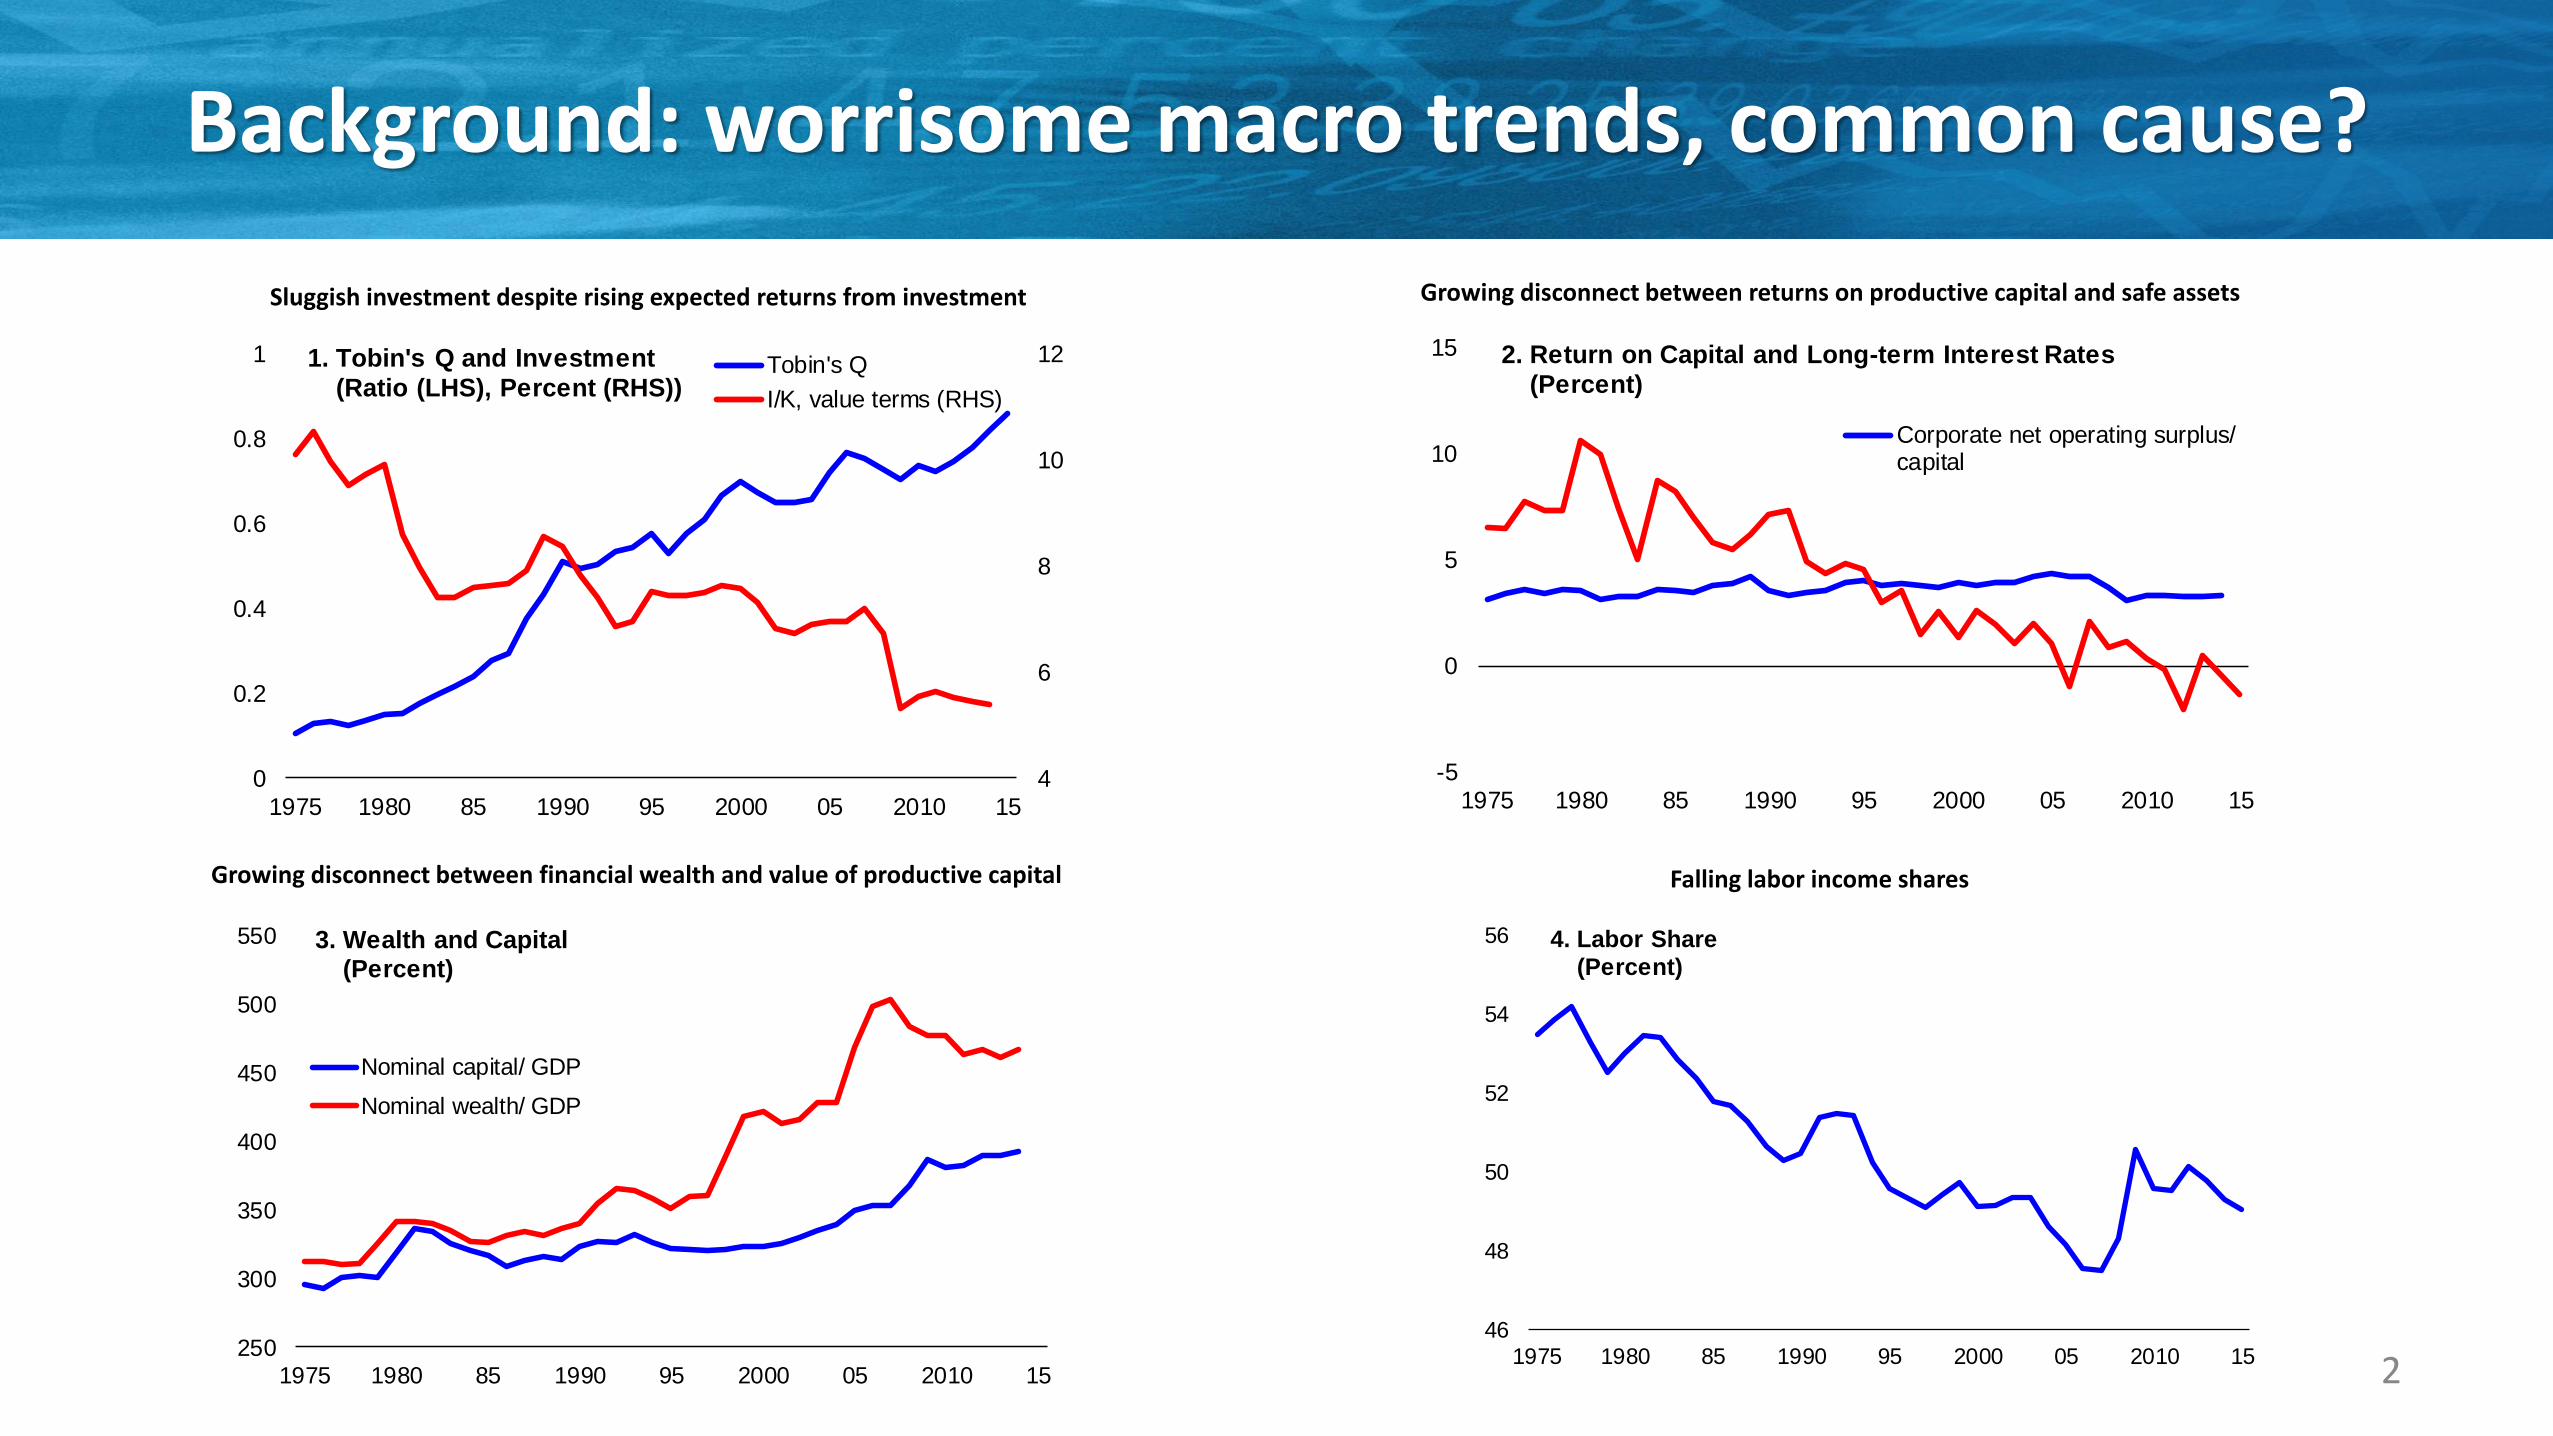
Background: worrisome macro trends, common cause?
2
Sluggish investment despite rising expected returns from investment Growing disconnect between returns on productive capital and safe assets
Growing disconnect between financial wealth and value of productive capital Falling labor income shares
4
6
8
10
12
0
0.2
0.4
0.6
0.8
1
1975 1980 85 1990 95 2000 05 2010 15
1. Tobin's Q and Investment(Ratio (LHS), Percent (RHS))
Tobin's Q
I/K, value terms (RHS)
-5
0
5
10
15
1975 1980 85 1990 95 2000 05 2010 15
2. Return on Capital and Long-term Interest Rates(Percent)
Corporate net operating surplus/capital
250
300
350
400
450
500
550
1975 1980 85 1990 95 2000 05 2010 15
3. Wealth and Capital(Percent)
Nominal capital/ GDP
Nominal wealth/ GDP
46
48
50
52
54
56
1975 1980 85 1990 95 2000 05 2010 15
4. Labor Share(Percent)

Unsettled Literature
• Factso Large increases in markups (~ 40-50% in AEs since 1980), particularly in the US, but focus on listed
firms (De Loecker and Eeckhout, 2017, 2018; Diez et al, 2018) o Increases in industry concentration, larger in US than EU (Gutierrez and Philippon, 2018; Bajgar et
al., 2019). But hard to interpret (Shapiro, 2019; Rossi-Hansberg et al, 2018…etc)
• Implications for growth and income distributiono Could be behind macro trends (Caballero et al., 2017; Eggertsson et al., 2018; Stiglitz, 2015)o But empirical evidence still patchy (De Loecker and Eeckhout, 2017, 2018; Diez et al., 2018)
• Driverso Dismal view: antitrust enforcement (Gutierrez and Philippon, 2018)o Benign view: technology/reallocation/superstars (Autor et al., 2018; Baqaee and Farhi, 2017;
Calligaris et al., 2018; Syverson, 2018; Van Reenen, 2018)
• Policy implications. Do we need to strengthen/rethink competition law and policy? (US) 3
Questions
• Facts. Has corporate market power increased? How do trends in market power differ across countries (US vs EU), industries and firms?
• Implications for growth and income distribution:o Impact on innovation, investment? What implications for interest rates, inflation and slack post-2008 financial crisis? o Contribution to fall in labor income shares?
• Drivers? Changing structure of product markets or policy-driven weakening of competition?
• Policy implications. What policy implications and in which areas?
4

Approaches
Data:o Large cross-country firm-level dataset (cleaned Orbis) for which data coverage is good: 27 countries, of which 2/3 are AEs ➔ goes (way) beyond existing studies (includes private firms)
o Market power: mainly markups, mostly following De Loecker and Warzynski (AER 2012)
• Macroeconomic implications:o Firm-level and industry-level regressions, address endogeneity through IV techniques
o DSGE model-based analysis, for EA and US, of: - Impact of trend rise in markups on inflation, output, interest rates, impact of the crisis- Output-inflation trade-off
5
Main Findings
• Facts:o Moderate increase in market power across AEs. Broad-based across countries and industries, albeit with some heterogeneity: US > EUo Rise concentrated among small fraction of high-markup firms – US seems different
• Macroeconomic effects: modest so far but could become increasingly negativeo Growth: - Investment: 3% lower K stock, 1% lower output in average AE today relative to counterfactual- Innovation: ~ 0 effect so far but increasingly < 0 in future if market power rose further- Macroeconomic stabilization: tougher, including after 2008 crisis, due to lower natural rateo Income distribution: at least 10% (~ 0.2 pct pt) of decline in labor shares in average AE
• Drivers? Tentative evidence supporting market forces (e.g. technology) story more than policy-driven weakening of competition
• Policy implications: product market (de)regulation, competition policy, technological diffusion 6

Market Power Trends Across Countries, Industries, and Firms
7
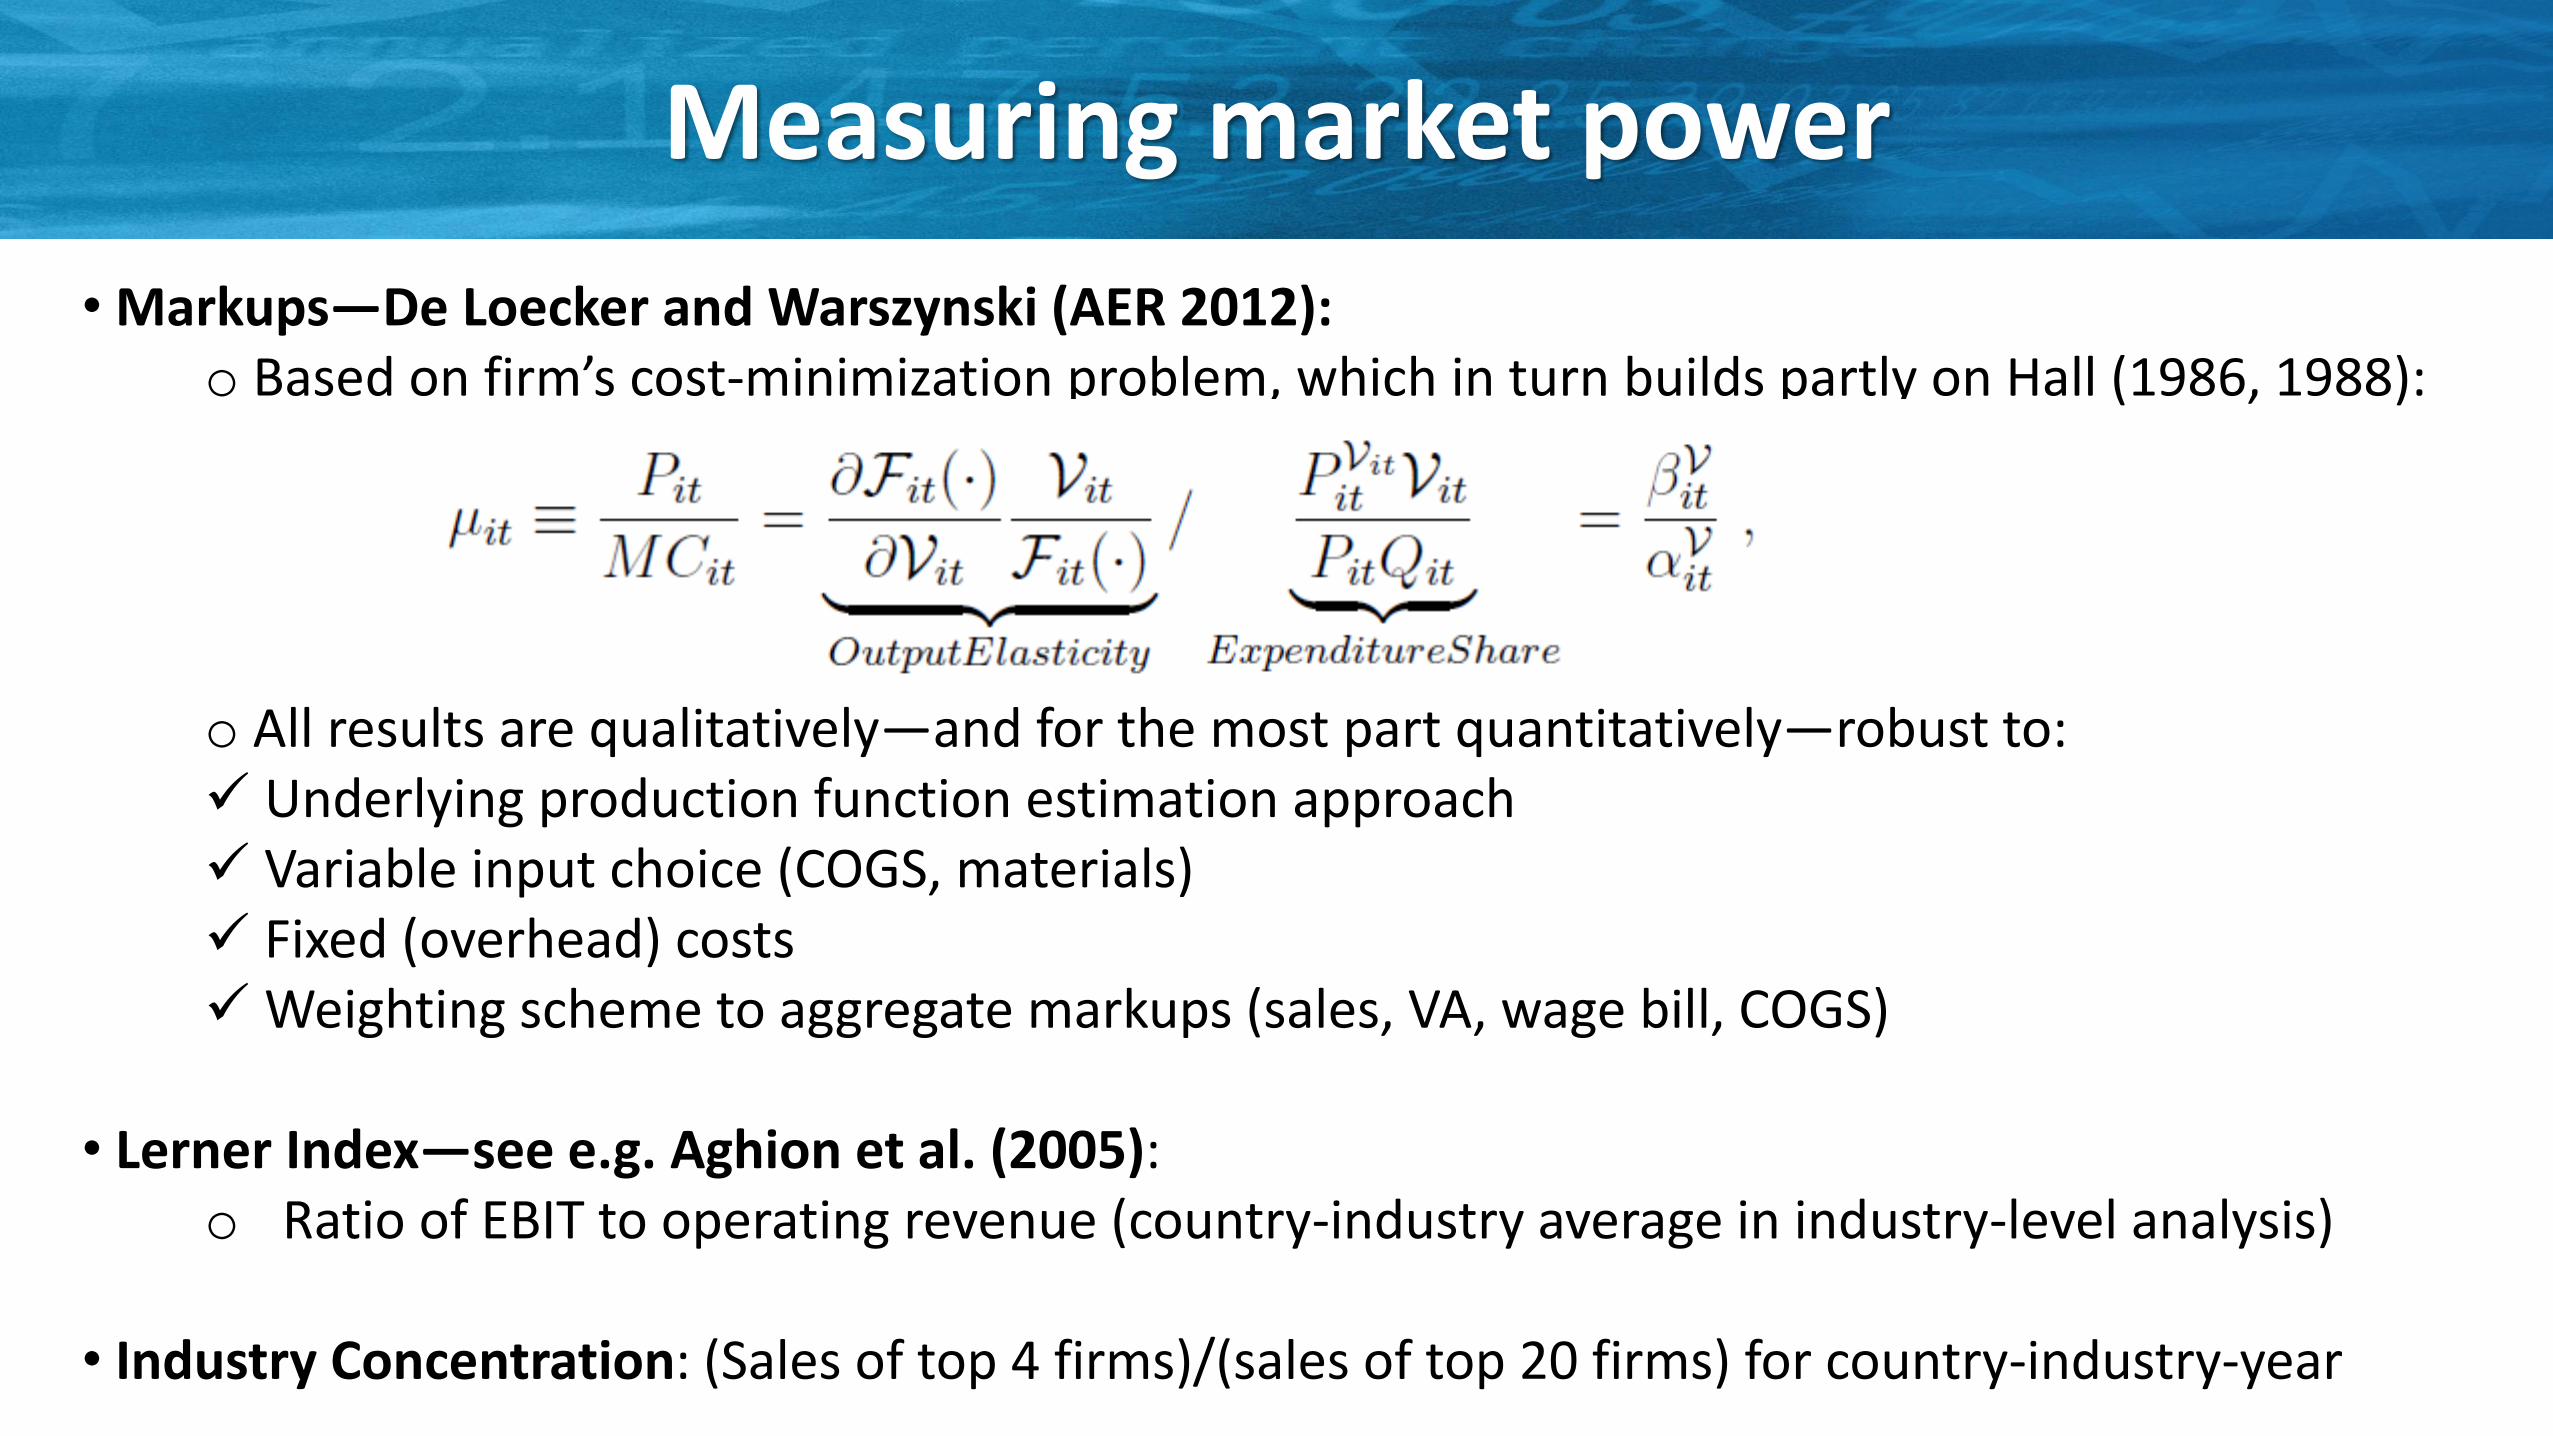
Measuring market power
• Markups—De Loecker and Warszynski (AER 2012):o Based on firm’s cost-minimization problem, which in turn builds partly on Hall (1986, 1988):
o All results are qualitatively—and for the most part quantitatively—robust to:✓ Underlying production function estimation approach✓ Variable input choice (COGS, materials)✓ Fixed (overhead) costs✓Weighting scheme to aggregate markups (sales, VA, wage bill, COGS)
• Lerner Index—see e.g. Aghion et al. (2005): o Ratio of EBIT to operating revenue (country-industry average in industry-level analysis)
• Industry Concentration: (Sales of top 4 firms)/(sales of top 20 firms) for country-industry-year
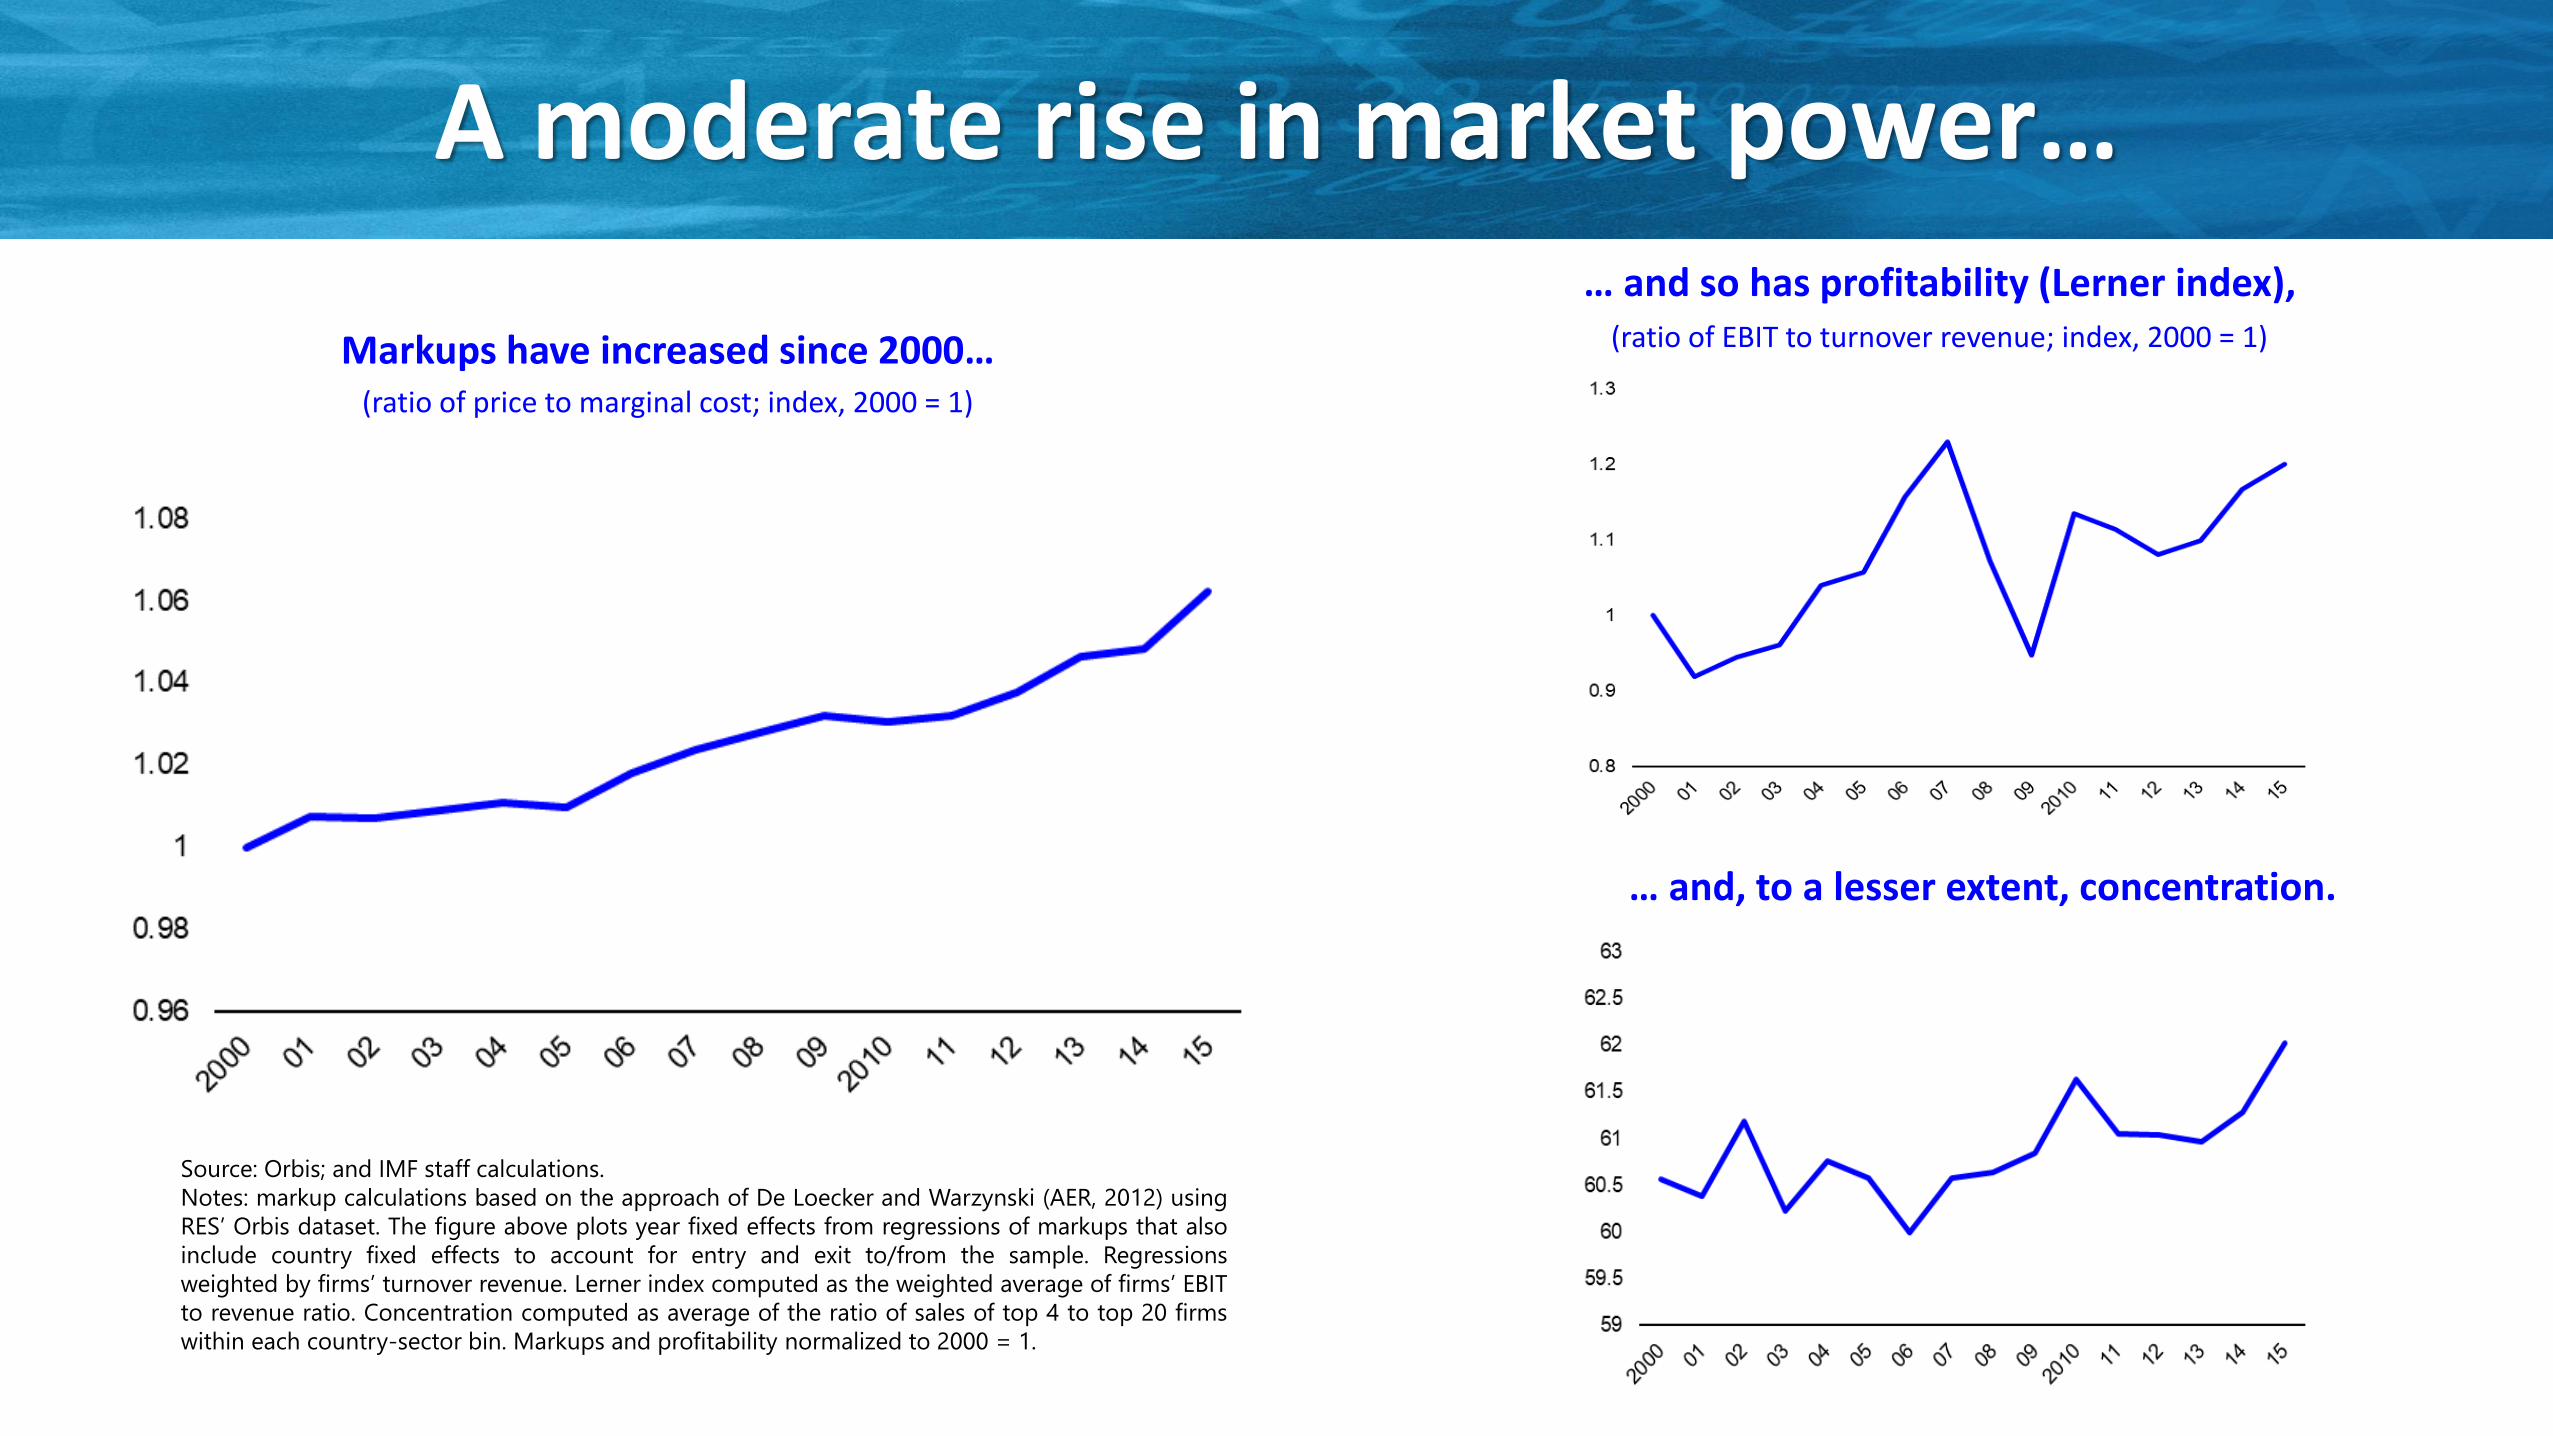
A moderate rise in market power…
Source: Orbis; and IMF staff calculations.
Notes: markup calculations based on the approach of De Loecker and Warzynski (AER, 2012) using
RES’ Orbis dataset. The figure above plots year fixed effects from regressions of markups that also
include country fixed effects to account for entry and exit to/from the sample. Regressions
weighted by firms’ turnover revenue. Lerner index computed as the weighted average of firms’ EBIT
to revenue ratio. Concentration computed as average of the ratio of sales of top 4 to top 20 firms
within each country-sector bin. Markups and profitability normalized to 2000 = 1.
Markups have increased since 2000…(ratio of price to marginal cost; index, 2000 = 1)
… and so has profitability (Lerner index),(ratio of EBIT to turnover revenue; index, 2000 = 1)
… and, to a lesser extent, concentration.
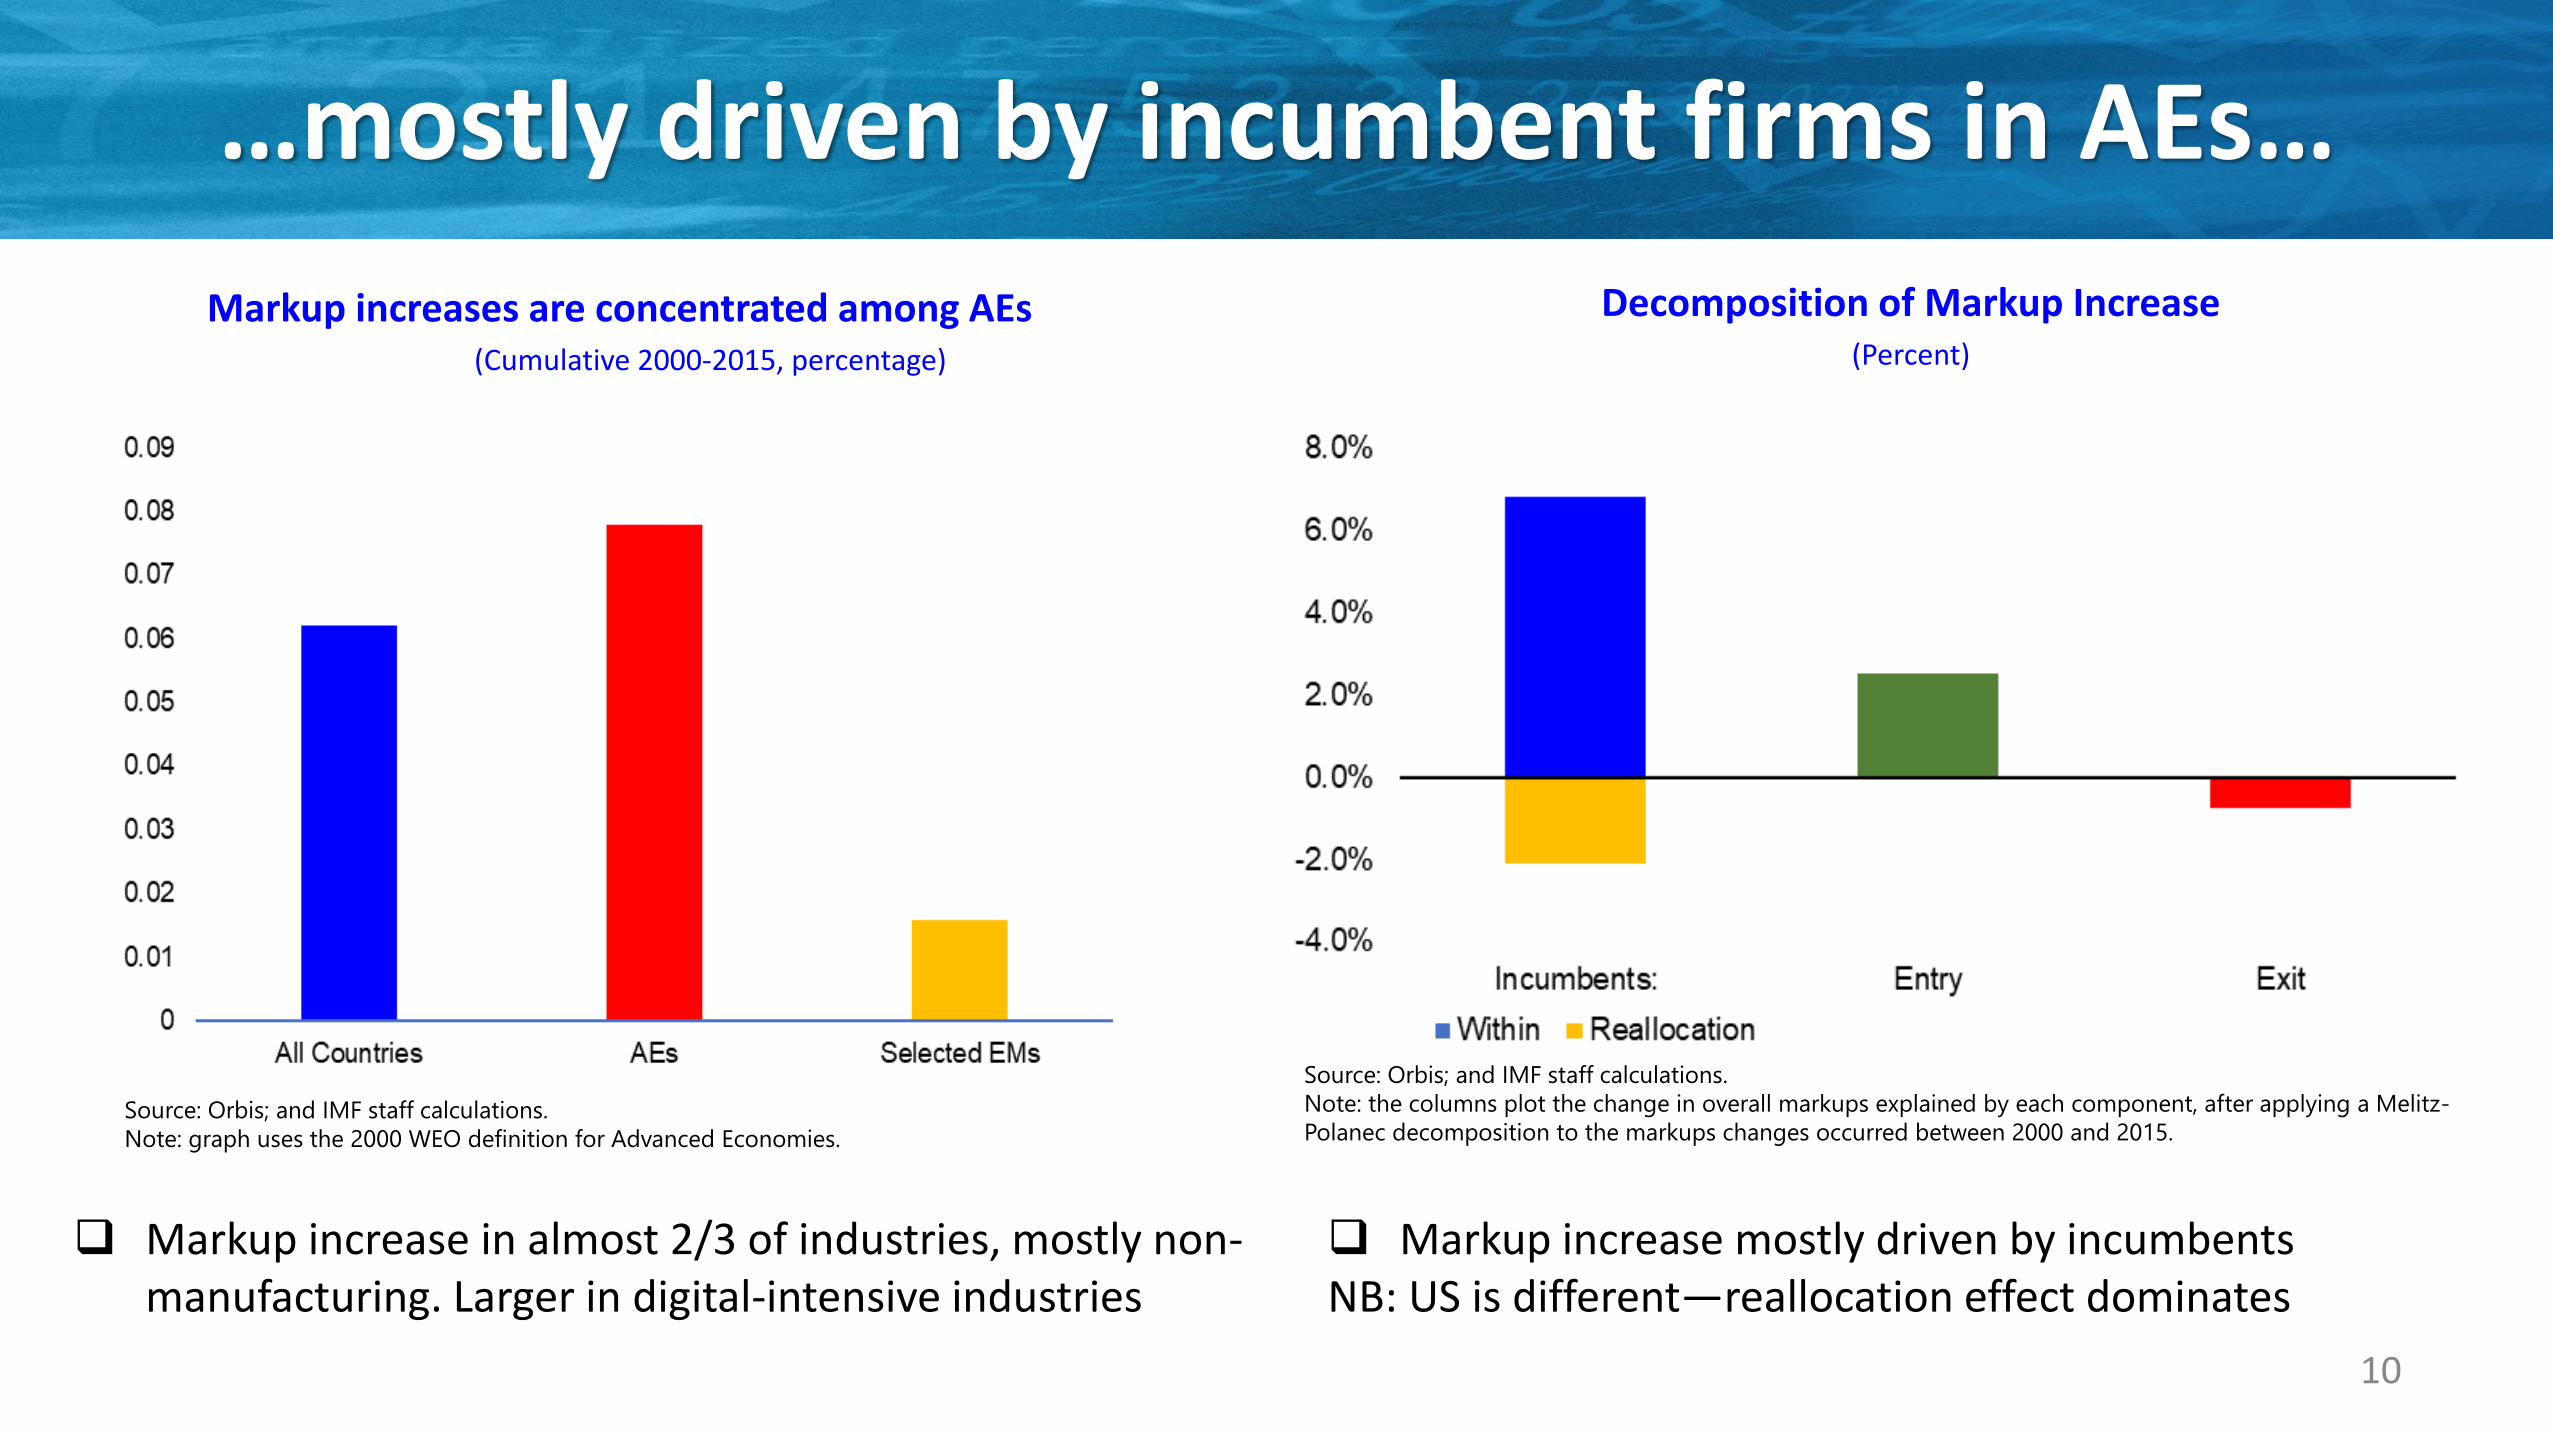
…mostly driven by incumbent firms in AEs…
❑ Markup increase in almost 2/3 of industries, mostly non-manufacturing. Larger in digital-intensive industries
Markup increases are concentrated among AEs(Cumulative 2000-2015, percentage)
Source: Orbis; and IMF staff calculations.
Note: graph uses the 2000 WEO definition for Advanced Economies.
Decomposition of Markup Increase (Percent)
Source: Orbis; and IMF staff calculations.
Note: the columns plot the change in overall markups explained by each component, after applying a Melitz-
Polanec decomposition to the markups changes occurred between 2000 and 2015.
❑ Markup increase mostly driven by incumbentsNB: US is different—reallocation effect dominates
10
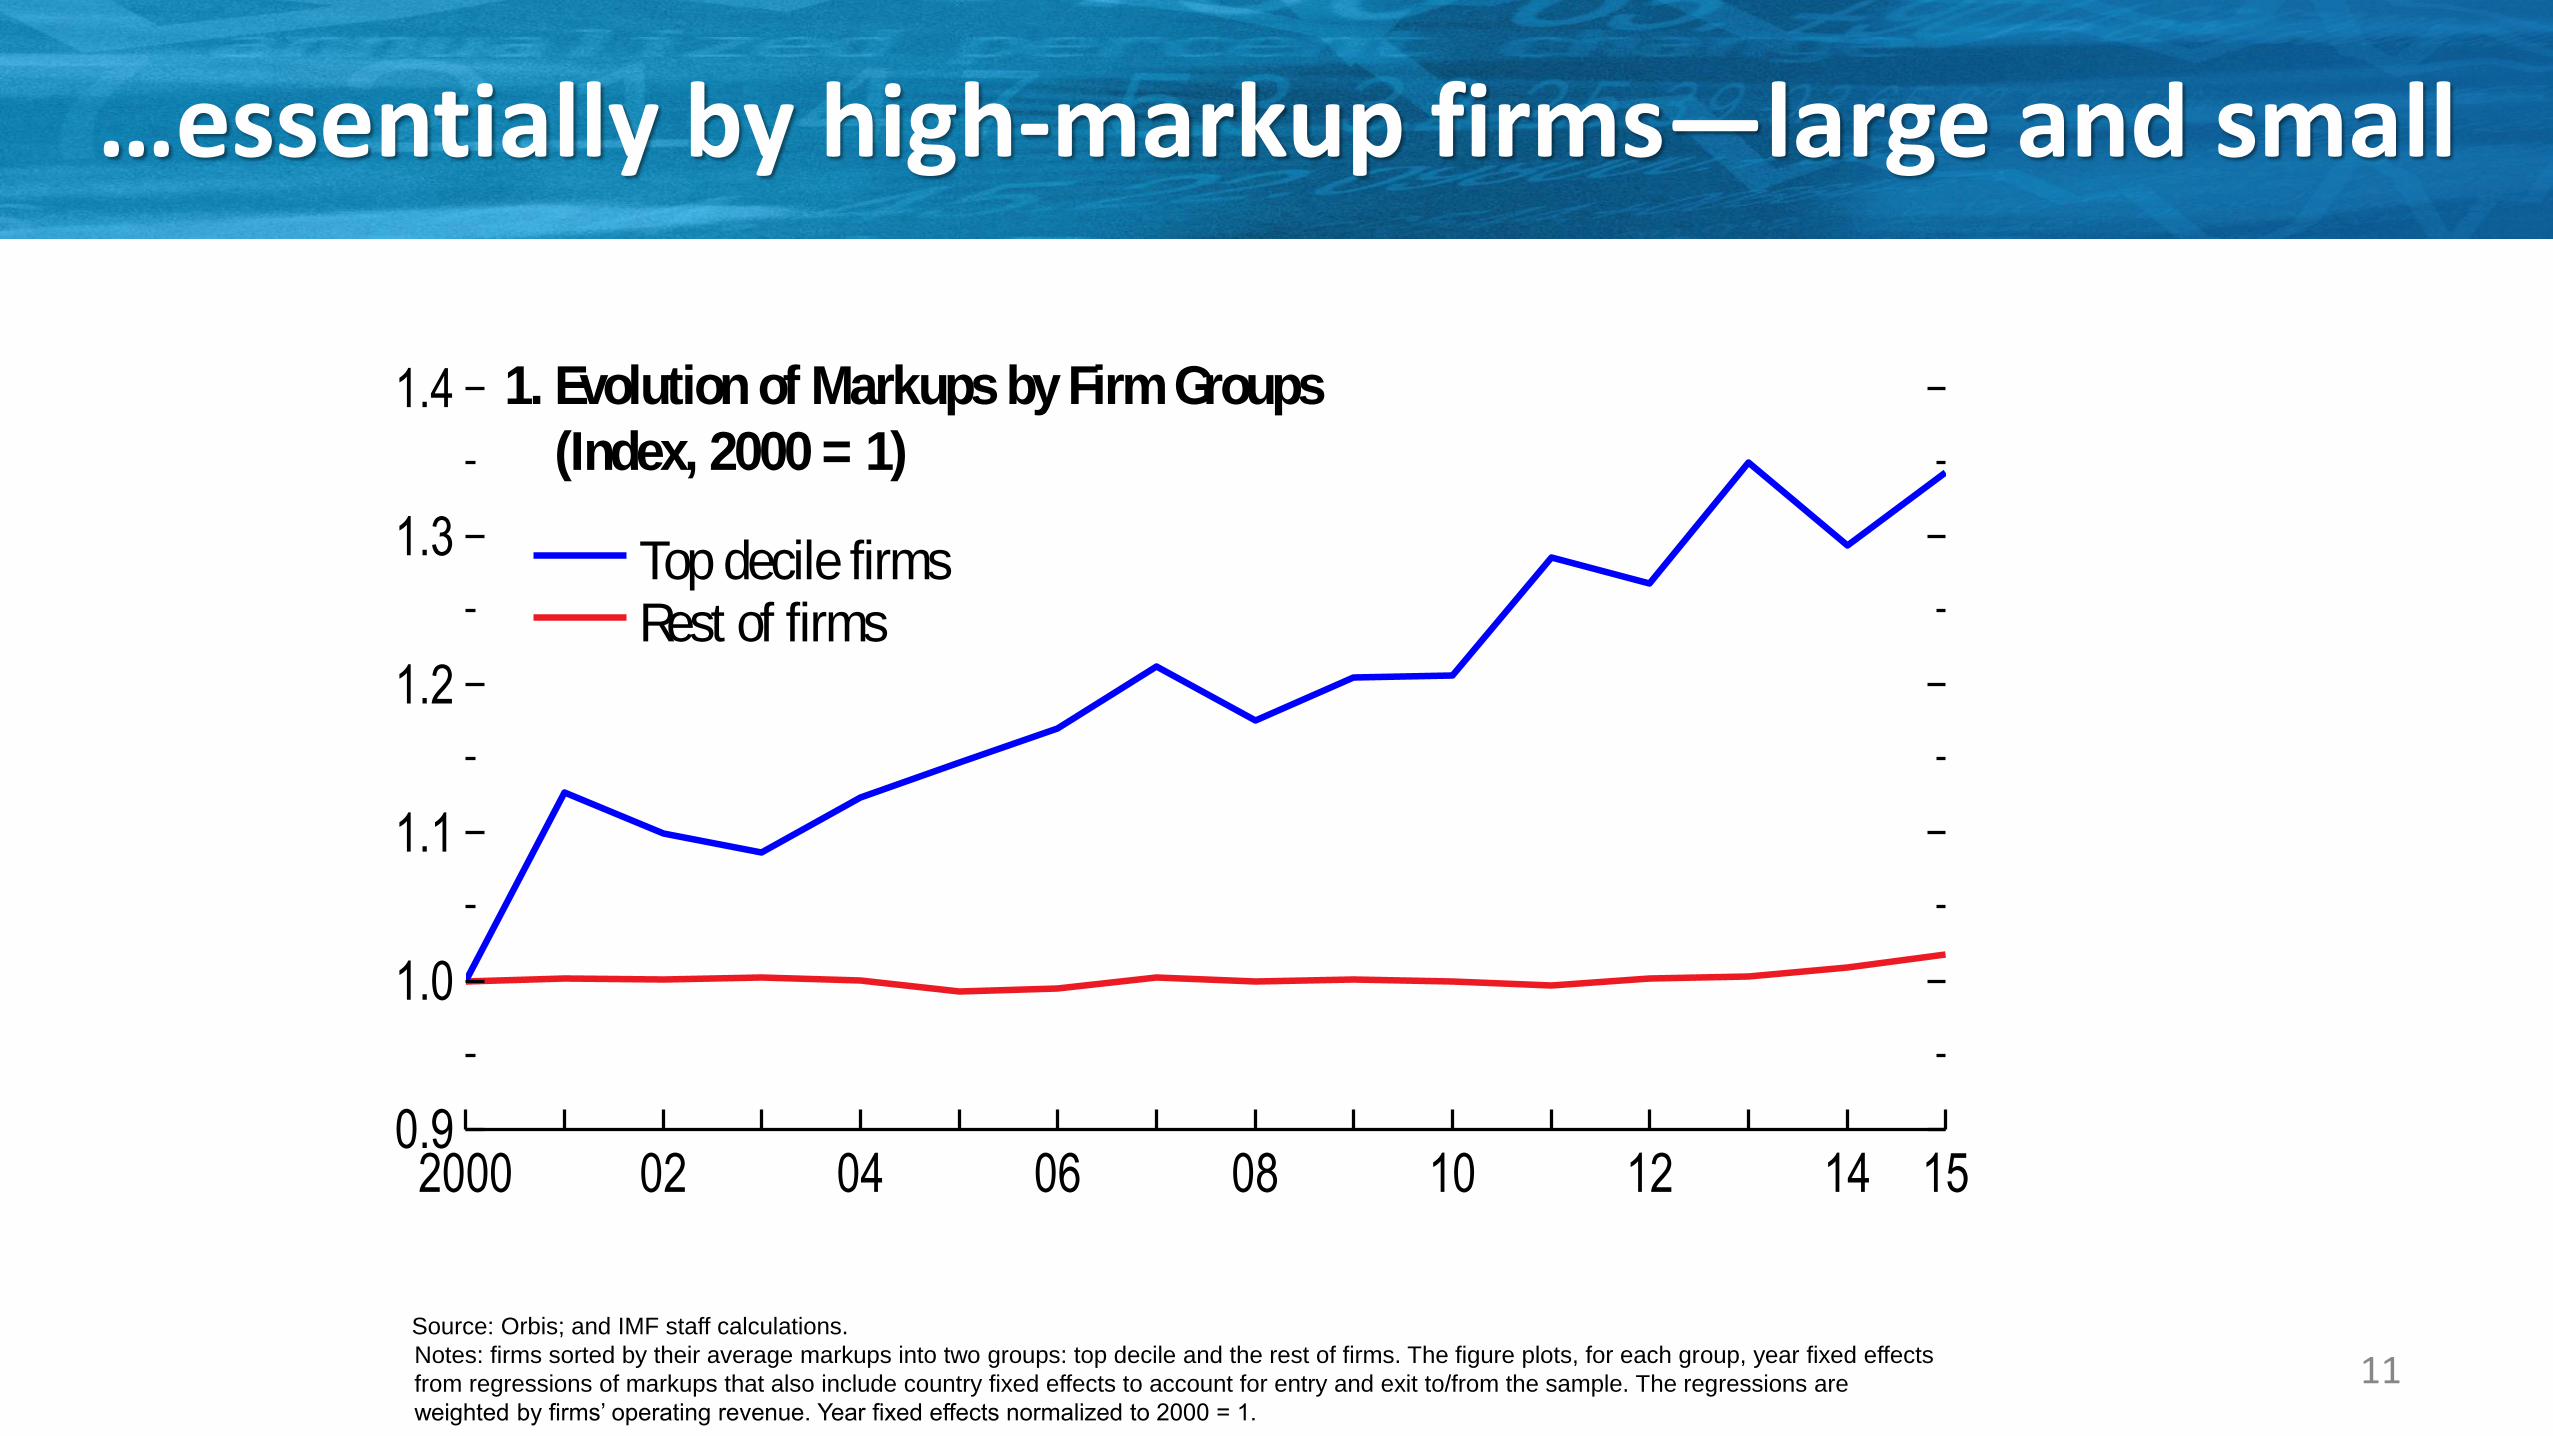
…essentially by high-markup firms—large and small
Source: Orbis; and IMF staff calculations.
Notes: firms sorted by their average markups into two groups: top decile and the rest of firms. The figure plots, for each group, year fixed effects
from regressions of markups that also include country fixed effects to account for entry and exit to/from the sample. The regressions are
weighted by firms’ operating revenue. Year fixed effects normalized to 2000 = 1.
11
0
2
4
6
8
10
12
Top decile Larger firms Smaller firms
0.9
1.0
1.1
1.2
1.3
1.4
2000 02 04 06 08 10 12 14 15
Figure 2.5. Disconnect between Firms in the Top Decile and
the Rest
Sources: Orbis; and IMF staff calculations.Note: Firms are sorted by their average markups into two groups: top decile and the rest. The first panel plots, for each group, year fixed effects from regressions of markups that also include country fixed effects to account for entry and exit to/from the sample. The regressions are weighted by firms’ operating revenue. The bars in panel 2 show the share of total revenue accounted for by: firms in the top decile as a whole (left bar); the larger firms within the top decile (10 percent largest firms within top decile, middle bar); smaller firms within the top decile (90 percent smallest firms within top decile, right bar). Each bar in panel 3 plots the average value of the Lerner index/TFP/Intangibles ratio for the firms in the top decile of the markup distribution and for the other firms. The values for the rest of the firms were normalized to one. TFP = total factor productivity.
1. Evolution of Markups by Firm Groups
(Index, 2000 = 1)
2. Share of Revenue by the Top Decile;
Total, Larger, and Smaller Firms
(Percent)
Top decile firmsRest of firms
0.0
0.5
1.0
1.5
2.0
Lerner TFP Intangibles
3. Differences in Performance by Firm Groups
(Index, rest of firms = 1) Top decile firmsRest of firms
Markup increases have been largely concentrated in the top 10 percent of the markup distribution; most of these firms are small but the very large ones account for most the group’s revenue; these firms tend to be more profitable, more productive and make relatively more intensive use of intangibles than other firms.
Of which:
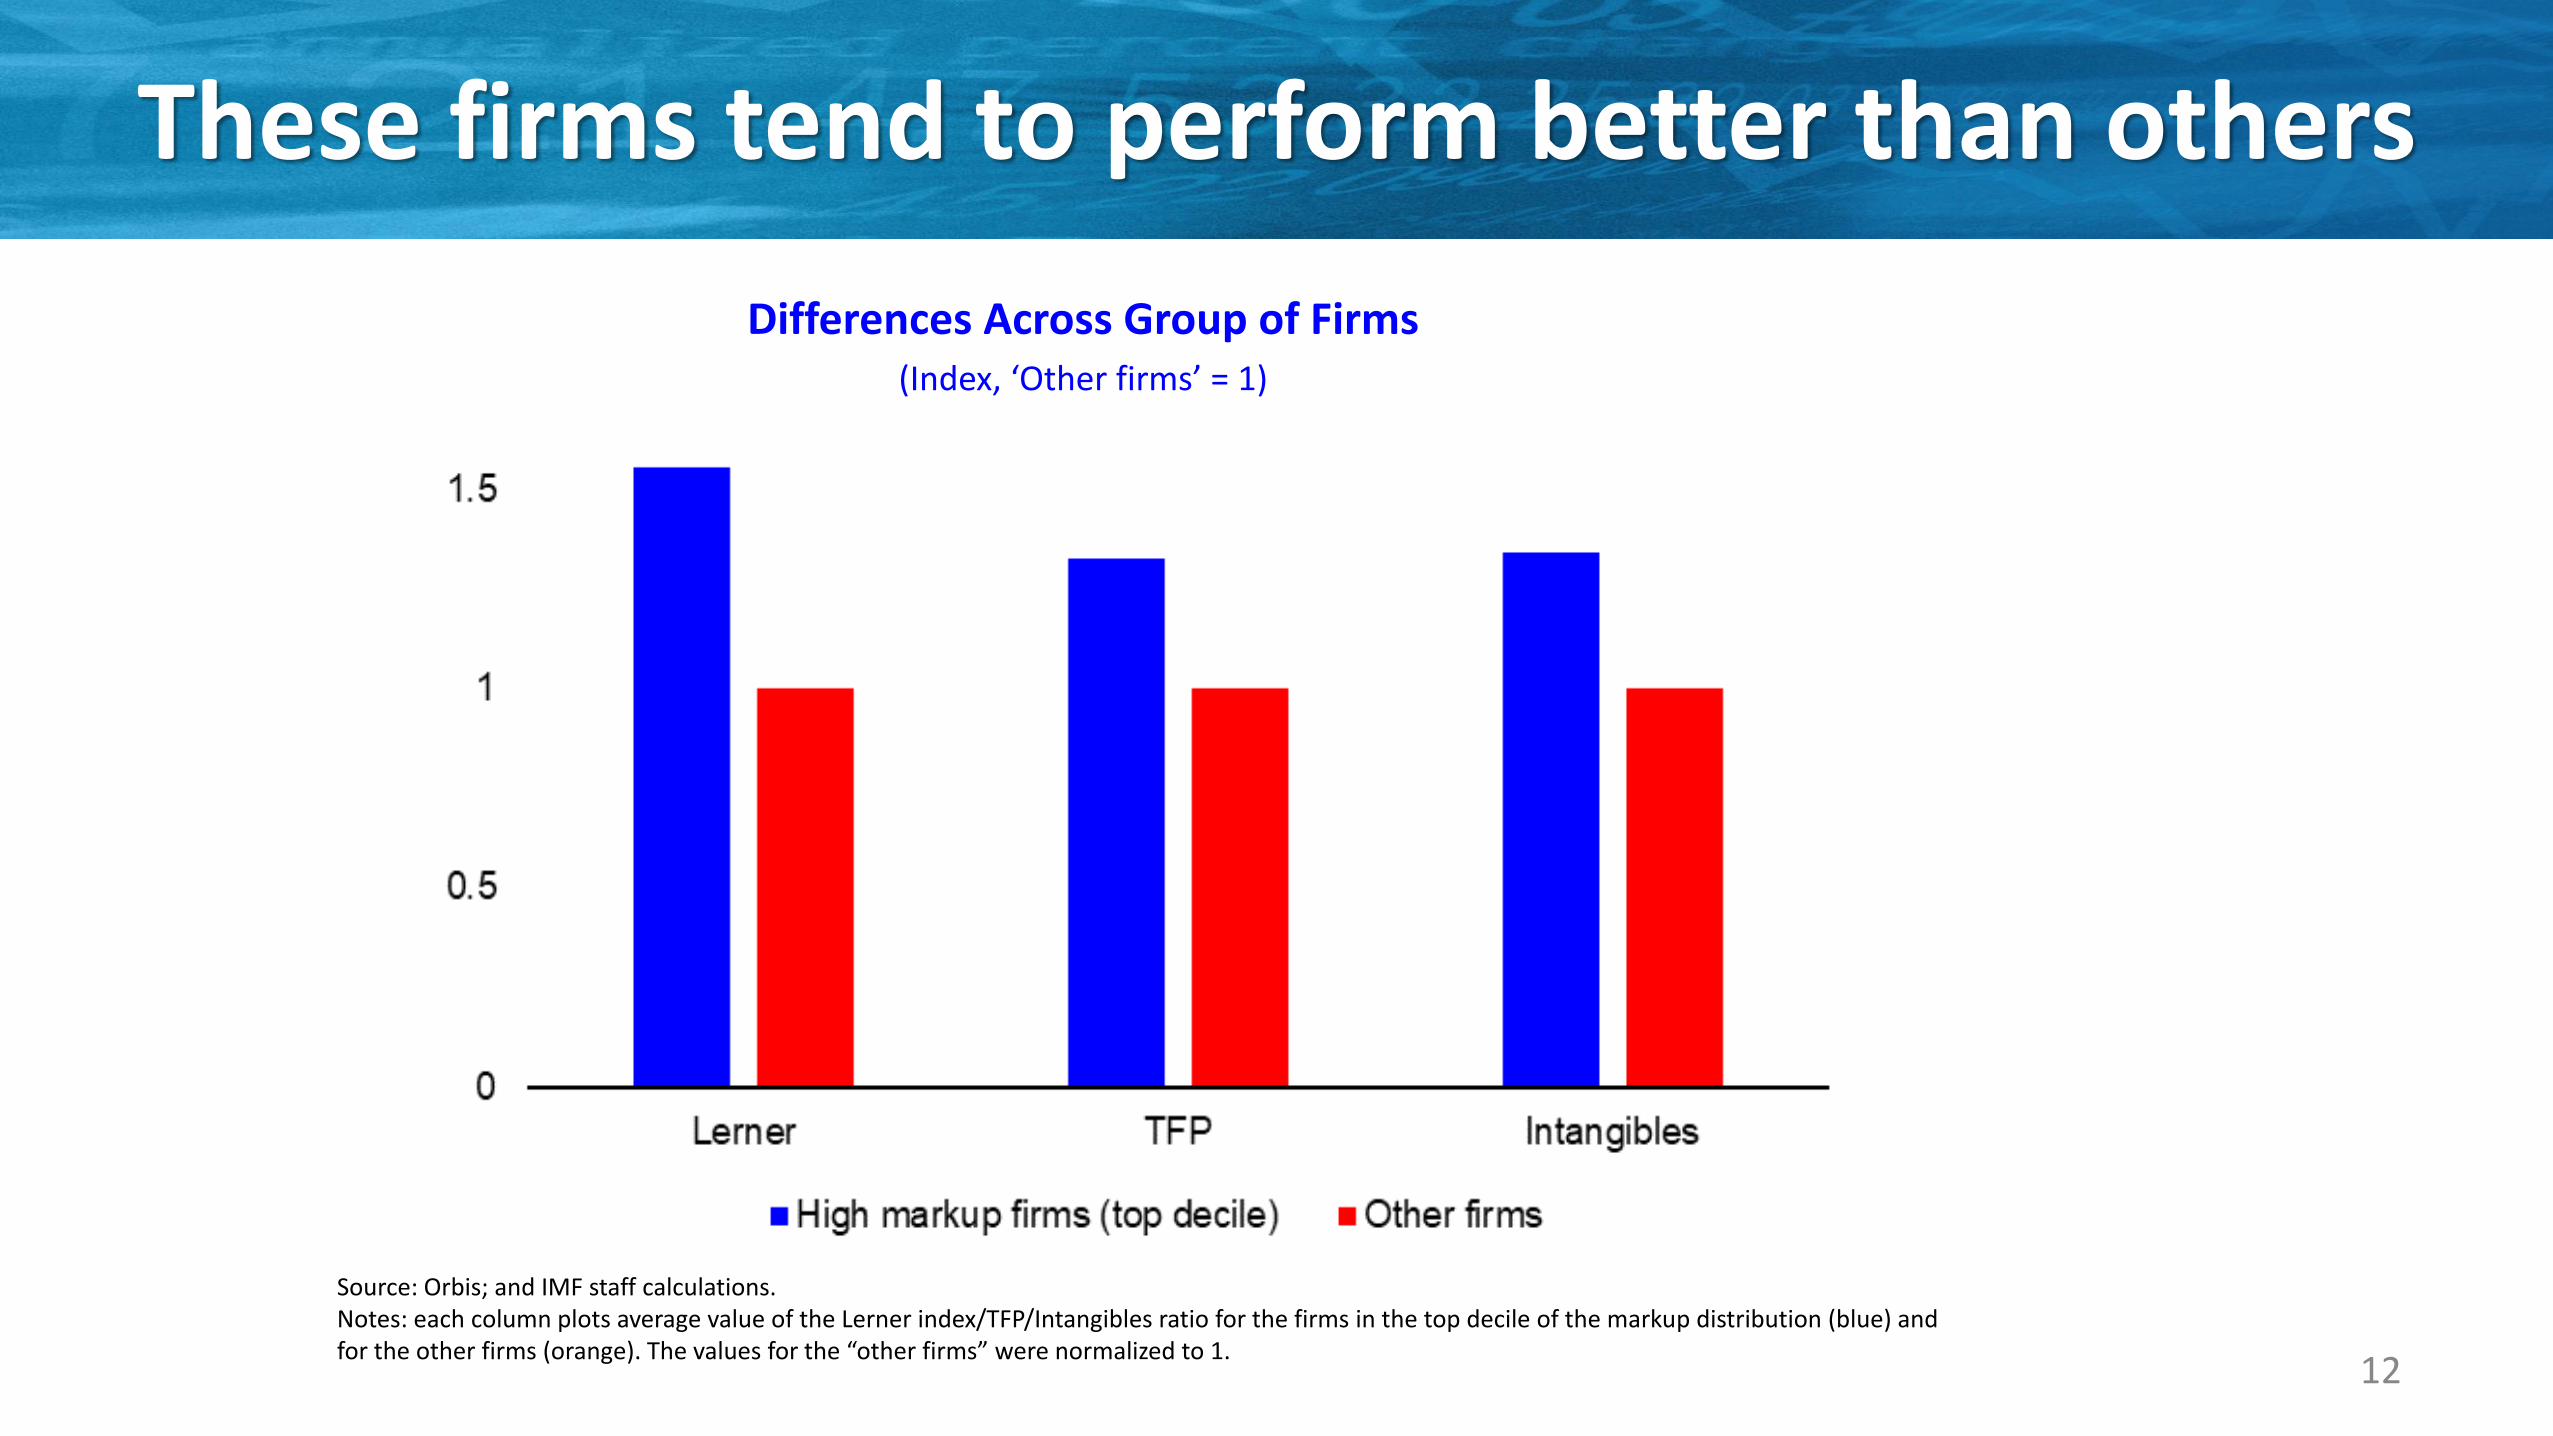
These firms tend to perform better than others
12
Source: Orbis; and IMF staff calculations.Notes: each column plots average value of the Lerner index/TFP/Intangibles ratio for the firms in the top decile of the markup distribution (blue) and for the other firms (orange). The values for the “other firms” were normalized to 1.
Differences Across Group of Firms (Index, ‘Other firms’ = 1)

Implications of Rising Market Power for Growth
13
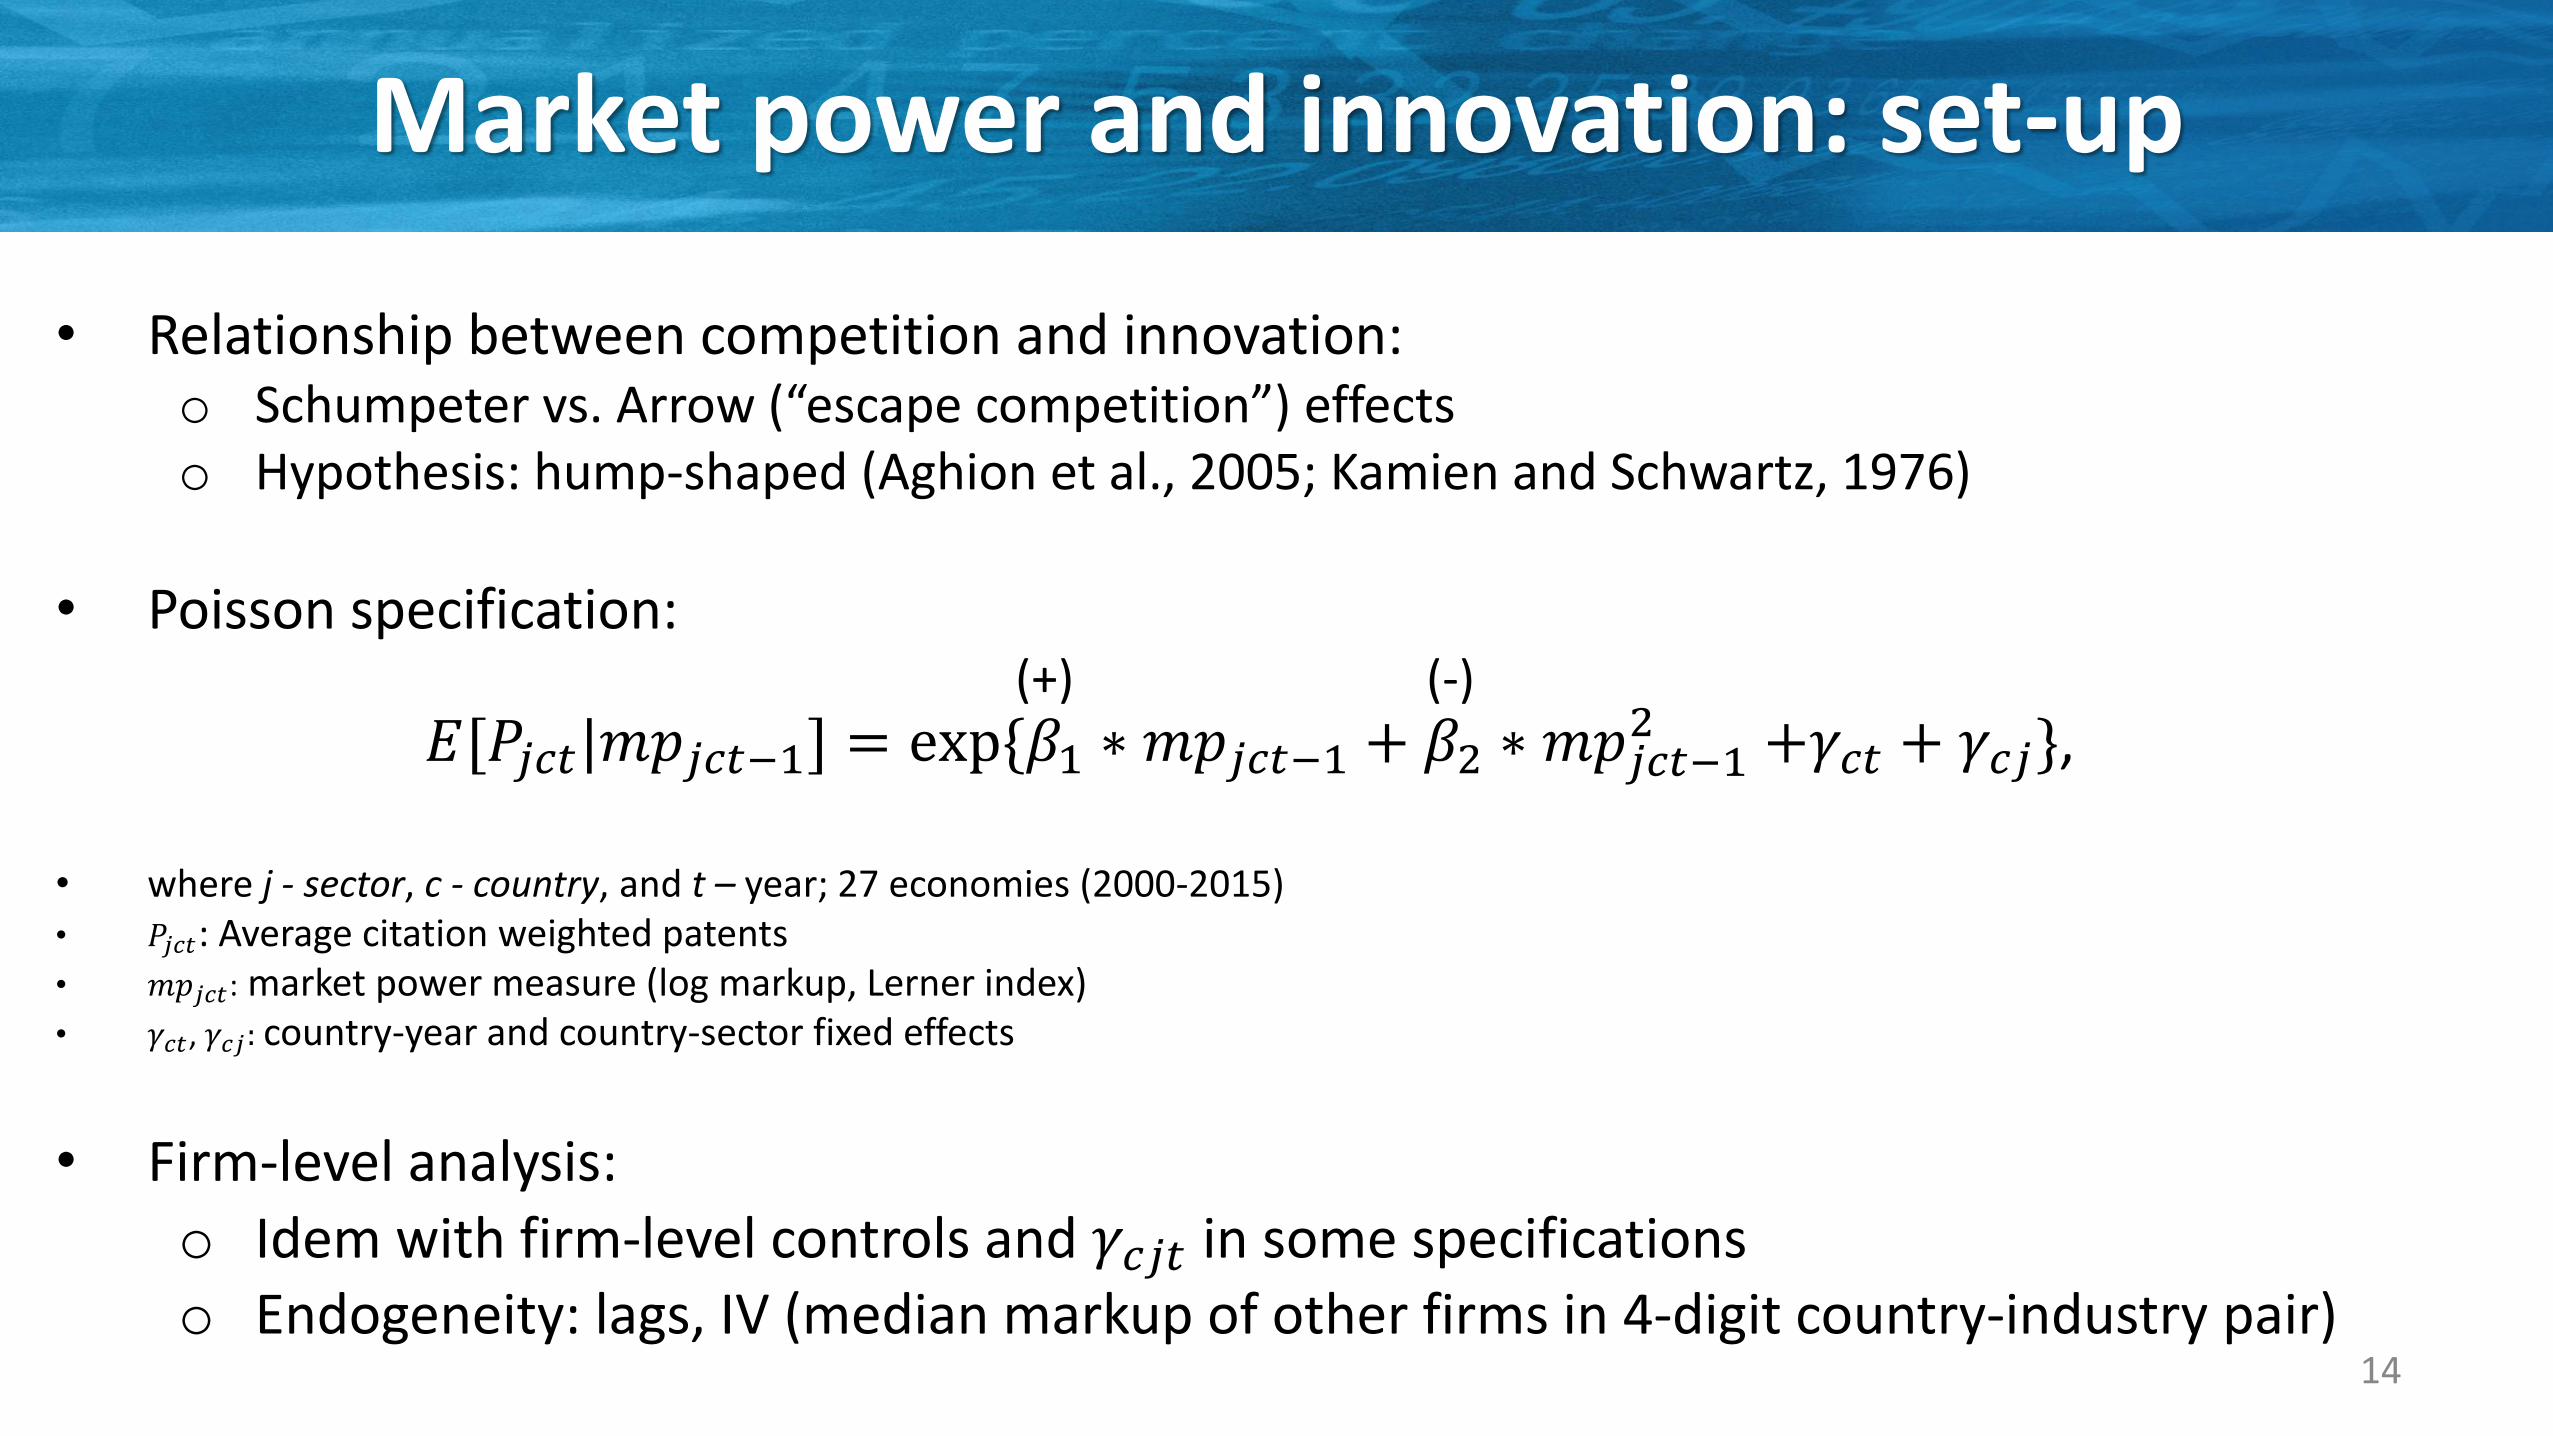
Market power and innovation: set-up
• Relationship between competition and innovation:o Schumpeter vs. Arrow (“escape competition”) effectso Hypothesis: hump-shaped (Aghion et al., 2005; Kamien and Schwartz, 1976)
• Poisson specification:
• where j - sector, c - country, and t – year; 27 economies (2000-2015)• 𝑃𝑗𝑐𝑡: Average citation weighted patents• 𝑚𝑝𝑗𝑐𝑡: market power measure (log markup, Lerner index)• 𝛾𝑐𝑡, 𝛾𝑐𝑗: country-year and country-sector fixed effects
• Firm-level analysis:
o Idem with firm-level controls and 𝛾𝑐𝑗𝑡 in some specificationso Endogeneity: lags, IV (median markup of other firms in 4-digit country-industry pair)
14
𝐸[𝑃𝑗𝑐𝑡|𝑚𝑝𝑗𝑐𝑡−1] = exp{𝛽1 ∗ 𝑚𝑝𝑗𝑐𝑡−1 + 𝛽2 ∗ 𝑚𝑝𝑗𝑐𝑡−12 +𝛾𝑐𝑡 + 𝛾𝑐𝑗},
(+) (-)
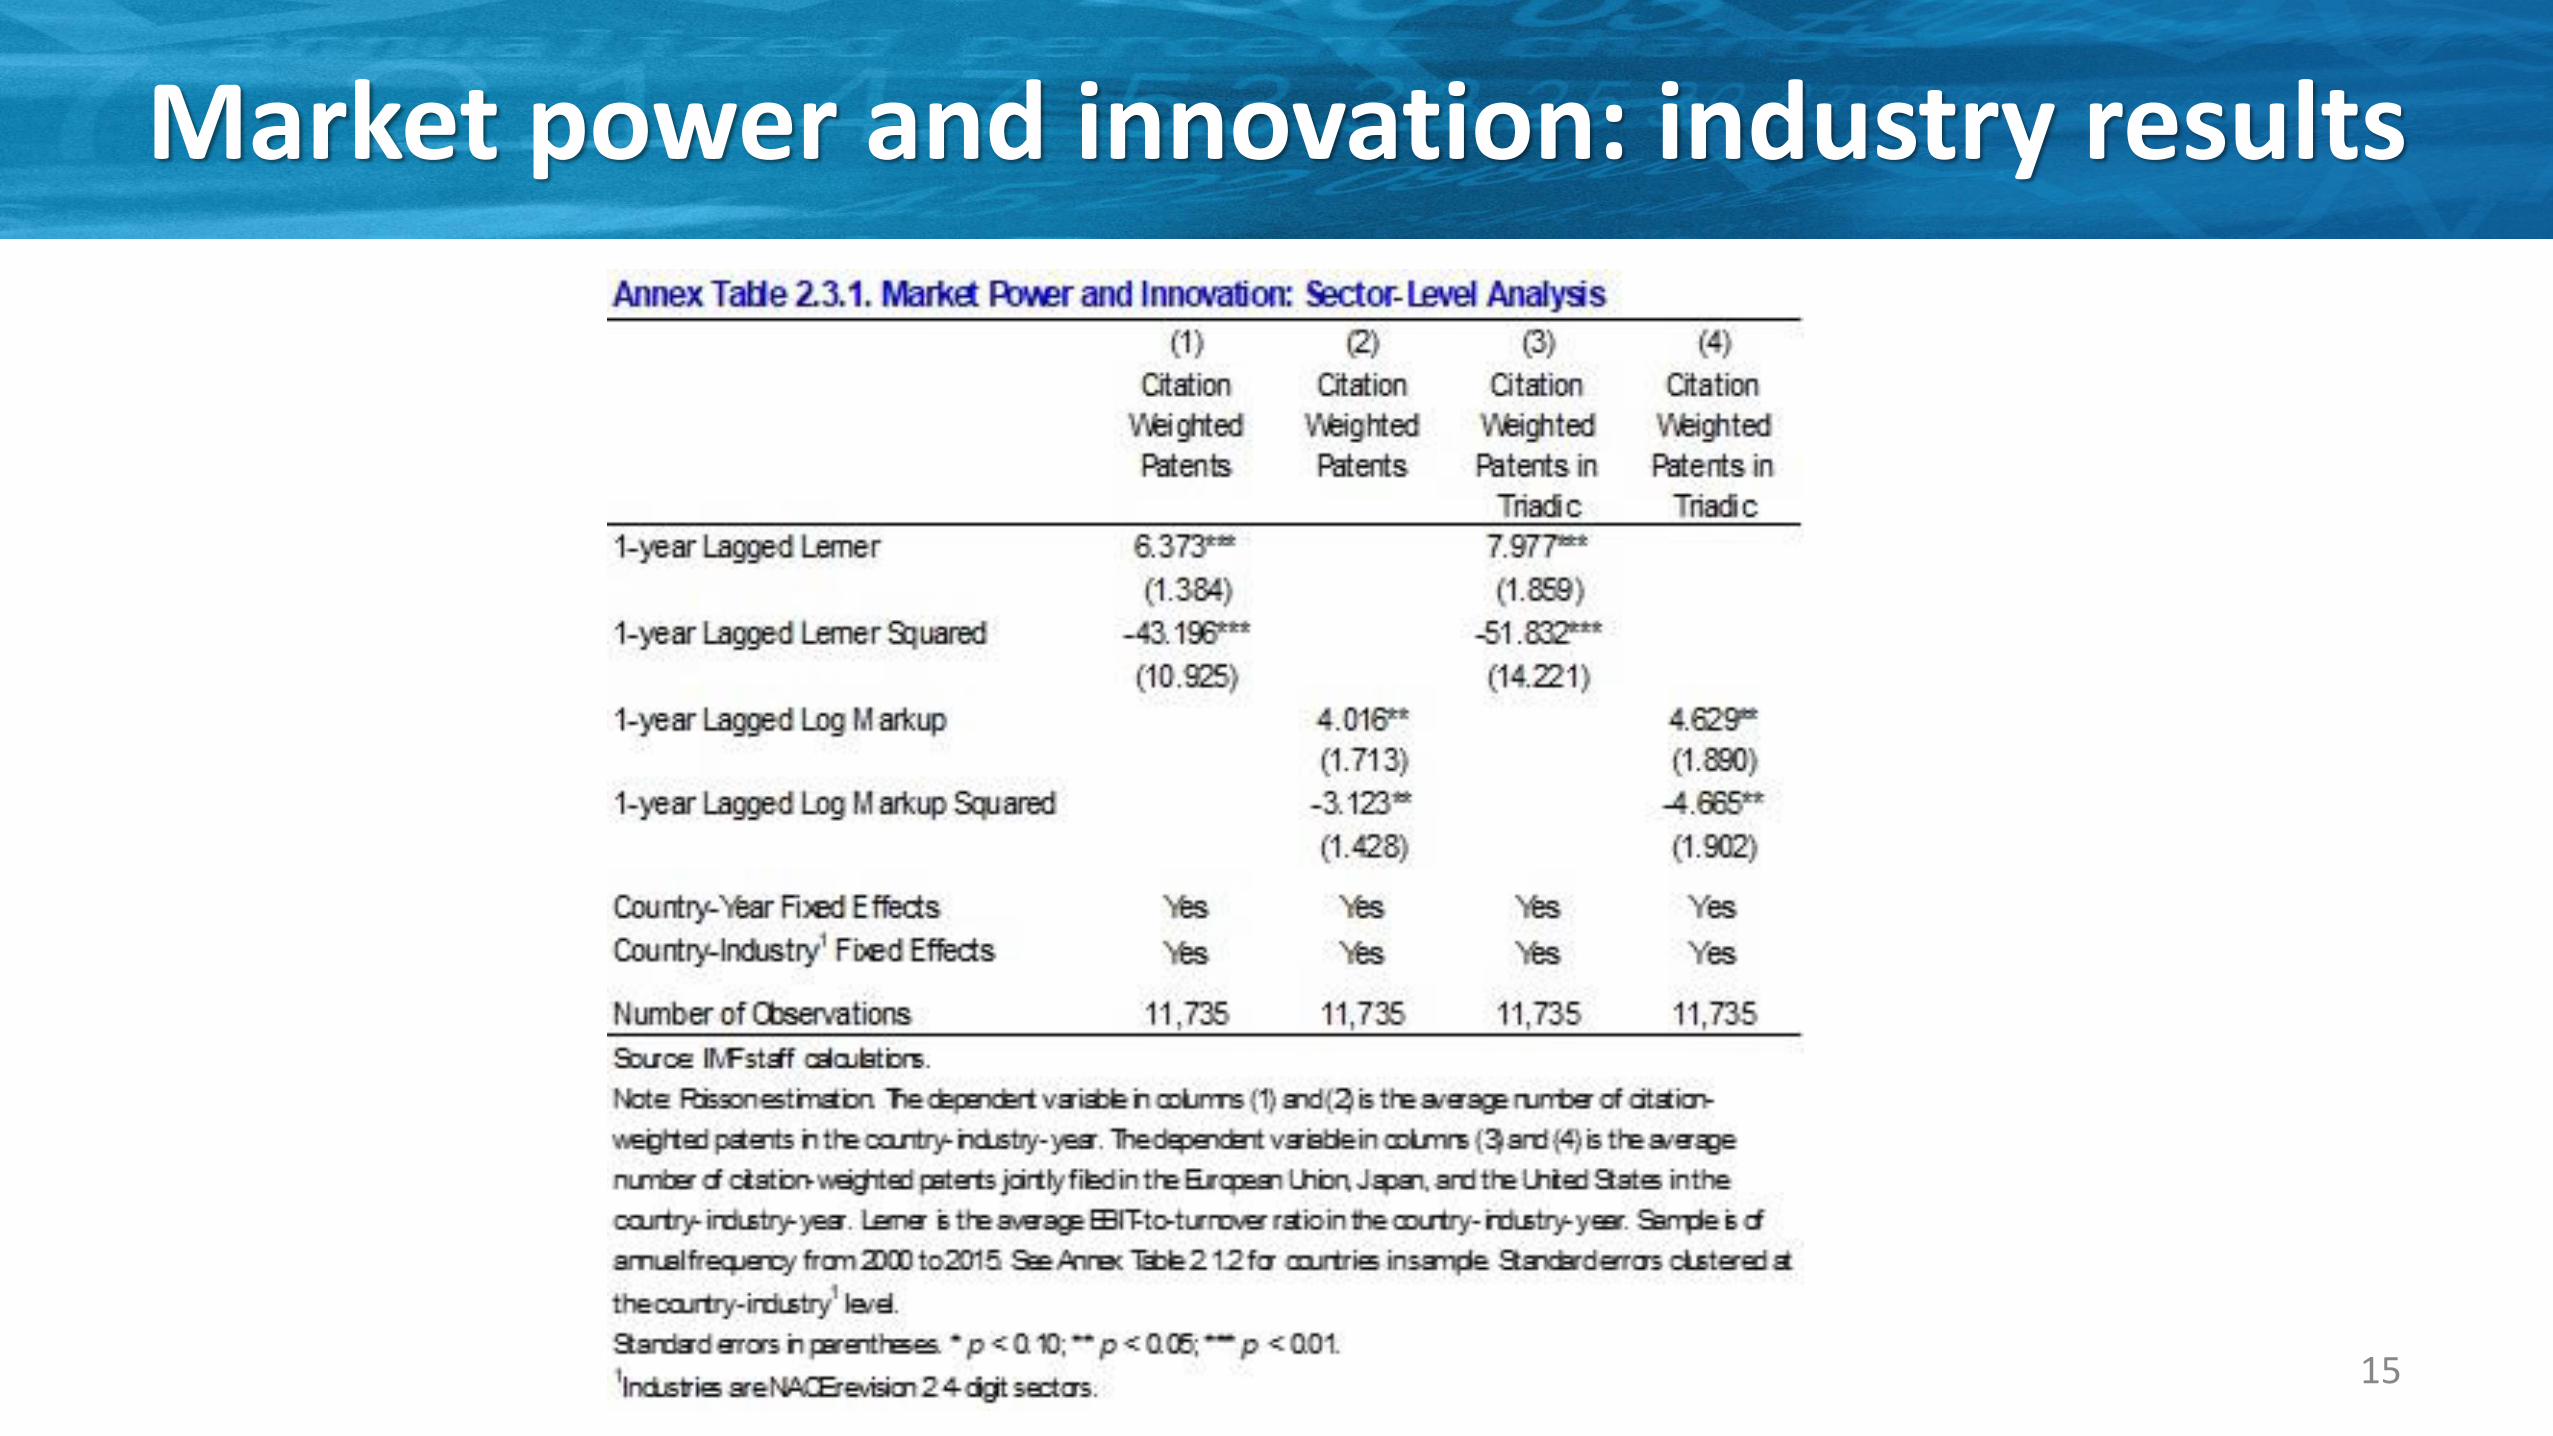
Market power and innovation: industry results
15
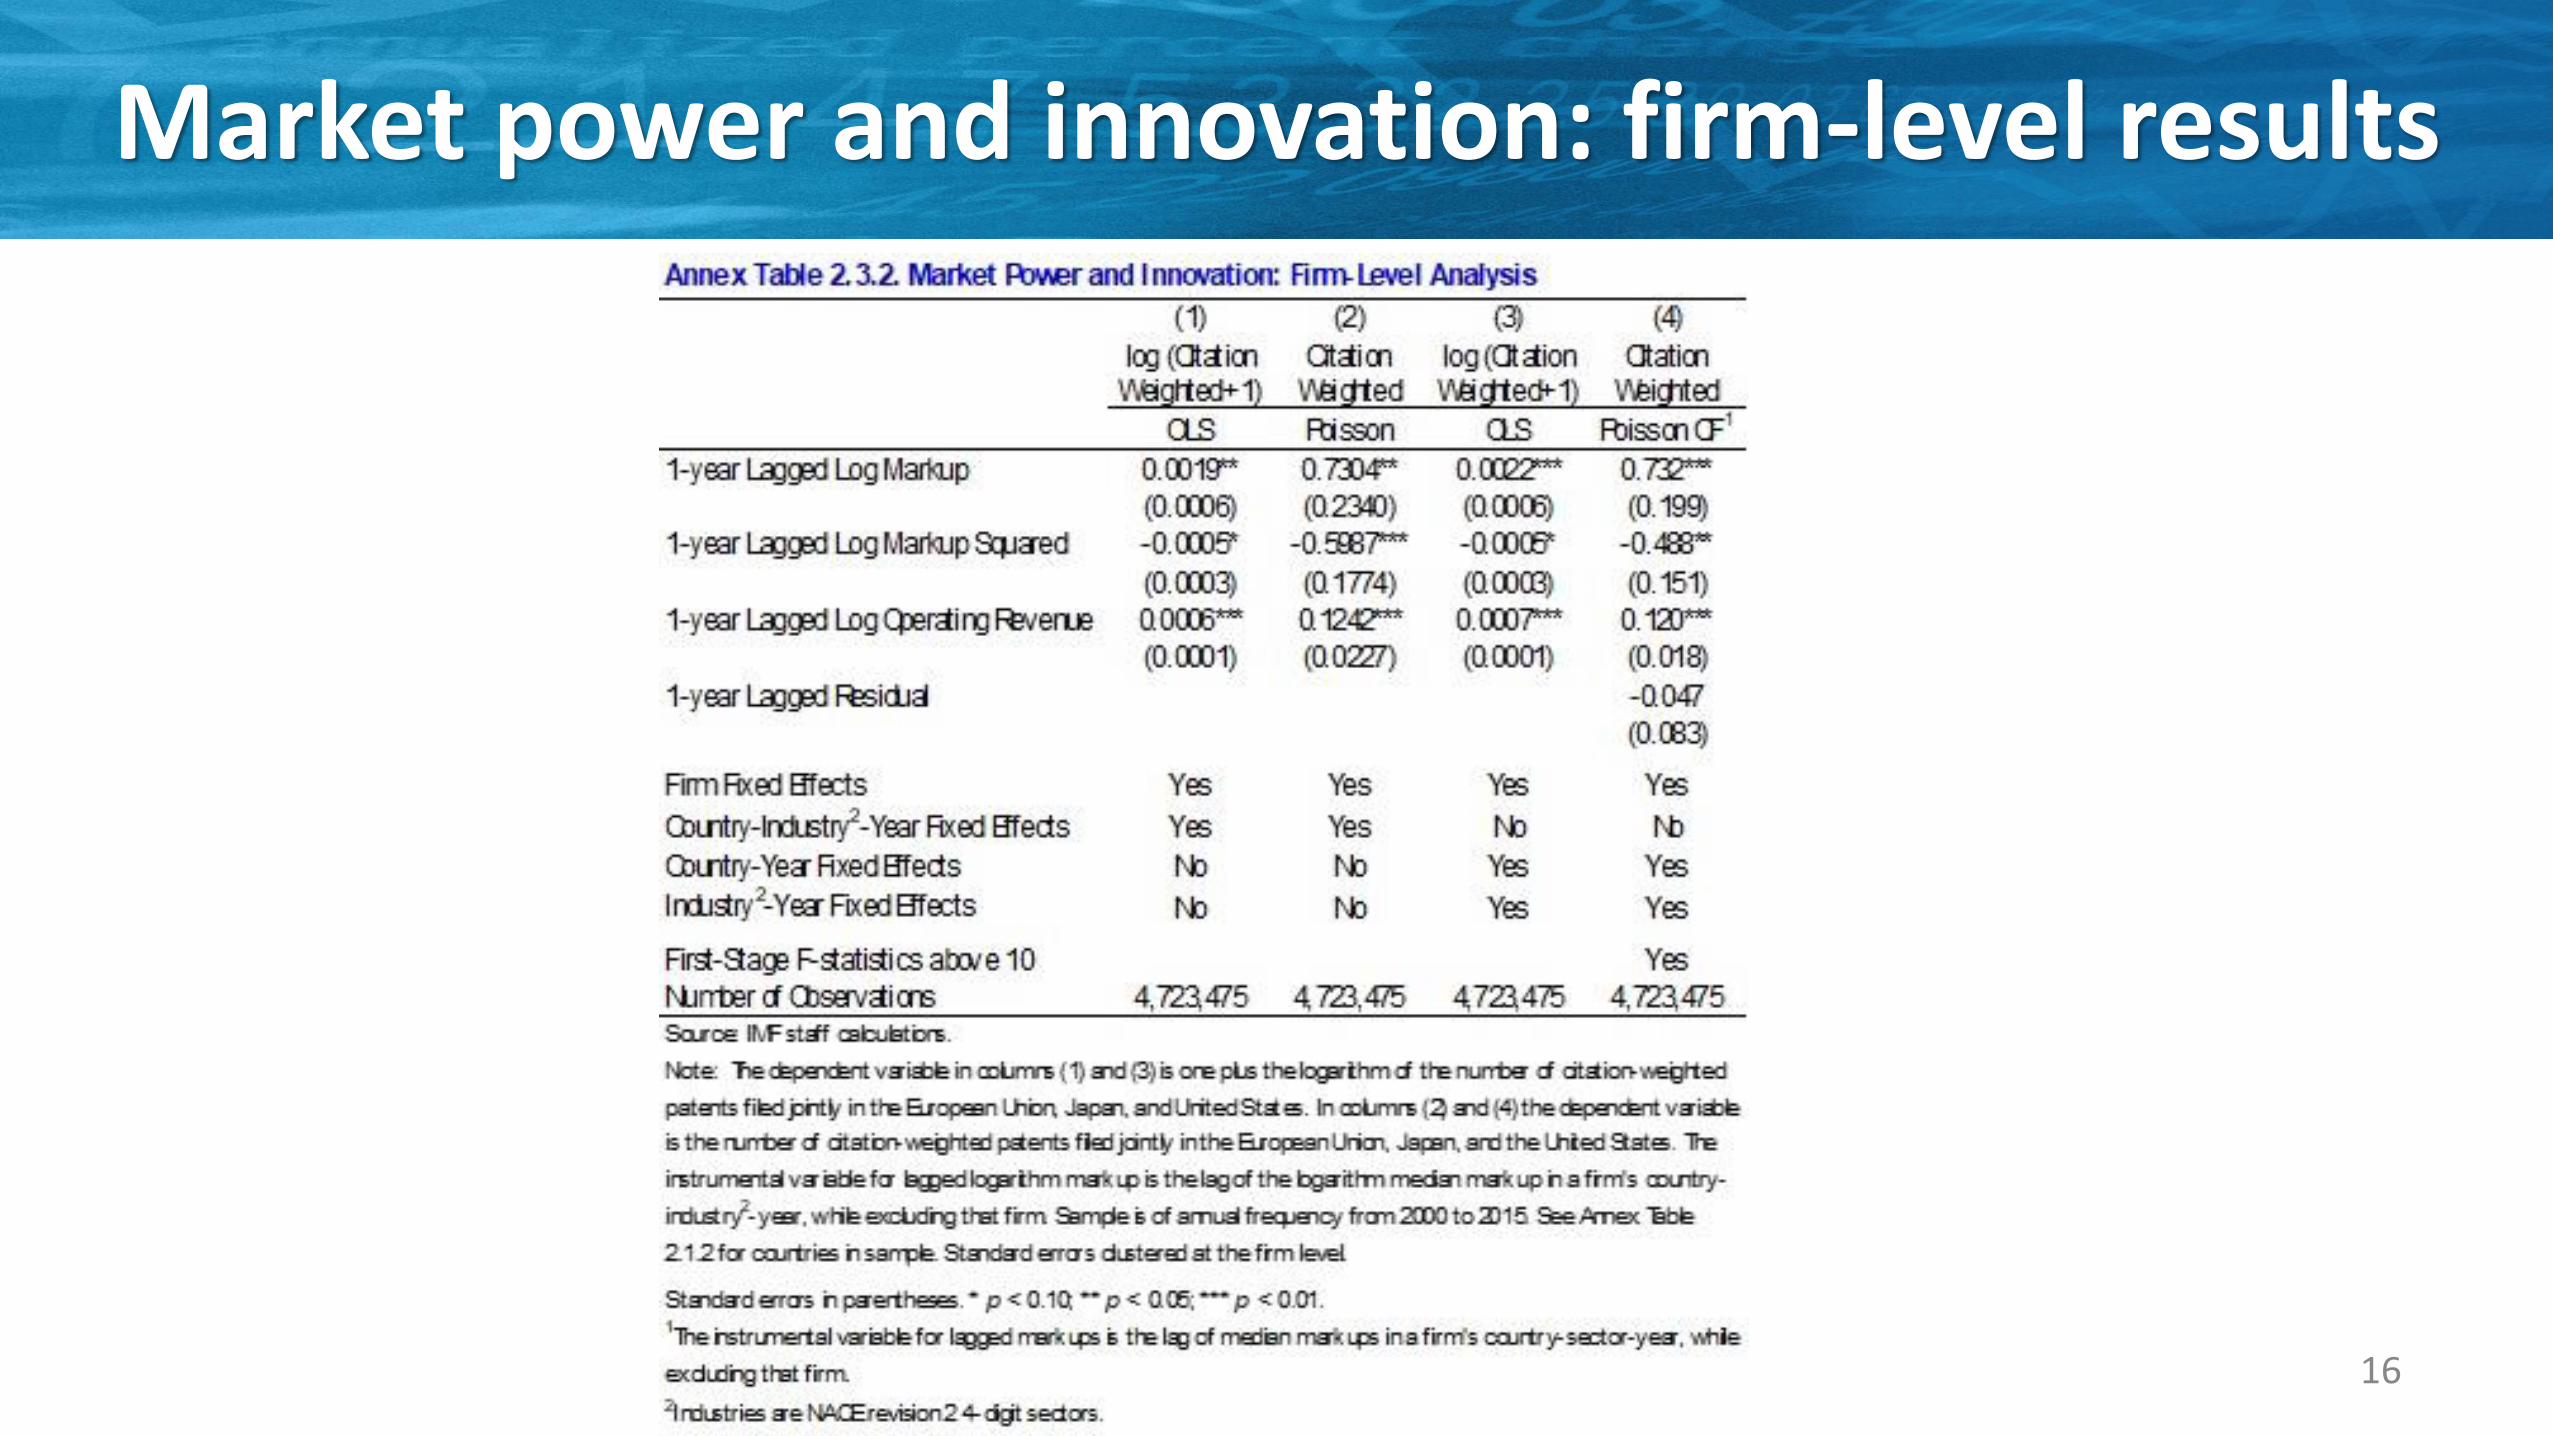
Market power and innovation: firm-level results
16
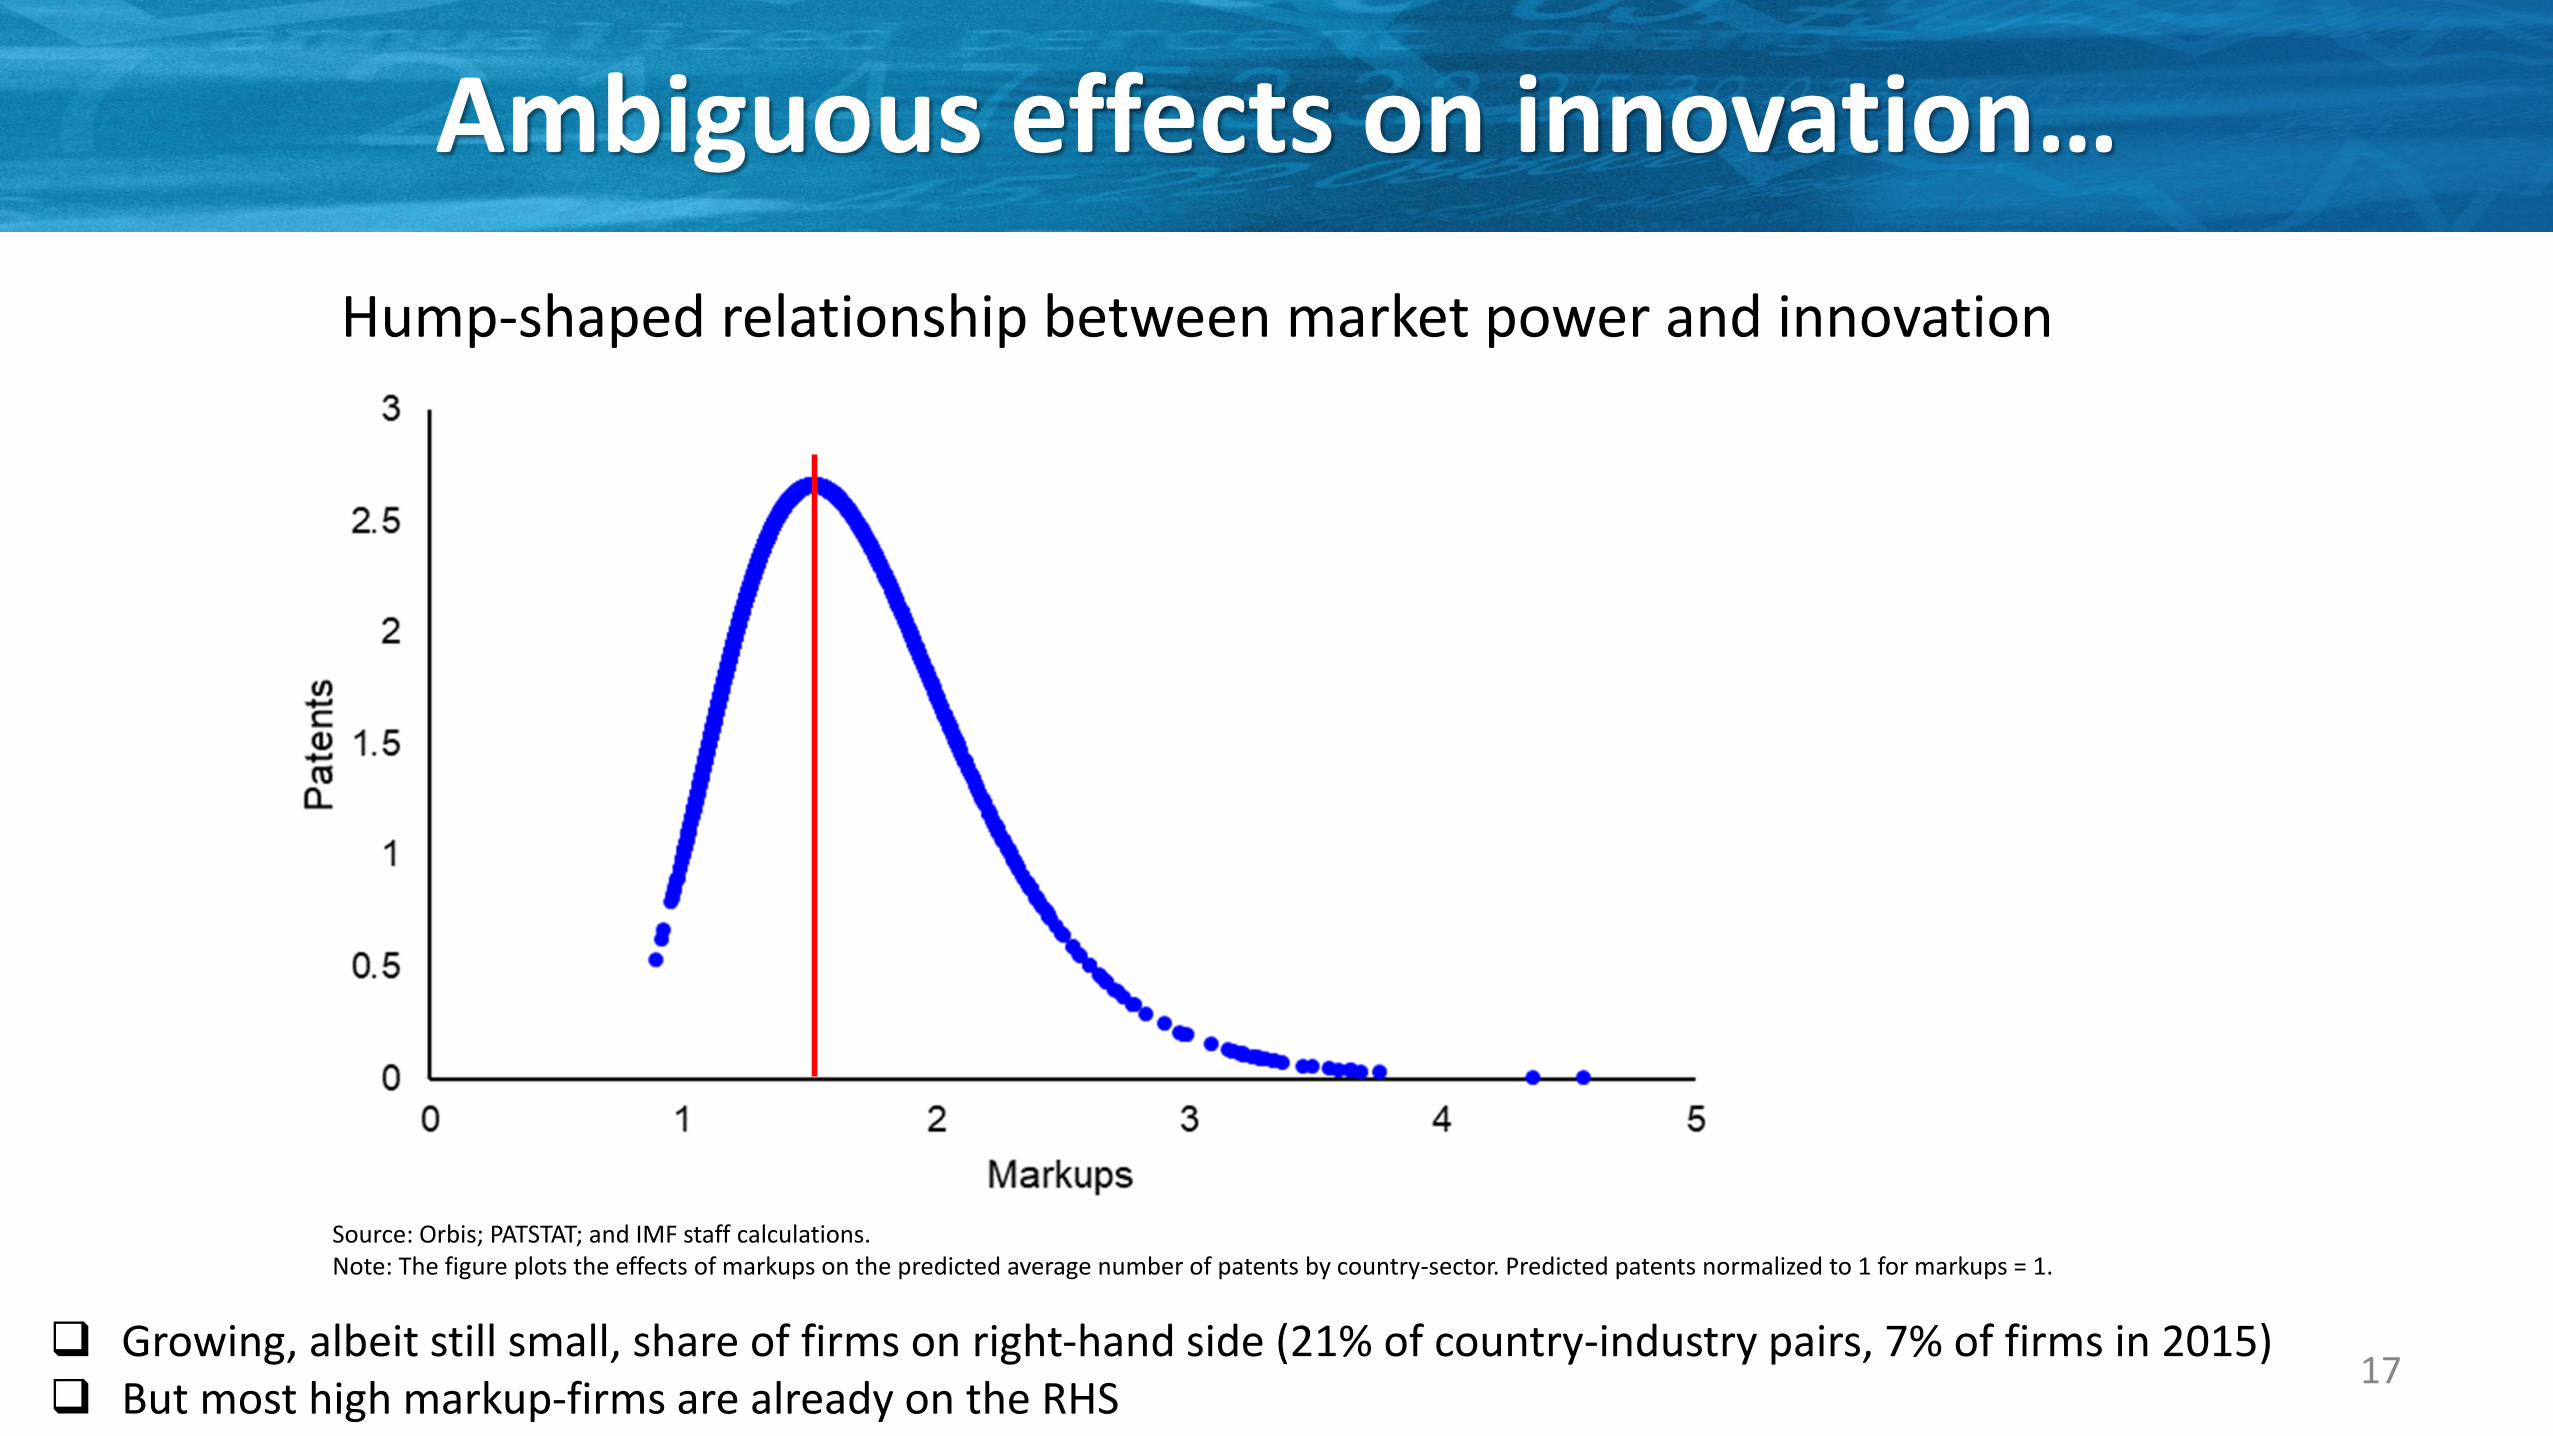
Ambiguous effects on innovation…
17
Hump-shaped relationship between market power and innovation
❑ Growing, albeit still small, share of firms on right-hand side (21% of country-industry pairs, 7% of firms in 2015)❑ But most high markup-firms are already on the RHS
Source: Orbis; PATSTAT; and IMF staff calculations.Note: The figure plots the effects of markups on the predicted average number of patents by country-sector. Predicted patents normalized to 1 for markups = 1.
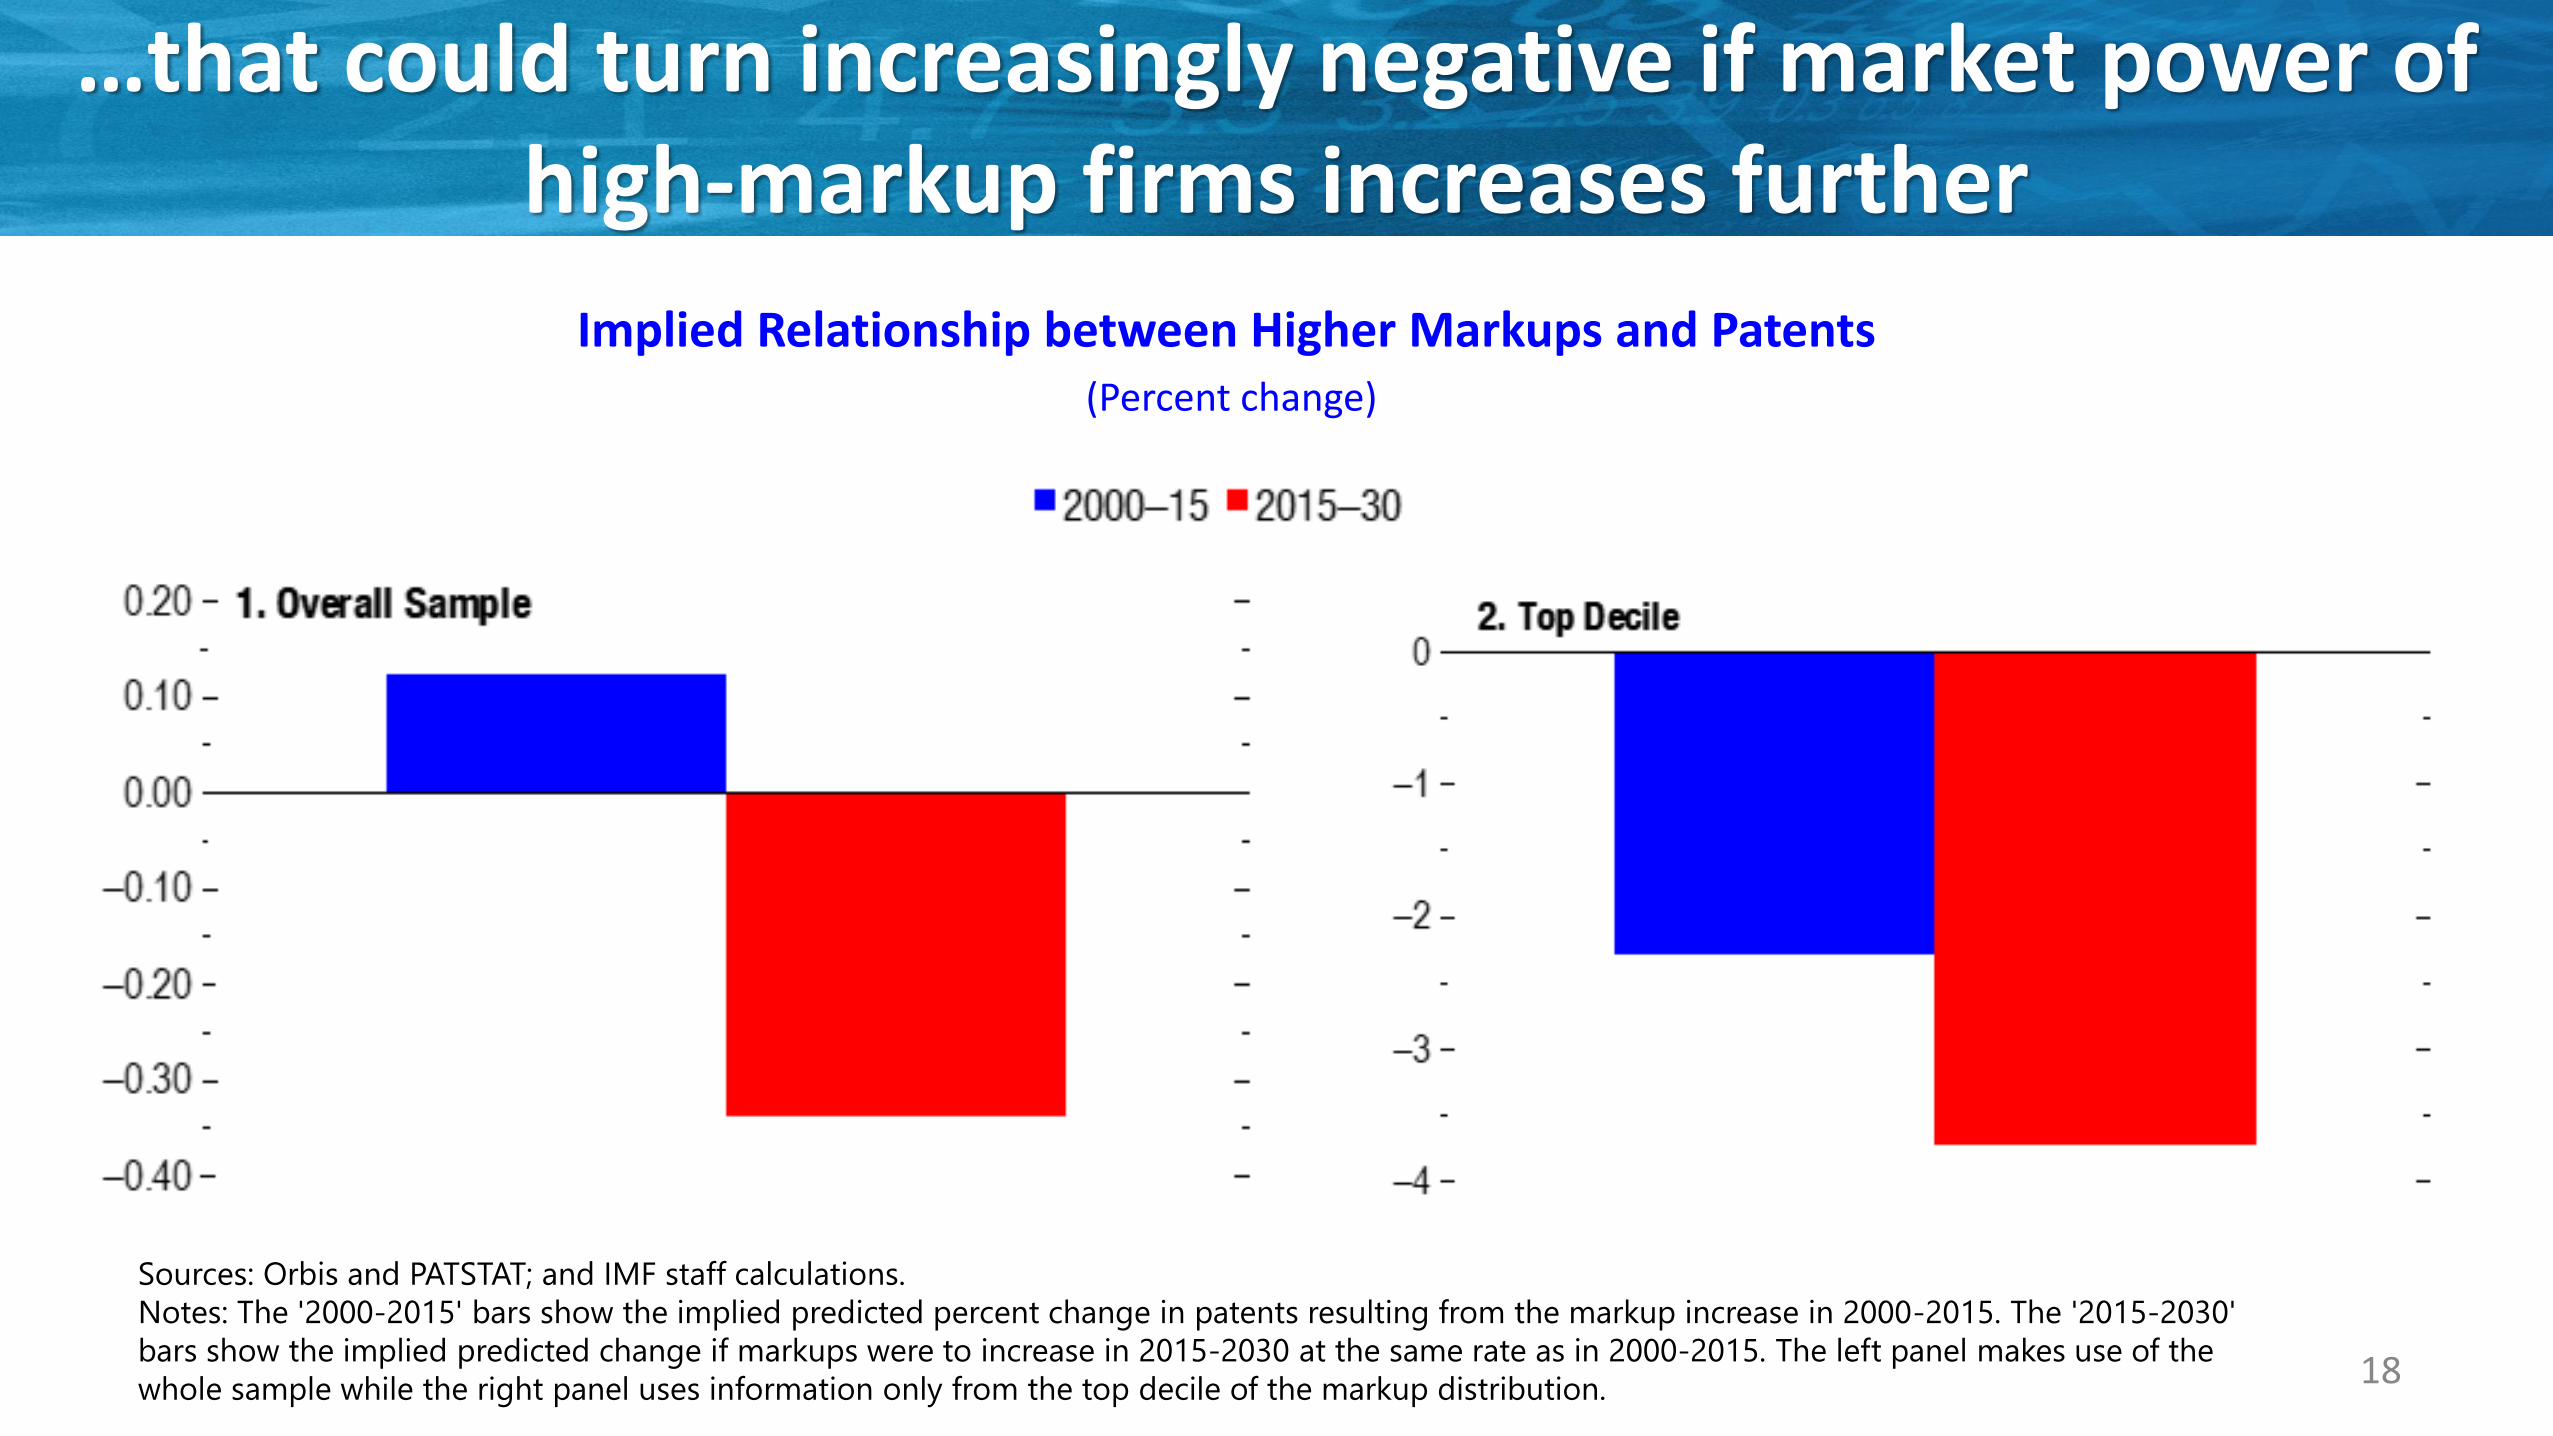
…that could turn increasingly negative if market power of high-markup firms increases further
18
Sources: Orbis and PATSTAT; and IMF staff calculations.
Notes: The '2000-2015' bars show the implied predicted percent change in patents resulting from the markup increase in 2000-2015. The '2015-2030'
bars show the implied predicted change if markups were to increase in 2015-2030 at the same rate as in 2000-2015. The left panel makes use of the
whole sample while the right panel uses information only from the top decile of the markup distribution.
Implied Relationship between Higher Markups and Patents (Percent change)
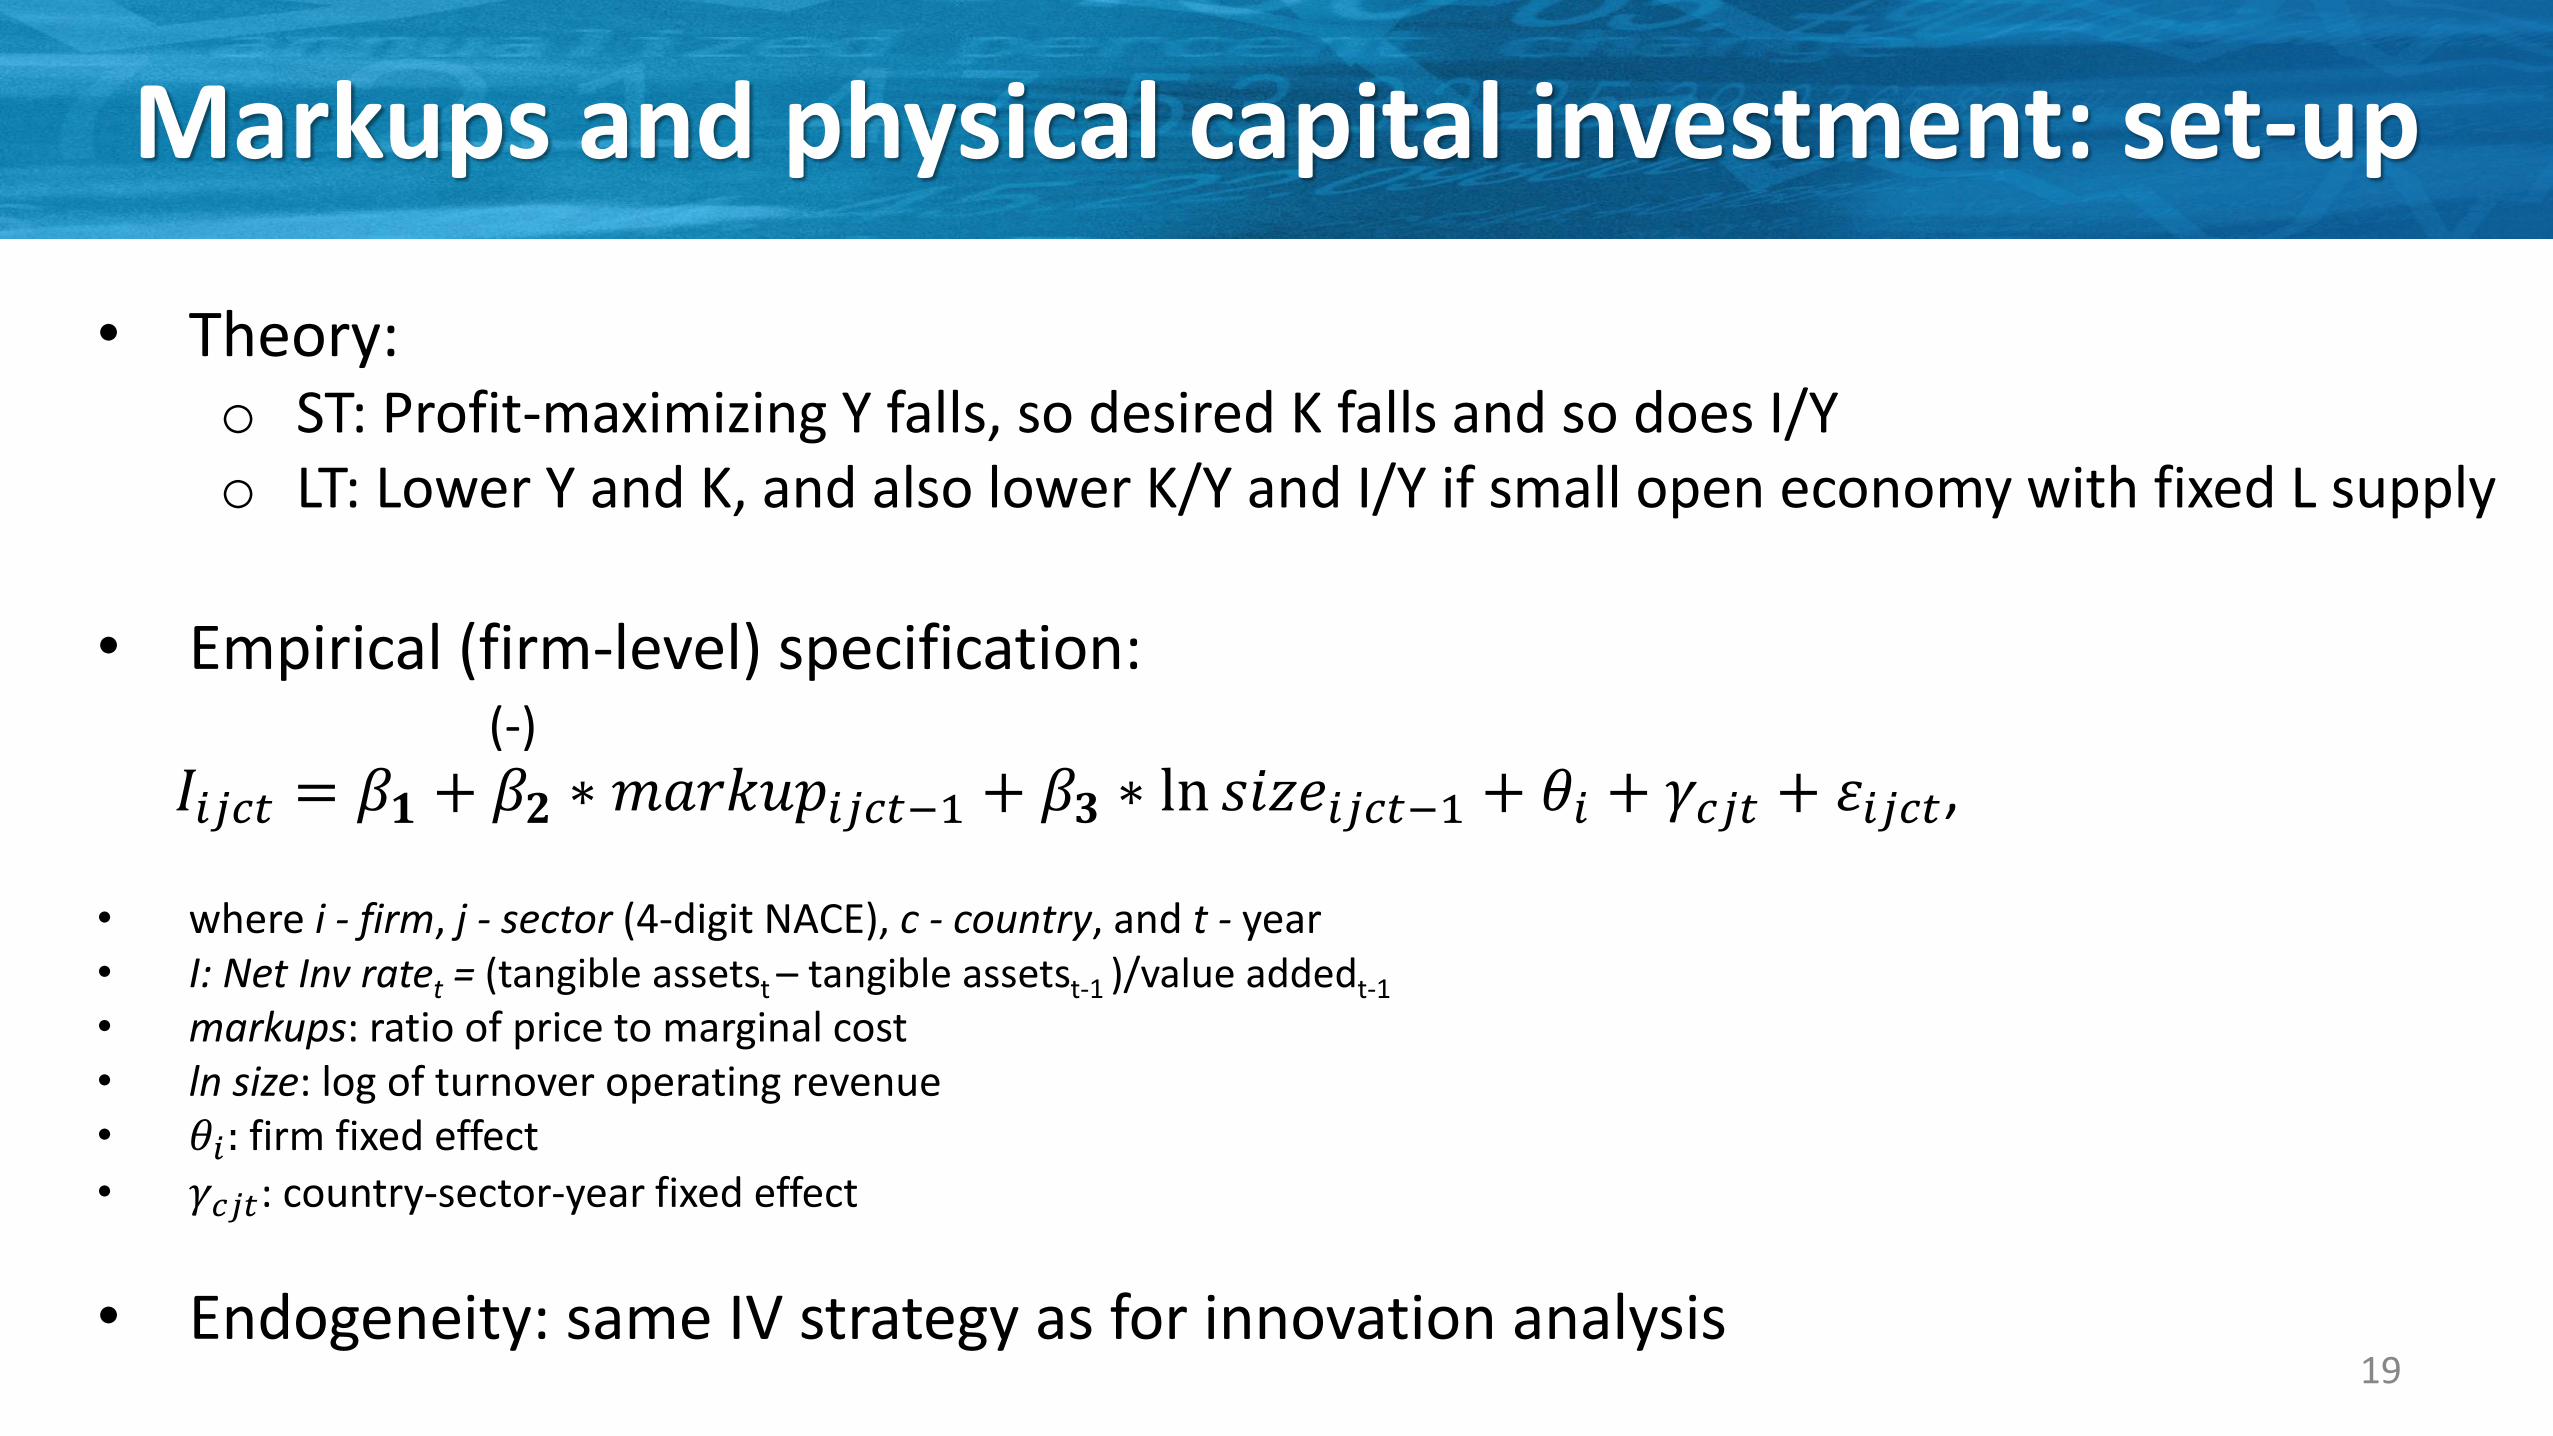
Markups and physical capital investment: set-up
• Theory:o ST: Profit-maximizing Y falls, so desired K falls and so does I/Yo LT: Lower Y and K, and also lower K/Y and I/Y if small open economy with fixed L supply
• Empirical (firm-level) specification:
• where i - firm, j - sector (4-digit NACE), c - country, and t - year • I: Net Inv ratet = (tangible assetst – tangible assetst-1 )/value addedt-1
• markups: ratio of price to marginal cost• ln size: log of turnover operating revenue • 𝜃𝑖: firm fixed effect
• 𝛾𝑐𝑗𝑡: country-sector-year fixed effect
• Endogeneity: same IV strategy as for innovation analysis
𝐼𝑖𝑗𝑐𝑡 = 𝛽𝟏 + 𝛽𝟐 ∗ 𝑚𝑎𝑟𝑘𝑢𝑝𝑖𝑗𝑐𝑡−1 + 𝛽𝟑 ∗ ln 𝑠𝑖𝑧𝑒𝑖𝑗𝑐𝑡−1 + 𝜃𝑖 + 𝛾𝑐𝑗𝑡 + 𝜀𝑖𝑗𝑐𝑡,
19
(-)
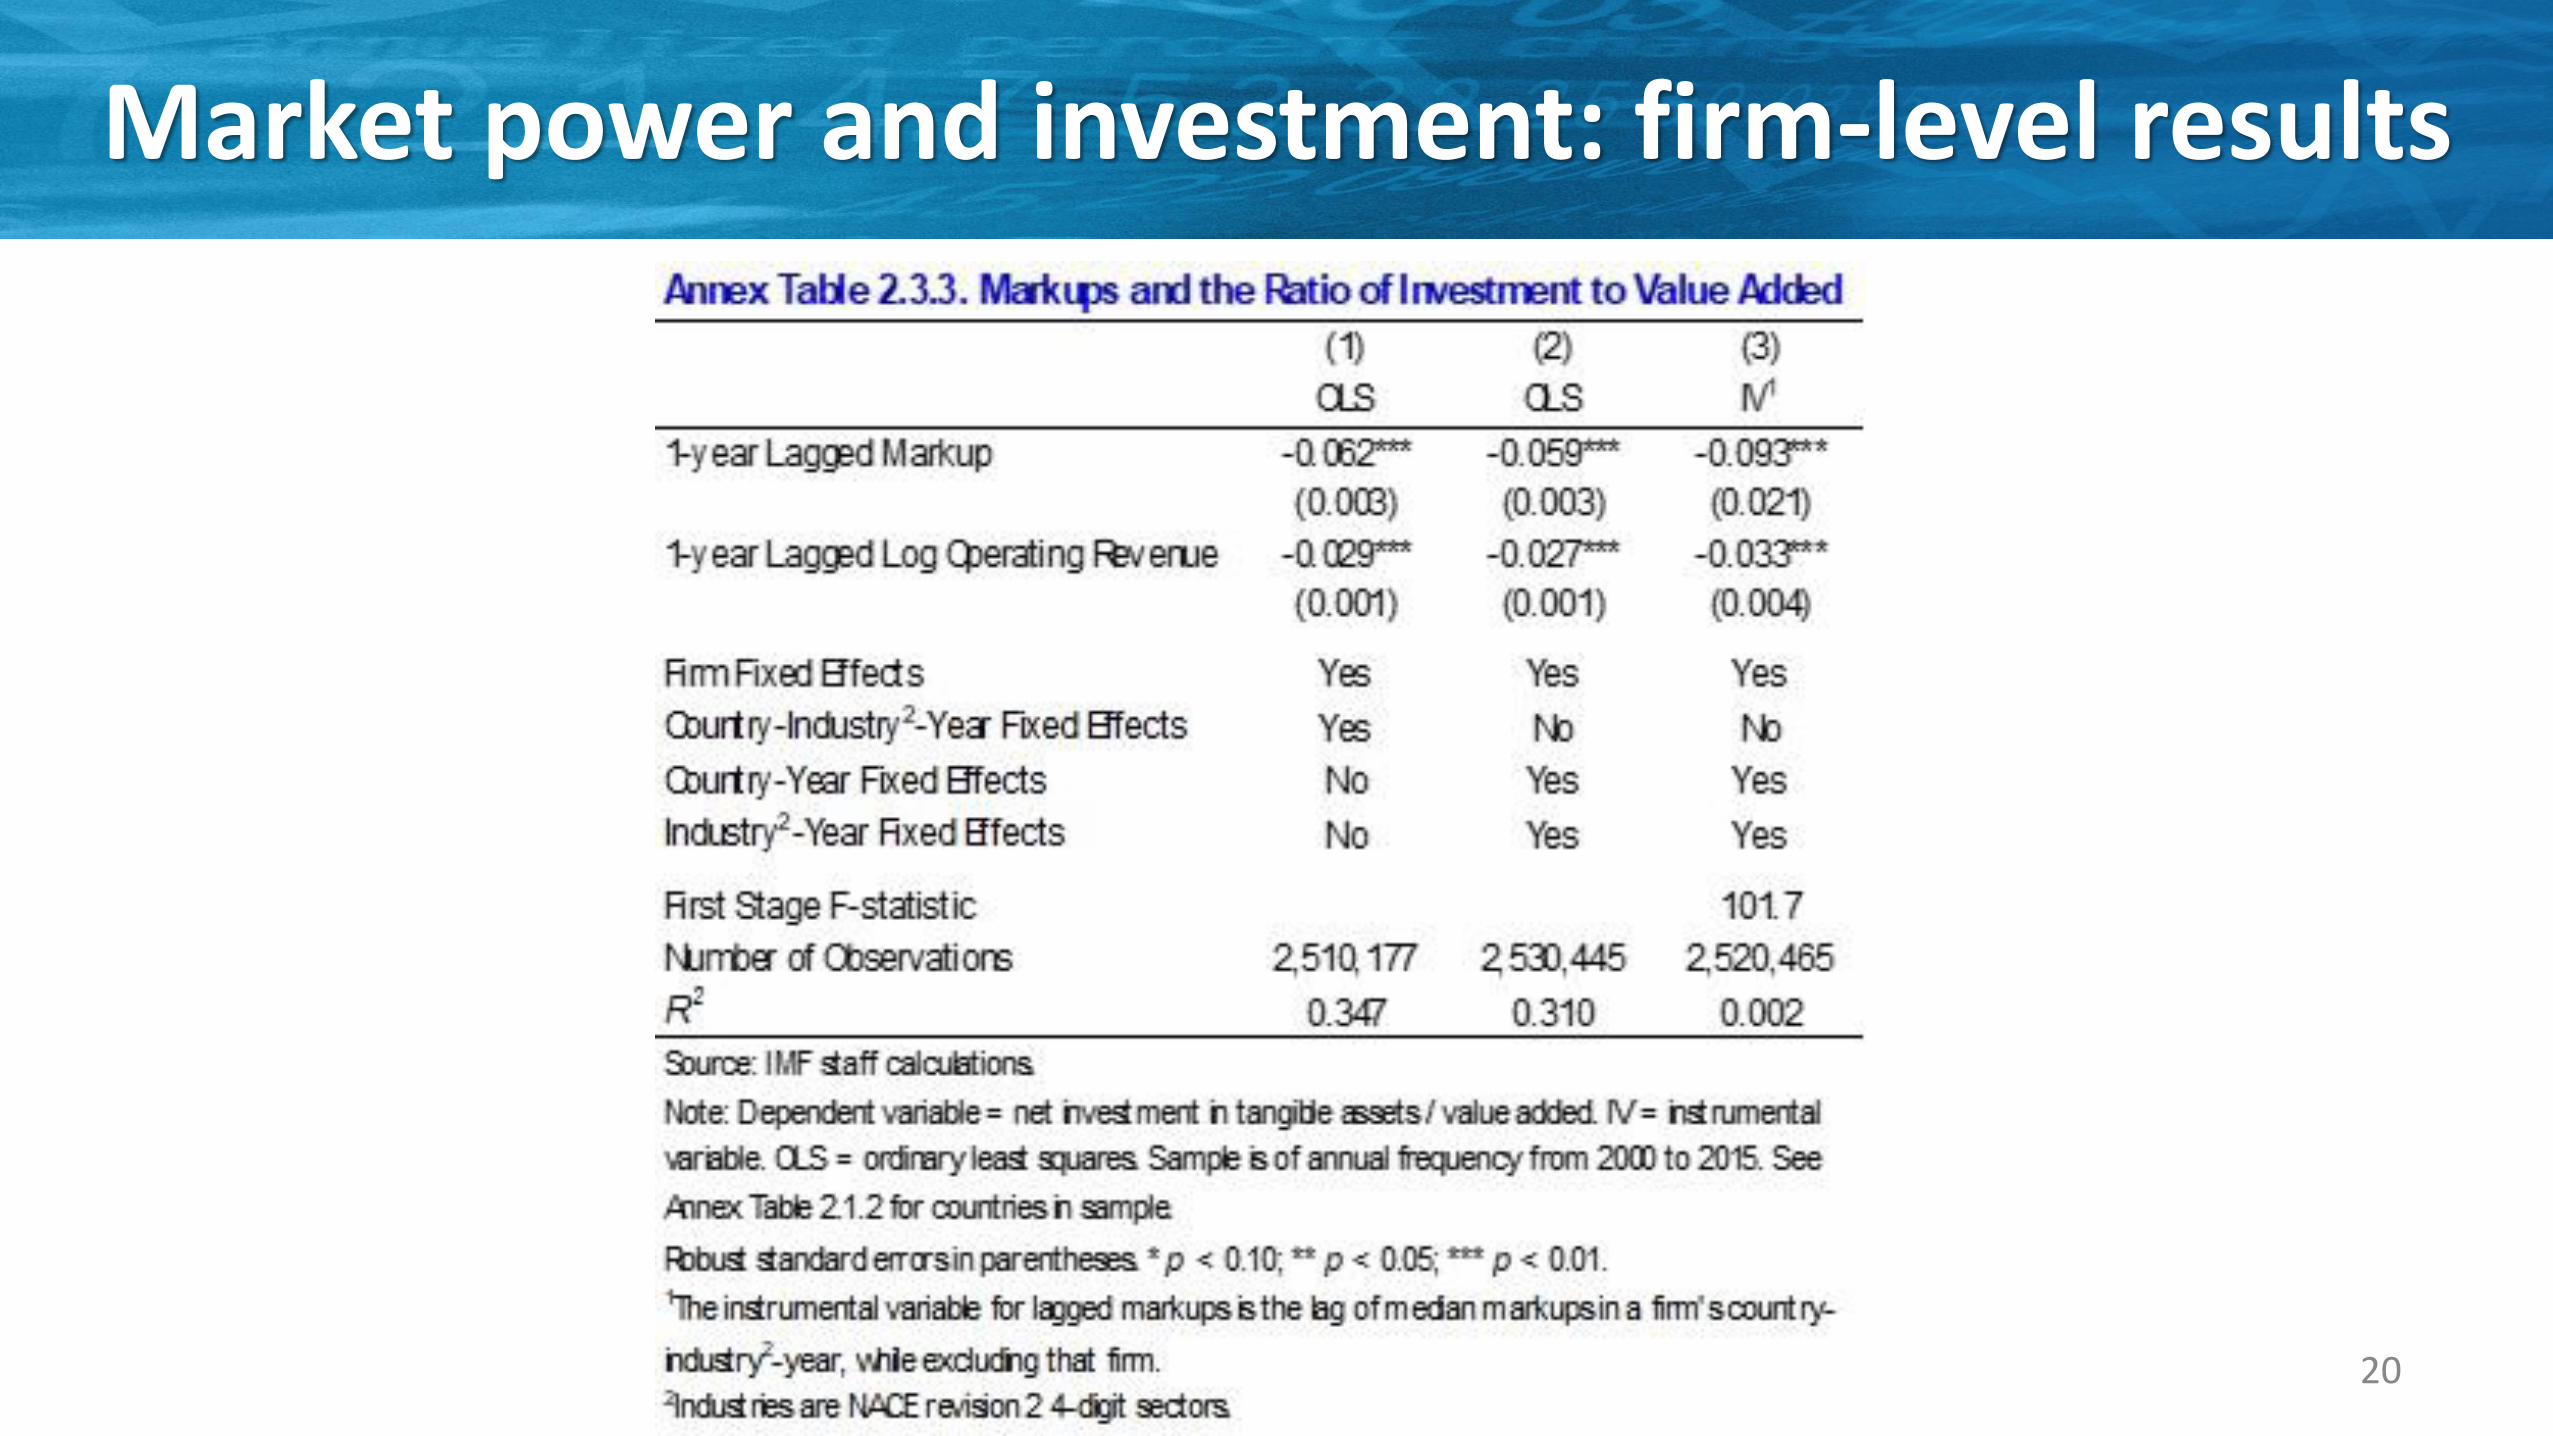
Market power and investment: firm-level results
20
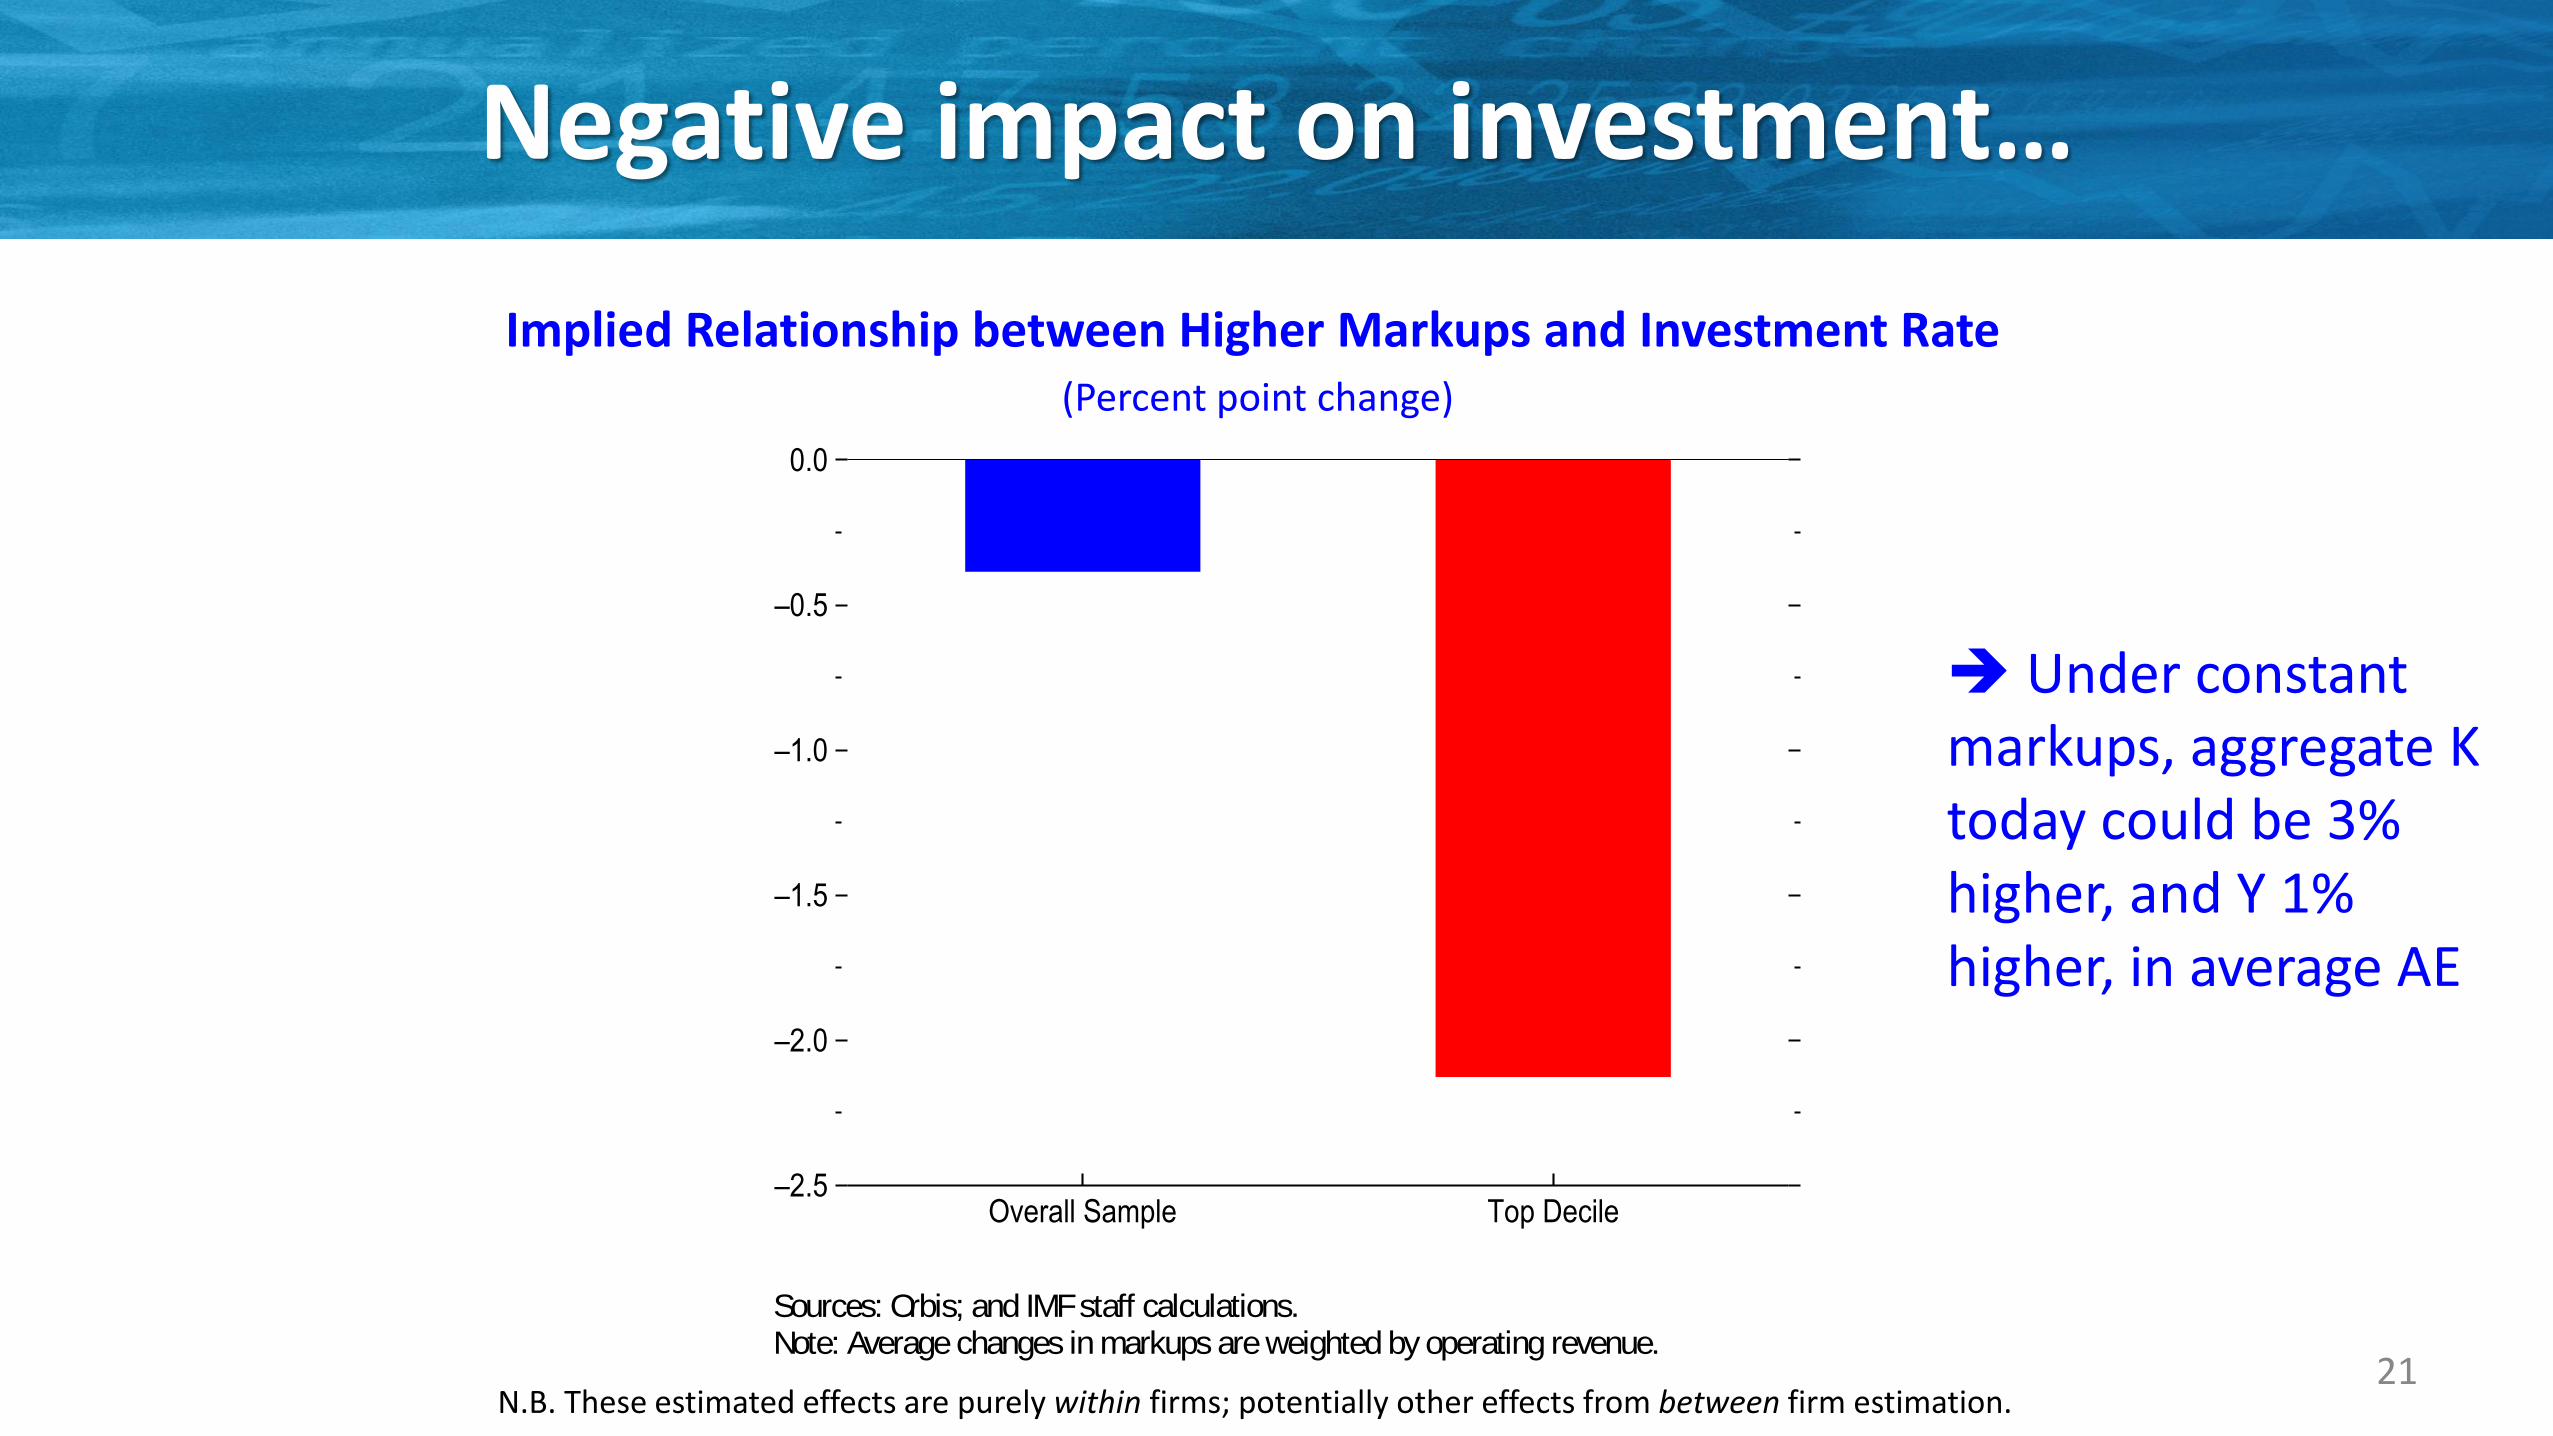
Negative impact on investment…
21
➔ Under constant markups, aggregate K today could be 3% higher, and Y 1% higher, in average AE
N.B. These estimated effects are purely within firms; potentially other effects from between firm estimation.
–2.5
–2.0
–1.5
–1.0
–0.5
0.0
Overall Sample Top Decile
Figure 2.8. Markups and Physical Capital Investment(Percentage point change in investment)
Sources: Orbis; and IMF staff calculations.Note: Average changes in markups are weighted by operating revenue.
For the overall sample, the average increase in firm’s markup is associated with a 0.4 percentage point decrease in its physical capital investment rate. For the top decile firms in markups, the average increase in firm’s markup is associated with a decrease in investment rate of 2 percentage points.
Implied Relationship between Higher Markups and Investment Rate (Percent point change)
…that somewhat lowered natural interest rate, thereby amplifying post-2008 recession and/or pushing central banks into more QE
22
• Build DSGE model to explore impact of higher markups for inflation, interest rates and output-inflation trade-off (~ Smets-Wouters AER 2007):
o Households, firms, monetary policy (subject to ZLB)
o Capital & labor in production, price & wage stickiness
o Estimated on euro area and US data, respectively
o Period-by-period, exogenous rise in markups (calibrated on within-firm increase in data)
• 3 key findings (US ~ EA):
o Slightly higher inflation (~ 0.2 pct pt during 2000s), but lower investment & slack ➔ trade-off
o Slight fall in natural rate (~ 0.1 pct pt by 2015) as potential output growth falls
o Impact on slope of Phillips curve unclear (Calvo vs. Rotemberg), but small in any event
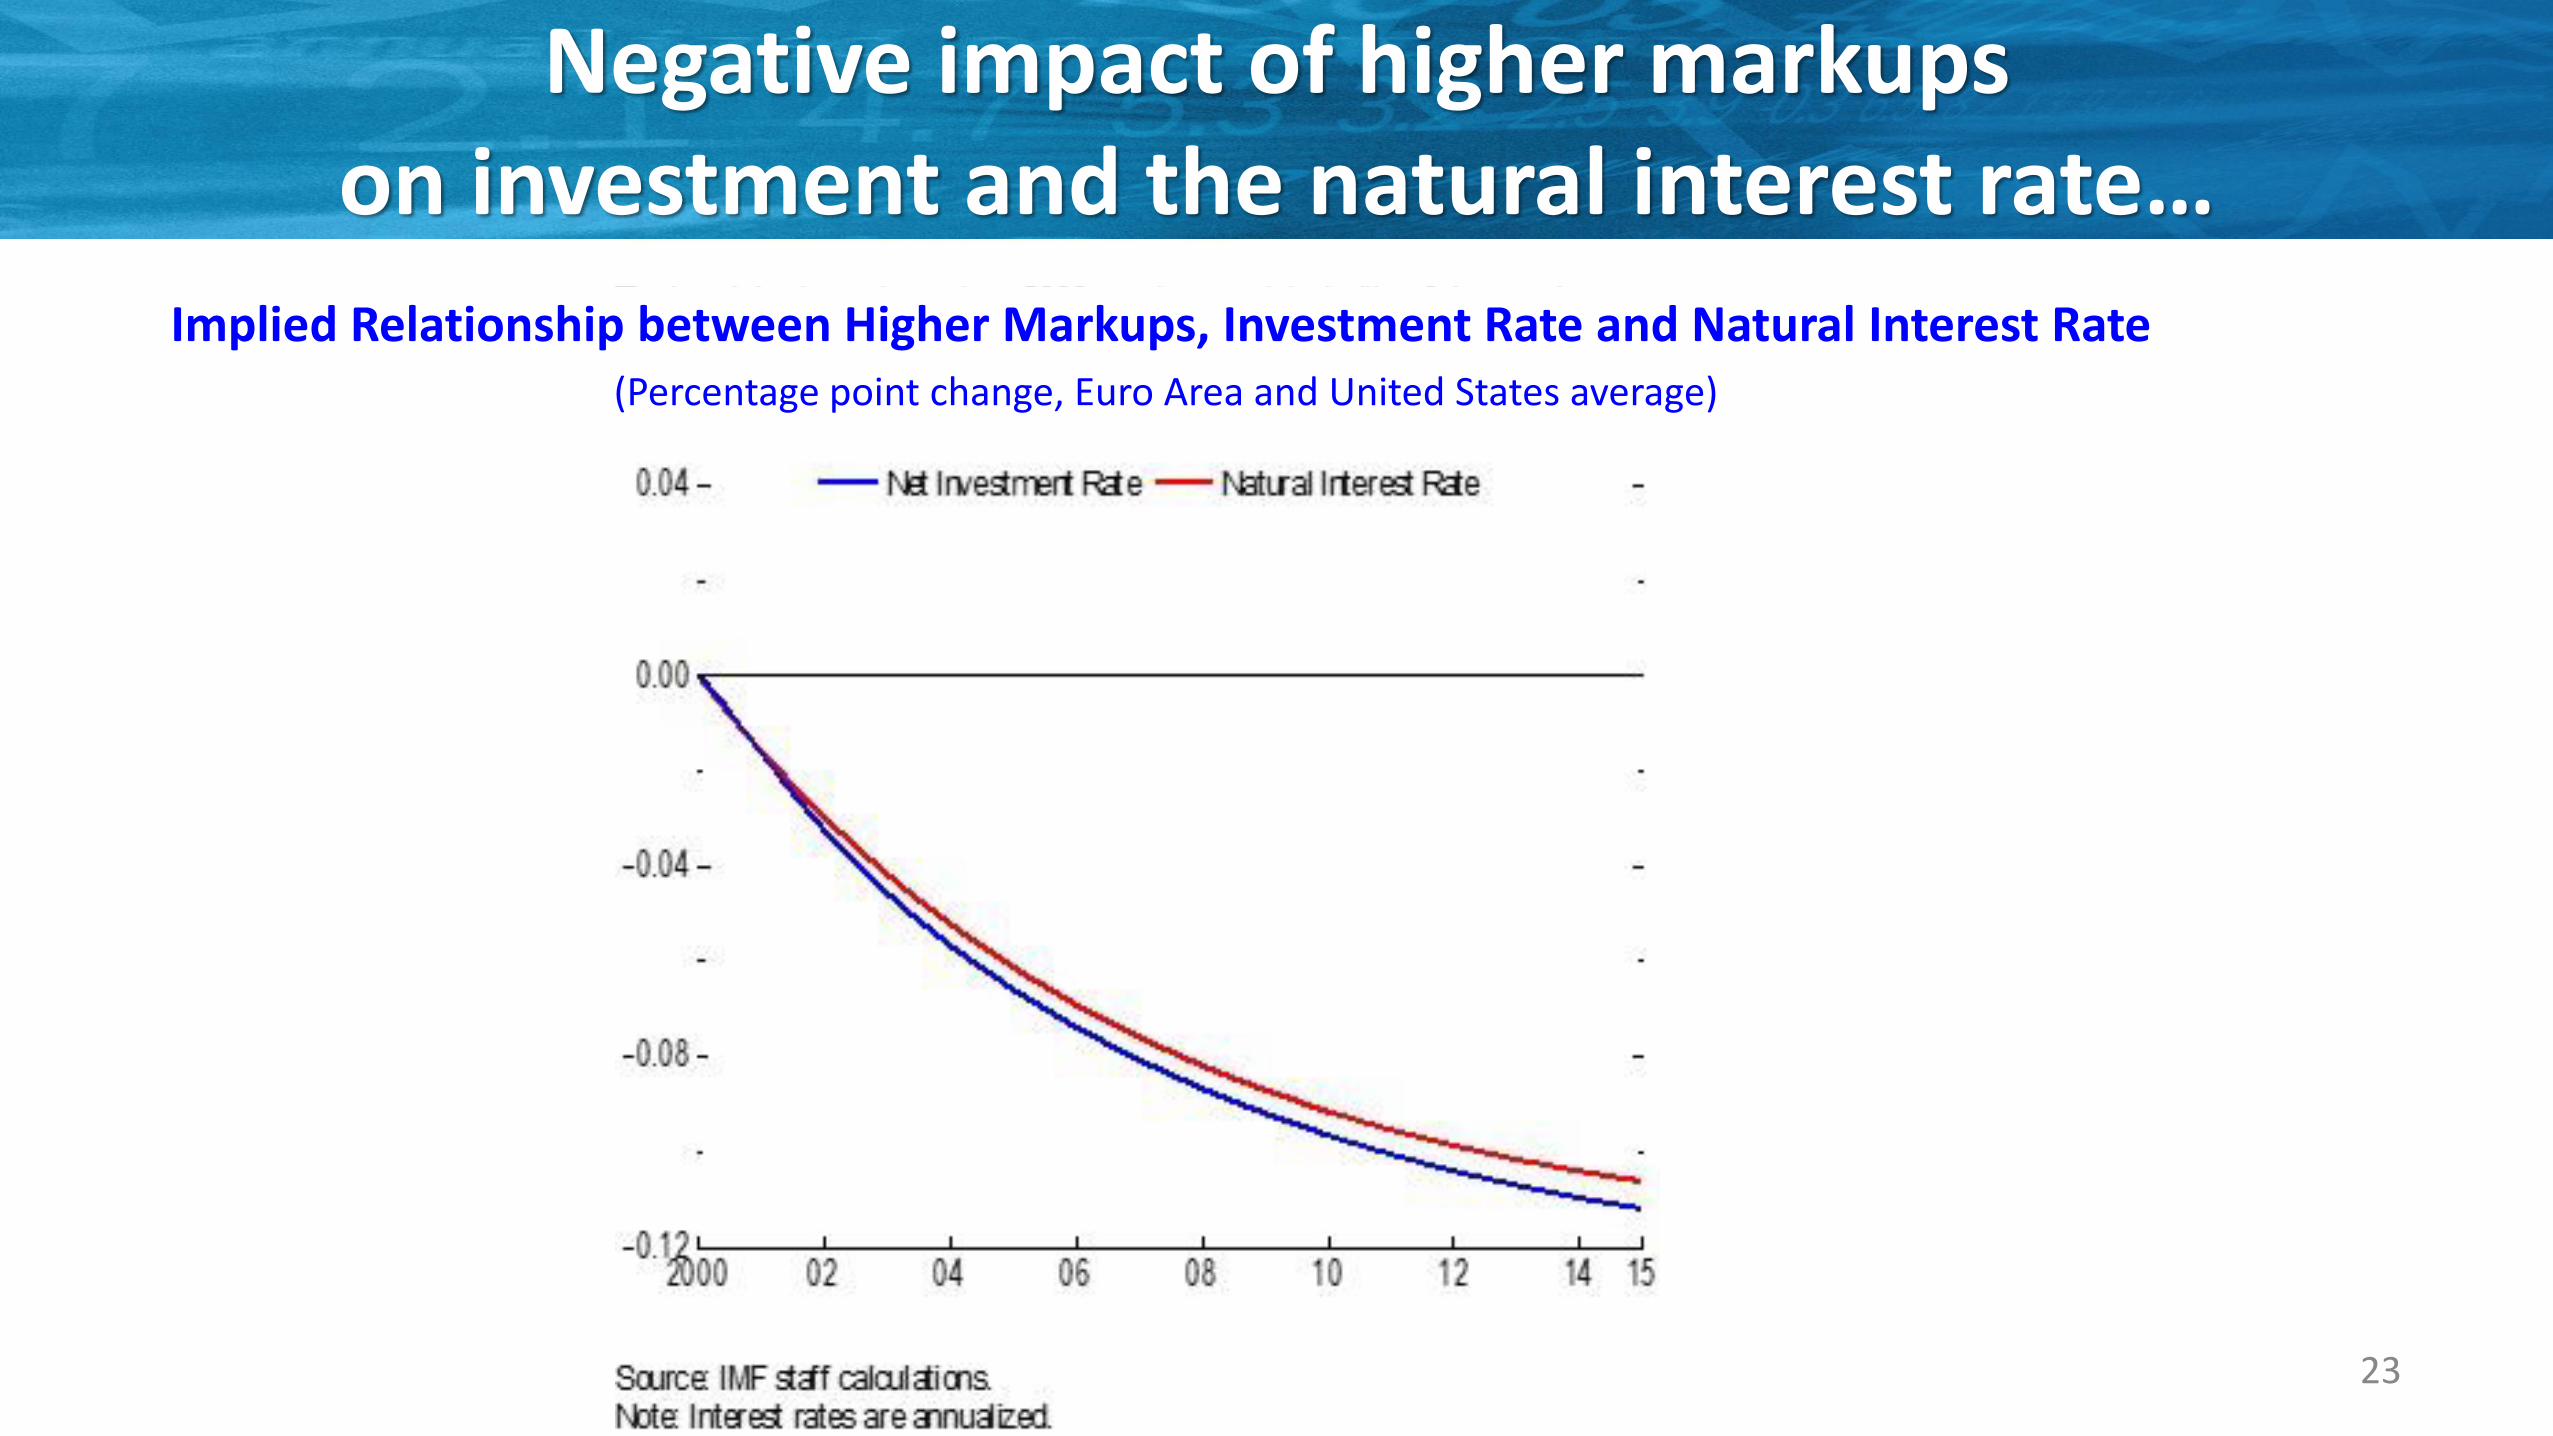
Negative impact of higher markups on investment and the natural interest rate…
23
Implied Relationship between Higher Markups, Investment Rate and Natural Interest Rate(Percentage point change, Euro Area and United States average)
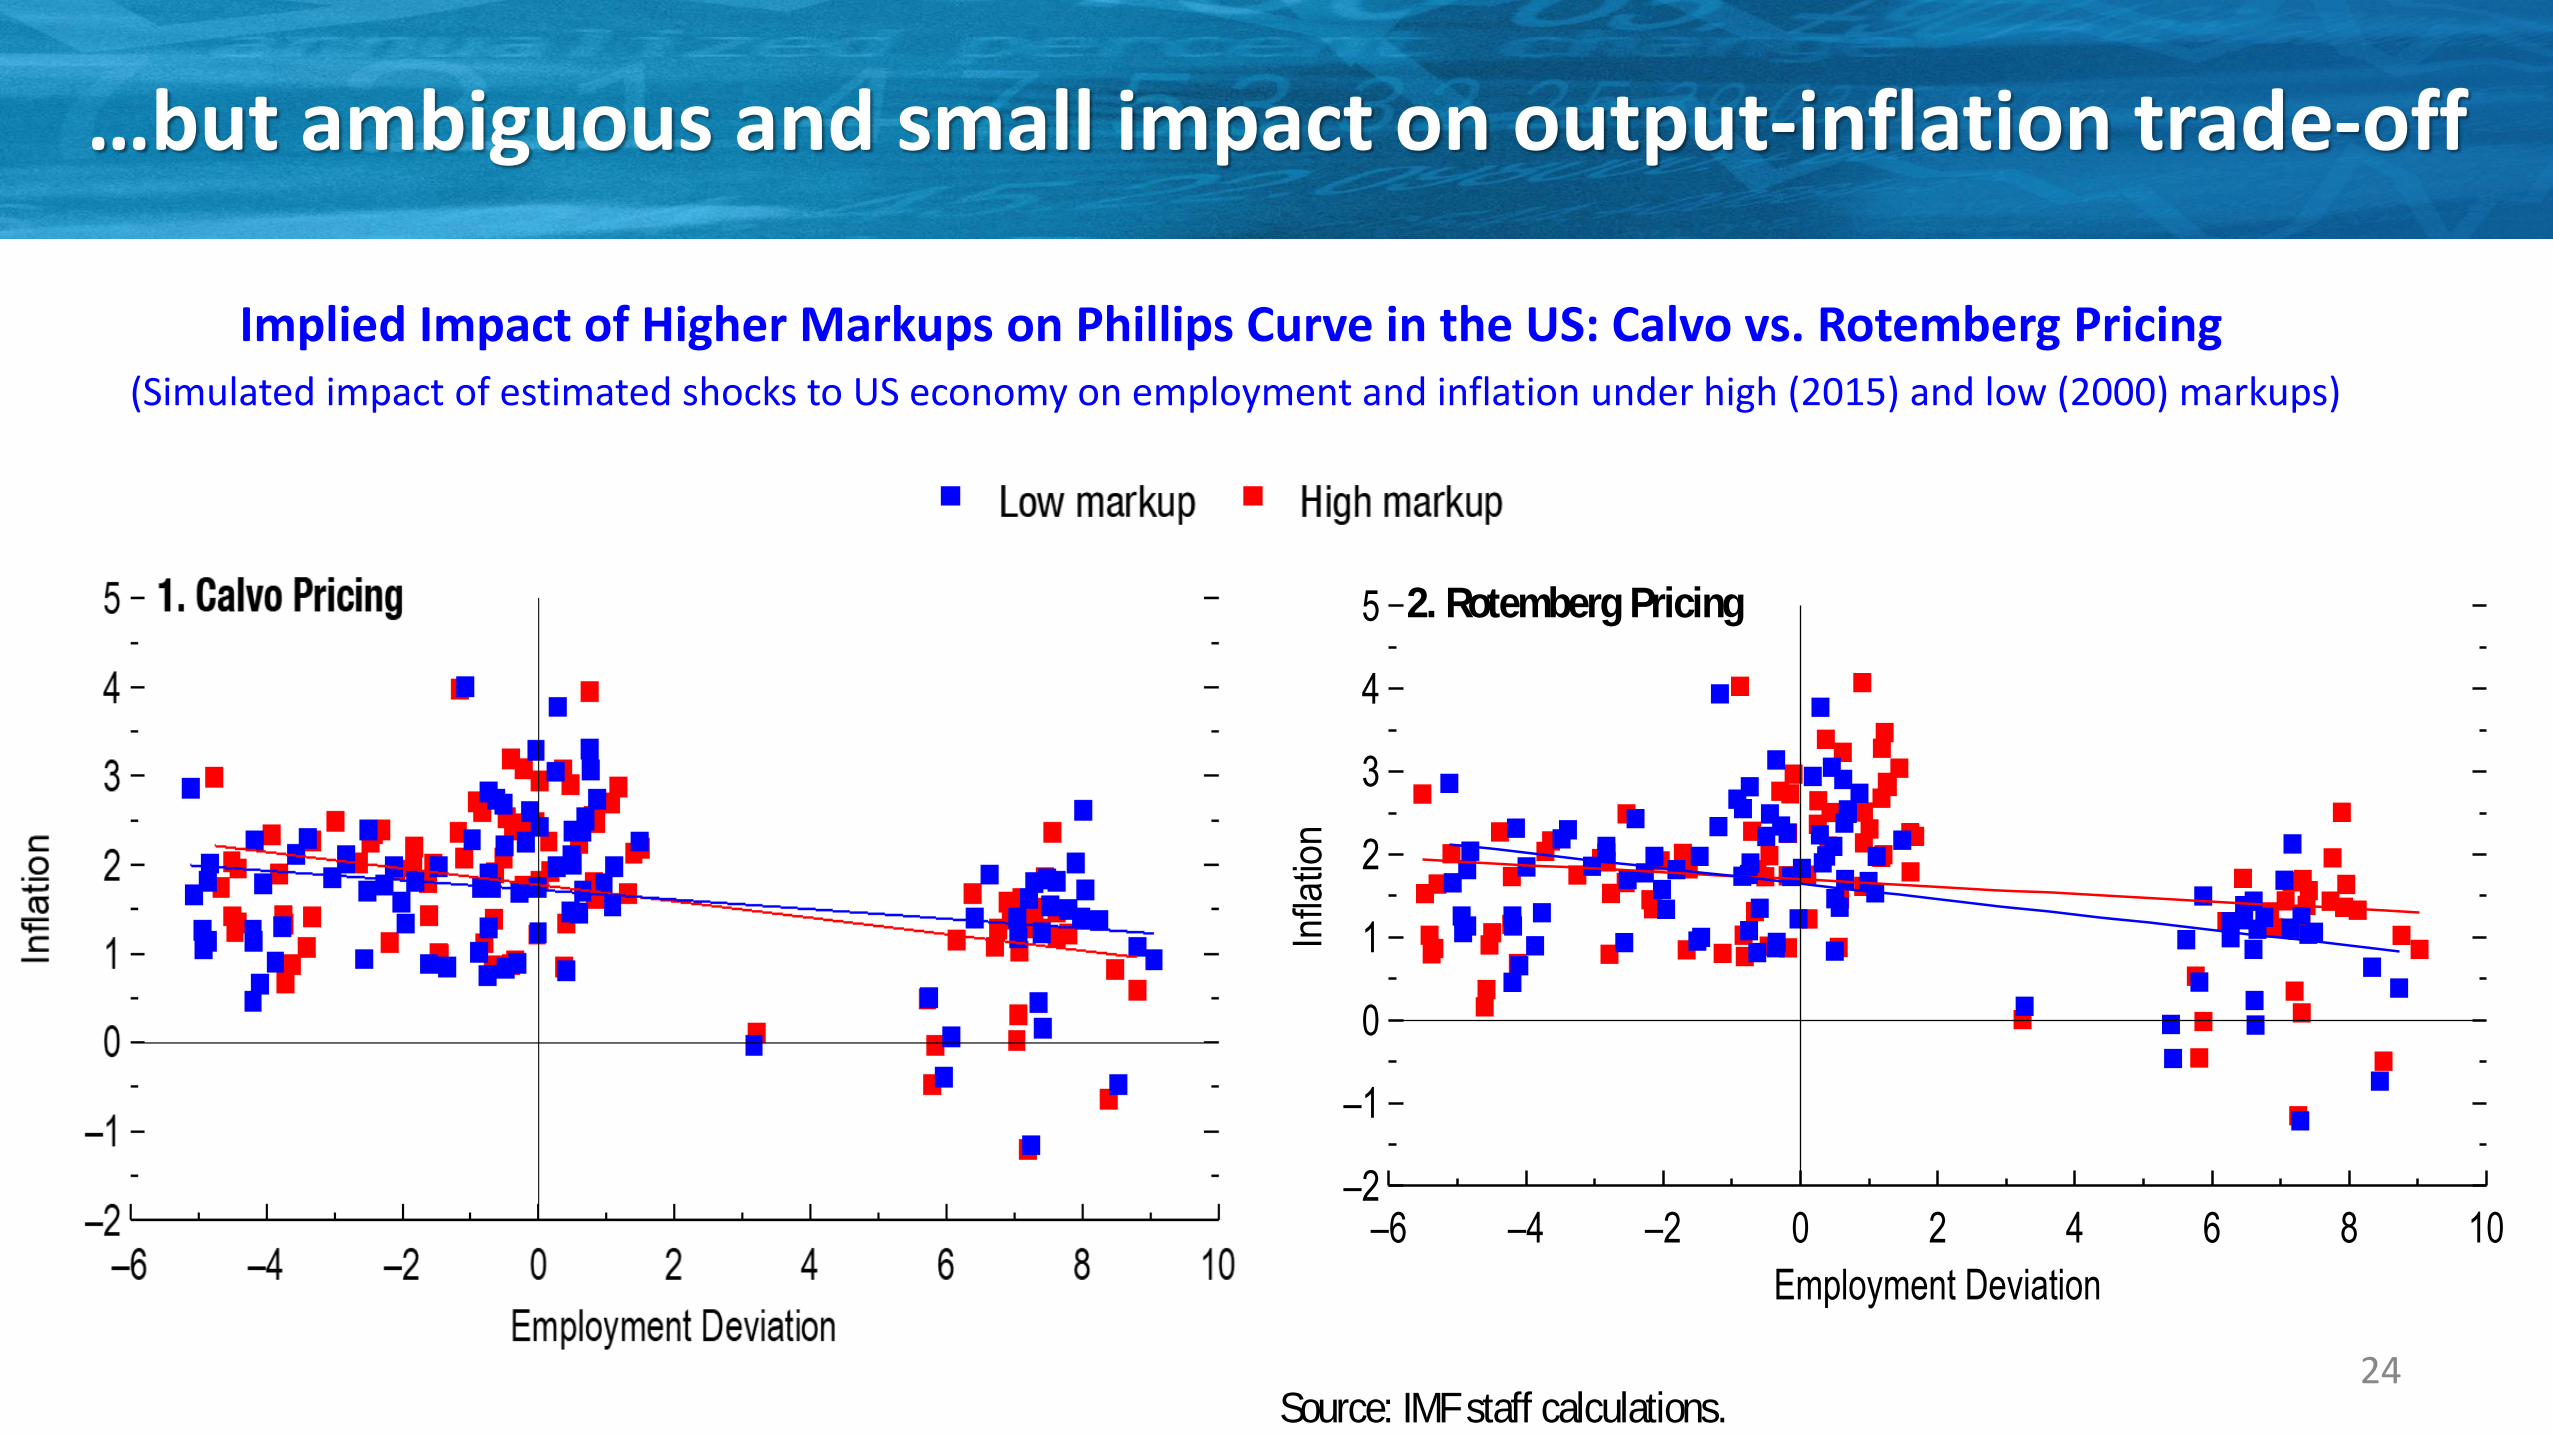
…but ambiguous and small impact on output-inflation trade-off
24
–2
–1
0
1
2
3
4
5
–6 –4 –2 0 2 4 6 8 10
Infla
tion
Employment Deviation
–2
–1
0
1
2
3
4
5
–6 –4 –2 0 2 4 6 8 10
Infla
tion
Employment Deviation
Source: IMF staff calculations.
1. Calvo Pricing
2. Rotemberg Pricing
Annex Figure 2.3.2. Simulated Phillips Curve(Percent)
Low markup High markup
Implied Impact of Higher Markups on Phillips Curve in the US: Calvo vs. Rotemberg Pricing(Simulated impact of estimated shocks to US economy on employment and inflation under high (2015) and low (2000) markups)

Implications of Rising Market Power for Income Distribution
25
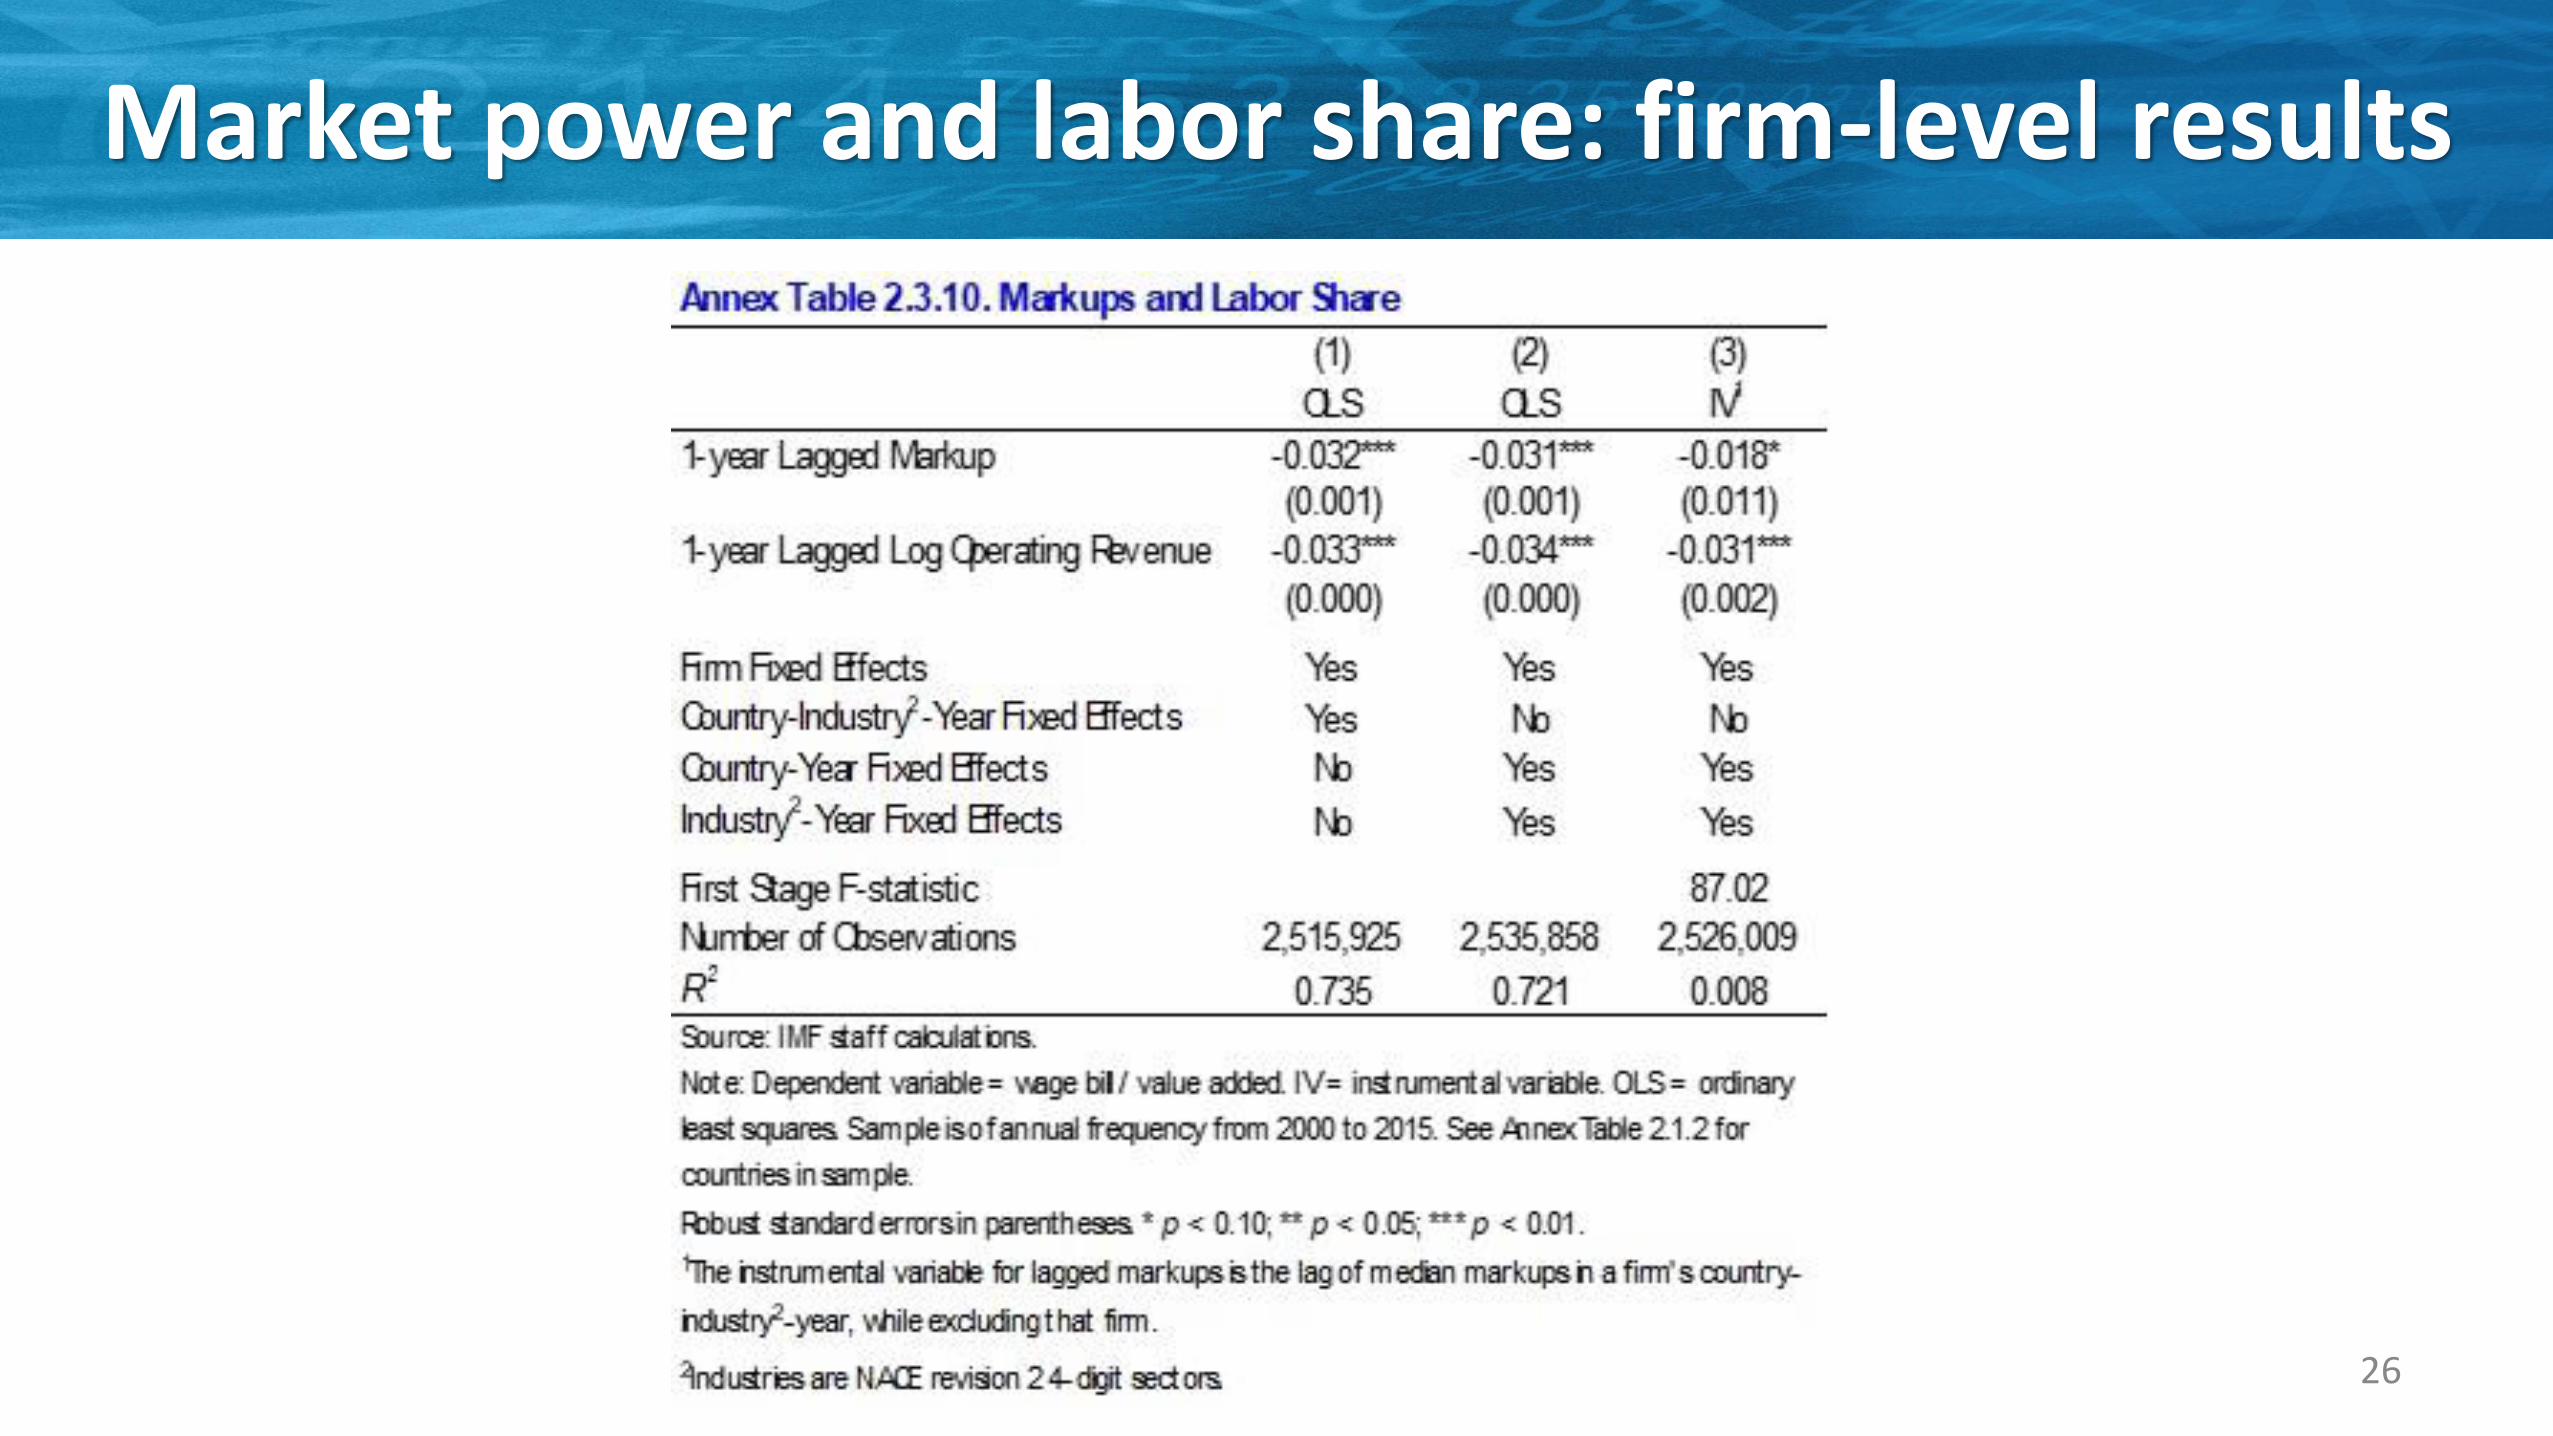
Market power and labor share: firm-level results
26
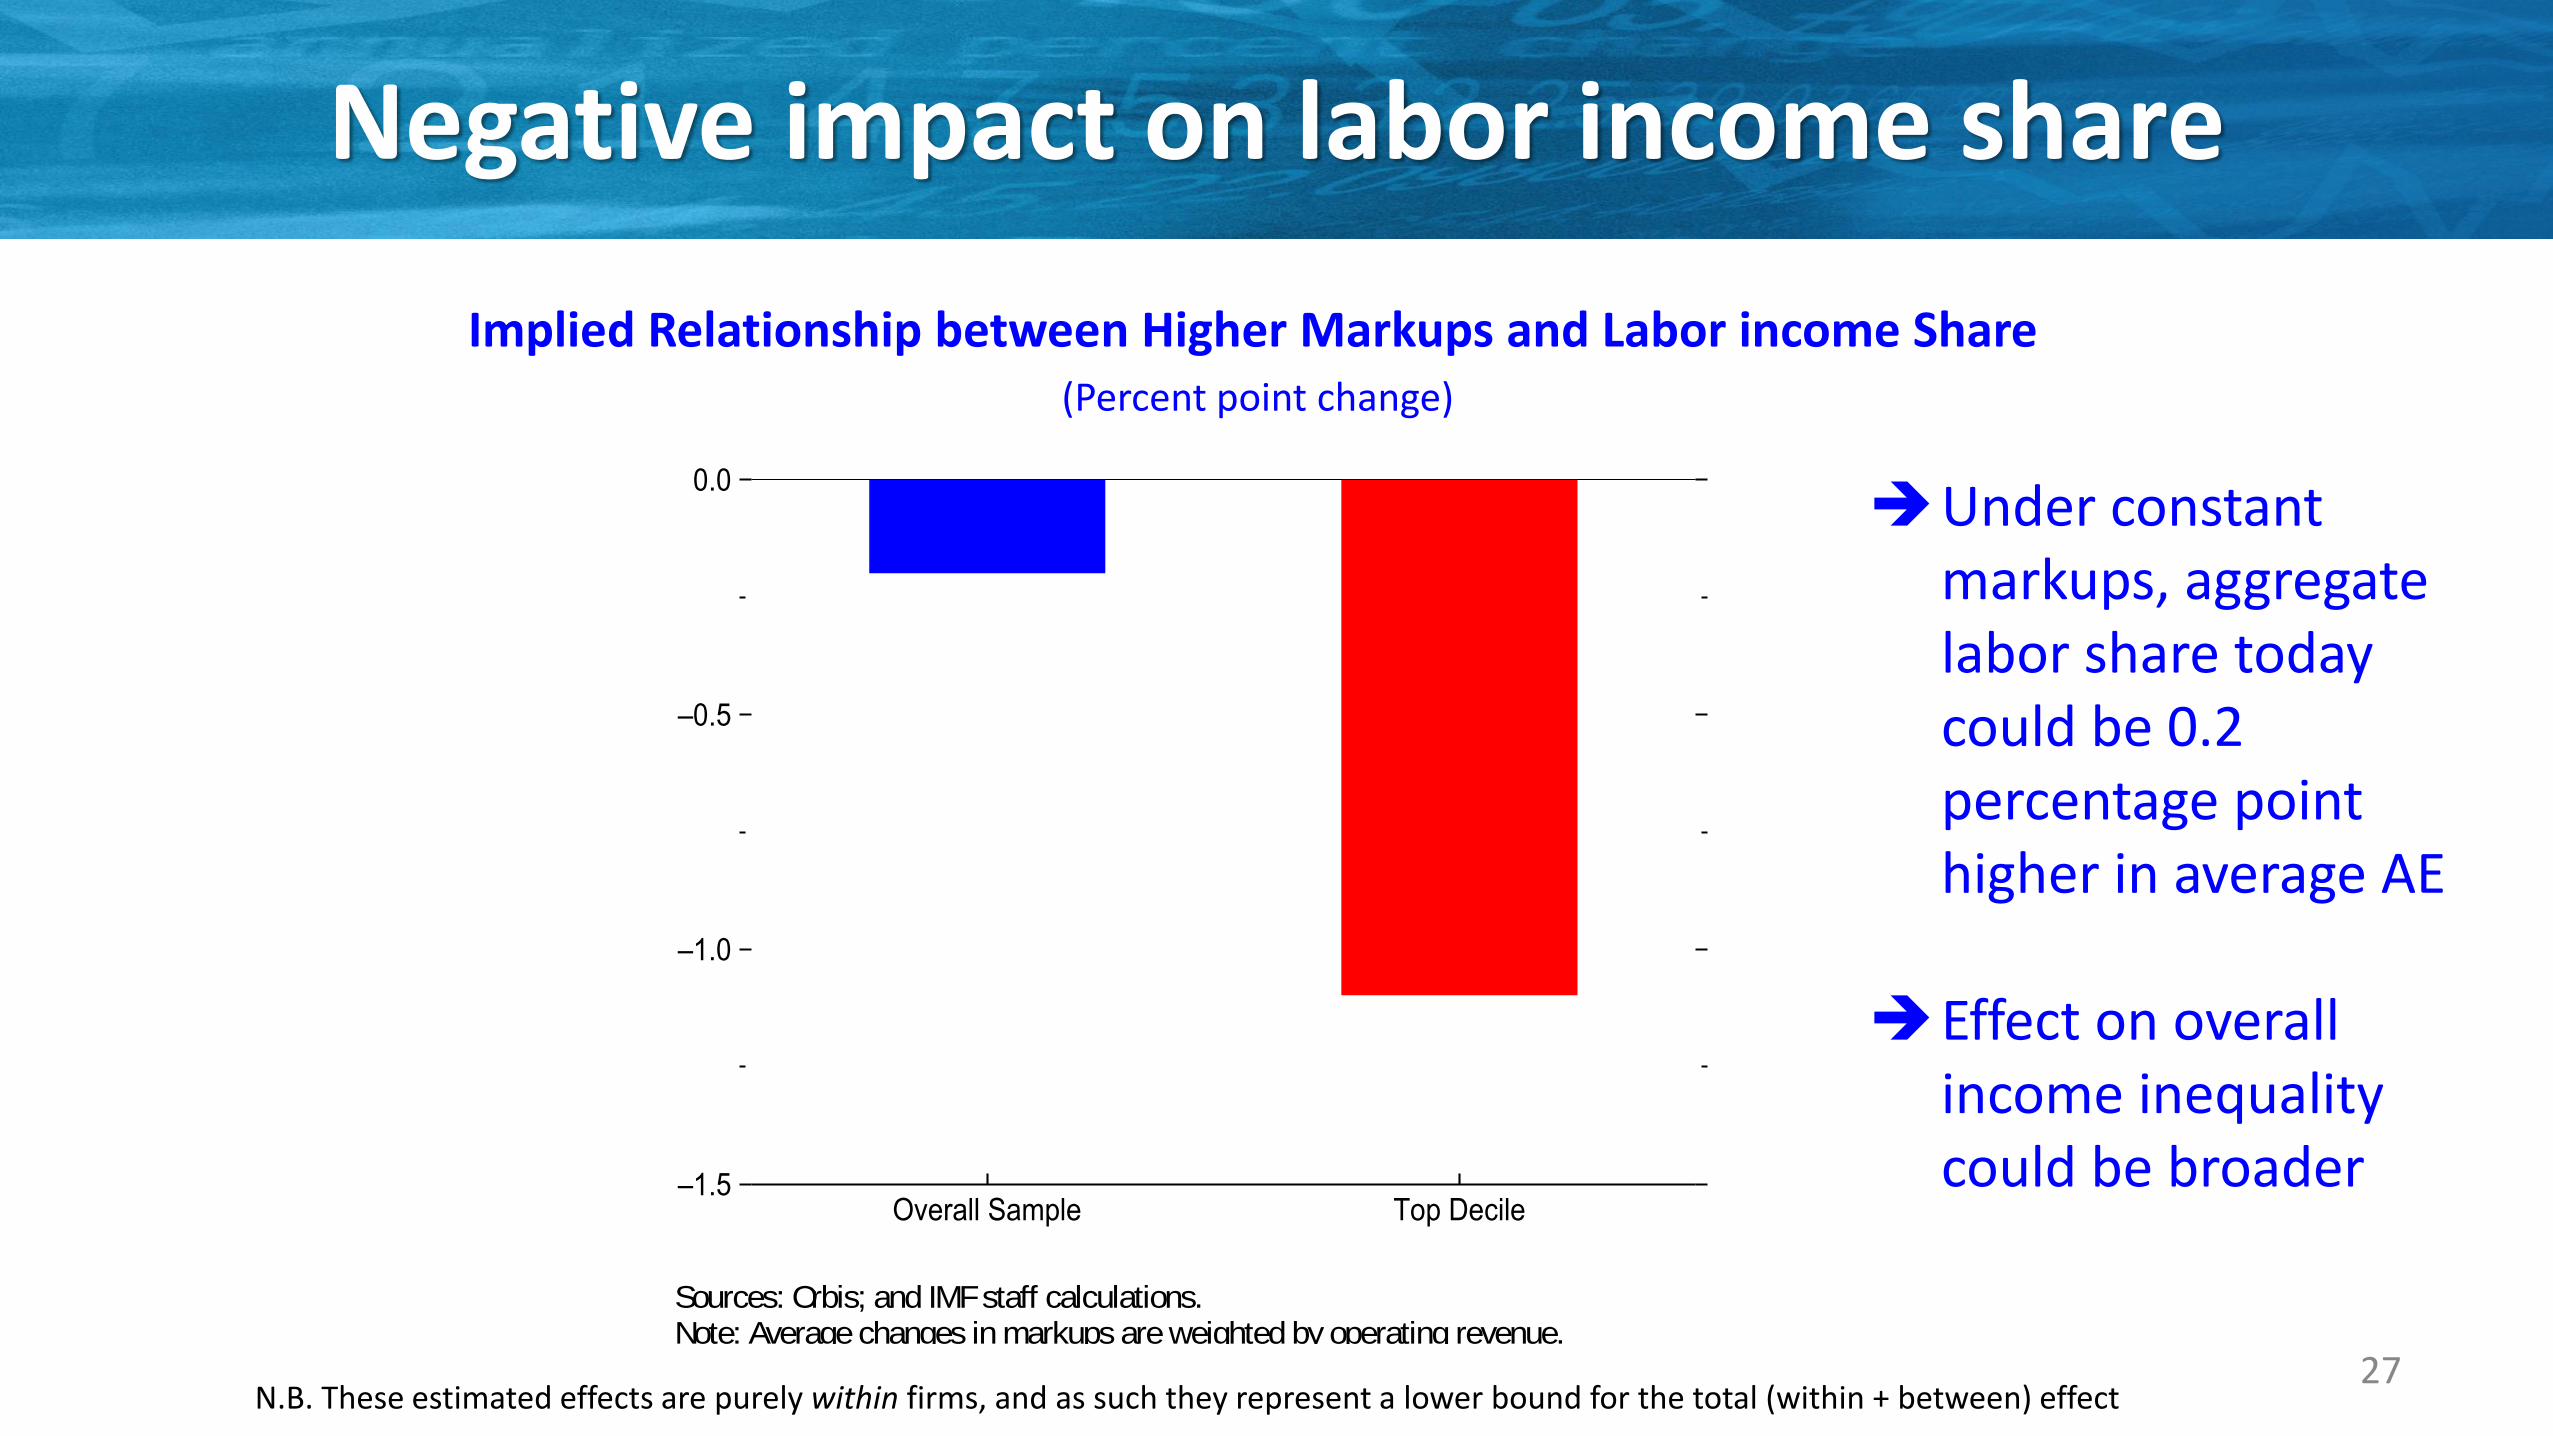
Negative impact on labor income share
27
➔Under constant markups, aggregate labor share today could be 0.2 percentage point higher in average AE
➔Effect on overall income inequality could be broader
N.B. These estimated effects are purely within firms, and as such they represent a lower bound for the total (within + between) effect
–1.5
–1.0
–0.5
0.0
Overall Sample Top Decile
Figure 2.10. Markups and Labor Income Shares(Percentage point change in labor shares)
Sources: Orbis; and IMF staff calculations.Note: Average changes in markups are weighted by operating revenue.
For the overall sample, the average increase in firm’s markup is associated with a 0.2 percentage point decrease in its labor share. For the top decile firms in markups, the average increase in firm’s markup is associated with a decrease in labor share of 1 percentage point.
Implied Relationship between Higher Markups and Labor income Share (Percent point change)

Summary and Policy Implications
28
Summing up
• Facts:o Moderate rise in markups across AEs—8% since 2000, broad-based, services >> manuf, US > EUo Mostly within firms. US seems different (large between component)o Rise concentrated among small fraction of high-markup firms in each industry
• Growth:o Innovation. Negligible impact so far, could grow increasingly negative if rising market power of high-markup firms kept unchecked
o Investment. Lower investment—reducing capital stock by some 3% since 2000 in average AE
o Macroeconomic stabilization. Made it somewhat more difficult, due to decline in natural rate
• Income distribution:o Labor share. Contributed at least 10% (~ 0.2 pct pt) to decline in labor share in average AE.
29
Policy Implications (1)
• Changing structure of product markets more than policy-driven weakening of competition…o Concentration among small fraction of firms in many countries and industries
o Larger markup increases in better-performing firms
o Larger increase in the US but also larger (growth-enhancing?) reallocation component
o Market deregulation over past three decades (domestic, trade, FDI)
• …does not warrant inaction: o “Winner-takes-most” more likely where competition policy makes it easier to happen
o Firms that achieved dominance through innovative product and business practices may entrench positions by erecting barriers to entry (e.g. proprietary intangibles)
30
Policy Implications (2)
• Over-arching goal: level playing field across all competitors, including new firms:o Domestic and foreign competition: entry barriers, particularly in services (licensing
requirements…etc); trade and FDI liberalization
o Competition policy—key complement to product market deregulation: - Market examinations and remedies- Greater attention to potential loss of competition (?)- Competition authorities’ resources- Dynamic perspective: magnitude and persistence of industry-level profits matters
o Diffusion: IPRs to reward disruptive innovations much more than incremental ones
o Corporate taxation: shift from profit to economic rent taxation (e.g. cash flow tax); destination-based > sourced-based (e.g. destination-based cash-flow tax)
31
Wenjie Chen, Federico Diez (lead author), Romain Duval (lead author), Callum Jones, Carolina Villegas-Sanchez (consultant) with contributions from Mai Dao, Nan Li, and support from Jiayue Fan and Christopher Johns.
THE RISE OF CORPORATE MARKET POWER AND ITS
MACROECONOMIC EFFECTS
Thank you!

Additional Slides
THE RISE OF CORPORATE MARKET POWER AND ITS
MACROECONOMIC EFFECTS

Boxes
• The role of rising concentration and market power for corporate savings
• Are M&As followed by market power increases? Cross-country firm-level evidence
34

Model: Key Ingredients
• Households consume, supply labor, invest in capital subject to quadratic capital adjustment costs, and save through one-period bonds
• Intermediate goods-producing firms hire capital and labor in competitive markets• They produce a substitutable good• They face frictions on price setting and set a price which is a markup over marginal costs
• Final goods-producing firms aggregate the intermediate goods into a final good which is used for consumption and investment
• Monetary authority sets the policy interest rate following a Taylor rule
• Stochastic shocks to productivity, discount, Phillips curve, investment, Taylor rule
35