health asert programme wales
TRANSCRIPT

Health ASERT Programme Wales
5. A Review of Databases and other Statistical Sources Reporting Ethnic Group and their Potential
to Enhance the Evidence Base on Health Promotion
Enhancing the health promotion evidence base on Minority Ethnic Groups, Refugees/Asylum seekers,
and Gypsy Travellers
G057 cover.indd 1 31/5/07 10:05:28

G/057/07-08 May Typeset in 12 ptISBN: 978 0 7504 4237 4 CMK 22-04-030(096) © Crown copyright 2007
G057 cover.indd 2 31/5/07 10:05:28

Health ASERT Programme Wales Report SeriesHealth ASERT Programme Wales. Enhancing the Health Promotion Evidence Base on Minority Ethnic Groups, Asylum Seekers/Refugees and Gypsy Travellers.
1. Main Findings and Recommendations
2. A Review of the Literature on the Health Beliefs, Health Status, and Use of Services in the Gypsy Traveller Population, and of appropriate Health Care Interventions
3. A Review of the Literature on the Health Beliefs, Health Status, and Use of Services in the Minority Ethnic Group Population, and of appropriate Health Care Interventions
4. A Review of the Literature on the Health Beliefs, Health Status, and Use of Services in the Refugee and Asylum Seeker Populations, and of appropriate Health Care Interventions
5. A Review of Databases and Other Statistical Sources Reporting Ethnic Group and their Potential to Enhance the Evidence Base on Health Promotion
6. Summary Primary Research Report (to be published 2007)
7. Full Length Primary Research Report (to be published 2007)
Author: Peter Aspinall
Centre for Health Services Studies University of Kent George Allen Wing Canterbury Kent CT2 7NF www.kent.ac.uk/chss
Contract Manager: Launa Anderson
Research and Evaluation Branch Health Improvement Division Public Health and Health Professions Department Welsh Assembly Government Cathays Park Cardiff CF10 3NQ www.wales.gov.uk/cmoresearch
Contact for information: HPDR&[email protected]
The views expressed in this report are those of the author and not necessarily those of the Welsh Assembly Government
1
Eng inside.indd 1 31/5/07 10:04:48
ContentsIntroduction 5
I. Gypsy Travellers 71. Pupil Level Annual Schools’ Census (PLASC) 7
2. Other datasets 9
II. Refugees and Asylum Seekers 11III. Black and Minority Ethnic Groups 131. Issues of ethnic categorisation in Wales 13
2. Ethnicity data collection in secondary care settings 14
3. Population profiling in primary care 15
4. Mortality data 16
5. Welsh Health Survey 17
6. Some specific collections 18 6.1 Sexually Transmitted Infections 18 6.2 Children looked after by local authorities 19 6.3 National Community Child Health Dataset (NCCHD) 20 6.4 All Wales perinatal survey 20 6.5 “Count me in” census of patients in mental health hospitals and facilities 20 6.6 Teenage pregnancy 21 6.7 National Diabetes Audit 21 6.8 All Wales Injury Surveillance System - Emergency care dataset 22
7. Wider determinants of health 22 7.1 Welsh Labour Force Survey 22 7.2 General Household Survey 22 7.3 British Household Panel Survey 23 7.4 ONS Longitudinal Survey 23 7.5 Millennium Cohort Survey 23 7.6 National Survey of Sexual Attitudes and Lifestyles (2000) 23 7.7 Pupil Level Annual School Census (PLASC) 23 7.8 National Assembly for Wales Homelessness 23 7.9 HESA Student Record 24 7.10 Department for Work and Pensions data 24 7.11 Home Office Citizenship Survey 24
IV. The Potential of Synthetic Estimation Techniques 25
2
Eng inside.indd 2 31/5/07 10:04:48
V. Census Measures of Morbidity 271. Limiting long-term illness 27
2. General health 27
3. Permanently sick/disabled 27
4. Carers 27
5. Persons in hospital and communal establishments on census day 27
VI. Conclusions and Recommendations 29
Appendix: Question examples 31
References 35
3
Eng inside.indd 3 31/5/07 10:04:49
PrefaceThe Health ASERT Programme Wales is a research programme commissioned by the Welsh Assembly Government to investigate health promotion issues among Minority Ethnic Groups, Refugees/Asylum seekers, and Gypsy Travellers. The acronym ASERT stands for Asylum Seekers, Ethnic minorities, Refugees and Travellers. Research was undertaken by the Research Centre for Transcultural Studies in Health, Middlesex University and the Centre for Health Services Studies, University of Kent at Canterbury between February 2003 and March 2004. The study aimed to enhance the evidence base on health promotion issues related to minority ethnic groups, refugees/asylum seekers and Gypsy Travellers in Wales in order to inform policy and programme development in the Welsh Assembly Government’s Health Promotion Division (now known as Health Improvement Division) and elsewhere in the Public Health and Health Professions Department. The study objectives were to: identify gaps in the existing evidence base of health needs and health promotion issues for the study groups; identify existing good practice of health services and promotion for the study groups; explore ways of delivering health promotion policy/programmes targeting these groups in a culturally and socially sensitive manner; identify issues for further research.
AcknowledgementsI am grateful to Ms. Kaori Onoda and Ms. Launa Anderson of the Research and Evaluation Branch, Health Improvement Division, and other members of the Health ASERT Programme Wales Steering Group, and Welsh Assembly Government for their helpful and informative comments on an earlier draft of this report.
This report was originally compiled in March 2004. In a small number of cases, updates have been provided prior to publication.
4
Eng inside.indd 4 31/5/07 10:04:49

5
IntroductionThere is currently only limited ethnicity data collection in the fields of health and health care and determinants of health. A recent scoping study to explore the feasibility of a health and social care research and development network covering black and minority ethnic groups in Wales (Welsh Assembly Government, 2005a) found:
‘The statistical data needed to build an understanding of BME health and social care needs, and to monitor the access and utilisation of available services, remains embryonic’.
The lack of useful ethnicity data was identified as a key challenge, one respondent writing:
‘In order to plan services effectively, demographic and health-profiling information on the BME communities in Wales should be collated and made available. Ongoing national, regional, as well as ward and neighbourhood level profiling work is necessary. Presently there is a dearth of statistical health data on BME groups. Reliable data on ethnic groups and ethnic monitoring are essential tools for ascertaining …the health care needs of a population, as well as for monitoring current services and commissioning new services’
Also considered problematic was the ‘amalgamation of Welsh data with English data to produce “England and Wales” data - wholly unacceptable in the era of post-devolution policy-making’.
A Statistical Focus on Ethnicity in Wales (National Statistics and National Assembly for Wales, 2004) has identified data sources that are ethnically coded: these are mainly surveys in the area of determinants of health.
A scoping study for the Welsh Assembly Government (2005b), setting out a case for a generic health information network, also has documented data sources more generally. In the last two or three years some new datasets have produced their first statistical releases.
Although ethnically coded data remains sparse, there have been some very notable success stories, including the recording of ethnic origin on all registrations in paediatric units reporting to the National Diabetes Audit and on 98 per cent of records in the National Community Child Health Database (NCCHD). (Welsh Assembly Government, 2005c)
These two scoping studies have formed the basis of two of the four infrastructure support services for the Clinical Research Collaboration Cymru (CRC Cymru): The Wales Equality and Diversity in Health and Social Care Research and Support Service (WEDHS); and Health Information Research Unit (HIRU). For more information on the CRC Cymru, please visit the website http://www.wales.nhs.uk/sites3/home.cfm?orgId=580.
Eng inside.indd 5 31/5/07 10:04:49

6
Eng inside.indd 6 31/5/07 10:04:49

7
I. Gypsy TravellersNearly all collections of ethnic data by public authorities utilise 2001 Census categories which exclude ‘Gypsy Travellers’ as a category (the exception being the Northern Ireland 2001 Census which included ‘Irish Traveller’ amongst the response options). However, the Office for National Statistics’ (ONS) full coding frame for write-in answers does include ‘Gypsy/Romany’, allocated to the ‘other white’ Census category. Local ethnic monitoring systems can, therefore, use this category and maintain full comparability with the 2001 Census classification.
There is likely to be a change in the ethnic categorisation for the Census 2011. This includes a new tick box option for ‘Gypsy/Romany/Irish Traveller’. There will be a census test in 2007 in order to test changes; a copy of the question being used in the test is available in the Appendix, Figure 1.
1. Pupil Level Annual Schools’ Census (PLASC)One of the few standard statistical collections that does include categorisation for Gypsy Travellers is the Pupil Level Annual School Census in England and Wales. In May 2001 the National Assembly for Wales consulted headteachers of maintained schools and local education authorities (LEAs) on guidance for schools on ethnic monitoring. Since 1990 and until that time schools had collected ethnic group data on categories based on the 1991 population Census. However, this had been to the exclusion of Gypsy Travellers and there was no other national reporting of data on Gypsy and Traveller children that would have enabled national monitoring of their experiences and achievements (although monitoring might have occurred locally). The new ethnic group classification in the 2001 Census (which included a ‘mixed’ category for the first time) raised issues of data protection and re-collection of ethnic group data on pupils using the new classification. Additionally, only limited use had been made of previous data collections to address attainment, the consultation highlighting the need ‘to emphasise the importance to schools of ethnic monitoring as a key element in understanding and addressing any variance of performance of pupils by ethnic group’.
The National Assembly for Wales undertook consultation specifically on ethnic monitoring of Gypsy and Traveller children. This consultation looked at: whether information on children’s Gypsy/Traveller status should be reported nationally on an individual basis to enable effective national Gypsy/Traveller monitoring or reported locally only; whether national reporting should be done from January 2002 or later once the new collection had bedded down; and whether it would be helpful for the Department for Education and Skills to issue guidance to schools and LEAs on procedures for the collection and recording of children’s Gypsy/Traveller status. The outcome of that consultation supported national collection and the categories ‘Traveller of Irish Heritage’ and ‘Gypsy/Roma’ were included in the ethnic categorisation for the 2003 Pupil Level Annual Schools’ Census.
Eng inside.indd 7 31/5/07 10:04:49

8
Table 1. Number of pupils aged 5 or over, by ethnic background, Wales, January 2006
Ethnic group Primary Secondary Special Total
White(a) White British Traveller of Irish Heritage Gypsy/Roma Any other White background
191,775 189,134
65 256
2,320
200,056 197,121
96 90
2,749
3,494 3,472
* *
16
395,324 389,727
161 346
5,085
Mixed White & Black Caribbean White & Black African White & Asian Any other mixed background
3,333 911 373 853
1,196
2,642 748 245 613
1,036
57 21 *
10 22
6,032 1,680
618 1,476 2,254
Asian Indian Pakistani Bangladeshi Any other Asian background
3,377 632
1,143 1,132
470
2,662 533 881 917 331
55 *
23 21 7
6,094 1,165 2,047 2,070
808
Black(a) Black Caribbean Black African Any other Black background
948 95
673 180
870 129 628 113
24 *
18 5
1,842 224
1,319 298
Chinese 419 450 7 876
Any other ethnic group 1,204 893 12 2,109
Total with valid category 201,056 207,573 3,649 412,278
Unknown or not stated 4,406 5,461 106 9,973
TOTAL 205,462 213,034 3,755 422,251
Source: National Statistics. Schools’ Census 2006: Provisional Results. Wales. SDR 100/2006.
a) Small numbers suppressed to protect confidentiality.
According to the results from the Wales January 2006 Pupil Level Annual School Census (for which ethnic data are available for 97.6 per cent of school pupils), there were 161 Travellers of Irish heritage and 346 Gypsy/Roma, a total of 507.
Pupil data tabulated by national identity show a predominance of ‘Welsh’ identity, but with significant numbers identifying as ‘British’ (Table 2). Also 551 pupils identified as ‘Irish’.
Eng inside.indd 8 31/5/07 10:04:50

9
Table 2. Number of pupils aged 5 or over, by national identity, January 2006(a)
National identity Primary Secondary Special Total
Welsh 117,979 121,602 1,716 241,297
English 11,897 13,122 272 25,291
Scottish 300 419 11 730
Irish 297 249 5 551
British 55,395 56,077 1,288 112,760
Other 4,229 3,277 36 7,542
Total with valid category 190,097 194,746 3,328 388,171
Unknown or not stated 15,365 18,288 427 34,080
TOTAL 205,462 213,034 3,618 422,251
Source:
National Statistics. Schools’ Census 2006: Provisional Results. Wales. SDR 100/2006.
a) Pupils in maintained primary, secondary and special schools
2. Other datasetsNo routine ethnic data collections relating to health and health care have been identified that include categories for Gypsy Travellers. Given the likely size of the community (using estimates based on the PLASC and other sources), consideration needs to be given to the adoption of ethnic classifications that include categories for Travellers of Irish Heritage and Gypsy/Roma.
Eng inside.indd 9 31/5/07 10:04:50

10
Eng inside.indd 10 31/5/07 10:04:50

11
II. Refugees and Asylum SeekersThere are very few statistical sources of information on refugees and asylum seekers. They are routinely excluded as a group from ethnicity data collections.
However the Longitudinal Survey of Refugees (LSR)1 is planned. It is a cross-departmental funded survey, led by the Home Office. It will be a census approach to all successful asylum applicants in a set period. It seeks to address some of the knowledge gaps about refugees in the UK. The principal aim of the survey is to establish a data set of longitudinal information about the integration of refugees who have been granted temporary or permanent leave to remain in the UK, and the process by which the integration is achieved. It is hoped that pilot fieldwork will commence in Spring 2007.
Also, in Wales, since 1 April 2006, unaccompanied asylum seeking children who are looked after by a local authority have been recorded on the individual child return collected by the Local Government Data Unit (the SSDA903 return). The SSDA903 is an annual return and the first returns with information on asylum seeking children are due on 31st May 2007.
Nationally, new developments provided for in the Nationality, Immigration and Asylum Act 2002 (November) included induction centres, health assessment, and proposed accommodation centres. The government was aiming for a UK network of induction centres, where asylum seekers would stay for a short period before being dispersed, the first of these being established at Dover. Initially, health assessments were only given to a selection of the residents at east Kent as a ‘pilot’ but this has now been extended to all residents. Health assessment for all asylum seekers in induction comprises a health needs assessment, records a basic health history, addresses public health concerns, and includes screening for tuberculosis (TB). More recently, the government announced that it would not be proceeding with the proposed accommodation centres, due to falling numbers of asylum seekers and new measures proposed in a five year strategy for asylum and immigration (HM Government, 2005).
There is a dearth of information relating to the health status, use of health services, and health-related behaviours of the diverse groups that comprise this population that, given its growing size, inhibits the effective planning of services.
1 http://www.homeoffice.gov.uk/rds/immigration_long_refugees.html
Eng inside.indd 11 31/5/07 10:04:50

12
Eng inside.indd 12 31/5/07 10:04:51
13
III. Black and Minority Ethnic Groups
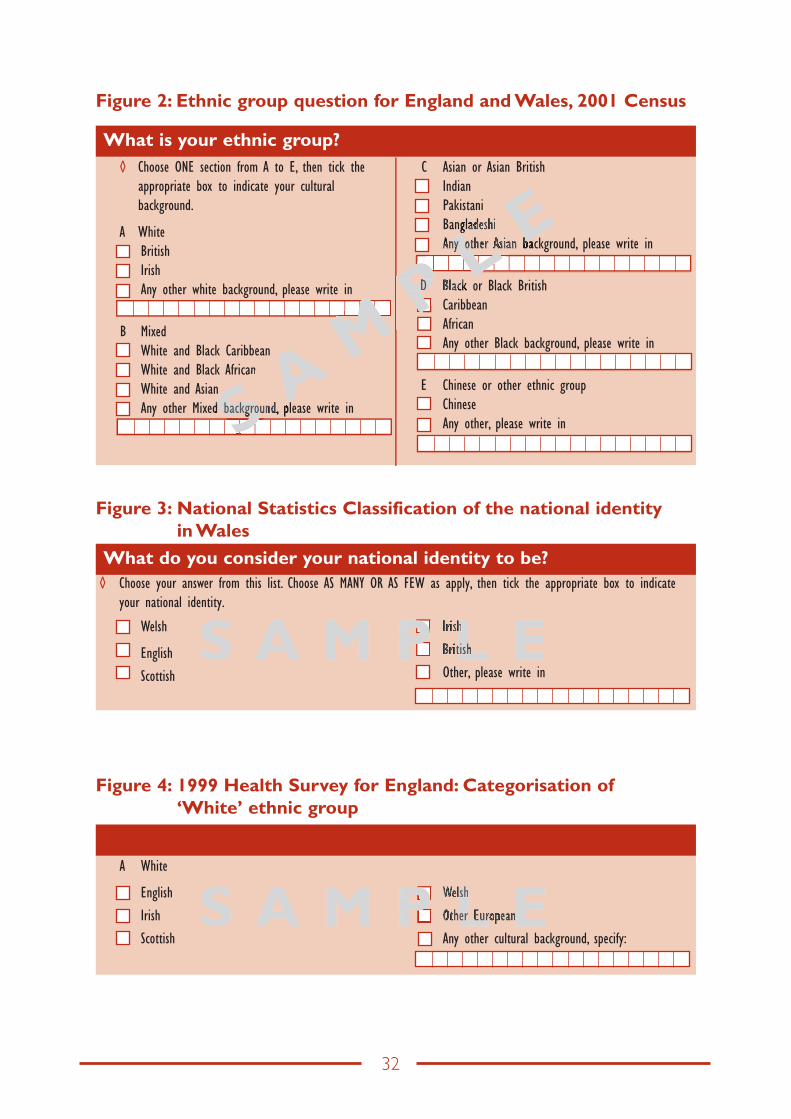
1. Issues of ethnic categorisation in WalesThe 2001 Census question for England and Wales (see Appendix, Figure 2) omitted a ‘Welsh category’ (unlike the Scottish Census that included a Scottish category and recognition of Scottish in the pan-ethnic subheadings). A campaign was mounted in Wales to get ‘Welsh’ added ahead of the 2001 Census enumeration but this was not possible, as the schedules had been printed. However, ONS advised form-fillers in Wales that they could utilise the ‘Any other White background, please write in’ category to indicate ‘Welsh’. Given that this guidance could not be printed on the forms, it is likely that the free text count of ‘Welsh’ significantly underestimates what the count would have been had there been a white ‘Welsh’ category to tick. The population size of Wales according to the 2001 Census is 2,903,085. Those so identifying as ‘Welsh’ comprised 14.39 per cent of the count in Wales, and varied from 3.96 per cent (Alyn and Deeside) to 30.41 per cent (Caernarfon).
A much higher proportion of the population of Wales identified as ‘Welsh’ when a national identity question introduced on the Labour Force Survey in 2001 explicitly offered ‘Welsh’ as one of the options (ONS, 2001/02). Respondents to the Labour Force Survey were asked if they considered their national identity to be Welsh, English, Scottish, Irish, British, or another national identity. They could choose as many or as few options as applied to them. Sixty per cent said that their national identity was Welsh only. A further 7 per cent described their identity as Welsh but included another national identity, most frequently British, in their answer. Thirty three per cent of the respondents chose non-Welsh options. Thus two-thirds of adults in Wales described their national identity as wholly or partly Welsh.
Following the difficulties of using the 2001 England and Wales Census ethnic group question in Wales, ONS introduced a ‘national identity’ classification to be used in combination with (but preceding) the ethnic group question. ONS recommend that users should ask about national identity as a separate question in addition to ethnicity (ONS, 2003). They report research that has led to the conclusion that classifying ethnic group is best achieved separately from national identity. Moreover, there is an order effect that is best addressed by asking national identity before ethnic group, allowing respondents to describe themselves as English, Welsh, Scottish, etc. ONS research also shows that people were happier when asked about their national identity first.
Examples of questions can be found in the Appendix, Figures 2 and 3.
An option to the two-tier classification of national identity and ethnic group is the use of the ethnic group/cultural background categories used in the 1999 Health Survey for England (Appendix, Figure 4).
However, in the Welsh context, that question lists ‘Welsh’ as the fourth option and may not capture the full size of the ‘Welsh’ group. Moreover, given the findings of ONS that classifying ethnic group is best achieved separately from national identity and the reported order effects, the two-tier question as recommended by ONS should be used where possible. Given the importance of national identity in Wales, it is clearly preferable to use the two-tier question rather than a single question on ethnic group in ethnic monitoring contexts. Further, although
Eng inside.indd 13 31/5/07 10:04:51

14
the minority ethnic group population in Wales is small (4.01 per cent including ‘Irish’ and ‘other white’, 2.12 per cent excluding these white minority groups), it is important to use the full 16-category classification to collect the data. This is likely to give better quality data at the point of capture (as Indians may more readily identify with an ‘Indian’ category than the pan-ethnic ‘Asian or Asian British’ label) and data that have greater validity (given the marked differences in health status and use of services across the South Asian cultural background groups). Again, detailed guidance on the circumstances in which cultural background groups can be combined is given by ONS (2003).
It is likely that the 2011 census will use a three-question package encompassing national identity, ethnicity and religion. This will include a Welsh tick-box for nationality as well as a White Welsh box for ethnicity. There have also been some other changes and additions. For example Chinese is now in the Asian or Asian British category and there are additions for other ethnic group to include Arab and Gyspy/Romany/Irish Traveller. These questions will be piloted in the 2007 census test. See Appendix, Figure 1, for examples of these proposed questions.
2. Ethnicity data collection in secondary care settings: Patient Episode Database for Wales (PEDW)
The mandatory collection of ethnic group on all NHS hospital inpatient episodes was introduced in April 1995 in England and Wales. However, the completeness of the data has been very poor with around 40 per cent of finished consultant episodes in England lacking a valid code (Aspinall, 2000), now down to 23.5 per cent (2004-05). An investigation of the Patient Episode Database Wales (PEDW) database confirms that although ethnic group is a field the level of ethnic coding on the Wales database is too poor to merit analysis. A recent review of ethnically coded statistical data (National Statistics and National Assembly for Wales, 2004) records for the PEDW: ‘At the moment no data is available as there are presently training issues regarding the collection of the information by trust staff …it is not known when data will become available’.
In England, incompleteness of ethnicity recording on the Hospital Episode Statistics database has proved an intractable problem. Routine measures to increase completeness of recording have not proved effective.
However, some local initiatives (such as target-setting in London) and the stimulus provided by the Race Relations (Amendment) Act 2000 and the use of Commission for Health Improvement (CHI) indicators based on completeness of ethnicity coding may result in some improvements in quality. Additionally, the priority accorded to ethnic group data collection of inpatients by the key decision-makers in NHS trusts, including the executive, appears to be a key determinant of quality. For example, in one London trust (SW London and St George’s Mental Health Trust) now regarded by the Department of Health as a ‘notable development site’ for ethnic monitoring, a sustained programme of improvement over 18 months saw an increase from approximately 37 per cent to 92 per cent of hospital inpatient records having a valid ‘ethnos’ code. This improvement appears to have come about through a commitment to use the data collected. The trust makes ethnic group data collection on its inpatient records a regular part of its clinical governance report, a key priority including the improvement of data
Eng inside.indd 14 31/5/07 10:04:51
15
quality to permit the development of a clear set of performance indicators for monitoring the impact of services on different groups.
The following recommendations are made:
1. The Race Relations (Amendment) Act 2000 requires statutory health care organisations to monitor the impact of services on different racial groups. NHS Trusts in Wales, therefore, need to accord priority to the collection of ‘ethnos’ data on the PEDW database that is substantially complete and of quality.
2. At a national and regional level in England, the most effective strategies have proved to be specific target setting for completeness (as opposed to general data quality improvement measures required by national data co-ordinators). Several years ago the London Office set a regional target of no more than 20 per cent of records uncoded.
3. The collection of ethnic group data for hospital inpatients that is of quality is a responsibility of NHS Trust Boards who should monitor and review collection and use of this information as part of the clinical governance process. This should be regularly reported on by Trust Boards in clinical governance reports.
4. The evidence from England shows that use of the ‘ethnos’ data is necessary to sustain improvements in its quality. Even if data are incomplete, use can be made of statistical methods to estimate how such incompleteness might impact on patterns of usage by the different ethnic groups (Bardsley et al., 2000). It is important, therefore, that trusts develop performance indicators to monitor the impact of services on different ethnic groups, a process that in itself will be a key driver of data quality.
5. Finally, NHS Trusts are required to report these data for the 2001 Census categories. However, data collection in England gives NHS Trusts some flexibility as to what additional codes are used in their patient administration systems. Where there are large communities locally that are not included in the 2001 Census classification (e.g. Somalis in Cardiff), Trusts may wish to consider using the Department of Health’s local codes (that map back to the 2001 Census Classification) (NHS Information Authority, 2001) or additional categories of their own choosing. This detailed framework of ethnic coding includes specific codes for some of the main refugee groups (‘Kosovan’, ‘Albanian’, ‘Bosnian’, ‘Croatian’, ‘Serbian’), for Gypsy Travellers (‘Irish Traveller’, ‘Traveller’, and ‘Gypsy/Romany’), and for other specific groups (for example, ‘Somali’ and ‘Kashmiri’).
3. Population profiling in primary careThere is currently no mandatory requirement to collect the ethnic group of patients in primary care settings. However, there have been a number of initiatives that have promoted such collection as well as a wider set of items. For example, in England, the Ethnic Health Unit supported a number of pilots for the introduction of ethnic monitoring, followed in early 1997 by the ‘Improving Health Among Ethnic Minority Populations’ initiative which built on this earlier work and was designed to assist the NHS in establishing ways of meeting ethnic health needs within the mainstream health inequalities agenda. Four of the latter projects were located in primary care settings. A few PCTs have specified the introduction of ethnic monitoring in their local implementation strategies for ‘Information for Health’.
Eng inside.indd 15 31/5/07 10:04:51

16
One of the most notable national development sites for patient profiling and one of the 1997 projects (Department of Health, 2003) is Princes Park Health Centre, Liverpool, serving around 8,000 patients. A form was designed to collect information on self-ascribed ethnicity and patients’ family origins and other supplementary information such as access to a car and telephone, language spoken and written, requirements for interpreting, specific illnesses, and patient satisfaction. Differences in morbidity profiles and satisfaction for patient groups defined by ethnicity and socio-economic status have been reported and ethnicity profiling has become mainstream at the practice, bringing about changes in service delivery. Patient profiling has now been extended to other local practices by Central Liverpool PCT, enabling around 25,000 patients to be profiled (Department of Health, 2003).
In Wales, personal communications (with staff in Health Statistics and Analysis Unit, Welsh Assembly Government, and National Public Health Service) report no routine collection of ethnic data by GPs although many GP systems allow these data to be recorded. A pilot GP Morbidity Database service has been established to collect and analyse routine information from over 30 general practices across Wales, providing a 10 per cent population sample. However, discussions with Health Solutions Wales (HSW) suggest that although the database software may contain a field for ethnicity, the database has not been populated with patient ethnicity. Problems in accessing and interrogating the database through the MIQUEST programme were also reported.
Since the completion of this review, the Patient Equality Monitoring Project has been set up by the NHS Centre for Equality and Human Rights. The aim of the project is to deliver a programme of change that improves the collection of equalities data within NHS Trusts across Wales. The aim is to distinguish the impact of health service policies and practices upon different groups of patients, according to their racial group, gender, age, disability, sexual orientation, religion or belief. There are three main areas of focus for the project. The first is training NHS Wales Secondary Care Trusts with the capacity and competency to collect patient equality information. The second is working with NHS Wales information technology stakeholders to standardise arrangements for the collection and use of patient equalities data so that the information can inform service planning and improvement. The third is exploring the opportunities for the future collection of this information in a Primary Care setting.
Furthermore as part of this project training is being created to prepare front line staff for the collection of equality information from patients. This will be done on a broader scale in future to encompass disability, sexual orientation, gender, age and religion/belief in addition to ethnicity. A comprehensive dataset is being developed with the help of the commissions and the service with a view to establishing commonality of approach across NHS Wales. Conwy and Denbighshire NHS Trust have undertaken a pilot exercise to monitor ethnicity which has successfully recorded over 50,000 unique pieces of patient information across outpatient and midwifery and are looking to expand to A&E in the immediate future.
4. Mortality dataCurrently, there is no collection of ethnic group data at birth and death registration in Britain. Many in the public health community have called for its introduction (e.g. Bhopal, 2000) and a case for recording ethnicity at birth and death registration has been made by the London
Eng inside.indd 16 31/5/07 10:04:52

17
Health Observatory (Aspinall et al., 2003) as part of the Government’s new consultation on what information should be recorded in civil registration procedures.
With respect to mortality statistics, country of birth is now a poor proxy of ethnic group. In addition to this drawback (the availability of data on migrant mortality only) the small absolute number of deaths amongst such groups in Wales (reflecting the much smaller proportions of minority ethnic groups in the total population compared with England) makes the analysis of mortality by specific country of birth groups an exercise of limited statistical value. Clearly, if such data were available for all ethnic groups (and not just migrants) the numbers would be larger.
Mortality statistics for country of birth groups could be analysed using proportional mortality ratios (PMRs), although the value added to what is already known from the analysis of migrant mortality in England and Wales is likely to be small. PMRs compare the number of deaths from individual causes as a proportion of all deaths within a given country of birth group. This approach overcomes the problem of having to identify population denominators (Breslow and Day, 1987) which (for country of birth) are only available around the time of the decennial census. This would provide a proxy measure of ethnic differences in mortality and would be straightforward and quick to calculate, although such differences are unlikely to achieve statistical significance and confidence intervals around the estimates are likely to be wide. In an analysis undertaken in London (Bardsley et al., 2000), the standardised mortality ratio (SMR) and PMR approaches produced very similar results.
5. The Welsh Health SurveyThis survey is a source of information about the health of people living in Wales, the way they use health services and the things that can affect their health (National Assembly for Wales, 2005a; National Assembly for Wales, 2006). The survey commenced in 2003 and will continue until at least 2008. It replaced two previous surveys: the former Welsh Health Survey (undertaken in 1995 and 1998) and the Health in Wales Survey (undertaken every two to three years between 1985 and 1996). A feasibility study was undertaken to look at merging these two studies (Nicholaas et al., 2003). The ethnicity question is the same as that used in the Census 2001 (see Appendix, Figure 2). Results for the first two years of the survey combined are 97.4 per cent White and 2.6 per cent from minority ethnic groups. Minority ethnic groups are comprise: Mixed White and Black Caribbean 0.2 per cent; mixed White and Black African 0.1 per cent; mixed white and Asian 0.1 per cent; any other mixed background 0.2 per cent; Indian 0.3 per cent; Pakistani 0.3 per cent; Bangladeshi 0.2 per cent; any other Asian background 0.2 per cent; Black Caribbean 0.1 per cent; Black African 0.2 per cent; any other Black background 0.1 per cent; Chinese 0.3 per cent; any other ethnic group 0.3 per cent; more than one ethnic group 0.1 per cent.
It will take several years to produce an aggregate sample size sufficiently large to capture an analytically usable sample of minority ethnic groups. To do this most effectively would require a specific ethnic boost of the kind that has been undertaken by the Health Survey for England. Techniques for boosting such as over-sampling and focussed enumeration as well as their
Eng inside.indd 17 31/5/07 10:04:52

18
implications for a Welsh ethnic minority boost are discussed in the Welsh Health Survey feasibility report (Nicholaas et al., 2003). The report also notes that a general ethnic minority boost would not prove useful, as the ethnic minority population is not homogenous.
6. Some specific collectionsAs in England, there are in Wales a number of statistical collections on different disease areas such as diabetes, where some ethnically coded data is available. Some of these are small-scale (reflecting the size of the minority ethnic group populations across the home countries) but, nevertheless, provide specifically Welsh data.
6.1 Sexually Transmitted Infections (STI)*
STI data in the UK are collected on the statistical returns KC60 (England, Wales, and Northern Ireland) and the ISD(D)5 in Scotland. In addition, there are various enhanced surveillance systems. The weakness of the KC60 (but not the ISD(D)5 return in Scotland) is the lack of demographic, socio-economic and sexual behaviour data. This is being addressed in England by the Common Data Set for Sexual Health (CDSSH) development project. The aim of this project is to provide a single standard structure for collecting data on sexual health within the National Health Service. The items collected include ethnicity and country of birth2.
Other STI datasets do include Wales. Amongst the various enhanced systems, the Gonococcal Resistance to Antimicrobials Surveillance Programme (GRASP) is a sentinel surveillance system for monitoring gonococcal antimicrobial resistance in England and Wales that has reported annually since 2000. Gonorrhoea (the second most common bacterial STI) is highly concentrated within demographic subgroups, black groups being disproportionately affected. GUM clinics in Wales as well as England report to the GRASP data collection that includes ethnic background (GRASP Steering Group, 2002). The Enhanced Laboratory Surveillance for Infectious Syphilis, established in August 2001 in GUM clinics in the London region, was extended to the rest of England and Wales in 2002. Demographic, behavioural and clinical data are collected, including gender, age, and ethnic background.
Ethnic data are also available for HIV-infected and AIDS patients. The HIV and AIDS patient reporting system (HAP) collects information on individuals with newly diagnosed HIV and AIDS. The SOPHID system (Survey of Prevalent HIV Infections Diagnosed) provides an epidemiological profile of, and determines the prevalence of, individuals living with diagnosed HIV in England, Wales and Northern Ireland. Further information is available on the Health Protection Agency website3,4.
* This section was kindly reviewed by Gemma Northey, epidemiologist for sexual health surveillance, NPHS CDSC Wales.2 http://www.cdssexualhealth.org.uk/3 http://www.hpa.org.uk/infections/topics_az/hiv_and_sti/hiv/epidemiology/hars_tables.htm4 http://www.hpa.org.uk/infections/topics_az/hiv_and_sti/hiv/sophid/sophid_main.htm
Eng inside.indd 18 31/5/07 10:04:52
19
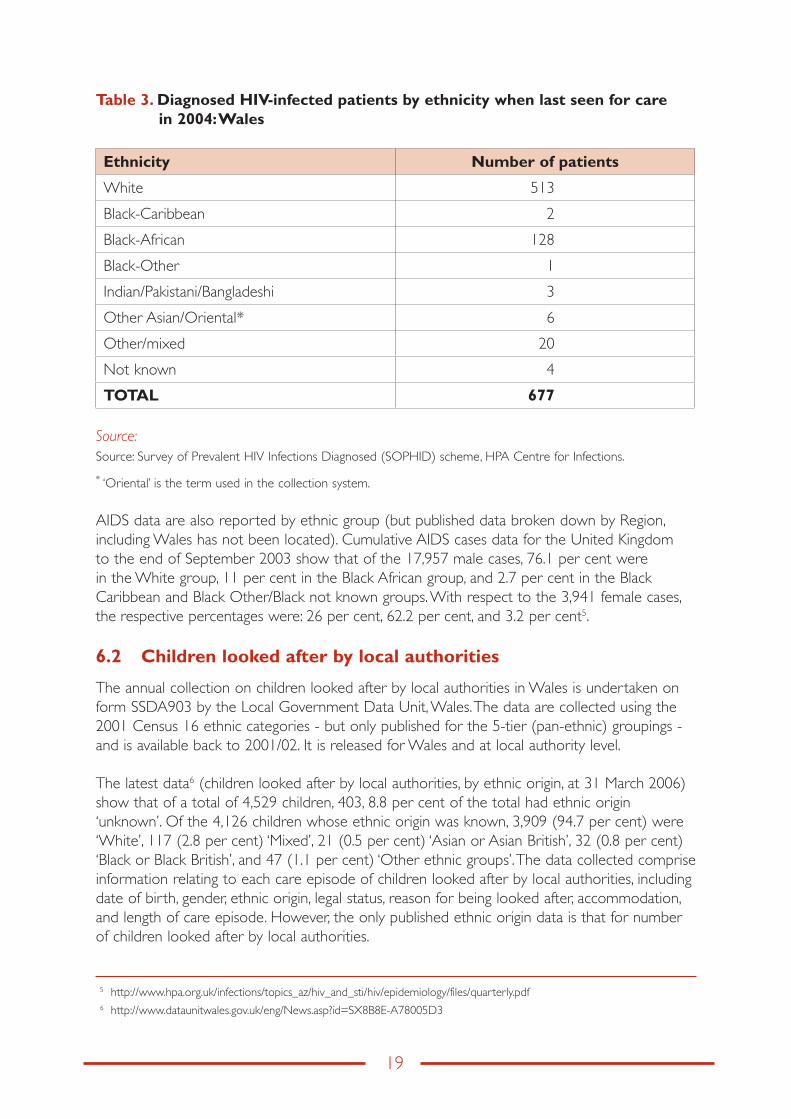
Table 3. Diagnosed HIV-infected patients by ethnicity when last seen for care in 2004: Wales
Ethnicity Number of patients
White 513
Black-Caribbean 2
Black-African 128
Black-Other 1
Indian/Pakistani/Bangladeshi 3
Other Asian/Oriental* 6
Other/mixed 20
Not known 4
TOTAL 677
Source: Source: Survey of Prevalent HIV Infections Diagnosed (SOPHID) scheme, HPA Centre for Infections.
* ‘Oriental’ is the term used in the collection system.
AIDS data are also reported by ethnic group (but published data broken down by Region, including Wales has not been located). Cumulative AIDS cases data for the United Kingdom to the end of September 2003 show that of the 17,957 male cases, 76.1 per cent were in the White group, 11 per cent in the Black African group, and 2.7 per cent in the Black Caribbean and Black Other/Black not known groups. With respect to the 3,941 female cases, the respective percentages were: 26 per cent, 62.2 per cent, and 3.2 per cent5.
6.2 Children looked after by local authorities
The annual collection on children looked after by local authorities in Wales is undertaken on form SSDA903 by the Local Government Data Unit, Wales. The data are collected using the 2001 Census 16 ethnic categories - but only published for the 5-tier (pan-ethnic) groupings - and is available back to 2001/02. It is released for Wales and at local authority level.
The latest data6 (children looked after by local authorities, by ethnic origin, at 31 March 2006) show that of a total of 4,529 children, 403, 8.8 per cent of the total had ethnic origin ‘unknown’. Of the 4,126 children whose ethnic origin was known, 3,909 (94.7 per cent) were ‘White’, 117 (2.8 per cent) ‘Mixed’, 21 (0.5 per cent) ‘Asian or Asian British’, 32 (0.8 per cent) ‘Black or Black British’, and 47 (1.1 per cent) ‘Other ethnic groups’. The data collected comprise information relating to each care episode of children looked after by local authorities, including date of birth, gender, ethnic origin, legal status, reason for being looked after, accommodation, and length of care episode. However, the only published ethnic origin data is that for number of children looked after by local authorities.
5 http://www.hpa.org.uk/infections/topics_az/hiv_and_sti/hiv/epidemiology/files/quarterly.pdf6 http://www.dataunitwales.gov.uk/eng/News.asp?id=SX8B8E-A78005D3
Eng inside.indd 19 31/5/07 10:04:52

20
6.3 National Community Child Health Database (NCCHD)
The National Community Child Health Database (NCCHD) is the first national community child health database in Wales and consists of anonymised records for all children born, resident or treated in Wales and born after 1987. The aim of the database has been to access the all Wales potential of local operational Child Health System (CCH2000) databases held by NHS Trusts and used by them to administer child immunisation and health surveillance programmes.
Although the database is still in development, data became available from the dataset in July 2005 (National Assembly for Wales, 2005). This report gives an indication of the kind of data that can be derived from the NCCHD. The overall data quality appears good: the NCCHD recorded 32,274 live births in 2004 to Welsh residents and this compares well with the 32,325 recorded by ONS.
The dataset records the ethnicity of the child as defined by the mother. The item was 98 per cent complete for the year 2004.
6.4 All Wales Perinatal Survey
The All Wales Perinatal Survey (AWPS) commenced in 1993 and aims to improve understanding of the ways in which the risk of death in late foetal life and infancy may be reduced. It collects accurate, complete and timely data on perinatal and infant mortality. Data analysis is based primarily on geographically defined populations. The ethnic data in the survey are limited to mother’s ethnic group (‘the mother’s ethnic group is that to which the mother considers she belongs’: the categories used are those for the 1991 Census plus ‘not known’). The most recent annual report identified is Cartlidge et al., 2003. This does not contain any ethnically stratified tables.
6.5 “Count Me In” census
The “Count Me In” census was carried out by the Healthcare Commission, the Mental Health Act Commission, and the National Institute for Mental Health in England for the first time in 2005 and involved an enumeration of inpatients in mental health hospitals and facilities across England and Wales. It collected details of ethnicity (using the 16 Census ethnic categories plus ‘not stated’ and ‘invalid’), language and religion as well as information about how inpatients came to be in hospital and details about their care. The census was repeated in 2006 and included people in learning disability units as well as patients in mental health hospitals and facilities. The purpose of the census is to help those who provide mental health and learning disability services to ensure that they are culturally relevant and appropriate and to provide improved information on service delivery.
To date, findings for Wales have only been published for the 2005 Census7. Of 2,117 patients, all but 12 (0.6 per cent) had ethnicity coded and there were no cases of blank/invalid ethnic coding. Of the 2,117 patients 92.7 per cent were coded ‘White British’, 2.1 per cent
7 http://www.healthcarecommission.org.uk/_db/_downloads/Wales_results.xls
Eng inside.indd 20 31/5/07 10:04:53
21
‘Irish’, and 1.9 per cent ‘Other White’. All other groups each comprised 0.5 per cent or less. Ethnicity data is available for various categories, including gender, age group and legal status on admission.
6.6 Teenage pregnancy
There are only limited data on teenage pregnancy across England and Wales. National statistical systems define pregnancy in a number of ways. The most comprehensive collections encompass live births, induced abortions, and foetal loss (miscarriages, ectopic pregnancies, and stillbirths). There is routine ethnically coded data on only one of these components. The statistical bulletins published by National Statistics and the Department of Health provide ethnically coded data on legal abortions for ‘England and Wales’, including for the under 20 age group. One drawback is that records with ‘not known/not stated’ ethnic group comprises 17.5 per cent of the total. Birth registration data only records the country of birth of mother (and not ethnic group). Many miscarriages take place outside hospital inpatient settings and do not get recorded on information systems. Finally, data on stillbirths are only available for the country of birth of the mother.
One potential source on the number of teenage mothers by ethnic group is the 2001 Census. The Teenage Pregnancy Unit (a cross-Government Unit located within the Department for Education and Skills) commissioned a special table from the Office for National Statistics but for England only (Department for Education and Skills, 2006). There is potential to do something similar for Wales. Unfortunately, the National Community Child Health Database (NCCHD) is not able to yield ethnically stratified data on teenage pregnancies and motherhood. Although ethnic group is recorded for the baby, it is not recorded for the mother. However, it is noteworthy that the NCCHD records that 10 per cent of all live births in 2004 are recorded as being born to mothers aged under 20.
6.7 National Diabetes Audits
The National Diabetes Audit (NDA) provides a way to collate, analyse, benchmark and feedback about the effectiveness of diabetic services and their impact on children and adults with diabetes. In the second paediatric report for the National Diabetes Audit, for the 15 month period January 2004 to March 2005, paediatric units in Wales submitted data (NHS Information Centre for Health and Social Care, 2006). In total 7 paediatric units in Wales successfully submitted data to the audit (there are a total of 17 paediatric units in Wales, so the information submitted to the audit represented 41 per cent of those in Wales). This is the first time that the NDA has included registration details for children and young people cared for by specialist paediatric diabetes units in Wales. In total information was submitted directly from paediatric units for 768 children and young people (0-24 years old) in Wales.
The dataset contains an ethnic category field that uses the national 2001 Census codes for ethnic group (16 categories plus ‘not stated’). There is an additional instruction to leave the ethnic category field blank if it is not known. Other data items on the dataset include NHS number, year of birth, postcode of usual address, gender, information on diabetic related reviews and examinations etc.
Eng inside.indd 21 31/5/07 10:04:53

22
The recording of ethnicity in paediatric units is much better than in primary care. In Wales ethnic group for children aged 16 years and younger was recorded in all registrations (compared with 68 per cent in England). While data were collected using the full 16 ethnic categories, they were aggregated into 5 groups for ease of reporting. In the 2004/5 Welsh registrations, 96 per cent identified as White, less than 1 per cent as Asian, 1 per cent as Black, and 3 per cent as Other. There were proportionately more children with type 2 diabetes in the ethnic minority groups than White children, 9 per cent of the Asian population and 5 per cent Black, compared to less than1 per cent of the White children in the audit.
6.8 All Wales Injury Surveillance System - Emergency Care Dataset
The All Wales Injury Surveillance System (AWISS) is a computerised injury surveillance system designed to collect and collate information on injuries treated in Accident and Emergency departments in Wales (Lyons et al., 2002). Initially the system collected data on fractures, burns, head injuries involving loss of consciousness, poisonings to under 4’s, and sports injuries. In January 1999 the system was expanded to include all injuries. There are currently two pilot sites. Gwent has submitted data from April 2000 (amounting to 450,000 records by February 2005) and Conwy and Denbighshire have submitted one test file. The data fields include age, sex, date of birth, and ethnic group (Welsh Assembly Government, 2005b).
7. Wider determinants of healthThe most comprehensive and reliable data on the ethnicity dimensions of the wider determinants of health in Wales is likely to be the 2001 Census. Census output data includes economic activity, industry of employment, occupation groups, qualifications, living arrangements, household spaces and accommodation type, housing tenure, rooms, amenities, central heating, and lowest floor level.
However, there are also some relevant government social surveys and administrative data collections that are documented in A Statistical Focus on Ethnicity in Wales (National Statistics and National Assembly for Wales, 2004). These surveys are listed below.
7.1 Welsh Labour Force Survey
The key variables in this survey are age, country of birth, religion, gender, Welsh language, Welsh identity, and married/cohabiting. Ethnic breakdown is by 6 standard groupings (although restricted by sample size). The survey is carried out at both the household and the individual level annually. Publication of ethnic groups is only available at Wales level, however local authority information can be published for “White” and “Non-White” for some local authorities.
7.2 General Household Survey
The key variables in this survey are national identity, age, gender, marital status, household/family size, type of household and family type. Ethnic breakdown is by 10 groupings. Respondents are adults (16 and over) in private households. The survey is carried out annually. The survey is carried out across Wales but ethnicity data cannot presently be published, even at the Wales level, because of small sample size.
Eng inside.indd 22 31/5/07 10:04:53

23
7.3 British Household Panel Survey
The key variables are household/family size, country of birth, age and gender and marital status. Ethnic breakdown is by 9 ethnic groupings. Adults (16 years and older) in private households are surveyed. The survey is carried out across Wales on an annual basis. Publication of ethnicity data are only possible at the all Wales level and cannot be broken down by other variables.
7.4 ONS Longitudinal Study
This contains linked Census and vital event data for one per cent of the population of England and Wales. Information from the 1971, 1981, 1991 and 2001 Censuses has been linked together, along with information on events such as births, deaths and cancer registrations. Key variables are religion, country of birth, country of parents’ birth, age, gender, marital status, type of household and family type. The ethnic breakdown is by 16 standard ethnic groupings with 5 broader groupings and is based on the Census question. Publication is restricted to the Wales level for ethnicity data.
7.5 Millennium Cohort Study
Key variables are language, religion, age, gender and marital status. Ethnic breakdown is available by 16 ethnic groupings. It follows the lives of a sample of nearly 19,000 babies born between 1 September 2000 and 31 August 2001 in England and Wales. Further surveys are to be carried out at key points of childhood and adulthood. The survey is conducted across Wales. In some cases ethnicity data may be available at ward level subject to preserving anonymity.
7.6 National Survey of Sexual Attitudes and Lifestyles
Key variables are age, gender, marital status and sexual orientation. Ethnic breakdown is by 18 standard ethnic groupings with 5 broader groupings. This survey was carried out in 1990 and 2000 with adults aged between 16 and 44 years of age across Wales. Ethnicity data are not yet publicly available but there are plans to publish in the future.
7.7 Pupil Level Annual School Census (PLASC)
Key variables are age, gender, postcode, national identity, Special Educational Needs status, free school meal entitlement, whether in local authority care, part time or full time and courses of study for those aged 16 and over. Ethnic breakdown is available by 79 different categories. It is a mandatory requirement for all Welsh pupils aged 5 and over and optional for those under 5. Ethnicity data are currently published at the local education authority level.
7.8 National Assembly for Wales (Homelessness)
Key variables here are decisions taken, households eligible for assistance, temporary accommodation and unintentionally homeless. Ethnic breakdown is available by 5 broad groups. All local authorities across Wales respond on a quarterly basis. Ethnicity data are available on a quarterly basis.
Eng inside.indd 23 31/5/07 10:04:53

24
7.9 HESA Student Record
Key variables collected are age, gender, postcode, degree type and mode, institution attended, qualifications obtained, qualifications on entry, first destination following graduation etc. Ethnic breakdown is by 16 standard ethnic groupings with 5 broader groupings. Higher education institutions in Wales report these data annually. Home postcodes of students are collected so data on different geographies could be published but level of publication would be dependent on confidentiality and disclosure rules.
7.10 Department for Work and Pensions
Types of data collected are bereavement benefit, incapacity benefit, invalidity carers allowance, income support, job seekers allowance, severe disability allowance and widows benefit. Ethnic breakdown is into 38 categories. Data are collected on a monthly basis and ethnicity data are available on a Wales level.
7.11 Home Office Citizenship Survey
Key variables are civic/social participation, trust and shared values, religion, family type, workplace discrimination, attitudes to race and fear of crime. Ethnic breakdown is into 16 groups. Adults (aged 16 and over) are surveyed from private households in Wales on a biennial basis. Ethnic data are available at the Wales level only but case studies have been produced with boosted sample data for two wards within Swansea.
Eng inside.indd 24 31/5/07 10:04:53
25
IV. The Potential of Synthetic Estimation Techniques
There are several datasets - including the Census Samples of Anonymised Records (SARs), health survey data such as the Health Survey for England or the Welsh Health Survey, and other nationally reported data - that can be used with Census data in the synthetic estimation process. This method does not depend on the availability of aggregate counts at the local level that are needed to provide the ‘observed count’ in the indirect age-standardisation calculation.
Some national survey datasets can be used to estimate the prevalence of risks in local areas (local authorities for example) when several years of data are combined. However, sample sizes for the different ethnic groups are usually too small to produce reliable estimates. In cases where local data on behavioural or other risks are not available or cannot be estimated, synthetic estimates can be computed based on either national data or data that are available at sub-national level (such as standard regions). Synthetic estimates are calculated using local population Census counts or estimates for the geographic area and subgroups of interest (e.g. age-, gender- and ethnicity-tabulated groups) and national risk factor prevalence rates for those groups. The national subgroup-specific rates are applied to the local population estimates for each group to obtain counts.
Synthetic estimation techniques have been used to obtain local estimates of disease frequency and of the prevalence of different risk behaviours. For an example on smoking please refer to ‘The Smoking Epidemic in England’ (Twigg et al., 2004). In the context of ethnicity and health, datasets such as the Policy Studies Institute Fourth National Survey of Ethnic Minorities (1993-1994) (Nazroo, 1997) and the 1999 Health Survey for England are key sources of risk factor prevalence rates for particular subgroups. Although synthetic estimates can be useful for planning the provision of health services, their value may be diminished if there is evidence or reason to believe that local rates for subgroups of interest would diverge significantly from national or regional rates. There may, for example, be ‘special cause’ factors at the local level that would undermine the validity of the synthetic estimates. Regional survey samples based primarily on minority ethnic group populations resident in inner-city areas may not provide useful population prevalence rates to apply to non-metropolitan local populations. More precise estimates can sometimes be obtained by factoring in other relevant factors to the calculation of the age-, sex- and ethnic-specific prevalence rates.
Most studies based on the synthetic estimation process emphasise the importance of qualifying the synthetic estimates when they are used, including a clear reference to the sources of the data used to compute the local area synthetic estimates.
Eng inside.indd 25 31/5/07 10:04:54

26
Eng inside.indd 26 31/5/07 10:04:54

27
V. Census Measures of MorbidityThe 2001 Census provides a number of potential measures of morbidity across different ethnic groups and at different area levels.
1. Limiting long-term illnessThe attraction of this measure is that it was available for the 1991 Census and therefore offers a measure of intercensal change. There is also an existing knowledge base concerning the interpretation of the measure and factors associated with differences in prevalence. See Appendix, Figure 5.
2. General healthFor the first time the 2001 Census asked a question on general health, Appendix, Figure 6.
Analyses of this question to date have used ‘percentage not good health’ (age standardised) as a health indicator. In research studies responses to the ‘general health’ question have been shown to be a better predictor of the use of health services than limiting long-term illness.
3. Permanently sick/disabledThe 2001 Census asked respondents not working ‘last week’ and those aged 16 to 74 only, Appendix, Figure 7.
This indicator (percentage permanently sick/disabled) probably provides a more severe measure of morbidity than limiting long-term illness or ‘not good’ health but is limited to the population of working age (16-74) and, by definition, excludes those who were working in the week prior to census day. However, given that the instruction asks respondents to tick all boxes that apply, it can be used as a population-based measure of morbidity, within these constraints.
4. CarersFor the first time the 2001 Census asked a question on ‘carers’, Appendix, Figure 8.
It is difficult to interpret this question as a measure of morbidity as the number of hours dedicated to unpaid caring for problems associated with ill-health, disability, or old age may be associated with the structure of the labour market, the availability of statutory/voluntary services, and other supply factors as well as the demand for such caring.
5. Persons in hospital and communal establishments on census day
In past censuses analysis of those resident in communal establishments (such as hospitals and care homes) on census day has proved to be of limited value as an indicator of morbidity. There are also definitional issues related to such indicators. An analysis of these data is now available (National Statistics and National Assembly for Wales, 2004).
Eng inside.indd 27 31/5/07 10:04:54

28
It is recommended that the Welsh Assembly Government undertake the derivation of age-standardised limiting long-term illness, ‘not good’ health, and ‘permanently sick/disabled’ prevalence ratios for the 16-group ethnic classification in Welsh unitary authorities (UAs). It may be feasible to undertake similar analyses at electoral ward level in selected UAs, possibly using the 5 group classification (White, Mixed, Asian or Asian British, Black or Black British, and Chinese or other ethnic group) if numbers are too small at the 16-category (cultural background) level. Decisions about the practicality of deriving such data broken down by gender is similarly likely to depend on numbers, although this should be feasible at UA level. The most robust method (given the counts) would be indirect age-standardisation.
Funnel plots could be used to identify statistical outliers at different area levels of output, for example, unitary authorities compared with Wales as a reference or electoral wards compared with their unitary authority as a reference. Analyses could also be undertaken using area-based socio-economic measures.
Eng inside.indd 28 31/5/07 10:04:54

29
VI. Conclusions and RecommendationsAn ethnic health intelligence strategy is needed to decide the scope of ethnicity data collection and population profiling.
Given the findings of the 2001 Census, Labour Force Survey in Wales and the Pupil Level Annual School Census, it is recommended that a ‘national identity’ question (as recommended by ONS) is also used in ethnic monitoring.
Given the substantial incompleteness of ethnic coding on the PEDW database (of hospital episode statistics), targets should be set for completeness and NHS trust boards should be required to report such completeness in clinical governance reports.
As the Pilot GP Morbidity database in Wales is not populated by ethnic group and ethnic group is seldom collected in primary care settings, it is recommended that ethnic group be added to this database.
As the Welsh Health Survey does not capture a sufficiently large minority ethnic population (around 2-3 per cent), it is recommended that this survey contains a minority ethnic boost sample or appraisal of a customised survey option.
It is recommended that the potential of synthetic estimation techniques be investigated in the short term with respect to both disease frequency and the prevalence of different behavioural risks.
It is recommended that the findings of the 2001 Census on limiting long-term illness, general health and permanently sick/disabled should be exploited to develop ethnic-specific standardised prevalence ratios and the use of specialised techniques (such as funnel plots) to identify statistical outliers.
•
•
•
•
•
•
•
Eng inside.indd 29 31/5/07 10:04:54

30
Eng inside.indd 30 31/5/07 10:04:54

31
AppendixFigure 1: Census 2007 test for Census 2011
What do you consider your national identity to be?◊ Tick all boxes that apply.
Welsh English Scottish Northern Irish British Irish Other, write in
What is your ethnic group?◊ Choose one section from A to E, then tick the box
to show your ethnic group. A White Welsh Other British Irish Any other white background, write in
B Mixed White and Black Caribbean White and Black African White and Asian Any other Mixed background, write in
C Asian or Asian British Indian Pakistani Bangladeshi Chinese Any other Asian background, write in
D Black or Black British Caribbean African Any other Black background, write in
E Other ethnic group Arab Gypsy/Romany/Irish Traveller Any other, write in
What is your religion?◊ The question is voluntary.
◊ Tick one box only.
None Christian (including Church in Wales, Catholic, Protestant and all other Christian denominations) Buddhist Hindu Jewish Muslim Sikh Any other religion, write in
What languages can you understand, speak, read or write?
◊ Tick all boxes that apply.
No Understand Speak Read Write ability spoken Welsh English Other language, write in
No Understand Sign ability sign British Sign Language,
Other sign language, write in
How often do you speak Welsh?◊ Tick one box only.
Daily
Weekly
Less often
Never
Individual Questions - Person 1
12
13
14
15
16
S AM
P L E
S AM
P L E Any other Mixed background, write in
S AM
P L E Any other Mixed background, write in Any other Mixed background, write in
C Asian or Asian British
S AM
P L E
C Asian or Asian British C Asian or Asian British Indian
S AM
P L E
Indian Indian Pakistani
S AM
P L E
Pakistani Pakistani BangladeshiS A
MP L E
Bangladeshi Bangladeshi ChineseS A
MP L E
Chinese Chinese Any other Asian background, write inS A
MP L E
Any other Asian background, write in Any other Asian background, write in
What languages can you understand, speak,
S AM
P L EWhat languages can you understand, speak, What languages can you understand, speak,
Tick all boxes that apply.
S AM
P L ETick all boxes that apply.Tick all boxes that apply.
No Understand Speak Read Write
S AM
P L E No Understand Speak Read Write No Understand Speak Read Write ability spoken
S AM
P L E ability spoken ability spoken Welsh
S AM
P L E Welsh Welsh English
S AM
P L E English English Other
S AM
P L E Other Other language,
S AM
P L E language, language,
S AM
P L E
S AM
P L E
S AM
P L E
S AM
P L E
S AM
P L E
S AM
P L E
S AM
P L E
S AM
P L E
S AM
P L E
S AM
P L E
S AM
P L E
S AM
P L E
S AM
P L E
S AM
P L E
S AM
P L E
S AM
P L E
S AM
P L E
S AM
P L E
S AM
P L E
S AM
P L E
S AM
P L E
S AM
P L E
S AM
P L E
S AM
P L E
S AM
P L E
S AM
P L E
S AM
P L E
S AM
P L E
S AM
P L E
S AM
P L E
S AM
P L E
S AM
P L E
S AM
P L E
S AM
P L E
S AM
P L E
S AM
P L E
S AM
P L E
S AM
P L E
S AM
P L E
S AM
P L E
S AM
P L E
S AM
P L E
S AM
P L E
S AM
P L E
S AM
P L E
S AM
P L E
S AM
P L E
S AM
P L E
S AM
P L E
S AM
P L E
S AM
P L E
S AM
P L E
S AM
P L E
S AM
P L E
S AM
P L E
S AM
P L E
Eng inside.indd 31 31/5/07 10:04:56
32
Figure 2: Ethnic group question for England and Wales, 2001 Census
◊ Choose ONE section from A to E, then tick the appropriate box to indicate your cultural background.
A White British Irish Any other white background, please write in
B Mixed White and Black Caribbean White and Black African White and Asian Any other Mixed background, please write in
C Asian or Asian British Indian Pakistani Bangladeshi Any other Asian background, please write in
D Black or Black British Caribbean African Any other Black background, please write in
E Chinese or other ethnic group Chinese Any other, please write in
What is your ethnic group?
S AM
P L E
S AM
P L E
White and Black African
S AM
P L E
White and Black African White and Black African
Any other Mixed background, please write inS AM
P L E
Any other Mixed background, please write in Any other Mixed background, please write in
Bangladeshi
S AM
P L E Bangladeshi Bangladeshi Any other Asian background, please write in
S AM
P L E Any other Asian background, please write in Any other Asian background, please write in
D Black or Black British
S AM
P L E D Black or Black British D Black or Black British Caribbean
S AM
P L E Caribbean Caribbean African
S AM
P L E African African
S AM
P L E
S AM
P L E
S AM
P L E
S AM
P L E
S AM
P L E
S AM
P L E
S AM
P L E
S AM
P L E
S AM
P L E
S AM
P L E
S AM
P L E
S AM
P L E
S AM
P L E
S AM
P L E
S AM
P L E
S AM
P L E
S AM
P L E
S AM
P L E
S AM
P L E
S AM
P L E
S AM
P L E
S AM
P L E
S AM
P L E
S AM
P L E
S AM
P L E
S AM
P L E
S AM
P L E
S AM
P L E
S AM
P L E
S AM
P L E
S AM
P L E
S AM
P L E
S AM
P L E
S AM
P L E
S AM
P L E
S AM
P L E
S AM
P L E
S AM
P L E
Figure 3: National Statistics Classification of the national identity in Wales
Welsh
English
Scottish
Irish
British
Other, please write in
What do you consider your national identity to be?◊ Choose your answer from this list. Choose AS MANY OR AS FEW as apply, then tick the appropriate box to indicate your national identity.
S A M P L ES A M P L E IrishS A M P L E Irish Irish
BritishS A M P L E British BritishS A M P L ES A M P L ES A M P L ES A M P L ES A M P L ES A M P L E
A White
English
Irish
Scottish
Welsh
Other European
Any other cultural background, specify:S A M P L ES A M P L E WelshS A M P L E Welsh Welsh
Other EuropeanS A M P L E Other European Other EuropeanS A M P L ES A M P L ES A M P L ES A M P L ES A M P L ES A M P L E
Figure 4: 1999 Health Survey for England: Categorisation of ‘White’ ethnic group
Eng inside.indd 32 31/5/07 10:04:57

33
Figure 7: Permanently sick/disabled question 2001 Census
Figure 5: Long-term limiting illness question 2001 Census
Yes No
Do you have any long-term illness, health problem or disability which limits your daily activities or the work you can do? Include problems which are due to old age
S A M P L ES A M P L E Yes NoS A M P L E Yes No Yes NoS A M P L ES A M P L ES A M P L E
Good? Fairly good? Not good?
Over the last twelve months would you say your health has on the whole been:
Figure 6: General health question 2001 Census
S A M P L ES A M P L E Good? Fairly good? Not good?S A M P L E Good? Fairly good? Not good? Good? Fairly good? Not good?S A M P L ES A M P L ES A M P L E
Tick all the boxes that apply.
Retired Looking after home/family
Student Permanently sick/disabled
None of the above
Last week, were you any of the following?
S A M P L E Retired Looking after home/familyS A M P L E Retired Looking after home/family Retired Looking after home/family
Student Permanently sick/disabledS A M P L E Student Permanently sick/disabled Student Permanently sick/disabledS A M P L ES A M P L ES A M P L ES A M P L ES A M P L ES A M P L E
Figure 8: Carers question 2001 Census
◊ long-term physical or mental ill-health or disabilty, or
◊ problems related to old age?
Do not count anything you do as part of your paid employment. Tick time spent in a particular week.
No Yes, 20-49 hours a week
Yes, 1-19 hours a week Yes, 50+ hours a week
Do you look after, or give any help or support to family members, friends, neighbours or others because of:
S A M P L ES A M P L E count anything you do as part of your paid employment.
S A M P L E count anything you do as part of your paid employment. count anything you do as part of your paid employment.
Tick time spent in a particular week.S A M P L E Tick time spent in a particular week. Tick time spent in a particular week.
No Yes, 20-49 hours a weekS A M P L E
No Yes, 20-49 hours a week No Yes, 20-49 hours a weekS A M P L ES A M P L ES A M P L E
Eng inside.indd 33 31/5/07 10:04:58

34
Eng inside.indd 34 31/5/07 10:04:58
35
ReferencesAspinall P.J. (2000) The mandatory collection of data on ethnic group of inpatients: experience of NHS trusts in England in the first reporting years. Public Health;114: 254-259.
Aspinall P., Jacobson B., Klodawski E., and Polato G.M. (2003) Missing Record: The Case for Recording Ethnicity at Birth and Death Registration. Executive Summary. London: London Health Observatory (July).
Bardsley M., Hamm J., Lowdell C., Morgan D., and Storkey M. (2000) Developing Health Assessment for Black and Minority Ethnic Groups: Analysing Routine Health Information. London: Health of Londoners Project and NHS Executive (March).
Bhopal R. (2000) What is the risk of coronary heart disease in South Asians? A review of UK research. Journal of Public Health Medicine; 22(3): 375-385.
Breslow N.E. and Day N.E. (1987) Statistical Methods in Cancer Research. Vol. II, The Design and Analysis of Cohort Studies (IARC Scientific Publication No. 82). Lyon, France: International Agency for Research on Cancer.
Cartlidge P.H.T., Sibert J.R., Hopkins J.M., Rolfe K., and Stewart J.H. (2003) All Wales Perinatal Survey. Annual Report 2003. Cardiff: Department of Child Health, Cardiff University.
Department for Education and Skills (2006). Teenage Pregnancy: Accelerating the Strategy to 2010. London: Department for Education and Skills.
Department of Health (2003) Delivering Race Equality: A Framework for Action. Mental Health Services. Consultation Document. London: Department of Health (October).
GRASP Steering Group (2002) The Gonococcal Resistance to Antimicrobials Surveillance Programme (GRASP). Year 2001 report. London: Public Health Laboratory Service.
HM Government (2005) Controlling our Borders: Making migration work for Britain. Five year strategy for asylum and immigration. London: Home Office.
Lyons R.A., Jones S., Kemp A., Sibert J., Shepherd J., Richmond P., Bartlett C., and Palmer S.R. (2002). Development and use of a population based injury surveillance system: The All Wales Injury Surveillance System (AWISS). Injury Prevention; 8: 83-86.
National Assembly for Wales (2005a). Welsh Health Survey 2003/04. Cardiff: National Assembly for Wales.
National Assembly for Wales (2005b). Experimental Statistics. First Release. National Community Child Health Database (NCCHD): First Data. Cardiff: National Assembly for Wales. http://new.wales.gov.uk/docrepos/40382/40382313/403824/health/health-2005/sdr63-2005.pdf?lang=en
National Assembly for Wales (2006). Welsh Health Survey 2004/05. Cardiff: National Assembly for Wales.
National Statistics (2006) Schools’ Census 2006: Provisional Results. Wales. SDR 100/2006.
Eng inside.indd 35 31/5/07 10:04:58

36
National Statistics and National Assembly for Wales (2004) Statistical Bulletin: A Statistical Focus on Ethnicity in Wales. SB 53/2004. Cardiff: Statistical Directorate, National Assembly for Wales (29 July). http://www.wales.gov.uk/keypubstatisticsforwales/content/publication/compendia/2004/sb53-2004/sb53-2004.htm
Nazroo J. (1997). The health of Britain’s ethnic minorities. London: Policy Studies Institute.
NHS Information Authority (2001). CDS, HES & Workforce: Ethnic data. Finalised coding frame. DCS Notice: 02/2001. Birmingham: NHS Information Authority.
NHS Information Centre for Health and Social Care (2006). National Diabetes Audit. Key findings about the quality of care for children and young people with diabetes in England, incorporating registrations from Wales. Report for the audit period 2004/05. Leeds: NHS Information Centre.
Nicolaas G., Pickering K., and Tipping S. (2003) Feasibility of combining the Welsh Health Survey and the Health in Wales Survey. Prepared by the National Centre for Social Research on behalf of the Welsh Assembly Government. London: National Centre for Social Research (September).
Office for National Statistics (2001/02). Annual Local Labour Force Survey 2001/02. London: ONS.
Office for National Statistics (2003) Ethnic group statistics. A guide for the collection and classification of ethnicity data. London: Office for National Statistics.
Twigg L., Moon G. and Walker S. (2004) The Smoking Epidemic in England. London: Health Development Agency.
Welsh Assembly Government. (2005a) Scoping Study to explore the feasibility of a Health and Social Care Research and Development Network covering Black and Minority Ethnic Groups in Wales. Cardiff: Wales Office of Research and Development, Welsh Assembly Government.
Welsh Assembly Government (2005b). Scoping Study report on the creation of a Generic Health Information Research Network (G-HIRN). Cardiff: Wales Office of Research and Development, Welsh Assembly Government.
Welsh Assembly Government (2005c). Headline Statistics Wales, National Community Child Health Database (NCCHD): First Data, 2004.
Eng inside.indd 36 31/5/07 10:04:58


G057 cover.indd 3 31/5/07 10:05:28