health brazil 2015/2016 - bvsms.saude.gov.br
TRANSCRIPT
1
HEALTH BRAZIL2015/2016
Brasília – DF2017
MINISTRY OF HEALTH OF BRAZIL
An analysis of health situation and the epidemic caused by Zika virus and other
diseases transmitted by Aedes Aegypti

1
An analysis of health situation and the epidemic caused by Zika virus and other
diseases transmitted by Aedes Aegypti
2015/2016HEALTH BRAZIL
MINISTRY OF HEALTH OF BRAZIL
Brasília – DF 2017

MINISTRY OF HEALTH OF BRAZILSecretariat of Health Surveillance
Department of Noncommunicable Diseases Surveillance and Health Promotion
HEALTH BRAZIL 2015/2016 An analysis of health situation and the
epidemic caused by Zika virus and other diseases transmitted by Aedes Aegypti
Brasília – DF 2017

2017 Ministry of Health of Brazil.This publication is made available under the terms of the Creative Commons License – Attribution – Not Commercial – ShareAlike Version 4.0 International. This publication may be partially or totally reproduced provided the source is quoted. The Ministry of Health institutional collection can be fully Accesssed via the Virtual Health Library of the Ministry of Health at: <www.saude.gov.br/bvs>. The content of this and other works of the Ministry of Health Publisher can be Accesssed at: <http://editora.saude.gov.br>.
Edition: 1st edition - 2017 – electronic version
Previous editions:Health Brazil 2004: an analysis of the health situationHealth Brazil 2005: an analysis of the health situation in BrazilHealth Brazil 2006: an analysis of the health situation in BrazilHealth Brazil 2007: an analysis of the health situationHealth Brazil 2008: 20 years of the Unified Health System (SUS) in BrazilHealth Brazil 2009: an analysis of the health situation and National and International Health Priorities AgendaHealth Brazil 2010: an analysis of the health situation and impact-selected health surveillance actions evidencesHealth Brazil 2011: an analysis of the health situation and women’s health surveillanceHealth Brazil 2012: an analysis of the health situation and 40 years of the National Immunization ProgramHealth Brazil 2013: an analysis of the health situation and communicable diseases related to povertyHealth Brazil 2014: an analysis of the health situation and external causes
Preparation, distribution and information:MINISTRY OF HEALTH OF BRAZILHealth Surveillance SecretariatDepartment of Noncommunicable Disease Surveillance and Health PromotionGeneral Coordination of Epidemiological Information and AnalysisEsplanada dos Ministérios, Edifício Sede, bloco G, 1ª andar, sala 134Postcode: 70058-900 – Brasília/DF, BrazilWebsite: www.saude.gov.br/svsE-mail: [email protected]
General editors:Adeilson Loureiro Cavalcante Maria de Fátima Marinho de Souza
Executive editors:Elisete DuarteHelena Luna FerreiraMarta Roberta Santana Coelho
Scientific editors:Elisabeth Carmen Duarte – Universidade de Brasília (UnB)Leila Posenato Garcia – Instituto de Pesquisa Econômica Aplicada (Ipea)
Technical review:César Dantas GuimarãesEdinilsa Ramos de SouzaElisabeth Carmen DuarteJuan José Cortez EscalanteLeila Posenato GarciaMaria Cecília de Souza MinayoMaria de Fatima Marinho de SouzaMarta Maria Alves da SilvaOtaliba Libânio de Morais Neto
Editorial production supervision:Thais de Souza Andrade Pansani
Portuguese-english translation:Fidelity Traduções Ltda
Translation proofreading:José Mauricio de Lima JuniorPaula Carvalho de Freitas
Publisher responsible:MINISTRY OF HEALTH OF BRAZIL Executive SecretariatSub- Secretariat for Administrative AffairsGeneral Coordination of Documentation and InformationCoordination of Editorial Management SIA, Trecho 4, lotes 540/610Postcode: 71200-040 - Brasília/DFTels.: (+55) 61 3315-7790 / 3315-7794Website: http://editora.saude.gov.brE-mail: [email protected]
Editorial team:Standardization: Delano de Aquino SilvaCover: Marcos MelquíadesCharts and figures final art: Marcos MelquíadesGraphic project and desktop publishing: Leonardo Silva
Catalogue Details___________________________________________________________________________________________________________________________
Brazil. Ministry of Health of Brazil. Secretariat of Health Surveillance. Department of Noncommunicable Diseases Surveillance and Health Promotion. Health Brazil 2015/2016 : an analysis of health situation and the epidemic caused by Zika virus and other diseases transmitted by Aedes aegypti [electronic resource] / Ministry of Health, Secretariat of Health Surveillance, Department of Noncommunicable Diseases Surveillance and Health Promotion. – Brasília: Ministry of Health of Brazil, 2017. 132 p. : il.
Access Mode: World Wide Web: <http://bvsms.saude.gov.br/publicacoes/health_brazil_2015_2016.pdf>Translation of: Saúde Brasil 2015/2016: uma análise da situação de saúde e da epidemia pelo vírus Zika e por outras doenças transmitidas pelo Aedes aegypti. ISBN 978-85-334-2513-5
1. Public Health. 2. SUS (BR). 3. Health indicators. I. Title.
CDU 614(81)_______________________________________________________________________________________________________________________________
Cataloging at source - General Coordination of Documentation and Information - MS Publisher - OS 2017/0178

Summary
PREFACE 07
INTRODUCTION 09
1 Dengue: epidemiological situation in Brazil, 2013-2016 112 Chikungunya fever in Brazil, 2015 and 2016 273 Zika virus fever 394 Microcephaly in Brazil: prevalence and characterization of cases from the Information System on Live Births (Sinasc), 2000-2015 515 Characterization of territorial vulnerabilities and mapping of
microcephaly cases in the Brazilian Northeastern Semi-Arid Region in 2015 67
6 Epidemiological situation of the congenital syndrome associated to Zika virus infection in Brazil, in 2015 83
7 Strategies to control the Aedes aegypti: a review 107
TECHNICAL TEAM 127

7
PREFACE
The Ministry of Health presents the book Health Brazil 2015/2016: An analysis of health situation and the epidemic caused by Zika virus and other diseases transmitted by Aedes Aegypti. This book was prepared and organized by the Secretariat of Health Surveillance (SVS/MS), proving its commitment to produce and disseminate health situation analysis with emphasis on Zika virus epidemic. This publication reinforces the debate about the potentialities of health situation analysis as one of the bases for building a collective health that draws on the evidence generated from the practice of epidemiology in services. The objectives are: to emphasize the use of the secondary data available in the Ministry of Health information systems; feedback to health managers, workers and users of national information systems; to establish a baseline for monitoring the indicators of interest in public health; to expand the possibility of projecting future scenarios based on trends and time series analyses; in addition to informing and discussing with the society the analyzed differences in health in the theme “Zika virus epidemic and other Aedes aegypti--communicative diseases in Brazil”, especially in relation to Zika virus, Chikungunya and Dengue epidemics, among others. The results presented throughout the chapters show important information for the management of the health system in order to guide health priorities and actions in the search for reduction of mortality due to the analyzed diseases.
The Editors

9
INTRODUCTION
This publication forms part of the book entitled “Health Brazil 2015/2016: An analysis of health situation and the epidemic caused by Zika virus and other diseases trans-mitted by Aedes Aegypti”, which is produced annually by the General Coordination of Epidemiological Information and Analysis, of the Noncommunicable Disease Surveillance and Health Promotion Department, located within the Brazilian Health Ministry’s Secre-tariat of Health Surveillance. This book is comprised of seven chapters dealing with “the epidemic caused by Zika virus and other diseases transmitted by Aedes Aegypti”, with emphasis on dengue, chikungunya and Zika. This theme continues to stand out on the Brazilian epidemiological scenario.
Dengue is one of the main public health issues in Brazil. From 2013 to 2016, more than 5 million cases were reported (Chapter 1). Chikungunya virus was detected in Brazil in 2014, with expansion in the period from 2015 to 2016, mainly in the Northeast region (chapter 2). The circulation of Zika virus in Brazil was confirmed in 2015. In 2016, about 200,000 cases were reported, with three confirmed deaths and an increase in cases of the Guillain-Barré syndrome (Chapter 3). In 2015, there were 1,608 cases of microcephaly in Brazil, an increase in relation to the previous period (average of 164 cases in the period 2000-2014) (chapter 4). At the Brazilian Northeastern Semi-arid Region, in 2015, the distribution of microcephaly cases revealed an overlapping risk for disease with socioe-conomic vulnerabilities in the territory (chapter 5). The investigation of suspected cases of congenital syndrome associated with Zika virus infection progressed from November 2015 to May 2016. A study revealed that one-fifth of the confirmed cases did not present microcephaly, which indicates the need for studies to better characterize this syndrome (Chapter 6). The last chapter presents a review on Aedes aegypti control strategies, with emphasis on the promising technological innovations to use in Brazil. It highlights the importance of integrating different and compatible vector control strategies to reduce mosquito infestation and the incidence of arboviruses transmitted by them (Chapter 7).
The book Health Brazil is the product of a jointly built strategy involving universities, research centers, consultants, health service managers and the Health Ministry technical staff, among others. In addition of producing knowledge, it is also a valuable internal process for encouraging reflection and institutional enhancement, strengthening the analytical ability of the professionals involved, providing feedback to health information systems and fostering a space for debate which brings academic rationale closer to health services needs and ways of operating.


Dengue: epidemiological situation in Brazil, 2013-20161

Table of Contents
Abstract 13Introduction 14Objectives 14Methods 14Results 16Discussion 23References 26

13
Dengue: epidemiological situation in Brazil, 2013-2016
Abstract
Introduction: Dengue contributes a significant disease burden an important eco-nomic and social impact in the populations of endemic areas. 2015 is considered as the most epidemic year of dengue in Brazil, surpassing the number of confirmed cases and the number of hospitalizations from the previous epidemic years, 2010 and 2013.
Objectives: Describe the cases of dengue in Brazil reported from 2013 to 2016 (until the Epidemiological Week 22 - EW 22), considering the circulating serotypes, severity of cases and number of deaths.
Methods: The cases of dengue reported at Sinan on the Net and Online versions in 2013, and only those in the system’s online version from 2014 to 2016 were analyzed, and the Hospitalization Information System (SIH) for dengue from 2013 until the first semes-ter of 2016. A descriptive analysis was prepared for the reported and hospitalized cases.
Results: Approximately 5 million cases of dengue were reported from 2013 to 2016 in Brazil; the total number of cases in this period exceeded the total number of cases re-gistered over the last decade. Serotypes DENV4 and DENV1 prevailed during the study period in the country. The ratio cases reported/hospitalization has been increasing since 2014 and indicates a lower need for hospitalization in recent years. 2,300 deaths due to dengue were confirmed in Brazil. The year of 2015 had the highest number of deaths.
Conclusion: Dengue remains as one of the most significant public health issues in Brazil even with the emergence of new viruses transmitted by Aedes aegypti, considering the burden of the disease and major potential of evolution to death. The number of cases notified during the analyzed period exceeded the number of cases reported over the last decade. Surveillance should be intense, especially during low transmission periods, in order to remain alert about the disease, make early detections of changes in the pattern and timely intervene with control actions.
Keywords: Dengue. Epidemics. Hospitalization.
Introduction
Dengue fever is the most rapidly spread mosquito-borne viral disease in the world. Fifty million infections for dengue are estimated annually worldwide and approximately 2.5 million people live in dengue-endemic countries.1
In Brazil, dengue is characterized for the endemic and epidemic transmission mainly determined by the simultaneous circulation of four viral serotypes: DENV1, DENV2, DENV3 and DENV4. According to Ordinance No. 204, dated February 17th, 2016 from the Brazilian Ministry of Health, dengue is a compulsory notification disease and death suspects must be reported immediately. The surveillance system must be immediately reported in case of deaths so that actions are timely carried out.

HEALTH BRAZIL 2015/2016 – An analysis of health situation and the epidemic caused by Zika virus and other diseases transmitted by Aedes Aegypti
Secretariat of Health SurveillanceMINISTRY OF HEALTH OF BRAZIL
14
Dengue contributes a significant burden of the disease and causes an important eco-nomic and social impact in the populations of endemic areas. It is a disease that affects affecting all social levels; however, the impact can be higher among the poor populations living in areas with inadequate water supply, poor infrastructure and where health con-ditions are more favorable for the multiplication of its main vector2.
The year of 2015 stands out as the most epidemic of dengue in Brazil, surpassing the number of confirmed cases and the number of hospitalizations from the previous epide-mic years, 2010 and 2013, according to the Ministry of Health Epidemiological Reports (Access on: <http://portalsaude.saude.gov.br/index.php/situacao-epidemiologica-dados--dengue>).
Objectives
Describe the cases of dengue in Brazil reported between 2013 and 2016 (until the Epi-demiological Week 22 - EW 22), considering the circulating serotypes, severity of cases and number of deaths. In addition, discuss the current circulation of other arboviruses that may influence the notification of dengue in the country.
Methods
This is a descriptive observational epidemiological study using dengue data from the Information System for Notifiable Diseases (Sinan), the National Hospital Information System (SIH/SUS) and the Laboratory Environment Management System (GAL), from 2013 to the first half of 2016.
The cases reported on Sinan in both Net and Online versions in 2013 were analyzed, and only those in the system’s online version from 2014 to 2016 were used. Hospitalizations with main or secondary diagnosis of classical dengue (CD) and dengue hemorrhagic fever (DHF), according to the International Statistical Classification of Diseases and Health--Related Problems - Tenth Review - were selected to analyze SIH/SUS data between 2013 and 2016 with codes for each hospitalization: ICD-10: A90 and A91, respectively. Data were analyzed on TabNET and Access on SUS IT Department webpage - DATASUS.3
These databases were also used to determine the value paid for hospitalizations of patients with dengue by SUS.
Dengue case definitions adopted by the Brazilian Ministry of Health (MS) until 2013 are the same ones adopted by the World Health Organization (WHO): classical dengue/CD, dengue hemorrhagic fever/DHF and dengue shock syndrome/DSS, except for the definition of dengue case with complications (DCC), exclusively adopted due to diffi-culties to classify the most serious cases of the disease as DHF or DCC.4 As of 2014, the Brazilian Ministry of Health adopted WHO new dengue classification: dengue, dengue with warning signs and severe dengue.2

15
Dengue: epidemiological situation in Brazil, 2013-2016
In order to adapt to the new dengue classification, some changes in the investiga-tion form for dengue at Sinan were made, and as of March 2014 only the system’s online version was provided for Brazilian Federal States and municipalities.
The cases of dengue in the country are confirmed through the following laboratory techniques: PCR, viral isolation, NS1 and serology Elisa IgM. These techniques are gua-ranteed by a network of public health laboratories widely distributed throughout Brazil. Serology is the mostly used laboratory method to confirm or discard cases. During non-epidemic periods, cases can be confirmed by clinical-epidemiological criteria, after confirmation of the first cases in the area by laboratory criteria. All reported cases may not be investigated in high transmission periods. Cases with unknown or inconclusive outcomes are summed to the confirmed cases during the epidemiological analysis and form the category of probable dengue cases, being considered in the trend analysis and incidence coefficients.
Data analysis
A descriptive analysis was done/carried out for the reported and hospitalized cases according to sex, age, place of residence, final classification, confirmation criteria, onset of symptoms and hospitalization date. In addition, dengue incidence coefficients, mortality rate and ratio of reported cases by dengue-hospitalized cases were calculated.
The percentage of reported cases according to the size of the population of the mu-nicipality of residence was also analyzed. Five categories of size of population were used for the stratification, considering the estimate of the population living in Brazil in 2015, namely: i) under 50 thousand inhabitants (n = 4,976; 89.4%); ii) between 50 and 99 thou-sand inhabitants (n = 316; 5.7%); iii) between 100 thousand and 499 thousand inhabitants (n = 233; 4.2%); iv) between 500 and 999 thousand inhabitants (n = 24; 0.5%); and v) above 1 million inhabitants (n = 14; 0.3%).
To calculate the coefficient of dengue incidence, confirmed and probable dengue cases were utilized and divided by the estimated population for each Federation Unit during the analyzed period.
Charts and tables were prepared from the previously described analysis with the aid of the programs EPI Info 7, Tabwin and Excel.
Ethical considerations
Databases without identification of cases and detailed addresses were used in this study, except for municipality and state of residence.

HEALTH BRAZIL 2015/2016 – An analysis of health situation and the epidemic caused by Zika virus and other diseases transmitted by Aedes Aegypti
Secretariat of Health SurveillanceMINISTRY OF HEALTH OF BRAZIL
16
Results
Approximately 5 million cases of dengue were reported from 2013 to 2016 in Brazil. In 2015 alone, 1.6 million cases were registered; at the moment being considered as the year of the greatest epidemic of the disease in the country. (Table 1).
Table 1 - Number of reported cases and hospitalizations for dengue, ratio between the number of notified cases and number of hospitalizations, and cost of hospitalizations paid by SUS - Brazil, 2013-2016
Year Cases Hospitalizations Reported cases/hospitalizations (Ratio)
Cost ofhospitalizations for SUS (in BRL million)
2013 1,452,489 64,162 22.6:1 20.6
2014 589,107 36,809 16.0:1 12.0
2015 1,649,008 71,915 22.9:1 23.8
2016 1,294,583 35,025 37.0: 1 11.6
Total 4,985,619 207,911 24.0: 1 68.1
Source: Sinan/SIH.
Dengue cases were mostly concentrated in medium-sized municipalities with populations between 100 and 499 thousand inhabitants in the whole period, except 2016, when the greatest concentration was noted in small municipalities, with less than 50 thousand inhabitants (Table 2).
Table 2 - Distribution of dengue cases proportion according to population size - Brazil, 2013-2016
Population size Proportion of cases
2013 2014 2015 2016
< 50 thousand inhabitants 27 23.5 26.6 30.6
50 - 99 thousand inhabitants 12.7 17.1 13.1 11.9
100 - 499 thousand inhabitants 31.4 27 29.3 26.6
500 - 999 thousand inhabitants 8.6 7.3 10.6 10.5
> = 1 million inhabitants 20.2 25.1 20.4 20.3
Source: Sinan, 2016: data until epidemiological week 22.

17
Dengue: epidemiological situation in Brazil, 2013-2016
Serotypes DENV4 and DENV1 prevailed during the study period in the country. Serotype DENV1 was identified in more than 80% of the positive samples through PCR or virus isolation as of 2014 and remains as the predominant serotype since then. The year of 2015 had the highest circulation of this serotype, which is also the year with lower circulation proportion of serotypes DENV2 and DENV3.Until the epidemiological week 22 (EW 22), 2016 had a similar number of reports as 2015; however, with lower hospitalization ratio (1 hospitalization for each 37 cases notified). In fact, we can observe a reduction in hospitalizations for dengue since 2014 leading to a gradual increase in the ratio of reported cases and hospitalizations, namely: 2014 (16:1), 2015 (23:1) and 2016 (37:1) (Table 1 and Chart 1). It is worth highlighting that 2014 had the lowest number of reported cases during the studied period; however, it was the year with greater hospitalization ratio proportionally (1 hospitalization for every 16 notified cases). It is also worth highlighting that chikungunya fever detection occurred during the second semester of 2014 and Zika virus fever detection in the first semester of 2015 (Table 3).
Chart 1 - Possible cases of dengue and hospitalizations for dengue, according to symptoms onset month - Brazil, 2013-2016*
Reported cases Hospitalizados
2016201520142013
DENV 1DENV 4 e DENV 1
16.000
14.000
12.000
10.000
8.000
6.000
4.000
2.000
0
500.000
450.000
400.000
350.000
300.000
250.000
200.000
150.000
100.000
50.000
0
Hos
pita
lized
Rep
orte
d ca
ses
Source: Sinan/SIH/SVS/MS.Note: Black bars represent the month of January. * Cases reported until Epidemiological Week 22 of 2016.

HEALTH BRAZIL 2015/2016 – An analysis of health situation and the epidemic caused by Zika virus and other diseases transmitted by Aedes Aegypti
Secretariat of Health SurveillanceMINISTRY OF HEALTH OF BRAZIL
18
Table 3 - Main dengue epidemiology events - Brazil 2013-2016
Year Event
2013 The largest dengue epidemic registered in Brazil.
2014 Simultaneous transmission of dengue and chikungunya in the states of Bahia, Amapá, and Mato Grosso do Sul
2015 Simultaneous transmission of dengue, chikungunya, and Zika in 22 states.
2016 Confirmation of the simultaneous transmission of dengue and Zika in all Brazilian states and expansion of the areas with the transmission of chikungunya.
Source: PNCD/SVS/MS.
Table 4 - Number of samples submitted, number of positive samples and proportion of serotypes confirmed- Brazil, 2013-2016
Federation Unit Samplessubmitted (n)
Positive Serotypes confirmed (%)
(n) (%) DENV1 DENV2 DENV3 DENV4
2013 17,339 5,593 32.3 39.9 3.5 0.6 56.0
2014 12,064 3,807 31.6 81.7 1.5 0.5 16.3
2015 23,196 8,859 38.2 93.8 0.7 0.4 5.1
2016 7,021 2,204 31.4 90.1 6.4 0.9 2.6
Source: GAL/SES.
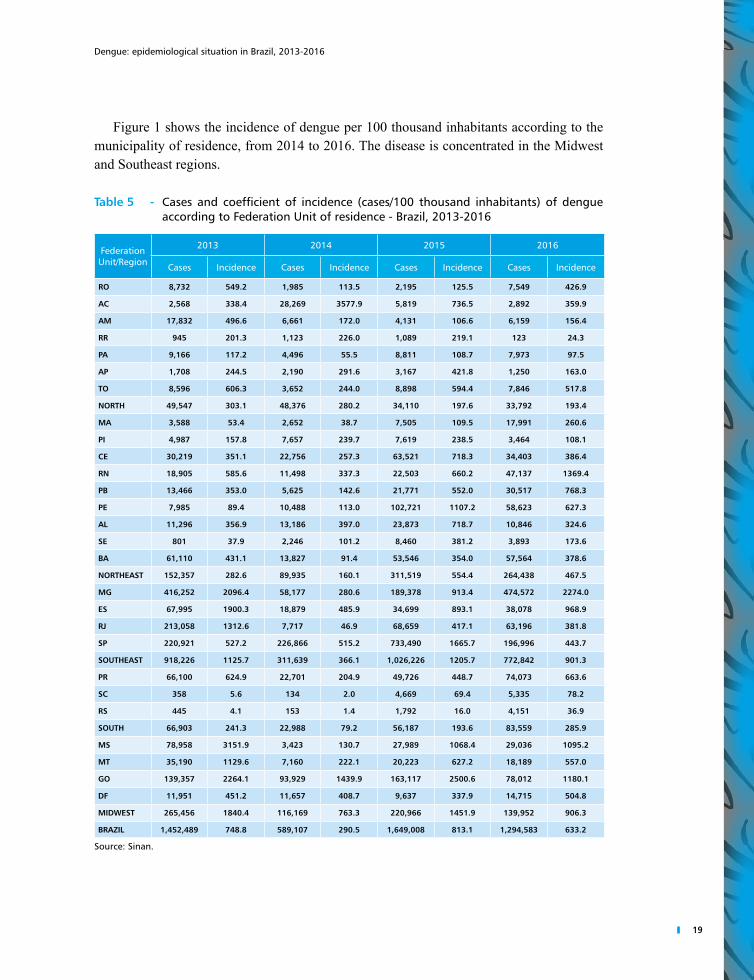
Table 5 shows the incidence of dengue per 100 thousand inhabitants of each state from 2013 to 2016. As mentioned, the greatest incidence was noted in 2015, especially in the states of Goiás, São Paulo, Pernambuco, and Mato Grosso do Sul, with 2,500.6; 1,665.7; 1,107.2 and 1,068.4 probable cases of the disease per 100 thousand inhabitants, respectively. In 2016, the states of Minas Gerais, Rio Grande do Norte, Goiás and Mato Grosso do Sul presented the highest number of cases so far: 2,274.0 1,369.4; 1,180.1 and 1,095.2 probable cases of the disease per 100 thousand inhabitants, respectively. The states of Santa Catarina and Rio Grande do Sul presented autochthonous cases in this period.
19
Dengue: epidemiological situation in Brazil, 2013-2016
Figure 1 shows the incidence of dengue per 100 thousand inhabitants according to the municipality of residence, from 2014 to 2016. The disease is concentrated in the Midwest and Southeast regions.
Table 5 - Cases and coefficient of incidence (cases/100 thousand inhabitants) of dengue according to Federation Unit of residence - Brazil, 2013-2016
Federation Unit/Region
2013 2014 2015 2016
Cases Incidence Cases Incidence Cases Incidence Cases Incidence
RO 8,732 549.2 1,985 113.5 2,195 125.5 7,549 426.9
AC 2,568 338.4 28,269 3577.9 5,819 736.5 2,892 359.9
AM 17,832 496.6 6,661 172.0 4,131 106.6 6,159 156.4
RR 945 201.3 1,123 226.0 1,089 219.1 123 24.3
PA 9,166 117.2 4,496 55.5 8,811 108.7 7,973 97.5
AP 1,708 244.5 2,190 291.6 3,167 421.8 1,250 163.0
TO 8,596 606.3 3,652 244.0 8,898 594.4 7,846 517.8
NORTH 49,547 303.1 48,376 280.2 34,110 197.6 33,792 193.4
MA 3,588 53.4 2,652 38.7 7,505 109.5 17,991 260.6
PI 4,987 157.8 7,657 239.7 7,619 238.5 3,464 108.1
CE 30,219 351.1 22,756 257.3 63,521 718.3 34,403 386.4
RN 18,905 585.6 11,498 337.3 22,503 660.2 47,137 1369.4
PB 13,466 353.0 5,625 142.6 21,771 552.0 30,517 768.3
PE 7,985 89.4 10,488 113.0 102,721 1107.2 58,623 627.3
AL 11,296 356.9 13,186 397.0 23,873 718.7 10,846 324.6
SE 801 37.9 2,246 101.2 8,460 381.2 3,893 173.6
BA 61,110 431.1 13,827 91.4 53,546 354.0 57,564 378.6
NORTHEAST 152,357 282.6 89,935 160.1 311,519 554.4 264,438 467.5
MG 416,252 2096.4 58,177 280.6 189,378 913.4 474,572 2274.0
ES 67,995 1900.3 18,879 485.9 34,699 893.1 38,078 968.9
RJ 213,058 1312.6 7,717 46.9 68,659 417.1 63,196 381.8
SP 220,921 527.2 226,866 515.2 733,490 1665.7 196,996 443.7
SOUTHEAST 918,226 1125.7 311,639 366.1 1,026,226 1205.7 772,842 901.3
PR 66,100 624.9 22,701 204.9 49,726 448.7 74,073 663.6
SC 358 5.6 134 2.0 4,669 69.4 5,335 78.2
RS 445 4.1 153 1.4 1,792 16.0 4,151 36.9
SOUTH 66,903 241.3 22,988 79.2 56,187 193.6 83,559 285.9
MS 78,958 3151.9 3,423 130.7 27,989 1068.4 29,036 1095.2
MT 35,190 1129.6 7,160 222.1 20,223 627.2 18,189 557.0
GO 139,357 2264.1 93,929 1439.9 163,117 2500.6 78,012 1180.1
DF 11,951 451.2 11,657 408.7 9,637 337.9 14,715 504.8
MIDWEST 265,456 1840.4 116,169 763.3 220,966 1451.9 139,952 906.3
BRAZIL 1,452,489 748.8 589,107 290.5 1,649,008 813.1 1,294,583 633.2
Source: Sinan.

HEALTH BRAZIL 2015/2016 – An analysis of health situation and the epidemic caused by Zika virus and other diseases transmitted by Aedes Aegypti
Secretariat of Health SurveillanceMINISTRY OF HEALTH OF BRAZIL
20
Figure 1 - Coefficient of dengue incidence according to Federal State of residence - Brazil, 2013-2016
100 to 300 cases< 100 cases
> 300 cases
No transmission
Coefficient of incidence per 100 thousand inhab.
2013 2014
2015 2016
Source: Sinan/SVS/MS.
Considering the classification for severe dengue cases in 2013 (dengue with compli-cations, dengue hemorrhagic fever and dengue shock syndrome), 6,977 cases of severe dengue were confirmed, being 5,558 (79.8%) cases of dengue with complication, 1,297 (18.5%) cases of dengue hemorrhagic fever and 122 (1.7%) cases of dengue shock syn-drome. Considering the new classification of dengue cases by the WHO (January, 2014), 2,439 cases of severe dengue and 33,940 cases of dengue with warning signs were confir-med between 2014 and the first half of 2016, with emphasis for the year of 2015 (Table 6). It is worth noting that, in 2014, only cases with final classification of severe dengue are considered as severe. Thus, this classification is more specific than the one considered previously; therefore, data are no longer comparable to the previous ones.

21
Dengue: epidemiological situation in Brazil, 2013-2016
Table 6 - Cases of severe dengue and dengue with warning signs, according to the UF of residence - Brazil, 2014-2016
Federation Unit 2014 2015 2016**
Severe cases Dengue with warning signs Severe cases Dengue with
warning signs Severe cases Dengue with warning signs
Rondônia 2 9 5 11 4 5
Acre 1 21 0 2 0 0
Amazonas 7 8 2 10 2 3
Roraima 1 2 0 10 0 1
Pará 4 25 12 33 3 25
Amapá 1 12 16 31 0 9
Tocantins 0 31 8 18 0 7
Maranhão 13 51 25 44 3 20
Piauí 3 25 19 42 2 3
Ceará 50 237 119 664 8 50
Rio Grande do Norte 20 135 6 46 4 40
Paraíba 9 108 10 75 4 32
Pernambuco 14 50 26 74 5 23
Alagoas 4 254 14 94 2 11
Sergipe 4 10 5 2 0 1
Bahia 9 111 28 36 3 4
Minas Gerais 34 670 123 984 157 1,356
Espírito Santo 16 333 65 602 20 267
Rio de Janeiro 7 98 50 340 11 78
São Paulo 90 4,991 625 13,074 61 726
Paraná 11 297 95 393 73 484
Santa Catarina 0 1 1 112 2 59
Rio Grande do Sul 0 1 2 9 7 29
Mato Grosso do Sul 3 68 11 220 15 95
Mato Grosso 4 20 14 41 5 8
Goiás 93 745 262 3,287 48 1,545
Federal District 15 134 26 75 16 283
BRAZIL 415 8,447 1,569 20,329 455 5,164
Source: Sinan.
In the distribution of incidence coefficient per age group, we can observe a predomi-nance of dengue cases with warning signs from the 15 year old group, in 2014 and 2015, and as of 2016 the age group of 70 years or older stands out (Chart 2). In the cases of severe dengue, the concentration of cases affects older individuals as it can be noted in Chart 3, a significant number of cases in the age group of 80 years or older.

HEALTH BRAZIL 2015/2016 – An analysis of health situation and the epidemic caused by Zika virus and other diseases transmitted by Aedes Aegypti
Secretariat of Health SurveillanceMINISTRY OF HEALTH OF BRAZIL
22
Chart 2 - Incidence of cases of dengue with warning signs, according to age group - Brazil, 2014-2016
80 years old or older
70 to 79 years
60 to 69 years
50 to 59 years
40 to 49 years
30 to 39 years
20 to 29 years
15 to 19 years
10 to 14 years
5 to 9 years
0 to 4 years
201620152014
14.0
12.0
10.0
8.0
6.0
4.0
2.0
0.0
Source: Sinan/SVS/MS.
Chart 3 - Incidence of cases of severe dengue, according to age group - Brazil, 2014-2016
80 years old or older
70 to 79 years
60 to 69 years
50 to 59 years
40 to 49 years
30 to 39 years
20 to 29 years
15 to 19 years
10 to 14 years
5 to 9 years
0 to 4 years
201620152014
6.0
5.0
4.0
3.0
2.0
1.0
0.0
Source: Sinan/SVS/MS.
A total of 2,300 deaths due to dengue were confirmed in Brazil between 2013 and the first half of 2016. The year of 2015 had the highest number of deaths with emphasis to the state of São Paulo, which corresponded to over 50% of deaths due to dengue that year. Regarding the age group, we can observe predominance of death in the population aged 50 to 79 years old, also with an important concentration in age groups of 20 to 49 years old and 80 years old or older (Chart 4).

23
Dengue: epidemiological situation in Brazil, 2013-2016
Chart 4 - Distribution of deaths due to dengue, according to age group - Brazil, 2013-2016ey:[
80 years or older
65 to 79 years
50 to 64 years
35 to 49 years
20 to 34 years
15 to 19 years
10 to 14 years
05 to 09 years
01 to 04 years
Less than 1 year
2016201520142013600
500
400
300
200
100
0
Source: Sinan/SVS/MS.
Discussion
Approximately 5 million cases of dengue were reported from 2013 to 2016 in Brazil. The total number of cases in this period exceeded the total number of cases registered over the last decade.5 The year of 2015 concentrated the highest number of cases and also the absolute number of deaths in the period. Serotypes DENV4 and DENV1 prevailed during the study period in the country. The ratio cases/hospitalization increased in 2014, when compared to 2013, indicating a lower need for hospitalization in recent years. Ho-wever, this ratio reduced in 2015 and 2016. A total of 2,300 deaths due to dengue were confirmed in Brazil.
The existence of 545 species of arboviruses, including Zika virus, chikungunya, yellow fever and Mayaro is known. The number of dengue cases and the notification of auto-chthonous cases of Zika virus and chikungunya (CHIKV) increased over the last decade, as of 2015 and 2014 respectively, which describes a complex epidemiological scenario.6
Clinical characteristics are similar between dengue, Zika and chikungunya diseases: non-specific acute febrile illness, arthralgia (joint pain) and rash, which may progress to meningoencephalitis. Thus, clinical similarities may cause changes in the notification of these arboviruses and data analysis should be performed with caution, especially in the periods directly preceding the description of CHIKV and Zika virus in the country. Possibly, the first cases were reported as dengue. In 2016, the characteristics of Zika virus and CHIKV are being better characterized and a change in notifications can be noted in the country’s epidemiological reports.

HEALTH BRAZIL 2015/2016 – An analysis of health situation and the epidemic caused by Zika virus and other diseases transmitted by Aedes Aegypti
Secretariat of Health SurveillanceMINISTRY OF HEALTH OF BRAZIL
24
Another factor corroborating the possibility of other arboviruses reported as dengue at Sinan are hospitalizations that do not follow the increasing trend of probable dengue cases in 2015, and especially in 2016, as noted in previous years.
Four dengue viral serotypes circulating in Brazil are currently described (DENV1, DENV2, DENV3 and DENV4) with variation of the circulating prevalence. The years of 2015 and 2014 had more notifications of DENV1 (64% and 82%, respectively) followed by DENV4 (32% and 16%, respectively). DENV1 (90%) prevails in 2016 (until epidemio-logical week 21) followed by DENV2 (6.4%) and DENV4 (2.6%); the increase in DENV2 notification should be highlighted.
The simultaneous circulation of dengue, chikungunya and Zika requires improved laboratory diagnosis and new perspective from the surveillance and assistance; dengue and chikungunya circulation already documented in other countries reinforces such need.10
An investigation of deaths in ten Brazilian municipalities concentrating more than half of deaths due to dengue was conducted in 2013. One hundred and six deaths were investigated using the dengue deaths investigations protocol, individual record of noti-fication/investigation, files, service records and interviews with family members. Out of the deaths investigated, 54 (51%) accounted for female with an average age of 52 (ranging from 48 days to 96 years), 52 (49%) deaths met the case definition already in the first medical service, and 41 (39%) cases were notified by epidemiological surveillance after the death. The final consideration of this investigation declared insufficiency of informa-tion recorded, such as failure to register basic vital signs; unsearched and/or unrecorded warning signs; lack of reference to dengue risk classification; additional examinations not requested or requested untimely and at the recommended intervals; hydration volumes often lower than those recommended by the manuals of the Ministry of Health; and clinical reassessments performed at intervals well above those recommended for patients who require hydration and at risk of developing to shock. Health services organization, proper clinical handling in the care of patients with suspicious of dengue, as well as follow-up recommended by the clinical protocols of the Ministry of Health may be associated with a reduction in dengue mortality in Brazil.11
The distribution and density of infestation of the mosquito vector Aedes aegypti (main vector in the urban environment) is an important health factor associated with basic sa-nitation issues, such as the existence of precarious housing, irregular garbage collection and water supply.7
Vector control may be directed to immature aquatic forms (larva and pupa) or adult mosquitoes by using different methods of assessment,8 but the difficulties to control Aedes is still the most important factor regarding public health.9
National and international meetings are being conducted to discuss the implementa-tion of vector control alternatives in Brazil at the National Program for Dengue Control, of the Ministry of Health (SVS/MS) in order to improve vector and epidemiological rates (http://portalsaude.saude.gov.br/images/pdf/2016/abril/05/2016-012----Relatorio--reuniao-especialistas-Aedes-publica—o.pdf).

25
Dengue: epidemiological situation in Brazil, 2013-2016
Besides implementing alternatives for the vector control, we also have vaccines against dengue: CYD-TDV or Dengvaxia® is a tetravalent attenuated (recombinant) dengue virus vaccine that has been registered in different countries, including Brazil, and is available in a single dose or in five doses. Manufacturer’s contraindications include non-application in pregnant women, during the phase of breastfeeding or in individuals with moderate fever or acute disease.1 Characteristics which are constantly present in the population of the endemic regions.
Efficacy studies for this vaccine show variations between the results of each country and group age. Results may indicate that the efficacy differs depending on the dengue serotypes circulating in each region. The importance of seroprevalence studies in order to make decisions related to the optimized vaccine use stands out. Thus, the importance of developing a dengue vaccine not only should be based on feasibility but also the opti-mization of its use, annual variation between serotypes and the epidemiological situation of the different Brazilian regions.6
In addition to this vaccine, other candidates are under clinical development phase, according to Dengue vaccine: WHO position paper - July 2016. WHO has quality, safety and efficacy recommendations for tetravalent attenuated vaccines, Access on: <http://who.int/biologicals/areas/vaccines/TRS_979_Annex_2.pdf?ua=1>.
Dengue remains a significant public health issue in Brazil even with the emergence of new viruses transmitted by Aedes aegypti, considering the disease burden and its major potential to evolve to death. The number of cases notified during the analyzed period exceeded the number of cases reported over the last decade. Surveillance should act more intensively during low transmission periods, in order to make early detections of changes to the disease’s standard and timely intervene for its control.

HEALTH BRAZIL 2015/2016 – An analysis of health situation and the epidemic caused by Zika virus and other diseases transmitted by Aedes Aegypti
Secretariat of Health SurveillanceMINISTRY OF HEALTH OF BRAZIL
26
References
1 WORLD HEALTH ORGANIZATION. Dengue control. ©2016. Access on: <http://www. who.int/entity/denguecontrol/en/index.html>. Visited on: July 5, 2016.
2 WORLD HEALTH ORGANIZATION. Special Programme for Research and Training in Tropical Diseases. Dengue: guidelines for diagnosis, treatment, prevention, and control. New ed. Geneva: TDR, World Health Organization, 2009.
3 BRASIL. Ministério da Saúde. Departamento de Informática do SUS. Arquivos de AIH: reduzida para tabulação do Sistema de Informações Hospitalares do SUS. Access on: <http://www2.datasus.gov.br/DATASUS/index.php?area=0203&id=6926>. Visited on: July 6, 2016.
4 BRASIL. Ministério da Saúde. Secretaria de Vigilância em Saúde. Departamento de Vigilância Epidemiológica. Guia de vigilância epidemiológica. 7. ed. Brasília, 2009. 816 p.
5 SIQUEIRA JÚNIOR, V. et al. Morbidade e mortalidade por dengue no Brasil: uma década em perspectiva. In: BRAZIL. Ministério da Saúde. Saúde Brasil 2009. Brasília, 2010. Cap. 9, p. 157-169.
6 RUNGE-RANZINGER, S. et al. Dengue disease surveillance: an updated systematic literature review. Tropical Medicine & International Health, v. 19, n. 9, p. 1116-1160, 2014. doi:<10.1111/tmi.12333>.
7 VALLE, D.; PIMENTA, D. N.; CUNHA, R. V. (Org.). Dengue: teorias e práticas. Rio de Janeiro: Fiocruz, 2015. 458 p.
8 BOWMAN, L. R.; DONEGAN, S.; MCCALL, P. J. Is Dengue Vector Control Deficient in Effectiveness or Evidence?: Systematic Review and Meta-analysis. PLoS Negl. Trop. Dis., v. 10, n. 3, e0004551, 2016. doi: 10.1371/journal.pntd.0004551.
9 HORSTICK, O. et al. Operational research in low-income countries. Lancet Infect Dis., v. 10, n. 6, p. 369-370, Jun. 2010. doi: 10.1016/S1473-3099(10)70094-3
10 FURUYA-KANAMORI, L. et al. Co-distribution and co-infection of chikungunya and dengue viruses. BMC Infectious Diseases, v. 16, p. 84, 2016. doi:<10.1186/s12879-016-1417-2>.
11 FIGUEIRÓ, A. C. et al. Óbito por dengue como evento sentinela para avaliação da qualidade da assistência: estudo de caso em dois municípios da Região Nordeste, Brasil, 2008. Cad. Saúde Pública, Rio de Janeiro, v. 27, n. 12, p. 2373-2385, dez. 2011.
Chikungunya fever in Brazil, 2015 and 20162

Table of Contents
Abstract 29Introduction 29Methods 30Results 30Discussion 36References 37

29
Chikungunya fever in Brazil, 2015 and 2016
Abstract
Introduction: Chikungunya virus (CHIKV) was identified in October, 2013 circula-ting autochthonically in the island of San Martin, in the Caribbean, and in a few months it had already reached several countries in South and North America. From the end of 2013 until May 2016, almost 2 million cases were reported in over 40 countries and territories in the Americas and the Caribbean. In Brazil, the autochthonous circulation began in September 2014, in the municipalities of Oiapoque/AP and Feira de Santana/BA. Transmission areas expanded in 2015 and now, 25 out of the 27 Brazilian federation units have autochthonous circulation.
Objective: This study has the purpose of describing chikungunya cases reported from 2015 to 2016 in Brazil, considering its spatial distribution, according to age group, sex and evolution. The descriptive analysis conducted used data from the Information System for Notifiable Diseases (Sinan), between 2015 and 2016.
Methods: Descriptive observational epidemiological study using chikungunya data from the Information System for Notifiable Diseases (Sinan), from 2015 to 2016. A descriptive analysis of cases was prepared according to sex, age, place of residence, final classification, confirmation criteria, onset of symptoms date and progress.
Results: The highest incidence rates were concentrated in both years (2015 and 2016) in the Northeast region, although 2016 presented a clear expansion of positive municipalities throughout the country and increased incidence rates of the disease for federation units of other regions, with emphasis for Tocantins and Rio de Janeiro. In terms of age, it is possible to note a gradient increase, thus reaching higher incidence rates in people aged 60 or older. In relation to the seasonality, an increase in the number of cases and deaths in February and March and maintenance of high transmission until May was noted from data analyzed from 2016. The update of data until the end of this year may confirm such a pattern in the future.
Conclusion: Results presented may help health managers identify the most vulnerable groups and regions to chikungunya fever and allow for baseline documentation for future disease monitoring in the Brazilian territory.
Keywords: Chikungunya fever. Incidence - Brazil. Incidence - Caribbean Region.
Introduction
The chikungunya virus (CHIKV) has a RNA genome and belongs to the genus Alphavirus--of the Togaviridae Family. So far, four CHIKV genotypes have been recognized, two of which were initially isolated in Africa: the East-Central-South-African - ECSA genotype, and the West African genotype; the third is the Asian genotype, and the most recently identified is the Indian Ocean Lineage1,2.

30
HEALTH BRAZIL 2015/2016 – An analysis of health situation and the epidemic caused by Zika virus and other diseases transmitted by Aedes Aegypti
Secretariat of Health SurveillanceMINISTRY OF HEALTH OF BRAZIL
CHIKV was isolated in 1952 from human blood samples collected during the epidemics in South Tanzania, a country located in the eastern region of the African continent. The intensity of joint pain felt by the patients made them walk characteristically and led the local population to call the disease chikungunya, which means “the one who bends”3 in Makonde, the dialect spoken in that region.
CHIKV can be transmitted by two different cycles: urban or wild. In the wild cycle, the virus circulates in an enzootic manner between species of mosquitoes Aedes (Ae. africanus, Ae. furcifer, among others) and non-human primates; in the urban environment CHIKV is transmitted by the Ae. aegypti and Ae. albopictus, anthropophilic vectors capable of maintaining the virus circulation between human-mosquito-human4.
In addition to the vector transmission, the vertical transmission of CHIKV was also observed, and this may occur from pregnant women presenting viremia during the intrapartum period. Neonates infected are usually born asymptomatic with clinical manifestations occurring two to three days later, and approximately 50% present severe clinical findings.5
During the epidemics, the attack rates are usually high which is a fact suggested from studies showing seroprevalence of up to 75%.6
CHIKV was identified in October, 2013 circulating autochthonically in the island of San Martin, in the Caribbean, and in a few months it had already reached several countries in South and North America.7 From the end of 2013 until May 2016, almost 2 million cases were reported in over 40 countries and territories in the Americas and the Caribbean.
In Brazil, the autochthonous circulation began in September 2014, in the municipalities of Oiapoque/AP and Feira de Santana/BA. Transmission areas expanded in 2015 and now, 25 out of the 27 federation units have autochthonous circulation.
Objectives
Describe chikungunya cases reported from 2015 to 2016 (epidemiological week 32 - EW 32) in Brazil, considering its spatial distribution, age group, sex and disease evolution.
Methods
This is a descriptive observational epidemiological study using chikungunya data from the Information System for Notifiable Diseases (Sinan), from 2015 to 2016.
The cases reported at Sinan, on both Net and Online versions, in 2016 were analyzed, and only those in the Net version from 2015 were used. Also, results found in dengue, Zika and chikungunya epidemiological reports from the Brazilian Ministry of Health were used.
Case definitions adopted by the Ministry of Health were used. The cases of chikun-gunya in the country are confirmed through the following laboratory techniques RT-PCR, viral isolation, serology Elisa IgM and IgG. Such techniques are guaranteed by a network of public health laboratories widely distributed throughout Brazil. As recommended in

31
Chikungunya fever in Brazil, 2015 and 2016
dengue surveillance, during non-epidemic periods, cases can be confirmed by clinical--epidemiological criteria, after confirmation of the first cases in the area by laboratory criteria. All reported cases may not be investigated during high transmission periods. Thus, cases with unknown or inconclusive final classification are summed to the confir-med cases and form the category of probable cases, being considered in the trend analysis and incidence coefficients.
Deaths must be confirmed using laboratory criteria and the source used was Sinan Net and Online.
Data analysis
A descriptive analysis was carried out for the reported cases according to sex, age, place of residence, final classification, confirmation criteria, onset of symptoms and evolution.
To calculate the chikungunya incidence coefficient, confirmed and probable cases were divided by the estimated population for each federation unit during the analyzed period.
Charts and tables were prepared from these analyses with the aid of the programs Tabwin and Excel.
Ethical considerations
Databases without identification of cases and detailed addresses were used in this study, except for municipality and federation unit of residence.
Results
In 2015, from EW 01 to EW 52, 38,332 probable cases of chikungunya fever were recor-ded (incidence rate of 18.7 cases/100 thousand inhab.) distributed in 696 municipalities, out of which 13,236 were confirmed.
In 2016, until the EW 32, 216,102 probable cases of chikungunya fever had been re-corded in the country (incidence rate of 105.7 cases/100 thousand inhab.) distributed in 2,248 municipalities, out of which 102,638 were confirmed.
When comparing to 2015, 2016 had about ten times more incidence of cases in the same period. In 2015, until EW 32, 20,598 probable cases of chikungunya fever were recorded with incidence rate of 10.1 cases/100 thousand inhab. (Table 1).
The analysis of incidence rate for probable cases (number of cases/100 thousand inhab.), per geographical regions, shows that the Northeast Region have the highest incidence rate: 335.6 cases/100 thousand inhab. Rio Grande do Norte (649.1 cases/100 thousand inhab.), Pernambuco (434.7 cases/100 thousand inhab.) and Alagoas (397.9 cases/100 thousand inhab.) stand out among the Federation units (Table 1). Although the disease

32
HEALTH BRAZIL 2015/2016 – An analysis of health situation and the epidemic caused by Zika virus and other diseases transmitted by Aedes Aegypti
Secretariat of Health SurveillanceMINISTRY OF HEALTH OF BRAZIL
concentration in both years in the Northeast is expressive, the disease spread to other regions in 2016 is clear, with emphasis for Tocantins and Rio de Janeiro.
Table 1 - Probable cases of chikungunya fever in 2015* and 2016** until Epidemiological Week 32, according to region, Federation Unit and Brazil
Region/Federation Unit Cases (n) incidence (/100 thousand inhab.)
2015* 2015** 2015 2016
North 990 5,064 5.7 ■■ 29.0
Rondônia 4 719 0.2 40.7
Acre 3 291 0.4 36.2
Amazonas 22 692 0.6 17.6
Roraima 22 74 4.4 14.6
Pará 61 1,620 0.7 19.8
Amapá 867 405 113.1 52.8
Tocantins 11 1,263 0.7 83.4
Northeast 19,283 189,814 34.1 ■■ 335.6
Maranhão 111 10,170 1.6 147.3
Piauí 317 2,463 9.9 76.9
Ceará 84 34,351 0.9 385.8
Rio Grande do Norte 2,708 22,344 78.7 649.1
Paraíba 9 14,947 0.2 376.3
Pernambuco 153 40,626 1.6 434.7
Alagoas 187 13,294 5.6 397.9
Sergipe 121 6,814 5.4 303.8
Bahia 15,593 44,805 102.6 294.7
Southeast 194 18,173 0.2 ■■ 21.2
Minas Gerais 17 1,273 0.1 6.1
Espírito Santo 4 276 0.1 7.0
Rio de Janeiro 19 13,058 0.1 78.9
São Paulo 154 3,566 0.3 8.0
South 31 1,541 0.1 ■■ 5.3
Paraná 17 946 0.2 8.5
Santa Catarina 7 394 0.1 1.8
Rio Grande do Sul*** 7 201 0.1 1.8
Midwest 100 1,510 0.6 ■■ 9.8
Mato Grosso do Sul 13 150 0.5 5.7
Mato Grosso 16 587 0.5 18.0
Goiás*** 38 263 0.6 4.0
Federal District 33 510 1.1 17.5
Brazil 20,598 216,102 10.1 105.7 Source: Sinan Net (updated on *3/22/2016; **8/17/2016). ***Federation Unit without autochthonous transmission.
Figures 1 and 2 show the spatial distribution of the incidence rate in Brazil’s map, as well as probable and confirmed cases of chikungunya fever, respectively, according to notification municipality, until the EW 32 of 2016. Again, the concentration of cases

33
Chikungunya fever in Brazil, 2015 and 2016
in the Northeast Region (Figure 1) and the clear expansion of positive municipalities throughout the country in 2016 (Figure 2) stands out.
Figure 1 - Distribution of incidence rate (/100 thousand inhab.) of chikungunya fever, according to notification municipality until the Epidemiological Week 32 - Brazil, 2016
300.0 —| 500.00.0 —| 300.0
1,000.0 —| 3,000.03,000.0 —| 9,188.4
500 —| 1,000.0
Municipality without records
Incidence
Source: Sinan (updated on 8/17/2016).
Figure 2 - Distribution of municipalities with reported, confirmed cases or without records of chikungunya fever cases, until the Epidemiological Week 32 - Brazil, 2016
ConfirmedNotifiedNo records
Source: Sinan (updated on 8/17/2016).

34
HEALTH BRAZIL 2015/2016 – An analysis of health situation and the epidemic caused by Zika virus and other diseases transmitted by Aedes Aegypti
Secretariat of Health SurveillanceMINISTRY OF HEALTH OF BRAZIL
Regarding the distribution of chikungunya fever incidence rate according to age group (Chart 1), it is possible to notice a gradual increase of such indicator in older individuals with emphasis for the highest incidences in the age group of 60 years old or older.
Chart 1 - Incidence rate (cases/100 thousand inhab.) of chikungunya fever according to age group, until the Epidemiological Week 32 - Brazil, 2016
70 to 79 years
60 to 69 years
50 to 59 years
40 to 49 years
30 to 39 years
20 to 29 years
15 to 19 years
10 to 14 years
5 to 9 years
0 to 4 years
180.0
160.0
140.0
120.0
100.0
80,0
60.0
40.0
20.0
0.0
Inci
denc
e ra
te /
100
thou
sand
inha
b.
Source: Sinan (updated on 8/17/2016).
Regarding the distribution of cases according to epidemiological weeks of the year (Chart 2), it is possible to observe an increase of cases over the last months of 2015, possibly indicating the historic trend of introduction and establishment of the disease transmission in the Brazilian territory other than a seasonal variation. A sudden increase in the number of cases occurred in 2016 (compared to the 2015 pattern) as of February (after EW 4) and maintenance of high numbers until May (EW 20). The decline of cases in the last months presented in the time series (June-August) may be partly artificial due to the constant updating of the information system.

35
Chikungunya fever in Brazil, 2015 and 2016
Chart 2 - Cases (reported and confirmed) of chikungunya fever according to Epidemiological Week of symptoms - Brazil, 2015-2016 (up to the Epidemiological Week 32)
2015
Epidemiological Week of Symptoms
2016
51494745434139373533312927252321191715131197531
14000
12000
10000
8000
6000
4000
2000
0
No.
of
case
s
Source: Sinan (updated on 8/17/2016).
Six deaths due to chikungunya fever were confirmed in 2015 in the following federation units: Bahia (three deaths), Sergipe (one death), São Paulo (one death), and Pernambuco (one death). The median age of the deaths in that year was 75 years old. Ninety-one de-aths due to chikungunya fever were confirmed in 2016 in the following federation units: Pernambuco (46 deaths), Rio Grande do Norte (19 deaths), Paraíba (seven deaths), Ceará (six deaths), Rio de Janeiro (four deaths), Bahia (four deaths), Maranhão (two deaths), Alagoas (two deaths) and São Paulo (one death). The median age of those deaths was 62 years old.
The distribution of deaths due to chikungunya fever (Chart 3) per month of occurrence follows the pattern described previously for cases reported in 2016. Most deaths confirmed until EW 32 of 2016 occurred between February and March. Even though deaths due to chikungunya are of compulsory notification (up to 24 hours from the knowledge of its occurrence) and mandatory investigation, this process may take a few weeks to months and this event may be underreported in more recent months of the series presented.

36
HEALTH BRAZIL 2015/2016 – An analysis of health situation and the epidemic caused by Zika virus and other diseases transmitted by Aedes Aegypti
Secretariat of Health SurveillanceMINISTRY OF HEALTH OF BRAZIL
Chart 3 - Distribution of deaths due to chikungunya fever in 2016*, up to Epidemiological Week 32, per month, Brazil
Month of occurrence
JulyJuneMayAprMarFebJan
35
30
25
20
15
10
5
0
Num
ber
of d
eath
s
Sources: SES and Sinan Net (updated on *8/17/2016).
Discussion
Chikungunya fever began its autochthonous transmission in Brazil in September 2014 and rapidly expanded its occurrence areas in the following years. Comparative data from the same period of 2015 and 2016 indicate an increase ten times higher in its incidence rates. Also, the disease territorial expansion first concentrated in the Northeast region and later present in 25 out of the 27 federation units with autochthonous circulation is clear. Results also show an important positive association with age and seasonality.
The identification of the first cases of chikungunya fever in Oiapoque/AP and almost simultaneously in Feira de Santana/BA, in 2014, and the further regional concentration in the Northeast, in 2015 and 2016, allows researchers to raise several hypotheses about the ways the disease entered the national territory.
Variations of chikungunya fever´s incidence rate with age may mean variations in vector exposure, but the increased incidence rates with increasing age should also re-flect an important detection and notification bias for the disease. This is because more symptomatic and persistent cases are more likely to be diagnosed and reported, and these are concentrated at more advanced ages. The fact that the disease chronification factors include age above 45 years and preexisting joint disorders strengthens such hypothesis.8

37
Chikungunya fever in Brazil, 2015 and 2016
In this sense, it is also worth noting the high median age of cases evolving for death (75 years old, in 2015, and 62 years old, in 2016).
Describing a seasonality pattern for cases and deaths due to chikungunya fever is hard because of its short historical series. However, a certain concentration of cases in February and March was observed in 2016, which can be associated to the higher vector density. This has already been noticed for dengue. Factors that may influence the differentiated chikungunya fever´s transmission pattern, when compared to dengue seasonality, is the virus geographical expansion within the national territory, the probable susceptibility of the population considering the recent circulation of the virus and the delay of notifications of chikungunya cases that makes epidemiological analysis difficult, especially in recent weeks, whose reduction may not reflect the actual situation.
Results presented may help health managers identify the most vulnerable groups and regions to chikungunya fever and allow for baseline documentation for future disease monitoring in the Brazilian territory.
References
1 POWERS, A. M. Chikungunya virus outbreak expansion and microevolutionary events affecting epidemiology and epidemic potential. Research and Reports in Tropical Medicine, v. 6, p. 11-19, 2015.
2 NUNES, M. R. T. et al. Emergence and potential for spread of Chikungunya virus in Brazil.3 BMC Med, v. 13, p. 102, 2015.4 ROBINSON, M. C.. An epidemic of virus disease in Southern Province, Tanganyika Territory, in
1952-53. I. Clinical features. Transaction of the Royal Society Tropical Medicine & Hygiene,5 v. 49, n. 1, p. 28-32, 1953.6 CAGLIOTI, C. et al. Chikungunya virus infection: an overview. New Microbiologica, v. 36, p.
211-227, 2013.7 GERARDIN, P. et al. Multidisciplinary prospective study of mother-to-child chikungunya virus
infections on the island of La Réunion. PLoS Medicine, v. 5, n. 3, e60, 2008.8 SERGON, K. et al. Seroprevalence of Chikungunya Virus (CHIKV) Infection on Lamu Island,
Kenya, October 2004. Am. J. Trop. Med. Hyg., v. 78, n. 2, p. 333-337, 2008.9 PAN AMERICAN HEALTH ORGANIZATION. Epidemiological alert: chikungunya fever.
Washington, D.C., 9 Dec. 2013.10 BRASIL. Ministério da Saúde. Secretaria de Vigilancia em Saúde. Departamento de Vigilância
das Doenças Transmissíveis. Febre de chikungunya: manejo clínico. Brasília, 2015.


Zika virus fever3

Table of Contents
Abstract 41Introduction 41Objectives 42Methods 42Results 43Discussion 48References 49

41
Zika virus fever
Abstract
Introduction: Zika circulation was laboratory confirmed in April 2015, in Brazil, through samples of patients in Camaçari/BA. Natal/RN, Sumaré and Campinas/SP, Maceió/AL and Belém/PA had laboratory confirmed cases in May of that same year. Its circulation is related to the increase in cases of Guillain-Barré syndrome and microcephaly.
Objectives: To describe the cases of Zika in Brazil reported in 2016 (until the Epidemio-logical Week 32 - EW 32), considering age group, sex and deaths.
Methods: The cases of Zika reported at the Information System for Notifiable Diseases (Sinan) on the Net version in 2016, and at the National Hospital Information System (SIH/SUS) for Guillain-Barré syndrome from 2015 to May 2016. A descriptive analysis was pre-pared for the reported and hospitalized cases.
Results: Approximately 200 thousand cases of Zika were reported in 2016 in Brazil. Three deaths due to Zika were confirmed and the cases of Guillain-Barré syndrome increased.
Conclusion: Complications from Zika virus infection are the main challenges for the public health in relation to urban arboviruses transmitted by Aedes. The integrated surveil-lance of these diseases must be improved in order to obtain timely detection and implement vector control measures that reduce the transmission. Referring specifically to Zika, clinical handling of acute cases, early stimulation of infants with congenital Zika virus syndrome and provide adequate treatment for neurological manifestations is essential.
Keywords: Zika virus. Guillain-Barré syndrome. Hospitalization - Brazil.
Introduction
Zika virus described in 1947, belongs to the genus Flavivírus, Flaviviridae Family and has the lineages of East and West Africa and the Asian regions, which spread throughout the Americas in 2015.1 The virus was identified during a research project conducted with Rhesus monkeys used as sentinels for yellow fever detection in the Zika Forest in Uganda. The virus name was derived from it.1 Zika transmission is mainly vectorial, by Aedes aegypti mosquitoes; however, there are evidences of sexual and blood transfusion transmission.1,2
The disease pattern is characterized by mild fever (less than 38.5oC) not reported in all cases, lasting about one to two days, followed by rash on the first or second day, mild muscle pain, mild to moderate joint pain, mild edema in the joints is frequently noted, pruritus and non-purulent conjunctivitis in most cases.3
Signs and symptoms caused by the Zika virus, compared to other exanthematic di-seases (dengue, chikungunya and measles), include more pronounced exanthematous and conjunctival hyperemia with no significant change in leukocyte and platelet counts.

42
HEALTH BRAZIL 2015/2016 – An analysis of health situation and the epidemic caused by Zika virus and other diseases transmitted by Aedes Aegypti
Secretariat of Health SurveillanceMINISTRY OF HEALTH OF BRAZIL
The signs and symptoms usually disappear after three to seven days. However, some patients may remain with arthralgia for approximately one month.4
After the 2007 outbreak in the island of Yap, Micronesia (six decades after the virus discovery), the international public health understood the potential of this new agent with 75% of the population infected by the virus.1,2
Until the French Polynesia epidemic in 2013 and 2014, the only known complication was the observation of increased cases of neurological syndrome; some of these cases were recorded in French Polynesia (2013). In 2013, the incidence of Guillain-Barré syndrome (GBS) was 20 times above the historic series of French Polynesia.
The first events related to Zika virus in Brazil were detected in February, 2015 by Rede Cievs Nordeste (Northeast Center for Strategic Information on Health Surveillance), which reported outbreaks of the pruritic exanthematous disease to be clarified.5 Zika circula-tion was confirmed by laboratory in April 20156, in Brazil, with samples of patients from Camaçari/BA. Natal/RN, Sumaré and Campinas/SP, Maceió/AL and Belém/PA had cases confirmed by laboratory in May of that same year.
Hospitalizations for GBS in Brazil increased approximately 15% after June, just as what had happened in French Polynesia. However, severe and atypical forms are rare. When they happen, they can exceptionally evolve to death, as identified in November 2015 for the first time in history.7
Pernambuco presented an increase in microcephaly cases after August 2015, which was confirmed in October after epidemiology field investigations.1,8 The relationship between microcephaly and Zika was confirmed in samples of amniotic fluid afterwards.9
Zika virus was being transmitted autochthonously in all Brazilian Federation Units in 2016.
Objectives
To describe the cases of Zika in Brazil reported in 2016 (until the Epidemiological Week 32 - EW 32), considering spatial distribution, age group, sex and evolution.
Methods
This is a descriptive observational epidemiological study using Zika data from the Information System for Notifiable Diseases (Sinan) from 2016 onwards, when the disease became of compulsory notification.10 A sentinel surveillance strategy was established in the first year of transmission, and data were limited to autochthony detection.
Also, results from dengue, Zika and chikungunya epidemiological reports by the Ministry of Health were used.

43
Zika virus fever
The cases reported at Sinan on the Net version in 2016, and at the National Hospital Information System (SIH/SUS) for Guillain-Barré syndrome from 2015 to 2016 were analyzed.
In Brazil, Zika cases are confirmed through the following laboratory techniques: RT--PCR and in-house serology Elisa IgM. Such techniques are guaranteed by a network of public health laboratories widely distributed throughout Brazil. The laboratory diagnosis is recommended for the first cases of an area without transmission, symptomatic pregnant women, cases with neurological manifestations, newborns with suspected Zika congenital syndrome and deaths. The other cases should be confirmed by clinical-epidemiological criteria, after confirmation of the first cases in the area by laboratory criteria.
Deaths must be confirmed using laboratory criteria and the source used for analysis was Sinan Net.
Data analysis
A descriptive analysis was prepared for the reported cases according to sex, age, place of residence, final classification, confirmation criteria, onset of symptoms, and evolution.
SIH/SUS data were used to analyze the increased number of GBS cases per federation unit and Brazil.
To calculate the Zika incidence coefficient, confirmed and possible cases divided by the estimated population for each federation unit during the analyzed period were used.
Charts and tables were prepared from these analyses with the aid of the programs Tabwin and Excel.
Ethical considerations
Databases without identification of cases and detailed addresses were used in this study, except for municipality and federation unit of residence.
Results
In 2016, until EW 32, 196,976 probable cases of Zika virus fever were recorded in the country (incidence rate of 96.3 cases/100 thousand inhab.) distributed in 2,277 municipalities; 101,851 cases were confirmed. The analysis of incidence rate for probable cases (/100 thousand inhab.), per geographical region, shows that the Midwest region have the highest incidence rate: 188.1 cases/100 thousand inhab. Mato Grosso (652.9 cases/100 thousand inhab.), Rio de Janeiro (363.6 cases/100 thousand inhab.) and Bahia (328.2 cases/100 thousand inhab.) stand out among the Federation units (Table 1).

44
HEALTH BRAZIL 2015/2016 – An analysis of health situation and the epidemic caused by Zika virus and other diseases transmitted by Aedes Aegypti
Secretariat of Health SurveillanceMINISTRY OF HEALTH OF BRAZIL
Table 1 - Incidence rate of Zika virus fever, per region and Federation Unit up to the Epidemiological Week 32 - Brazil, 2016
Region/Federation Unit Cases (n) Incidence (/100 thousand inhab.)
North 12,017 68.8
Rondônia 1,060 59.9
Acre 156 19.4
Amazonas 4,407 111.9
Roraima 124 24.5
Pará 3,574 43.7
Amapá 287 37.4
Tocantins 2,409 159.0
Northeast 72,222 127.7
Maranhão 3,728 54.0
Piauí 337 10.5
Ceará 4,217 47.4
Rio Grande do Norte 3,490 101.4
Paraíba 3,325 83.7
Pernambuco 435 4.7
Alagoas 6,398 191.5
Sergipe 394 17.6
Bahia 49,898 328.2
Southeast 82,228 95.9
Minas Gerais 14,324 68.6
Espírito Santo 2,254 57.4
Rio de Janeiro 60,176 363.6
São Paulo 5,474 12.3
South 1,469 5.0
Paraná 1,121 10.0
Santa Catarina 86 1.3
Rio Grande do Sul 262 2.3
Midwest 29,040 188.1
Mato Grosso do Sul 1,024 38.6
Mato Grosso 21,319 652.9
Goiás 6,361 96.2
Federal District 336 11.5
Brazil 196,979 96.3
Source: Sinan Net (updated on 8/17/2016).
Figures 1 and 2 show the distribution of the incidence rate in Brazil’s map, as well as suspected and confirmed Zika virus fever cases, respectively, according to notification municipality and up to EW 32 of 2016.
The highest incidence rates per municipality are in the states of Mato Grosso and Bahia, which may suggest that many municipalities are still vulnerable for high transmission in the rest of the states, except in the other municipalities of the remaining eight Northeast states whose circulation was intense in 2015, and in 2016 suffered a major chikungunya transmission.

45
Zika virus fever
There are confirmed cases of Zika in most municipalities of the country, including the states of Santa Catarina and Rio Grande do Sul, whose transmission of dengue (which has the same vector) is uncommon.
Figure 1 - Incidence rate (/100 thousand inhab.) of Zika virus fever per municipality of notification up to the Epidemiological Week 32 - Brazil, 2016
300.0 —| 500.00.0 —| 300.0
1,000.0 —| 3,000.03,000.0 —| 16,585.4
500 —| 1,000.0
Municipality without records
Incidence
Source: Sinan Net (updated on 8/17/2016).
Figure 2 - Distribution of reported and confirmed cases of Zika virus fever per Municipality of notification up to the Epidemiological Week 32 - Brazil, 2016
ConfirmedNotifiedNo records
Source: Sinan Net (updated on 8/17/2016).

46
HEALTH BRAZIL 2015/2016 – An analysis of health situation and the epidemic caused by Zika virus and other diseases transmitted by Aedes Aegypti
Secretariat of Health SurveillanceMINISTRY OF HEALTH OF BRAZIL
Regarding the time distribution of cases, Zika curve is similar to dengue curve with an important transmission between epidemiological weeks 3 to 15 of 2016 (Chart 1).
Chart 1 - Distribution of reported and confirmed cases of Zika virus fever per Epidemiological Week of symptoms onset up to the Epidemiological Week 32 - Brazil, 2016
32
Epidemiological weeks
31302928272625242322212019181716151413121110987654321
16000
14000
12000
10000
8000
6000
4000
2000
0
No.
of
case
s
Source: Sinan Net (updated on 8/17/2016).
The predominant age group of Zika cases incidence rate was 20 to 39 years old, also with significant rate in the age group under or equal to 4 years old (Chart 2).
Chart 2 - Distribution of incidence rate of Zika virus fever per age group up to the Epidemiological Week 32 - Brazil, 2016
80 years and above
70 to 79 years old
60 to 69 years old
50 to 59 years old
40 to 49 years old
30 to 39 years old
20 to 29 years old
15 to 19 years old
10 to 14 years old
5 to 9 years old
0 to 4 years old
140.0
120.0
100.0
80.0
60.0
40.0
20.0
0.0
Inci
denc
e ra
te /
100
thou
sand
inha
b.
Source: Sinan Net (updated on 8/17/2016).
The distribution of reported cases per sex shows predominance of the female sex, with 67% of probable cases.

47
Zika virus fever
Three deaths due to Zika virus were confirmed by laboratory tests in 2016: two in Rio de Janeiro and one in Espírito Santo. Three deaths due to the disease were also confirmed by laboratory tests in 2015: in the states of Maranhão, Pará and Rio Grande do Norte. The median age of the deaths due to Zika virus fever was 20 years old.
Hospitalizations for Guillain-Barré syndrome (GBS) increased by 34% in the country in 2015 (1,953 hospitalizations) when compared to 2014 (1,455 hospitalizations). When January to May data are compared (period available for 2016), the male sex prevail in both years (Chart 3). All age groups presented an increase in 2016, except the 35 to 39 years age group; the highest incidence rates are in the 55 to 74 years old age group (Chart 4). SIH/SUS does not show the infectious agent involved in GBS cases, which limits inferences that the increase is only related to the circulation of the Zika virus in Brazil.
Chart 3 - Number of hospitalizations for Guillain-Barré syndrome, according to sex - Brazil, January to May 2015-2016
20162015
FemaleMale600
500
400
300
200
100
0
Num
ber
of c
ases
Source: SIH/SUS (updated on 7/4/2016).

48
HEALTH BRAZIL 2015/2016 – An analysis of health situation and the epidemic caused by Zika virus and other diseases transmitted by Aedes Aegypti
Secretariat of Health SurveillanceMINISTRY OF HEALTH OF BRAZIL
Chart 4 - Incidence rate (hospitalizations per 100 thousand inhabitants) for Guillain-Barré syndrome, according to age group - Brazil, January to May 2015-2016
80y+75-79y
70-74y65-69y
60-64y55-59y
50-54y45-49y
40-44y35-39y
30-34y25-29y
20-24y15-19y
10-14y5-9y
1-4y<1y
201620151.20
1.00
0.80
0.60
0.40
0.20
0.00
Inci
denc
e ra
te p
er 1
00 t
hous
and
inha
b.
Source: SIH/SUS (updated on 7/4/2016).
Complications of the Zika infection, especially the congenital Zika virus syndrome, are discussed in a specific chapter herein.
Discussion
Brazil had approximately 200 thousand cases of Zika in 2016 with higher incidence rates in the Midwest and Northeast regions. Although Zika virus had been identified by laboratory for the first time in April, 2015,6 evidences based on molecular techniques and retrospective research show that it was introduced in Brazil between 2013 and 2014 and that it was possibly related to the increased international transit of people and goods due to the mass events that took place in the country.1,11 In addition, microcephaly data (discussed in another chapter) suggest that the Northeast region had an intense circulation since 2014/2015, a period in which the disease did not have compulsory notification or was unknown.
The incidence rate was higher in the age groups from 20 to 39 years old, which possi-bly reflects an exposure to the vector, and is similar to the distribution noted for dengue. High rates in the age group under 5 years old should also be highlighted, possibly due to the clinical signs and symptoms (pruritic rash), which would increase the possibility for parents to reach out health services and hence the possibility of diagnosis and notification of cases.
Zika seasonality is similar to dengue seasonality. They prevail on the first half of the year. The simultaneous circulation of dengue, Zika and chikungunya increases the pos-sibility of having diagnostic error, thus reinforcing the need for syndromic approach for diagnosis and control measures.
conclusão

49
Zika virus fever
Vectorial control measures are the same for Zika virus, dengue and chikungunya as they are transmitted by Aedes mosquitoes and form the most significant arboviruses groups for the country’s public health.1
A Protocol of Neurological Manifestation with History of previous Viral Infection Surveillance was elaborated since an increase in GBS cases was noted.12 This surveillance proposal is being restructured and predicts an information system capable of capturing the-se manifestations, including their etiology and financial aid to maintain sentinel services.
Complications from Zika virus infection are the main challenges for Public Health in relation to urban arboviruses transmitted by Aedes and are another extremely important example to improve the structure of sanitation in municipalities.
The integrated surveillance of these diseases must be improved in order to obtain ti-mely detection and implement vector control measures that can reduce the transmission. Referring specifically to Zika, clinical handling of acute cases, early stimulation of infants with congenital Zika virus syndrome and provide adequate treatment of neurological manifestations is essential.
References
1 MUSSO, D.; GUBLER, D. J. Zika virus. Clin. Microbiol. Rev., v. 29, n. 3, p. 487-524, 2016. doi:<10.1128/CMR.00072-15>.
2 WORLD HEALTH ORGANIZATION. The history of Zika Virus. Geneva, 2016. Access on: <http://www.who.int/emergencies/zika-virus/history/en/>. Accesss on: July 10, 2016.
3 CARDOSO C. W et al. Outbreak of Exanthematous Illness associated with Zika, Chikungunya, and Dengue viruses, Salvador, Brazil. Emerg. Infect Dis., v. 21, n. 12, p. 2274-2276, 2015. doi: <10.3201/eid2112.151167>.
4 EUROPEAN CENTRE FOR DISEASE PREVENTION AND CONTROL. Rapid Risk Assessment: Zika Virus Infection Outbreak, French Polynesia. Stockholm, 2014.
5 HEUKELBACH, J. et al. Zika virus outbreak in Brazil. J. Infect. Dev .Ctries., v. 10, n. 2, p. 116-120, 2016. doi: <10.3855/jidc.8217>.
6 CAMPOS, G.S.; BANDEIRA, A.C.; SARDI, S. I. Zika virus outbreak, Bahia, Brazil. Emerg. Infect Dis., v. 21, n. 10, p. 1885-1886, 2015. doi: <10.32301/eid2110.150847>.
7 BRASIL. Ministério da Saúde. Ministério da Saúde confirma relação entre vírus Zika e microcefalia. Brasília, 28 nov. 2015. Nota à imprensa. Access on: <http://portalsaude.saude.gov. br/mdex.php/cidadao/prmcipal/agencia-saude/21014-ministerio-da-saude-confirma-relacao- entre-virus-zika-e-microcefalia>. Visited on: December 6, 2015.
8 TEIXEIRA, M. G. et al. The epidemic of Zika virus-related microcephaly in Brazil: detection, control, etiology, and future scenarios. Am. J. Public Health, v. 106, n. 4, p. 601-605, 2016. doi: <10.2105/AJPH.2016.303113>.
9 CALVET, G. et al. Detection and sequencing of Zika virus from amniotic fluid of fetuses with microcephaly in Brazil: a case study. Lancet, v. 16, Jun. 2016.

50
HEALTH BRAZIL 2015/2016 – An analysis of health situation and the epidemic caused by Zika virus and other diseases transmitted by Aedes Aegypti
Secretariat of Health SurveillanceMINISTRY OF HEALTH OF BRAZIL
10 BRASIL. Ministério da Saúde. Portaria 204, de 17 de fevereiro de 2016. Define a Lista Nacional de Notificação Compulsória de doenças, agravos e eventos de saúde pública nos serviços de saúde públicos e privados em todo o território nacional, nos termos do anexo, e dá outras providências. Access on: <http://pesquisa.in.gov.br/imprensa/jsp/visualiza/index.jsp?jornal = 1&pagina=23&data=18/02/2016>. Visited on: September 12, 2016.
11 FARIA, N. R. et al. Zika virus in the Americas: Early epidemiological and genetic findings. Science., v. 5036, p. 1-9, Mar. 2016. doi: <10.1126/science.aaf5036>.
12 BRASIL. Ministério da Saúde. Protocolo de vigilância dos casos de manifestações neurológicas com histórico de Infecção Viral Prévia. 2015. Access on: <http://portalsaude.saude.gov.br/images/pdf/2016/fevereiro/05/Protocolo-de-vigilancia-de- manifestacoes-neurologicas.pdf>. Visited on: September 12, 2016.

Microcephaly in Brazil: prevalence and characterization of cases from the Information System on Live Births (Sinasc), 2000-2015i
4
iThis chapter is a reprint of the original article published in the Epidemiology and Health Services – journal of the Brazilian National Health System. Quota-tions should make reference to the original publication: SOUZA, M. F. M. et al. Microcefalia no Brasil: prevalência e caracterização dos casos a partir do Sistema de Informações sobre Nascidos Vivos (Sinasc), 2000-2015. revista Epidemiologia e Serviços de Saúde, Brasília, v. 25, n. 4, p. 701-712, out./dez. 2016.

Table of Contents
Abstract 53Introduction 53Methods 54Results 55Discussion 61References 64

53
Microcephaly in Brazil: prevalence and characterization of cases from the Information System on Live Births (Sinasc), 2000-2015
Abstract
Objective: to describe the prevalence coefficients and characterize cases of micro-cephaly at birth in Brazil from 2000-2015.
Methods: this is a descriptive study with data from the Information System on Live Births (Sinasc). The coefficients were calculated by region and characteristics of mothers and live births (LB).
Results: the annual average number of microcephaly cases was 164 for the period 2000-2014, whilst in 2015, 1,608 cases were registered (54.6 cases per 100 thousand LB). Higher coefficients were observed among preterm babies (81.7; 95%CI 72.3;92.2), born from black-skinned (70.9; 95%CI 58.5;85.9) or to brown-skinned (71.5; 95%CI67.4;75.8) women, to women aged ≤19 (70.3; 95%CI 63.5;77.8) or ≥40 (62.1; 95%CI 46.6;82.6), with ≤3 years of study (73.4; 95%CI 58.2;92.4) and residents in the Northeast region (138.7; 95%CI 130.9;147.0).
Conclusion: the high number of microcephaly cases in 2015 reinforces the importance of Sinasc and the need to improve the surveillance of congenital anomalies.
Key words: Microcephaly. Congenital Anomaly. Live Birth. Epidemiology, Descrip-tive. Brazil.
Introduction
The congenital anomalies, including microcephaly, have a complex and multifacto-rial etiology, and can be caused by chromosomal anomalies, exposure to environmental teratogens, metabolic disorders, and also by maternal diseases during pregnancy. They can be primary, if they are present at birth, or secondary, if they are developed after birth. The primary microcephaly is characterized by the head circumference two standard de-viations (SD) below the average specific for the sex and gestational age. Although being a practical definition, defining microcephaly from the head circumference may lead to the inclusion of brains with normal development.1,2
In Brazil, data on live births are collected at birth, by issuing the Certificate of Live Birth and recording the information on the Information System on Live Births (Sinasc) of the Ministry of Health. Sinasc’s coverage and data quality have been improved since its implementation, in 1990.3,4 For the years of 2010 and 2013, the coverage was estimated in 95% and 96%, respectively.5,6 The information recorded on this system is essential to planning and assessing the actions in health directed to pregnant women, to childbirth and to the newborn.7
All the congenital anomalies diagnosed by the doctor must be described in the Certi-ficate of Live Birth, without any hierarchy or assumptions to group them into syndromes, and there is no need to codify them.10 The better the description is, the better will be the codification and information production work, which is highly useful to health sur-veillance for monitoring the frequency and time trends of different types of anomalies.
54
HEALTH BRAZIL 2015/2016 – An analysis of health situation and the epidemic caused by Zika virus and other diseases transmitted by Aedes Aegypti
Secretariat of Health SurveillanceMINISTRY OF HEALTH OF BRAZIL
The information generated also helps on the identification of elements that are part of the causal chain of the congenital anomalies and on the assessment of the primary prevention efforts during prenatal care, and also on pre-conception care.8,9,10
On Sinasc, primary microcephaly is defined by the head circumference below 3 SD of the development curves for the given gestational age and sex.2,10,11 This definition corre-sponds to a head circumference from 28.85 to 30.99cm for female live births (gestational age from 259 to 293 days, or approximately 37 to 41 weeks) and from 29.12 to 31.52cm for male live births at term birth.12
In Brazil, in the period 2000-2014, the number of live births with microcephaly pre-sented stability. However, from October 2015, an unexpected raise in the number of cases was observed, mainly in Pernambuco State, which is located in the Northeast region of the country.13,14 Later, on February 1, 2016, the International Health Regulations Emer-gency Committee declared that the amount of microcephaly cases and other neurological disorders reported in Brazil, after the occurrence of a similar case in French Polynesia in 2014, constituted a Public Health Emergency of International Concern (PHEIC), due to the probable association to Zika virus.15
This situation motivated the conduction of this study, which aims to describe the prevalence rates and characterize cases of microcephaly at birth in Brazil, in the period 2000-2015.
Methods
This descriptive study used secondary data from Sinasc, concerning the period from 2000 to 2015. Data from 2015, updated on February 12, 2016, were still preliminary when this study was conducted.
Sinasc is fed by data collected through the Certificate of Live Birth, in which there is a field to describe congenital anomalies - simple or multiple - identified at the child-birth. Sinasc’s records which were included in this study belonged to live births with microcephaly in combination or not with other(s) congenital anomaly(ies).
These anomalies are identified according to the following codes of the 10th Revision of the International Statistical Classification of Diseases and Related Health Problems - ICD-1016: congenital malformations of the nervous system, (Q00 to Q07 - Q02 refers to microcephaly); congenital malformations of eye, ear, face and neck (Q10 to Q18); congenital malformations of the circulatory system (Q20 to Q28); congenital malforma-tions of the respiratory system (Q30 to Q34); cleft lip and cleft palate (Q35 to Q37); other congenital malformations of the digestive system (Q38 to Q45); congenital malformations of genital organs (Q50 a Q56); congenital malformations of the urinary system (Q60 to Q64); congenital malformations and deformations of the musculoskeletal system (Q65 to Q79); other congenital malformations (Q80 to Q89); chromosomal anomalies not elsewhere classified (Q90 to Q99); haemangioma and lymphangioma of any site (D18).

55
Microcephaly in Brazil: prevalence and characterization of cases from the Information System on Live Births (Sinasc), 2000-2015
The cases of microcephaly at birth, in 2015, were described according to the follow-ing groups of variables: (i) mother’s geographic place of residence: state, region (North, Northeast, Southeast, South, Midwest) and population size of the municipality (<20 thousand inhabitants; 20 to 50 thousand; >50 to 100 thousand; >100 to 500 thousand; >500 thousand); (ii) mother’s characteristics: age group (up to 19 years old; 20-24; 25-29; 30-34; 35-39; ≥40), education level (0-3 years of schooling; 4-7; 8-11; ≥12), ethnicity/skin color (white; black; brown; Asian; indigenous), marital status (single, married, legally separated/divorced/widowed; in cohabitation); (iii) pregnancy and childbirth: number of prenatal care appointments (none; 1-3; 4-5, ≥6), trimester of the first prenatal care ap-pointment (1st; 2nd; 3rd), place of childbirth (health care facility; other), type of childbirth (vaginal; cesarean section), weeks of pregnancy (<37, preterm; 37, 38, 39-41, at term birth; ≥42, postterm), type of pregnancy (single; multiple); (iv) characteristics of the newborn: month of birth, sex (male, female); birth weight (<2,500g, low weight; ≥2,500g, appropri-ate weight), presence of other congenital malformations besides microcephaly (yes; no), Apgar score at 1st and 5th minutes after birth (0-3; 4-7; 8-10).
For the period from 2000 to 2015, annual coefficients of microcephaly prevalence were estimated for Brazil and regions, and the time series were described. The numerator and denominator of the prevalence coefficient of microcephaly at birth (per 100 thousand live births) were, respectively, the number of live births with microcephaly and the total of live births, according to the categories of the aforementioned variables. Prevalence ra-tios (PR) and 95% confidence intervals (95%CI) were calculated. The reference category to calculate the PR was the one with the lowest prevalence coefficient. The category of ignored values was excluded from all the variables due to its small frequency and was presented in the table’s foot.
The analyses were performed with the statistics packages IBM SPSS, Statistical Analysis System (SAS), Tableau Public and OpenEpi. In accordance with the ethics in research, the databases analyzed in this study did not include any variable that allowed the identifica-tion of the individuals involved - such as name, mother’s name and address. Therefore, it was not necessary to submit this study to the Ethics Research Committee.
Results
In the period from 2000 to 2014, 2,464 live births with microcephaly were registered in Brazil, with an annual average of 164 (standard deviation = 15). In 2015, the number of cases increased in 9 times in relation to the average, with a total of 1,608 cases. In 2015, 71% of the live births with microcephaly (n=1,142) were born to mothers resident in the Northeast region (Table 1). This time-space concentration also reflected in the prevalence rate of microcephaly at birth for the year of 2015 (Charts 1A, 1B and 1C).
The time evolution of the prevalence rate of microcephaly in Brazil, according to mon-th of birth, showed a growth that started in October 2015 (Chart 1B). In that year, most of the prevalence rates of microcephaly at birth were observed in the following states of

56
HEALTH BRAZIL 2015/2016 – An analysis of health situation and the epidemic caused by Zika virus and other diseases transmitted by Aedes Aegypti
Secretariat of Health SurveillanceMINISTRY OF HEALTH OF BRAZIL
the Northeast: Pernambuco, Sergipe and Paraíba (Chart 1C). For the month of August, a slight growth on the prevalence rate was observed among live births to mothers resident in Mato Grosso State (data not presented).
Table 1 – Absolute frequency of live births with microcephaly, according to year of birth and mother’s region of residence; Brazil, 2000 to 2015a
RegionYear
2000 2001 2002 2003 2004 2005 2006 2007 2008 2009 2010 2011 2012 2013 2014 2015
North 15 11 12 15 22 14 18 4 21 12 14 9 19 19 14 72
Northeast 43 47 52 51 43 46 40 40 48 32 47 38 51 50 45 1,142
Southeast 65 66 71 66 59 68 68 64 60 68 62 76 84 85 71 295
South 28 31 28 23 29 18 20 15 12 20 29 16 28 21 20 27
Midwest 24 15 15 17 20 18 9 11 9 9 11 15 8 8 12 72
Brazil 175 170 178 172 173 164 155 134 150 141 163 154 190 183 162 1,608
Source: MS/SVS/CGIAE/Sinasc, 2015.aNumber of live births in 2015 = 2,951,136 (partial data updated on 12/02/2016).
Chart 1 – Prevalence coefficient of microcephaly at birth (per 100 thousand live births), according to the mother’s region of residence, 2000-2015 (A); month of childbirth in 2015 (B) and state of residence in the Brazilian Northeast region in 2015* (C)
BrazilMidwestSouthSoutheastNortheastNorth
2015201420132012201120102009200820072006200520042003200220012000
140
120
100
80
60
40
20
0
Pre
vale
nce
(x10
0 th
ousa
nd)
A
to be continued

57
Microcephaly in Brazil: prevalence and characterization of cases from the Information System on Live Births (Sinasc), 2000-2015
Month
DecNovOctSepAugJulJunMayAprMarFebJan
288.9
253.4
83.9
17.528.7
8.85.66.75.04.36.77.5
300
250
200
150
100
50
0
Pre
vale
nce
(x10
0 th
ousa
nd)
B
Kilometers
150010005000
Brazil
Kilometers
3000200010000
Northeast
North
Midwest
Southeast
South Bahia 118,1
Sergipe 227,2
Alagoas 54,8
Pernambuco 279,2
Paraíba 181,7
Rio Grande do Norte 148,8
Ceará 57,3
Piauí 123,2
Maranhão 82,3C
Northeast
Source: MS/SVS/CGIAE/Sinasc, 2015.* Number of live births in 2015 = 2,951,136 (partial data updated on 2/12/2016).
In 2015, the prevalence coefficient of microcephaly at birth in Brazil was of 54.6 cases per 100 thousand live births. The region with the highest rate was the Northeast (139 cases per 100 thousand LB), which corresponds to 28 times the average of the prevalence for this region in the period from 2000 to 2014 (5.0 cases per 100 thousand LB). The second highest prevalence coefficient was observed in the Midwest (31.0 cases per 100 thousand LB), almost five times smaller than the one found in the Northeast (Table 2).
According to the population size of the mother’s municipality of residence, the pre-valence coefficients of microcephaly at birth were similar among the municipalities with up to 500 thousand inhabitants. However, a higher coefficient was observed in munici-palities with over 500 thousand inhabitants (Table 2). This comparison used as reference the population size category of 100 to 500 thousand inhabitants.
conclusion

58
HEALTH BRAZIL 2015/2016 – An analysis of health situation and the epidemic caused by Zika virus and other diseases transmitted by Aedes Aegypti
Secretariat of Health SurveillanceMINISTRY OF HEALTH OF BRAZIL
With regard to maternal sociodemographic characteristics (Table 2), the prevalence coefficient of microcephaly at birth was higher among children to mothers aged up to 24 or over 40 years old, without higher education (less than 11 years of schooling), with black or brown skin color and who self-declared single or in cohabitation. A decreasing trend of the prevalence of microcephaly at birth was observed as the mother’s education level increased. Mothers with up to 3 years of schooling presented a prevalence ratio 2.4 times comparing to mothers with 12 years or over of schooling. Most of the mothers to children with microcephaly at birth did not have higher education (87%), and there was a predominance of 8 to 11 years of schooling for all age groups.
Table 2 – Frequency of live births and prevalence coefficient of microcephaly at birth (per 100 thousand live births), according to sociodemographic characteristics, region and population size of the mothers’ municipality of residence; Brazil, 2015a
Variable
Live birth with
microcephalyPrevalence
coefficientb 95%CIc Prevalence ratio 95%CIc
N %
Age group (in years)
Up to 19 373 23 70.3 63.5 - 77.8 1.67 1.42 - 1.95
20 to 24 443 28 60.3 54.9 - 66.1 1.44 1.23 - 1.68
25 to 29 349 22 49.0 44.1 - 54.4 1.17 0.99 - 1.37
30 to 34 247 15 42.0 37.0 - 47.5 1 -
35 to 39 149 9 49.0 41.7 - 57.5 1.17 0.95 - 1.43
40 and over 47 3 62.1 46.6 - 82.6 1.48 1.08 - 2.02
Education level (years of schooling)
0 to 3 72 4 73.4 58.2 - 92.4 2.35 1.78 - 3.09
4 to 7 371 23 67.1 60.6 - 74.3 2.15 1.79 - 2.57
8 to 11 967 60 56.4 53.0 - 60.1 1.81 1.53 - 2.13
12 and over 169 11 31.2 26.9 - 36.3 1 -
Ethnicity/skin color
White 299 19 28.6 25.5 - 32.0 1 -
Dark-skinned d 1,232 77 71.9 68.0 - 76.0 2.51 2.20 - 2.83
Black 104 6 70.9 58.5 - 85.9 2.48 1.98 - 3.10
Brown 1,128 70 71.5 67.4 - 75.8 2.5 2.20 - 2.84
Asian 3 0 28.3 9.1 - 87.6 0.99 0.32 - 3.08
Indigenous 10 1 50.4 27.1 - 93.7 1.77 0.94 - 3.31
Marital status
Single 760 47 62.3 58.1 - 66.9 1.48 1.32 - 1.67
Married 408 25 42.0 38.1 - 46.3 1 -
Legally separated /divorced/widowed 15 1 40.3 24.3 - 66.9 0.96 0.57 - 1.61
In cohabitation 406 25 58.6 53.2 - 64.2 1.40 1.22 - 1.60
Region
North 72 4 23.0 18.3 - 29 3.43 2.21 - 5.34
Northeast 1,142 71 138.7 130.9 - 147 20.7 14.12 - 30.28
Southeast 295 18 25.0 22.3 - 28 3.73 2.52 - 5.53
South 27 2 6.7 4.6 - 9.8 1 -
Midwest 72 4 31.0 24.6 - 39 4.63 2.97 - 7.19
to be continued

59
Microcephaly in Brazil: prevalence and characterization of cases from the Information System on Live Births (Sinasc), 2000-2015
Variable
Live birth with
microcephalyPrevalence
coefficientb 95%CIc Prevalence ratio 95%CIc
N %
Population size ( x 1,000 inhabitants)
Less than 20 222 14 53.0 46.5 - 60.4 1.11 0.94 - 1.31
20 to 50 250 16 52.8 46.7 - 59.8 1.10 0.94 - 1.30
>50 to 100 188 12 51.6 44.7 - 59.5 1.08 0.91 - 1.29
>100 to 500 393 24 47.8 43.3 - 52.7 1 -
Over 500 555 35 63.7 58.6 - 69.2 1.33 1.17 - 1.52
Brazil 1,608 100 54.6 51.9 - 57.2 - -
Source: MS/SVS/CGIAE/Sinasc, 2015.Note: the values ignored according to category are: age group (0.0%); education level (1.8%); ethnicity/skin color (4.0%), marital status (1.2%), region (0.0%) and population size (0.0%).a) Number of live births in 2015 = 2,951,136 (partial data updated on 02/12/2016). b) Numerator = No. of live births with microcephaly; Denominator=total of live births; Multiplication factor = 100,000 c) 95%CI: 95% confidence interval.d) Combination of the category ethnicity/skin color of black+brown.
Concerning prenatal care, 71% of the mothers to live births with microcephaly atten-ded six or more appointments and 68% started the prenatal care in the first trimester of pregnancy. The prevalence ratio of microcephaly at birth was 2.6 times among mothers who did not attend prenatal care when comparing to those who attended six or more appointments. The prevalence coefficient of microcephaly was lower among mothers with a higher number of prenatal care appointments. With regard to childbirth, 99% were performed in health care facilities and 57% were vaginal (Table 3).
Table 3 – Frequency of live births and prevalence coefficient of microcephaly at birth (per 100 thousand live births). according to characteristics of prenatal care and childbirth; Brazil. 2015a
Variable
Live birthwith microcephaly
microcephalyb Prevalence of 95%CIc Prevalence ratio 95%CIc
N %
Prenatal care appointments
None 20 1 129.9 83.9 - 201.3 2.60 1.67 - 4.05
1 to 3 136 9 74.6 63.1 - 88.3 1.49 1.25 - 1.79
4 to 5 253 16 66.8 59.1 - 75.6 1.34 1.17 - 1.54
6 and over 1.140 71 49.9 47.1 - 52.9 1 -
Trimester of the first prenatal care appointment
1st 1.086 68 49.6 46.7 - 52.7 1 -
2nd 329 21 67.1 60.2 - 74.8 1.35 1.20 - 1.53
3rd 43 3 61.6 45.7 - 83.1 1.24 0.92 - 1.69
Type of pregnancy
Single 1.578 98 54.7 52.1 - 57.5 1.24 0.85 - 1.82
Multiple 27 2 44.0 30.2 - 64.2 1 -
Type of childbirth
to be continued
conclusion

60
HEALTH BRAZIL 2015/2016 – An analysis of health situation and the epidemic caused by Zika virus and other diseases transmitted by Aedes Aegypti
Secretariat of Health SurveillanceMINISTRY OF HEALTH OF BRAZIL
Variable
Live birthwith microcephaly
microcephalyb Prevalence of 95%CIc Prevalence ratio 95%CIc
N %
Vaginal 919 57 70.3 65.9 - 74.9 1.69 1.53 - 1.87
Caesarian 681 42 41.6 38.6 - 44.8 1 -
Place of childbirth
Health care facility 1.595 99 54.4 51.8 - 57.2 1 -
Others 13 1 64.8 37.6 - 111.5 1.19 0.69 - 2.05
Brazil 1.608 100.0 54.6 51.9 - 57.2 - -
Source: MS/SVS/CGIAE/Sinasc, 2015.Note: the ignored values according to categories are: prenatal care appointment (4.0%); trimester of the first prenatal care appointment (9.3%); type of pregnancy (0.2%); type of childbirth (0.5%) and place of childbirth (0.0%) .a) Number of live births in 2015 = 2.951.136 (partial data updated on 02/12/2016) .b) Numerator = No. of live births with microcephaly; Denominator = total number of live births; Multiplication factor = 100,000c) 95%CI: 95% confidence interval.
When the information on the live births is analyzed, a prevalence of the following characteristics could be observed: at term births (76%), adequate birth weight (63%) and Apgar score 8 to 10 in the 1st (76%) and 5th (89%) minutes after birth (Table 4).
The highest prevalence coefficient of microcephaly (81.7 per 100 thousand) was observed among preterm live births, corresponding to 1.82 times the observed among babies born between 39 and 41 weeks (44.8 per 100 thousand). A decreasing trend was observed in the prevalence of microcephaly as the gestational age increased up to the 41st week. Then, there was a growth in the rate among the postterm live births (72.8 per 100 thousand) (Table 4).
With regard to Apgar score, we can highlight the high prevalence coefficients of mi-crocephaly among those with Apgar score <4 (258.9 per 100 thousand in the 1st minute and 598.5 per 100 thousand in the 5th minute after birth), and the prevalence ratios were of 5.35 and 11.78, respectively, when comparing to live births with Apgar score between 8 and 10 (Table 4).
A predominance of female live births with microcephaly was observed (Table 4). The prevalence rate (65.0 per 100 thousand) was higher than the prevalence for the male sex (43.8 per 100 thousand).
The prevalence of microcephaly in the group of low birth weight (235.1 per 100 thou-sand) was higher than in the group with adequate birth weight, whose prevalence ratio was of 6.22 (Table 4). Among the infants with microcephaly and low birth weight, 65% were born at term.
conclusion

61
Microcephaly in Brazil: prevalence and characterization of cases from the Information System on Live Births (Sinasc), 2000-2015
Table 4 – Frequency of live births and prevalence coefficient of microcephaly at birth (per 100 thousand live births), according to characteristics of the newborns; Brazil, 2015a
VariableLive birth
with microcephalymicrocephaly b
Prevalence of 95%CI c Prevalence ratio 95%CI c
N %
Weeks of pregnancy
Under 37 260 16 81.7 72.3 - 92.2 1.82 1.60 - 2.12
37 179 11 70.0 60.4 - 81.0 1.56 1.33 - 1.85
38 337 21 55.9 50.2 - 62.2 1.25 1.10 - 1.42
39 to 41 711 44 44.8 41.6 - 48.2 1 -
42 and over 64 4 72.8 57.0 - 93.0 1.63 1.26 - 2.10
Sex
Male 662 41 43.8 40.6 - 47.3 1 -
Female 936 58 65 61.0 - 69.3 1.48 1.34 - 1.64
Apgar at 1st minute
0 to 3 102 6 258.9 213.3 - 314.3 5.35 4.37 - 6.56
4 to 7 255 16 79.6 70.4 - 90.0 1.64 1.43 - 1.88
8 to 10 1,219 76 48.4 45.8 - 51.2 1 -
Apgar at 5th minute
0 to 3 59 4 598.5 464.0 - 771.7 11.79 9.14 - 15.41
4 to 7 94 6 166.8 136.3 - 204.1 3.28 2.67 - 4.06
8 to 10 1,425 89 50.78 48.1 - 53.4 1 -
Birth weight (g)
Less than 2,500 587 37 235.1 216.8 - 254.9 6.22 5.63 - 6.90
2,500 and over 1,020 63 37.8 35.5 - 40.2 1 -
Brazil 1,608 100 54.6 51.9 - 57.2 - -
Source: MS/SVS/CGIAE/Sinasc, 2015.Note: the ignored values according to categories are: weeks of pregnancy (3.5%); sex (0.6%), Apgar at 1st minute (2.0%), Apgar at 5th minute (2.0%), birth weight (0.1%).a) Number of live births in 2015 = 2,951,136 (partial data updated on 02/12/2016).b) Numerator = No. of live births with microcephaly; Denominator = total number of live births; Multiplication factor = 100,000. c) 95%CI: 95% confidence interval.
Among the live births with microcephaly, 456 multiple anomalies were registered in 259 infants. The organs/systems more frequently involved were: musculoskeletal (41% n=49/456), nervous (12% n=55/456), eye, ear, face and neck (11%; n=49/456) (data not presented).
Discussion
In this study, the unexpected increase of the prevalence coefficient of live births with microcephaly stands out, mainly in the Brazilian Northeast region, after October 2015. This growth has been associated to the probable intrauterine exposition to Zika virus.14,17
The prevalence coefficients of microcephaly were higher among live births to moth-ers with the following characteristics: age up to 24 or over 40 years old, black or brown-skinned, with no higher education, residents in the Northeast region of the country, and

62
HEALTH BRAZIL 2015/2016 – An analysis of health situation and the epidemic caused by Zika virus and other diseases transmitted by Aedes Aegypti
Secretariat of Health SurveillanceMINISTRY OF HEALTH OF BRAZIL
who self-declared single or in cohabitation. Although the variable “income” has not been included in the present study, because it is not present on Sinasc, these results gather proxy variables that can lead to the conclusion that most mothers of newborns with microcephaly cases belong to an unfavorable socioeconomic context. Gross et al.18 also described the association between microcephaly and low socioeconomic level. Moreover, according to the Brazilian Institute of Geography and Statistics (IBGE),19 the average monthly income of individuals aged 14 or over in the Northeast region was the lowest amongst Brazilian regions, and corresponded to 67% of the country’s average in 2015.
According to the 2010 demographic census, the population of the Northeast region is essentially composed by dark-skinned individuals (69.2%), being 59.8% brown and 9.4% black.20 Taking into consideration that most cases were concentrated in that region, the population characteristics according to ethnicity/skin color can, partly, explain the fact that the highest prevalence coefficients of microcephaly at birth, in Northeast, have been observed to dark-skinned women’s children.
In this study, the highest prevalence coefficients of microcephaly in Brazil were ob-served, in 2015, in the following states of the Northeast region: Pernambuco, Paraíba and Sergipe. In another study, conducted in Brazil, the states of Pernambuco, Paraíba and Bahia were described with higher growth of cases in 2015, compared to their respective annual averages for the period from 2000 to 2014.14 The different approaches of these studies to measure the frequency of this disease, probably contributed to the differences observed.
A higher prevalence of microcephaly at birth was observed in municipalities with over 500 thousand inhabitants, which can be partly explained to the fact that the de-mographic density of populous municipalities favors the transmission of vector-borne diseases.21,22,23 Besides that, those municipalities usually have better structure and man-agement of health services and, thus, are more likely to detect and notify microcephaly cases when comparing to smaller-population municipalities.9,10
The highest prevalence coefficients of microcephaly were observed among live births with unsatisfactory general conditions: preterm, with low birth weight and Apgar score <4 in the 1st and 5th minutes after birth. Similar results were found by Gross et al.,18 who described the association between microcephaly at birth, the intrauterine growth retar-dation, the low Apgar score and the low socioeconomic level. In a study with Korean children, the authors observed an association between congenital malformations, high proportion of low birth weight, preterm birth, multiple births and advanced maternal age.24 In a cohort study conducted in the South of Brazil, the maternal age between 16 and 19 years old was associated to higher risk of low birth weight and preterm birth. However, this higher risk among adolescent mothers would be better explained due to their socioeconomic conditions, rather than their biological features.25
In Brazil, due to the microcephaly outbreak and to the possible association with the virus Zika,11,14,26 there was a high appeal for health professionals concerning epidemiologi-cal surveillance of suspect cases, which contributed to improve notification on Sinasc.
63
Microcephaly in Brazil: prevalence and characterization of cases from the Information System on Live Births (Sinasc), 2000-2015
Although Sinasc does not present information on the head circumference (HC), the case definition for microcephaly adopted by the Ministry of Health for this system asks for the notification of live births with HC equal or lower than three standard deviations under the average for age and sex.10 Therefore, the absence of HC record does not allow the information on microcephaly to be validated, as well as the criterion used for notification. Nevertheless, the criterion used on Sinasc is more specific than the surveillance system for microcephaly and/or changes in the central nervous system that suggest congenital infection, implemented by the Ministry of Health.11 In this system, the definition of suspect case initially included live births at term for both sexes with HC equal or smaller than 33cm and, later, equal or smaller than 32cm.11 After March 13, 2016 the new definition of suspect case included at term live births with HC inferior to 31.5 and 31.9cm for female and male babies, respectively.11 It is important to highlight that the data analyzed in this study is previous to this most recent definition.
Concerning emergency public health situation, the simultaneity of case definitions of microcephaly used on Sinasc and surveillance, besides the change occurred through-out time of suspect case definition for the surveillance may have contributed for the superestimation of cases on Sinasc. In this context, the possibilities of cases notification to Sinasc from the HC adopted for surveillance and false-positive diagnoses due to the high sensibility of the definition of suspect cases stand out.13,28,29 These facts may also explain the isolated raise in the prevalence observed in August, among live births to mothers residents in Mato Grosso (results not presented).
During the data collection for this study, the measures of HC adopted by the surveil-lance system were the same for both sexes, which can partly explain the highest prevalence of cases among female babies, as described in our results.
Owing to the public health emergency situation, a priority in data entry (typing) of microcephaly cases on Sinasc over newborns with normal head circunpherence may have occurred. This situation may have contributed to the overestimation of the number of microcephaly cases on Sinasc in 2015.
This study presents univariate analysis, not considering the multiple relations between variables and confounding possibility. However, it contributes to the knowledge and dis-cussion on microcephaly at birth in Brazil, which was characterized as a Public Health Emergency of International Concern (PHEIC) in 2015.15
This phenomenon has been widely studied due to its complexity, in order to obtain more scientific evidence about its etiology. A revision study concluded that there is a causal association between intrauterine exposition to Zika virus and microcephaly at birth, although there are still some questions to be explored.30
Given the facts, we suggest a review in the form of the Certificate of Live Birth to include the register of HC and other anthropometric measurements that are already con-ducted but do not have a field to be recorded in the current model of the form. Another important measure would be the development of a surveillance model for all congenital

64
HEALTH BRAZIL 2015/2016 – An analysis of health situation and the epidemic caused by Zika virus and other diseases transmitted by Aedes Aegypti
Secretariat of Health SurveillanceMINISTRY OF HEALTH OF BRAZIL
anomalies that included, among other actions, the improvement on case definitions, the creation of a list with priority anomalies for epidemiological investigation, as well as the training and tools of the necessary resources. Furthermore, some coordinated actions between the surveillance services and health care need to be strengthened, in order to prevent new cases and for health promotion, and also for the children with microcephaly and their families follow up.
References
1 WORLD HEALTH ORGANIZATION. Birth defects surveillance: a manual for programme managers. Geneva, 2014.
2 ESTUDIO COLABORATIVO LATINO AMERICANO DE MALFORMACIONES CONGÊNITAS. Microcefalia no ECLAMC e no Brasil. Buenos Aires, 2015. Available at: <http://www.eclamc.org/descargas/LMicrocefalia no ECLAMC e no Brasil.docx>. Access on: 12 Jul. 2016.
3 MOURA, E. C.; CORTEZ-ESCALANTE, J. J. Monitoramento de indicadores de qualidade dos Sistemas de Informações sobre Mortalidade (SIM) e Nascidos Vivos (Sinasc), nos anos 2000, 2005 e 2010. In: BRAZIL. Ministério da Saúde. Secretariat of Health Surveillance. Departamento de Análise de Situação de Saúde. Saúde Brasil 2011: uma análise da situação de saúde a vigilância da saúde da mulher. Brasília, 2012. p. 401-418.
4 FRIAS, P. G.; SZWARCWALD, C. L.; LIRA, P. I. C. Avaliação dos sistemas de informações sobre nascidos vivos e óbitos no Brasil na década de 2000. Cadernos de Saúde Pública, Rio de Janeiro, v. 30, n. 10, p. 2068-2080, Oct. 2014.
5 SZWARCWALD, C. L. et al. Busca ativa de óbitos e nascimentos no Nordeste e na Amazônia Legal: estimação das coberturas do SIM e Sinasc nos municípios brasileiros. In: BRAZIL. Ministério da Saúde. Secretariat of Health Surveillance. Departamento de Análise de Situação de Saúde. Saúde Brasil 2010: uma análise da situação de saúde e de evidências selecionadas de impacto de ações de vigilância em saúde. Brasília, 2011. p. 79-98. (Série G. Estatística e Informação em Saúde).
6 SZWARCWALD, C. L. et al. Correction of vital statistics based on a proactive search of deaths and live births: evidence from a study of the North and Northeast regions of Brazil. Population Health Metrics, [S.l.], v. 12, p. 16, Jun. 2014.
7 BRAZIL. Ministério da Saúde. Departamento de Informática do SUS. Sistema de Informações de Nascidos Vivos. Brasília, 2016. Available at: <http://www2.datasus.gov.br/DATASUS/ index. php?area=060702>. Access on: 12 Jul. 2016.
8 LECHAT, M. F.; DOLK, H. Registries of congenital anomalies: EUROCAT. Environmental Health Perspectives, [S.l.], v. 101, Supplement 2, p. 153-157, Jul. 1993.
9 CASTILLA, E. E.; ORIOLI, I. M. ECLAMC: the Latin-American collaborative study of congenital malformations. Journal of Community Genetics, [S.l.], v. 7, n. 2-3, p. 76-94, Nov. 2004.
10 CASTILLA, E. E. et al. Manual de preenchimento e de codificação de anomalias congênitas no campo 34 da DN (SINASC). Rio de Janeiro: Estudio Colaborativo Latino Americano de Malformaciones Congénitas, 2010.
11 BRAZIL. Ministério da Saúde. Secretaria de Vigilância Sanitária. Protocolo de vigilância e resposta à ocorrência de microcefalia e/ou alterações do sistema nervoso central (SNC).

65
Microcephaly in Brazil: prevalence and characterization of cases from the Information System on Live Births (Sinasc), 2000-2015
12 Brasília, 2016. Available at: <portalsaude.saude.gov.br/images/pdf/2016/ marco/10/ microcefalia-protocolo-vigilancia-resposta- v2-10mar2016.pdf>. Access on: March 19, 2016.
13 THE INTERNATIONAL FETAL AND NEWBORN GROWTH CONSORTIUM FOR THE 21ST CENTURY. About Intergrowthst. Oxford, 2016. Available at: <http://intergrowth21. ndog.ox.ac.uk>. Visited on: 12 Jul. 2016.
14 LOPEZ-CAMELO, J. S.; ORIOLI, I. M.; CASTILLA, E. Resumo e conclusões dos documentos 1-5. Buenos Aires: Estudio Colaborativo Latino Americano de Malformaciones Congénitas, 2015. Available at: <http://www.eclamc.org/descargas/6.DocumentoECLAMCFinalV3.docx>. Access on: 12 Jul. 2016.
15 OLIVEIRA, W. K. et al. Increase in reported prevalence of microcephaly in infants born to women living in areas with confirmed Zika Virus transmission during the first trimester of pregnancy: Brazil, 2015. Morbidity and Mortality Weekly Report, [S.l.], v. 65, n. 9, p. 242-247, Mar. 2016.
16 WORLD HEALTH ORGANIZATION. WHO statement on the first meeting of the International Health Regulations (2005) (IHR 2005) Emergency Committee on Zika virus and observed increase in neurological disorders and neonatal malformations. Geneva, 2016. Available at: <www.who.int/mediacentre/news/statements/2016/1st-emergency-committee- zika/en/>. Access on: 12 July 2016.
17 ORGANIZAÇÃO MUNDIAL DE SAÜDE. Classificação Estatística Internacional de Doenças: CID-10. 8. ed. rev. e ampl. São Paulo: Universidade de São Paulo, 2008.
18 FARIA, N. R. et al. Zika virus in the Americas: early epidemiological and genetic findings. Science, [S.l.], v. 352, n. 6283, p. 345-349. Mar. 2016.
19 GROSS, S. J. et al. Newborn head size and neurological status: predictors of growth and development of low birth weight infants. The American Journal of Diseases of Children, [S.l.], v. 132, n. 8, p. 753-756, Aug. 1978.
20 IBGE. Pesquisa Nacional por Amostra de Domicílios Contínua: ano 2015. Rio de Janeiro, 2015. Available at: <http://www.ibge.gov.br/home/estatistica/pesquisas/anos_anteriores_2015. shtm>. Access on: 12 Jul. 2016.
21 IBGE. Banco de dados agregado. Rio de Janeiro, 2010. Available at: <http://www.sidra.ibge. gov.br/bda/popul/default.asp?t=3&z=t&o=25&u1=1&u2=1&u3=1&u4=1&u5=1&u6=1 (pop por cor-raça - censo demográfico amostra - 2010)>. Access on: 12 Jul. 2016.
22 SUTHERST, R. W. Global change and human vulnerability to vector-borne diseases. Clinical Microbiology Reviews, [S.l.], v. 17, n. 1, p. 136-173, Jan. 2004.
23 UNITED NATIONS. Department of Economic and Social Affairs. Population Division. World urbanization prospects: the 2014 revision: highlights. New York, 2014. Available at: <https:// esa.un.org/unpd/wup/Publications/Files/WUP2014-Highlights.pdf>. Access on: 12 Jul. 2016.
24 BARRETO, M. L. et al. Zika virus and microcephaly in Brazil: a scientific agenda. Lancet, [S.l.], v. 387, n. 10022, p. 919-921, Mar. 2016.
25 KIM, M. A. et al. Prevalence of birth defects in Korean livebirths, 2005-2006. Journal Korean Medical Science, [S.l.], v. 27, n. 10, p. 1233-1240, Oct. 2012.
26 RESTREPO-MÊNDEZ, M. C. et al. The association of maternal age with birthweight and gestational age: a cross-cohort comparison. Paediatric and Perinatal Epidemiology, [S.l.], v. 29, n. 1, p. 31-40, Jan. 2015.
27 EUROPEAN CENTRE FOR DISEASE PREVENTION AND CONTROL. Rapid risk assessment: Zika virus disease epidemic: potential association with microcephaly and Guillain- Barré syndrome: third update, 23 February 2016. Stockholm, 2016. Available at: <http://ecdc. europa.eu/en/publications/ Publications/zika-virus-rapid-risk-assessment-23-february-2016. pdf>. Access on: 12 Jul. 2016.

66
HEALTH BRAZIL 2015/2016 – An analysis of health situation and the epidemic caused by Zika virus and other diseases transmitted by Aedes Aegypti
Secretariat of Health SurveillanceMINISTRY OF HEALTH OF BRAZIL
28 BRAZIL. Ministério da Saúde. Secretaria de Vigilância Sanitária. Departamento de Vigilância Epidemiológica. Nota informativa n° 1/2015 - COES Microcefalias. Brasília, 2015. Available at: <http:// portalsaude.saude.gov.br/images/pdf/2015/novembro/18/microcefalia-nota- informativa-17nov2015-c.pdf>. Access on: 7 Jul. 2016
29 VICTORA, C. G. et al. Microcephaly in Brazil: how to interpret reported numbers? Lancet, [S.l.], v. 387, n. 10019, p. 621-624, Feb. 2016.
30 BUTLER, D. Zika vírus: Brazils surge in small-headed babies questionade by report. Nature, [S.l.], v. 530, n.7588, p. 13-14, Feb. 2016.
31 RASMUSSEN, S. A. et al. Zika virus and birth defects: reviewing the evidence for causality. The New England Journal of Medicine, [S.l.], v. 374, n. 20, p. 1981-1987, May 2016.

Characterization of territorial vulnerabilities and mapping of microcephaly cases in the Brazilian Northeastern Semi-Arid Region in 2015
5

Table of Contents
Abstract 69Introduction 69Methodology 72Objectives 72Results 73Discussion 79Concluding remarks 81References 81

69
Characterization of territorial vulnerabilities and mapping of microcephaly cases in the Brazilian Northeastern Semi-Arid Region in 2015
Abstract
Objective: To describe inequalities in microcephaly cases distribution according to the Brazilian Northeastern Semi-Arid Region’s social and environmental profile in 2015 based on its main social and economic vulnerabilities.
Methodology: This is an ecological study of the Northeastern Semi-Arid municipa-lities on the prevalence of microcephaly. Data of the Live Births Information System were used to characterize the demographic, social and economic profile, occupation, prenatal care and characteristics of the delivery of women whose children were diagnosed with microcephaly. In addition to the prevalence of microcephaly, the following vulnerability indicators were analyzed in the spatial distribution analysis: percentage of the population whose vulnerability is related to water supply for human consumption from the Program of Water Quality Surveillance for human consumption and quick survey for Aedes aegypti indices used by the National Program for Dengue Control in order to establish risk ranges.
Results: The Northeast Region registered 823,234 live births out of which 318,848 (38.7%) occurred in municipalities belonging to the Northeastern Semi-Arid Region. In municipalities with reported cases of microcephaly, live births accounted for 134,755 (16.3%). The spatial distribution per municipality was more intense in the south coast of the state of Rio Grande do Norte than in the north of Pernambuco, and less intense in the state of Sergipe. According to Kernel density estimator, the risk related to water supply for human consumption and quick survey of indices for Aedes aegypti and of spatial scope corroborate with the distribution of vulnerability, greatly agree with the higher prevalence of microcephaly, thus showing specific contexts in the municipalities in question.
Concluding remarks: Facing the problem of this disease in the Northeastern Semi--Arid requires the construction and consolidation of surveillance actions and local health promotion strategies linked to improved infrastructure of Accesss to water, thus improving the resilience of this target population.
Keywords: Microcephaly. Zika. Water supply. Vulnerability. Health Surveillance.
Introduction
An unexpected growth of microcephaly cases reported to the Information System on Live Births (Sinasc) was noted in Brazil, in October 2015. Pernambuco (PE) was the first state to identify changes in this disease’s epidemiological pattern. Then, these changes were also noted in all states of the country’s Northeast Region and these were temporally coincident with the increase in cases of Zika virus infection. Such a scenario led the Brazilian Ministry of Health (MS) to declare a situation of Public Health Emergency of International Concern on November 29, 2015 (PHEIC).1,2,3,4

70
HEALTH BRAZIL 2015/2016 – An analysis of health situation and the epidemic caused by Zika virus and other diseases transmitted by Aedes Aegypti
Secretariat of Health SurveillanceMINISTRY OF HEALTH OF BRAZIL
According to the World Health Organization (WHO), microcephaly is characterized by the “measurement of the skull at least 24 hours after birth and within the first week of life (up to 6 days and 23 hours) by means of technique and standardized equipment where the head circumference (HC) is less than two (-2) standard deviations below the specific mean for sex and gestational age.”5 This is a rare neurological condition of com-plex etiology and multifactorial, resulting from congenital anomalies or originated after childbirth, involving from genetic factors to environmental factors. In some cases, it is possible to consider that the child with microcephaly has a change on the brain structure and development problems.5,6
Analyses conducted by the Evandro Chagas Institute (an institute of the Ministry of Health in Belém/PA) in blood and tissue samples of a baby born in Ceará with microce-phaly, and other congenital malformations, confirmed the presence of Zika virus in its fluids. Then, some studies have confirmed the transposition of the Zika virus through the placental barrier through genomic detection in amniotic fluid of Brazilian pregnant women, as well as its presence in stillbirths and newborns with microcephaly and/or other malformations of the Central Nervous System (SNC).7,8
These and other studies present in literature have constituted increasingly assertive evidence about the relation of the virus presence with the occurrence of microcephaly and deaths of newborns in Brazil. The appearance of unplanned diseases may be associa-ted to a combination of several factors (climatic variables, lack of sanitation, disordered growth of the territory associated with delayed environmental education, etc.) that lead to increased vulnerability in a given territory.
Territory is understood as: “a space of relations (social, economic and political), a system of objects and actions (fixed and flows) in permanent interaction; but above all, in these limited spaces of power different social actors using the territory seek to make their projects and desires for life feasible”9
A territory’s vulnerability can be evaluated as the low adaptive capacity and high sensitiveness to external disturbances. That is, response to the exposure of a risk, as well as the fragility of distinct population groups in possessing assets that allow them to take advantage of the benefits offered by the State to face risk situations. Thus, the characte-rization of the territory to describe its vulnerability implies understanding that it is not a probability assessment and the offer of objective elements to identify more critical spaces (thus, more vulnerable) or less critical (more resilient) to a certain risk.10
The total extension of the Brazilian Semi-Arid Region is 982,563.3 km2 and delimited based on the 1941 Thorntwaite Aridity Index (municipalities with index of up to 0.50) and the Drought Risk (above 60%). Therefore, the Northeast Region concentrates approxima-tely 89.5% of the Brazilian Semi-Arid Region and comprises most Northeastern states, except for Maranhão. In 2010, the Northeastern Semi-Arid had 22,598,318 inhabitants11 divided into 1,050 municipalities and represented 12% of the Brazilian population and 43% of the Northeastern population.12

71
Characterization of territorial vulnerabilities and mapping of microcephaly cases in the Brazilian Northeastern Semi-Arid Region in 2015
This Brazilian region has precarious indicators in terms of life condition,13 whether related to social (Accesss to infrastructure services and human development), as well as environmental (climate and water scarcity) and economic conditions (fragility of their pri-mary production chains). Thus, this territory can be characterized as of broad vulnerability.
One of the climatic characteristics of the Northeastern Semi-Arid is the rainfall con-centration between January and April with annual averages that vary between 500 and 800 mm. Total annual precipitation varies from 30% to 50%.14 Such climatic characteristic ends up producing strong environmental conditions, harming the development of the region and corroborating to its water vulnerability.
From 2012 to 2015, 91.6% of the Northeastern Semi-Arid municipalities submitted a request for federal recognition of the Emergency Situation or State of Public Calamity due to drought to the Ministry of National Integration showing the low resilience to drought and water drought and strong dependence on the precipitation regime.15
In the Northeastern Semi-Arid, all municipalities had less than the average Municipal Human Development Index (MHDI) value of Brazil in 2010, 62% of them with very low and low MHDI, 37% with average MHDI, less than 1% with high MHDI and none with very high MHDI.11
Low Human Development Indexes show that the geographical space of the territory has high social and economic vulnerability and raises hypothesis related to the association with microcephaly. The Accesss to water for human consumption also illustrates this vulnerability scenario.
According to 2015 data from the Drinking Water Quality Information System (Sisa-gua/MS) on the forms of supply recommended on Ordinance GM/MS No. 2,914 dated December 12, 2011, 66% of the population is supplied by the Water Supply System (WSS); 7% is only supplied by Collective Alternative Solution (CAS) and approximately 1% is only supplied by Individual Alternative Solution (IAS). However, there is still 26% of the population without information about their water supply for human consumption entered on Sisagua.
In this regard, entering the forms of supply at Sisagua enables to characterize the water supply coverage for human consumption in the Brazilian territory per year of reference.
The risk related to supply is associated to water consumption that does not meet the drinking standard established by the Ministry of Health or poses a health risk. Given the above, the population supplied by untreated WSS, the population only supplied by untre-ated CAS, the population only supplied by IAS and the population without information about their water supply for human consumption entered on Sisagua (population without information) are considered vulnerable.16
There is also a hypothesis that areas of greater vulnerability Accesssing water for hu-man consumption in the Northeastern Semi-Arid territory may be associated to a greater incidence of Zika virus infection. In addition, it is also believed that the higher incidence of Zika virus infection in these areas is related to the higher prevalence of microcephaly.

72
HEALTH BRAZIL 2015/2016 – An analysis of health situation and the epidemic caused by Zika virus and other diseases transmitted by Aedes Aegypti
Secretariat of Health SurveillanceMINISTRY OF HEALTH OF BRAZIL
This work is justified by the relevance of the current national and international micro-cephaly emergency situation, especially the high prevalence in some areas of the Northe-astern Semi-Arid and the need for analysis focusing on Public Health and vulnerability of the territory. The results of this analysis may contribute to making a more effective health surveillance decision in such places.
Objectives
General objective
To describe inequalities in microcephaly cases distribution according to the Brazilian Northeastern Semi-Arid Region social and environmental profile in 2015 from the main social and economic vulnerabilities identified in the territory.
Specific objectivesTo describe spatial distribution and geographical areas of higher prevalence of micro-
cephaly, in the Northeastern Semi-Arid, in 2015.To characterize the demographic, social and economic profile, as well as occupational
characteristics, prenatal care and delivery of women whose children received a microce-phaly diagnosis in the Northeastern Semi-Arid, in 2015.
To calculate a compound indicator for vulnerabilities with emphasis on Accesss to water for human consumption and describe its spatial distribution in the Northeastern Semi-Arid, in 2015.
To describe the spatial distribution of microcephaly cases according to the territory’s vulnerability (compound indicator) in the Northeastern Semi-Arid, in 2015.
Methodology
This is an ecological study having the Northeastern Semi-Arid municipalities as the unit of analysis on the prevalence of microcephaly in 2015.
To characterize the demographic, social and economic profile, occupation, prenatal characteristics and delivery of women whose infants were diagnosed with microcephaly based on 2015 data from Sinasc provided by the General Coordination of Information and Epidemiological Analysis (CGIAE), Secretariat of Health Surveillance (SVS/MS)17. From this system, confirmed cases of microcephaly were selected according to the muni-cipality of residence of the mother (n=337). Simple frequencies were calculated with the respective confidence intervals (95% CI). The prevalence of live births with microcephaly was calculated by dividing the number of microcephaly cases in a certain municipality in 2015 by the number of live births in that municipality in the same year.
In addition to the prevalence of microcephaly, the following vulnerability indicators were analyzed in the spatial distribution analysis: percentage of the population whose vulnerability is related to water supply for human consumption (PV-AGUA) from the

73
Characterization of territorial vulnerabilities and mapping of microcephaly cases in the Brazilian Northeastern Semi-Arid Region in 2015
Program of Quality Water Surveillance for Human Consumption (Vigiagua) and quick survey of Aedes aegypti indices used by the National Program for Dengue Control in order to establish risk ranges.18
The compound indicator of vulnerability was prepared using PV-AGUA and LIRAa variables by establishing the score (Si) of each municipality so that the lower value found (Vmin) was attributed to zero score and the highest (Vmax) to the value one. An interpo-lation was then made to obtain the scores of the other municipalities by using the relation Si=(Vobs - Vmin)/(Vmax - Vmin); all variables could be placed within the same scale. The compound indicator of vulnerability was then obtained for each municipality as the simple arithmetic mean of the scores obtained in each sector for each variable.
Kernel’s density estimator was used in the spatial exploration step. The density estimator is useful to understand the spatial distribution of events as its results reflect the identifi-cation of ‘hot areas’ which are geographical areas with higher concentration of the event studied in the space. The Kernel density ratio map, which is different from the previous one because it is the division of two densities (in which the numerator is the density of cases and the denominator is the density of the population at risk) was also used. The adaptive method and quartz model were used as search radius for both methods.
The digital cartographic mesh can be publicly Accesssed, is available online and was provided by the Brazilian Institute of Geography and Statistics (IBGE). For the spatial exploration, the software TerraView on version 4.2.2, provided by the National Institute for Space Research (Inpe) was used. Epiinfo 7, 32-bit version Tabwin and Microsoft Excel were also used.
Results
In 2015, the Northeast Region registered 823,234 live births (LB) out of which 318,848 (38.7%) occurred in municipalities belonging to the Northeastern Semi-Arid Region. In municipalities with reported cases of microcephaly, live births accounted for 134,755 (16.3%) in 2015.
Out of the 1,142 microcephaly cases identified in the Northeast region in 2015, 337 (29.5%) had mothers living in municipalities from the Northeastern Semi-Arid Region (189 municipalities) with a prevalence of 1.05 cases of microcephaly per 1,000 LB, a little below the Northeast prevalence (1.38 cases of microcephaly per 1,000 LB). Considering only municipalities in the Northeastern Semi-Arid with reported cases of microcephaly, the prevalence was of 2.05 cases per 1,000 LB.
Pernambuco, Bahia and Paraíba States had the highest number of municipalities with reported cases of microcephaly (64, 35 and 25, respectively), whilst Piauí and Sergipe States had higher prevalence of LB with microcephaly in 2015 (11.2 and 4 cases/1,000 LB, respectively) considering only the population of LB of the municipalities with cases (Table 1).

74
HEALTH BRAZIL 2015/2016 – An analysis of health situation and the epidemic caused by Zika virus and other diseases transmitted by Aedes Aegypti
Secretariat of Health SurveillanceMINISTRY OF HEALTH OF BRAZIL
Table 1 - Prevalence of microcephaly among live births per state of the Northeastern Semi-Arid (municipalities with reported cases of microcephaly in 2015, n=189 municipalities) – Sinasc, Brazil, 2015
State
No. ofSemi-Arid municipalities
No. ofmunicipalities
% ofmunicipalities
Municipalities positive for microcephaly in the Northeastern Semi-Arid*
positive for microcephaly (n = 189)
belonging to the Semi-Arid
positive for microcephaly
Total of births
Total cases of microcephaly
Prevalence of microcephaly
(/1.000 LB)
Piauí 7 128 5.5 712 8 11.2
Ceará 20 150 13.3 21,537 36 1.7
Rio Grande do Norte 17 147 11.6 8,773 24 2.7
Paraíba 25 170 14.7 12,037 37 3.1
Pernambuco 64 122 52.5 48,741 155 3.2
Alagoas 11 38 28.9 8,351 14 1.7
Sergipe 10 29 34.5 3,188 13 4.1
Bahia 35 266 13.2 31,416 50 1.6
Source: Sinasc/CGIAE/SVS/MS, 2015.*Municipalities with at least one case of microcephaly.
The maternal profile included women from 18 to 24 years old (41.2%), brown-skinned (81.3%), with incomplete high school or under it (70.3%), single, divorced or widowed (45%) and mostly working in the agricultural, forestry and fishing sectors (44.5%) (Table 2).
Most women had seven or more prenatal care visits (71.2%). More than half (68.5%) of women delivered in municipalities different from their municipality of residence, and most deliveries occurred in the fourth trimester of the year (91.7%) (Table 2).
With regard to delivery characteristics, C-sections accounted for 40.5% of deliveries, whilst 35.7% of children were born with low weight and 80.5% were born between 37 and 41 weeks of pregnancy.
Table 2 – Demographic, social and economic, prenatal and delivery characteristics (n=337) of women of infants diagnosed with microcephaly in the Northeastern Semi-Arid municipalities – Brazil, 2015
Variables Number of Women % (95%CI)
Age Groupa
<18 years 42 12.5 (8.93 to 15.99)
18 to 24 years 139 41.2 (35.99 to 46.51)
25 to 34 years 108 32.0 (27.07 to 37.03)
35 to 44 years 48 14.2 (10.51 to 17.97)
Ethnicity/skin color of the mother b
White 44 14.2 (10.31 to 18.07)
Black 8 2.6 (0.82 to 4.34)
Brown 252 81.3 (76.95 to 85.63)
Indigenous 5 1.6 (0.21 to 3.01)
Unknown 0.3 (0 to 0.95)
Education level c
No schooling 4 1.2 (0.03 to 2.43)
Basic education incomplete 85 26.2 (21.44 to 31.02)to be continued

75
Characterization of territorial vulnerabilities and mapping of microcephaly cases in the Brazilian Northeastern Semi-Arid Region in 2015
Variables Number of Women % (95%CI)
Basic education incomplete 44 13.6 (9.85 to 17.31)
High School incomplete 95 29.3 (24.36 to 34.28)
High School complete 66 20.4 (15.98 to 24.76)
Undergraduate degree incomplete 17 5.2 (2.82 to 7.68)
Undergraduate degree complete 8 2.6 (0.78 to 4.16)
Unknown 5 1.5 (0.2 to 2.88)
Marital status c
Single 144 43.5 (38.16 to 48.84)
Married 102 30.8 (25.85 to 35.79)
Widowed 2 0.6 (0 to 1.43)
Divorced 3 0.9 (0 to 1.93)
Common-law marriage 76 23.0 (18.43 to 27.49)
Unknown 4 1.2 (0.03 to 2.39)
Occupation d
Agriculture, forestry and fishing worker 134 44.5 (38.91 to 50.13)
Housewife 91 30.2 (25.04 to 35.42)
Student 23 7.6 (4.64 to 10.64)
Commerce worker, seller in stores and markets 14 4.6 (2.27 to 7.03)
Sciences and arts professional 9 3.0 (1.07 to 4.91)
High school level technician 9 3.0 (1.07 to 4.91)
Administrative services worker 9 3.0 (1.07 to 4.91)
Goods production and industrial services worker 6 2.0 (0.41 to 3.57)Superior members of public body, manager of public interest and companies organizations, manager 5 1.7 (0.22 to 3.1)
Unemployed/Unknown 0.33 (0 to 0.98)
PRENATAL AND DELIVERY CHARACTERISTICS e Number of prenatal care visits
None 7 2.1 (0.56 to 3.6)
From 1 to 3 22 6.5 (3.89 to 9.17)
From 4 to 6 67 19.9 (15.62 to 24.14)
7 and more 240 71.2 (66.39 to 76.05)
Unknown 1 0.3 (0 to 0.88)
Municipality of delivery is the same as residence
Yes 106 31.4 (26.49 to 36.41)
No 231 68.5 (63.59 to 73.51)
Trimester of the year of delivery
1st trimester 5 1.5 (0.2 to 2.78)
2nd trimester 2 0.6 (0 to 1.42)
3rd trimester 21 6.2 (3.65 to 8.81)
4th trimester 309 91.7 (88.75 to 94.65)
Characteristics of the delivery
Vaginal 200 59.5 (54.27 to 64.77)
C-section 136 40.5 (35.23 to 45.73)
Weight of the newborn at birth
<2,500 g 120 35.7 (30.59 to 40.83)
2,500 g and above 216 64.3 (59.17 to 69.41)
Duration of the pregnancy f
Pre-term (up to 36 weeks) 47 14.3 (10.54 to 18.12)
At term (37 to 41 weeks) 264 80.5 (76.2 to 84.78)
Post-term (42 weeks and more) 17 5.9 (2.78 to 7.58)
Source: Sinasc/CGIAE/SVS/MS, 2015. a n=310; not informed/not registered=0.32%. b n=324; not informed/not registered =3.86%.c n=331; not informed/not registered =1.78%.d n=301; not informed/not registered =10.68%. e n=336 not informed/not registered =0.30%.f n=336; not informed/not registered =0.30%.g n=328; not informed/not registered =2.67%.
conclusion

76
HEALTH BRAZIL 2015/2016 – An analysis of health situation and the epidemic caused by Zika virus and other diseases transmitted by Aedes Aegypti
Secretariat of Health SurveillanceMINISTRY OF HEALTH OF BRAZIL
Figure 1 shows the distribution of the spatial pattern per municipality of density of microcephaly prevalence in the Brazilian Northeastern municipalities for 2015. There is a higher intensity from the south coast of the state of Rio Grande do Norte to the north of Pernambuco, continuing less intensively until the state of Sergipe. In the countryside, the border of Rio Grande do Norte, Ceará and Paraíba, as well as some municipalities of Paraíba also stand out.
Figure 1 – Kernel smoothing of the prevalence of microcephaly throughout the Brazilian Northeast – Brazil, 2015
Density of microcephaly
250 0 250 500 km
-
+
Brazil
Northeast
Source: SVS/MS, 2015.
When the Northeastern Semi-Arid municipalities are detailed (Figure 2), it is pos-sible to notice the municipalities with the highest prevalence of microcephaly in the region. Paraíba’s Semi-Arid stands out with basically all of its municipalities classified as medium-high and high. Municipalities bordering this state also have the high values of the indicator, as well as the region transiting to the coast going from Rio Grande do Norte to Alagoas.
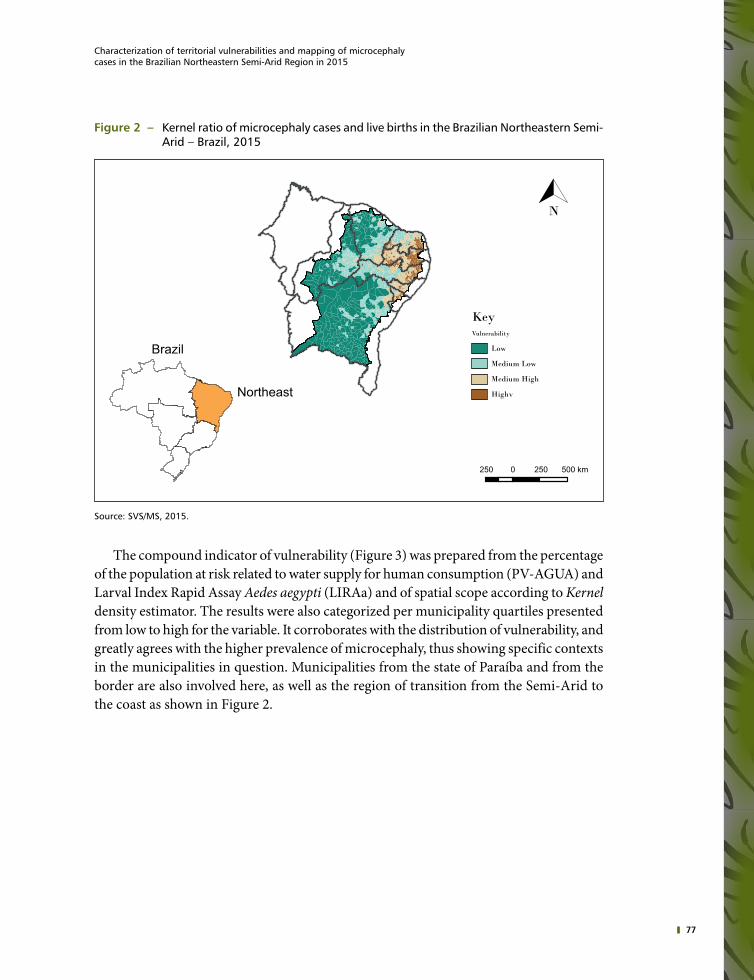
77
Characterization of territorial vulnerabilities and mapping of microcephaly cases in the Brazilian Northeastern Semi-Arid Region in 2015
Figure 2 – Kernel ratio of microcephaly cases and live births in the Brazilian Northeastern Semi-Arid – Brazil, 2015
Brazil
Northeast
KeyVulnerability
N
Low
Medium Low
Medium High
Highv
250 0 250 500 km
Source: SVS/MS, 2015.
The compound indicator of vulnerability (Figure 3) was prepared from the percentage of the population at risk related to water supply for human consumption (PV-AGUA) and Larval Index Rapid Assay Aedes aegypti (LIRAa) and of spatial scope according to Kernel density estimator. The results were also categorized per municipality quartiles presented from low to high for the variable. It corroborates with the distribution of vulnerability, and greatly agrees with the higher prevalence of microcephaly, thus showing specific contexts in the municipalities in question. Municipalities from the state of Paraíba and from the border are also involved here, as well as the region of transition from the Semi-Arid to the coast as shown in Figure 2.

78
HEALTH BRAZIL 2015/2016 – An analysis of health situation and the epidemic caused by Zika virus and other diseases transmitted by Aedes Aegypti
Secretariat of Health SurveillanceMINISTRY OF HEALTH OF BRAZIL
Figure 3 – Kernel softening according to indicator of vulnerability in the Brazilian Northeastern Semi-Arid – Brazil, 2015
N
Brazil
Northeast
KeyVulnerability
Low
Medium Low
Medium High
High
250 0 250 500 km
Source: SVS/MS, 2015.
Considering Sisagua data related to the forms of water supply, 32.6% of the population is considered vulnerable (supply without treatment, insufficient treatment or unknown). Among the municipalities with reported cases of microcephaly, 31.3% of the population is considered vulnerable. Detailing of water supply for human consumption vulnerability is shown on Table 3.
Table 3 – Detailing of water supply for human consumption vulnerability - Northeastern Semi-Arid, 2015
Northeastern Semi-Arid
Forms of supply Total Municipalities with reported microcephaly
Population Supplied by WSS* without treatment (a) 244,653 25,911
Population supplied by CAS*** only without treatment (b) 994,500 245,946
Population supplied by IAS*** only (c) 153,171 30,359
Population without information on water supply (d) 5,968,931 2,337,021
Population with vulnerability related to water supply(a+b+c+d) 7,361,255 2,639,237
% Of Population with vulnerability related to water supply (PV-AGUA) 32.6% 31.3%
Source: SVS/MS, 2015.* WSS - Water Supply System.** CAS - Collective Alternative Solution.*** IAS - Individual Alternative Solution.

79
Characterization of territorial vulnerabilities and mapping of microcephaly cases in the Brazilian Northeastern Semi-Arid Region in 2015
Discussion
Microcephaly cases in the Northeastern Semi-Arid are mostly found among infants of mothers with low schooling, single, agriculture, forestry and fishing workers. In a context where low schooling and where almost half of the women declare themselves as single or divorced (possibly heads of their families) a greater difficulty to stay or entry into the labor market is inferred. According to the 2010 Census, the Northeastern states had the highest percentage of houses headed by women (from 27% to 33%).11
This aspect expands the context of social vulnerability of these women, now mothers of infants who will demand much of their care and attention from the state since the causes of this neurological disorder may have different degrees. The Ministry of Health has publi-shed a protocol with guidelines to follow-up mothers of newborns in these conditions and announced the professional qualification and expansion of specialized services; however, articulations intra and intersectoral will be necessary to discuss short, medium and long--term consequences of the social impacts caused by microcephaly translating the precarious conditions of this population’s social inclusion in the territory.
The irregular water supply identified in the analysis is a significant determinant in terms of inadequate sanitation conditions. Lack or intermittence of water for human consumption makes the population store water improperly: in poorly capped water boxes, barrels and buckets without cap, etc., making the environment conducive to the procreation of the vector Aedes aegypti. Open sewers should also be considered here.
This study considers that the population supplied by IAS only is also vulnerable as it is not treated, at first. Filtering and disinfection or filtering and water boiling at home, that is, transfer of responsibility for the treatment of water by the State to the population is re-commended in this case.
In terms of irregular collection of solid waste, final disposal in inadequate places, accu-mulation of materials as plastic packages, or general packages, tires, bottles and other contai-ners to store rainwater also increases the potentials of development of the mosquito vector.
Researches show that the survival rate and longevity of A. aegypti increase with the lack of urbanization and infrastructure: it increases in favelas, then in suburbs and reduces in neighborhoods duly urbanized with sanitation. On average, the vector females of an urban neighborhood, of the suburbs and the favelas had, respectively, 60%-70%, 70%-80% and 80%-90% the possibility to survive each day after release.19
The Northeastern Semi-Arid specific social and environmental vulnerability is a drou-ght phenomenon strengthened when associated to the poor Accesss to water for human consumption as mentioned previously. When studying the relation between drought and health in the Brazilian Semi-Arid Region, Sena et al.20 identified the existence of significant inequalities among the municipalities located in this region when compared to the other Brazilian municipalities. The universal and equal Accesss to drinking water was highli-ghted by authors as one of the necessary actions to achieve the objectives of Sustainable Development in the Semi-Arid Region, thus reinforcing that the “impacts of the drought
80
HEALTH BRAZIL 2015/2016 – An analysis of health situation and the epidemic caused by Zika virus and other diseases transmitted by Aedes Aegypti
Secretariat of Health SurveillanceMINISTRY OF HEALTH OF BRAZIL
process in the economic, social and environmental development affect health determinants, especially with regard to Accesss to the quantity and quality of drinking water and food, thereby compromising living conditions especially among the poorest and most vulnerable social groups”.20
The relation between water scarcity, inadequate forms of reservation and social inequa-lities points to the consolidation of the Northeastern Semi-Arid as a territory susceptible to vector circulation and consequently to the Zika virus. The first high resolution spatial-global map of environmental adequacy for Zika transmission to human beings was produced in a study by Messina et al.21 using a set of known registries such as the occurrence of Zika and environmental co-variables in a structure of species distribution modeling. Although it is clear that a lot still needs to be understood about Zika, this first map serves as a baseline to understand the change in this global emerging arboviruses geographical distribution.
These authors highlight that previous works focused on mapping other diseases trans-mitted by vectors and were not specific for the Northeastern Semi-Arid and microcephaly. In addition, the relatively smaller quantity of data on Zika infection (especially before recent outbreaks) means that this set of data should also be updated with new information when necessary, leading to a stronger database and improving the accuracy of future maps. Thus, better understanding the Zika transmission dynamics will end up enabling the preparation of cartographic refinements, as the differentiation between endemic areas and those with epidemic potential.21
Therefore, the sharp increase in the number of cases over the last trimester of 2015 shows how fast Zika virus circulates.
By using Kernel’s method, the spatial description became even more adequate to define differentiated areas of the region under study. The identification of the pattern of occur-rence of the events studied coincided with the areas identified with greater vulnerability to microcephaly. Also, considering the specific characteristics of each area, it was possible to form homogeneous regions regardless of political limit, namely: Rio Grande do Norte Semi-Arid Southern Center, Paraíba and Pernambuco Semi-Arid east, the latter is the most expressive cluster; and there are also significant groups; however, they are diffuse in Alagoas, Sergipe and Bahia, as well as in Rio Grande do Norte, Paraíba and Pernambuco Semi-Arid West. On the other hand, this method allowed stabilizing low value fluctuations especially in less populated municipalities.
The vulnerability map followed the microcephaly trend in the Semi-Arid region. The population vulnerable to water supply for human consumption and LIRAa were considered for this map.
LIRAa was used to create the compound indicator of vulnerability which is used by the National Program for Dengue Control. This indicator shows indices of larval infestations (based on Predial and Breteau methods), including data related to types of recipients.22
Data related to LIRAa were provided by the Department of Communicable Diseases Surveillance (DEVIT/MS). In September, October and November 2015 LIRAa’s assessment, 405 Northeastern Semi-Arid municipalities participated, out of which 120 were at higher

81
Characterization of territorial vulnerabilities and mapping of microcephaly cases in the Brazilian Northeastern Semi-Arid Region in 2015
risk for the occurrence of diseases transmitted by the Aedes aegypti. In addition to these, 175 were under alert and 110 had satisfactory conditions.18
From the municipalities participating in 2015 LIRAa and located in the Northeastern Semi-Arid, 78% (n=316) had containers and water reservoirs for human consumption as the main Aedes aegypti infestation deposit, thus corroborating to the epidemiological scenario seen in the region as a consequence of the prolonged drought, water reservation and frequent intermittence in the distribution of water consumed by the population living in the region.
Out of the Northeastern Semi-Arid municipalities with reported cases of microcephaly (n=189), 107 (56.6%) participated in 2015 LIRAa. Thirty-eight municipalities reached an index indicating a situation of risk for Aedes aegypti infestation. Other 55 municipalities are under alert and 14 have satisfactory conditions.
It is also noted that out of the Northeastern Semi-Arid municipalities that participated in 2015 LIRAa with microcephaly cases (n=90), 84.1% had inadequate containers and reservoirs to store water for human consumption as predominant deposit of Aedes aegypti infestation.
Knowing that the spatial distribution may encourage health surveillance actions focused on reducing the populations of Aedes mosquitoes, as well as help to allocate – always limited – resources to prevent the disease. Public health and individual risk mitigation actions can also be focused on areas identified as highly vulnerable for Zika transmission, especially during the first infection outbreak.21
Concluding remarks
Based on the results provided herein and keeping the vulnerability standards identified, anticipating that the Brazilian Northeastern Semi-Arid will be strongly affected by the vector and Zika virus circulation and other epidemics of diseases transmitted by vectors is possible. The results show that facing the problem of this disease in the Northeastern Semi-Arid requires the construction and consolidation of surveillance and local health promotion strategies linked to the improved infrastructure of Accesss to water, thus im-proving the resilience of this target population.
References
1 CAMPOS, G. S.; BANDEIRA, A. C.; SARDI, S. I. Zika virus outbreak, Bahia, Brazil. Emerging infectious diseases, v. 21, n. 10, p. 1885-1885, 2015.
2 CARDOSO, C. W. et al. Outbreak of exanthematous illness associated with Zika, chikungunya, and dengue viruses, Salvador, Brazil. Emerging infectious diseases, v. 21, n. 12, p. 2274, 2015.
3 BRASIL. Ministério da Saúde. Portaria n° 1.813, de 11 de novembro de 2015. Declara Emergência em Saúde Pública de importância Nacional (ESPIN) por alteração do padrão de ocorrência de microcefalias no Brasil. Brasília, DF, 2015.
4 BRASIL. Ministério da Saúde. Secretária de Vigilância em Saúde. Monitoramento dos casos de dengue, febre de chikungunya e febre pelo vírus Zika até a Semana Epidemiológica 52. Boletim Epidemiológico, v. 47, n. 3, p. 1-10, 2016.

82
HEALTH BRAZIL 2015/2016 – An analysis of health situation and the epidemic caused by Zika virus and other diseases transmitted by Aedes Aegypti
Secretariat of Health SurveillanceMINISTRY OF HEALTH OF BRAZIL
5 BRASIL. Ministério da Saúde. Secretária de Vigilância em Saúde. Departamento de Vigilância das Doenças Transmissíveis. Protocolo de vigilância e resposta à ocorrência de microcefalia e/ou alterações do sistema nervoso central (SNC). Brasília, 2015. Versão 2.
6 WORLD HEALTH ORGANIZATION et al. Birth defects surveillance: a manual for programme managers. Geneva, 2014.
7 HENRIQUES, C. M. P.; DUARTE, E.; GARCIA, L. P. Desafios para o enfrentamento da epidemia de microcefalia. Epidemiologia e Serviços de Saúde, v. 25, n. 1, p. 7-10, 2016.
8 CALVET, G. et al. Detection and sequencing of Zika virus from amniotic fl uid of fetuses with microcephaly in Brazil: a case study. The Lancet Infectious Diseases, v. 16 , Issue 6, p. 653-660, 2016.
9 SANTOS, M. A Natureza do espaço: técnica e tempo, razão e emoção. 3. ed. São Paulo: Hucitec, 1999.
10 KAZTMAN, R. Activos y estructura de oportunidades: estudios sobre las raíces de la vulnerabilidad social en Uruguay. Montevideo: PNUD-Uruguay; CEPAL-Oficina de Montevideo, 1999.
11 IBGE. Censo demográfico 2010. Rio de Janeiro, 2011.12 MEDEIROS, S. S. et al. Sinopse do censo demográfico para o semiárido brasileiro. Campina
Grande: INSA, 2012.13 BRASIL. Ministério da Saúde. Portaria GM/MS n° 2.914, de 12 de dezembro de 2011. Dispõe
sobre os procedimentos de controle e de vigilância da qualidade da água para consumo humano e seu padrão de potabilidade. Brasília, 2011.
14 CAVALCANTI, I. F. et al. Tempo e clima no Brasil. São Paulo: Oficina de Textos, 2009.15 BRASIL. Ministério da Ciência, Tecnologia e Inovação Desertificação. Desertificação e
Mudanças Climáticas no Semiárido Brasileiro. Brasília: INSA-PB, 2011.16 BRASIL. Ministério da Saúde. Secretaria de Vigilância em Saúde. Departamento de Saúde
Ambiental e Saúde do Trabalhador. Coordenação-Geral de Vigilância de Saúde Ambiental. Sistema de Informação de Vigilância da Qualidade da Água para Consumo Humano (Sisagua) - Brasil 2015. Brasília, 2015. Extracted in June, 2016.
17 BRASIL. Ministério da Saúde. Sistema de informação de Nascidos Vivos (Sinasc). Brasília, 2015.18 BRASIL. Ministério da Saúde. Secretariat of Health Surveillance. Departamento de Vigilância
das doenças Transmissíveis (DEVIT). Coordenação Geral do Programa Nacional de Controle da Dengue (PNCD). Levantamento Rápido do Índice de Infestação por Aedes aegypti (LIRAa) - Brasil 2015. Brasília, 2015. Extracted in June, 2016.
19 VALLE, D.; PIMENTA, D. N.; CUNHA, R. V. Dengue: teorias e práticas. Rio de Janeiro: Fiocruz, 2015.
20 SENA, A. et al. Medindo o invisível: análise dos Objetivos de Desenvolvimento Sustentável em populações expostas à seca. Ciência & Saúde Coletiva, v. 21, n. 3, p. 671-684, 2016.
21 MESSINA, J. P. et al. Mapping global environmental suitability for Zika virus. Elife, v. 5, p. e15272, 2016.
22 BRASIL. Ministério da Saúde. Secretariat of Health Surveillance. Departamento de Vigilância das Doenças Transmissíveis. Levantamento Rápido de Índices para Aedes Aegypti (LIRAa) para vigilância entomológica do Aedes aegypti no Brasil: metodologia para avaliação dos índices de Breteau e Predial e tipo de recipientes. Brasília, 2013.

Epidemiological situation of the congenital syndrome associated to Zika virus infection in Brazil, in 2015
6

Table of Contents
Abstract 85Introduction 85Methods 86Results 90Discussion 103References 105

85
Epidemiological situation of the congenital syndrome associated to Zika virus infection in Brazil, in 2015
Abstract
Introduction: Based on current knowledge, the congenital syndrome associated to Zika virus infection has been characterized by the presence of microcephaly and/or malformations of the central nervous system as a consequence of the congenital infection by this virus.
Objectives: To describe the epidemiological situation of the congenital syndrome associated to Zika virus infection in Brazil.
Methods: A descriptive study of suspected congenital syndrome cases associated to Zika virus infection reported to the Brazilian Ministry of Health from November 8th, 2015 to May 28th, 2016 was conducted. Data from the Record of Public Health Events (Resp- Microcephaly) and the Information System on Live Births (Sinasc) were used.
Results: 7,723 suspected cases of congenital syndrome associated to Zika virus infec-tion were reported. An increase from epidemiological week (EW) 31/2015, peaking in EW 47/2015 was noted in the analysis per EW of birth. Investigations and cases conclu-sion had significant progress in this period, reaching respectively 59% of cases and 34% of deaths with investigation concluded. Microcephaly as a criterion to define suspected cases of congenital syndrome associated to Zika virus infection had 81% of sensitiveness and 59% of specificity. One fifth of the confirmed cases did not present microcephaly.
Conclusion: Progresses made to identify suspected cases is evident, as well as in their investigation and conclusion. However, epidemiological and clinical studies are necessary to better characterize the congenital syndrome associated to the Zika virus infection.
Keywords: Zika virus. Microcephaly. Congenital anomalies. Public Health Surveillance.
Introduction
On October 22th, 2015, the Ministry of Health was notified by the State Health Secreta-riat of the state of Pernambuco (SES/PE) about a change in the epidemiological standard of microcephaly from January to September, 2015. A significant number of cases were registered compared to previous years according to information from the Information System on Live Births (Sinasc). i
On November 11th, 2015, the Brazilian Ministry of Health declared a change in the epidemiological pattern of microcephaly in Pernambuco with an increase in the number of cases and unusual clinical condition as a Public Health Emergency of National Concern (PHENC) (Ordinance GM/MS No. 1,813 dated November 11th, 2015)2, and communicated the event to the World Health Organization (WHO). Since then, evidences indicated a possible relation between microcephaly and congenital infection by the Zika virus whose circulation in the country had already been detected on April 26th, 2015. The Brazilian Ministry of Health was the first one to recognize Zika virus involvement with microce-
i Source: <http://www.who.int/mediacentre/news/statements/2016/2nd-emergency-committee-zika/en/>.
86
HEALTH BRAZIL 2015/2016 – An analysis of health situation and the epidemic caused by Zika virus and other diseases transmitted by Aedes Aegypti
Secretariat of Health SurveillanceMINISTRY OF HEALTH OF BRAZIL
phaly in November, 2015, even before the release of more robust evidence from clinical, epidemiological and laboratory studies.3
On February 1st, 2016, WHO declared that increased cases of microcephaly and other neurological disorders reported in Brazil were Public Health Emergency of International Concern (PHEIC).4 The term PHEIC is defined in the International Health Regulation (IHR) as an extraordinary event posing public health for another State-Party through the international propagation of diseases that may require a coordinated international response.5 On March 8th, 2016, after the second meeting of the Emergency Committee for IHR, WHO recognized the causal relationship between Zika virus and the increase in the occurrence of neurological alterations and congenital malformations.ii
Since the notification of the event in October 2015, the Brazilian Ministry of Health started to monitor and investigate cases intensively with the support of State and Municipal Health Departments, the publication of protocols and guidelines for health surveillance and assistance, as well as the provision of instruments for cases notification and registry as the Record of Public Health Events (Resp-Microcephaly).6
The information note about preliminary procedures to be adopted for microcephaly cases surveillance in Brazil, published on November 17th, 2015, established definitions for the notification of cases of newborns with microcephaly.7 On December 12th, 2015 a “Pro-tocol of Surveillance and Response to the Occurrence of Microcephaly and/or Alterations of the Central Nervous System (CNS)” changed the cutoff head circumference (HC) for notification of suspected microcephaly cases in newborns at term, including definitions of case for the reporting of miscarriages, stillbirths and fetuses with microcephaly and/or CNS disorders.8 Such definitions were in force until March 12th, 2016 when a new version of the surveillance protocol was published.3
Based on the current knowledge, the congenital syndrome associated to Zika virus infection has been characterized by the presence of microcephaly and/or other malfor-mations of the central nervous system as a consequence of the congenital infection by this virus.9,10 This chapter will describe the epidemiological situation of the congenital syndrome associated to Zika virus infection in Brazil from 2015 to 2016.
Methods
A descriptive study of suspected congenital syndrome cases associated to Zika virus infection reported to the Brazilian Ministry of Health from November 8th, 2015 to May 28th, 2016 was conducted.
Within the PHENC and PHEIC context, the Ministry of Health established a “Protocol of Surveillance and Response to the Occurrence of Microcephaly and/or Alterations of the Central Nervous System (CNS)”3. By August 2016, this protocol was in version 2.1. On
ii Source: <http://www.who.int/mediacentre/news/statements/2016/2nd-emergency-committee-zika/en/>.

87
Epidemiological situation of the congenital syndrome associated to Zika virus infection in Brazil, in 2015
November 19th, 2015, the Ministry of Health created a register system (Resp-Microcephaly) and provided states and municipalities with an electronic form to report suspected cases. Since it is an open form, any citizen may fill in a report which is later checked by State and Municipal Health Departments that officially inform the case to the Ministry of Health. Such information is used to prepare the national Epidemiological Report used to monitor microcephaly cases and disclosed weekly (available at: <http://www.combateae-des.saude.gov.br/pt/situacao-epidemiologica>).
Suspected cases of congenital syndrome associated to Zika virus infection with mis-carriages, stillbirths and live births with microcephaly and/or alterations of CNS were reported, considering the definitions below extracted from the Surveillance handbook on child and fetal death and the Committee for Prevention of Infant and Fetus Mortality.11
Miscarriage: expulsion or extraction of products of conception with less than 500 g and/or height less than 25 cm, or less than 22 weeks of gestation, whether or not with evidence of life and being spontaneous or induced.
Fetus: concept of the 8th week of pregnancy until birth.Stillbirth or fetal death: death of the product of pregnancy before the expulsion or its
complete extraction from the maternal body, regardless of the duration of the pregnancy. After the separation, if the fetus does not breathe or gives another sign of life as heartbeats, umbilical cord pulsations or effective movements of voluntary contraction muscles, it is considered dead.
Live birth: the product of the conception expelled or extracted from the maternal body breathing or presenting any sign of life as heartbeats, umbilical cord pulsations or effective movements of voluntary contraction muscles after the separation, whether or not the umbilical cord is cut and being detached from the placenta or not.
The different definitions of suspected cases of congenital syndrome associated to Zika virus infection adopted for notification at national level over time are presented in Table 1 – Definitions of confirmed, discarded and possible cases are available on the “Protocol of Surveillance and Response to the Occurrence of Microcephaly and/or Alterations of the Central Nervous System (CNS)” version 2.1.3

88
HEALTH BRAZIL 2015/2016 – An analysis of health situation and the epidemic caused by Zika virus and other diseases transmitted by Aedes Aegypti
Secretariat of Health SurveillanceMINISTRY OF HEALTH OF BRAZIL
Table 1 – Definitions of suspected cases of congenital syndrome associated to Zika virus infection adopted by the Ministry of Health for notification at national level – Brazil,
2015-2016
Groups November 17th to December 11th, 20157
December 12th, 2015 to March 12th, 20168 March 13th to May 28th, 2016*3
Miscarriages
Spontaneous miscarriages of pregnant women with reported exanthema during pregnancy, without other causes identified.
Miscarriages of pregnant women with clinical suspicion and/or laboratory result compatible with acute exanthematous disease during pregnancy.
Fetus
• Ultrasound finding of fetus with head circumference less than two standard deviations (<2 SD) below the average for gestational age with or without other central nervous system (CNS) alterations.
• Ultrasound finding of fetus with CNS alteration suggesting congenital infection.
Fetus presenting at least one of the following criteria related to changes of the central nervous system identified in ultrasound examination:• Presence of cerebral calcifications
and/or• Presence of ventricular changes
and/or• At least two of the following
signs of change of posterior fossa: cerebellar hypoplasia, cerebellar vermis hypoplasia, posterior fossa widening greater than 10 mm, and agenesis/hypoplasia of corpus callosum.
Stillbirths
Stillbirth of any gestational age, of pregnant women with reported exanthematous disease during pregnancy.
Stillbirth of pregnant women with clinical suspicion and/or laboratory result compatible with acute exanthematous disease during pregnancy presenting:• HC <= -2 standard deviations for
gestational age and sex, according to Intergrowth Table when mea-surement is possible or
• Congenital anomalies of the central nervous system, such as: anen-cephaly, encephalocele. Closed spina bifida. Open spina bifida, anencephaly or neural tube defects, in addition to severe structural malformations as arthrogryposis multiplex congenital (AMC).
Newborns
• Newborn, less than 37 weeks of pregnancy, with HC calculated at birth < = percentile 3 (two standard deviations) in Fenton’s curve. 18
• Newborn, between 37 and 42 weeks of pregnancy, with HC calculated at birth < = 33 cm WHO’s curve. 19
• Newborn alive with at least 37 weeks of gesta-tional age with HC below the percentile 3 according to Fenton’s curve. 18
• Newborn alive with 37 weeks or more of gesta-tional age with HC <= 32 cm according to WHO references. 19
• Newborn with at least 37 weeks of gestational age with HC <= -2 standard deviations according to Intergrowth table, 20 for gesta-tional age and sex.
• Newborn with 37 weeks or more of gestational age with HC < = 31.5 centimeters for females and <= 31.9 for males, equivalent to <= -2 standard deviations for the age of the neonate and sex, according to WHO table. 19
Source: Protocol of Surveillance and Response to the Occurrence of Microcephaly and/or Alterations of the Central Ner-vous System (CNS).* Definition in force when data for this chapter were collected.
Consolidated information published previously in weekly epidemiological reports of the Public Health Emergency Operations Center (Coes-Microcephaly) including the description of cases and deaths per municipality. All deaths were also accounted among

89
Epidemiological situation of the congenital syndrome associated to Zika virus infection in Brazil, in 2015
cases on these reports. The total number of suspected cases reported and according to their classification was reported (under investigation, confirmed and discarded) as per definitions established on the surveillance protocol.3 Data from the national bank Resp-Microcephaly were analyzed in order to describe the epidemiological, social and demographic profile of suspected cases.
To add information on the profile of mothers, a relation between databases of Resp--Microcephaly and the Information System on Live Births (Sinasc) was traced in 2015-2016. The linkage was made in several steps; the first was to determine it and the subse-quent ones were probabilities made by the Technical Team of the General Coordination of Information and Epidemiological Analysis (CGIAE) using a method developed by them. The following key variables were used: name of the mother, municipality of residence and date of birth of the infant. Databases were linked up to epidemiological week 08/2016.
In order to describe the characteristics of suspected cases of congenital syndrome associated to Zika virus infection in live births, the following variables obtained from Sinasc were used:
• Mothers’ age (in complete years): under 15, 15 to 19, 20 to 24, 25 to 29, 30 to 34, 35 to 39, and 40 and above.
• Mothers’ education level (in years of schooling): 0 to 3, 4 to 7, 8 to 11, and 12 years or over.
• Mothers’ marital status: single, married under common-law, married, legally separated/divorced/widowed.
• Mothers’ ethnicity/skin color: white, black, Asian, brown and indigenous.• Number of prenatal care visits: none, 1 to 3, 4 to 5, 6 or more.• Type of delivery: vaginal or C-section.• Duration of the pregnancy (in weeks): less than 37 (pre-term), 37 to 41, 42 or more.• Sex of the infant: male and female.• Weight at birth (in grams): less than 2,500 (low weight) and 2,500 or more.
Deaths reported by State Health Departments to the Ministry of Health were analyzed and disclosed in epidemiological reports. Death data from Sinasc and Resp-Microcephaly were not analyzed. At first, cumulative data informed up to EW 21/2016 were analyzed and cases and deaths were described according to their final classification per region, federation unit (UF) and confirmation criteria (laboratory or image). The spatial distri-bution of suspected cases and those confirmed throughout the territory was identified, including deaths. Also, the number of new cases and percentage increase per epidemio-logical week of report were analyzed, as well as the progresses made in the conclusion of reported cases investigations.
Based on Resp-Microcephaly, the distribution of cases of newborns and infants with microcephaly and/or CNS alterations per epidemiological week of birth reported was analyzed and stratified per region of the country. In addition, the Z score of HC was calculated according to WHO reference and was further classified into: less or equal to

90
HEALTH BRAZIL 2015/2016 – An analysis of health situation and the epidemic caused by Zika virus and other diseases transmitted by Aedes Aegypti
Secretariat of Health SurveillanceMINISTRY OF HEALTH OF BRAZIL
-3 standard deviations, greater than -3 and less than or equal to -2 standard deviations and greater and -2 standard deviations. Live births with confirmed congenital infection by Zika virus had the main CNS alterations identified through imaging exams.
The capacity of definition of case in force was estimated focusing on microcephaly (HC less than or equal to -2 standard deviations for age and sex, according to WHO reference), as well as the capacity to identify cases with or without alterations of CNS suggesting congenital infection, that is, the real true-positive and true-negative. To do so, the sensitiveness and specificity of the definition was calculated by comparing the HC classification (with or without microcephaly) to the final classification of the case (confirmed or discarded) based on laboratory and imaging tests.
The analyses were conducted with the aid of the software Stata 13 (StataCorp. 2013. Stata Statistical Software: Release 13. College Station, TX: StataCorp LP). Secondary data analyzed within the scope of PHENC and PHEIC surveillance action were exclusively used. The study complied with the principles of ethics contemplated in the Resolution of the National Health Council (CNS) No. 466, dated December 12th, 2012.
Results
Epidemiological situation based on epidemiological reports
The accumulated distribution of reported cases of microcephaly and/or CNS altera-tions, according to definitions contained on the Surveillance Protocol, is presented in Table 1. Up to EW 21/2016 (May 28th, 2016) 7,723 suspected cases of congenital syndrome associated to Zika virus infection were reported (in newborns, stillbirths, miscarriages or fetuses), according to definitions of the Surveillance Protocol. Since the beginning of the emergency, the Brazilian Northeast Region presented the highest number of suspected cases and accounted for 76% of notifications until EW 21/2016, followed by the Southeast (13.5%) and the Midwest (5.5%) regions.
The states of Pernambuco, Bahia and Paraíba concentrated 51.4% of all suspected cases reported countrywide. Out of the total number of suspected cases of congenital syndrome associated to Zika virus infection, 3,162 (41%) remained under investigation until EW 21/2016. Of the 4,561 cases investigated and classified, 1,489 had microcephaly and/or CNS alteration suggesting congenital infection by Zika or STORCH (congenital syphilis, congenital toxoplasmosis, congenital rubella, congenital cytomegalovirus or congenital herpes) confirmed, and 3,072 were discarded. Among the confirmed cases, 223 (15%) were concluded from specific laboratory criteria for Zika virus (PCR technique and serology) and 51 (3%) were closed as suggestive of infection by STORCH.

91
Epidemiological situation of the congenital syndrome associated to Zika virus infection in Brazil, in 2015
Table 2 - Accumulated distributiona of suspected congenital syndrome cases associated to Zika virus infectionb - Brazil, November 8th, 2015 to May 28th, 2016 (epidemiological weeks 45/2015 to 21/2016)
Federation Units and Regions Total accumulateda cases Still under
investigationInvestigated and
confirmedc dInvestigated
and discardede
N % N N N
Brazil 7,723 ■■ 100 3,162 1,489 3,072
Alagoas 300 3.9 63 72 165
Bahia 1107 14.3 647 249 211
Ceará 490 6.3 186 110 194
Maranhão 261 3.4 80 126 55
Paraíba 882 11.4 311 129 442
Pernambuco 1982 25.7 491 358 1,133
Piauí 167 2.2 11 85 71
Rio Grande do Norte 428 5.5 253 113 62
Sergipe 234 3.0 114 77 43
NORTHEAST REGION 5,851 ■■ 75.8 2,156 1,319 2,376
Espírito Santo 149 1.9 88 12 49
Minas Gerais 112 1.5 54 3 55
Rio de Janeiro 455 5.9 275 64 116
São Paulo 329 4.3 198a 8b 123
SOUTHEAST REGION 1,045 ■■ 13.5 615 87 343
Acre 38 0.5 21 0 17
Amapá 11 0.1 2 8 1
Amazonas 20 0.3 11 4 5
Pará 30 0.4 29 1 0
Rondônia 15 0.2 4 4 7
Roraima 24 0.3 9 8 7
Tocantins 137 1.8 93 11 33
NORTH REGION 275 ■■ 3.6 169 36 70
Federal District 44 0.6 4 5 35
Goiás 136 1.8 63 14 59
Mato Grosso 227 2.9 118 16 93
Mato Grosso do Sul 18 0.2 2 2 14
MIDWEST REGION 425 ■■ 5.5 187 37 201
Paraná 37 0.5 6 4 27
Santa Catarina 7 0.1 1 1 5
Rio Grande do Sul 83 1.1 28 5 50
SOUTH REGION 127 ■■ 1.6 35 10 82
Source: Health Secretariats of the States and the Federal District (data updated until 5/28/2016).
a Cumulative number of reported cases of microcephaly and/or CNS changes, suggesting congenital infection in fetuses, miscarria-ges, stillbirths or newborns fulfilling the definition of previous operating case (33 cm), as well as the definitions adopted on the Surveillance Protocol (as of 12/9/2015) that defined the 32-cm-CP for newborns with 37 weeks or more of gestations and other protocol definitions.b According to definitions of the Protocol of Surveillance and Response to the Occurrence of Microcephaly and/or Altera-tions of the Central Nervous System (CNS).c Present typical changes: indicating congenital infection such as intracranial calcifications, dilation of the cerebral ven-tricles or posterior fossa alterations among other clinical signs observed by any imaging method or identification of the Zika virus in laboratory tests.d 223 cases were confirmed by specific laboratory criteria for Zika virus (PCR technique and serology). e Discarded for presenting normal exam results, for presenting microcephaly and/or congenital malformations confirmed by non-infectious causes or not being included in the definitions of cases.

92
HEALTH BRAZIL 2015/2016 – An analysis of health situation and the epidemic caused by Zika virus and other diseases transmitted by Aedes Aegypti
Secretariat of Health SurveillanceMINISTRY OF HEALTH OF BRAZIL
As informed by the Epidemiological Surveillance Center “Prof. Alexandre Vranjac” of São Paulo State Health Department, 198 cases were under investigation for congenital infection. Out of these, 39 are possibly associated to Zika virus infection; however, investi-gations were not yet concluded. 1 confirmed case of microcephaly by Zika virus infection in newborn with possible place of infection in another Federation Unit.
The 7,723 suspected cases were distributed into 1,441 (25.9%) of the 5,570 Brazilian municipalities as presented in Table 2. Municipalities with 50 or more suspected cases are mainly located in the Northeast Region followed by the Southeast region (states of Rio de Janeiro and São Paulo) and Midwest (Goiás and Mato Grosso) region. From the total of municipalities with reported cases, 539 (37.4%) had confirmed cases, being 460 in the Northeast Region of the country. Until EW 21/2016, only the state of Acre had no confirmed cases (Figure 1).
Table 3 - Distribution of municipalities with reported and confirmed cases of congenital syndrome associated to Zika virus infection* - Brazil, regions and Federation units,
November 8, 2015 to May 28, 2016 (epidemiological weeks 45/2015 to 21/2016)
Regions and Federation Units
Municipalities with suspected cases
Municipalities with confirmed cases
Total number of municipalities
N % N %
Brazil 1,441 25.9 539 9.7 5,570
Alagoas 73 71.6 29 28.4 102
Bahia 177 42.4 60 14.4 417
Ceará 102 55.4 47 25.5 184
Maranhão 85 39.2 60 27.6 217
Paraíba 135 60.5 53 23.8 223
Pernambuco 179 96.8 104 56.2 185
Piauí 67 29.9 36 16.1 224
Rio Grande do Norte 84 50.3 43 25.7 167
Sergipe 53 70.7 28 37.3 75
Northeast Region 955 53.2 460 25.6 1,794
Espírito Santo 28 35.9 9 11.5 78
Minas Gerais 58 6.8 3 0.4 853
Rio de Janeiro 48 52.2 11 12.0 92
São Paulo 92 14.3 8 1.2 645
Southeast Region 226 13.5 31 1.9 1,668
Acre 9 40.9 Without record Without record 22
Amapá 4 25.0 4 25.0 16
Amazonas 5 8.1 1 1.6 62
Pará 24 16.7 1 0.7 144
Rondônia 7 13.5 1 1.9 52
Roraima 6 40.0 2 13.3 15
Tocantins 52 37.4 9 6.5 139
North Region 107 23.8 18 4.0 450
Federal District 1 100.0 1 100.0 1
continued
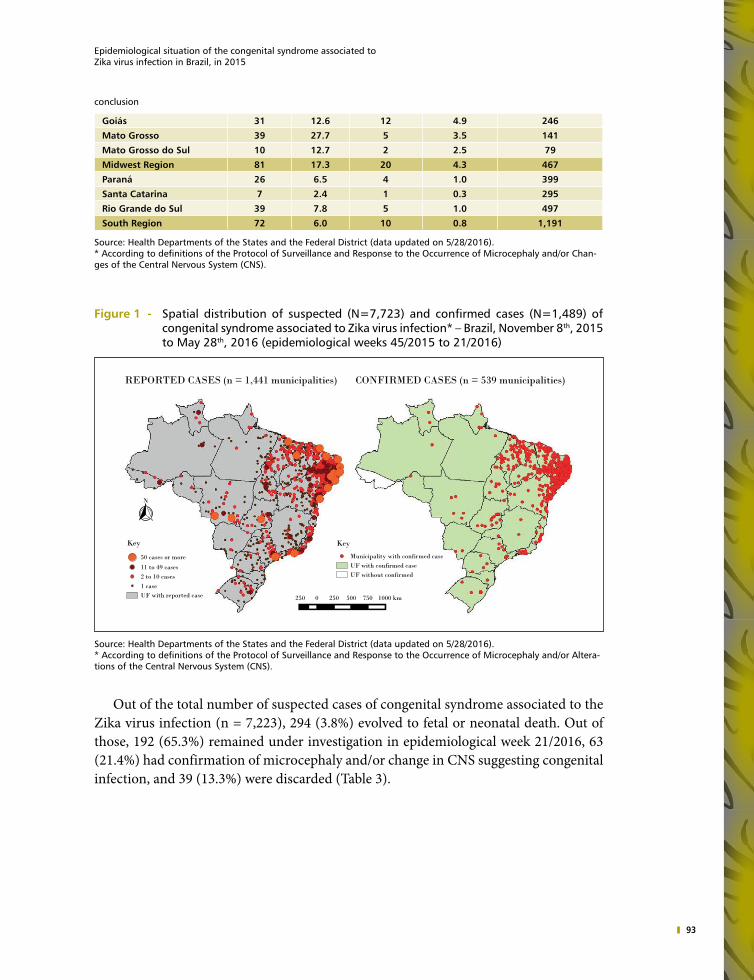
93
Epidemiological situation of the congenital syndrome associated to Zika virus infection in Brazil, in 2015
Goiás 31 12.6 12 4.9 246
Mato Grosso 39 27.7 5 3.5 141
Mato Grosso do Sul 10 12.7 2 2.5 79
Midwest Region 81 17.3 20 4.3 467
Paraná 26 6.5 4 1.0 399
Santa Catarina 7 2.4 1 0.3 295
Rio Grande do Sul 39 7.8 5 1.0 497
South Region 72 6.0 10 0.8 1,191
Source: Health Departments of the States and the Federal District (data updated on 5/28/2016).* According to definitions of the Protocol of Surveillance and Response to the Occurrence of Microcephaly and/or Chan-ges of the Central Nervous System (CNS).
Figure 1 - Spatial distribution of suspected (N=7,723) and confirmed cases (N=1,489) of congenital syndrome associated to Zika virus infection* – Brazil, November 8th, 2015 to May 28th, 2016 (epidemiological weeks 45/2015 to 21/2016)
1000 km7505002500250
N
REPORTED CASES (n = 1,441 municipalities) CONFIRMED CASES (n = 539 municipalities)
Key
Municipality with confirmed caseUF with confirmed caseUF without confirmed
Key
50 cases or more
11 to 49 cases2 to 10 cases1 caseUF with reported case
Source: Health Departments of the States and the Federal District (data updated on 5/28/2016).* According to definitions of the Protocol of Surveillance and Response to the Occurrence of Microcephaly and/or Altera-tions of the Central Nervous System (CNS).
Out of the total number of suspected cases of congenital syndrome associated to the Zika virus infection (n = 7,223), 294 (3.8%) evolved to fetal or neonatal death. Out of those, 192 (65.3%) remained under investigation in epidemiological week 21/2016, 63 (21.4%) had confirmation of microcephaly and/or change in CNS suggesting congenital infection, and 39 (13.3%) were discarded (Table 3).
conclusion

94
HEALTH BRAZIL 2015/2016 – An analysis of health situation and the epidemic caused by Zika virus and other diseases transmitted by Aedes Aegypti
Secretariat of Health SurveillanceMINISTRY OF HEALTH OF BRAZIL
Table 3 – Number of fetal or neonatal deaths among suspected cases of congenital syndrome associated to Zika virus infection according to classification – Brazil and Federation Units, November 8th, 2015 to May 28th, 2016 (epidemiological weeks 45/2015 to 21/2016)
Classification of deaths
Federation Unit Under Investigation Confirmed Discarded Total deaths
BRAZIL 192 63 39 294
Acre - - 1 1
Alagoas 3 3 1 7
Amapá - - 1 1
Bahia 31 1 1 33
Ceará 15 16 - 31
Federal District - 1 - 1
Espírito Santo 5 3 - 8
Goiás 3 - 2 5
Maranhão 8 - 1 9
Mato Grosso 8 2 3 13
Minas Gerais - 1 2 3
Paraíba 1- 11 3 24
Paraná - - 2 2
Pernambuco 61 2 2 65
Piauí - 3 5* 8
Rio Grande do Norte 6 13 - 19
Rio Grande do Sul 2 - 7 9
Rio de Janeiro 16 3 4 23
Rondônia - 1 1 2
Roraima 1 - - 1
São Paulo 2 - 2 4
Santa Catarina 1 - - 1
Sergipe 5 3 1 9
Tocantins 15 - - 15
Source: Health Departments of the States and the Federal District (data updated on 5/28/2016).*From the five deaths discarded by the state of Piauí, one comes from a municipality from the state of Maranhão.
Time analysis of data from epidemiological reports
Chart 1 presents the accumulated distribution of suspected cases reported, as well as the percentage increase according to the epidemiological week of report and region of the country. A significant increase is noted in the beginning of the first monitoring, passing from 399 cases on week 45 to 739 on week 46/2015 and representing an increase

95
Epidemiological situation of the congenital syndrome associated to Zika virus infection in Brazil, in 2015
of 85.2%. Then, a percentage reduction in the percentage increase of cases is noted, remai-ning under 2% as of epidemiological week 12/2016. Chart 2 shows new cases reported by epidemiological week. The increase initially noted was due to reports from the Northeast Region which presented a consistent reduction as of EW 48 of 2015, except for the first weeks of 2016. Report peaks of the Southeast Region were also noted in weeks 49/2015 and 4/2016. It is emphasized that the peak noted in EW 4/2016 was an artifact due to the vacation and recess period, which is also noted in the Northeast Region and not noted when analyzing data by EW of birth (Chart 2).
Chart 1 - Accumulated distribution of suspected congenital syndrome cases associated to Zika virus infection* and percentage increase per region – Brazil, epidemiological weeks 46/2015 to 21/2016 (November 15th, 2015 to May 28th, 2016) (n = 7,723)
Percentage increaseSouthSoutheastNorthMidwestNortheast
Epidemiological Week of Report
20162015
21201918171615141312111098765432152515049484746
Per
cent
age
incr
ease
(%)
90.0
80.0
70.0
60.0
50.0
40.0
30.0
20.0
10.0
0.0
9000
8000
7000
6000
5000
4000
3000
2000
1000
0
Rep
orte
d ca
ses
(n)
Source: Health Departments of the States and the Federal District (data updated on 5/28/2016).* According to definitions of the Protocol of Surveillance and Response to the Occurrence of Microcephaly and/or Altera-tions of the Central Nervous System (CNS).

96
HEALTH BRAZIL 2015/2016 – An analysis of health situation and the epidemic caused by Zika virus and other diseases transmitted by Aedes Aegypti
Secretariat of Health SurveillanceMINISTRY OF HEALTH OF BRAZIL
Chart 2 - Distribution of new suspected congenital syndrome cases associated to Zika virus infection* per region - Brazil, epidemiological weeks 46/2015 to 21/2016 (November 15th, 2015 to May 28 th, 2016) (n = 7,723)
20162015
21201918171615141312111098765432152515049484746
SouthSoutheastNorthMidwestNortheast
Epidemiological Week of Report
600
500
400
300
200
100
0
New
cas
es (n
)
Source: Health Departments of the States and the Federal District (data updated on 5/28/2016).* According to definitions of the Protocol of Surveillance and Response to the Occurrence of Microcephaly and/or Altera-tions of the Central Nervous System (CNS).
After the epidemiological week 2/2016, the epidemiological reports started to show the classification of cases in the following categories: under investigation, confirmed and discarded. In epidemiological week 2/2016, 87% of cases were under investigation. An expressive increase in the conclusion of cases investigation until epidemiological week 21/2016 was noted. Concluded cases (confirmed and discarded) represented 13% of re-ports in the beginning of the year and started to represent 59% in week 21/2016. Among those, confirmed cases grew from 6% to 19% (Chart 3).

97
Epidemiological situation of the congenital syndrome associated to Zika virus infection in Brazil, in 2015
Chart 3 – Distribution of new suspected congenital syndrome cases associated to Zika virus infection* per classification – Brazil, epidemiological weeks 2** to 21/2016 (January 10th to May 28 th, 2016) (n = 4,610)
21201918171615141312111098765432
DiscardedConfirmedUnder investigation
Epidemiological weeks
41%
19%
40%
87%
6%
7%100%
90%
80%
70%
60%
50%
40%
30%
20%
10%
0%
Per
cent
age
Source: Health Departments of the States and the Federal District (data updated on 5/28/2016).*Data by final classification were only available from epidemiological week 2/2016.** According to definitions of the Protocol of Surveillance and Response to the Occurrence of Microcephaly and/or Alte-rations of the Central Nervous System (CNS).
The distribution of fetal and neonatal deaths with suspected congenital syndrome associated to Zika virus infection is presented in Chart 4, according to the investigation status. Although progresses made in the conclusion of investigations were noted from the beginning of the monitoring, passing from 10% in EW 2/2016 to 25% in EW 3/2016, little variation is seen in the percentage of cases concluded in the following weeks, reaching 34% in EW 21/2016.

98
HEALTH BRAZIL 2015/2016 – An analysis of health situation and the epidemic caused by Zika virus and other diseases transmitted by Aedes Aegypti
Secretariat of Health SurveillanceMINISTRY OF HEALTH OF BRAZIL
Chart 4 - Distribution of percentage of deaths among suspected congenital syndrome cases associated to Zika virus infection* per classification - Brazil, epidemiological weeks 2** to 21/2016 (January 10th to May 28 th, 2016) (n = 245)
21201918171615141312111098765432
DiscardedConfirmedUnder investigation
Epidemiological weeks
65%
21%
13%
90%
10%100%
90%
80%
70%
60%
50%
40%
30%
20%
10%
0%
Per
cent
age
Source: Health Secretariats of the States and the Federal District (data updated until 5/28/2016).* Data by final classification were only available from epidemiological week 2/2016.** According to definitions of the Protocol of Surveillance and Response to the Occurrence of Microcephaly and/or Chan-ges of the Central Nervous System (CNS).
Characterization of newborns notification in Resp-Microcephaly
Resp-Microcephaly had 7,444 notifications of newborns with suspected congenital syndrome associated to the Zika virus infection until EW 21/2016. Chart 5 shows the distribution of such notifications per epidemiological week, indicating weeks with chan-ges in definitions of suspected cases to be reported to the Ministry of Health. The peak of notifications occurred in EW 47/2015 under the definition that considered CP ≤ 33 cm for newborns at term from both sexes. This definition was changed in a protocol disclosed in epidemiological week 49, and becoming in force as of EW 50 (HC ≤ 32 cm for newborns at term from both sexes). A reduction in the number of notifications was noted from the period of enforcement of these definitions, passing from 482 notifications in EW 50/2015 to 227 in EW 10/2016. A new version of the surveillance protocol was launched in EW 10/2016 and adopted a HC ≤ - 2 standard deviations for both sexes, as well as Intergrowth table as a reference for newborns at term.

99
Epidemiological situation of the congenital syndrome associated to Zika virus infection in Brazil, in 2015
Chart 5 – Number of suspected congenital syndrome cases associated to Zika virus infection* – Brazil, epidemiological week 40/2015 to 21/2016 (October 4th, 2015 to May 28 th, 2016) (n = 7,430)
Epidemiological week of report
20162015
21201918171615141312111098765432152515049484746454443424140
800
700
600
500
400
300
200
100
0
Rep
orte
d ca
ses
(n)
HC < -2 DPHC < 32cmHC < 33cm
Source: Resp (CGVR/SVS) on 5/28/2016 (EW 21/2016).* According to definitions of the Protocol of Surveillance and Response to the Occurrence of Microcephaly and/or Altera-tions of the Central Nervous System (CNS).
Chart 6 shows notifications of newborns with suspected congenital syndrome asso-ciated to Zika virus infection according to the EW of birth. An expressive increase in the number of notifications in EW 31/2015 was noted, thus reaching a peak in EW 47/2015. Since then, the number of suspected cases in live births was reduced.
Chart 6 - Distribution of suspected congenital syndrome cases associated to the Zika virus infection in live births* - Brazil, epidemiological week 1/2015 to 21/2016 (January 4, 2015 to May 28, 2016) (n = 7,444)
Epidemiological week of report
21201918171615141312111098765432121 22 23 24 25 26 27 28 29 30 31 32 33 34 35 36 37 38 39 40 41 42 43 44 45 46 47 48 49 50 51 522019181716151413121110987654321
20162015
600
500
400
300
200
100
0
Rep
orte
d ca
ses
(n)
Source: Resp (CGVR/SVS) until 5/28/2016 (EW 21/2016).* According to definitions of the Protocol of Surveillance and Response to the Occurrence of Microcephaly and/or Altera-tions of the Central Nervous System (CNS).

100
HEALTH BRAZIL 2015/2016 – An analysis of health situation and the epidemic caused by Zika virus and other diseases transmitted by Aedes Aegypti
Secretariat of Health SurveillanceMINISTRY OF HEALTH OF BRAZIL
Chart 7 shows the epidemic curve of suspected cases of congenital syndrome associa-ted to the Zika virus infection stratified per region of the country. The national curve is mainly the result of notifications from the Northeast Region, responsible for the substantial increase in EW 30/2015 and the peak in EW 47/2015. However, a substantial increase was also noted in notifications of the Southeast Region as of EW 47/2015 and remained around 50 notifications until EW 10/2016 with further reductions.
Chart 7 - Distribution of suspected congenital syndrome cases associated to the Zika virus infection in live births* per region of residence of the mother - Brazil, January 4th, 2015 to May 28 th, 2016 (epidemiological weeks 1/2015 to 21/2016) (n = 7,444)
Midwest Northeast North Southeast South
21201918171615141312111098765432121 22 23 24 25 26 27 28 29 30 31 32 33 34 35 36 37 38 39 40 41 42 43 44 45 46 47 48 49 50 51 522019181716151413121110987654321
20162015
450
400
350
300
250
200
150
100
50
0
Rep
orte
d ca
ses
(n)
Source: Resp (CGVR/SVS) on 5/28/2016 (SE 21/2016).*According to definitions of the Protocol of Surveillance and Response to the Occurrence of Microcephaly and/or Altera-tions of the Central Nervous System (CNS).
Characterizations in alterations of CNS
A total of 5,877 suspected cases of congenital syndrome associated to Zika virus infection in newborns reported until EW 08/2016 were analyzed, including only those born at term or post-term, that is, with gestational age equal to or above 37 weeks. Out of those, 1,045 (18%) presented a detailed description of the results of image examinations in Resp-Microcephaly. The main alterations in CNS included cerebral calcifications and ventriculomegaly identified in 16% and 13% of newborns assessed, respectively. Also, 7% of cases presented both alterations.
Regarding the relation with HC, alterations in CNS were more frequent among chil-dren with severe microcephaly (HC <- 3 standard deviations), out of which 15% (52/344) presented cerebral calcifications and ventriculomegaly which were less frequent among newborns with HC between -3 and -2 standard deviations (6%; 14/236) and those with HC considered normal (2%; 8/465) (Chart 8).

101
Epidemiological situation of the congenital syndrome associated to Zika virus infection in Brazil, in 2015
Chart 8 - Distribution (%) of suspected congenital syndrome cases associated to Zika virus infection in live births* regarding HC and alterations of the nervous central system - Brazil, from January 4th, 2015 to February 27 th, 2016 (epidemiological weeks 1/2015 to 8/2016) (n = 1,045)
Calcification and ventriculomegalyVentriculomegalyCalcificationNormal
> 2SD-< 3SD - >-3SD and ≤-2 SD
92
51
81
856
55
16
14
15100%
90%
80%
70%
60%
50%
40%
30%
20%
10%
0%_
Source: Resp (CGVR/SVS) on 5/28/2016 (EW 21/2016).* According to definitions of the Protocol of Surveillance and Response to the Occurrence of Microcephaly and/or Altera-tions of the Central Nervous System (CNS).
The definition of case in force, based on the presence of microcephaly, had 81% of sensitiveness and 59% of specificity. It was also noted that 19% of children with changes in CNS did not have microcephaly.
Characteristics of mothers and newborns with suspected congenital syndrome associated to Zika virus infection
Table 4 presents the characteristics of mothers and newborns with suspected congenital syndrome associated to Zika virus infection reported in Resp-Microcephaly and Sinasc. Out of the 5,877 newborns reported in Resp-Microcephaly until EW 8/2016, 5,194 (88.4%) were also reported in Sinasc.
Most mothers were of brown or black skin color (84.3%), aged from 15 to 29 years old (71.4%), with more than eight years of schooling (70.6%) and almost half were sin-gle, divorced or widowed (49.4%). Regarding prenatal care and delivery, 88% of mothers attended four or more prenatal visits and most of them had vaginal delivery (64.1%) with 37 to 41 weeks of pregnancy (81.5%).

102
HEALTH BRAZIL 2015/2016 – An analysis of health situation and the epidemic caused by Zika virus and other diseases transmitted by Aedes Aegypti
Secretariat of Health SurveillanceMINISTRY OF HEALTH OF BRAZIL
Table 4 - Characteristics of mothers and live births with suspected congenital syndrome cases associated to the Zika virus infection reported in Resp-Microcephaly and the Information System on Live Births - Brazil, from January 4th, 2015 to February 27
th, 2016 (epidemiological weeks 1/2015 to 8/2016) (n = 5,194)
Variables n %
Mother’s age (years)
Less than 15 219 4.2
15 to 19 1,173 22.6
20 to 24 1,412 27.1
25 to 29 1,120 21.6
30 to 34 751 14.5
35 to 39 397 7.6
40 and above 122 2.4
Mother’s schooling (years)
0 to 3 242 4.8
4 to 7 1,254 24.6
8 to 11 3,163 62.1
12 or more 431 8.5
Mother’s marital status
Single 2,497 48.7
Common-law marriage 1,461 28.4
Married 1,143 22.2
Legally separated/divorced 33 0.6
Widowed 5 0.1
Mother’s ethnicity/skin color
Brown 3,795 76.6
White 744 15.0
Black 386 7.8
Indigenous 22 0.4
Asian 12 0.2
Number of prenatal care visits
None 165 3.2
1 to 3 453 8.8
4 to 6 1,660 32.2
7 and above 2,873 55.8
Type of delivery
Vaginal 3,322 64.1
C-section 1,858 35.9
Gestational week at birth
Less than 37 weeks 761 15.1
37 to 41 weeks 4,111 81.5
42 weeks and more 172 3.4
Source: Resp (CGVR/SVS) and Sinasc (CGIAE/SVS) on EW 08/2016.
The characteristics of the 5,194 newborns reported in Resp-Microcephaly and Sinasc until EW 8/2016 are presented in Chart 9. Most children were female (61.2%) and weighing equal to or more than 2,500 g (69.9%). Almost one third had low weight at birth (30.1%).

103
Epidemiological situation of the congenital syndrome associated to Zika virus infection in Brazil, in 2015
Chart 9 - Distribution (%) of cases with suspected congenital syndrome associated to Zika virus infection in live births reported in Resp-Microcephaly and the Information System on Live Births per sex and weight at birth - Brazil, from January 4th, 2015 to February 27 th, 2016 (epidemiological weeks 1/2015 to 8/2016) (n = 5,194)
2,500 g or moreLess than 2,500 gFemaleMale
70
30
61
39
Weight at birthNewborn sex
Source: Resp (CGVR/SVS) and Sinasc (CGIAE/SVS) on EW 08/2016.
Discussion
A public health emergency is a situation that requires the urgent deployment of pre-vention, control and risk containment, damages and public health concern measures.12 The Secretariat of Health Surveillance, within the Ministry of Health (SVS/MS) is responsible for coordinating the preparation and response of health surveillance action in national and international public health emergencies, in cooperation with state and municipal bodies, as well as other government bodies, as established in Ordinance GM/MS No. 1,378 dated July 9th, 2013. Therefore, a Plan of Response to Public Health Emergencies was structured to use a coordination and control system for a timely and efficient response.13
This chapter described the epidemiological situation of PHEIC related to the increased occurrence of microcephaly and/or changes in CNS in Brazil after the Zika virus fever outbreak in the beginning of 2015.14 Since EW 45/2015, SVS/MS publishes bulletins and epidemiological reports weekly with the purpose of disclosing consolidated data provided by Departments of Health Surveillance on reported cases and their investigation, as well as recommendations for managers and the general population. Results presented evidence of significant improvements regarding the conclusion of cases, a result of the integrated action of all three SUS management levels with the mobilization of managers and professionals involved. Actions include the Strategy of Quick Action to Strengthen Health Care and

104
HEALTH BRAZIL 2015/2016 – An analysis of health situation and the epidemic caused by Zika virus and other diseases transmitted by Aedes Aegypti
Secretariat of Health SurveillanceMINISTRY OF HEALTH OF BRAZIL
Social Protection of Children with Microcephaly established by Ministerial Ordinance No. 405 dated March 15th, 2016.15 and instituted within SUS and the Social Assistance of the National Health System. In addition, state initiatives through community effort have contributed substantially to the conclusion of cases with the conduction of clinical assessments and imaging exams.
Despite the progresses in deaths investigation in the beginning of the monitoring, little variation in the percentage of confirmed cases in subsequent weeks was noted. The difficulties to conclude the investigation of these suspected deaths can be related to a series of factors, and the main ones pointed by the State and Municipal Departments of Health are: refusal of those responsible for providing information for surveillance teams; unavailability of results of examinations during pregnancy, thus making it difficult to identify a possible relation between the death by congenital infection as syphilis, toxo-plasmosis and cytomegalovirus; impossibility to conduct imaging exams especially in stillbirths; impossibility to collect material to conduct laboratory examinations; delay in the processing of samples and release of results due to the high demand for these services in a short period of time; inconclusive laboratory exams due to error in the collection and storage of samples, among others. Such difficulties are challenges that need to be overcome by all three management levels of SUS.
The analyses of Resp-Microcephaly data allowed identifying the national epidemics curve of microcephaly cases in newborns in Brazil with suspected association to congenital infection by Zika virus from 2015 to 2016. A change in the occurrence standard was noted in EW 31/2015 peaking in EW 47/2015. Also, occurrences reduced in 2016 thus suggesting the closing of a cycle of births with pregnancies as of November, 2014. These exclusive data reinforce how important the work conducted by all three management levels of SUS are in the event’s monitoring and surveillance culminating in the creation and feeding of a national database that can be used to conduct internationally relevant researches.
From the linkage between Resp-Microcephaly and Sinasc, the profile of newborns and their mothers could be identified with key characteristics, especially in relation to prenatal and delivery. Most newborns had brown or black mothers aged less than 30 years old. In addition, an expressive percentage was of single, divorced and widowed mothers. These characteristics show that a significant part of these newborns can be at a vulnerable and socially risky situation thus implying a need for further attention from the public power to assist these families through social protection public policies.16
Results should be interpreted by taking some limitations into account. First, data presented in epidemiological reports are informed in a consolidated manner by city of residence of the mother to the Ministry of Health. Data may vary from notifications in-cluded in Resp-Microcephaly. As it is a form for electronic record of cases, notifications included in Resp-Microcephaly should be validated by SES (State Health Secretariat) checking if the reported case meets the definitions established by the protocol in force and feed backing information on the national database. This process may have delays implying eventual differences between the epidemiological report and data obtained directly from

105
Epidemiological situation of the congenital syndrome associated to Zika virus infection in Brazil, in 2015
Resp-Microcephaly. However, SVS/MS has been actively working for Resp-Microcephaly to become the only source of information on cases of congenital syndrome associated to the Zika virus infection throughout the country on the short term.
Changes to the criteria of definition of suspected case for notification have a clear in-fluence on the epidemic curve. Initially, the Ministry of Health adopted a more sensitive criterion to characterize microcephaly in newborns at term in order to capture a higher number of cases, and classifying CPs ≤ 33 cm as a case. Thus, many normal children can be included as a suspected case of microcephaly (false-positive) and be unnecessarily submitted to image examinations involving radiation (as computerized tomography, for example), in addition to causing an unnecessary anguish to parents. This is why the definitions of case were reviewed - in order to make them more specific and better express the reality of this public health event. As of EW 11/2016, new definitions of case based on recommendations of Medical Scientific Societies, experts consulted and WHO were adopted.17
Despite the limitations related to the changes in suspected case definitions over time, the adoption of more sensitive criteria in the beginning of the epidemics enabled to iden-tify one fifth of newborns with changes of CNS suggesting congenital infection did not present microcephaly according to international definitions.17 This finding has important implications for health surveillance, and indicates the need to expand the criteria to detect the consequences of the Zika virus congenital infection.
Data presented on this chapter show progresses made to identify suspected cases is evident, as well as in their investigation and conclusion. However, there are still challen-ges especially in terms of investigation of suspected deaths and laboratory investigation of Zika virus infection. In addition, the results presented herein reinforce the need to conduct epidemiological studies in order to fill existing gaps in the knowledge about congenital syndrome such as the need to know better the social and demographic profile of newborns and their families, as well as to estimate the risk of microcephaly and other changes of CNS associated to Zika virus congenital infection.
References
1 BRAZIL. Ministério da Saúde. Secretaria de Vigilância em Saúde. Situação epidemiológica de ocorrência de microcefalias no Brasil, 2015. Boletim Epidemiológico, v. 46, n. 34, p. 1-3, 2015.
2 BRAZIL. Ministério da Saúde. Portaria GM n° 1.813, de 11 de novembro de 2015. Declara Emergência em Saúde Pública de importância Nacional (Espin) por alteração do padrão de ocorrência de microcefalias no Brasil. Diário Oficial da União, Poder Executivo, Brasília, DF, ano 152, n. 216, 11 nov. 2015. Seção 1, p. 51.
3 BRAZIL. Ministério da Saúde. Secretaria de Vigilância em Saúde. Departamento de Vigilância das Doenças Transmissíveis. Protocolo de vigilância e resposta à ocorrência de microcefalia e/ou alterações do sistema nervoso central (SNC): versão 2.1. Brasília, 2016.
4 WORLD HEALTH ORGANIZATION. WHO statement on the first meeting of the International Health Regulations (2005). Emergency Committee on Zika virus and observed increase in neurological disorders and neonatal malformations. 2016. Available at: <http:// www.

106
HEALTH BRAZIL 2015/2016 – An analysis of health situation and the epidemic caused by Zika virus and other diseases transmitted by Aedes Aegypti
Secretariat of Health SurveillanceMINISTRY OF HEALTH OF BRAZIL
who.int/mediacentre/news/statements/2016/emergency-committee-zika-microcephaly/ en/>. Access on: 18 Jul. 2016.
5 WORLD HEALTH ORGANIZATION. International health regulations. Geneva, 2005.6 BRAZIL. Ministério da Saúde. Registro de Eventos em Saúde Pública - Microcefalia. 2015.
Available at: <http://resp.saude.gov.br/microcefalia>. Access on: 18 Jul. 2016.7 BRAZIL. Ministério da Saúde. Secretaria de Vigilância em Saúde. Departamento de Vigilância
das Doenças Transmissíveis. Nota informativa no 01/2015 - Coes Microcefalias: procedimentos preliminares a serem adotados para a vigilância dos casos de microcefalia no Brasil. Brasília, 2015.
8 BRAZIL. Ministério da Saúde. Secretaria de Vigilância em Saúde. Departamento de Vigilância das Doenças Transmissíveis. Protocolo de vigilância e resposta à ocorrência de microcefalia relacionada à infecção pelo vírus Zika: versão 1.0. Brasília, 2015.
9 PAN AMERICAN HEALTH ORGANIZATION. Guideline for Zika virus disease and complications surveillance. Washington, D.C., 2016.
10 EICKMANN, S. H. et al. [Zika virus congenital syndrome]. Cadernos de saude publica, v. 32, n. 7, e00047716, 2016.
11 BRAZIL. Ministério da Saúde. Secretaria de Vigilância em Saúde. Secretaria de Atenção à Saúde. Manual de vigilância do óbito infantil e fetal e do Comitê de Prevenção do Óbito Infantil e Fetal. Brasília, 2009.
12 CARMO, E. H.; PENNA, G.; OLIVEIRA, W. K. Emergências de saúde pública: conceito, caracterização, preparação e resposta. Estud. av [online], v. 22, n. 64, p. 19-32, 2008.
13 BRAZIL. Ministério da Saúde. Secretaria de Vigilância em Saúde. Departamento de Vigilância em Saúde Ambiental e Saúde do Trabalhador. Plano de Resposta às Emergências em Saúde Pública. Brasília, 2014.
14 CARDOSO, C. W. et al. Outbreak of Exanthematous Illness Associated with Zika, Chikungunya, and Dengue Viruses, Salvador, Brazil. Emerging infectious diseases, v. 21, n. 12, p. 2274-2276, 2015.
15 BRAZIL. Ministério da Saúde. Portaria Interministerial n° 405 de 15 de março de 2016. Institui, no âmbito do Sistema Ünico de Saúde (SUS) e do Sistema Único de Assistência Social (Suas), a Estratégia de Ação Rápida para o Fortalecimento da Atenção à Saúde e da Proteção Social de Crianças com Microcefalia. Diário Oficial da União, Poder Executivo, Brasília, DF, n. 51, 16 mar. 2016. Seção 1, p. 27.
16 GOMES, M. A.; PEREIRA, M. L. D. Família em situação de vulnerabilidade social: uma questão de políticas públicas. Ciência & Saúde Coletiva, v. 10, n. 2, p. 357-363, 2005.
17 WORLD HEALTH ORGANIZATION. Interim guidance (4 March 2016): assessment of infants with microcephaly in the context of Zika virus. 2016. Available at: <http://apps.who.int/iris/bitstream/10665/204475/1/WHO_ZIKV_MOC_16.3_eng.pdf>. Access on: 18 Jul. 2016.
18 FENTON, T. R.; KIM, J. H. A systematic review and meta-analysis to revise the Fenton growth chart for preterm infants. BMC Pediatr., v. 13, p. 59, 2013.
19 WORLD HEALTH ORGANIZATION. The WHO Child Growth Standards: WHO, 2006. Available at: <http://www.who.int/childgrowth/standards/en/>. Access on: 18 Jul. 2016.
20 VILLAR, J. et al. International standards for newborn weight, length, and head circumference by gestational age and sex: the Newborn Cross-Sectional Study of the Intergrowth-21st Project. Lancet, v. 384, n. 9946, p. 857-868, 2014.

Strategies to control the Aedes aegypti: a reviewi7
i This chapter is a reprint of the original piece published in the journal of the Brazilian National Health System: Epidemiology and Health Services. Quotations should make reference to the original publication: ZARA, A. L. S. A. et al. Aedes aegypti control strategies: a review. Epidemiology and Health Services Journal, Brasília, v. 25, n. 2, p. 391-404, Apr./June, 2016.

Table of Contents
Abstract 109Introduction 109Discussion 118References 120

109
Strategies to control the Aedes aegypti: a review
Abstract
Objectives: To describe the main strategies to control Aedes aegypti, with emphasis on promising technological innovations for use in Brazil.
Methods: This study is a non-systematic review of the literature.Results: Several technologies have been developed as alternatives in the control of
Ae. aegypti, using different mechanisms of action, such as selective monitoring of the infestation, social interventions, dispersing insecticides, new biological control agents and molecular techniques for population control of mosquitoes, also considering the combination between them. Evolving technologies require evaluation of the effectiveness, feasibility and costs of implementation strategies as complementary to the actions already recommended by the National Program for Dengue Control.
Conclusion: The integration of different compatible and effective vector control strategies, considering the available technologies and regional characteristics, appears to be a viable method to try to reduce the infestation of mosquitoes and the incidence of arbovirus transmitted by them.
Keywords: Aedes. Insects vectors. Control of vectors. Control of mosquitoes. Review literature as topic.
Introduction
Aedes control has become an important challenge, especially in developing countries. Even considering situations in which resources intended to control the vector are appro-priate to implement programs, they often do not succeed. Aspects related to municipalities’ infrastructure problems as low coverage of garbage collection and intermittence in water supply compromise the efficacy of traditional methods of Aedes control.1,2
There are two main species of mosquitoes of the genus Aedes capable of transmitting other arboviruses as chikungunya, Zika and yellow fever besides dengue: Aedes aegypti and Aedes albopictus.3-6
Ae. aegypti was first described by Linnaeus in Egypt, in 1762,7 when the mosquito was present in tropics and subtropics almost throughout the American continent, in Southeast Asia and all over India.8 This species was probably introduced in Brazil in the colonial period, between the 16th and 19th centuries, during the commerce of slaves.9,10 With the destruction of natural habitats due to anthropogenic pressure, part of the wild population suffered a selective process that favored the dissemination and survival of the species in human agglomerates.7,11
The Ae. aegypti etiology benefits its broad dispersion, favored in urban environments, preferably inside and around households. They are rarely found in semi-wild environments or where men are not intensely present. Breeders are mainly artificial recipients, both open and abandoned, which serve as a rainwater reservoir, and those used to store water for

110
HEALTH BRAZIL 2015/2016 – An analysis of health situation and the epidemic caused by Zika virus and other diseases transmitted by Aedes Aegypti
Secretariat of Health SurveillanceMINISTRY OF HEALTH OF BRAZIL
domestic use.9 Breeders in environments inhabited by men favor the quick proliferation of the species for two factors: ideal conditions for reproduction and feeding sources.
The fight against Ae. aegypti became systematized and intensified in Brazil after the 20th century with the purpose of reducing the number of cases of urban yellow fever, which had caused the death of millions of people. Vector control was made by mechani-cally eliminating breeders; when elimination was not possible, breeders were treated with larvicide, as well as other insecticides.12
Between 1958 and 1973, Ae. aegypti was eradicated from the country twice.13,15 However, the first registries of the vector reintroduction in Brazil emerged in 1976 due to failures in the epidemiological surveillance and the accelerated population’s growth.16-18 Since then, the Ae. aegypti is present in all Federation Units (UF), distributed into approximately 4,523 municipalities.6
Adaptations of Ae. aegypti allowed it to become abundant in municipalities and to be easily taken to other areas through transport means, which increased its vector compe-tence, that is, its skill to become infected by a virus, replicate it and transmit it.19 Females are able to make multiple ingestions of blood during a single gonadotrophic cycle, thus expanding its ability to be infected and transmit the virus. This behavior makes Ae. aegypti an efficient vector.20
Eggs quiescence allows the maintenance of the cycle in nature during seasonal weather variations as the feasibility of Ae. aegypti eggs reaches 492 days in drought, hatching after contact with water.21
Ae. albopictus, originated in Asia, has the ability to tolerate low temperatures8 and shows preferences for rural, semiwild and wild environments, and in the lack of human artifacts feeds from nectar and wild animal blood and reproduces in natural deposits.22
In Brazil, the first record of Ae. albopictus was in 1986, in the state of Rio de Janeiro,10 then in Minas Gerais and São Paulo, and in Espírito Santo23 in the following year. Ae. albopictus was reported in 3,285 Brazilian municipalities in 2014 with absence in four states: Sergipe, Acre, Amapá, and Roraima.23 Although there are similarities between the Ae. aegypti and Ae. albopictus behavior, the differences between them determine the dy-namics of diseases transmission, viruses propagation and species dissemination.10 Climatic conditions (temperature, rainfall, altitude) interfere in the Ae. aegypti vital cycle, as well as domicile , dispersion, meal and reproduction.24
Given the challenges to control the vector and a serious and concerning scenario in relation to arboviruses outlined by the expansion of these viruses worldwide, adopting specific strategies with more investments in proper methods providing sustainability to actions established by surveillance networks and result in the analysis of its effectiveness becomes essential. Thus, given the current scenario of outbreaks and epidemics of Zika, chikungunya and dengue, this study becomes relevant as it describes the main strategies to control Ae. aegypti with emphasis in promising technology innovations for use in Brazil. This non-systematic review of literature addresses topics about control programs, mechanisms, strategies and technology innovations for vector control. Such data are ex-

111
Strategies to control the Aedes aegypti: a review
pected to contribute to the reflection on the theme, as well as the guidance or orientation of control actions.
Ae. aegypti control programs in Brazil
As of 1996, the Ministry of Health implemented the Ae. aegypti Eradication Plan, which preconized the multi-sectorial operation and provided for a decentralized model with the participation of three government levels whose main goals focused on reducing hemorrhagic dengue cases. Even with the efforts to structure the fight against the vector throughout municipalities, the Plan could not achieve the necessary multi-sectorial action it needed which can be seen as one of the factors responsible for the failure to contain the increased number of dengue cases and advance of Ae. aegypti infestation. 25,26
In 2001, the government gave up the target to eradicate the mosquito and started to consider controlling the vector by implementing the Dengue Control Actions Intensifica-tion Plan, which prioritized actions in municipalities with greater dengue transmission. In 2002, the National Program for Dengue Control (NPDC) was prepared due to incre-ased risk of outbreaks, occurrence of severe dengue cases and reintroduction and quick dissemination of serotype 3 in the country.25-27
Supported by the Ministry of Health, states and municipal departments of health started to manage and execute NPDC actions involving ten main components: epidemiological surveillance, vector combat, assistance to patients, integration with primary health care, environmental sanitation actions, integrate health education actions, communication and social mobilization, human resources qualification, legislation, political and social support and NPDC monitoring and assessment.25,27,28 Thus, the Program stopped being exclusively directed to tackling the vector and suggested adaptations consistent with local specific municipalities, including the possibility to prepare sub-regional plans.28
Control strategies
In Brazil, health community agents and endemic combat agents in partnership with the population are responsible for promoting the mechanic and chemical control of the vector. Their actions are focused on detecting, destructing or appropriately directing natural or artificial water reservoirs that may serve as a deposit for Aedes eggs. Another supplementary strategy recommended by the Ministry of Health is the promotion of educational actions during the household visit by community agents focused on ensuring the sustainability of breeder elimination by home owners, in an attempt to break the chain of diseases transmission.26
Basically, three types of control mechanisms can be used: mechanical, biological and chemical.
• Mechanical control: consists in adopting practices capable of eliminating the vector and breeders or reduce the mosquito contact with the man. The main mechanical

112
HEALTH BRAZIL 2015/2016 – An analysis of health situation and the epidemic caused by Zika virus and other diseases transmitted by Aedes Aegypti
Secretariat of Health SurveillanceMINISTRY OF HEALTH OF BRAZIL
control activities involve protection, destruction or proper destination of breeders, reservoirs drainage and installation of screens in doors and windows. 26,29-32
• Biological control: based on the use of predators or pathogens that are able to reduce the vector population. Fish,3,34 aquatic invertebrates that eat larvae and pupae, and pathogens that release toxins as bacteria, fungi and parasites26,29,30 are the possible alternative of predators. Another alternative is to use Bacillus thuringiensis israelensis (Bti), a bacillus with potent larvicide action as it produces protein endotoxins.35-37 However, although Bti is efficient when reducing the number of immature Aedes in short-term treated recipients, there is no evidence that this isolated method may cause an impact in the reduction of dengue morbidity in the long term.30,35,38
• Chemical control: it is the use of chemicals that can be neurotoxic, analogous to juvenile hormone and inhibitors of chitin synthesis,29,30 to kill larvae and adult insects. This is a type of control recommended upon rational and safe use for the environment and the population, supplement surveillance actions and environ-mental handling due to the possibility of selecting vectors resistant to products and causing environmental impacts.29,30
Insecticides to control adult mosquitoes populations (adulticides) and in its larval form (larvicide) can be used through focal and perifocal treatment and the aerospace spraying of ultra-low volume (ULV) insecticides. Focal treatment is made by applying a (chemical or biological) larvicide product in positive deposits for immature forms of mosquitoes that cannot be eliminated mechanically. 26,29,39
Perifocal treatment is the application of an adulticide layer of residual action in external walls of breeders located in strategic points through manual sprayer and is indicated for recently infected places as a supplementary measure to the local treatment in strategic points. 26,29,39
The ULV insecticides aerospace spraying treatment made with portable equipment or coupled to vehicles has the specific purpose of eliminating adult forms of Ae. aegypti, and should be only used to block the transmission and control outbreaks or epidemics. This is not a selective nebulization and promotes the elimination of any mosquito present in the environment. Its indiscriminate use to fight other insects is not recommended. 26,29
Due to the resistance in samples of Ae. aegypti populations to the insecticides, NPDC has been promoting its replacement over the years. Organophosphates (malathion®, fenitrothion® and temephos) were the first ones to replace organochlorine. In turn, pyre-throids (cypermethrin® and deltamethrin®) have been used as an alternative to replace organophosphates because of its high efficiency against adult mosquitoes and as it need lower quantities of active product. In addition to the environmental impact, pyrethroids have a high cost.26,30,39,40 Monitoring the susceptibility to insecticides in different areas of the country is an important ration strategy to broaden the knowledge on resistance mechanisms and control the vector infestation levels locally.41

113
Strategies to control the Aedes aegypti: a review
Technology innovations for vector control
Several technologies have been developed as alternatives in the control of Ae. aegypti, using different action mechanisms as social measures, selective monitoring of the infesta-tion, dispersion of insecticides, new chemical and biological control agents and molecular procedures for population control of mosquitoes, also considering combining them.
Eco-bio-social approach
The eco-bio-social approach is highlighted for the application of concepts and practices related to social education and care with the environment as allies of mosquito control. Such approach has three main elements: (i) transdisciplinarity: implies an inclusive vision of health problems related to the ecosystem; (ii) participation of stakeholders: involves several partners including the local community; and (iii) equity: comprises the equal participation of men and women and different social groups in Aedes fighting actions.42,43 In practice, this approach is led by several community sectors, including health and en-vironmental education and use of mechanical tools without the use of insecticides for vector control. Health education materials socially and culturally appropriate are develo-ped and used by several groups - women, students, managers, new volunteer groups for environmental health. Activities are focused on eliminating water reservoirs, placing caps in recipients likely to proliferate mosquitoes and install screens on windows and doors.42,43
Risk mapping
Risk mapping is also a promising strategy developed to assess and identify risk area thus increasing arboviruses transmission in certain territories by using local spatial sta-tistics. When linking spatial data with entomological surveillance data (characteristics, presence, infestation indices, assessment of control methods efficiency), epidemiological surveillance, laboratory and sanitation network, specific vector control actions are directed for priority areas.44,45
Natural compounds
As an alternative of chemical control, some natural compounds as essential plant oils have been investigated in order to check the larvicide activity against Ae. aegypti.46-48 The characteristics of certain structural chemical groupings of these compounds or their combination may increase or reduce the larvicide activity. 46-48
This is a research area that has been awakening a lot of interest, considering that it is necessary to produce efficient and safe insecticides for the population and the environ-ment.46,47 A study conducted by Santos et al46 showed that 21 compounds presented good larvicide activity against Ae. aegypti with the increased power among those with more

114
HEALTH BRAZIL 2015/2016 – An analysis of health situation and the epidemic caused by Zika virus and other diseases transmitted by Aedes Aegypti
Secretariat of Health SurveillanceMINISTRY OF HEALTH OF BRAZIL
lipophilic chemical groupings. These compounds are considered harmless as they are used as flavoring additives in foods for human consumption - for example, the limonene found in citric fruits shell as lemons and oranges.47 Highlighting that these new compounds should, in addition to the larvicide effect, show a residual prolonged effect in deposits where they are applied is important. This is a very important characteristics to adopt a certain compound in public health campaign activities.
Wolbachia
As a biological control of the vector, the use of Wolbachia, a species of intracellular symbionts bacteria, harmless to men and pets found naturally in over 60% of insects49 is being investigated. Wolbachia is capable of reducing an adult mosquito lifetime by half and is capable of producing full cytoplasmic incompatibility, thus resulting in sterile progeny.50,51
This is an innovative approach with the purpose of reducing the dengue virus trans-mission by the vector mosquito naturally and self-sustainably.49,50,52-54
This strategy consists in infecting the Ae. aegypti mosquito with specific Wolbachia strains capable of producing sterile mosquitoes. Interrupting the Ae. aegypti reproduc-tion cycle is when male mosquitoes with Wolbachia mate with female mosquitoes with Wolbachia, and these females lay eggs that will not eclode. In turn, the transmission of bacteria for descending generations occurs when male mosquitoes with Wolbachia mate with females that already carry the bacteria and vice-versa. With this, the virus transmis-sion chain is expected to be interrupted when the mosquito population is infected.49,55,56 Wolbachia was also capable of suppressing or eliminating the arbovirus transmission through the competition for amino acids between the host mosquito and the virus, which does not imply the induction of mutations in the pathogen.55,57,58 There is no evidence that Wolbachia promotes mutations in Zika virus and hence cause microcephaly.
Field researches to assess the interaction Wolbachia-Ae. aegypti started in Australia in 2008 and are being developed in Vietnam and Brazil. The method is based on the weekly release of mosquitoes with Wolbachia in order to assess their ability to establish in the environment and reproduce with the mosquitoes already there.54,59-61
Insecticide-dispersing mosquitoes
Insecticide-dispersing mosquitoes are being employed successfully as experiment. The strategy consists in attracting Aedes females to small recipients called “dissemination stations” treated with pyriproxyfen insecticide. In dissemination stations, the powder insecticide microparticles stick to the body of the mosquito and are taken by them to breeders within a 400-meter radius. When females get to reservoirs to lay eggs, the in-secticide particles are left by them on the water and reservoirs then become lethal for mosquito larvae.62,63

115
Strategies to control the Aedes aegypti: a review
Residual in-home spatial nebulizer (IRS)
IRS is also undergoing experiments and consists in applying residual insecticide (such as deltamethrin) inside houses in specific points to attract adult mosquitoes - such as dark places behind and below furniture, inside closets, inside shoes, behind curtains, among others. There are evidences of immediate and lasting effect in the reduction of immature and adult Ae. aegypti populations.64,65
Devices with insecticides
Plastic devices containing insecticides of slow and continuous release are a practical alternative in houses with effects lasting up to 20 days. The strategy was proven effective to avoid stings and kill Ae. aegypti females. 66,67
Mosquitoes exposed to 5% to 10% formulations of metofluthrin are almost entirely inhibited to sting; within only a few minutes Ae. aegypti females are disoriented and se-arch for resting places. According to researches responsible for the device development, 80% to 90% of mosquitoes die in less than one hour.66,67 The disadvantages of using this technology include the limitation of the insecticide effect in big environments and repla-cement of devices after losing the insecticide’s effect.66,67
Transgenic mosquitoes
Genetic strategies are also being developed to control vectors,68-70 and are usually divided into two steps. The first step consists in reducing or even eliminating mosquitoes species by developing lethal genes or capable of making insects sterile. The second step involves the transformation or replacement of the population by introducing an effector gene to reduce or block the disease transmission to the wild population.71,72
Using sexing technologies is essential in mass creation and release in the environment because only male mosquitoes can be released, once they do not feed of blood as females, and the risk of stings and disease transmission is reduced.69,71-73
In Brazil, field researches to assess risks and effectiveness of the release of genetically modified mosquitoes started to be conducted in Juazeiro and Jacobina, in Bahia, and in Piracicaba, in São Paulo, as of 2010.74-76 Preliminary results showed that, after releasing transgenic mosquitoes in Juazeiro-BA, 80% to 95% of the Ae. aegypti population was re-duced.76 In April 2014, OX513A (a strain of transgenic mosquitoes produced by the British company Oxitec®) received a technical approval from the National Biosafety Technical Committee (CTNBio) for commercial release in Brazil.
Insects sterilization by irradiation
Another promising vector control alternative is the sterile insect technique (SIT) 77-79 by irradiation, which consists in treating male insects with a minimal dosage of gamma rays

116
HEALTH BRAZIL 2015/2016 – An analysis of health situation and the epidemic caused by Zika virus and other diseases transmitted by Aedes Aegypti
Secretariat of Health SurveillanceMINISTRY OF HEALTH OF BRAZIL
or x-rays to induce random chromosomal rearrangements and cause male sterilization. Mating of sterile male released with native wild females may lead to a reduced potential of female reproduction and thus contribute to the local elimination or suppres-sion of vector populations in case the number of males released is sufficient and occurs during the necessary time.80-82
Combined techniques
Wolbachia and SiT by irradiation
Because of the need to minimize the risk of population replacement for the use of Wolbachia and the risk of pathogen transmission by mosquitoes submitted to SIT by irradiation, a combination of SIT techniques and incompatible insects by Wolbachia (incompatible insect technique - IIT) is being tested.80,83 This combined strategy consists in infecting mosquitoes with Wolbachia and then submit them to x-rays or gamma rays exposure. One of the advantages is that the technologies does not require the sexing process, which is a relatively expensive and lengthy procedure.80,83
Clothes impregnated with insecticides
Using uniforms impregnated with insecticides is a vector control alternative for chil-dren. This technology is already used in military uniforms to avoid insects sting when fighting in the jungle.84-86 It has the purpose of avoiding mosquitoes stings when children are at school. The disadvantage is that the uniform is only used in a certain period of the day and during school days. It can be a useful technology for pregnant women in order to prevent Zika virus infection and implying in microcephaly and other neurological complications.
Screens impregnated with insecticides
Screens impregnated with insecticides are installed in houses, schools and health facilities windows and doors close to regions with the highest number of cases reported. Screens are impregnated with deltamethrin and have ultraviolet protection. The disad-vantage is that this technology was implemented successfully in houses located in regions with low/medium social and economic level and a small number of buildings; therefore, not representative for any area.90,91
The main advantages and limitations of promising technologies to control the Ae. aegypti are listed in Chart 1.

117
Strategies to control the Aedes aegypti: a review
Chart 1 - Technologies for Aedes aegypti control: mechanisms, advantages and benefits, disadvantages and limitations
Technology Vector control mechanism Main advantages Main disadvantages and limitations
Eco-bio-social approach
Social participation in vector control through mechanical tools use
Compatible with other technologies, uses mechanical tools, avoids using insecticides.
Depends on the involvement of several society sectors; requires human resources; educational process with medium and long-term results; and requires recurrent actions to ensure the method’s sustainability.
Risk mapping Specific vector control actions in risk areas
Compatible with other technologies; allows more precise risk situation analysis; helps optimizing resources.
Indicates a critical situation; however, requires other technologies to reach satisfactory results; depends on severaldata sources and quality of secondary data.
Natural compounds Larvicide activity
An alternative for chemical control; uses safer insecticides.
Requires efficiency and cost-effectiveness studies compared to chemical control.
Wolbachia
Bacteria that, when colonizing with mosquitoes, causes sterility and reduction of arboviruses transmission
Uses natural microorganism; self-sustainable; avoids mosquitoes sexing; does not use insecticides and radiation.
Climatic differences, mosquitoes release protocols, urbanization and human density level may limit the invasive potential of insects in release places.
Insecticide-dispersing mosquitoes
Release of mosquitoes impregnated with larvicide, which disperse the product in possible breeders where they will lay their eggs
Favors the optimization of human resources use; compatible with other technologies; uses larvicide already provided by the Department of Health; agents are familiar with the type of trap used; mosquitoes take larvicides to breeders that are not visible or Accesssible that only they can find.
May promote the selection of populations of mosquitoes resistant to the insecticide, requires a formulation of insecticide with ideal concentration in small particles.
Residual in-home spatial nebulizer
Application of residual insecticide in specific points inside houses
Has spatial scope and reduces the transmission of diseases during the outbreak.
May promote the selection of populations resistant to the insecticide; can be influenced by the machine regulation; demands trained application agents; there are only two available adulticides (pyrethroids and organophosphates).
Devices with insecticides
Adulticide action through in-house devices of slow release
Shows effective action in 80% to 90% of adult mosquitoes in the environment.67
May promote the selection of populations resistant to the insecticide; effect limitation in big environments; requires device replacement after losing the insecticide effect.
Transgenic mosquitoes
production of lethal genes, mosquitoes sterilization or introduction of gene reducing or blocking the transmission of diseases
Leads to reduction of mosquitoes lifetime; reduces mosquitoes infestation; and avoids the use of radiation.
Requires use of mosquitoes sexing technologies; depends on the release protocol; requires constant production and release of mosquitoes in the environment.
to be continued

118
HEALTH BRAZIL 2015/2016 – An analysis of health situation and the epidemic caused by Zika virus and other diseases transmitted by Aedes Aegypti
Secretariat of Health SurveillanceMINISTRY OF HEALTH OF BRAZIL
Technology Vector control mechanism Main advantages Main disadvantages and limitations
Irradiation Insects sterilization by irradiation
Reduces mosquitoes infestation; avoids the mosquitoes sexing process; and may use radiological equipment already available in the health system.
Replacement for wild mosquitoes population over time may occur.
Wolbachia + irradiation
Mosquito sterilization and reduction or blockade of transmission of pathogens
Reduces the risk of sterilization by replacement of mosquitoes and reduction of wild mosquitoes or blockage and reduces the risk of pathogens transmission; pathogens avoid the sexing process.
Climatic differences, mosquitoes release protocols, urbanization and human density level may limit the invasive potential of insects in release places; requires production of mosquitoes with Wolbachia and irradiated and constant release in the environment.
Clothes impregnated with insecticides
Repellent and insecticide action
Individual protection; avoids constant reapplication of repellents and insecticides; and can be used by pregnant women to try and avoid Zika cases and consequent neurological complications.
Selection of insecticide-resistant populations, frequent dermatological contact with the chemical substance, production and clothe durability, use by children only during class hours and school days.
Screens impregnated with insecticides
Mechanical, repellent and insecticide protection
Combines mechanical and chemical control and is compatible with other technologies.
May promote the selection of populations resistant to the insecticide, requires screens installation and maintenance, difficulty for large-scale implementation, difficulty to manufacture, and presented little effectiveness in places with low mosquitoes infestation.
Source: Prepared by the authors.
Discussion
This study evidences the main vector control strategies promoted in NPDC and those with potential supplementary use to activities of the Program in Brazil without the in-tention to exhaust all vector control strategies existing and being developed worldwide. However, it should be emphasized that actions promoted by NPDC and developed throu-ghout municipalities have not shown efficiency to reduce Aedes infestation in most of the country, which reflects in increased number of dengue, chikungunya and Zika cases.92
In order to be considered useful in vector control, the technology must be efficient and safe, have large-scale and timely feasibility, compatibility with strategies already used, reasonable implementation and continuous use costs, method sustainability and pose minimum risk of negative externalities for the environment and the population.
Adopting combinations of vector control strategies requires continuous assessment of effectiveness, considering the possible synergic effects between compatible strategies and spatial heterogeneity from the assessment of risk areas within urban agglomerates, especially in capitals and metropolitan regions. The eco-bio-social approach and mapping of risk areas are technologies that can be integrated to all other strategies.
conclusion

119
Strategies to control the Aedes aegypti: a review
Allied to specific vector fight strategies, inter-sectorial actions have become increa-singly necessary for the success of arboviruses control. As recommended by NPDC,26 the cooperation of other areas in addition to the health sector is essential to be successful when fighting vectors and is considered the main method to avoid dengue, Zika and chi-kungunya cases until now. Basic sanitation, proper handling of solid waste and garbage, regular water supply, health education, borders surveillance, tourism and intense move-ment of people are examples of macro factors external to health that must be prioritized as strategic targets of solid policies with the involvement of all society sectors.
Taking into account Brazil’s continental dimensions, the social, economic and infras-tructure2 differences and the mosquitoes susceptibility to insecticides profile30,41 moni-toring regional situations from risk mapping is necessary to adopt a proper set of vector control measures. Besides compatible with other technologies this type of mapping allows more precise risk situation analysis thus helping to optimize resources.
However, restrictions related to the quality of information available to map the risk for arboviruses may exist. Although the dengue surveillance system has proven to be consis-tent in Brazil, timely for the notification of cases and representative,93 after reintroducing the chikungunya and Zika viruses, difficulties for the differential diagnosis of arboviruses with similar signs and symptoms were imposed, which may compromise the proper cases notification.94,95 The surveillance system can also be improved by using applications to improve the notification and data typing opportunity through investments that ensure the acceptance and stability of the system, favor the completion of data and expand its representativeness and sensitiveness97 in order to make it increasingly useful to prevent and control arboviruses.98
It is recommended that the incorporation of new technologies involving the use of insecticides as mosquitoes’ dispersant,62,63 in-house spraying,64 spatial repellents,66,67 clothes and screens impregnated32 and biological larvicides, 38,46 is followed by the monitoring of mosquitoes’ susceptibility to insecticides profile considering the possibility to maintain genetically resistant populations.30,41
Once new technologies are incorporated to NPDC, studies assessing implementation strategies, budgetary impact and financial investments for sustainability and continuous assessment of interventions will be necessary.
The integration of different compatible and efficient vector control strategies conside-ring the technologies available and specific regional characteristics seems to be a feasible mechanism to reduce the infestation of mosquitoes and incidence of arboviruses trans-mitted by them, as a single solution for Ae. aegypti does not exist in Brazil.
However, there is still a lot to be investigated on Ae. aegypti control strategies with emphasis in promising technology innovations. Relevant matters as eco-bio-social ap-proach were addressed in this study considering the relevance of society’s involvement for vector control sustainability. However, other equally important investigations linked to social communication strategies with the involvement of society segments and the
120
HEALTH BRAZIL 2015/2016 – An analysis of health situation and the epidemic caused by Zika virus and other diseases transmitted by Aedes Aegypti
Secretariat of Health SurveillanceMINISTRY OF HEALTH OF BRAZIL
entire population were not addressed herein; they include new educational approaches and incentive to the community participation in arboviruses control.
From the strategic and continuous planning point-of-view, scientific evidence review studies and complete economic assessments seeking to indicate feasible integrated vec-tor control actions linked to technology innovations, as well as to value the coordinated action of several society sectors are greatly relevant. These review studies may contribute to direct measures in already established health surveillance programs, especially given the dengue, Zika and chikungunya92 epidemic scenario in which Brazil is in.
References
1 HALSTEAD, S. B. Aedes aegypti: why can’t we control it? Bulletin of the Society Vector Ecology, [S.l.], v. 1113, n. 2, p. 304-311, 1988.
2 COELHO, G. E. Dengue: desafios atuais. Epidemiologia e Serviços de Saúde, Brasília, v. 17, n. 3, p. 231-233, jul./set. 2008.
3 OLIVEIRA, R. L. de et al. Aedes aegypti in Brazil: Genetically differentiated populations with high susceptibility to dengue and yellow fever viruses. Transactions of the Royal Society of Tropical Medicine and Hygiene, [S.l.], v. 98, n. 1, p. 43-54, Jan. 2004.
4 MARCONDES, C. B.; XIMENES, M. F. Zika virus in Brazil and the danger of infestation by Aedes (Stegomyia) mosquitoes. Revista da Sociedade Brasileira de Medicina Tropical, Uberaba, v. 49, n. 1, p. 4-10, dez. 2015.
5 KANTOR, I. N. Dengue, zika and chikungunya. Medicina (B Aires), Buenos Aires, v. 76, n. 2, p. 93-97, Feb. 2016.
6 MILLER, B. R.; BALLINGER, M. E. Aedes albopictus mosquitoes introduced into Brazil: vector competence for yellow fever and dengue viruses. Transactions of the Royal Society of Tropical Medicine and Hygiene, [S.l.], v. 82, n. 3, p. 476-477, 1988.
7 CHRISTOPHERS, S. R. Aedes aegypt (L.): the yellow fever mosquito: its life history, bionomics and structure. London: Cambridge University Press, 1960. 750 p. Available at: <http://www.dpi.inpe.br/geocxnets/wiki/lib/exe/fetch.php?media=wiki:christophers_1960. pdf>. Access on: 28 Feb. 2016.
8 KRAEMER, M. U. G. et al. The global distribution of the arbovirus vectors Aedes aegypti and Ae. albopictus. E.life, [S.l.], v. 4, p. e08347, June 2015.
9 CONSOLI, R. A. G. B.; OLIVEIRA, R. L. Principais mosquitos de importância sanitária no Brasil. Rio de Janeiro: Fiocruz, 1994. 228 p. Available at: <http://static.scielo.org/ scielobooks/th/pdf/consoli-9788575412909.pdf>. Access on: 3 Mar. 2016.
10 FORATTINI, O. E Culicidologia médica: identificação, biologia e epidemiologia. São Paulo: EDUSP, 2002. 864 p.
11 CROVELLO, T. J.; HACKER, C. S. Evolutionary strategies in life table characteristics among feral and urban strains of Aedes aegypti (L.). Evolution, [S.l.], v. 26, n. 2, p. 185-196, June 1972.
12 COSTA, Z. G. A. et al. Evolução histórica da vigilância epidemiológica e do controle da febre amarela no Brasil. Revista Pan-Amazônica de Saúde, Ananindeua, v. 2, n. 1, p.11-26, Mar. 2010.
13 SOPER, F. L. The 1964 status of Aedes aegypti eradication and yellow fever in the Americas. Transactions of the Royal Society of Tropical Medicine and Hygiene, [S.l.], v. 14, n. 6, p. 887-891, Nov. 1965.
14 FRANCO, O. Reinfestação do Pará por Aedes aegypti. Revista Brasileira de Malariologia e Doenças Tropicais, Rio de Janeiro, v. 21, n. 4, p. 729-731, 1969.

121
Strategies to control the Aedes aegypti: a review
15 NOBRE, A.; ANTEZANA, D.; TAUIL, P L. Febre amarela e dengue no Brasil: epidemiologia e controle. Revista da Sociedade Brasileira de Medicina Tropical, Uberaba, v. 27, Suplemento 3, p. 59-66, 1994.
16 TAUIL, P L. Urbanização e ecologia do dengue. Cadernos de Saúde Pública, Rio de Janeiro, v. 17, Suplemento, p. 99-102, 2001.
17 TAUIL, P L. Aspectos críticos do controle do dengue no Brasil. Cadernos de Saúde Pública, Rio de Janeiro, v. 18, n. 3, p. 867-871, May/June, 2002.
18 MACIEL, I. J.; SIQUEIRA JÚNIOR, J. B.; MARTELLI, C. M. T. Epidemiologia e desafios no controle do dengue. Revista de Patologia Tropical, Goiânia, v. 37, n. 2, p. 111-130, May/June, 2008.
19 DYE, C. The analysis of parasite transmission by bloodsucking insects. Annual Review of Entomology, [S.l.], v. 37, p. 1-19, 1992.
20 SCOTT, T. W et al. Detection of multiple blood feeding in Aedes aegypti (Diptera: Culicidae) during a single gonotrophic cycle using a histologic technique. Journal of Medical Entomology, [S.l.], v. 30, n. 1, p. 94-99, Jan. 1993.
21 SILVA, H. H. G.; SILVA, I. G. Influência do período de quiescência dos ovos sobre o ciclo de vida de Aedes aegypti (Linnaeus, 1762) (Diptera, Culicidae) em condições de laboratório. Revista da Sociedade Brasileira de Medicina Tropical, Uberaba, v. 32, n. 4, p. 349-355, July/Aug. 1999.
22 MOORE, C. G. et al. Aedes albopictus in the United States: rapid spread of a potential disease vector. Journal of the American Mosquito Control Association, [S.l.], v. 4, n. 3, p. 356-361, 1988.
23 CARVALHO, R. G.; OLIVEIRA, R. L. de; BRAGA, I. A. Updating the geographical distribution and frequency of Aedes albopictus in Brazil with remarks regarding its range in the Americas. Memórias do Instituto Oswaldo Cruz, Manguinhos, v. 109, n. 6, p. 787-796, Sept. 2014.
24 DONALÍSIO, M. R.; GLASSER, C. M. Vigilância entomológica e controle de vetores do dengue. Revista Brasileira de Epidemiologia, São Paulo, v. 5, n. 3, p. 259-279, Oct./DeC. 2002.
25 BRAGA, I. A.; VALLE, D. Aedes aegypti: histórico do controle no Brasil. Epidemiologia e Serviços de Saúde, Brasília, v. 16, n. 2, p. 113-118, Apr./June, 2007.
26 BRASIL. Ministério da Saúde. Secretaria de Vigilância em Saúde. Departamento de Vigilância Epidemiológica. Diretrizes nacionais para a prevenção e controle de epidemias de dengue. Brasília, 2009. (Série A. Normas e Manuais Técnicos).
27 FIGUEIRÓ, A. C. et al. Análise da lógica de intervenção do Programa Nacional de Controle da Dengue. Revista Brasileira de Saúde Materno Infantil, Recife, v. 10, Suplemento 1, p. S93-106, nov. 2010.
28 BRASIL Ministério da Saúde; FUNDAÇÃO NACIONAL DE SAÜDE. Programa Nacional de Controle da Dengue (PNCD). Brasília, 2002. 32 p.
29 WORLD HEALTH ORGANIZATION. Chemical methods for the control of vectors and pests of public health importance. Geneve, 1996. Available at: <http://apps.who.int/iris/bitstream/10665/63504/1/WHO_CTD_WHOPES_97.2.pdf>. Access on: 4 Mar. 2016.
30 BRAGA, I. A.; VALLE, D. Aedes aegypti: inseticidas, mecanismos de ação e resistência. Epidemiologia e Serviços de Saúde, Brasília, v. 16, n. 4, p. 279-293, Oct./Dec. 2007.
31 ROMERO-VIVAS, C. M.; WHEELER, J. G.; FALCONAR, A. K. An inexpensive intervention for the control of larval Aedes aegypti assessed by an improved method of surveillance and analysis. Journal of the American Mosquito Control Association, [S.l.], v. 18, n. 1, p. 40-46, Mar. 2002.
32 MANRIQUE-SAIDE, P et al. Use of insecticide-treated house screens to reduce infestations of dengue virus vectors, Mexico. Emerging Infectious Diseases, [S.l.], v. 21, n. 2, p. 308-311, Feb. 2015.
33 SHULSE, C. D.; SEMLITSCH, R. D.; TRAUTH, K. M. Mosquitofish dominate amphibian and invertebrate community development in experimental wetlands. Journal of Applied Ecology, [S.l.], v. 50, n. 5, p. 1244-1256, June 2013.

122
HEALTH BRAZIL 2015/2016 – An analysis of health situation and the epidemic caused by Zika virus and other diseases transmitted by Aedes Aegypti
Secretariat of Health SurveillanceMINISTRY OF HEALTH OF BRAZIL
34 HOY, J. B. Experimental mass-rearing of the mosquitofish, Gambusia affinis. Journal of the American Mosquito Control Association, [S.l.], v. 1, n. 3, p. 295-298, Sept. 1985.
35 RITCHIE, S. A.; RAPLEY, L. P; BENJAMIN, S. Bacillus thuringiensis var. israelensis (Bti) provides residual control of Aedes aegypti in small containers. The American Journal of Tropical Medicine and Hygiene, [S.l.], v. 82, n. 6, p. 1053-1059, June 2010.
36 BENJAMIN, S. et al. Efficacy of a Bacillus thuringiensis israelensis tablet formulation, VectoBac DT, for control of dengue mosquito vectors in potable water containers. The Southeast Asian Journal of Tropical Medicine and Public Health, [S.l.], v. 36, n. 4, p. 879-892, July 2005.
37 MULLA, M. S. et al. Field evaluation of the microbial insecticide Bacillus thuringiensis serotype H-14 against floodwater mosquitoes. Applied and Environmental Microbiolog, [S.l.], v. 43, n. 6, p. 1288-1293, June 1982.
38 BOYCE, R. et al. Bacillus thuringiensis israelensis (Bti) for the control of dengue vectors: systematic literature review Tropical Medicine & International Health, [S.l.], v. 8, n. 5, p. 564-577, May 2013.
39 BRASIL. Ministério da Saúde; FUNDAÇÃO NACIONAL DE SAÚDE. Dengue: instruções para pessoal de combate ao vetor: manual de normas técnicas. 3. ed. Brasília, 2001. Available at: <http://bvsms.saude.govbr/bvs/publicacoes/funasa/man_dengue.pdf>. Access on: 4 Mar. 2016.
40 GUZMAN, M. G. et al. Dengue: a continuing global threat. Nature Reviews Microbiology, [S.l.], v. 8, Supplement 12, p. S7-16, Dec. 2010.
41 BRAGA, I.; VALLE, D. Aedes aegypti: vigilância, monitoramento da resistência e alternativas de controle no Brasil. Epidemiologia e Serviços de Saúde, Brasília, v. 16, n. 4, p. 295-302, Oct./Dec. 2007.
42 SPECIAL PROGRAMME FOR RESEARCH AND TRAINING IN TROPICAL DISEASES. Dengue control support through eco-bio-social approach. Geneva: World Health Organization, 2013. Available at: <http://www.who.int/tdr/news/2013/dengue_control/en/>. Access on: February 20, 2016.
43 LIMA, E. P.; GOULART, M. O. F.; ROLIM NETO, M. L. Meta-analysis of studies on chemical, physical and biological agents in the control of Aedes aegypti. BMC Public Health, [S.l.], v. 15, p. 858, Dec. 2015.
44 LACON, G. et al. Shifting patterns of Aedes aegypti fine scale spatial clustering in Iquitos, Peru. PLoS Neglected Tropical Diseases, [S.l.], v. 8, n. 8, p. e3038, Aug. 2014.
45 VAZQUEZ-PROKOPEC, G. M. et al. Quantifying the spatial dimension of dengue virus epidemic spread within a tropical urban environment. PLoS Neglected Tropical Diseases, [S.l.], v. 4, n. 12, p. e920, 21 Dec. 2010.
46 SANTOS, S. R. et al. Toxic effects on and structure-toxicity relationships of phenylpropanoids, terpenes, and related compounds in Aedes aegypti larvae. Vector-Borne and Zoonotic Diseases, [S.l.], v. 10, n. 10, p. 1049-1054, Dec. 2010.
47 SANTOS, S. R. et al. Structure-activity relationships of larvicidal monoterpenes and derivatives against Aedes aegypti Linn. Chemosphere, [S.l.], v. 84, n. 1, p. 150-153, June 2011.
48 PEREIRA, A. I. S. et al. Atividade antimicrobiana no combate às larvas do mosquito Aedes aegypti: homogeneização dos óleos essenciais do linalol e eugenol. Educación Química, [S.l.], v. 25, n. 4, p. 446-449, 2014. Available at: <http://www.sciencedirect.com/science/article/pii/ S0187893X14700655>. Access on: 4 Mar. 2016.
49 WALKER, T. et al. The wMel Wolbachia strain blocks dengue and invades caged Aedes aegypti populations. Nature, [S.l.], v. 476, n. 7361, p. 450-453, Aug. 2011.
50 MCMENIMAN, C. J. et al. Stable introduction of a life-shortening Wolbachia infection into the mosquito Aedes aegypti. Science, v 323, n. 5910, p. 141-144, Jan. 2009.
51 YEAP, H. L. et al. Dynamics of the “popcorn” Wolbachia infection in outbred Aedes aegypti informs prospects for mosquito vector control. Genetics, [S.l.], v. 187, n. 2, p. 583-595, Feb. 2011.

123
Strategies to control the Aedes aegypti: a review
52 MOREIRA, L. A. et al. A Wolbachia symbiont in Aedes aegypti limits infection with dengue, chikungunya, and plasmodium. Cell, [S.l.], v. 139, n. 7, p. 1268-1278, Dec. 2009.
53 HOFFMANN, A. A. et al. Successful establishment of Wolbachia in Aedes populations to suppress dengue transmission. Nature, [S.l.], v. 476, n. 7361, p. 454-457, 24 Aug. 2011.
54 DUTRA, H. L. et al. From lab to field: the influence of urban landscapes on the invasive potential of Wolbachia in Brazilian Aedes aegypti mosquitoes. PLoS Neglected Tropical Diseases, [S.l.], v. 9, n. 4, p. e0003689, Apr. 2015.
55 SINKINS, S. P Wolbachia and arbovirus inhibition in mosquitoes. Future Microbiology, [S.l.], v. 8, n. 10, p. 1249-1256, Oct. 2013.
56 BULL, J. J.; TURELLI, M. Wolbachia versus dengue: evolutionary forecasts. Evolution, Medicine, and Public Health, [S.l.], v. 2013, n. 1, p. 197-207, Sept. 2013.
57 YE, Y. H. et al. Wolbachia reduces the transmission potential of dengue- infected Aedes aegypti. PLoS Neglected Tropical Diseases, [S.l.], v. 9, n. 6, p. e0003894, June 2015.
58 ITURBE-ORMAETXE, I.; WALKER, T; O’NEILL, S. L. Wolbachia and the biological control of mosquito-borne disease. EMBO Reports, [S.l.], v. 12, n. 6, p. 508-518, June 2011.
59 RITCHIE, S. A. et al. A secure semi-field system for the study of Aedes aegypti. PLoS Neglected Tropical Diseases, [S.l.], v. 5, n. 3, p. e988, Mar. 2011.
60 NGUYEN, T. H. et al. Field evaluation of the establishment potential of wmelpop Wolbachia in Australia and Vietnam for dengue control. Parasites & Vectors, [S.l.], v. 8, p. 563, 28 Dec. 2015.
61 HOFFMANN, A. A. et al. Stability of the wMel Wolbachia infection following invasion into Aedes aegypti populations. PLoS Neglected Tropical Diseases, [S.l.], v. 8, n. 9, p. e3115, Sept. 2014.
62 ABAD-FRANCH, F. et al. Mosquito-disseminated pyriproxyfen yields high breeding-site coverage and boosts juvenile mosquito mortality at the neighborhood scale. PLoS Neglected Tropical Diseases, [S.l.], v. 9, n. 4, p. e0003702, Apr. 2015.
63 DEVINE, G. J. et al. Using adult mosquitoes to transfer insecticides to Aedes aegypti larval habitats. Proceedings of the National Academy of Sciences, [S.l.], v. 106, n. 28, p. 11530-11534, July 2009.
64 PAREDES-ESQUIVEL, C. et al. The impact of indoor residual spraying of deltamethrin on dengue vector populations in the Peruvian Amazon. Acta Tropica, [S.l.], v. 154, p. 139-144, Feb. 2016.
65 CHADEE, D. D. Resting behaviour of Aedes aegypti in Trinidad: with evidence for the reintroduction of indoor residual spraying (IRS) for dengue control. Parasites & Vectors, [S.l.], v. 6, n. 1, p. 255, Sept. 2013.
66 RAPLEY, L. P et al The effects of sustained release metofluthrin on the biting, movement, and mortality of Aedes aegypti in a domestic setting. The American Journal of Tropical Medicine and Hygiene, [S.l.], v. 81, n. 1, p. 94-99, July 2009.
67 RITCHIE, S. A.; DEVINE, G. J. Confusion, knock-down and kill of Aedes aegypti using metofluthrin in domestic settings: a powerful tool to prevent dengue transmission? Parasites & Vectors, [S.l.], v. 6, n.1, p. 262, Sept. 2013.
68 MASSONNET-BRUNEEL, B. et al. Fitness of transgenic mosquito Aedes aegypti males carrying a dominant lethal genetic system. PLoS One, [S.l.], v. 8, n. 5, p. e62711, May 2013.
69 HARRIS, A. F. et al. Successful suppression of a field mosquito population by sustained release of engineered male mosquitoes. Nature Biotechnology, [S.l.], v. 30, n. 9, p. 828-830, Sept. 2012.
70 YAKOB, L.; ALPHEY, L.; BONSALL, M. B. Aedes aegypti control: the concomitant role of competition, space and transgenic technologies. Journal of Applied Ecology, [S.l.], v. 45, n. 4, p. 1258-1265, June 2008.
71 ARAÚJO, H. R. C. et al. Aedes aegypti control strategies in Brazil: incorporation of new technologies to overcome the persistence of dengue epidemics. Insects, [S.l.], v. 6, n. 2, p. 576-594, June 2015.

124
HEALTH BRAZIL 2015/2016 – An analysis of health situation and the epidemic caused by Zika virus and other diseases transmitted by Aedes Aegypti
Secretariat of Health SurveillanceMINISTRY OF HEALTH OF BRAZIL
72 CARVALHO, D. O. et al. Two step male release strategy using transgenic mosquito lines to control transmission of vector-borne diseases. Acta Tropica, [S.l.], v. 132, Supplement, p. S170-177, Apr. 2014.
73 WISE DE VALDEZ, M. R. et al. Genetic elimination of dengue vector mosquitoes. Proceedings of the National Academy of Sciences, [S.l.], v. 108, n. 12, p. 4772-4775, Mar. 2011.
74 WINSKILL, Petal Dispersal of engineered male Aedes aegypti mosquitoes. PLoS Neglected Tropical Diseases, [S.l.], v. 9, n. 11, p. e0004156, Nov. 2015.
75 CARVALHO, D. O. et al. Mass production of genetically modified Aedes aegypti for field releases in Brazil. Journal of Visualized Experiments, [S.l.], n. 83, p. 3579, Jan. 2014.
76 CARVALHO, D. O. et al. Suppression of a field population of Aedes aegypti in Brazil by sustained release of transgenic male mosquitoes. PLoS Neglected Tropical Diseases, [S.l.], v. 9, n. 7, p. e0003864, July 2015.
77 ALPHEY, L. et al. Sterile-insect methods for control of mosquito-borne diseases: an analysis. Vector-Borne and Zoonotic Diseases, [S.l.], v. 10, n. 3, p. 295-311, Apr. 2010.
78 FERREIRA, C. P; YANG, H. M.; ESTEVA, L. Assessing the suitability of sterile insect technique applied to Aedes aegypti. Journal of Biological Systems, [S.l.], v. 16, n. 4, p. 565-577, Dec. 2008.
79 BOYER, S. Sterile insect technique: targeted control without insecticide. Médecine tropicale, Marseille, v. 72, p. 60-62, Mar. 2012.
80 ZHANG, D. et al. Combining the sterile insect technique with Wolbachia-based approaches: II - a safer approach to Aedes albopictus population suppression programmes, designed to minimize the consequences of inadvertent female release. PLoS One, [S.l.], v. 10, n. 8, p. e0135194, Aug. 2015.
81 ATYAME, C. M. et al. Comparison of irradiation and Wolbachia based approaches for sterile-male strategies targeting Aedes albopictus. PLoS One, [S.l.], v. 11, n. 1, p. e0146834, Jan. 2016.
82 THOME, R. C.; YANG, H. M.; ESTEVA, L. Optimal control of Aedes aegypti mosquitoes by the sterile insect technique and insecticide. Mathematical Biosciences, [S.l.], v. 223, n. 1, p. 12-23, Jan. 2010.
83 ZHANG, D. et al. Combining the sterile insect technique with the incompatible insect technique: I-impact of Wolbachia infection on the fitness of triple- and double-infected strains of Aedes albopictus. PLoS One, [S.l.], v. 10, n. 4, p. e0121126, Apr. 2015.
84 SOTO, J. et al. Efficacy of permethrin-impregnated uniforms in the prevention of malaria and leishmaniasis in Colombian soldiers. Clinical Infectious Diseases, [S.l.], v. 21, n. 3, p. 599-602, Sept. 1995.
85 ROMI, R. et al. Impregnation of uniforms with permethrin as a mean of protection of working personnel exposed to contact with hematophagous arthropods. Annali di igiene: medicina preventiva e di comunità, Roma, v. 9, n. 4, p. 313-319, July/Aug. 1997.
86 DEPARIS, X. et al. Efficacy of permethrin-treated uniforms in combination with DEET topical repellent for protection of French military troops in Côte d’Ivoire. Journal of Medical Entomology, [S.l.], v. 41, n. 5, p. 914-921, Sept. 2004.
87 TOZAN, Y. et al. Use of insecticide-treated school uniforms for prevention of dengue in schoolchildren: a cost-effectiveness analysis. PLoS One, [S.l.], v. 9, n. 9, p. e108017, Sept. 2014.
88 WILDER-SMITH, A. et al. Hypothesis: impregnated school uniforms reduce the incidence of dengue infections in school children. Medical Hypotheses, [S.l.], v. 76, n. 6, p. 861-862, June 2011.
89 WILDER-SMITH, A. et al. The impact of insecticide-treated school uniforms on dengue infections in school-aged children: study protocol for a randomised controlled trial in Thailand. Trials, [S.l.], v. 13, p. 212, Nov. 2012.

125
Strategies to control the Aedes aegypti: a review
90 BALY, A. et al. The cost of routine Aedes aegypti control and of insecticide-treated curtam implementation. The American Journal of Tropical Medicine and Hygiene, [S.l.], v. 84, n. 5, p. 747-752, May 2011.
91 BALY, A. et al. Costs of dengue prevention and incremental cost of dengue outbreak control in Guantanamo, Cuba. Tropical Medicine & International Health, [S.l.], v. 17, n. 1, p. 123-132, Jan. 2012.
92 BRASIL. Ministério da Saúde. Secretaria de Vigilância em Saúde. Monitoramento dos casos de dengue e febre de chikungunya até a Semana Epidemiológica (SE) 52 de 2015. Boletim Epidemiológico, Brasília, v. 47, n. 3, p. 10, 2016.
93 BARBOSA, J. R. et al. Avaliação da qualidade dos dados, valor preditivo positivo, oportunidade e representatividade do sistema de vigilância epidemiológica da dengue no Brasil, 2005 a 2009. Epidemiologia e Serviços de Saúde, Brasília, v. 24, n. 1, p. 49-58, jan./mar. 2015.
94 CENTERS FOR DISEASE CONTROL AND PREVENTION. Revised diagnostic testing for Zika, chikungunya, and dengue viruses in US Public Health Laboratories. [Georgia], 2016. p. 6. Available at: <http://www.cdc.gov/zika/pdfs/denvchikvzikv-testing-algorithm. pdf>. Access on: 10 Feb. 2016.
95 MUSSO, D.; CAO-LORMEAU, V. M.; GUBLER, D. J. Zika virus: following the path of dengue and chikungunya? Lancet, [S.l.], v. 386, n. 9990, p. 243-244, July 2015.
96 SANTOS, K. C. et al. Avaliação dos atributos de aceitabilidade e estabilidade do sistema de vigilância da dengue no estado de Goiás, 2011. Epidemiologia e Serviços de Saúde, Brasília, v. 23, n. 2, p. 249-258, Apr./June, 2014.
97 COELHO, G. E. Sensibilidade do sistema de vigilância da dengue na detecção de casos hospitalizados pela doença e avaliação de fatores determinantes da notificação. 2014. 93 f. Tese (Doutorado) - Universidade Federal de Goiás, Goiânia, 2014.
98 CENTERS FOR DISEASE CONTROL AND PREVENTION. Updated guidelines for evaluating public health surveillance systems: recommendations from the guidelines working group. MMWR Recommendations Reports, [S.l.], v. 50, n. 13, p. 1-35, July 2001.


TECHNICAL TEAM

129
Technical Team
Dengue: epidemiological situation in Brazil, 2013-2016
• Cristiane Pujol(1), Daniele Silva de Moraes Vanlume Simões(2), Elisabete Carmen Duarte(3), Laura Nogueira da Cruz(1), Livia Carla Vinhal Frutuoso(1), Priscila Leal Leite(1) , Virginia Kagure Wachira(1)
(1) General Coordination of the National Program for Dengue Control, Secretariat of Health Surveillance, Ministry of Health
(2) Department of Communicable Diseases Surveillance, Secretariat of Health Surveillance, Ministry of Health
(3) University of Brasília
Chikungunya fever in Brazil, 2015 and 2016
• Cristiane Pujol(1), Daniele Silva de Moraes Vanlume Simões(2), Elisabete Carmen Duarte(3), Isabela Ornelas Pereira(1), Jaqueline Martins(1), Laura Nogueira da Cruz(1), Livia Carla Vinhal Frutuoso(1), Priscila Leal Leite(1), Sulamita Brandão Barbiratto(1), Virginia Kagure Wachira(1), Rivaldo Venâncio(4)
(1) General Coordination of the National Program for Dengue Control, Secretariat of Health Surveillance, Ministry of Health
(2) Department of Communicable Diseases Surveillance, Secretariat of Health Surveillance, Ministry of Health
(3) University of Brasília(4) Oswaldo Cruz Foundation
Zika virus fever
• Cristiane Pujol(1), Daniele Silva de Moraes Vanlume Simões(2), Elisabete Carmen Duarte(3), Isabela Ornelas Pereira(1), Jaqueline Martins(1), Laura Nogueira da Cruz(1), Livia Carla Vinhal Frutuoso(1), Priscila Leal Leite(1), Sulamita Brandão Barbiratto(1), Virginia Kagure Wachira(1), Wanderson Kleber de Oliveira(4)
(1) General Coordination of the National Program for Dengue Control, Secretariat of Health Surveillance, Ministry of Health
(2) Department of Communicable Diseases Surveillance, Secretariat of Health Surveillance, Ministry of Health
(3) University of Brasília(4) General Coordination of Surveillance and Response to Public Health Emergencies, Secretariat
of Health Surveillance, Ministry of Health

130
HEALTH BRAZIL 2015/2016 – An analysis of health situation and the epidemic caused by Zika virus and other diseases transmitted by Aedes Aegypti
Secretariat of Health SurveillanceMINISTRY OF HEALTH OF BRAZIL
Microcephaly in Brazil: prevalence and characterization of cases from the Information System on Live Births (Sinasc), 2000-2015
• Fatima Marinho(1), Valdelaine Etelvina Miranda de Araújo(1), Denise Lopes Porto(1), Helena Luna Ferreira(1), Marta Roberta Santana Coelho(1), Roberto Carlos Reyes Lecca(1), Hélio de Oliveira(1), Ivana Pereira de Almeida Poncioni(1), Maria Helian Nunes Maranhão(1), Yluska Myrna Meneses Brandão e Mendes(1), Roberto Men Fernandes(1), Raquel Barbosa de Lima(1), Dácio de Lyra Rabello Neto(1)
(1) Secretariat of Health Surveillance, Ministry of Health
Characterization of territorial vulnerabilities and mapping of microcephaly cases in the Brazilian Northeastern Semi-Arid Region in 2015
• Aristeu de Oliveira Junior(1), Camila Vicente Bonfim(1), Cristina Luiza Dalia Pereira Paragó Musmanno(1), Daniela Buosi Rohlfs(1), Débora de Sousa Bandeira(1), Fernan-da Barbosa de Queiroz(1), Isabella de Oliveira Campos Miquilin(1), Jackeline Leite Pereira(1), Luiz Belino Ferreira Sales(1), Renan Duarte dos Santos(1), Renan Neves da Mata(1), Rodrigo Matias de Sousa Resende(1), Walter Massa Ramalho(2), Ysabely de Aguiar Pontes Pamplona(1)
(1) Department of Environmental Health and Worker Health Surveillance, Secretariat of Health Surveillance, Ministry of Health
(2) University of Brasília
Epidemiological situation of the congenital syndrome associated to Zika virus infection in Brazil, in 2015
• Eduardo H. Carmo(1), Felipe Tavares Duailibe(1), Giovanny V. A. França(1), Jadher Percio(3), Maria Clara Restrepo-Méndez(2), Marília L. Nunes(1), Vaneide D. Pedi(1), Wanderson K. de Oliveira(1)
(1) Center for Strategic Information on Health Surveillance, Secretariat of Health Surveillance, Ministry of Health
(2) Epidemiology Training Applied to Services of the Unified Health System Program, Secretariat of Health Surveillance, Ministry of Health
(3) International Center for Health Equality, Federal University of Pelotas

131
Technical Team
Strategies to control the Aedes aegypti: a review
• Ana Laura de Sene Amâncio Zara(1), Sandra Maria dos Santos(1), Ellen Synthia Fernandes-Oliveira(2), Roberta Gomes Carvalho(3), Giovanini Evelim Coelho(3)
(1) Federal University of Goiás, Institute of Tropical Pathology and Public Health. Goiânia/GO, Brazil
(2) Federal University of Goiás, Institute of Biological Sciences. Goiânia/GO, Brazil(3) Secretariat of Health Surveillance, Ministry of Health
ACKNOWLEDGEMENTS:
To the source that provided the Health Brazil 2015/2016 book cover Tile drawing: National Historic and Artistic Heritage Institute (Iphan) by donating, to the Ministry of Health, the book:ALCÂNTARA, Dora Monteiro e Silva de; BRITO, Stella Regina Soares de; SANJAD, Thais Alessandra Bastos Caminha. Azulejaria em Belém do Pará: inventário-arquitetura civil e religiosa - século XVIII ao XX.- Brasília: Iphan, 2016. Azulejo-PE 143.1.1 from Dresden/Germany, Villeroy & Boch Mosaik Fabrik Factory, p. 222, 2016.

MINISTRY OFHEALTH
9 7 8 8 5 3 3 4 2 5 1 3 5
ISBN 978-85-334-2513-5