health data transparency basics inside -
TRANSCRIPT

1
IntroductionMuch has been written about the apparent disconnect between the relatively high rate of health care spending in the United States and the relatively substantial deficiencies in the quality and access of care provided. In order to close this gap, more needs to be known about which expenditures provide the greatest value in terms of quality of care, treatment outcomes and access to care. At a minimum, determining value requires measurement of health care price and quality data. Reporting the data in a way that is accessible and meaningful to researchers, consumers and policymakers has the added potential to encourage health care purchasing decisions based on value.
The argument for such data transparency is that if consumers have access to valid price performance information, they can make informed decisions, selecting providers who provide the highest quality care at the best value for their dollar. Providers, in turn, will be motivated to continuously improve, competing on the basis of quality, price and service. Likewise, purchasers, armed with price and quality data, may structure contracts, payments and benefits in a way that encourages the purchase of health care services and health care coverage with the highest value.
But does health care data transparency really work? Does access to price and quality data impact consumer choice, enhance quality of care, improve health care outcomes and reduce spending? Since the collection and reporting of health care price and quality data is a relatively new field, the potential impacts are mixed and still emerging. Yet there is significant momentum at the local, state and federal levels — in both public and private sectors — in support of greater health data transparency.
health data transparency basicsMarch, 2012
insideHow does price transparency impact consumer decision-making? 2How does price and quality data impact health care spending? 3 How does quality transparency impact consumer choice, quality of care and outcomes? 3 What has been the federal role in supporting health data transparency? 4 Transparency provisions in the Patient Protection and Affordable Care Act (ACA) 4 What has Ohio done with respect to health data transparency? 5What is the potential state role regarding health data transparency? 6State and federal efforts to develop multi-payer claims databases 7What would increased data transparency mean to stakeholders? 8How have commercial insurers responded to the call for transparency? 10Sources for health data 11 Federal health care cost and quality reporting 11 Ohio-specific health care cost and quality reporting 13 National, private-sector health care cost and quality reporting 13Sources 15
91%of Americans feel that having information about costs before they receive care is important
12%of consumers report having used the Internet to find information on provider costs
sour
ce: C
omm
onw
ealth
Fun
dso
urce
: Del
oitte

2
The effect of price transparency on spending for health care services is mixed, scant, and still emerging. With consumers increasingly being asked to pay a greater share of their health care costs, support for access to price and quality data is generally high. A Commonwealth Fund survey found that 95 % of Americans think having information about the quality of care provided by different doctors or hospitals is important and 91% feel that having information about costs before they receive that care is important. Yet the evidence to date suggests that the impact of transparent health care data on consumer decisions and health care spending is limited by several factors:
While interest in data is high, usage is low. According to a 2010 survey of consumers by Deloitte, hospital quality ratings rank sixth among the factors that informed consumers’ most recent hospital choice, behind insurance coverage, physician recommendation and reputation; only 1 in 4 consumers report having searched online for physician quality-of-care information; just 12% of consumers report having used the Internet to find information on provider costs; and only 1 in 10 consumers uses web sites to compare hospital treatment options. Other studies have shown that patients tend to rely more on their physician’s advice about where and from whom to seek medical care than on the price differential among providers.
Many consumers have limited incentive or ability to shop around for care. In order for price transparency to impact consumer purchasing decisions in a way that reduces spending, consumers must have an incentive to use it. But most insured patients’ share of the cost of medical care is so low that they have little incentive to shop around for a lower-cost provider. Almost half (47%) of consumers pay 30% or less of their total plan’s costs and 1 in 4 consumers do not know how much they contribute to the total cost of their plan (Deloitte 2010). Patients covered by high-deductible plans have an incentive to seek lower cost care, but are often hindered by the inability to access negotiated fee schedules between their insurer and provider or hospital, thus limiting the potential impact on actual spending. In some locations, particularly rural areas, consumer ability to shop around for care based on price information is limited by the small number of providers in the area.
Consumers have limited knowledge of total costs and/or out of pocket costs, making it difficult to compare the actual cost of care Predicting the cost for a patient’s medical care is difficult because of differences in individual treatment course and response. This is complicated by billings from multiple providers and the variety of insurance benefit structures, all of which have unique, undisclosed fee schedules that are negotiated between the insurer and providers. Today, the majority of published prices are averages ― a measure that can be potentially misleading when attempting to compare the actual cost of care, especially since it does not account for negotiated rates between insurers and providers.
Many consumers have limited understanding of price and quality data.Often, consumers are unaware that health quality and price data is publicly available. Consumers who try to access data often find that it is voluminous and difficult to understand and use. Problems range from formats that are not user-friendly to measures that are not clearly defined to inadequate search functions. In addition, when price information is not coupled with reliable quality data, some consumers assume incorrectly that higher-cost equates to better care. Similarly, patient satisfaction measures may be mistaken for evidence-based measures of provider performance. A recent study showed that a consumer Google search of items such as “doctor reports" and "hospital ratings” resulted in 67 percent of sites listed displaying information based on patient experience, and only 22 percent of sites displaying evidence-based performance measures. More research – like that recently announced by AHRQ - needs to be done to determine if improved reporting design, simplified content and enhanced dissemination would increase consumers’ use of public reports of health care data.
How does price transparency impact consumer decision-making?
0 10 20 30 40 50 60 70 80
Insurance coverage (74%)
Doctor recommendation/referral (61%)
Reputation (60%)
Close to home (59%)
Cost of services (39%)
Specialization I needed (59%)
Quality or satisfaction ratings, rankings, reports (59%)
What factors impact what hospital a patient chooses?According to a 2010 national survey by Deloitte, these are the top six factors that patients list as "important" in deciding what hospital to use. The bolded categories are ones that would be most influenced by greater data transparency

3
How does quality transparency impact consumer choice, quality of care and outcomes?
As with price transparency, the impact of transparency on the quality of health care services and health outcomes is mixed, scant, and still emerging, but observations include:
Evidence suggests that publicly releasing performance data stimulates quality improvement efforts among hospitals. Public reporting gives low-ranking hospitals objective feedback for improving their performance and motivates high cost hospitals to seek ways to eliminate expensive but medically questionable procedures that may not improve outcomes.
The impact of reporting on effectiveness, patient safety, and patient-centeredness is inconsistent and uncertain.Systemic reviews of the evidence that publishing care performance measures improves quality of care have yielded inconsistent results. Overall, rigorous evaluation of public reporting systems’ impact on quality of care is lacking.
Tracking quality of care data may lead to quality improvements by changing clinical behaviors.A study by The Wisconsin Collaborative for Healthcare Quality found that tracking the quality of care encourages physicians to change the way they practice medicine, including increasing the likelihood of following guidelines and contacting patients due for tests. The group now tracks more than 30 quality measures for physician practices. According to the National Committee for Quality Assurance, clinical quality is higher among health plans that measure and publicly report on their performance.
The impact of transparent quality data on consumer choice of provider or hospital can be limited by the amount of competition in the area. Even with access to quality data, a patient’s selection of a hospital or physician can be limited by a lack of multiple facilities or specialists and/or by their physician’s hospital admitting privileges.
How does price and quality data impact health care spending?
Price transparency’s potential to reduce regional price variations and reduce spending is limited by the amount of competition among providers. While the wide variation in health care prices within the U.S. arguably creates an opportunity for reduced spending by encouraging providers to seek a more mid-range price to remain competitive, some areas do not have enough providers for the market to be competitive. For example, in New Hampshire, where there is not much competition among providers, publishing price data for 30 common procedures resulted in no decrease in price variation one year later.
A lack of coordination and consistency among transparency initiatives minimizes the potential for price and quality transparency data to reduce health spending. Data collection and reporting place significant operational and financial burdens on provider organizations that need to be considered in the transparency cost-benefit analysis.
Health quality data that is transparent to providers, consumers and health plans supports cost-saving payment methodologies that pay for value, not volume, of service. It has been estimated that between 20 percent and 50 percent of health care expenditures add no clinical value. That is, many services are unnecessary or inappropriate. Under traditional fee-for-service payment models, there is no incentive for providers to reduce unnecessary care. Many emerging payment methodologies pay providers based on performance, as measured by a set of quality standards. Reporting these measures to consumers, employers and providers may allow everyone to determine the value of health care services and to compare quality, cost and patient experience across providers.

4
Transparency provisions in The Patient Protection and Affordable Care Act (ACA) Perhaps the greatest support for expanded collection and reporting of health data comes from the Patient Protection and Affordable Care Act, signed into law on March 23, 2010.
Increases data collection and public reporting for • hospitals and physicians and improves reporting requirement for nursing homes, skilled nursing facilities and long-term care facilities. The data is to be used to (1) evaluate value-based payment pilots, including medical homes, accountable care organizations, bundled payments, and healthcare innovation zones1 and (2) to evaluate value-based payment policies such as non-payment for hospital-acquired infections and hospital readmissions.Makes Medicare claims data available• to states developing claims databases and to “qualified organizations,” like employers, insurance companies, and consumers to help identify high quality doctors and hospitals. Establishes the Patient-Centered Outcomes Research • Institute (PCORI) to perform comparative effectiveness research using quality metrics.Sets minimum data collection standards• for state run exchanges, including standardizing the electronic transmission of health care claims, enrollment and benefit data.Requires transparency from health insurers who must • demonstrate compliance with the medical loss ratio, requiring 80% of premiums for small groups and individuals (85% for large groups) be spent on payments for medical services or on activities that improve health care quality. Requires insurers to justify premium increases• in excess of 10%. Since premiums are based on claims history, hospital costs, doctor fees, marketing expenses, overhead costs, and profits, insurers will have no choice but to be transparent.
1 Healthcare innovation zones are accountable care organizations centered on academic medical centers. HIZs combine the advanced care expertise, data research capabilities and physician training competencies of academic hospitals with community providers and public and private payers.
What has been the federal role in supporting health data transparency?
““We will democratize government data….Simple information transparency can reduce costs.”
U.S. Chief Technology Officer, Aneesh Chopra ““People deserve to know, indeed they have a right to know, what their
healthcare costs and how good it is. Patients should also be able to see an estimate of the overall cost of the procedure, how much their insurer will pay and how much they will be expected to pay.” Then HHS Secretary Michael Levitt
Obama administratiOn bush administratiOn
The federal government has been collecting both process and outcome measures for health and health care for several years, mainly through voluntary reporting efforts led by federal-state partnerships. Multiple federal agencies including the Centers for Medicare and Medicaid Services (CMS), the Agency for Healthcare Research and Quality (AHRQ), and the CDC’s National Center for Health Statistics have been involved with collecting, housing, and disseminating this data. (See page 11 for a list of federal transparency resources). It is only recently, however, that coordinated efforts have been made to release and share the data publicly.
Notably, the support for greater health data transparency has been bipartisan, with strong support coming from the two most recent Presidential administrations. President George Bush issued an Executive Order in 2006 directing federal agencies that administer or sponsor federal health insurance programs to increase transparency in pricing and quality. In 2009, President Barack Obama identified transparency and data sharing as one of four key components of the U.S. Department of Health and Human Services (HHS) Open Government Initiative.
The Open Government Initiative charges the leaders of all executive agencies and departments with developing plans to increase “transparency, participation, and collaboration” in all federal government activities. The Health Indicators Warehouse and the Community Health Data Initiative, both described on page 11, are two flagship products developed as part of this effort.

5
Ohio’s first significant legislation to address health data transparency was enacted into law in 2006. House Bill 197 requires all hospitals bi-annually to report hospital performance measures (determined by an appointed Hospital Measures Advisory Council) to the Ohio Department of Health (ODH). ODH then disseminates the information though a publicly available website, Ohio Hospital Compare. Currently, Ohio hospitals report performance measures for the following health conditions: heart attack, heart failure, heart surgery, stroke, pneumonia, surgical care, infection, infection prevention, patient safety, patient satisfaction, childhood asthma and pregnancy/delivery. Hospitals operated by the Ohio Department of Mental Health, long-term care hospitals and veteran’s hospitals are exempt.
House Bill 197 also requires each Ohio hospital to report to ODH its charges for room and board, emergency department, operating room, delivery, and physical therapy, as well as charges for the 60 most common inpatient procedures (called diagnosis-related groups) and 60 most common outpatient procedures. In addition, each hospital must report the number of discharges, the average charge and the average length of stay. Finally, each hospital must make its price information list available free of charge on its website.
In October 2011, Ohio Rep. Barbara Sears introduced H.B. 353 to repeal the state mandate requiring hospitals to submit quality care data to the Ohio Hospital Compare website. According to the Ohio Hospital Association, which backs the bill, reporting quality data to the state public website is duplicative of information already being reported to the federal Hospital Compare website. The bill currently resides in the House Heath and Aging committee.
In November 2011, the Ohio Senate passed Senate Bill 264, a bill requiring nursing homes to meet at least five of 23 accountability measures to receive their share of the $300 million in funding set aside for nursing home quality-incentive payments. “For the first time ever, we are recognizing that we want to measure and pay for quality,” said Sen. Shannon Jones, R-Springboro, the sponsor of the bill, which passed the Senate unanimously. “This sets the stage for a huge transformation in the industry.” The bill was later passed by the Ohio House and signed by Gov. Kasich. It is set to go into effect on July 1, 2012.
What has Ohio done with respect to health data transparency?
“For the first time ever, we are recognizing that we want to measure and pay for quality. This sets the stage for a huge transformation in the industry.”― Sen. Shannon Jones, R-Springboro
Structural indicators Accreditation, certification, staffing ratiosVolume Number of procedures performedProcess Clinical quality indicators measured during the treatment processOutcome Risk-adjusted short-term, intermediate, and long-term health statusSpending Cost of care provided, price, or resource used to provide careEfficiency/value Combination of costs and quality metricsPatient experience Patients’ perception of the provider and care provided
Types of Metrics for Evaluating Provider Quality (from “Emphasis on Public Reporting of Health Care Data Intensifies by Julie Lewis)

6
What is the potential state role regarding health data transparency?
State roles for supporting health data transparency
Executive Leadership Legislative LeadershipAssist in developing and promoting • standardized metrics and policies for price and quality transparency that are consistent with nationally accepted standards and consistent across programs. Support the • coordination of health information technology/exchange with quality measuring and reporting requirements to avoid the inefficient allocation of public and private resources.Assess the • return on investment and impact of transparency efforts on outcomes, access, and cost; provide regular updates to legislators.Make price and quality transparency a • requirement for state license renewals for insurers, health care facilities, and providersRequire or incentivize all health plans and • providers with state contracts to participate in price and quality transparency effortsAs an• economic development tool, provide price and quality data to prospective employers, health plans or providers.Collaborate with other large employers • to leverage support for price and quality transparency efforts, both locally and statewide.Monitor prices to prevent collusion• among insurers and/or providers
Encourage or require price and quality • transparency through legislation mandating that health plans and employers make such information available to plan enrollees. For example, in 2007, Texas became the first state in the nation to enact legislation requiring group health insurance carriers that operate in or contract with employers in the state to release claims data to an employer or group policyholder upon request. Mandate that health care providers and • facilities disclose prices.Provide funding for public-private partnerships• to pilot transparency projects
The Kasich administration has identified transparency as one of its guiding principles "geared toward transforming Ohio into a model of health and economic vitality," according to remarks from Lt. Gov. Mary Taylor at a HPIO forum in February, 2012.
Futhermore, standardizing performance measurement and public reporting is one of the health system performance initiatives of the Governor's Office of Health Transformation (OHT). In a November 2011 interview with the Dayton Daily News, OHT Director Greg Moody articulated the administration's belief that greater access to health data will enable consumers to make better decisions about their care, thus lowering costs.
"Let’s get past trying to hoard this information for proprietary interests and put it out there so that people can make decisions," Moody said. "When you make price transparent, it’s a whole different ballgame.”
"Let’s get past trying to hoard this information for proprietary interests and put it out there so that people can make decisions. When you make price transparent, it’s a whole different ballgame.” ― Greg Moody, Director, Governor's Office of Health Transformation

7
State roles for supporting health data transparency
Executive Leadership Legislative LeadershipAssist in developing and promoting • standardized metrics and policies for price and quality transparency that are consistent with nationally accepted standards and consistent across programs. Support the • coordination of health information technology/exchange with quality measuring and reporting requirements to avoid the inefficient allocation of public and private resources.Assess the • return on investment and impact of transparency efforts on outcomes, access, and cost; provide regular updates to legislators.Make price and quality transparency a • requirement for state license renewals for insurers, health care facilities, and providersRequire or incentivize all health plans and • providers with state contracts to participate in price and quality transparency effortsAs an• economic development tool, provide price and quality data to prospective employers, health plans or providers.Collaborate with other large employers • to leverage support for price and quality transparency efforts, both locally and statewide.Monitor prices to prevent collusion• among insurers and/or providers
Encourage or require price and quality • transparency through legislation mandating that health plans and employers make such information available to plan enrollees. For example, in 2007, Texas became the first state in the nation to enact legislation requiring group health insurance carriers that operate in or contract with employers in the state to release claims data to an employer or group policyholder upon request. Mandate that health care providers and • facilities disclose prices.Provide funding for public-private partnerships• to pilot transparency projects
State and federal efforts to develop multi-payer claims databases
Using funds available through the American Recovery and Reinvestment Act of 2009, the Assistant Secretary for Planning and Evaluation (ASPE) within HHS is collaborating with CMS and AHRQ to develop a Multi-Payer Claims Database (MPCD) which will include longitudinal, public and private claims data to support comparative effectiveness research (CER) on priority populations, interventions, and conditions. The MPCD is expected to draw heavily from the experience of states that have already implemented all-payer claims databases (APCDs).
APCDs contain data derived from medical claims, pharmacy claims, eligibility files, provider (physician and facility) files, and dental claims from both private and public payers. Data usually includes patient demographics, provider demographics, clinical, financial, and utilization information. While typically created by state mandate, a couple of states have established APCDs through voluntary reporting. In all cases, access, release, and usage rules of the data can be as restrictive or open as the state desires, as long as there is no violation of privacy laws. Benefits of an APCD include:
Encourages consumer engagement and informed decision-making• Allows for data-driven policymaking and legislative efforts• Drives quality improvement efforts by allowing for performance assessments across systems and • payersSupports data-driven management of health care cost and utilization • Improves population health by illuminating disease and vaccination patterns• Informs private and public sector contracting decisions (e.g. allows exchanges to use • performance data to determine if an insurer should be allowed to participate)Assists with state regulation of insurers (e.g. allows states to determine if proposed rate increases • are reasonable as required by the ACA)
Efforts to expand APCD data initiatives and promote the uniformity of health care data standards are being led by the multi-stakeholder APCD Council (apcdcouncil.org) and the National Association of Health Data Organizations (NAHDO) (www.nahdo.org). Additional support for APCD expansion comes from the ACA, which makes Medicare claims data available to states and indicates state eligibility for federal funding (through the new Center for Medicare and Medicaid Innovation) for APCD development if the effort is linked with payment reforms.
Current state efforts at developing APCDsAs of February, 2012
Credit: APCD Council, a collaboration between the University of New Hampshire and the National Association of Health Data Organizations

8
Stakeholder What data they need Why they need it Concerns of increased transparencyConsumers Accurate total and out-of-pocket cost of an episode of care•
Access to easy-to-understand provider quality of care and outcomes information• Secure medical records• Cost of medications• Knowledge about treatment benefits and risks•
To make informed care decisions • To be able to “shop” for medical services and • medications
Disclosure of personal medical information• Information overload/confusion•
Providers Standard metrics for assessing quality of care• Outcomes or performance based payment• Reduced paperwork• Knowledge of prices paid to hospitals, labs, specialists, etc., to inform patients•
To drive and evaluate quality improvement efforts • To support data-driven management of patient • health care cost and utilization
Unfair, inaccurate, or unreliable quality • measurement methodologiesLoss of patient-physician confidentiality• Reductions in payments• Additional cost and time to meet reporting • requirements, some of which may not lead to better outcomesPatients may delay or avoid care once they • know the costPatients may not follow doctor recommendations • if less expensive options are available
Insurers/Payers
Standard metrics for assessing provider quality and patient outcomes• Patient compliance data• Consumer involvement in care decisions• Reduction in inappropriate or unnecessary medical services• Information on total cost of treatment•
To support data-driven management of client • health care cost and utilizationTo inform contracting decisions with providers•
Disclosure of proprietary discounts and fee • schedules will compromise trade secretsLack of trust from providers and consumers• Potential liability for violating privacy laws• Price transparency may lead to higher prices • by potentially reducing the incentive to bid aggressively and by facilitating possible collusion among insurers and hospitals, particularly in markets where there is little competition
Employers Standard metrics for assessing provider quality• Patient compliance data• Health status, needs, and goals of employees• Risks and benefits of treatments and drugs• Employee participation in wellness programs•
To assess plan performance, understand medical • expense trends, identify workforce health risks, develop targeted health programs, evaluate how they are spending their health care dollars, and predict future health-related expendituresTo inform contracting decisions with insurance • vendors
State Government
Standard metrics for assessing provider quality• Patient compliance data• Consumer involvement in care decisions• Reduction in inappropriate or unnecessary medical services• Information on total cost of treatment• Provider capacity • Data on population health•
To allow for data-driven policymaking and • legislative effortsTo support data-driven management of state • employees’ health care cost and utilizationTo assist with state regulation of insurers and • providersTo inform contracting decisions with insurance • vendors
Additional cost and time to regulate and monitor • reporting activities Possible loss of control over Medicaid provider • payment rates if CMS decides to require publicly-available rate justifications
Researchers Claims data and/or electronic health records from which to glean patient and • provider demographics as well as clinical, financial, and utilization information (e.g. cost and quality metrics, process measures, utilization data, service volumes, patient satisfaction, etc) to inform research studies
To enhance health services research to support • data-driven improvements in careTo identify disparities in health care• To perform observational studies using claims and • other datasetsTo conduct evaluations of patient care processes• To measure impact of payment reforms on quality • and cost of careTo foster new research ideas•
Ability to share data with researchers while • adequately protecting patient data and privacyData use fees can be a deterrent to health • services research
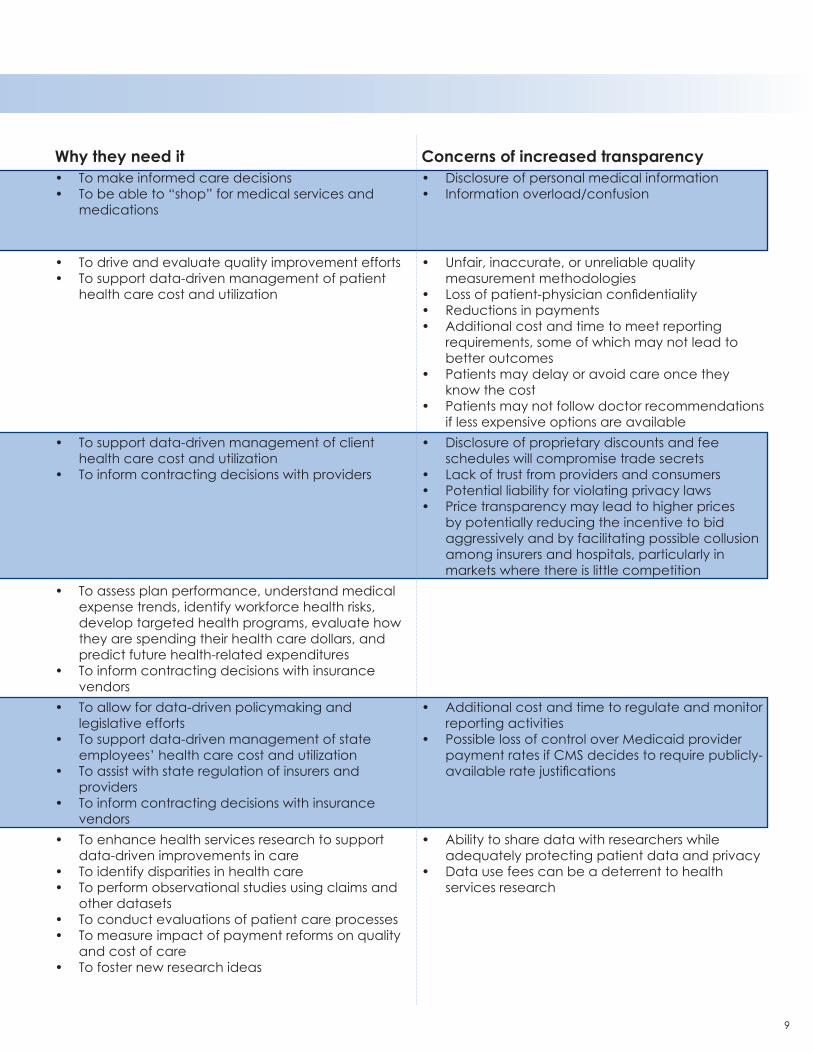
What would increased data transparency mean to stakeholders?
9
Stakeholder What data they need Why they need it Concerns of increased transparencyConsumers Accurate total and out-of-pocket cost of an episode of care•
Access to easy-to-understand provider quality of care and outcomes information• Secure medical records• Cost of medications• Knowledge about treatment benefits and risks•
To make informed care decisions • To be able to “shop” for medical services and • medications
Disclosure of personal medical information• Information overload/confusion•
Providers Standard metrics for assessing quality of care• Outcomes or performance based payment• Reduced paperwork• Knowledge of prices paid to hospitals, labs, specialists, etc., to inform patients•
To drive and evaluate quality improvement efforts • To support data-driven management of patient • health care cost and utilization
Unfair, inaccurate, or unreliable quality • measurement methodologiesLoss of patient-physician confidentiality• Reductions in payments• Additional cost and time to meet reporting • requirements, some of which may not lead to better outcomesPatients may delay or avoid care once they • know the costPatients may not follow doctor recommendations • if less expensive options are available
Insurers/Payers
Standard metrics for assessing provider quality and patient outcomes• Patient compliance data• Consumer involvement in care decisions• Reduction in inappropriate or unnecessary medical services• Information on total cost of treatment•
To support data-driven management of client • health care cost and utilizationTo inform contracting decisions with providers•
Disclosure of proprietary discounts and fee • schedules will compromise trade secretsLack of trust from providers and consumers• Potential liability for violating privacy laws• Price transparency may lead to higher prices • by potentially reducing the incentive to bid aggressively and by facilitating possible collusion among insurers and hospitals, particularly in markets where there is little competition
Employers Standard metrics for assessing provider quality• Patient compliance data• Health status, needs, and goals of employees• Risks and benefits of treatments and drugs• Employee participation in wellness programs•
To assess plan performance, understand medical • expense trends, identify workforce health risks, develop targeted health programs, evaluate how they are spending their health care dollars, and predict future health-related expendituresTo inform contracting decisions with insurance • vendors
State Government
Standard metrics for assessing provider quality• Patient compliance data• Consumer involvement in care decisions• Reduction in inappropriate or unnecessary medical services• Information on total cost of treatment• Provider capacity • Data on population health•
To allow for data-driven policymaking and • legislative effortsTo support data-driven management of state • employees’ health care cost and utilizationTo assist with state regulation of insurers and • providersTo inform contracting decisions with insurance • vendors
Additional cost and time to regulate and monitor • reporting activities Possible loss of control over Medicaid provider • payment rates if CMS decides to require publicly-available rate justifications
Researchers Claims data and/or electronic health records from which to glean patient and • provider demographics as well as clinical, financial, and utilization information (e.g. cost and quality metrics, process measures, utilization data, service volumes, patient satisfaction, etc) to inform research studies
To enhance health services research to support • data-driven improvements in careTo identify disparities in health care• To perform observational studies using claims and • other datasetsTo conduct evaluations of patient care processes• To measure impact of payment reforms on quality • and cost of careTo foster new research ideas•
Ability to share data with researchers while • adequately protecting patient data and privacyData use fees can be a deterrent to health • services research
10
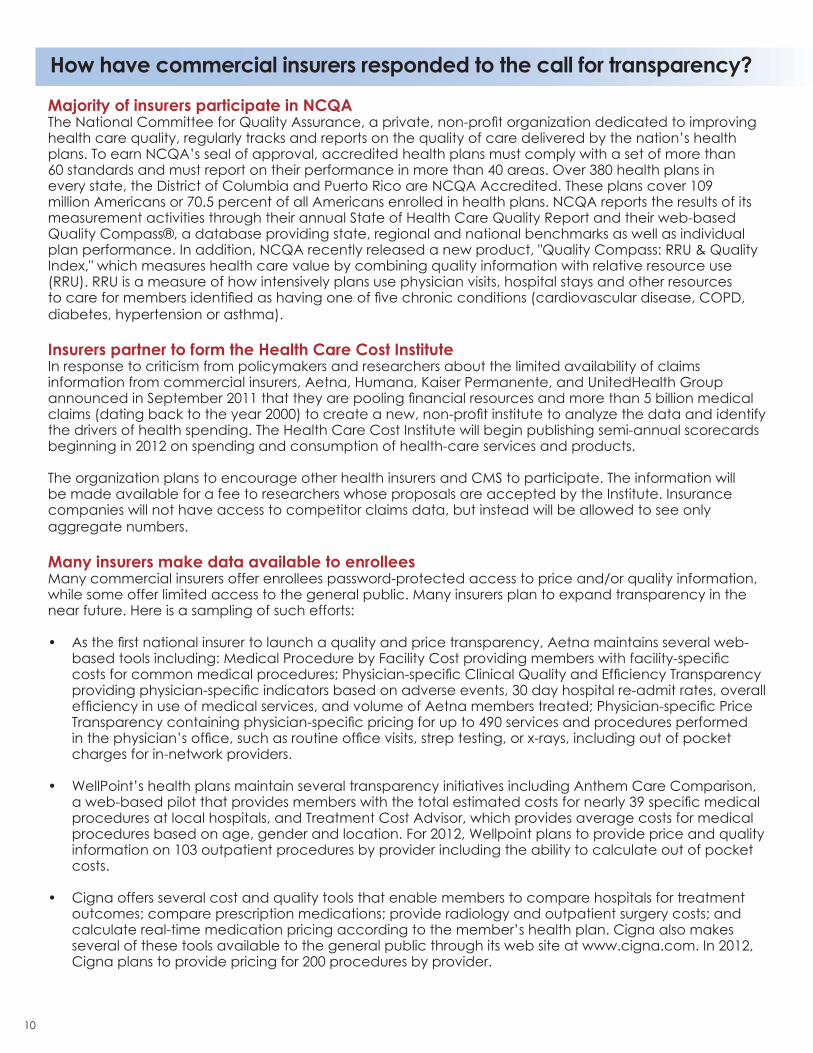
How have commercial insurers responded to the call for transparency?
Majority of insurers participate in NCQAThe National Committee for Quality Assurance, a private, non-profit organization dedicated to improving health care quality, regularly tracks and reports on the quality of care delivered by the nation’s health plans. To earn NCQA’s seal of approval, accredited health plans must comply with a set of more than 60 standards and must report on their performance in more than 40 areas. Over 380 health plans in every state, the District of Columbia and Puerto Rico are NCQA Accredited. These plans cover 109 million Americans or 70.5 percent of all Americans enrolled in health plans. NCQA reports the results of its measurement activities through their annual State of Health Care Quality Report and their web-based Quality Compass®, a database providing state, regional and national benchmarks as well as individual plan performance. In addition, NCQA recently released a new product, "Quality Compass: RRU & Quality Index," which measures health care value by combining quality information with relative resource use (RRU). RRU is a measure of how intensively plans use physician visits, hospital stays and other resources to care for members identified as having one of five chronic conditions (cardiovascular disease, COPD, diabetes, hypertension or asthma).
Insurers partner to form the Health Care Cost InstituteIn response to criticism from policymakers and researchers about the limited availability of claims information from commercial insurers, Aetna, Humana, Kaiser Permanente, and UnitedHealth Group announced in September 2011 that they are pooling financial resources and more than 5 billion medical claims (dating back to the year 2000) to create a new, non-profit institute to analyze the data and identify the drivers of health spending. The Health Care Cost Institute will begin publishing semi-annual scorecards beginning in 2012 on spending and consumption of health-care services and products.
The organization plans to encourage other health insurers and CMS to participate. The information will be made available for a fee to researchers whose proposals are accepted by the Institute. Insurance companies will not have access to competitor claims data, but instead will be allowed to see only aggregate numbers.
Many insurers make data available to enrolleesMany commercial insurers offer enrollees password-protected access to price and/or quality information, while some offer limited access to the general public. Many insurers plan to expand transparency in the near future. Here is a sampling of such efforts:
As the first national insurer to launch a quality and price transparency, Aetna maintains several web-• based tools including: Medical Procedure by Facility Cost providing members with facility-specific costs for common medical procedures; Physician-specific Clinical Quality and Efficiency Transparency providing physician-specific indicators based on adverse events, 30 day hospital re-admit rates, overall efficiency in use of medical services, and volume of Aetna members treated; Physician-specific Price Transparency containing physician-specific pricing for up to 490 services and procedures performed in the physician’s office, such as routine office visits, strep testing, or x-rays, including out of pocket charges for in-network providers.
WellPoint’s health plans maintain several transparency initiatives including Anthem Care Comparison, • a web-based pilot that provides members with the total estimated costs for nearly 39 specific medical procedures at local hospitals, and Treatment Cost Advisor, which provides average costs for medical procedures based on age, gender and location. For 2012, Wellpoint plans to provide price and quality information on 103 outpatient procedures by provider including the ability to calculate out of pocket costs.
Cigna offers several cost and quality tools that enable members to compare hospitals for treatment • outcomes; compare prescription medications; provide radiology and outpatient surgery costs; and calculate real-time medication pricing according to the member’s health plan. Cigna also makes several of these tools available to the general public through its web site at www.cigna.com. In 2012, Cigna plans to provide pricing for 200 procedures by provider.

11
Federal health care cost and quality reportingHealth Indicators Warehouse (HIW)http://healthindicators.gov/A user-friendly, web-accessible database launched by HHS in 2011 to:
Provide a single source for national, state, and community health indicators• Meet the needs of multiple population health initiatives• Facilitate the harmonization of indicators across initiatives• Link indicators with evidence-based interventions• Serve as the data hub for the HHS Community Health Data Initiative.•
Community Health Data Initiativehttp://www.data.gov/health A large-scale, public-private effort led by HHS to release data, encourage innovative application development, and catalyze change to improve community health. The site provides access to many datasets and tools that have been gathered from agencies across the Federal government.
Agency for Healthcare Research and Quality (AHRQ)Consumer Assessment of Healthcare Providers and Systems (CAHPS)https://www.cahps.ahrq.govA comprehensive family of standardized surveys that asks consumers and patients to report on and evaluate their experiences with health care.
Health Care Cost and Utilization Project (HCUP)http://www.hcup-us.ahrq.gov/A family of both national and state-specific longitudinal databases containing all-payer, encounter-level information on inpatient stays, emergency department visits, and ambulatory care in U.S. (1988-present). These databases are created by AHRQ through a Federal-State-Industry partnership. These databases enable research on a broad range of health policy issues, including cost and quality of health services, medical practice patterns, access to health care programs, and outcomes of treatments at the national, State, and local market levels. This data is available to the public and to researchers for a fee.
Health Resources and Services Administration (HRSA)The Uniform Data System (UDS)http://bphc.hrsa.gov/healthcenterdatastatistics/Contains data reported by grantees of HRSA primary care programs: Community Health Center, Migrant Health Center, Health Care for the Homeless, Public Housing Primary Care. It tracks patient demographics, services provided, staffing, clinical indicators, utilization rates, costs, and revenues. UDS data are reported at the grantee, state, and national levels.
Sources for health data
UnitedHealth offers a premium designation program that designates physicians across 21 specialties • (including primary care) and cardiac facilities (in a given local market) based on compliance with nationally accepted, evidence--based guidelines for quality care. For 2012, UnitedHealth Group plans to offer enrollees access to price and quality information for 125 doctor, lab, radiology, and outpatient services by provider as well as for some inpatient services.
In the last decade, there has been a proliferation of public and private reporting of health care costs and quality data – some mandatory, some voluntary. Unfortunately, the result has been what some consider an unwieldy, inconsistent set of quality reporting measures that has providers scrambling to find the staff time to devote to increasing reporting efforts. And many stakeholders — especially consumers — have been left to wonder how to make sense of any of it. The problem is compounded by a lack of institutional resources and expertise to perform meaningful analysis on the data being collected. While there have been many commendable efforts in recent years to harmonize and streamline quality and performance measures across reporting organizations, more work needs to be done to reduce the data collection burden on providers and to lessen confusion among data users.
Can there ever be too much data?

12
Centers for Medicare and Medicaid Services (CMS)Hospital Comparehttp://www.hospitalcompare.hhs.govAn online tool for comparing the quality of care that hospitals provide. It also includes data on some Department of Veterans Affairs medical centers. The quality measures are developed by the Hospital Quality Alliance (HQA) , a public-private partnership established in 2002. Quarterly reporting is mandatory for all acute care hospitals in order to receive the annual Medicare inflationary payment update.
Nursing Home Comparehttp://www.medicare.gov/NHCompareAn online tool for comparing the quality of care provided by Medicaid or Medicare-certified nursing homes. It rates nursing homes based on health inspection reports, staffing data, and quality measures.
Home Health Comparehttp://www.medicare.gov/homehealthcompare/An online tool for comparing the quality of care that home health agencies provide. It provides a list of U.S. home health agencies, services provided and quality measures. The information comes from home health agencies that have voluntarily agreed to submit quality information.
Dialysis Facility Comparehttp://www.medicare.gov/DialysisAn online tool for comparing the quality of care that dialysis facilities provide. It provides a list of U.S. dialysis facilities, services provided, quality measures, and resources.http://www.medicare.gov/Dialysis/Include/DataSection/Questions/SearchCriteria.asp?version=default&browser=IE%7C8%7CWinXP&language=English&defaultstatus=0&pagelist=Home
CMS Dashboardshttps://www.cms.gov/Dashboard/Dashboards are designed to improve public understanding of Medicare and Medicaid programs by simplifying and making data more accessible.
Health Care Consumer Initiativeshttps://www.cms.gov/HealthCareConInit/Contains service volumes and Medicare payment data for hospitals, ambulatory surgical centers, and physicians.
Substance Abuse and Mental Health Services Administration (SAMHSA)The Treatment Episode Data Set (TEDS)http://wwwdasis.samhsa.gov/webt/information.htmIncludes records for some 1.5 million substance abuse treatment admissions annually. Facilities reporting TEDS data are those that receive State alcohol and/or drug agency funds (including Federal Block Grant funds) for the provision of substance abuse treatment
CDC’s National Center for Health StatisticsHealth Data Interactive (HDI)http://www.cdc.gov/nchs/hdi.htmPresents tables with national health statistics that can be customized by age, gender, race/ethnicity, and geographic location to explore different trends and patterns.
National Healthcare Safety Network (NHSN)http://www.cdc.gov/nhsn/feature_dataStat.htmlA secure, internet-based surveillance system that enables healthcare facilities to collect and use data about healthcare-associated infections, adherence to clinical practices known to prevent healthcare-associated infections, the incidence or prevalence of multidrug-resistant organisms within their organizations, and other adverse events. Some states utilize NHSN as a means for healthcare facilities to submit data on healthcare-associated infections (HAIs) mandated through specific state legislation.
13
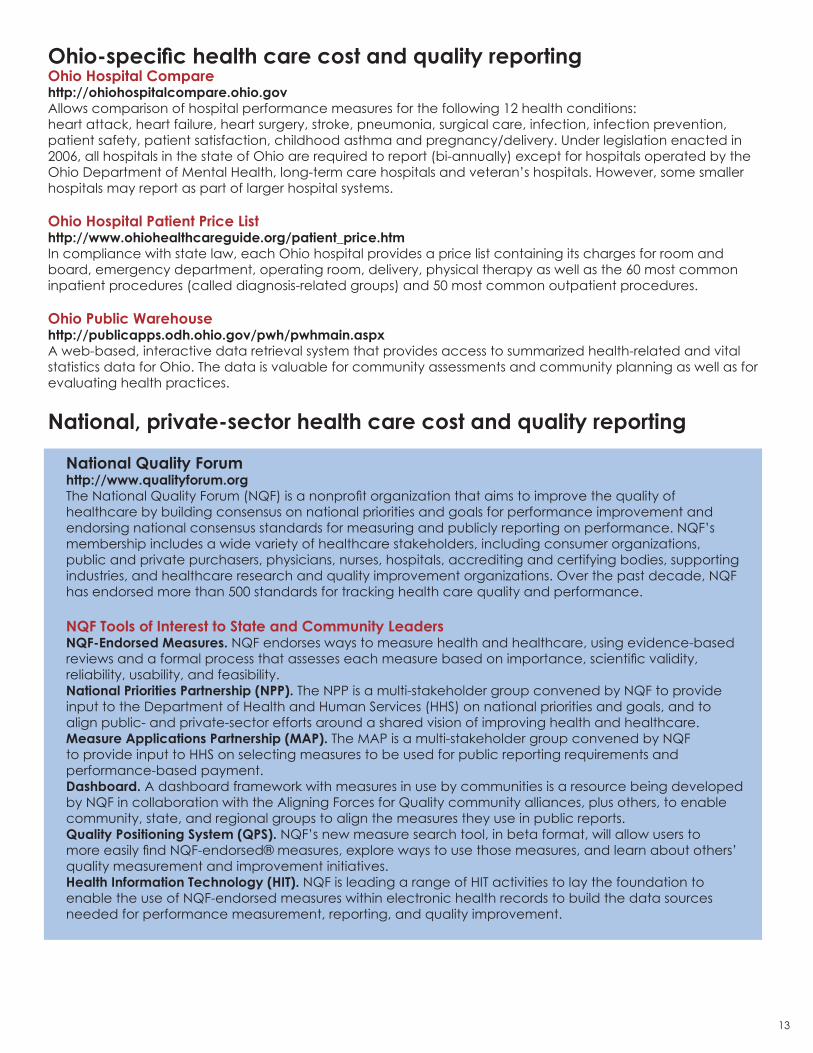
Ohio-specific health care cost and quality reportingOhio Hospital Comparehttp://ohiohospitalcompare.ohio.govAllows comparison of hospital performance measures for the following 12 health conditions:heart attack, heart failure, heart surgery, stroke, pneumonia, surgical care, infection, infection prevention, patient safety, patient satisfaction, childhood asthma and pregnancy/delivery. Under legislation enacted in 2006, all hospitals in the state of Ohio are required to report (bi-annually) except for hospitals operated by the Ohio Department of Mental Health, long-term care hospitals and veteran’s hospitals. However, some smaller hospitals may report as part of larger hospital systems.
Ohio Hospital Patient Price Listhttp://www.ohiohealthcareguide.org/patient_price.htmIn compliance with state law, each Ohio hospital provides a price list containing its charges for room and board, emergency department, operating room, delivery, physical therapy as well as the 60 most common inpatient procedures (called diagnosis-related groups) and 50 most common outpatient procedures.
Ohio Public Warehousehttp://publicapps.odh.ohio.gov/pwh/pwhmain.aspxA web-based, interactive data retrieval system that provides access to summarized health-related and vital statistics data for Ohio. The data is valuable for community assessments and community planning as well as for evaluating health practices.
National, private-sector health care cost and quality reporting
National Quality Forumhttp://www.qualityforum.orgThe National Quality Forum (NQF) is a nonprofit organization that aims to improve the quality of healthcare by building consensus on national priorities and goals for performance improvement and endorsing national consensus standards for measuring and publicly reporting on performance. NQF’s membership includes a wide variety of healthcare stakeholders, including consumer organizations, public and private purchasers, physicians, nurses, hospitals, accrediting and certifying bodies, supporting industries, and healthcare research and quality improvement organizations. Over the past decade, NQF has endorsed more than 500 standards for tracking health care quality and performance.
NQF Tools of Interest to State and Community LeadersNQF-Endorsed Measures. NQF endorses ways to measure health and healthcare, using evidence-based reviews and a formal process that assesses each measure based on importance, scientific validity, reliability, usability, and feasibility.National Priorities Partnership (NPP). The NPP is a multi-stakeholder group convened by NQF to provide input to the Department of Health and Human Services (HHS) on national priorities and goals, and to align public- and private-sector efforts around a shared vision of improving health and healthcare.Measure Applications Partnership (MAP). The MAP is a multi-stakeholder group convened by NQF to provide input to HHS on selecting measures to be used for public reporting requirements and performance-based payment.Dashboard. A dashboard framework with measures in use by communities is a resource being developed by NQF in collaboration with the Aligning Forces for Quality community alliances, plus others, to enable community, state, and regional groups to align the measures they use in public reports.Quality Positioning System (QPS). NQF’s new measure search tool, in beta format, will allow users to more easily find NQF-endorsed® measures, explore ways to use those measures, and learn about others’ quality measurement and improvement initiatives.Health Information Technology (HIT). NQF is leading a range of HIT activities to lay the foundation to enable the use of NQF-endorsed measures within electronic health records to build the data sources needed for performance measurement, reporting, and quality improvement.

14
National Committee for Quality Assurance (NCQA)http://www.ncqa.org/Default.aspx The National Committee for Quality Assurance is a private, not-for-profit organization dedicated to improving health care quality. Since its founding in 1990, NCQA has helped to elevate the issue of health care quality to the top of the national agenda. NCQA uses a variety of approaches to assess health care quality (e.g. on- and off-site surveys, audits, satisfaction surveys, and clinical performance measurement), and uses these for a range of accreditation, certification, recognition and performance measurement programs for different types of organizations, medical groups and physicians. In addition, NCQA regularly tracks the quality of care delivered by the nation’s health plans. To earn NCQA’s seal of approval, accredited health plans must comply with a set of more than 60 standards and must report on their performance in more than 40 areas.
The Joint Commissionhttp://www.qualitycheck.org/The Joint Commission evaluates and accredits more than 19,000 health care organizations and programs in the United States. An independent, not-for-profit organization, The Joint Commission is the nation’s oldest and largest standards-setting and accrediting body in health care. It requires hospitals to report quality improvement efforts quarterly, for a variety of treatment areas. The information is made available to the public though Quality Check.
Leapfrog http://www.leapfroggroup.org/cpThe Leapfrog Hospital Survey is an annual, voluntary public reporting initiative launched in to2001 to assess hospital performance based on four quality and safety practices that are proven to reduce preventable medical mistakes and are endorsed by the National Quality Forum (NQF). Consumers, health plans, and hospitals can use data to identify areas of improvement and to compare hospital performance locally, regionally, and/or nationally.
HealthGradeshttp://www.healthgrades.com/HealthGrades is a healthcare ratings company that compiles outcomes data from dozens of independent public and private sources and translates it into report card ratings on providers, including physicians, hospitals, nursing homes, and home health agencies. Quality and cost information is available to consumers, hospitals, employers, health plans and others.

15
Avalere Health, LLC. Data Transparency: Next Steps for Reform Success. July 2010. http://www.avalerehealth.net/research/docs/20100629_Data_Transparency_Audiocon.pdf
Boulton, Guy. Measuring quality improves doctors’ care, study finds. JSOnline, October 22, 2011. http://www.jsonline.com/business/measuring-quality-improves-doctors-care-study-finds-132351813.html
Canright, Collin. DATA: Open Data, Transparency, and Efficient Markets. Built in Chicago. July 23, 2011. http://www.builtinchicago.org/profiles/blogs/data-open-data-transparency
Cutler, David and Leemore Dafny. Designing Transparency Systems for Medical Care Prices. The New England Journal of Medicine 364; 894-95. March 10, 2011. http://www.nejm.org/doi/full/10.1056/NEJMp1100540#t=article
Deloitte Center for Health Solutions. Health Care Price Transparency: A Strategic Perspective for State Government Leaders., 2007. http://www.deloitte.com/assets/Dcom-UnitedStates/Local%20Assets/Documents/us_chs_pricetransparency_031307.pdf
Deloitte Center for Health Solutions. 2010 Survey of Health Care Consumers: Key Findings, Strategic Implications. http://www.deloitte.com/assets/Dcom-UnitedStates/Local%20Assets/Documents/US_CHS_2010SurveyofHealthCareConsumers_050310.pdf
The Foundation of Research and Education of the American Health Information Management Association and the Medical Group Management Association Center for Research. AHRQ Conference on Health Care Data Collection and Reporting: Collecting and Reporting Data for Performance Measurement: Moving Toward Alignment. Rockville, MD: AHRQ; 2007. AHRQ Publication No. 07-0033-EF. http://healthit.ahrq.gov/portal/server.pt/gateway/PTARGS_0_1248_227079_0_0_18/AHRQ_DataReport_final.pdf.
Fung Ch, Lim YW, Mattke S, damberg C, Shekelle PG (RAND). Systemic review: the evidence that publishing patient care performance data improves quality of care. Annals of Internal Medicine. 2008 Jan 15; 148(2): 111-23.
Goozner, Merrill. Quality, Economy, Transparency: A New Health Care Code. The Fiscal Times, May 10, 2010. http://www.kaiserhealthnews.org/Stories/2010/May/10/FT-Wisconsin-hospital-program.aspx
Hoangmai H. Pham, Jennifer Coughlan, and Ann S. O’Malley. The Impact of Quality-Reporting Programs on Hospital Operations. Health Affairs, 25, no.5(2006): 1412-1422 http://content.healthaffairs.org/content/25/5/1412.full
Institute of Medicine (US) Roundtable on Evidence-based Medicine; Yong PL, Saunders RS, Olsen LA, editors. The Healthcare Imperative: Lowering Costs and Improving Outcomes: Workshop Series Summary. Washington, DC: National Academies Press; 2010. http://www.iom.edu/Reports/2011/The-Healthcare-Imperative-Lowering-Costs-and-Improving-Outcomes.aspx
Langhorne, Thomas. Why hospital bills remain a big mystery. Courierpress.com. August 13, 2011. http://www.courierpress.com/news/2011/aug/13/why-hospital-bills-remain-a-big-mystery/Lewis, Julie. Emphasis on public reporting of health care data intensifies. Bulletin of the American College of Surgeons. Vol. 93, No. 4: 22-25. http://www.facs.org/fellows_info/bulletin/2008/lewis0408.pdf
Mathews, Anna Wilde. Push for Health-Cost Data. Wall Street Journal. October 27, 2011. http://online.wsj.com/article/SB10001424052970203911804576653282823208852.html
National Conference of State Legislatures. State Legislation Relating to Transparency and Disclosure of Health and Hospital Charges. http://www.ncsl.org/default.aspx?tabid=14512
NGA Center for Best Practices Issue Brief. Quality and Price Transparency as an Element of State Health Reform. August 15, 2008. http://www.nga.org/cms/home/nga-center-for-best-practices/center-publications/page-health-publications/col2-content/main-content-list/quality-and-price-transparency-a.html
Wechsler, Pat. Health Insurers Pool $1 Trillion in Claims Data to Spot Trends. Bloomberg. September 20, 2011. http://www.bloomberg.com/news/2011-09-20/health-insurers-pool-1-trillion-in-claims-data-to-spot-trends.html
Nyman, John and Chia-hsuan W. Li. Price and Quality Transparency: How Effective for Health Care Reform. Minnesota Medicine, July 2009. http://www.minnesotamedicine.com/PastIssues/PastIssues2009/July2009/ClinicalNymanJuly2009.aspx
Ohio Hospital Association. Quality Reporting and Transparency Fact Sheet. Update Nov 9, 2010. http://www.ohanet.org/SiteObjects/54AB898C03962A47BF3682F8E4277366/Quality%20Reporting&Transparency%2011-09-19.pdf
O’Reilly, Kevin. Patient-rating websites top Google searches for best doctors. Amednews.com. Nov 28, 2011. http://www.ama-assn.org/amednews/2011/11/28/prsb1128.htm
Pantos, George. How a State Law on Health Claims Transparency Can Serve as a Federal Model. Society for Human Resource Management. Nov 24, 2010. http://www.shrm.org/hrdisciplines/benefits/Articles/Pages/ClaimsTransparency.aspx
Pricewaterhouse Coopers Health Research Institute. Seeing is Believing: Toward Transparency in Healthcare. Medicare Patient Management: Sept/Oct 2007.http://www.medicarepatientmanagement.com/issues/02-05/mpmSO07-Transparency-0827.pdf
Sinaiko, Anna and Meredith Rosenthal. Increased Price Transparency in Health Care – Challenges and Potential Effects. New England Journal of Medicine. March 9, 2011. http://www.nejm.org/doi/full/10.1056/NEJMp1100041
Sipkoff, Martin. Can Transparency Save Health Care? Managed Care, March 2004. http://www.managedcaremag.com/archives/0403/0403.transparency.html
Springfield News Sun. "Advance medical cost info elusive," Nov. 29, 2011.
U.S. Government Accountability Office. Health Price Transparency: Meaningful Price Information Is Difficult for Consumers to Obtain Prior to Receiving Care. GAO-11-791, September 2011. http://www.gao.gov/new.items/d11791.pdf
Sources

16
37 W. Broad Street, Suite 350Columbus, Ohio 43215
614.224.4950
www.hpio.net