health hazard evaluation report 1976-0001-0388 · · 2015-11-05page 2 - health hazard evaluation...
TRANSCRIPT

US DEPARTMENT OF HEALTH EDUCATIONt AND WELFARE CENTER FOR DISEASE CONTROL
NATIONAL INSTITUTE FOR OCCUPATIONAL SAFETY AND HEALTH CINCINNATI OHIO 45226
HEALTH HAZARD EVALUATION DETERMINATION REPORT NO 76-l-388
BOHN ALUMINUM AND BRASS CORPORATION DANVILLE ILLINOIS
APRIL 1977
I TOXICITY DETERMINATION
Environmental investigations were conducted at Bohn Aluminum and Brass Corporation in February May and July of 1976 Medical examinations and tests were additionally done during the May and July surveys The purpose of these investigations was to determine whether Pmployees were exposed to toxic concentrations of Mac Stamp 68 a tooling l ubricant or brazing fumes On the basis of environmental and medical data collected during these surveys observations of work practices and available literature relevant to the toxicity of substances used in the work areas it has been determined that exposures of brazers to cadmium fumes are potentially toxic at concentrations measured during this investigationAlthough exposures are only sporadic the fact that cadmium tends to accumulate in the body over a number of years and that the long term effects of this accumulation are not well understood make it advisable to limit exposures to cadmium as much as possible
Exposure to fumes of copper zinc and silver have been determined to be non-toxic at concentrations measured during this investigation
It is further believed that exposures to Mac Stamp 68 will not produce any long term health effects Vapors of this solvent may produce transient irritation of the eyes nose and throat however any direct skin contact could dry and defat the skin
Concentrations of 111-trichloroethane and of fluorides have been determined to be non-toxic at the concentrations measured
Recommendations to control or minimize existing hazards are offered herein
Page 2 - Health Hazard Evaluation Determination 76-1
I I DISTRIBUTION AND AVAILABILITY OF DETERtUNATION REPORT
Copies of this Determination Report are available upon request from NIOSH Division of Technical Services Information Resources and Dissemination Section 4676 Columbia Parkway Cincinnati Ohio 45226 After 90 days the report will be available through National Technical Information Sershyvice (NTIS) Springfield Virginia Information regarding its availabilitythrough NTIS can be obtained from IHOSH Publications Office at the Cincinnati address Copies have been sent to
a) Bohn Aluminum and Brass Corporation b) Authorized Representatives of UAW Local 1271 Danville Illinois c) US Department of Labor - Region V d) NIOSH - Region V
For the purpose of informing the approximately 60 affected employees the Determination Report shall be posted for a period of 30 calendar days in a prominent place(s) near where exposed persons work
III INTRODUCTION
Section 20(a)(6) of the Occupational Safety and Health Act of 1970 29 USC 669(a)(6) authorizes the Secretary of Health Education and l~elfare followshying a written request by an employer or authorized represen t ative of employees to determine whether any substance normally found in the place of employmenthas potentially toxic effects in such concentrations as used or found
In the early part of 1976 NIOSH was asked by the local union to investigate a problem at Bohn Aluminum and Brass Company Danville Illinois A number of workers were alleged to have upper respiratory irritation skin rashes and breathing difficulties presumably due to cutting oil exposure A NIOSH industrial hygiene team visited the plant in February 1976 A combined industrial hygiene-medical team returned to the plant in May 1976 The findings elicited during these two visits indicated potential excessive exposure to cadmium fume in addition to a potential problem with the cutting oil and prompted a further indepth study This investigation was pe rformed in late July and was directed toward discovering any adverse effects in the workers as a result of prolonged exposure to cadmium fume The report to follow is a detailed description of the investigation that took place
Page 3 - Health Hazard Evaluation Determination 76-1
IV HEALTH HAZARD EVALUATION
A Process Description
Bohn Aluminum and Brass Corporation Heat Transfer Division manufactures finned heating and cooling coils both for the trade to be used in commercial industrial or institutional heating and air conditionin~ units or for use in Bohnbulls own air conditioning and refrigeration products At the Danville facility which has been in operation since 1956 approximately 400 people are employed in the production of these coils There are about 260~00 squarefeet of manufacturing space and about 40000 square feet of offices in which 300 administrative personnel are employed
The operations investigated were copper fabrication fin-press and brazing
1 Copper Fabrication
Copper tubing of various lengths is received in Department 03 and is bent into hairpin shapes on one of two types of machines In one process large rolls of copper tubing are unwound and threaded into the automatic bender cut to the appropriate length and bent into a hairpin shape The Mac Stamp 68 is a tooling lubricant primarily an aliphatic solvent with a small percentof chlorinated aliphatic solvent (the exact composition is considered proshyprietary) This is injected as a vapor onto the copper tubing and the machine parts Several of these units may be operating at any given time with one employee operating each of the machines There is also a 11 hand bending operation in which pre-cut and pre-lubricated lengths of copper tubing are placed one at a time into a machine which bends them into the hairpin shape Exposure to ~1ac Stamp 68 in Department 03 would be from inhalation of the solvent vapors and from skin contact during the actual handling of the parts coated with the oil There are 13 persons employed in Department 03 on the first shift and four persons on the second shift there is no graveyard shift at Bohn
2 Fin-Press
The fin-press in Department 12 is a punch press operation Rolls of aluminum sheeting are uncoiled into the punch press and simultaneously holes are punched for the copper tubing to fit through and the fins are cut to the appropriate size These are then stacked and the fin-press operator fits the copper hairpin parts through the holes in the stick of fins The fin spacing ranges from 4 to 24 fins per inch with the exact dimension determined by the height of the fin collar This is a continuous process generatin~ thousands of fins per hour The operator is potentially exposed to Mac Stamp 68 since the aluminum is dipped into the lubricant before it is punched and the Mac Stamp 68 is also sprayed into the die as the aluminum goes through
Page 4 - Health Hazard Evaluation Detenmination 76-1
3 Brazing
To complete the heating and cooling coils 11 return bends 11 11Caps leads or other connections are brazed onto the copper tubing For brazing copper to copper an alloy of copper and phosphorous (93 7) or silver copper and phosphorous (5 89 6) is used For brazing copper to brass connecshytions a brazing alloy of 35 silver 36 copper 21 zinc and 18 cadmium or an alloy of 45 silver 15 copper 16 zinc and 24 cadmium would be used The brazing alloys are usually referred to in terms of their percent silver
Whenever the alloys containing 35 silver or 45 silver are used a brazing flux is spread on the surfaces to be brazed using a small brush This flux contains fluorides
In Departments 20s and 20f a coil with a U-bend on the bottom is brazed to another coil to form a complete circuit This usually involves copper to copper brazing although certain orders require copper to brass brazing Twenty-five persons worked in each of the two departments which operate only during first shift
In Department 01 headers or distributors are built and both copper to copper and copper to brass brazing is done About 30 persons work in this Departshyment however no more than a dozen usually braze at any one time There are also hand bending machines in this area at which employees may be exposed to l~ac Stamp 68
Copper to copper brazing is also done in Department 19 where very large coils are built Coils are also tested for leakage in this area by immersing them in tanks of water and forcing compressed air through the circuit If no leaks are found the coils are put on a large conveyor through a drying oven Sixteen persons work in Department 19 on the first shift 7 on the second shift but there is no brazing done during second shift
B Evaluation Design and Methods (Environmental)
An initial environmental study was conducted on February 4-6 1976 by NIOSH industria 1 hygienists for the purpose of evaluating employee exposure to tmiddot1ac Stamp 68 and to fumes generated during brazing operations Worker exposures to tmiddot1ac Stamp 68 were monitored in Department 03 where copper tubing was bent Department 12 the fin-press operation ard Department 19 where parts which had been machined with t~ac Stamp 68 were being brazed (Although the use of r~ac Stamp 68 had been instituted because it does not require conventional degreasing in a solvent a film of the lubricant often remains on the parts to be braz2d)
Charcoal tubes and Sipin pumps were used to collect personal breathing zone samples on employees in these three areas Pumps were calibrated at 50 ccminute and consecutive samples of approximately 10 liters each were taken over an 8-hour period
Page 5 - Health Hazard Evaluation Determination 76-1
Exposures to silver cadmium copper zinc and lead were investigated in Departments 20s 20f 01 and 19 during brazing operations Personal sampl-ing pumps drew air at a flow rate of 15 liters per minute through AA filters contained in closed faced cassettesto collect breathing zone saM~les on brazers
Ouring this initial visit to Bohn 29 employees were interviewed using non-directed medical questionnaires to determine if there were any adverse health effects attributable to their exposures to substances used in the workplace
Based upon information and data collected during the initial survey it was decided that a combined environmental and medical investigation should be conducted to determine the range and severity of health effects and to fullycharacterize exposures of brazers in Departments 01 20s and 20f to cadmium contained in the brazing alloy and fluorides contained in the brazing flux
On t1ay 17-19 1976 a NIOSH physician and industrial hygienist returned to Bohn Aluminum and Brass Corporation to conduct a follow-up investigation Persona1 breathing zone samp1 es were again co11 ected for r-lac Stamp 68 and for metal fumes in the areas visited on the initial survey Exposures to Mac Stamp 68 were monitored on both first and second shifts in Department03 using Sipin pumps and charcoal tubes Metal fume exposures in Departments01 20s and 20f were characterized by personal breathing zone samples collected on AA filters Fluoride exposures were additionally monitored by collectingpersonal breathing zone and general area samples wherever the brazing flux was used Persona1 samp1i ng pumps set at one 1iter per minute dre1 air through an AA pre-filter and 15 ml of sodium acetate solution contained in impingers
~1edical interviews and limited physical examinations were also conducted to evaluate 29 employees
It was determined that more extensive medical investigations would be necessaryin order to fully characterize the health status of brazers who had been exposed to cadmium for a number of years
The workforce at Bohn appeared to be very stable with the length of service of brazers ran~ing up to 25 years Most of the brazers were women many of whom had been (or are) brazing during childbearing years and it was felt that their exposures and health status should be investigated A third and final medicalenvironmental survey was conducted on July 27-30 1976 This was arranged during a period of high cadmium usage
Environmental air samples were again obtained on this survey to be analyzedfor cadmium silver copper zinc and fluorides using methods identical to those used on the previous survey Heat stress measurements were made next to the automatic brazing unit on July 29
Page 6 - Health Hazard Evaluation Determination 76-1
C Evaluation Design and Methods (Medical)
The total number of workers exposed and controls who participated in this study was 38 Vacations and illnesses limited the number of persons (exposed to cadmium fumes) that were available for selection Therefore all of those who were braziers (those who work directly with cadmium solder) at the time of the study were asked to participate This group numbered 20 There were 12 females and 8 males Their age range was 25-60 with a mean of 379 This group had worked as braziers from 25 years - 200 years with a mean of 79 years A control cohort was selected and matched as closely as possible for age sex and smoking history The control cohort consisted of office personnel factory workers physically removed from the areas of exposure and NIOSH volunteers There were 18 in the control group 8 females and 10 males There age range was 23 to 53 with a mean of 363 The control group had little or no known previous exposure to cadmium
A series of tests were performed on these cohorts The tests that were done included
1 Pulmonary Function Studies (FVC- Forced Vital Capacity FEV Forced Expiratory Volume in one second and W1EF - ~-1aximum MldshyExpiratory Flow)
2 Blood Pressure Measurement 3 Complete Blood Count (Hemoglobin Hematocrit WhitP Blood
Cell Count Differential)4 Blood Urea Nitrogen5 Serum Creatinine 6 Serum Alpha-1-antitrypsin7 Urinalysis8 Urine Beta-2-microglobulin9 Blood Cadmium Level
10 Urine Cadmium Level 11 Hair Cadmium Level 12 Urine Uric Acid Concentration 13 Urine Creatinine Concentration 14 Medical History15 Physical Examination
All urine evaluations were performed on spot urine samples The analysis of the multiple specimens taken was performed by Medical DiagnosticServices Inc in Cincinnati Ohio and the NIOSH Contract Laboratory in Salt Lake City Utah Standard analytical techniques were used for the biomedical evaluations and Atomic Absorption Spectrophotometry was used in the cadmium determinations on blood urine and hair
In addition to the previously described testing a series of animal experiments were conducted to determine the irritancy and sensitization potential of the cutting oil Mac-Stamp 11 Both rabbits and guinea pigs had various concentrations of rmiddot1ac-Stamp applied to intact or abraded skin and their responses to these applications recorded
shy
Page 7 - Health Hazard Evaluation Determination 76-1
After reception logging and tabulating the data T tests were performed on each medical test variable Analysis within the exposed (brazier group) relating to total number of years brazing was carried out using the SPSS ANOVA program This analysis of variance consisted of using years brazing smoking and sex as main effects and age as covariant
C Evaluation Criteria 1 Environmental Standards
Three types of standards have been selected for use as criteria in evaluating the exposures of employees to substances used at Bohn NIOSH has developedand recommended standards which are designed to protect the health and safetyof t~orkers employed for up to a 10-hour workday 40-hour bullJeek over a working lifetime The US Department of Labor enforces standards for over 400 chemical substances (29 CFR 1910 1000 Tables G-1 G-2 and G-3) The third type of criteria Threshold Limit Values (TLVbulls) represent airborne concentrashytions of substances under which it is believed 11 nearly all workers may be exposed lithout adverse effect These have been recoJllTlended by the American Conference of Governmental Industrial Hygienists The following table presentsthose standards applicable to the substances evaluated during this survey
Federal ACGIH NIOSH Substance Standard TLV Recommendation Cadmium fume 0 1 mg~middot1 3 005 mgt~3 05 mgt1 3
111-Trichloroethane 350 PPt1 350 PPN 350 PPt13 3Copper fume 01 mgM 02 mgM3 3 13Fluorides 25 mgM3 25 mgt~ 2 5 mg1middot
Silver 001 mgM3 0 01 mg~1~Zinc (oxide fume) 5 mgM 5 mgt-1 5 mgM3
Heat Stress See Toxicologic Effects Section Acceptable ceiling concentration= 30 mgM3
There is no environmental standard for Mac Stamp 68 It is primarily an aliphatic solvent and would not be expected to be very volatile
2 Toxicologic Effects a) Metal Fumes
(1) Cadmium Cadmium fumes are produced during brazing operations at Bohn in which the alloys containing 35 and 45 percent silver are used Cadmium fume is a severe pulmonaryirritant and in high concentrations over short periods of time can lead to pulshymonary edema and death Throat irritation cough chest pain and dyspnea are common symptoms following acute exposure In severe cases acute pulmonary edema may develop within 24 hours of exposure eventually followed by permanent lung damage in the form of fibrotic changes Chronic exposure may lead to pulmonary
Page 8 - Health Hazard Evaluation Determination 76-1
emphysema renal tubular dysfunction (even renal failure) rhinitis ulceration of the nasal septum olfactory nerve damage and anosmia Continuous ingestion of cadmium may cause back pain joint pain unsteady gait osteomalacia and even bone fractures
In occupational situations chronic cadmium poisoning follows repeated exposures over a long period of time Cadmium is readily absorbed via inhalation and retention of absorbed cadmium has been found to be very high It tends to accumulate in the liver and kidneys as it is stored in the cadmium-binding proshytein metallothionein The biologic half life of cadmium in humans is unknown however based on mathematical models it has been estimated to be as high as 10 to 30 years Excretion is slow Urinary concentrations of cadmium have no diagnostic significance in terms of severity or duration of exposure and indicates only increased absorption of cadmium
As early as 1947 Hardy and Skinner1 described 5 cases of chronic cadmium poisonshying in a plant manufacturing cadmium faced bearings Air concentrations ranging from 017 to 046 mgcu mwere reported and the duration of exposure for the five men ranged from 4 to 8 years ~orkers experienced varying degrees of symptomatology including loss of appetite nausea vomiting epigastric and sternal pain constipation fatigue dental trouble and burning of the throat Hemoglobin levels were decreased in two and cadmium was found in the urine of all five (001-005 mg per liter)
Ventilatory function was assessed by Kazantzis2 in workers exposed to cadmium in casting operations in two factories in Great Britan Mean values for vital capacity and maximum ventilatory capacity were not found to be significantlydifferent when control groups from the same factories were compared to the exposed groups However mean values for two other indices of pulmonary function were found to differ si9nificantly indicating possible ventilatory impairmentA follow-up on these 100 men 5 years later revealed a greater deterioration in performance of respiratory function tests in the exposed group as compared to the controls3 The authors also reported forty-three diagnosed cases of chronic cadmium poisoning compared to 19 in the initial study Emphysema andor proshyteinuria were the primary findings in these workers Results of atmospheric sampling at one of the factories showed a range of 10 to 80 ug Cdcu m during the later survey and 5 to 270 ugcu m on the prior study
In a more recent study 4 kidney damuge as evidenced by proteinuria was reported to be more prevalent than pulmonary ventilatory impairment when 3 groups of workers exposed to cadmium were examined Excessive proteinuria was found in 15 of men exposed to cadmium for less than 20 years and in 68 of men exposed for more than 20 years to concentrations reported to be less than 200 ugcu m Proteinuria is believed to be indicative of tugu6a7 damage caused by the accumushylation of cadmium in tubular epithelial cells and excretion of low moleshycular weight proteins such as B2 microglobulin is one of the early signs of cadmium toxicity
Increased destruction of red cells and bone marrow depressio ~ccompanied bymild to moderate hypochromic anemia have also been reported
Page 9 - Health Hazard Evaluation Determination 76-1
Evidence from biochemical studies and from toxicologic experiments ~n 1 enimals indicates that zinc may prevent manifestations of cadmium toxicity Cadmium and zinc are believed to compete for the same binding sites and where zinc is bound preferentially to cadmium the ability of cadmium to interfere with or inhibit normal biochemical activity is suppressed Zinc appears to form more stable complexes when nitrogen or o9Ygen are the ligands but cadmium seems to bind more freely with sulfur groups In one experiment rabbits treated with both cadmium and zinc were compare~1 to rabbits treated with cadmium alone for 5 days per week for 6 months t1oderate light chain proshyteinuria and slight tubular damage were found in those rabbits receiving doses of both metals whereas rabbits treated with cadmium alone developed severe proteinuria and extensive tubular damage In addition present animal data suggests cadmium to be a carcinogen as well as a teratogen Increased incidence of Prostatic and lung cancer have been reported in humans exposed to cadmium fumetl
(2) Zinc
t1any metal fumes including zinc are capable of producing a syndrome referred to as 11 metal fume fever This is characterized by symptoms including chills and fever nausea vomiting dryness of the throat coughing fatigue and weakness sometimes accompanied by mental confusion and decreased pulmonaryvital capacity This condition is usually temporary
In an experim~~t in which 2 persons voluntarily exposed themselves to zinc oxide vapors a sweetish taste was experienced as well as a tickling sensashytion in the nasal passages coughing nausea and anorexia headache malaise chills and fever White blood cell counts on both men indicated a moderate leukocytosis which reached a peak about 30 hours following inhalation and which persisted even after the febrile reaction had subsided Vital capacity was also found to be reduced in both men The average concentration to which the subjects were exposed was 600 mgcu m and the lengths of exposure were 10-12 and 12 minutes
(3) Copper
Copper fume is also capable of producing metal fume fever and in some instances a discoloration of the skin and hair Exposures to copper fume have also been associated with congestion of the nasal mucous membranes ulceration of the nasal septum and sometimes pharyngeal congestion Chronic exposure can lead to irritation of the respiratory tract a metallic or sweet taste nausea and more seriously damage to the liver kidneys or spleen
(4) Silver
Silver can accumulate in body tissues and produce argyria a blue-gray disshycoloration of the skin mucous membranes and eyes but this appears to result only after prolonged and repeated exposures Systemic effects have not been documented
Page 10 - Health Hazard Evaluation Determination 76-1
(5 Fluorides
Industrial exposures to fluorides have produced irritation of the eyes and respiratory tract nosebleeds nausea 11 Sinus troubles and skin rashes Repeated exposure to high concentrations may also produce osteosclerosis
(6 Mac Stamp 68
There is no report in the literature relating to the industrial toxicity of Mac Stamp 68 Since it is primarily an aliphatic hydrocarbon it might be expected to produce central nervous system depression if sufficient quantishyties are inhaled Other possible hea l th effects could include irritation of the mucous membranes of the eyes nose and upper respiratory tract Direct skin contact with the liquid solvent may produce dehydration and defattingof the skin causing irritation and possibly dermatitis
(7) Heat Stress
Since measurement of deep body temperature is impractical for monitoring the workers heat load the measurement of environmental factors is required which most nearly correlate with deep body temperature and other physiological responses to heat At the present time wet bulb-globe temperature index (WBGT)is the simplest and most suitable technique to measure the environmental factors WBGT values are calculated by the following equations
1 Outdoors with solar load WBGT = 07 WB + 02 GT + 01 DB
2 Indoors or outdoors with no solar load WBGT = 07 WB + 03 GT
WBGT = Wet bulb glove temperature index WB = Natural wet bulb temperature DB = lry bulb temperature GT =Globe thermometer temperature
The determination of WBGT requires the use of a black globe thermometer a natural wet blub thermometer and a dry bulb thermometer
(8) 111-Trichloroethane
Main effect of exposure is anesthesia Increased concentrations can cause mild irritation of mucous membranes and disturbed equilibrium May cause decreased blood pressure transient elevations of transaminase levels and at extremely high levels death from suffocation
Page 11 - Health Hazard Evaluation Determination 76-1
D Evaluation Results
1 Environmental
The results of analyses of environmental air samples collected at Bohn Aluminum and Brass Corporation are presented in Tables I II III and IV
During the initial survey concentrations of Mac Stamp 68 were found to range up to 33 ppm with an average concentration of 6 ppm The two highestconcentrations (30 and 33) were measured on breathing zone samples from the operator of the 5 Automatic Bender in Department 02 Breathing zone concentrations at the fin-press were 13 and 12 in two consecutive samples and concentrations of Mac Stamp to which brazers were exposed in Department19 ranged from 2 to 4 ppm
In May Mac Stamp 68 concentrations ranged up to 55 ppm with an averageconcentration of 10 ppm The highest concentration was measured in the breathing zone of the fin-press operator and the next highest concentrashytions (28 and 23 ppm) were measured on breathing zone samples from the 6 and 8 Automatic Benders 111-trichloroethane concentraiions were also monitored during th1s visit and concentrations of up to 17 ppm were measured with an average level of 4 ppm 111-trichloroethane was found on charcoal tube samples that had been collected in areas where only Mac Stamp 68 was used probably indicating both a plant-wide environmental air contamination and also the presence of chlorinated hydrocarbons in Mac Stamp 68 Mac Stamp 68 was likewise found on samples from the degreasing areas most likely as a result of environmental air contamination from nearby areas in wh i ch Mac Stamp 68 was used Tables I and II presents the results of analyses for Mac Stamp and 111-trichloroethane
Filter samples obtained in the breathing zones of brazers on February 5 and 6 1976 were analyzed by atomic absorption spectroscopy for silver cadmium copper zinc and lead No lead was detected on any of the filters therefore samples obtained on subsequent surveys were not analyzed for this metal Silver was only detected on 9 of the 62 filter samples taken during the three plant visits and the highest concentration was 0015 mgM3 measured in July on a breathing zone sample of a brazer in Department 20 The other silver concentrations ranged from 0 001 to 0009 mgM3
Copper concentrations ranged up to 0089 mgM3 during brazing operations with average concentrations of 0026 0 017 0 006 and 0 013 mgM3 on February 5 and 6 ~1ay 17-19 July 28 and July 29 respectively
Page 12 - Health Hazard Evaluation Determination 76-1
The highest zinc concentration on any of the filter samples was 0281 mgM This was measured in the breathing zone of a brazer in Depa rtment 20f during the use of the 35 si lver aljoy in February Other environmental air concenshytrations averaged 0033 mgt~ in February 0013 mg~~13 in both tmiddot1ay and on July 28 and 0022 mg M3 on Ju ly 29
The highest cadmium concentrati ~ns were measured in February when they 3ranged from 0005 to 0366 mgM The average concentration was 0074 mg~1 during that s urvey The five highest values were all found in the brea thi ng zones of brazers i n Department 20f while they were using the 35 silver alloy In nay very little cadmium-containing alloy was used and the average environshymental air concentration measured during that part of the investigation was 0001 mgM3 and 8 of the 17 filters had no detectable amounts of cadmium on them I n July environmental air concentrations of cadmium averaged 0015 mgM3 (with a range up to 0049) on the 28th and 0033 mgjM3 (ranging up to 0185) on the 29th
Environmental concentrations of fluorides were also monitored during nay and July Only two of the 8 samples collected in May had any detectable amounts of fluorides These were both area samples collected next to brazers in Department 01 and each had 0002 mgM3 of fluorides In July fl uori de concentrations ranged up to 0419 mgM3 with an average of 0090 mg~3
Heat stress measurements were also performed The WBGT an index used when evaluating worker exposure in hot environments was calculated for July 29 For indoor exposure the following calculation is made
HBGT = 07 ~JB + 03 GT WB = Natural wet bulb temperature obtained with a wetted
sensor exposed to the natural air movement GT = Globe thermometer temperature
The temperature measurements and results of ca1 culations for ~JBGT are included in Table VI All measurements were below the permissible heat expos ure TLV for continuous light load (300 C) and moderate load (267 C) act i vi ty
2 Medical Results and Discussion
Twenty workers exposed to cadmium fume braziers) and 18 controls (those with little or no cadmium exposure were evaluated in this study By history 14 exposed workers (70) and 10 controls (55) were smokers Their mean packyear consumption was 278 and 225 respectively
One pack year = one package of cigarettes per day for one year
3
Page 13 - Health Hazard Evaluation Determination 76-1
As seen in Table VII both groups were compared in how they responded to the medical questionnaire Headache and chest tightness were the only two symptoms that occurred more frequently in exposed workers than control workers and were statistically significant p OS) These symptoms are frequently encountered in workers exposed to cadmium fume
Physical examinations were performed on both cohorts Blood pressureheight weight skin examination and evaluations of teeth lungs heart and sense of smell were done Table VIII shows the comparisons between the groups No significant differences were found
In addition to the history and physical examination a number of biomedical tests were done These are listed in Part IV Section B The results of the biomedical evaluations can be found in Tables IX through XX These Tables show individual worker values as well as means and standard deviations All of these biomedical evaluations were done as listed in Part IV Section B Pulmonary function studies were performed using the 11 Vitalograph 11 machines a~g predicted normal values for height sex and age taken from Kamburoff et al
Evaluation of Mac Stamp 68 a cutting oil in use at Bohn was studied to access its skin irritancy and sensitization properties Guinea pigs were used to determine sensitization and rabbits were used to test irritancy potentialTable XX shows the results of the skin irritancy and sensitization testingindicating that Mac Stamp is irritating but probably not a sensitizing agent
Careful analysis of the laboratory data revealed no significant differences (p lt05) between the control and exposed groups Analysis of variance comshyparing those who worked greater than 10 years and those working less than 10 years both males and females in the brazing operations showed only one variable urine creatinine to be significantly different The meaning of this is unknown
Workers 3 21 and 22 (See Tables X XII XIV XVI XVIII XIX) deserve special consideration at this time These workers were observed to have a variety of abnormalities in one or more of the biomedical evaluations performed in this hazard evaluation The abnormalities in forced vital capacity (FVC) forced expiratory volume in one second (FEV1) and FEV1FVC ratios were the most conshysistant in these three workers Their values 1n these tests indicate moderate to severe pulmonary disease that was difficult to attribute to non-occupational causes
All of these results must be considered with respect to a number of factors First the relationship between years worked as a brazier and actual exposure to cadmium fume can only be estimated because of the intermittant and irregular use of cadmium containing solders It is possible that 11 years brazing is an inapproshypriate measure of the true exposure Second the possibility that some of those who served as control may have at some time received significant exposures to cadmium unknown to them Third and ~erhaps the most important is the recently 1reported protective effects of zinc During exposure to heavy metals such as cadmium or lead zinc has been shown to have a protective effect The workers at Bohn Aluminum and Brass did have exposures to zinc
Blood pressure greater than 14090 was considered as normal
Page 14- Health Hazard Evaluation Determination 76-1
F Conclusions (Environmental)
It is believed that exposures of brazers to cadmium fume at Bohn Aluminum and Brass Corporation are potentially toxic under the conditions observed during this investigation Recognizing that the use of cadmium containinq brazing alloys may be only sporadic in nature it is felt that since cadmium is not rapidly metabolized and excreted and therefore tends to accumulate in the body even sporadic exposures at the concentrations measured may produce adverse health effects Furthermore the long term health effects of chronic exposure to cadmium are not fully understood and it is possible that irreversshyible systemic damage (kidney damage or pulmonary disease) may be occurring even before symptoms (proteinuria or reduction in ventilatory capacity) present themselves The medical data does indicate that cadmium has been absorbed by the body in brazers and since there are no defined 11 Safe 11 bioshylogical levels it is recommended that employee exposures to cadmium be limited via administrative and environmental controls This should be suppleshymented by a continuing program of medical surveillance of all workers exposed to cadmium in the work place
Exposures to fumes of copper zinc and silver have been determined to be non-toxic at the concentrations measured during this evaluation Breathing zone concentrations of these metals were below existing standards for occupashytional exposures Additionally medical findings did not indicate any health effects attributable to these exposures
On the basis of environmental monitoring in Departments 03 and 12 and on physical examination of workers exposed to Mac Stamp 68 it is believed that exposures to vapors of Mac Stamp 68 may produce transient sensory irritation especially of the upper respiratory tract and direct contact could dry and defat the skin possibly resulting in dermatitis Specific animal experiments conducted by NIOSH to test Mac Stamp 68 for irritation and sensitization potential showed that this solvent could cause irritation in sufficient concenshytrations but no sensitization was produced in guinea pigs Irritation of the skin could be avoided by the use of appropriate protective clothing including impervious gloves and aprons Alternatively coveralls could be worn which would be removed before leaving the plant and laundered before reuse
Concentrations of fluorides and of 111-trichloroethane as measured during this investigation have been determined to be non-toxic Environmental concenshytrations were consistently low and medical findings did not reveal any symptoms indicative of over-exposure to either substance
NIOSH has defined a 11 hot environmental condition as any combination of air temperature humidity radiation and wind speed that exceed a WBGT of 79GF Although this level was not exceeded on July 29 certain provisions are advised to reduce the peaks of physiologic strain in order to insure the health of workers These would include frequent work breaks to allow employees to get water and replacement salt the use of appropriate protective clothing and equipment acclimitization of employees and defined work-rest regimens
Page 15 - Health Hazard Evaluation Determination 76-1
G Conclusions (Medical)
A variety of medical and biomedical evaluations were performed during this hazard evaluation Comparison of the exposed and control cohorts revealed no significant differences in the biomedical test results Physical examshyinations revealed no significant group differences Comparison of symptomshyatology showed significant occurrence of headache and chest tightness in the exposed group over that in the control group
The lack of significant differences between these groups is surprising considering the environmental measurements showing increased cadmium fume levels intermittently present in the brazing work areas Several possible explanations for this are listed in the preceding section It is this investigators opinion that a potentially toxic situation existed during this evaluation It is apparent that certain individuals in the brazing group workers 3 21 and 22 may have been effected by cadmium fume exposuredesoite a the fact that there were no statistical differences in the groups as whole The individuals mentioned had abnormal findings possibly related to cadmium exposure that could not easily be explained by other causative agents ie heavy tobacco consumption
V RECOnimiddot1ENDATIONS
Pursuant to the above conclusions the following specific recoomendations are made
1 Ventilation Control
In Department 01 employee exposure could be substantially reduced if the ventilation system were operating Ventilation measurements done during July indicated that the presence of individual fans blowing air dawn toward the employees sitting at the bench totally compromised the attempt to move contaminant air into the exhaust hood and out of the work area Assuming that the exhaust fan capacity is sufficient cadmium and other metal fumes could be vented away from the breathing zones of the workers if the individual cooling fans were not working at cross-purposes to the hood
In Oepartments 20s and 20f there was no local exhaust ventilation Since high contaminant concentrations were measured in this area during this investishygation it is recommended that some sort of ventilation be installed This could either be a canopy hood over a special lark bench at which all cadmium brazing could be done or portable exhause ventilation in the form of a flexible exhaust duct which would draw fumes away from the workers breathing zones
Make-up air must be provided Perhaps if this make-up air were sufficiently cooled in summer it would preclude the necessity for the individual coolingfans which tend to make it difficult to exhaust air in any one direction
Page 16 - Health Hazard Evaluation Determination 76-1
2 Temporary Administrative Control of Exposures
It was apparent that even during special orders in which cadmium-containing alloy had to be used that only a small proportion of the total number of braziers in Departments 20s and 20f actually used this alloy Therefore it would be advisable as a temporary measure only to rotate braziers on these special coils such that no person would be exposed to cadmium conshytaining fumes for much more than a two-hour period on any one day This is only a temporary measure and does not supplant ventilation cont~ol
3 Medical Surveillance
The following recommendations are offered to insure worker safety and health
A If a reasonable substitute is available the cadmium contained solder should be discontinued
B Routine pre-employment medical examinations should be performed as well as periodic physical examtnations depending on age and job classification A suggested time table is every 2-3 years while a worker is less than 40 years of age then o~ a yearly basis thereafter
C The examinations should consist of medical history physical examinations and appropriate biomedical testing A suggested biomedical profile would include
1) Blood Pressure Measurement 2) Pulmonary Function Studies 3) Chest X-ray4) Electrocardiogram5) Complete Blood Count 6) Urinalysis7) Serum Multiphasic Analysis-12 (if cadmium use 1s continued)8) Urine for Cadmium (24 hour collection)9) Urine for Beta-2-Microglobulin
Page 17 - Health Hazard Evaluation Determination 76-1
vI REFERENCES
1 Hardy HL and Skinner JB The Possibility of Chronic Cadmium Posioning J Ind Hyg Toxicol 29 No 5 321-24 1947
2 Kazantizes G Respiratory Function in Men Casting Cadmium Alloys Part I Assessment of Ventilatory function Br J Industr ~1ed 1330-36 1956
3 Bonnell JA Kazantzi s G King e A Follwo-up Study of tmiddot1en Exposed to Cadmium Oxide Fume Br J Industr Med 16 135-145 1959
4 Lauwerys R Buchet J Roels H et al Epidemiologic Survey of Workers Exposed to Cadmium Arch Environ H1th 145 148 1974
115 5 Friberg L Odelblad E Localization of Cd in Different Organs An Autoradiographic Study Acta Path Microbial Scand 41 96 1957
115 6 Gunn SA Gould TC Selective Accumulation of cd by Cortex of Rat Kidney Proc Sec Exp Biol t~ed 96 820 1957
7 Zenz C (ed) Occupational Medicine Chicago Year Book Publishers Inc 1973
8 Tsuchiya K Arch Environ Health 14875-80 1967
9 Vallee BL Ulmer DO Biochemical Effects of Mercury Cadmium and Lead US Department of Health Education and Welfare GM-15003 1972
10 Buell G Some Biochemical Aspects of Cadmium Toxicity J Occ Med 17 No 3 189-195 1975
11 Vigliani EC The Biopathology of Cadmium Am Ind Hyg Assoc 30 329 1969
12 Sturgis CC Drinker P Thompson RM Metal Fume Fever I Clinical Observations of the Effect of the Experimental Inhalation of Zinc Oxide byTwo Apparently Normal Persons J Ind Hyg 9 No 3 88-97 1927
13 Kamburoff PL and 1middotoitowitz HJ amp RH 1972 Predictions of Spiroshymetric indicies British Journal of Diseases of the Chest
14 Haeger-Aronsen B Schutz A Abdulla M Antagonistic Effect in Vivo of Zinc on Inhibition of Delta Aminolevalinic Acid Dehydratase by Lead JulyshyAugust 1976 Archives of Environmental Health
15 A~erican Conference of Governmental Industrial Hygienists Documentation of Threshold Limit Values
16 Standards Completions Project Appendix C 11edica1 Surveillance Guidelines Cadmium Fume
Page 18- Health Hazard Evaluation Determination 76-1 -
17 Barrett H~-1 Irwin DA Semmens E Studies on the Toxicity of Inhaled Cadmium The Journal of Industrial Hygiene and Toxicology Sept 1947
18 Buell G Some Biochemical Aspects of Cadmium Toxicology Journal of Occupational Medicine Vol 17 No 3 March 1975
19 Patty FA ed Industrial Hygiene and Toxicology 2nd Revised Ed Interscience Publishers New York 1963
20 Lemen RA et al Cancer Mortality Among Cadmium Production Workers Anna1 s ilew York Academy of Sciences
VII AUTHORSHIP AND ACKNOWLEDGImiddotIENTS
Report Prepared By Beth SB LevyIndustrial Hygienist Industrial Hygiene Section HETAB NIOSH Cincinnati Ohio
Channing R Meyer t~D Chief Medical Section HETAB NIOSH Cincinnati Ohio
Originating Office Jerome P Flesch Acting Chief Hazard Evaluations and Technical Assistance Branch NISOH Cincinnati Ohio
Acknowledgments Jerome P Flesch Acting Chief HETAB Robert E Rosensteel Chief IHS HETAB Clint Collins Engineering COSTEP HETAB Eileen Philbin Nurse Officer Medical Section HETAB Rob Kemp Nedical Support Section Sandy Langenbrunner Hedical Support Section Linda Shea Nurse Consultant Willia~Stringer Support Services Branch Vernon Perone Experimental Toxicology Branch
TABLE I BREATHING ZONE CONCENTRATIONS OF MAC-STAMP 68
BOHN ALUMINUM amp BRASS CORP FEBRUARY 5 amp 6 1976
MAC-STAMP 68 DPET PROCESS SAMPLING PERIOD (ppm)
12 12
Fin-press Fin-press
815-1125 11 25 - 15 30
1271 1151
03 8 Automatic Bender 812- 1120 685 03 8 Automatic Bender 1120 - 1530 1556
03 7 Automatic Bender 810 - 11 20 703 03 7 ~utomatic Bender 11 20 - 15 30 441
03 5 Automatic Bender 807 - 11 17 3331 03 5 Automatic Bender 11 1 7 - 15 30 2993
03 ~laterials Hand1 ing 932 - 1135 309 03 Materials Handling 11 35 - 1525 364
1 j
Drop-saw Operator Drop-saw Operator
935 - 11 25 11 25 - 1525
ND 305
03 Automatic Bender 747 - 1116 373
03 Supervising 750 - 1l 17 259
03 Hand Bender 755- 1117 387
03 Automatic Bender 753 - 1117 142
01 Hand Bender 912 - 1212 1 74
19 19
Drying oven-capping coils Drying oven-capping coils
924 - 1208 1208 - 1530
ND ND
19 19
Brazing on Mac-Stamp Brazing on Mac-Stamp
855 - 1128 1128 - 1445
414 300
19 19
Brazing on Mac-Stamp Brazing on Mac-Stamp
858 - 1130 1130- 1445
219 l 73
ND = None Detected
DEPT
BREATHING ZONE
PROCESS
TABLE II CONCENTRATIONS OF MAC STAMP 68 AND 111-TRICHLOROETHANE
BOHN ALU~1INUM amp BRASS CORP t4AY 17 amp 18 1976
1 1 1-TR I-MAC-STArmiddot1P 68 CHLOROETHANE
TIME EEm (EEm 03 Automatic Bender 8 1622 - 1825 838 204 03 Oirving Jeep 1608 - 1830 245 195 03 Cutting copper tubing 16 03 - 18 17 325 209 03 Materials Handler 1605 - 1820 461 203 03 Automatic Bender 12 1605- 1819 ND ND 03 tlaterials Handler 1820 - 2210 697 1 74 03 Driving Jeep 1830 - 2200 1325 180 03 Automatic Bender 8 1823 - 2212 2327 229 03 Automatic Bender 12 1818 - 2201 1453 231 03 Cutting Copper Tubing 1817 - 2201 193 750 03 Automatic Bender 12 830 - 1432 592 273 1 Automatic Bender 6 825 - 1432 2806 338
Automatic Bender 8 832 - 1432 1064 231 03 Automatic Saw 829 - 1432 592 305 12 Fin Press 1744 - 2202 041 374 12 Fin Press 835 - 1432 5549 320 20s Degreasing - Loads 1636 - 1833 048 546 20s Degreasing - Unloads 1 6 42 - 1834 077 1658 20s Degreasing - Loads 1833 - 2206 670 1201 01 Degreasing 839 - 1453 665 146
ND = None Detected
TABLE III ENVIRONMENTAL CONCENTRATIONS OF METALS
BOHN ALUMINUM amp B~~SS CORP FEBRUARY 5 amp6 1976
DEPT PROCESS SAMPLING SILVER CADMIUM
3PERIOD Conc(mgM3) Conc(mgM) COPPER 3 Conc(mgM)
ZINC 3 Co~c~_~~-J 20f Brazing - 35~ Ag 810- 1112 ND 0176 0022 0033
20f Brazing - 25 Ag 816- 1110 ND 0050 0011 0023 20f Brazing - 35 Ag 820 - 11 13 ND 0142 0019 0027 20f Brazing - 35~ Ag 822 - 1111 004 0366 0028 0067 20f Brazing - 35~ Ag 813 - 1113 004 0267 0089 0281
01 Brazing - 35~ Ag 835 - 1513 i~ D 0005 0007 0002 01 Brazing - 5~ Ag 840 - 1530 ND 0002 0010 ND 01 Brazing - 35~ Ag 905- 1430 ND 0008 0010 0004 19 Brazing - 0 or 5~ Ag 858 - 1435 ND 0010 0029 0006 19 Brazing - 0~ Ag 927 - 1440 ND 0009 0021 0004 19 Brazing - 0~ Ag 855 - 1445 ND 0006 0010 0004 20s Brazing - 0 amp 5 Ag 1030 - 1515 ND 0009 0042 0007 20s Brazing - 0 amp 5 Ag 1035 - 1505 0005 0007 0037 0007 20samp20f Brazing - 0 amp 5 Ag 1 040 - 1512 0002 0022 0034 0010 20f Brazing - 0 amp 5~ Ag 1045 - 1500 ND 0026 0018 0016
Federal Standard (8-hr TWA) 001
TLV 01 01 5
(c=cei1ing) 001 005(c) 02 5
ND = None Detected Pump did not appear to be functioning at desired f1owrate
TABLE IV BREATHING ZONE CONCENTRATIONS OF METALS
BOHN ALUMINUM amp BRASS CORP MAY 17-19 1976
BRAZING ALLOY ( Silver) DEPT SAMPLE PERIOD
CADMI~M mgM
COPP3R mgM
ZINS mgM
SILVsectR mgM
5 01 855 - 1451 001 008 003 ND 05 20f 952 - 1455 ND 008 001 ND 05 20f 955 - 1455 001 015 002 ND 05 20f 959 - 1457 001 029 002 ND 535 01 849 - 1448 003 013 002 ND 35 01 843 - 1449 003 007 002 ND 05 01 758 - 1450 001 011 001 ND 05 01 852 - 1446 001 010 000 ND 05 20f 957 - 1455 001 043 005 004 05 01 847 - 1451 001 015 002 001 05 01 809 - ll 22 ND 015 001 ND 05 01 811 - 11 20 ND 030 ND 002 05 01 805 - ll 22 ND 005 ND ND 35 01 800- 1120 ND 004 ND ND 05 20 846 - 11 26 ND 033 ND bull ND 05 20 843 - 1125 ND 024 003 ND 05 20 840 - ll 25 ND 016 002 ND
TLV mgM 3 005 02 5 001
JULY 28~ 1976
35 - half day 05 - half day
20 735 - 1505 003 ND 007 ND
35 - half day 05 - half day
20 740 - 1505 009 007 012 ND
35 - half day 05 - half day
20 748 - 1505 003 ND 005 ND
05 20 747 - 1507 003 007 005 ND 35 01 754 - 1513 035 ND 019 ND 35 01 808- 1515 015 007 005 ND 35 01[
05 01 810- 1515 014 012 023 ND
TABLE IV (Cont)
BRAZING ALLOY ( Silver) DEPT SAMPLE PERIOD
CADMI~M COPP~R mgM mgM
ZIN5 mgM
SILV~R mgM
35 - half day 05 - half day
20 817 - 1507 049 009 071 ND
35 01 806-1515 022 007 007 ND 35 20 1209 - 1509 ND ND ND ND 35 01 754 - 1513 047 009 016 ND 05 01 759 - 1453 003 005 004 ND 05 20 740 - 1506 ND 003 003 ND
JULY 29 1976
05 20 717 - 1436 008 010 010 ND 535 01 752 - 1445 185 054 045 009 05 20 713 - 1451 010 013 013 ND 05 20 715 - 1450 012 010 015 ND 05 20 718 - 1431 ND 007 003 ND 35 20 718 - 1435 014 017 007 ND 05 20 723 - 1441 007 009 009 ND 35 20 724 - 1435 056 007 058 ND 35 20 726 - 1437 027 007 026 ND 35 20 730 - 1435 035 004 033 ND 05 20 730 - 1437 037 007 036 ND 535 01 737 - 1436 061 018 039 ND 535 01 742 - 1447 013 007 005 ND 05 20 912- 1436 012 019 014 ND 535 01 757 - 1457 019 013 015 ND 535 01 757 - 1443 032 013 011 ND
Pumps were turned off during lunch break (approximately 30 minutes) Ll) Sample ND = ~one Detected middot
TABLE V ENVtRONMENTAL CONCENTRATIONS OF FLUORIDES
BOHN ALUtnNU1middot1 amp BRASS CORP JULY 28 and 29 1976
WORK F ( impinsecter) + F (fi1~er) STATION DEPT SAMPLE PERIOD mgM mgtmiddot1
1 20 848 - 1508 001 ND
TOTA~ mgM
001 2 20 850 - 1508 ND ND ND
14 01 854 - 1514 017 112 129 15 01 854 - 1518 021 069 090 16 01 855 - 1516 ND 009 009 1 01 856 - 1517 007 072 079 3 01 856 - 1515 011 046 057 4 01 858-1516 022 082 1 04 1 20 750 - 1437 ND ND ND 2 20 750 - 1439 010 ND 010
14 01 755 - 1446 124 060 184 4 01 758 - 1446 010 025 035
16 01 754 - 1445 074 058 132 2 01 757 - 1447 064 033 097 3 01 756 - 1447 346 073 419
TLV = 25 mg(M3
During May only 2 samples had detectable amounts (0002 mgtM3 each) of fluorides All pumps except ninth and tenth on list were turned off during lun
(approximately 30 minutes) ch break
ND = None Detected
TABLE VI HEAT STRESS r~EASUREr1ENTS
BOHN ALUMINUrmiddot1 amp BRASS CORP JULY 29 1976
Times WB 07 WB GT 03 GT WBGT
1 935 740 518 895 269 787
2 1010 740 518 900 270 788
3 1055 735 515 865 260 775
4 1128 740 518 890 267 785
5 1218 730 511 945 284 795
6 127 720 504 860 258 762
7 235 720 504 865 260 764
8 317 720 504 855 257 761
Values given in oF degrees Farenheit
PERtHSSIBLE IIEAT EXPOSURE THRESHOLD LP1IT ALUES
(Values Given in oc WBGT and oF HBGT)
lmiddotJORK- REST REG II lEU umlT ~~om~ LOf)
t10DCRATE HEVY Continuous ~lork 300(84degF 267(80degF25(77degF 75 Hork 25 Rest Each Hour 306 28l 259 50 Hork 50 Rest Each Hour 314 29~ 27~
25 Work 75 Rest Each Hour 322 311 300
degF = 95 cc + 32
degF = Dearees F~renheit oc = Oegrees Centa~ra~e
Taken from 1976 TLvbulls published by the American Conference of Governmental Industrial Hygienists
TABLE VII COMPARISON OF SYt1PTOMS BY HISTORY
BOHN ALUMINUf1 amp BRASS CORP JULY 1976
SYf~PTOI~S EXPOSED POSITIVE CONTROL POSITIVE
l Cough 60 50 2 Sputum Production 50 39 3 Chest Tightness 45 17 p lt05 4 Wheezing 30 22 5 Shortness of Breath 40 44 6 Frequency of Urination lnight 10 17 7 Protein sugar or blood in urine 5 (Sugar) 0 8 Kidney or Bladder Problems 35 28 9 High Blood Pressure in Past 10 22 1o Chest Pain 20 17 11 Heart Attacks 0 0 12 Abnormal Blood Fats 0 0 13 ~liscarriages (female) 42 12 14 Difficulties with Pregnancy (female) 8 0 15 Deformities in Living Children 8 0 16 Difficulties Fathering Children 0 0 17 Headache 75 28 p lt01
Dizziness 60 39 Trouble Sleeping 25 17
tO Tremor 5 6 21 Abnormal Sense of Smell 5 17 22 Weight Loss 10 11 23 Anemia 5 6 24 Fatigue 30 22 25 Loss of appetite 5 6 26 Skin Rash 20 6 27 Hepatitis or Liver Disease 5 0 28 Frequent Colds 5 6 29 Family Members who have died or or
how have emphysema 35 17
Symptoms showing suggestive differences at or approaching statistical significance
TABLE VIII
C0~1PARISON OF PHYSICAL EXAltiNATION RESULTS ABNORI~LITIES
BOHN ALUNINUI1 amp BRASS CORP JULY 1976
EXPOSED POSITIVE CONTROL POSITIVE
Blood Pressure 35 22 (Abnormal Greater than 14090)
Skin 0 0
Teeth (Edentoulous) 50 50
Lungs 0 11
Heart (Mummurs or Irregularities) 10 0
Smell 10 0
TABLE IX BLOOD CADtUUt lETERttiUATIONS
BOHN ALWUNur1 amp BRASS CORP JULY 1976
EXPOSED CONTROL 1 lt20 ugDL 11 lt20 ugDL
2 lt20 ugDL 12 lt20 ugDL
3 lt20 ugDL 13 lt20 ugDL
4 lt20 ugDL 14 lt20 ugDl
5 lt20 ugDL 15 lt20 ugDl 6 lt20 ugDL 16 lt20 ugDL 7 lt20 ugDL 18 lt20 ugDL B lt2 0 ugDL 19 lt20 ugDL 9 lt20 ugDL 20 lt20 ugDL 10 lt20 ugDL 30 lt20 ugDL 17 lt20 ugDl 31 lt20 ugDL 21 lt20 ugDL 32 lt20 ugDL 22 lt20 ugDL 33 lt20 ugDL 23 lt20 ugDL 34 lt2n ugDL 24 lt20 ugDL 35 lt20 ugDL 25 lt20 ugDL 36 lt20 ugDL 26 lt20 ugDL 37 lt20 ugDL 27 lt20 ugDL 38 lt20 ugDL 28 lt20 ugDl 29 lt20 ugDL
TABLE X URii~E CADMIUM DETERtUNATIONS
ugL Cor~ected for Specific Gravity (1024)
BOHN ALU~1INUrt amp BRASS CORP JULY 1976
EXPOSED CONTROL
1 10 11 8
2 1 1 12 10 3 22 13 8
4 12 14 4 5 14 15 12 6 lt4 16 lt4
7 7 18 lt4 8 lt4 19 12 9 17 20 8 10 8 30 5 17 11 31 lt4
21 27 32 7 22 15 33 6
23 7 34 11 24 14 35 22 25 4 36 12 26 6 37 9
27 8 38 9
28 7 29 7
Mean 1055 ~middotlean 828 Standard Deviation + 634 Standard Deviation +482
Worker abnormal possibly related to cadmium exposure
TABLE XI HAIR CAD~HUt-1 CONCENTRATION
ugCd Per Gram Hair
BOHN ALUf1INU11 amp BRASS CORP JULY 1976
EXPOSED CONTROL
1 29 11 07 2 13 12 11
3 30 13 0
4 35 14 15 5 49 15 04 6 23 16 13 7 23 18 07 8 2G 9 19 9 10 20 54 10 07 30 09 17 17 31 10
21 69 32 80 22 22 33 26 23 06 34 07 24 06 35 16 25 10 36 09 26 24 37 15 27 92 37 27 28 20
29 14
Mean 262 Mean 183 Standard Deviation +22 Standard Deviation ~1 90
Worker abnormal possibly related to cadmium exposure
TABLE XII PULMONARY FUNCTION STUDY RESULTS
EXPOSED BOHN ALUMINUt1 amp BRASS CORP
JULY 1976
FVC (Liters) FEV1 (Liters) (LitersSec) WORKER (PREDICTED) (WORKER) (PREDICTED (WORKER) FEF FEV 1FVC
l 346 428 2 93 349 293 ~15
2 359 445 310 380 41 () 854 3 320 374 269 250 122 668 4 468 590 382 435 360 737 5 466 514 378 446 490 867 6 496 475 420 415 4 70 874 7 310 295 2 69 236 1 72 800 8 4 68 492 358 420 440 R54 9 336 320 288 290 350 906
10 446 6 5 394 529 600 860
17 384 442 330 3 36 220 760 21 248 185 225 122 065 fi59 22 4 46 580 400 380 190 655
23 370 457 328 370 2 90 810 24 382 455 328 3 77 335 R28 25 380 450 325 3 70 342 822 26 357 3 95 318 352 4 30 891
27 51 558 4 13 475 490 851 28 360 41 B 310 365 450 873 29 444 660 369 530 4 30 803
lmiddottean 809 Standard Deviation +076
Harker abnormal possibly related to cadmium exposure
TABLE XIII PULMONARY FUNCTION STUDIES BOHN ALUf1INUt1 amp BRASS CORP
JULY 1976 CONTROL
WORKER
FVC Liters) FEV (Liters) 1 (LitersSec)
FEF FEV1FVC (PREDICTED) (WORKER) (PREDICTED) (~ORKER)
11 339 392 300 425 300 826 12 342 460 300 425 498 923 13 315 285 270 210 152 736 14 302 340 265 270 218 794 15 356 397 301 348 338 876 16 442 650 341 562 880 865 18 330 348 288 278 249 789 19 433 498 339 398 310 799 20 524 630 424 621) 630 984 30 318 320 293 302 420 943 31 392 412 344 31)8 2()8 747 32 548 575 442 497 530 864 33 526 530 422 408 290 77() 34 298 265 273 245 320 924 35 490 570 403 442 320 775 36 466 532 380 438 340 823 37 462 508 394 410 355 807 38 484 494 394 398 445 840
Mean 838 Standard Deviation +070
TABLE XIV BRAZIERS (Exposed)
CBC RESULTS
BOHN ALUt11 NUt~ amp BRASS CORP JULY 1976
WBCcc RBCcc STUDY (Thousands) (r~illions) HGBgmdl HCT ~1CVm3 t1CH pg t1CHC
1 64 502 156 464 92 31 336
2 42 462 133 407 88 389 32A
3 83 492 159 469 95 323 339
4 74 540 165 489 90 305 337
5 51 498 149 431 86 295 341
6 49 508 154 459 90 304 337
7 74 472 145 440 93 308 331 8 77 510 164 474 92 321 346
9 72 410 120 364 88 294 331 10 53 496 147 437 87 297 337 17 80 443 130 399 89 293 326
21 52 454 135 410 90 298 331 22 65 529 155 462 87 294 337
23 76 4 55 123 372 81 269 331
24 62 460 141 426 92 306 332 25 79 459 141 422 91 307 335 26 45 358 94 297 82 264 319 27 81 555 168 497 89 303 338 28 65 476 143 424 88 301 338 29 49 511 160 469 91 314 342
riean 65 480 144 431 89 299 334 Std Dev +13 + 45 + 18 + 48 + 34 + 14 + 06
Worker abnorma1t possibly related to cadmium exposure
TABLE XV CONTROL GROUP
CBC RESULTS
BOHN ALUmNU~l amp BRASS CORP JULY 1976
STUDY
11
WBCcc RBCcc (Thousands) (t4i 11 ions) HGBgmdl HCT tmiddot1CVm3
87 408 135 404 98 rtCH pg 333
t-1CHC 336
12 66 455 14 1 402 88 309 351 13 110 470 147 444 94 312 331 14 46 4 36 128 382 87 294 336 15 62 470 137 409 86 293 337 16 103 550 169 504 91 308 336 18 63 408 123 363 88 302 341 19 54 452 146 441 97 324 332 20 71 490 150 454 92 306 331 30 43 448 140 424 94 312 330 31 52 474 143 430 90 301 333 32 64 489 149 436 88 305 343 33 64 523 155 454 86 296 342 34 38 517 139 426 82 270 328 35 82 460 141 426 92 308 332 36 66 495 146 438 88 294 333 37 57 457 140 414 9) 306 339 38 95 469 138 411 87 293 336
~~ean 68 4 71 143 426 90 304 336
Std Dev +20 + 37 + 11 + 31 + 41 + 13 +06
TABLE XVI BRAZIERS (Exposed)
URINE AND BLOOD RESULTS BOHN ALUt-11 NUt1 amp BRASS CORP
JULY 1976 STUDY
BUN (Blood Urea URINE mg01 URINE BETA MICROGLOBULIN
Nitrogen) m~DL URIC ACID CREATi mgDL URI~E 4-370 ugLl) ALPHA-1-ANTITRYPSIN BLOOD 165-389 mgLdl
17 49 83 lt30
2 17 50 76 lt30 3 17 22 52 lt30
4 16 68 174 lt30
5 16 36 93 lt30
6 15 91 247 58 7 16 66 200 lt30 B 19 57 131 55 9 9 23 62 40
10 18 100 290 340 17 10 36 126 lt30
~1 15 53 122 lt30 15 21 65 lt30
10 16 49 lt 30 24 16 20 45 lt 30 25 18 66 155 lt 30 26 11 40 86 lt 30 27 20 69 194 lt 30 28 13 23 48 lt 30 29 25 66 200 lt 30
Mean 15 1 486 1249 Std Dev + 42 +244 + 722
~orker abnorma1 possibly related to cadmium exposure
260 330 330 210 285 170 210 260 210 210 240 210 220
330 420 210 275 330 330 330
2685 + 647
STUDY
TABLE XVII CONTROL GROUP
BLOOD AND URINE RESULTS
BOHN ALUm NW1 amp BRASS CORP JULY 1976
BUN (Blood Urea URINEmgDL URINE BETA MICROGLOBULIN (Nitrogen)m~DL URIC ACID CREATrngDL URI~E (4-370 ugL1l
ALPHA-1-ANTITRYPSIN BLOOD 165-389 mgld1
11 20 24 54 lt30 330 12 19 17 25 lt30 420 13 l7 24 35 lt30 330 14 20 31 87 lt30 420 15 12 16 35 lt30 330 16 20 29 89 lt30 130 18 17 50 132 32 330 19 19 77 196 lt30 45
20 13 60 157 lt30 210 30 13 48 100 lt30 340 31 1 8 21 lt30 360 32 18 69 154 lt30 170
3 18 63 140 44 330 34 1 1 17 41 lt30 330 35 14 25 40 lt30 230 36 20 39 122 lt30 210 37 15 66 204 lt30 210 38 11 24 66 lt30 330
i~ean 16 38 94 286
+ 35 + 214 + 592 ~ 894
TABLE XVI II SERU~ CREATININE
MgDL BOHN ALWIINUi1 amp BRASS CORP
JULY 1976 EXPOSED CONTROL
~~~~(~~ ~rrum cR[~TtiHNt rJO~KtR StR01 ~Rt~Tif~Hit
1 08 11 OB 2 06 12 09
3 07 13 OP
4 09 14 09 5 08 15 07 6 10 16 12 7 08 18 09 8 08 19 11 9 16 20 08
10 08 30 07 7 09 31 06
10 32 07 22 09 33 07 23 08 34 08 24 08 35 06 25 08 36 08 26 08 37 09 27 08 38 08 28 07 29 12
Mean 12 08 Std Dev + 02 +01
~orker abnormal possibly related to cadmium exposure
TABLE XIX CDr1PARISON OF ALPHA-1-ANTITRYPSIN AND TOTAL
WHIBITORY CAPACITY BETWEEN EXPOSED Atm CONTROL
BOHN ALUt1INUt1 amp BRASS CORP JliLY 1976
EXPOSED CONTROL WORKER ~-1 -~i E~IDL TIC WORKER ~-1 -AT coyenVoL TIC
1 225 084 11 420 063 2 240 079 12 560 105
3 280 079 13 280 105
4 270 084 14 330 079 5 290 084 15 260 084 6 300 070 16 110 044 7 330 074 18 300 100 8 320 095 19 280 074 9 320 070 20 330 078
10 280 068 30 350 111 17 240 095 31 350 111
21 330 082 32 1 90 074 22 310 053 33 270 079
23 360 116 34 2RO 095 24 440 126 35 320 090 25 220 068 36 290 074 26 220 079 37 280 063 27 290 079 38 400 111 28 280 079 29 420 079
tmiddot1ean 298 082 311 086
Std Dev + 60 + 16 + 94 + 19
Worker abnormal possibly related to cadmium e~osure
TABLE XX SENSITIVITY AND IRRITANCY DATA ON 11 flAC-STM1P 68
BOHN ALUt1 HWImiddot1 amp BRASS CORP JULY 1976
11 11SKIN IRRITATION AND SENSITIZATION STUDIES ~middot1AC-STA P 6R
(1) SKIN IRRITATIOf~ Rabbit Skin)
This material is a skin irritant at concentrations above 25 on intact skin and at concentrations above 10 on abraded skin
(2) SKIN SENSITIZATION (Guinea Pig Skin)
This material did not sensitize guinea pig skin however a negative test does not completely rule out the possibilitythat it may be a human skin sensitizer
Recommended patch test concentration on human intact skin is 10 and on abraded skin is 5
- HEALTH HAZARD EVALUATION DETERMINATION REPORT
-
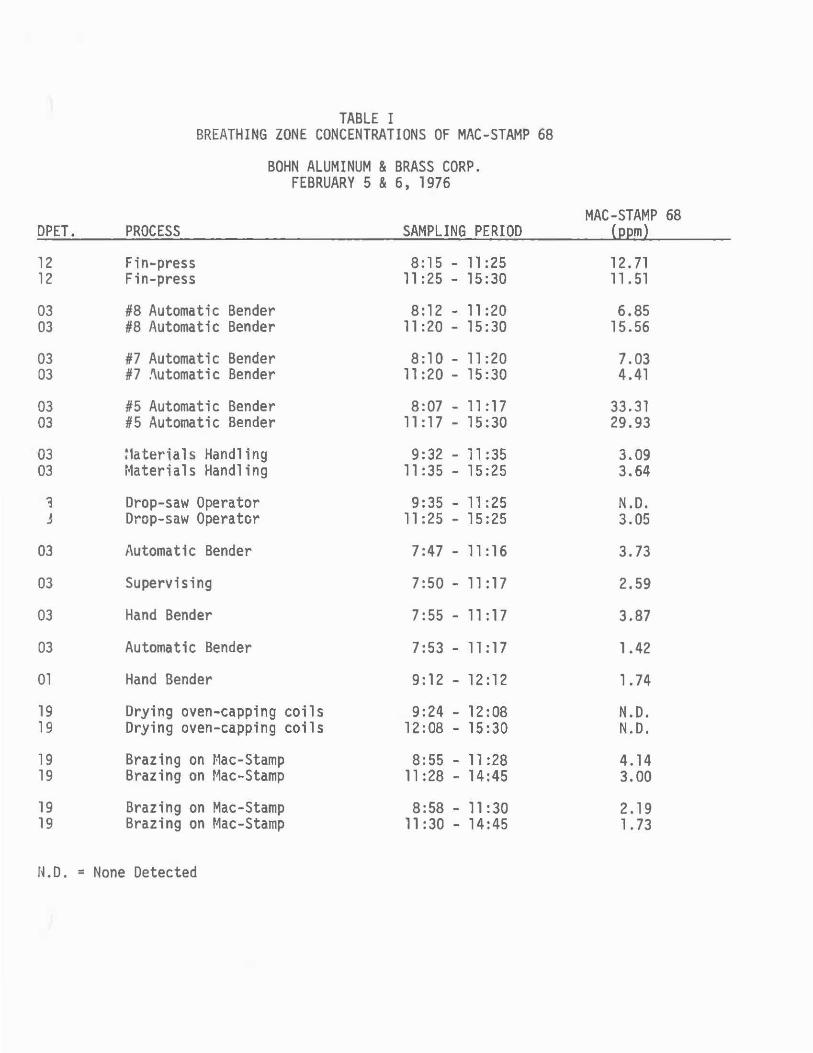