health in ireland
TRANSCRIPT

Health in IrelandKey Trends 2019
Prepared by the Department of Health, gov.ie/health

1
Introduction
IntroductionThe 2019 edition of Health in Ireland: Key Trends provides summary statistics on health and health care over the past ten years. It highlights selected trends and topics and includes data from newly available sources. There are also several tables and graphs comparing Ireland with other countries in the EU or the OECD, to provide context for national performance and assess progress. The booklet is divided into seven chapters covering topics from population growth, life expectancy and health status to profiles of the new regional health areas. Rapid ageing of the population in conjunction with lifestyle-related health threats present major challenges now and for the future in sustaining and improving health and health services in Ireland.
Following the publication of results from Census 2016, the estimated population growth between 2016 and 2019 was 3.8%. The numbers and proportion of the population in the older age groups continues to grow, with the number of people over the age of 65 continuing to increase by over 20,000 a year. Over the next 20 years, the number of people aged 85 and over is projected to increase on average by around 6,000 each year. This will have a significant impact on the demand for health care services in Ireland.
Life expectancy continues to improve in Ireland. Male life expectancy has increased by 3 years and female life expectancy by almost 2 years since 2007. The gap between the life expectancy of men and women also continues to narrow, with the latest
available data showing this gap now at its lowest point since the 1950’s with women’s life expectancy 3.6 years more than males. These improvements are largely due to lower levels of mortality and better survival from conditions such as heart disease and cancer affecting older age groups. The contribution of modern health services to this achievement, while difficult to quantify, has been of unquestionable significance.
Mortality rates have declined 10.5% since 2009. Age-standardised death rates for major causes of death such as cancers and circulatory system diseases have declined by 10% and 25% respectively over the past ten years.
Lifestyle factors such as smoking, drinking, levels of physical activity and obesity continue to be issues which have the potential to jeopardise many of the health gains achieved in recent years. However, inequalities in health are closely linked with wider social determinants including living and working conditions, issues of service access, and cultural and physical environments. Taken together with an ageing population, adverse trends, if not addressed now, will lead to an unhealthy and costly future.
From 2009 to 2012, the population eligible for a medical card increased steadily. More recently, however, these trends have reversed as economic conditions have improved. The key challenge, and opportunity, will be to ensure that scarce resources are carefully targeted to deliver services in the
fairest, most efficient and most effective ways possible.
A new chapter has been added to Key Trends this year which focuses on profiling the new regional health areas. The establishment of Regional Health Areas (RHAs) with clearly defined population catchments will enable a fundamental shift towards a population health approach to planning, resourcing and delivering integrated health and social care services based on population need. Population profiling to describe and understand regional population characteristics commenced between the Department of Health and HSE in 2019. Some initial findings are presented in this section.
The Sláintecare implementation Plan published in 2018 states that the successful implementation of the Sláintecare vision will require robust knowledge and information drawing on good quality, timely and relevant data sources. Key Trends 2019 makes a contribution to this vision and offer readers an evidence base for what is currently happening in our health service. This annual publication is a resource that supports Sláintecare’s ongoing programme of evaluation and assesses the contribution of the reform programme to the performance of the health system during the 10-year implementation period. Effective management will mean decision-making and planning based on the best possible evidence at all levels.
2
Introduction
IntroductionChapter 1 Table 1.1 Population Estimates (‘000s) for
Regional Authority Areas by Age GroupTable 1.2 Population of Ireland (‘000s) by Age
GroupFigure 1.1a Old Age Dependency Ratio by
Electoral DivisionsFigure 1.1b Percentage of Carers by Electoral
DivisionsFigure 1.2 Cumulative Percentage Increase in
Population, All Ages and 65+, Ireland and EU-28
Table 1.3 Live Births, Birth Rate and Total Fertility Rate, Ireland and EU-28
Figure 1.3 Total Fertility Rate by County, IrelandFigure 1.4 Total Fertility Rates in EuropeTable 1.4 Population 2019 and Projected
Population to 2039 (‘000s) by Age Group, Ireland
Table 1.5 Dependency Ratio Ireland, 2019 and Projected to 2039
Figure 1.5 Older Age Groups: Population 2019 and Projected Population 2024-2039
Table 1.6 Life Expectancy, Ireland, by Age and Gender
Figure 1.6 Life Expectancy at Birth, Ireland and EU28, by Gender
Figure 1.7 Life Expectancy at Birth for EU28 Countries
Figure 1.8 Healthy Life Years and Life Expectancy at Age 65 by Gender, Ireland and EU 28
Chapter 2Figure 2.1 Summary of Population Health, Ireland
and EU28Table 2.1 Self Perceived Health Status, Ireland
and EU28Table 2.2 People with a Long-Standing Illness or
Health Problem, Ireland and EU28Table 2.3 Self Perceived Long-Standing
Limitations in Usual Activities Due to Health Problems, Ireland and EU28
Figure 2.2 Self Perceived Health Rated Good or Very Good by Income Quintile, Ireland and EU28
Figure 2.3 Percentage of the Population Reporting Good or Very Good Health in EU28 Countries
Table 2.4 Principal Causes of Death: Numbers and Age Standardised Death Rates per 100,000 Population
Figure 2.5a Deaths by Principal Causes, Percentage Distribution, Ages 0 64
Figure 2.5b Deaths by Principal Causes, Percentage Distribution, Ages 65 and Over
Figure 2.6 5 Year Age Standardised Mortality Rates from External Injury or Poisoning by County
Table 2.5 Age Standardised Death Rates per 100,000 Population by Principal Causes of Death, Ireland and EU 28
Figure 2.7 Age Standardised Death Rates for Selected Causes, Ireland
Figure 2.8 Age Standardised Death Rate for Suicide by Gender, 3 Year Moving Average, Ireland and EU28
Figure 2.9 Treatable Mortality Rates for Ireland and EU28
Figure 2.10 Infant Mortality Rates, Ireland and EU 28
Figure 2.11 Percentage of Children, Aged 11-17, engaged in Risky Health Behaviour, Ireland
Figure 2.12 Alcohol and Cigarette Consumption per Annum, per Capita Aged 15 Years and Over
Figure 2.13 Comparison of Different Health Indicators Across Genders
Figure 2.14 Incidence of chronic conditions among smokers and non-smokers
Chapter 3Table 3.1a Public Acute Hospital Summary
Statistics

3
Introduction
Figure 3.1 Public Hospital Bed Days Used by Type of Care, Age Group and Gender
Table 3.1b Private Acute Hospital Summary Statistics
Figure 3.2 In Patient Discharges per BedFigure 3.3 Numbers of Adults and Children
Waiting for In-patient and Daycase Elective Procedures
Figure 3.4 Number of People Waiting 52 Weeks or Longer for an Outpatient Appointment and Total Number of People on Outpatient Waiting List
Figure 3.5 National 30 Day Moving Average of Admitted Patients Waiting on Trolleys in Emergency Departments in Public Acute Hospitals
Figure 3.6 Emergency Hospital DischargesFigure 3.7 Patience Experience Time in
Emergency DepartmentsFigure 3.8 DELTA and ECHO Ambulance
Response Times Figure 3.9 Number of Transplants in Ireland by
Type Figure 3.10 Total Transplants in Ireland per Million
Population Table 3.2 Psychiatric Hospitals and Units
Summary Statistics Figure 3.11 Psychiatric Hospitals and Units:
Admission Rate per 100,000 Population by Age Group
Figure 3.12 Hospital Inpatient Experience Rating, by Age Group and Gender
Figure 3.13 Patient Experience Survey, Confidence in Staff and Dignity of Patients by Age Group
Chapter 4Figure 4.1 Percentage of Population with a
Medical Card by Age Group Table 4.1 Primary Care Reimbursement Service
Schemes Figure 4.2 Prescription items dispensed under
the General Medical Services (GMS) scheme
Figure 4.3 Average no. of GP visits in the last 12 months, by Age Group
Figure 4.4 Out of Hours GP ContactsFigure 4.5 Percentage of Population Covered by
Private Health Insurance Table 4.2 Long Stay Care Summary Statistics Figure 4.6 Blood Donations and Percentage of
Blood Donors in PopulationTable 4.3 Immunisation rates, percentage uptake Table 4.4 Number of Cases in Treatment for
Problem Drug and Alcohol Use Figure 4.7 Problem Drug and Alcohol Use Rate
per 100,000 Population ages 15-64.
Chapter 5Table 5.1 Public Health Service Employment
(HSE & Section 38) Figure 5.1 Public Health Service Employment by
Grade Category Figure 5.2 Proportion of Staff Employed in the
Public Health Service in each Grade Category
Figure 5.3 Consultant and Non-Consultant Hospital Doctors (HSE & Section 38)
Figure 5.4 Consultant Hospital Doctors Employed in the Public Health Service by Category
Table 5.2 Consultant and Non-Consultant Hospital Doctors Employed in the Public Health Service
Figure 5.5 Practising Doctors per 1,000 population
Chapter 6 Table 6.1 Public Health Expenditure in Millions
of Euro Table 6.2 HSE Non-Capital Vote Allocation in
Millions of Euro Table 6.3 Capital Public Health Expenditure by
Programme in Millions of Euro Figure 6.1 Total Public Health Expenditure Figure 6.2 Percentage Gross Non-Capital Voted
Expenditure by Programme, HSE

4
Introduction
Table 6.4 Current Health Care Expenditure by Financing Scheme
Table 6.5 Current Health Care Expenditure by Health Care Function
Table 6.6 Current Health Care Expenditure by Provider
Figure 6.3 Total Health Expenditure Per Capita in Ireland in Real Terms
Table 6.7 Total Current Health Care Expenditure Per Capita (US$PPPS) And as % of GDP for Selected OECD Countries
Figure 6.4 Health Expenditure as a Share of GDP for Selected OECD Countries and GNI* for Ireland
Figure 6.5 Health Expenditure by Type of Care as a % of Total Health Expenditure, EU15
Chapter 7Figure 7.1 Population breakdown by RHAFigure 7.2 Percentage of Population Aged over-
65 by RHAFigure 7.3a Population Distribution by Age Group
for Area A
Figure 7.3b Population Distribution by Age Group for Area B
Figure 7.3c Population Distribution by Age Group for Area C
Figure 7.3d Population Distribution by Age Group for Area D
Figure 7.3e Population Distribution by Age Group for Area E
Figure 7.3f Population Distribution by Age Group for Area F
Figure 7.4 Percentage of Population with a Disability by RHA
Figure 7.5 Percentage of Population with a Medical Card by RHA
Figure 7.6 Percentage of Population considered very/extremely disadvantaged by RHA
Figure 7.7a Age-Standardised Mortality Rate from Circulatory Diseases by RHA
Figure 7.7b Age-Standardised Mortality Rate from Respiratory Diseases by RHA
Figure 7.7c Age-Standardised Mortality Rate from Cancers by RHA

1. Population and Life ExpectancyThe demographic data presented in this section shows rapidly changing population structures, both in Ireland and the European Union. Understanding the trends in fertility, demographics and mortality is vital for the planning and delivery of health care services now and into the future.
Based off the results of the 2016 Census, population estimates and projections have been updated in this year’s publication with the latest information. The population in 2019 has grown by an estimated 3.8% since the 2016 Census. Since 2010, the population has increased by 8.1% to a figure of 4.92 million. The population is growing across all regions and age groups, with the most significant growth seen in the older age groups (Table 1.2). The population aged 65 and over has increased by 35.2% since 2009, which is considerably higher than the EU average increase of 16.5%.
The latest population projections released by the Central Statistics Office indicate that this population growth is set to continue for at least the next two decades. Assuming moderate changes in migration and fertility rates, the total population is projected to reach 5.68 million by 2039. The total fertility rate has continued to decrease and is now at its lowest in the last decade, however
Ireland still has the third highest fertility rate in the EU behind France and Sweden (Figure 1.4). Since 2009 there has been a gradual decrease in the number of live births (Table 1.3). This is due in part to the reduction in fertility rates but, more significantly, to the fact that the number of women in the main child-bearing age groups has declined in recent years. This is a demographic feature which is likely to result in a steady reduction in the number of births over the coming decade even if, as expected, Ireland continues to experience fertility rates which are higher than most other EU countries.
Population ageing clearly has major implications for the planning and provision of health services; it is also a measure of improvement in health and life expectancy. Life expectancy is continuing to increase, currently standing at 84 years for women and 80.4 years for men (Table 1.6). Life expectancy for women is higher than for men, as in most countries (Figure 1.6). However, this gap has narrowed in the past decade, and male life expectancy in 2017 was 3.6 years below female life expectancy compared to 5.3 years in 1997 (Table 1.6). The greatest gains in life expectancy have been achieved in the older age groups reflecting decreasing mortality rates from major diseases (Section 2). In addition to living longer,
women in Ireland typically experience a slightly higher number of healthy life years than men, however men at 65 experience a slightly higher proportion of their life expectancy in good health. The proportion of life expectancy at age 65 to be lived in good health is higher for both men and women in Ireland compared with the EU average (Figure 1.8).
Overall, there are more people in Ireland and we are living longer lives than before. These trends are set to continue into the coming decades.
5
Chapter 1Population and Life Expectancy

6
Chapter 1Population and Life Expectancy
Table 1.1Population Estimates (‘000s) for Regional Authority Areas by Age Group, 2019
Border Midland West Dublin Mid-East Mid-West South-East South-West Ireland
Male 202.5 153.0 230.2 683.3 359.8 242.3 216.6 350.3 2,438.0
Female 204.2 151.9 233.5 712.4 363.7 242.7 219.3 355.9 2,483.5
Total 406.7 304.9 463.7 1,395.7 723.5 485.0 435.9 706.2 4,921.5
Age Groups:0-14 86.5 69.2 94.0 263.2 163.9 98.2 91.1 143.0 1,008.9
15-24 51.0 38.9 57.2 175.2 92.6 60.9 54.9 87.4 618.0
25-34 43.7 34.9 52.2 223.7 81.3 53.6 48.1 83.0 620.0
35-44 58.2 46.8 69.2 240.3 117.0 71.3 64.5 109.2 776.9
45-54 54.9 41.0 62.7 176.3 103.5 66.7 60.2 96.2 661.6
55-64 47.4 33.5 54.6 139.2 76.4 57.1 50.7 80.8 539.7
65-74 37.5 24.4 42.3 100.4 53.8 45.0 38.5 62.2 404.1
75-84 19.8 12.2 22.6 56.5 26.2 23.8 20.8 32.9 214.9
85+ 7.4 3.9 9.0 21.0 8.8 8.5 7.0 11.6 77.3
2016 393.3 293.4 447.5 1,335.9 690.9 472.5 421.2 685.0 4,739.6
% change 2016-2019 3.4 3.9 3.6 4.5 4.7 2.6 3.5 3.1 3.8
Source: Central Statistics Office.Notes: (i) Data for 2019 are preliminary. (ii) Age groups may not sum to total due to rounding. (iii) The composition of the NUTS regions changed in 2016 and took effect for the population
estimates from 2018. The main changes at NUTS 3 level are the transfer of South Tipperary from the South-East into the Mid-West NUTS 3 region and the movement of Louth from the Border to the Mid-East NUTS 3 Region.
The regions refer to the EU NUTS 3 areas: Border: Cavan, Donegal, Leitrim, Monaghan, Sligo. Midland: Laois, Longford, Offaly, Westmeath. West: Galway, Mayo, Roscommon. Dublin: County Dublin. Mid-East: Kildare, Meath, Wicklow, Louth. Mid-West: Clare, Limerick, Tipperary. South-East: Carlow, Kilkenny, Waterford, Wexford. South-West: Cork, Kerry.

7
Chapter 1Population and Life Expectancy
Table 1.2Population of Ireland (‘000s) by Age Group, 2010 to 2019
% change
Age Group 2010 2011 2012 2013 2014 2015 2016 2017 2018 2019 2010- 2019
2018- 2019
0-14 957.7 976.6 988.0 993.9 997.6 1,001.6 1,005.5 1,007.0 1,008.7 1,008.9 5.3% 0.0%
15-64 3,081.9 3,066.6 3,055.7 3,051.5 3,058.5 3,075.9 3,104.3 3,135.6 3,175.0 3,216.2 4.4% 1.3%
65 and over 515.0 531.6 549.9 569.2 589.5 610.3 629.8 649.9 673.4 696.3 35.2% 3.4%
All Ages 4,554.8 4,574.9 4,593.7 4,614.7 4,645.4 4,687.8 4,739.6 4,792.5 4,857.1 4,921.5 8.1% 1.3%
Source: Central Statistics Office.
Notes: (i) Data for 2017, 2018 and 2019 is preliminary. (ii) Age groups may not sum to total due to rounding.

8
Chapter 1Population and Life Expectancy
Figure 1.1a Figure 1.1bOld Age Dependency Ratio, by Electoral Divisions, 2016
Percentage of Carers in Population, by Electoral Divisions, 2016.
Source: Central Statistics Office.
Note: The old age dependency ratio is the population over 65 as a percentage of those aged 15-64.
Old Age Dependency RatioPercentage of Carers

9
Chapter 1Population and Life Expectancy
Figure 1.2Cumulative Percentage Increase in Population, All Ages and 65+ for Ireland and EU-28, 2009 to 2018
Source: Eurostat.
Notes:
(i) Data for 2017 & 2018 are provisional
40%
35%
30%
25%
20%
15%
10%
5%
0%
2009 2010 2011 2012 2013 2014 2015 2016 2017 2018
EU 28 - Total Population EU 28 - aged 65 years and over Ireland - Total Population Ireland - aged 65 years and over
Cum
ulati
ve %
Incr
ease
in P
opul
ation

10
Chapter 1Population and Life Expectancy
Table 1.3Live Births, Birth Rate and Total Fertility Rate, Ireland and EU-28, 2009-2018
Source: Central Statistics Office, Eurostat.
Notes: (i) Total Fertility Rate (TFR) is a measure of the average number of children a woman could expect to have if the fertility rates for a given year pertained throughout her fertile years. (ii) % change for EU28 total fertility rate relates to 2009-2017 and 2016-2017. (iii) There is a break in TFR data for EU28 between 2010-2012 and 2014-2015. (iv) Data for 2018 is provisional.
% Change
2009 2010 2011 2012 2013 2014 2015 2016 2017 2018 2009-2018
2017-2018
Number of live births 75,554 75,174 74,033 71,674 68,954 67,295 65,536 63,841 62,053 61,016 -19.2 -4.4
Birth rate (per 1,000 population) 16.7 16.5 16.2 15.6 15.0 14.6 14.0 13.5 12.9 12.6 -24.6 -6.7
Total fertility rate Ireland 2.06 2.06 2.02 1.98 1.93 1.9 1.86 1.81 1.8 1.75 -15.0 -3.3
EU28 1.61 1.62 1.59 1.59 1.55 1.58 1.57 1.6 1.59 n/a -1.2 -0.6

11
Chapter 1Population and Life Expectancy
Figure 1.3Total Fertility Rate by County, Ireland, 2018
Source: Central Statistics Office
1.57 - 1.77
1.77 - 1.88
1.88 - 1.92
1.92 - 2.14

12
Chapter 1Population and Life Expectancy
Figure 1.4Total Fertility Rates in Europe, 2017
Source: Eurostat.
FranceSwedenIreland
DenmarkUnited Kingdom
RomaniaLatvia
CzechiaBelgium
LithuaniaNetherlands
SloveniaEU-28
EstoniaGermanyBulgariaHungary
AustriaSlovakiaFinlandPolandCroatia
LuxembourgPortugal
GreeceCyprus
ItalySpainMalta
0.0 0.5 1.0 1.5 2.0Fertility Rate

13
Chapter 1Population and Life Expectancy
Table 1.4Population 2019 and Projected Population to 2039 (‘000s) by Age Group, Ireland.
Source: Central Statistics Office.
Notes: (i) Projections are based on the Central Statistics Office’s M2F2 assumption of moderate growth in migration and a decrease in the total fertility rate to 1.6 by 2031, remaining constant thereafter. (ii) The projections should not be considered as forecasts. (iii) Projections were produced using data for 1 January 2016 as a starting point. (iv) (e.): The current CSO population estimate was used for 2019 figures.
% Change
Age Group 2019(e.) 2024 2029 2034 2039 2019-2039
0-14 1008.9 970.8 895.3 857.7 858.8 -15.0
15-64 3216.2 3338.0 3480.8 3566.0 3592.5 10.9
65-84 619.0 722.2 827.5 919.4 1026.2 48.5
85 and over 77.3 93.7 118.0 158.1 198.3 104.5
Total 4,921 5,125 5,322 5,501 5,676 11.8
Table 1.5Dependency Ratio Ireland, 2019 and Projected to 2039
% change
Age Group 2019 (e.) 2024 2029 2034 2039 2019-2039
0-14 31.8 29.1 25.7 24.1 23.9 -24.2
65 and over 21.6 24.4 27.2 30.2 34.1 39.8
All ages 53.0 53.7 52.8 53.9 57.1 1.7
Source: Central Statistics Office.
Notes: (i) See notes under Table 1.4 (ii) Dependency Ratio refers to the number of persons aged 0-14 years and 65 years and over as a percentage of those aged 15-64 years. (iii) (e.): The current CSO population estimate was used for 2019 figures.

14
Chapter 1Population and Life Expectancy
Figure 1.5Older Age Groups: Population 2019 and Projected Population 2024-2039
Source: Central Statistics Office.
Notes: (i) See notes under Table 1.4(ii) (e.): The current CSO population estimate was used for 2018 figures.
30%
25%
20%
15%
10%
5%
0%
85+
75-85
65-74
2019(e.) 2024 2029 2034 2039
Perc
enta
ge o
f Tot
al P
opul
ation

15
Chapter 1Population and Life Expectancy
Table 1.6Life Expectancy, Ireland, by Age and Gender, 1997, 2007 and 2017
% Change
Life expectancy at age 1997 2007 2017 1997-2017
Male 0 73.4 77.3 80.4 9.5
1 72.8 76.6 79.6 9.3
40 35.4 38.9 41.5 17.2
65 14.0 17.0 19.0 35.7
75 8.2 10.1 11.5 40.2
Female 0 78.7 82.1 84.0 6.7
1 78.2 81.3 83.2 6.4
40 40.0 42.9 44.7 11.8
65 17.6 20.1 21.4 21.6
75 10.5 12.4 13.3 26.7
Source: Eurostat.
Notes: (i) Data for 2017 are provisional.

16
Chapter 1Population and Life Expectancy
Figure 1.6Life Expectancy at Birth by Gender, Ireland and EU-28, 2008 to 2017
84
83
82
81
80
79
78
77
76
75
74
Life
Exp
ecta
ncy
in Y
ears
Source: Eurostat.
Notes: (i) Data for 2016 and 2017 are provisional. (ii) There is a break in data for EU-28 for 2010-2012.
EU 28 - Males
EU 28 - Females
Ireland Males
Ireland Females
2008 2009 2010 2011 2012 2013 2014 2015 2016 2017

17
Chapter 1Population and Life Expectancy
Figure 1.7Life Expectancy at Birth for EU-28 Countries, 2017
SpainItaly
FranceSweden
MaltaCyprusIreland
LuxembourgNetherlands
AustriaFinland
BelgiumPortugal
GreeceUnited Kingdom
SloveniaGermanyDenmark
EU-28Czech Republic
EstoniaCroatiaPoland
SlovakiaHungary
LithuaniaRomania
LatviaBulgaria
70 72 74 76 78 80 82 84
Life Expectancy in Years Source: Eurostat.

18
Chapter 1Population and Life Expectancy
Source: Eurostat.
Figure 1.8Healthy Life Years and Life Expectancy at Age 65 by Gender, Ireland and EU-28, 2017
22
20
18
16
14
12
10
8
6
4
2
0EU-28 EU-28Ireland
Female Male
Ireland
Year
s
Life Expectancy
Healthy Life Years

2. Health of the Population Population health at the national level presents a picture of decreasing mortality rates and high self-perceived health over the past ten years. Figure 2.1 provides an overview of the chapter, comparing Ireland to the European average across various population health indicators. Ireland is among the top performers for treatable death, self-perceived health status and stroke mortality rates, but is below the EU average for respiratory and acute myocardial infarction (AMI) mortality rates.
Ireland has the highest self-perceived health status in the EU, with 82.9% of people rating their health as good or very good (Figure 2.3). The number of people reporting a chronic illness or health problem is also better than the EU average, at around 27.7% of the population (Table 2.2). However, as shown in Figure 2.2, health status reflects income inequality, with fewer low income earners reporting good health both in Ireland and across the EU.
Table 2.4 shows that age-standardised mortality rates have declined for all causes over the past decade by 10.5%. This decrease is particularly strong for mortality rates from suicide (-37.8%), pneumonia (-36.8%) and stroke (-35.7%). Infant mortality, measured as deaths per 1,000 live births, has also decreased by 5.2% since 2009 and remains below the EU average (Figure 2.10).
Provisional data for 2018 shows a slight increase of 2.3% in the overall mortality rate over the previous year. Figure 2.8 shows that Ireland is currently below the EU average for suicide rates for both men and women. After a rise in the male suicide rate from 2008 to 2012, the three-year moving average has decreased and in 2015 the rate fell below the EU average for the first time since 2010. However, improvements in mortality rates and high levels of self-rated health can mask variations between regions, age groups and other population subgroups. The variation in external injury and poisoning across counties can be seen in Figure 2.6, and the differing primary causes of deaths among over 65s and under 65s is shown in Figures 2.5a and 2.5b.
A death is considered treatable, or amenable, if it could have been avoided with optimal quality healthcare. For example, if a person under 50 years of age suffers from diabetes, then timely health care is very likely to successfully prevent this individual dying because of their diabetes. A death from diabetes among this group is therefore considered treatable. Figure 2.9 shows that Ireland performs better than the European average for treatable deaths.
Figure 2.11 demonstrates the levels of risky health behaviour among children, with a constant
downward trend among all behaviours. Cigarette consumption has decreased since 2000, as shown in Figure 2.12. Alcohol consumption has also decreased over the same period, but not as dramatically. In 2018, Irish people consumed 11 litres of alcohol per capita, based on Revenue figures.
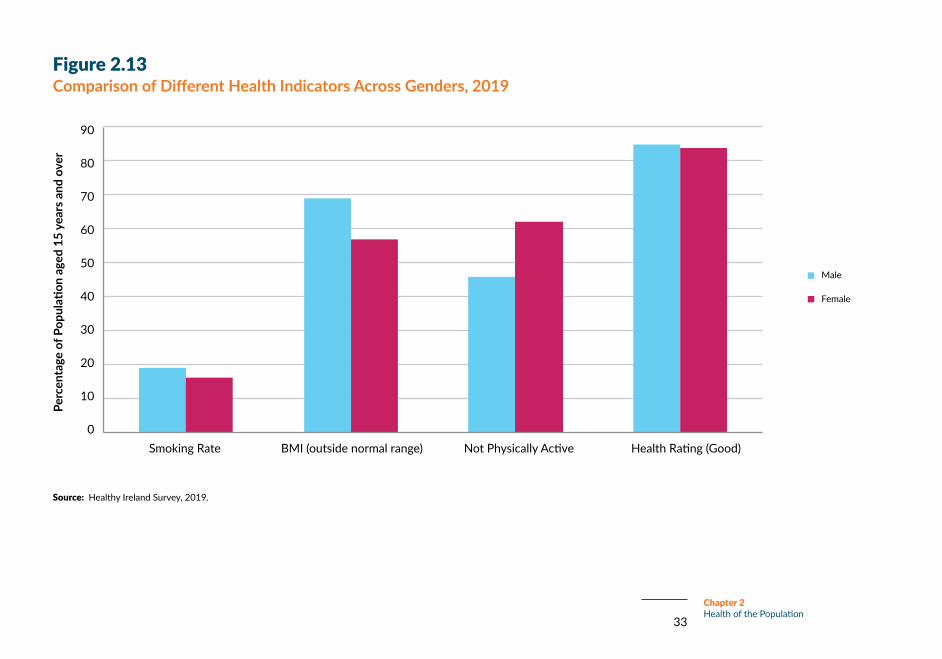
Chapter 2 concludes with data from the latest Healthy Ireland survey. Figure 2.13 examines differences between genders across a number of health indicators. Figure 2.14 compares the incidence of chronic illnesses between smokers and non-smokers.
19
Chapter 2Health of the Population

20
Chapter 2Health of the Population
Figure 2.1Summary of Population Health, Ireland and EU28 Average, 2016
Source: Eurostat
Notes:(i) Standard deviation is a measure of how much a value varies from the mean average. (ii) Values have been adjusted so that the upper half of the graph is more desirable. For example, Ireland’s stroke mortality rate is lower than the EU average, but as this is the more desirable outcome
Ireland is positioned higher up on the graph. (iii) For details on the measurement of these indicators, see the following graphs: Table 2.4 and Figure 2.9.
2.5
2
1.5
1
0.5
0
-0.5
-1
-1.5
-2
-2.5
Cancers Acute myocardial infarction
Stroke Diseases of the
respiratory system
Suicide Infant Mortality
Rate
Self-Perceived Health Status
Life Expectancy at
Birth
Treatable Deaths
Stan
dard
Dev
iatio
ns
Best
out
com
e
Majority ofEU countries (between 25th and 75th percentiles)
EU28 Average
Ireland

21
Chapter 2Health of the Population
Table 2.1Self-Perceived Health Status, Ireland and EU-28, 2017
Very Good Good Fair, Bad, Very Bad
Age Group % Male % Female % Male % Female % Male % Female
16-24 73.5 70.3 23.2 24.4 3.4 5.325-34 55.8 53.8 34 39.2 10.2 735-44 48.9 51.1 39.4 38.7 11.7 10.245-64 35.1 38.6 44.6 40.1 20.4 21.365+ 20.7 22 43.8 47.3 35.5 30.7Ireland 44.5 44.8 38.4 38.1 17.1 16.4EU-28 24.8 21.2 47.8 46.1 27.7 32.8
Source: EU-SILC, Eurostat.
Table 2.2People with a Long-Standing Illness or Health Problem, Ireland and EU-28, 2017
Source: EU-SILC, Eurostat.
Age GroupYes No
% Male % Female % Male % Female
16-24 13.8 12.4 86.2 87.625-34 16.2 15.6 83.8 84.435-44 18.3 17.1 81.7 82.945-64 33.8 32.2 66.2 67.865+ 50.8 50.3 49.2 49.7Ireland 28.1 27.3 71.9 72.7EU-28 35.0 38.9 65.0 61.1
Table 2.3Self-Perceived Long-Standing Limitations in Usual Activities Due to Health Problems, Ireland and EU-28, 2017
Source: EU-SILC, Eurostat.
Age GroupSome Severe
% Male % Female % Male % Female
16-44 6.0 5.8 2.5 2.0
45-64 13.5 15.0 6.4 7.3
65-74 16.2 15.1 9.4 9.5
75+ 24.6 29.0 16.1 16.6
Ireland 10.9 11.7 5.5 5.8
EU-28 15.4 18.8 6.8 8.1

22
Chapter 2Health of the Population
Figure 2.2Self-Perceived Health Rated Good or Very Good by Income Quintile, Ireland and EU-28, 2017
Source: Eurostat.
Note:(i) Income quintiles are calculated on the basis of the total equivalised disposable income attributed to each member of the household.
100
90
80
70
60
50
40
30
20
10
0
low income earners high income earners
% o
f Pop
ulati
on
Income Quintile
EU-28
Ireland

23
Chapter 2Health of the Population
Figure 2.3Percentage of the Population Reporting Good or Very Good Health in EU-28 countries, 2017
Source: EU-SILC, Eurostat.
0 10 20 30 40 50 60 70 80 90
Percentage
IrelandCyprus
ItalySweden
NetherlandsMalta
United KingdomBelgium
SpainGreece
DenmarkLuxembourg
RomaniaAustriaFinlandEU-28France
SlovakiaBulgaria
GermanySlovenia
Czech RepublicCroatia
HungaryPolandEstonia
PortugalLatvia
Lithuania

24
Chapter 2Health of the Population
Table 2.4Principal causes of death and infant mortality rate: numbers and age-standardised death rates per 100,000 population, 2009-2018
Source: Central Statistics Office, Public Health Information System (PHIS) - Department of Health.
Notes: (i) (p) The figures for 2018
are provisional. They should be treated with caution as they refer to deaths registered in these years and may be incomplete.
(ii) The rates provided in the table are age-standardised to the European standard population and are presented as rates per 100,000 population except for infant mortality rates which are expressed as deaths per 1,000 live births.
(iii) *Excludes cancer of the trachea, bronchus and lung.
% change2009 2013 2017 2018(p) 2009-2018 2017-2018
All Causes Number 28,380 29,504 30,418 31,116 9.6 2.3Rate 1092.4 1043.9 955.5 977.9 -10.5 2.3
Diseases of the circulatory systemAll Circulatory System Diseases: Number 9,507 9,473 8,889 8,938 -6.0 0.6
Rate 391.6 354.8 291.4 293.1 -25.1 0.6Ischaemic Heart Disease: Number 5,016 4,642 4,160 4,140 -17.5 -0.5
Rate 204.0 171.6 133.8 133.3 -34.7 -0.4Stroke: Number 2,054 1,959 1,706 1,680 -18.2 -1.5
Rate 86.5 75.0 56.6 55.6 -35.7 -1.6CancerAll Malignant Neoplasms: Number 8,336 8,725 9,141 9,198 10.3 0.6
Rate 302.7 288.8 270.4 272.6 -10.0 0.8Cancer of the Trachea, Bronchus and Lung: Number 1,728 1,831 1,911 1,812 4.9 -5.2
Rate 62.3 60.1 56.2 53.2 -14.7 -5.4Cancer of the Female Breast: Number 662 704 724 773 16.8 6.8
Rate 41.6 40.6 37.8 40.4 -2.9 7.1Diseases of the Respiratory system*All Respiratory System Diseases: Number 3,606 3,504 4,059 4,165 15.5 2.6
Rate 154.4 135.6 135.7 138.1 -10.5 1.8Chronic Lower Respiratory Disease Number 1,516 1,657 1,611 1,743 15.0 8.2
Rate 62.0 61.6 52.2 56.1 -9.5 7.6Pneumonia Number 1,320 983 1,088 1,084 -17.9 -0.4
Rate 59.8 40.5 38.4 37.8 -36.8 -1.5External causes of injury and poisoningAll Deaths from External Causes: Number 1,726 1,491 1,299 1,341 -22.3 3.2
Rate 44.4 38.1 32.5 33.9 -23.6 4.3Transport Accidents: Number 225 167 127 106 -52.9 -16.5
Rate 4.9 3.9 3.0 2.5 -49.7 -18.8Suicide: Number 552 487 383 352 -36.2 -8.1
Rate 12.2 11.1 8.3 7.6 -37.8 -8.5Infant deathsInfant Mortality Rate (per 1,000 live births) Number 247 245 174 187 -24.3 7.5
Rate 3.3 3.6 3.0 3.1 -5.2 3.3
Respiratory Disease
s - 14.6
%

25
Chapter 2Health of the Population
Figure 2.5a Figure 2.5bDeaths by Principal causes, percentage distribution, 2018, ages 0-64
Deaths by Principal Causes, Percentage Distribution, 2018, Ages 65 and Over
Source: Public Health Information System (PHIS) - Department of Health
Source: Public Health Information System (PHIS) - Department of Health
Ischaemic Heart Disease
Stroke
Other circulatory diseases
Non-respiratory cancers
Cancer of the Trachea, Bronchus and Lung
Chronic Lower Respiratory Disease
Pneumonia
Other respiratory diseases
External Causes of Injury and Poisoning
All other causes
Diseases of the circulatory system - 19.1%
Diseases of the circulatory system - 30.8%
Respiratory Disease
s - 14.6
%
Respiratory Disease
s - 21
.2%
18%
15.7%
3.8%
1.0%2.0% 7.8%
32.5%
6.0%
2.8%
10.3%
24.7%
14%
5.9%
10.9%
21.6%
5.7%
6.6%
4.0%
4.8%
1.9%

26
Chapter 2Health of the Population
Figure 2.65-year Age Standardised Mortality Rate from External Injury or Poisoning
25.15 - 26.29
26.29 - 33.62
33.62 - 37.98
37.98 - 43.44
43.44 - 49.07
Source: Public Health Information System (PHIS) - Department of Health
5-year age standardised mortality rate per 100,00 population

27
Chapter 2Health of the Population
Table 2.5Age-Standardised Death Rates per 100,000 Population by Principal Causes of Death, Ireland and EU-28, 2016
Source: Public Health Information System (PHIS) - Department of Health, Eurostat.
Cause Ireland EU-28 % difference Ireland-EU
All causes 983.0 1002.3 -1.9
Circulatory system diseases 309.0 358.3 -13.8
Non-respiratory cancers 220.1 205.9 6.9
Respiratory system diseases (incl. cancer of trachea, bronchus and lung)
191.1 136.3 40.2
External causes of injury and poisoning 33.0 46.2 -28.7
Figure 2.7Age-standardised death rates for selected causes, Ireland, 2001 to 2018
Source: Public Health Information System (PHIS) -
Department of Health.
Notes:(i) See notes under Table 2.4.(ii) b - break in series. Due to a change in classification
system used to determine underlying cause of death from ICD9 to ICD10 in 2007, caution should be used in comparing rates over time.
In particular, the rate for respiratory diseases shows a decrease in 2007 which is largely due to this change.
(iii) Circulatory system diseases includes Ischaemic heart disease.
700
600
500
400
300
200
100
0
Rate
(per
100
,000
pop
ulati
on)
Cancer (excl. trachea, bronchus, lung)
Circulatory System Diseases
Ischaemic Heart Disease
Respiratory System Diseases (incl. cancer of trachea, bronchus, lung)
2001
2002
2003
2004
2005
20
06
2007
(b)
2008
2009
2010
2011
2012
2013
2014
2015
2016
2017
2018

28
Chapter 2Health of the Population
Figure 2.8Age-Standardised Death Rate for Suicide by Gender, 3-year moving average, Ireland and EU28, 2008 to 2016
25
20
15
10
5
0
Rate
(per
100
,000
pop
ulati
on)
2008 2009 2010 2011 2012 2013 2014 2015 2016
Ireland Male
Ireland Female
EU28 Male
EU28 Female
Source: Public Health Information System (PHIS) - Department of Health, Eurostat.

29
Chapter 2Health of the Population
Figure 2.9Treatable Deaths by Gender, Difference from EU28 Average, 2016
350
300
250
200
150
100
50
0
Dea
th R
ate
per 1
00,0
00 P
opul
ation
Source: Eurostat
Note: (i) A death is considered treatable, or amenable, if it could have been avoided with optimal quality healthcare.
Fran
ce
Net
herla
nds
Italy
Swed
en
Luxe
mbo
urg
Belg
ium
Spai
n
Den
mar
k
Cypr
us
Irela
nd
Mal
ta
Aust
ria
Finl
and
Slov
enia
Uni
ted
King
dom
Ger
man
y
Port
ugal
Gre
ece
Pola
nd
Czec
hia
Croa
tia
Esto
nia
Slov
akia
Hun
gary
Bulg
aria
Rom
ania
Latv
ia
Lith
uani
a
Females
Males
Male Average
Female Average

30
Chapter 2Health of the Population
Figure 2.10Infant Mortality Rates, Ireland and EU-28, 2008 to 2017
4.5
4.0
3.5
3.0
2.5
2.0
1.5
1.0
0.5
0.0
Rate
(per
1,0
00 li
ve b
irths
)
EU-28
Ireland
Source: Eurostat, Public Health Information System (PHIS).
2008 2009 2010 2011 2012 2013 2014 2015 2016 2017

31
Chapter 2Health of the Population
Smoking Monthly or More Frequently
Ever Used Alcohol Cannabis Use in the last year
Figure 2.11Percentage of Children, Aged 11-17 engaged in Risky Health Behaviours, Ireland, 2010, 2014 and 2018
60
50
40
30
20
10
0
% o
f You
ng P
eopl
e
2010
2014
2018
Source: Health Behaviour in School-aged Children (HBSC), World Health Organization.

32
Chapter 2Health of the Population
Figure 2.12Alcohol and Cigarette Consumption per Annum, per Capita Aged 15 years and over, 1998 to 2018
16
14
12
10
8
6
4
2
0
2500
2000
1500
1000
500
0
Litr
es o
f alc
ohol
per
yea
r per
cap
ita a
ged
15 a
nd o
ver
No.
of c
igar
ettes
per
yea
r per
cap
ita a
ged
15 a
nd o
ver
1998
1999
2000
2001
2002
2003
2004
2005
2006
2007
2008
2009
2010
2011
2012
2013
2014
2015
2016
2017
2018
Alcohol Cigarettes
Source: Revenue Commissioners, CSO (population data).
Notes: (i) Alcohol is measured in terms of pure alcohol consumed, based on sales of beer, cider, wine and spirits. Tobacco is measured in terms of sales of cigarettes recorded by the Revenue Commissioners.(ii) Cigarette consumption excludes ‘roll your own’ cigarettes and other tobacco products.(iii) The Cigarette clearances in 2017 were higher than normal due to the stockpiling of cigarettes with branded packs before the cut-off date for the introduction of plain packaging for cigarettes. The higher
clearances in 2017 resulted in reduced clearances in 2018.
33
Chapter 2Health of the Population
90
80
70
60
50
40
30
20
10
0
Perc
enta
ge o
f Pop
ulati
on a
ged
15 y
ears
and
ove
r
Smoking Rate BMI (outside normal range) Not Physically Active Health Rating (Good)
Source: Healthy Ireland Survey, 2019.
Male
Female
Figure 2.13Comparison of Different Health Indicators Across Genders, 2019

34
Chapter 2Health of the Population
Figure 2.14Incidence of chronic conditions among smokers and non-smokers, 2019
Source: Healthy Ireland, 2019
Notes: (i) Smokers refers to both current smokers and ex-smokers
18%
16%
14%
12%
10%
8%
6%
4%
2%
0%
High blood pressure or hypertension
High cholesterol Arthritis (including osteoarthritis or
rheumatism)
Asthma Any emotional nervous or psychiatric problems such as depression or
anxiety
Smokers Non-Smokers
Perc
enta
ge o
f Pop
ulati
on a
ged
15 a
nd o
ver

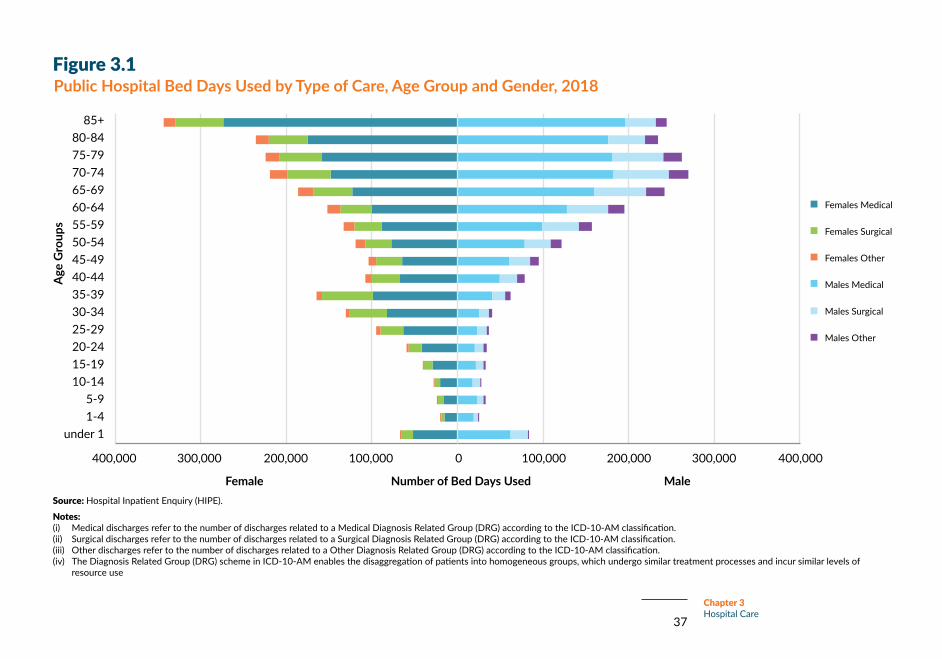
3. Hospital CareThis section presents statistics on publicly-funded acute hospitals, psychiatric hospital sectors and private acute hospitals (Tables 3.1a and 3.1b). Within the public acute sector, there is a range of specialist and general hospitals. The data presented in this section largely relates to the type and amount of activity taking place across this sector.
Figure 3.1 shows medical, surgical and other hospital attendance in terms of bed days used in 2018. By far, the majority of bed days are used by those aged 65 and over. There is also a significant gender difference among the older age groups, owing to greater female life expectancy. The rises in discharge numbers across in-patients and day cases show an overall increase in hospital activity in recent years.
62.6% of hospital discharges are now for day case treatment, an increase of 7.1% since 2009 (Table 3.1a). In 2018, in-patients on average spent 5.8 days in hospital, an overall decrease of -2.7% since 2009 (Table 3.1a), though this has increased slightly in recent years.
As of November 2019, there were 12,710 adults waiting 9 months or more for an elective procedure (Figure 3.3). This is a decrease of 13.8% on November last year. For children, we can also see a slight downward trend and in November
2019, there were 1,785 children waiting 6 months or more for elective procedures. The total number of people waiting for outpatient appointments has risen steadily over the last year, and the number of those waiting 52 weeks or more has risen 16% since November 2018 (Figure 3.4).
The number of people waiting on trolleys in emergency departments is illustrated in Figure 3.5. After a large spike in the first few months of this year (on a similar vein to other years), the 30-day moving average has diverged upwards and is now significantly higher than previous years. The number of emergency discharges in public hospitals over time and across age-groups are shown in Figure 3.6, and show an increase every year.
Figure 3.7 shows the time experienced by 50%, 75% and 95% of people who attend Emergency Departments (as measured through the median, 75th percentile and 95th percentile respectively). Monthly data since 2017 shows that 50% of attendees spent less than 6 hours in the Emergency Department and 75% of attendees experience a time less than 9 hours. The figure also shows little monthly variation in both of these measures over the period of interest. However, when examining the time spent in the Emergency Department by 95% of people as measured by the
95th percentile, there is a large degree of monthly variation. Overall, this chart indicates that while the large numbers of ED attendees will experience little variation in the time experienced in the emergency department, seasonal factors have had an impact on Emergency Department experience times.
Figure 3.8 represents the percentage of emergency ambulance responses that occur within 18 minutes and 59 seconds. The national average response for life threatening cardiac or respiratory arrest (Clinical Status 1 ECHO) was 79.5% and for life threatening other than cardiac or respiratory arrest (Clinical Status 1 DELTA) was 57.4%.
Five pancreas transplants were performed in Ireland in 2017, with a total of 234 transplants undertaken (Figure 3.9). The rate of transplants per population has decreased following a gradual increase in previous years (Figure 3.10).
According to the most recent census of Irish psychiatric units and hospitals, there were 2,356 patients resident in 2018, an increase of 1.4% from 2017. Admissions to psychiatric hospitals and units have fallen by 16.2% in the period 2010-2018 (Table 3.2).
35
Chapter 3Hospital Care

36
Chapter 3Hospital Care
Table 3.1aPublic Acute Hospital Summary Statistics, 2009-2018
Source: In-patient & Day Case Activity data: Hospital In-Patient Enquiry (HIPE).
Beds, Emergency Department, Out-patient data: Health Service Executive.
Notes: (i) The data on surgical inpatients and daycases refer to the number of discharges with a surgical
Diagnosis Related Group (DRG). (ii) The above table excludes inpatient and day case activity data for a small number of hospitals
who report data to HIPE which are not HSE acute hospitals. (iii) From 2012, data on discharges includes additional activity in acute medical assessment units
(AMAUs) which would previously have been excluded. The inclusion of additional same-day discharge patients from AMAUs can result in a reduction in the average length of stay. Therefore the % change in average length of stay and number of inpatients should be viewed with caution.
(iv) Data for Emergency Department attendances refers to new and return emergency presentations at Emergency Departments.
(v) Outpatient data for 2011 was not available due to the development of a reformed set of OPD data.
(vi) From 2015 this data includes day case activity from St. Luke’s Radiation Oncology Network centres located in Beaumont and St. James’s Hospitals. These centres are operational since 2011, but data has only been included in HIPE from 2015.
% Change
2009 2010 2011 2012 2013 2014 2015 2016 2017 2018 2009-2018 2017-2018
In-Patients
Acute Beds 11,369 10,990 10,694 10,337 10,411 10,480 10,473 10,592 10,665 10,856 -4.5 1.8
In-patient Discharges 583,488 583,017 583,053 616,934 615,211 622,763 625,541 635,353 633,155 642,646 10.1 1.5
Bed Days Used 3,479,835 3,441,538 3,334,248 3,351,489 3,332,974 3,380,587 3,471,997 3,502,570 3,537,719 3,743,133 7.6 5.8
% Bed Days Used by Patients Aged 65+ 48.3 49.4 49.3 49.9 50.9 51.5 52.2 52.6 53.1 54.0 11.8 1.7
Average Length of Stay in Days 6.0 5.9 5.7 5.4 5.4 5.4 5.6 5.5 5.6 5.8 -2.7 3.8
Surgical In-Patients 140,694 139,269 134,654 135,202 134,022 134,118 134,240 132,858 133,531 133,859 -4.9 0.2
Day Cases
Beds 1,772 1,857 1,936 2,049 2,021 2,006 2,026 2,140 2,170 2,240 26.4 3.2
Day Cases 819,254 857,654 883,422 915,254 931,381 957,258 1,025,797 1,056,656 1,072,902 1,074,172 31.1 0.1
% Day Cases Aged 65+ 35.3 36.3 36.1 36.4 37.0 37.7 38.8 38.9 39.4 40.3 14.0 2.2
Surgical Day Cases 107,465 115,846 127,544 138,686 142,728 148,072 152,556 158,065 165,295 160,837 49.7 -2.7
Total Discharges
In-Patients and Day Cases 1,402,742 1,440,671 1,466,475 1,532,188 1,546,592 1,580,021 1,651,338 1,692,009 1,706,057 1,716,818 22.4 0.6
Daycases as a % of Total Discharges 58.4 59.5 60.2 59.7 60.2 60.6 62.1 62.4 62.9 62.6 7.1 -0.5
Emergency Department Attendances 1,253,178 1,232,908 1,226,820 1,278,522 1,252,385 1,218,132 1,232,255 1,296,571 1,318,368 1,323,466 5.6 0.4
Outpatient Attendances 3,419,705 3,583,290 n/a 2,355,030 3,071,995 3,206,056 3,298,868 3,327,526 3,287,693 3,335,855 -2.5 1.5
37
Chapter 3Hospital Care
Figure 3.1Public Hospital Bed Days Used by Type of Care, Age Group and Gender, 2018
Source: Hospital Inpatient Enquiry (HIPE).
Notes: (i) Medical discharges refer to the number of discharges related to a Medical Diagnosis Related Group (DRG) according to the ICD-10-AM classification.(ii) Surgical discharges refer to the number of discharges related to a Surgical Diagnosis Related Group (DRG) according to the ICD-10-AM classification.(iii) Other discharges refer to the number of discharges related to a Other Diagnosis Related Group (DRG) according to the ICD-10-AM classification.(iv) The Diagnosis Related Group (DRG) scheme in ICD-10-AM enables the disaggregation of patients into homogeneous groups, which undergo similar treatment processes and incur similar levels of
resource use
85+80-8475-7970-7465-6960-6455-5950-5445-4940-4435-3930-3425-2920-2415-1910-14
5-91-4
under 1
400,000 300,000 200,000 100,000 0 100,000 200,000 300,000 400,000
Age
Gro
ups
Number of Bed Days UsedFemale Male
Females Medical
Females Surgical
Females Other
Males Medical
Males Surgical
Males Other

38
Chapter 3Hospital Care
Table 3.1bPrivate Acute Hospital Summary Statistics, 2016-2017
Source: Survey of Private Hospitals conducted by the Department of Health, 2016 and 2017.
Notes: (i) The data presented above was collected from a data collection exercise conducted with acute
private hospitals operating in the State. Survey questions have changes between the two years and data may not be strictly comparable.
(ii) Data for beds and discharges refers to acute hospitals only.
% Change
2016 2017 2016-2017
Number of Private hospitals
Acute hospitals 18 18 -
Psychiatric hospitals 3 3 -
In-Patients
Acute Beds 1,907 1,796 -5.8
In-patient Discharges 102,312 104,077 1.7
Bed Days Used 489,372 465,876 -4.8
Average Length of Stay in Days 4.8 4.5 -5.9
Day Cases
Day Case Discharges 289,964 305,653 5.4
Total Discharges
In-Patients and Day Cases 392,276 409,730 4.4
Daycases as a % of Total Discharges 73.9% 74.6% 0.9

39
Chapter 3Hospital Care
Figure 3.2In-Patient Discharges per Bed, 2009 to 2018
Source: HSE Business Intelligence Unit
65
60
55
50
45
40
35
30
25
20
15
10
5
02009 2010 2011 2012 2013 2014 2015 2016 2017 2018
Dis
char
ges p
er B
ed

40
Chapter 3Hospital Care
Figure 3.3Numbers of Adults and Children waiting for In-Patient and Daycase Elective Procedures, November 2018-2019
16,000
14,000
12,000
10,000
8,000
6,000
4,000
2,000
0
Num
ber
Nov
embe
r
Dec
embe
r
Janu
ary
Febr
uary
Mar
ch
Apr
il
May
June July
Augu
st
Sept
embe
r
Oct
ober
Nov
embe
r 201
9
Source: National Treatment Purchase Fund.
Note: Excludes patients waiting for GI endoscopy.
Adults > 9 months
Children > 9 months

41
Chapter 3Hospital Care
Figure 3.4Number of People waiting 52 weeks or Longer for an Outpatient Appointment and Total Number of People on Outpatient Waiting List, 2018-2019
600
550
500
450
400
350
300
250
200
150
100
50
0
Peop
le o
n W
aitin
g Li
st (0
00’s)
Nov
embe
r
Dec
embe
r
Janu
ary
Febr
uary
Mar
ch
Apr
il
May
June July
Augu
st
Sept
embe
r
Oct
ober
Nov
embe
r 201
9
Source: National Treatment Purchase Fund.
Total people on outpatient waiting list
Waiting > 52 weeks

42
Chapter 3Hospital Care
Figure 3.5National 30-day moving average of admitted patients waiting on trolleys in Emergency Departments in public acute hospitals, 2015 to 2019
Source: TrolleyGar, HSE
Note: Data relates to figures collected daily at 2pm, Monday to Sunday.
350
300
250
200
150
100
50
0
2015
2016
2017
2018
2019
Janu
ary
Febr
uary
Mar
ch
Apr
il
May
June
July
Augu
st
Sept
embe
r
Oct
ober
Nov
embe
r
Dec
embe
r
30-d
ay m
ovin
g av
erag
e of
pati
ents
wai
ting
on tr
olle
ys

43
Chapter 3Hospital Care
Under 15 15-64 65-84 85+
Figure 3.6Emergency Hospital Discharges, 2012-2018
Source: Hospital Inpatient Enquiry (HIPE)
Notes:(i) Emergency admissions relate to persons who attend the emergency department and were subsequently admitted to hospital as an in-patient.
450,000
400,000
350,000
300,000
250,000
200,000
150,000
100,000
50,000
0
Emer
genc
y ho
spita
l dis
char
ges
2012 2013 2014 2015 2016 2017 2018
7.8%
28.7%
46.5%
16.7%
8.1%
29.0%
46.9%
15.0%
8.0%
30.0%
46.7%
15.1%
8.3%
30.2%
45.7%
14.9%
8.4%
31.1%
45.7%
14.3%
8.7%
31.5%
45.8%
13.1%
9.0%
32.3%
45.0%
12.9%

44
Chapter 3Hospital Care
Figure 3.7Patient experience time in Emergency departments , 2017-2019*
1600
1400
1200
1000
800
600
400
200
0
50% of ED attendances (Median)
75% of ED attendances
95% of ED attendances
6 hour
9 hour
24 hour
Janu
ary
17
Febr
uary
17
Mar
ch 1
7
Apr
il 17
May
17
June
17
July
17
Augu
st 1
7
Sept
embe
r 17
Oct
ober
17
Nov
embe
r 17
Dec
embe
r 17
Janu
ary
18
Febr
uary
18
Mar
ch 1
8
Apr
il 18
May
18
June
18
July
18
Augu
st 1
8
Sept
embe
r 18
Oct
ober
18
Nov
embe
r 18
Dec
embe
r 18
Janu
ary
19
Febr
uary
19
Mar
ch 1
9
Apr
il 19
May
19
June
19
July
19
Augu
st 1
9
Sept
embe
r 19
Oct
ober
19
Tim
e in
min
utes
Source: Patient Experience Time database
Notes:1. Time in minutes above is measured from ED registration time to
ED Departure Time.2. 50% of ED attendances refers to the median.
3. 75% of ED attendances refers to the 75th Percentile.4. 95% of ED attendances refers to the 95th Percentile.5. Monthly figures for 2019 are up to October 2019.

45
Chapter 3Hospital Care
Kidney Lung Heart Liver Pancreas
Figure 3.8DELTA and ECHO Ambulance Response Times, 2019
Source: HSE.
Notes:(i) Clinical Status 1 ECHO refers to a life threatening cardiac or respiratory arrest.(ii) Clinical Status 1 DELTA refers to a life threatening emergency other than cardiac or
respiratory arrest(iii) Dublin Fire Brigade is included as it has an ambulance service to support the health
service executive. (iv) Data refers to September 2019 year to date activity
Source: National Organ Donation and Transplantation Office, HSE.
1 ECHO 1 DELTA
Figure 3.9Number of Transplants in Ireland by Type, 2018
% re
spon
ded
to in
≤ 1
8 m
ins 5
9 se
cond
s
100
90
80
70
60
50
40
30
20
10
0
North Leinster
South West Dublin Fire Brigade
Ireland
167
28
16
185

46
Chapter 3Hospital Care
Figure 3.10Total Transplants in Ireland per Million Population, 2009 to 2018
Source: National Organ Donation and Transplantation Office, HSE.
70
60
50
40
30
20
10
0
Num
ber o
f tra
nspl
ants
per
m
illio
n po
pula
tion
2009 2010 2011 2012 2013 2014 2015 2016 2017 2018

47
Chapter 3Hospital Care
Table 3.2Psychiatric Hospitals and Units Summary Statistics, 2009 to 2018
Source: Health Research Board and Mental Health Commission.
Notes: (i) Cases with an unspecified age were excluded from the age analysis. (ii) Since 2013 there as been an annual census recorded at midnight December 31st. (iii) *This figure shows percent change 2010-2018, as 2009 data is not available.
% Change
2009 2010 2011 2012 2013 2014 2015 2016 2017 2018 2009-2018
2017-2018
Number of In-Patient Admissions 20,195 19,619 18,992 18,173 18,457 17,797 17,860 17,290 16,743 17,000 -15.8 1.5
% Male 50.1 50.2 50.5 50.2 49.4 49.6 50.7 50.0 49.8 50.1 0.1 0.7
% Female 49.9 49.8 49.5 49.8 50.6 50.4 49.3 50.0 50.2 49.9 -0.1 -0.7
Admission Rate per 100,000 Population by Age Group
<25 years 155.5 159.4 140.1 131.3 148.0 144.6 152.3 142.5 138.4 145.0 -6.8 4.8
25-44 587.7 571.1 536.4 515.8 518.7 506.7 511.8 481.1 460.6 471.0 -19.9 2.3
45-64 661.6 636.4 604.0 590.3 573.6 546.3 520.9 490.5 462.1 477.2 -27.9 3.3
65+ 551.9 499.1 509.3 464.9 476.1 450.3 444.7 424.0 426.7 417.7 -24.3 -2.1
Total 452.9 438.8 413.9 396.1 401.8 387.5 385.3 363.1 349.4 357.0 -21.2 2.2
Total of In-Patient Census - 2,812 - - 2,401 2,228 2,337 2,408 2,324 2,356 -16.2 1.4

48
Chapter 3Hospital Care
Figure 3.11Psychiatric Hospitals and Units: Admission Rate per 100,000 Population by Age Group, 2009 to 2018
700
600
500
400
300
200
100
02009 2010 2011 2012 2013 2014 2015 2016 2017 2018
<25 years
25-44
45-64
65+
Rate
per
100
,000
Pop
ulati
on
Source: Table 3.2.
15% 26% 13% 17% 14% 16%

49
Chapter 3Hospital Care
Figure 3.12Hospital Inpatient Experience Rating, 2019
Source: National Patient Experience Survey
Notes: (i) All patients aged 16 and over discharged in May 2019, who spend 24 hours or more in a public acute hospital and have a postal address
in the Republic of Ireland were asked to complete the survey.
100%
90%
80%
70%
60%
50%
40%
30%
20%
10%
0
% o
f Res
pond
ents
2017 2018 2019
Fair to Poor Good Very Good
16%
30%
54% 54% 56%
16%
30% 28%
16%

50
Chapter 3Hospital Care
Figure 3.13Patient Experience Survey, Confidence in Staff and Dignity of Patients, 2019
90%
80%
70%
60%
50%
40%
30%
20%
10%
0%2017 2018 2019 2017 2018 2019
Overall, did you feel you were treated withrespect and dignity while you
were in the hospital?
Did you have confidence and trust inthe hospital staff treating you?
% a
nsw
erin
g ‘Y
es, A
lway
s’
Source: National Patient Experience Survey
Notes: See notes under Figure 3.12
84% 84% 84% 83% 83%82%

51
Chapter 4Primary Care and Community Services
4. Primary Care and Community ServicesThis chapter provides an overview of the extensive primary care sector, including a broad range of services. General Practitioner (GP) care, immunisation rates, blood donations, drug treatment and reimbursement services such as the medical card, GP visit card, Drug Payment and Long-Term Illness (LTI) schemes are discussed here.
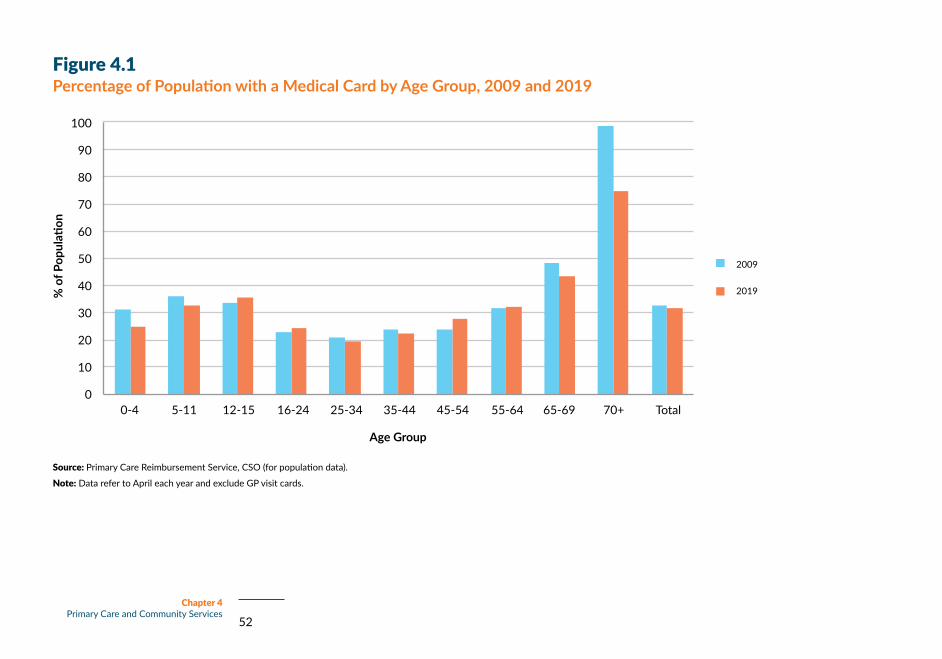
The number of medical card holders peaked in 2012 and has slowly decreased since (Table 4.1). 32.4% of the population had a medical card in December 2018, compared to 40.4% in 2012 and 32.6% in 2009. When broken down by age group (Figure 4.1), the percentage of people with a medical card has decreased among the younger age groups following a steady decrease over the previous periods. That decrease among the youngest age groups could be partly attributed to the introduction of free GP visit cards for children under 6 from 2015.
The percentage of the population participating in the Drugs Payment Scheme has decreased by 24% since 2009, while numbers for the Long-Term Illness scheme have more than doubled (Table 4.1).
The percentage of the population covered by private health insurance has risen slightly in the
past few years, from 40.6% to 43.4% (Figure 4.5). This increase can be seen across all age groups and is particularly large among those aged 80 and over (+5% since 2014).
There has been a 5.6% rise in the number of people residing in long-stay care facilities since 2015, and almost half of these residents are over the age of 85 (Table 4.2). There has been a 14.6% increase in the percentage of long-stay residents aged under 65 during this period.
Figure 4.6 shows a downward trend in blood donations since 2014. The percentage of blood donors in the population has decreased from 1.74% to 1.64% and the number of whole blood donations per year has decreased by almost 3,000 since 2014.
There has been an increase in HPV vaccine uptake in 2018 following a drop-off in the previous period. Immunisation uptake rates for most other major illnesses have remained mostly stable and above 90%, with the exception of the Pneumococcal Conjugate vaccination uptake at 88% (Table 4.3).
Table 4.4 and Figure 4.7 present data on the treatment of problem drug and alcohol use. There
were 17,093 cases treated in 2018, representing a rate of 217 people per 100,000 aged 15-64 (Table 4.4). Figure 4.7 shows that this rate peaked in 2011 at 251.7 and has been slowly decreasing since.
52
Chapter 4Primary Care and Community Services
Figure 4.1Percentage of Population with a Medical Card by Age Group, 2009 and 2019
Source: Primary Care Reimbursement Service, CSO (for population data).
Note: Data refer to April each year and exclude GP visit cards.
100
90
80
70
60
50
40
30
20
10
0
Age Group
0-4 5-11 12-15 16-24 25-34 35-44 45-54 55-64 65-69 70+ Total
% o
f Pop
ulati
on
2009
2019

53
Chapter 4Primary Care and Community Services
Table 4.1Primary Care Reimbursement Service Schemes, 2009 to 2018
% change
Scheme 2009 2010 2011 2012 2013 2014 2015 2016 2017 20182009-2018
2017-2018
Medical CardNumber 1,478,560 1,615,809 1,694,063 1,853,877 1,849,380 1,768,700 1,734,853 1,683,792 1,581,526 1,574,507 6.5 -0.4% of population 32.6 35.5 37.0 40.4 40.1 38.1 37.0 35.5 33.0 32.4 -0.6 -1.8of which 0-15 years 335,297 370,354 388,098 432,082 427,961 403,027 390,730 371,819 340,167 335,958 0.2 -1.2% of 0-15 years 33.8 36.5 37.6 41.3 40.6 38.1 36.8 34.9 31.8 33.3 -1.5 4.7GP Visit Card a
Number 98,325 117,423 125,657 131,102 125,426 159,576 431,306 470,505 486,920 503,650 412.2 3.4% of population 2.2 2.6 2.7 2.9 2.7 3.4 9.2 9.9 10.2 10.4 372.7 2.4Drugs Payments SchemeNumber 1,587,448 1,557,048 1,518,241 1,463,388 1,399,959 1,332,817 1,301,905 1,272,724 1,259,410 1,290,634 -18.7 2.5% of population 35.0 34.2 33.2 31.9 30.3 28.7 27.8 26.9 26.3 26.6 -24.0 1.2Long-term Illness SchemeNumber 127,636 134,926 142,585 150,598 158,924 196,902 225,631 245,964 263,336 281,075 120.2 6.7% of population 2.8 3.0 3.1 3.3 3.4 4.2 4.8 5.2 5.5 5.8 107.1 5.5DentalNumber of treatments 1,584,598 1,408,686 1,030,032 1,198,124 1,310,773 1,312,383 1,250,925 1,215,042 1,194,730 1,113,774 -29.7 -6.8
Number of people treated 343,067 382,404 347,773 394,399 435,292 436,433 420,459 416,662 413,133 389,791 13.6 -5.6OphthalmicNumber of treatments 564,606 637,850 675,841 730,629 758,275 756,305 756,036 767,280 770,741 691,965 22.6 -10.2Number of people treated 238,844 269,076 279,505 307,522 317,218 317,731 315,040 318,021 318,570 287,305 20.3 -9.8
Source: General Medical Services (Payments) Board / Primary Care Reimbursement Service, HSE.
Notes: (i) Data as at 31st December each year.

54
Chapter 4Primary Care and Community Services
Figure 4.2Prescription items dispensed under the General Medical Services (GMS) scheme: % change from previous year in number of items dispensed and average cost per item paid to pharmacies, 2009 to 2018
Source: General Medical Services (Payments) Board / Primary Care Reimbursement Service, HSE.
Notes: (i) Data on cost per item includes dispensing fee, ingredient cost and VAT.(ii) Number of prescription items excludes Stock Order Items.
10
8
6
4
2
0
-2
-4
-6
-8
-10
2009 2010 2011 2012 2013 2014 2015 2016 2017 2018
Change in previous year in Number of items dispensed
Change in previous year in Average cost per item
Perc
enta
ge c
hang
e

55
Chapter 4Primary Care and Community Services
Figure 4.3Average no. of GP visits in the last 12 months by age group and gender, 2019
Source: Healthy Ireland Survey, 2019
10.0
9.0
8.0
7.0
6.0
5.0
4.0
3.0
2.0
1.0
0.0
Male Female
15-24 25-34 35-44 45-54 55-64 65-74 75+ Overall

56
Chapter 4Primary Care and Community Services
Num
ber o
f Out
of H
ours
con
tact
s
Num
ber o
f GP’
s Par
ticip
ating
in O
OH
sche
me
Figure 4.4Out of Hours GP Contacts, 2013-2018
Source: Primary Care Reimbursement Service (PCRS)
(i) An ‘Out-of-Hours’ fee is payable for non routine consultations when a GMS cardholder is seen by their GP or another GP acting on his/her behalf from 5 pm in the evening to 9 am on the following morning (Monday to Friday) and all hours on Saturdays, Sundays and Bank Holidays. Special fees are payable for a range of additional services such as excisions, suturing, vaccinations, catheterization, family planning etc.
1,100,000
1,000,000
900,000
800,000
700,000
600,000
500,000
400,000
300,000
200,000
100,000
0
3,000
2,500
2,000
1,500
1,000
500
02013 2014 2015 2016 2017 2018
Out of Hours Contacts
Number of GPs Participating in Scheme

57
Chapter 4Primary Care and Community Services
Figure 4.5Percentage of Population Covered by Private Health Insurance in Ireland by age group, 2014, 2016 and 2018
Source: Health Insurance Authority.
Note: Data excludes insurance offered by insurers with restricted membership undertakings.
60
50
40
30
20
10
0
Age Group
0 to 17 18 to 29 30 to 39 40 to 49 50 to 59 60 to 69 70 to 79 80 and over All Ages
% o
f Pop
ulati
on
2014
2016
2018

58
Chapter 4Primary Care and Community Services
Table 4.2Long-Stay Care Summary Statistics, 2015 to 2018
% change
2015 2016 2017 2018 2015- 2018
2017- 2018
Number of Beds 30,106 30,396 30,674 31,340 4.1 2.2
Number of Patients Resident at 31/12 22,273 23,086 23,154 23,529 5.6 1.6
Average age of Resident 82.9 82.7 82.6 83.1 0.2 0.6
Age Distribution (as % of total)
Under 65 4.8 5.3 5.5 5.5 14.6 0.0
65-69 4.1 4.2 4.2 4.3 4.2 2.4
70-74 7.2 7.4 7.6 7.8 9.0 2.6
75-79 12.9 12.7 12.7 12.7 -1.8 0.0
80-84 20.8 20.9 20.5 20.5 -1.2 0.0
85+ 50.2 49.4 49.5 49.2 -1.9 -0.6
Source: HIQA (Number of beds), Nursing Homes Support Scheme, HSE. Notes: (i) The ‘number of beds’ refers to beds registered with HIQA in designated centres for providing residential care for older people and also includes beds used for short term care. (ii) The ‘number of patients resident’ is reported by the NHSS and is administrative data that captures all residents covered by the Nursing Home Support scheme (NHSS). Residents in long-stay units who
are not covered by the scheme are not included here. (iii) Age distribution data is based on those resident in December of the year in question.

59
Chapter 4Primary Care and Community Services
Figure 4.6Blood Donations and Percentage of Blood Donors in Population, 2014 to 2018
Source: Irish Blood Transfusion Service, CSO for population data.
150
145
140
135
130
125
120
115
110
105
100
2.0
1.9
1.8
1.7
1.6
1.5
1.4
1.3
1.2
1.1
1.0 2014 2015 2016 2017 2018
Num
ber o
f Who
le B
lood
Don
ation
s in
100
0s
% o
f Don
ors i
n Po
pula
tion
Percentage of Donors in Population
Number of whole blood donations (1,000s)

60
Chapter 4Primary Care and Community Services
Table 4.3Immunisation rates, percentage uptake, 2008 to 2017
% change
2009 2010B 2011 2012 2013 2014 2015 2016 2017 2018 2009- 2018
2017- 2018
Diphtheria 94 94 95 95 96 96 95 95 95 94 0.0 -1.1
Pertussis 94 94 95 95 96 96 95 95 95 94 0.0 -1.1
Tetanus 94 94 95 95 96 96 95 95 95 94 0.0 -1.1
Haemophilus Influenzae Type B 93 94 95 95 95 96 95 95 95 94 1.1 -1.1
Polio 94 94 95 95 96 96 95 95 95 94 0.0 -1.1
Meningococcal 93 86 84 85 87 88 88 87 88 90 -3.2 2.3
Measles, Mumps & Rubella (MMR) 90 90 92 92 93 93 93 92 92 92 2.2 0.0
Hepatitis B - 94 95 95 95 95 95 95 95 94 - -1.1
Pneumococcal Conjugate - 88 90 91 91 92 92 91 91 88 - -3.3
Human Papillomavirus - - 82 87 86 88 87 72 51 64 - 25.5
Source: Health Protection Surveillance Centre (HPSC).Notes: (i) The data for 2009 and 2010 are incomplete as data for some regions were incomplete. (ii) The data above relate to children who have reached their second birthday and have received 3 doses of each vaccine, with the exception of MMR which relates to 1 dose and HPV. (iii) Meningococcal vaccine data for Q3 and Q4 2017 was not available (iv) Human Papillomavirus figures refer to the percentage uptake among girls in second level schools and their age equivalents in special schools and home schooled who were recorded as having received
at least HPV stage 2. Figures are collected in reference to the academic year, so 2017 figures refer to those vaccinated during the 2016/2017 academic year, etc. (v) Human Papillomavirus uptake for academic years 2009/2010 and 2010/2011 was manually reported, and national uptake for the combined cohort was estimated at 82.1%

61
Chapter 4Primary Care and Community Services
Table 4.4Number of Cases in Treatment for Problem Drug and Alcohol Use and Rate per 100,000 Population Aged 15-64 years, Ireland, 2009-2018
% Change
2009 2010 2011 2012 2013 2014 2015 2016 2017 2018 2009- 2018
2017-2018
Drugs including Alcohol
All cases in treatment 15,092 16,422 16,827 16,126 16,312 17,077 16,933 16,325 15,742 17,093 13.3 8.6
New entries into treatment each year† 7,517 7,738 7,719 7,114 6,899 7,237 7,007 6,922 6,482 6,889 -8.4 6.3
Rate per 100,000 (15-64 year olds) 242.6 250.9 251.7 232.9 226.1 236.5 227.8 223.0 206.7 216.9 -10.6 4.9
Drugs excluding Alcohol
All cases in treatment 7,389 8,699 8,283 7,903 8,894 9,672 9,711 9,097 8,772 10,113 36.9 15.3
New entries into each treatment year 3,359 3,657 3,265 3,191 3,389 3,648 3,651 3,446 3,168 3,859 14.9 21.8
Rate per 100,000 (15-64 year olds)† 108.4 118.6 106.5 104.4 111.1 119.2 118.7 111.0 101.0 121.5 12.1 20.3
Source: National Drug Treatment Reporting System, Health Research Board. CSO for population data. * This data supersede all previously published data from NDTRS publications. *Ongoing data validations and corrections to the NDTRS dataset may have resulted in minor changes to previously reported figures.

62
Chapter 4Primary Care and Community Services
Figure 4.7Number of Cases in Treatment for Problem Drug and Alcohol Use and Rate per 100,000 Population ages 15-64, 2009 - 2018
Source: Table 4.6
300
250
200
150
100
50
02009 2010 2011 2012 2013 2014 2015 2016 2017 2018
Rate
per
100
,000
Pop
ulati
on
63
Chapter 5Health Service Employment
5. Health Service EmploymentThis chapter shows fluctuations and trends in Irish health service employment over the past decade. The total number of whole time equivalent (WTE) staff employed has increased by 6.2% since 2010 (Table 5.1). After dropping almost 8% between 2010 and 2014, this trend has reversed and numbers have been growing steadily since. All grade categories have increased since 2018, and total public health employment now stands at over 119,000. However, it should be noted that data for 2019 in this Table 5.1 refer to the end of September 2019, whereas figures for all other years refer to the end of December, meaning they are not strictly comparable due to seasonal fluctuations in employment such as student nurses. A comparable trend in public health service employment can be found in Figure 5.1 which uses employment figures related to September annually.
Nursing remains the single largest grade category with almost 38,000 nurses currently employed in the public health service in Ireland. Nurses account
for almost a third (31.8%) of the total public health service workforce (Figure 5.2). This proportion has remained relatively constant over the past decade, and the numbers of nurses has only seen a small percentage change between 2010 and 2019 (3.7%).
The chapter also shows a breakdown of consultant hospital doctors by speciality (Table 5.2). All specialities have seen an increase in the past ten years (apart from the ‘other’ category), and the total number of consultant hospital doctors now stands at 3,190. The largest consultant categories are medical and surgical.
The total number of consultant and non-consultant hospital doctors in Ireland is 10,018, an increase of over a third since 2010 (37.8%). The rapid rate of growth among hospital doctors since 2013 can be seen in Figure 5.3.
Despite these increases, our rate of practising doctors per 1,000 population is low compared to other OECD countries. Out of the 30 countries for which data is available, Ireland is placed 21st between Luxembourg and Belgium (Figure 5.5).

64
Chapter 5Health Service Employment
Table 5.1Public Health Service Employment (HSE & Section 38), 2010 to 2019
% change
Grade Category 2010 2011 2012 2013 2014 2015 2016 2017 2018 2019* 2010-2019
2018-2019
Medical/Dental 8,096 8,331 8,320 8,353 8,817 9,336 9,723 10,121 10,467 10,737 32.6 2.6
Nursing 36,503 35,902 34,637 34,178 34,509 35,353 35,835 36,777 37,644 37,843 3.7 0.5
Health and Social Care Professionals#
16,355 16,217 15,717 15,844 13,640 14,578 15,364 15,950 16,496 16,588 1.4 0.6
Management/Administration 17,301 15,983 15,726 15,503 15,112 16,164 16,767 17,714 18,504 18,809 8.7 1.6
General Support Staff 11,413 10,445 9,974 9,700 9,419 9,494 9,448 9,454 9,454 9,486 -16.9 0.3
Other Patient and Client Care 22,537 21,758 20,878 20,504 21,532 22,350 23,122 24,281 25,292 25,664 13.9 1.5
Total 112,206 108,637 105,251 104,082 103,030 107,275 110,258 114,297 117,857 119,126 6.2 1.1
Source: HSE Health Service Personnel Census at 31st December (except for 2019 - see note (v) below).
Notes: (i) Figures refer to wholetime equivalents (WTE). Previous figures have been revised to comply with current methodologies around Graduate Nurses and Support/Care interns. Pre-registration Student
Nurses on clinical placement are recorded at 50% actual WTE, in line with a WRC agreement. (ii) #It is not possible to make valid staffing comparisons over extended timeframes due to changes in the configuration of the health sector. In particular, it should be noted that Children & Family Services
transferred to TUSLA on 01 Jan 2014. This change had a significant impact on the Health and Social Care Professionals grouping which includes Social Work. (iii) Management/Administration includes staff who are of direct service to the public and include consultant’s secretaries, out-patient departmental personnel, medical records personnel, telephonists and
other staff who are engaged in frontline duties. (iv) Directly employed home help staff are included under General Support Staff w.e.f. 2018 and historical figures have been restated to reflect this methodology change. (v) *The 2019 data refers to September 2019 employment figures. Caution should be exercised in comparing this data to previous years which refer to December figures.

65
Chapter 5Health Service Employment
Figure 5.1 Figure 5.2Public Health Service Employment by Grade Category, 2010 to 2019 Proportion of Staff Employed in the
Public Health Service in each Grade Category, September 2019
120,000
100,000
80,000
60,000
40,000
20,000
0
Medical/Dental
Nursing
Health and Social Care Professionals#
Management/Administration
General Support Staff
Other Patient and Child Care
2010 2011 2012 2013 2014 2015 2016 2017 2018 2019
Who
letim
e Eq
uiva
lent
Medical/Dental
Nursing
Health and Social Care Professionals#
Management/Administration
General Support Staff
Other Patient and Child Care
Source: HSE Personnel Census.
Notes: 1. For comparability purposes , information in chart above relates to annual September
employment figures.2. See notes under Table 5.1.
Source: Table 5.1.
Notes: See notes under Table 5.1.
21.5%
9.0%
8.0%
15.8%
13.9%
31.8%

66
Chapter 5Health Service Employment
Figure 5.3Consultant and Non-Consultant Hospital Doctors (HSE & Section 38), 2010 to 2019
10,000
9,000
8,000
7,000
6,000
5,000
4,000
3,000
2,000
1,000
0 2010 2011 2012 2013 2014 2015 2016 2017 2018 2019*
Who
letim
e Eq
uiva
lent
Source: HSE Personnel Census.
Notes: 1. For comparability purposes , information in chart above relates to annual
September employment figures.2. See notes under Table 5.2.
Consultants
Non-Consultant Hospital Doctors
Figure 5.4Consultant Hospital Doctors Employed in the Public Health Service by Category, September 2019
Source: HSE Health Service Personnel Census.
Notes: See notes under Table 5.2.
Medicine
Surgery
Anaesthesia
Psychiatry
Radiology
Pathology
Paediatrics
Obstetrics & Gynaecology
Emergency Medicine
Other
25.7%
17.1%
12.5%
12.2%
9.1%
8.1%
6.1%
5.0%3.3%
0.8%

67
Chapter 5Health Service Employment
Table 5.2Consultant and Non-Consultant Hospital Doctors Employed in the Public Health Service, 2010 to 2019
% change
Grade Category 2010 2011 2012 2013 2014 2015 2016 2017 2018 2019* 2010-2019 2018-2019
Consultant Hospital Doctors:
Consultant Anaesthesia 348 356 353 351 348 350 373 389 394 398 14.2 1.0
Consultant Emergency Medicine 56 63 72 75 75 83 92 98 97 105 86.5 7.3
Consultant Medicine 518 543 563 601 654 675 723 756 795 820 58.2 3.2
Consultant Obstetrics & Gynaecology 118 119 125 122 124 135 140 151 157 161 36.0 2.8
Consultant Paediatrics 136 138 144 135 148 151 157 172 182 195 43.5 6.9
Consultant Pathology 182 200 203 206 207 213 230 239 249 259 42.2 3.9
Consultant Psychiatry 364 355 356 356 351 362 362 364 374 391 7.5 4.6
Consultant Radiology 227 238 239 240 244 249 268 270 286 290 27.8 1.4
Consultant Surgery 433 435 440 451 465 488 498 511 535 547 26.2 2.2
Consultant, Other 30 27 18 19 20 19 19 21 28 26 -12.0 -4.6
Sub-Total Consultant Hospital Doctors 2,412 2,474 2,514 2,555 2,635 2,724 2,862 2,971 3,096 3,190 32.3 3.1
Non-Consultant Hospital Doctors:
Interns 532 597 565 631 674 712 713 720 730 729 36.9 -0.1
Registrar 1,733 1,761 1,809 1,761 1,775 1,948 2,055 2,160 2,265 2,315 33.6 2.2
Senior House Officer 1,709 1,812 1,807 1,808 2,034 2,158 2,217 2,295 2,346 2,360 38.1 0.6
Senior Registrar 141 140 105 93 146 141 186 175 202 210 48.5 4.0
Specialist Registrar 741 768 785 792 854 933 964 1,067 1,092 1,214 63.8 11.1
Sub-Total Non-Consultant Hospital Doctors 4,857 5,079 5,070 5,086 5,483 5,894 6,135 6,417 6,635 6,828 40.6 2.9
Total 7,269 7,553 7,584 7,641 8,118 8,618 8,997 9,388 9,731 10,018 37.8 3.0
Source: HSE Health Service Personnel Census.
Notes: (i) Figures refer to wholetime equivalents (WTE), excluding staff on career break. (ii) *The 2019 data refers to September 2019 employment figures. Caution should be exercised in comparing this data to previous years
which refer to December figures. (iii) Consultant Obstetrics & Gynaecology includes Masters of Maternity Hospitals. (iv) All figures for registrars have been updated to include Registrars in General Practice. (v) Consultants, Other includes consultants in Dentistry and Intensive Care Medicine.

68
Chapter 5Health Service Employment
Figure 5.5Practising Doctors per 1,000 Population, 2017
Source: OECD.
Notes: (i) Practising doctors are defined as those who are providing care directly to patients. (ii) *Data is from 2016
AustriaNorway
LithuaniaSweden*
SwitzerlandGermany
ItalyIceland
SpainDenmark*
AustraliaNetherlands
EstoniaOECD Average
LatviaHungary
FranceIsrael
BelgiumSlovenia
New ZealandIreland
LuxembourgUnited Kingdom
United StatesCanada
JapanPolandMexico
Korea
0 1 2 3 4 5 6

69
Chapter 6Health Service Expenditure
6. Health Service ExpenditureThis section summarises data and trends in spending on health services during the past decade. It also presents a profile of current health spending for Ireland according to the System of Health Accounts methodology which was developed to allow better cross-country analysis of trends in health expenditure.
Table 6.1 shows total public expenditure on health, capital and non-capital, each year from 2010 to estimates for 2019. There was an increase in total public health expenditure of 8.4% from 2018 to 2019. Capital expenditure, which accounted for 4.0% of total expenditure in 2019, was 17.2% higher in 2019 than in 2018 (Table 6.3). Table 6.2 and Figure 6.2 provide a more detailed breakdown on non-capital expenditure by area of care.
Public capital health expenditure is shown in Table 6.3. Capital expenditure has increased by 21.8% since 2009 , and by 17.2% between 2017-2018.
The Systems of Health accounts data provided in Tables 6.4, 6.5 and 6.6 presents an opportunity for the analysis of public and private health expenditure in Ireland by financing source, health care provider and type of health care. Table 6.4 shows that the majority of health care expenditure (73.3%) was financed by Government schemes and compulsory contributory health care financing schemes in 2017. Curative and rehabilitative care accounts for the majority of health care expenditure at 55.9% (Table 6.5); while Hospitals account for over a third (37.2%) (Table 6.6).
Figure 6.3 presents the health expenditure per capita from 2008 to 2018, adjusted for inflation. Table 6.7 compares Ireland’s health expenditure with selected OECD countries. Ireland has the 14th highest spend per capita across selected OECD countries. Using modified GNI* for Ireland as a comparator with GDP from other countries (as recommended by the Economic Statistics Review Group), Ireland’s total current health expenditure as a percentage of GDP/GNI* ranks 3rd behind Switzerland and the United States. This position changes to 7th when looking at public expenditure only (Figure 6.4).
Chapter 6 concludes with a comparison of Ireland’s health expenditure by type of care as a percentage of total health expenditure with that of the EU15 countries (Figure 6.5).

70
Chapter 6Health Service Expenditure
Table 6.1Public Health Expenditure in Millions of Euro, 2010 to 2019
% change
2010 2011 2012 2013 2014 2015A 2016 A 2017 2018 2019 2010-2019
2018-2019
Total Public Non-Capital Expenditure on Health 13,818 13,181 13,218 13,084 13,276 13,879 14,581 15,316 16,304 17,525 26.8 7.5
Public Non-Capital Expenditure on Health
(excluding treatment benefits)
13,762 13,156 13,197 13,063 13,246 13,846 14,548 15,263 16,221 17,417 26.6 7.4
Total Public Capital Expenditure on Health 366 347 350 347 386 398 423 465 545 742 102.8 36.1
Total Public Expenditure 14,184 13,528 13,568 13,431 13,662 14,277 15,004 15,781 16,849 18,267 28.8 8.4
Source: Non-capital expenditure - Revised Estimates for Public Services and HSE Performance Assurance Reports.
Capital expenditure - revised estimates for Public Services and HSE Reports on Capital Programme.
Notes: (i) In 2014 funding of c. €540 million was transferred, in the context of the establishment of the Child and Family Agency, from the HSE Vote to Vote 40 (Office of the Minister for Children & Youth Affairs).
For comparison purposes, this table has been revised for the period 2010-2013 to exclude expenditure in respect of children and family services. Data from 2015 also exludes expenditure in respect of children and family services.
(ii) A: In 2015 the Vote of the HSE was disestablished and the funding transferred to Vote 38 (Office of the Minister for Health) from which Vote grants are now paid to the HSE. As a consequence, income previously accounted for as Appropriations-in-Aid in the HSE Vote is collected directly by the HSE and shown in the HSE accounts but no longer incorporated in Vote terms. For comparison purposes, the figures above for 2015 and after include these income figures - €1.075bn in 2015, €1.061bn in 2016, €1.054bn in 2017 and €1.085bn in 2018 and 2019
(iii) Total Public Non-Capital Expenditure includes Treatment Benefits (funded from the Vote of the Office of the Minister for Social Protection). (iv) Public Non-Capital Expenditure refers to the Health Vote and HSE Vote in the Revised Estimates for Public Services: excludes expenditure in respect items not considered health expenditure, such as
expenditure in relation to the State Claims Agency (v) Figures for 2019 are estimated.

71
Chapter 6Health Service Expenditure
Table 6.2HSE Non-Capital Vote Allocation in Millions of Euro, 2012-2018
Source: Revised Estimates for Public Services (2012 - 2019); HSE National Service Plans (2012 - 2017); and HSE Performance Reports (2014-2018).
Notes: (i) In 2014 funding of c. €540 million was transferred, in the context of the establishment of the Child and Family Agency, from the HSE Vote to Vote 40 (Office of the Minister for Children & Youth Affairs).
For comparison purposes, expenditure in respect of children and family services has been excluded from the Table. (ii) A: In 2015 the Vote of the HSE was disestablished and the funding transferred to Vote 38 (Office of the Minister for Health) from which Vote grants are now paid to the HSE. As a consequence, income
previously accounted for as Appropriations-in-Aid in the HSE Vote is now collected directly by the HSE and shown in the HSE accounts but no longer incorporated in Vote terms. The 2014 estimate was also revised for comparison purposes. The allocation of this income of €1.043bn in 2014, €1.075bn in 2015, €1.061bn in 2016, €1.054bn in 2017 and €1.085bn in 2018 across the above HSE programmes is provisional.
(iii) HSE Gross Non-Capital Total up to and including 2013 refers to the HSE Vote in the Revised Estimates for Public Services (2012 - 2014) and from 2014 refers to those sections of the Health Vote in the Revised Estimates for Public Services relevant to the HSE. Allocations across the HSE programmes above are provisional for 2014 -2018.
(iv) * Includes Medical Card Services Schemes. (v) ^ Costs formerly apportioned across other programmes within Primary Care. Elements of Multi Care Group Services costs reflected across programmes in 2013 and after. Palliative Care costs included
in Primary Care from 2016. Social Inclusion costs included in Primary Care in 2013, 2014 and from 2016.
% change
2012 2013 2014 A 2015 A 2016 2017 2018 2017-2018
Care of Older People 1,366 1,366 1,468 1,569 1,620 1,693 1,774 4.8Care for Persons with Disabilities 1,554 1,535 1,554 1,654 1,773 1,858 2,004 7.8Mental Health 711 737 754 780 804 860 913 6.1Primary Care & Community Health* 3,129 3,352 3,462 3,506 3,892 4,009 4,203 4.8Multi Care Group Services^ 482 113 - - - Palliative Care & Chronic Illness^ 73 72 75 78 - Social Inclusion^ 115 - - 129 - Health and Wellbeing - 228 214 185 191 211 112 -46.9Other^ 81 - - - - Primary, Community and Continuing Care Total 7,510 7,403 7,527 7,901 8,280 8,633 9,006 4.3Acute Division 3,978 4,286 4,496 4,701 4,929 5,243 5,589 6.6Long Term Charges Repayment Scheme 2 8 8 4 2 2 2 0.0Statutory Pensions # 737 678 597 626 670 686 728 6.1Other # 850 647 628 667 708 812 992 22.1HSE Gross Non-Capital Total 13,077 13,022 13,256 13,899 14,589 15,376 16,316 6.1
Total Appropriations-in-Aid 1,485 1,354 1,043 1,075 1,061 1,054 1,085 3.0HSE Net Non-Capital Total 11,592 11,668 12,213 12,824 13,528 14,322 15,231 6.3

72
Chapter 6Health Service Expenditure
Table 6.3Capital Public Health Expenditure by Programme in Millions of Euro, 2009 to 2018
Source: Revised Estimates for Public Services and HSE Reports on Capital Programme.
Note: Excludes capital expenditure by the Office of the Minister for Children & Youth Affairs.
% change
Programme 2009 2010 2011 2012 2013 2014 2015 2016 2017 2018 2009-2018
2017-2018
Acute Hospitals 209 220 202 208 203 197 185 237 253 254 21.4 0.4
Community Health 161 97 71 53 62 79 100 79 79 87 -46.0 10.1
Mental Health 25 27 39 54 23 50 38 21 38 81 223.1 113.2
Disability Services 27 5 11 6 8 6 8 16 26 50 82.5 92.3
ICT 13 7 16 22 41 41 55 54 56 61 381.0 8.9
Miscellaneous 12 10 8 7 11 14 12 16 13 12 -0.9 -7.7
Total Public Capital Expenditure 447 366 347 350 347 386 398 423 465 545 21.8 17.2

73
Chapter 6Health Service Expenditure
Figure 6.1Total public health expenditure, 2010 to 2019
Source: Table 6.1.
Note: See notes under Table 6.1.
Figure 6.2Percentage gross non-capital voted expenditure by programme, HSE 2018
Source: Table 6.2.
Note: See notes under Table 6.2.
18,000
16,000
14,000
12,000
10,000
8,000
6,000
4,000
2,000
0 2010 2011 2012 2013 2014 2015 2016 2017 2018 2019
Expe
nditu
re (€
mill
ions
)
Care of Older People
Care for Persons with Disabilities
Mental Health
Primary Care & Community Health
Health and Wellbeing
Acute Hospitals
Long Term Charges Repayment Scheme
Statutory Pensions
Other
Primary, Community and Conti nuing Care (55.2%
)
12.3%
5.6%
25.8%
34.3%
0.7%
~0.0% 4.5%
6.1%
10.9%

74
Chapter 6Health Service Expenditure
Table 6.4Current Health Care Expenditure by Financing Scheme, 2012 to 2017
Source: System of Health Accounts, Central Statistics Office.
Financing Scheme2012 2013 2014 2015 2016 2017
€m % €m % €m % €m % €m % €m %
Govt. Financing Schemes and Compulsory Contributory Health Care Financing Schemes
13,425 70.987 13,096 70.5 13,264 70.4 13,891 71.2 14,653 72.1 15,487 73.3
Voluntary Health Care Payment Schemes (e.g. Health insurance)
2,908 15.376 2,850 15.3 2,909 15.4 2,971 15.2 3,038 14.9 3,048 14.4
Household Out-of-Pocket Payments 2,579 13.637 2,626 14.1 2,671 14.2 2,650 13.6 2,641 13.0 2,595 12.3
Total Current Health Care Expenditure 18,912 100 18,572 100.0 18,844 100.0 19,512 100.0 20,332 100.0 21,130 100.0

75
Chapter 6Health Service Expenditure
Table 6.5Current Health Care Expenditure by Health Care Function, 2012 to 2017
Source: System of Health Accounts, Central Statistics Office.
Health care function2012 2013 2014 2015 2016 2017
€m % €m % €m % €m % €m % €m %
Curative and Rehabilitative Care 10,068 53.2 10,008 53.9 10,142 53.8 10,626 54.5 11,126 54.7 11,808 55.9
Long-Term Care (Health) 4,188 22.1 3,994 21.5 4,153 22.0 4,301 22.0 4,499 22.1 4,469 21.1
Ancillary Services 514 2.7 569 3.1 545 2.9 581 3.0 603 3.0 593 2.8
Medical Goods (Non-Specified by Function) 3,029 16.0 2,804 15.1 2,745 14.6 2,790 14.3 2,912 14.3 3,074 14.5
Preventive Care 616 3.3 622 3.3 624 3.3 642 3.3 666 3.3 555 2.6
Governance and Health System Administration and Financing 490 2.6 568 3.1 629 3.3 564 2.9 519 2.6 625 3.0
Health Care Services N.E.C 6 0.0 6 0.0 6 0.0 6 0.0 7 0.0 8 0.0
Total Current Health Care Expenditure 18,911 100.0 18,571 100.0 18,844 100.0 19,510 100.0 20,332 100.0 21,132 100.0

76
Chapter 6Health Service Expenditure
Table 6.6Current Health Care Expenditure by Provider, 2012 to 2017
Source: System of Health Accounts, Central Statistics Office.
Provider2012 2013 2014 2015 2016 2017
€m % €m % €m % €m % €m % €m %
Hospitals 6,534 34.9 6,535 35.3 6,663 35.3 6,976 36.2 7,429 36.8 7,854 37.2
Long-Term Residential Facilities 3,624 19.4 3,449 18.6 3,493 18.5 3,534 18.4 3,646 18.1 3,724 17.6
Ambulatory Health Care Providers 3,767 20.1 3,760 20.3 3,774 20.0 3,918 20.3 4,098 20.3 4,207 19.9
Ancillary Health Care Providers 283 1.5 284 1.5 263 1.4 271 1.4 280 1.4 277 1.3
Retailers of Medical Goods 2,891 15.4 2,738 14.8 2,705 14.3 2,737 14.2 2,851 14.1 2,983 14.1
Providers of Preventative Care 238 1.3 230 1.2 228 1.2 228 1.2 233 1.2 256 1.2
Providers of Health Care Administration and Financing 423 2.3 488 2.6 625 3.3 557 2.9 544 2.7 618 2.9
Rest of the Economy 917 4.9 985 5.3 1,070 5.7 994 5.2 1,045 5.2 1,151 5.4
Rest of the World 26 0.1 26 0.1 28 0.1 36 0.2 41 0.2 51 0.2
Providers N.E.C. 13 0.1 12 0.1 3 0.0 4 0.0 4 0.0 10 0.0
Total Current Health Care Expenditure 18,716 100.0 18,507 100.0 18,852 100.0 19,255 100.0 20,171 100.0 21,131 100.0

77
Chapter 6Health Service Expenditure
Figure 6.3Total Health Expenditure per Capita in Ireland in Real Terms, 2008 to 2018
Source: OECD, CSO.
Notes: (i) Total Current Health Expenditure is measured in Euro and has been deflated to real prices by using the CSO National Accounts series for net expenditure by central and local government on current
goods and services at base year 2016. (ii) b: break in series. (iii) e: OECD estimate.
4,500
4,000
3,500
3,000
2,500
2,000
1,500
1,000
500
0
Euro
per
cap
ita
2008 2009 2010 2011 2012 2013 2014 2015 2016 2017 2018(e)
Private
Public

78
Chapter 6Health Service Expenditure
Table 6.7Total current health expenditure per capita (US$PPPs) and as % of GDP/GNI* for selected OECD countries, 2018# (or nearest year)
Source: OECD, Eurostat.
Notes: (i) #Data for 2018 are
provisional. (ii) Per Capita Expenditure
is expressed in US$ Purchasing Power Parities (US$PPPs).
(iii) GDP: Gross Domestic Product.
(iv) As PPPs are statistical constructs rather than precise measures, minor differences between countries should be interpreted with caution.
(v) Modified Gross National Income (GNI*): adjusted for retained earnings of re-domiciled firms and depreciation on foreign-owned domestic capital assets.
Per Capita % GDP/GNI*Country Public Private Total Public Private TotalAustralia 3,467.0 1,538.3 5,005.3 6.4 2.8 9.3Austria 4,032.6 1,362.5 5,395.1 7.7 2.6 10.3Belgium 3,819.9 1,123.6 4,943.5 8.0 2.4 10.4Canada 3,466.0 1,508.3 4,974.3 7.5 3.3 10.7Chile 1,272.1 909.6 2,181.7 5.2 3.7 8.9Czech Republic 2,502.2 530.4 3,032.6 6.2 1.3 7.5Denmark 4,472.2 826.6 5,298.8 8.8 1.6 10.5Estonia 1,678.9 552.5 2,231.4 4.9 1.6 6.4Finland 3,185.8 1,049.7 4,235.6 6.8 2.3 9.1France 4,141.2 823.5 4,964.7 9.3 1.9 11.2Germany 5,056.1 930.4 5,986.4 9.5 1.7 11.2Greece 1,348.8 885.4 2,238.2 4.7 3.1 7.8Hungary 1,438.8 608.0 2,046.8 4.6 2.0 6.6Iceland 3,570.1 779.0 4,349.1 6.8 1.5 8.3Ireland (GNI*) 3,583.1 1,286.3 4,869.4 8.8 3.2 12.0Israel 1,773.0 960.1 2,779.7 4.8 2.6 7.5Italy 2,544.6 883.2 3,427.8 6.5 2.3 8.8Japan 4,007.8 758.3 4,766.1 9.2 1.7 10.9Korea 1,907.6 1,284.0 3,191.6 4.8 3.3 8.1Latvia 1,003.7 744.8 1,748.5 3.4 2.5 5.9Lithuania 1,606.6 808.7 2,415.8 4.5 2.3 6.8Luxembourg 4,256.5 748.0 5,070.2 4.5 0.8 5.4Mexico 585.8 552.2 1,138.0 2.8 2.6 5.5Netherlands 4,342.7 945.8 5,288.4 8.2 1.8 9.9New Zealand 3,107.7 815.0 3,922.6 7.4 1.9 9.3Norway 5,288.8 898.2 6,186.9 8.7 1.5 10.2Poland 1,475.9 580.4 2,056.4 4.5 1.8 6.3Portugal 1,901.8 959.6 2,861.4 6.0 3.1 9.1Slovak Republic 1,833.9 456.4 2,290.3 5.4 1.3 6.7Slovenia 2,085.4 774.0 2,859.4 5.8 2.2 7.9Spain 2,341.4 981.2 3,322.6 6.2 2.6 8.9Sweden 4,569.5 877.6 5,447.1 9.3 1.8 11.0Switzerland 4,660.4 2,656.2 7,316.6 7.8 4.4 12.2Turkey 957.1 269.5 1,226.6 3.3 0.9 4.2United Kingdom 3,138.5 931.1 4,069.6 7.5 2.2 9.8United States 8,949.0 1,637.1 10,586.1 14.3 2.6 16.9

79
Chapter 6Health Service Expenditure
Figure 6.4Health Expenditure as a share of GDP for selected OECD Countries and GNI* for Ireland, 2018 (or nearest year)
Source: OECD Health Statistics
Notes: (i) a: Australian expenditure estimates exclude all expenditure for residential aged care facilities in welfare (social) services.(ii) Modified Gross National Income (GNI*): adjusted for retained earnings of redomiciled firms and depreciation on foreign-owned domestic capital assets. (iii) Voluntary/Out-of-pocket includes private insurance.
United States Switzerland
Ireland (GNI*)Germany
France Sweden
Japan Canada
Denmark Belgium Austria
Norway Netherlands
United Kingdom New Zealand
Australia (a)Finland
Portugal Chile Spain
OECD35Italy
Iceland Korea
Slovenia Greece
Czech Republic Israel
LithuaniaSlovak Republic
Hungary Estonia Poland Latvia
Mexico Luxembourg
Turkey
Share of GDP/GNI*0 2 4 6 8 10 12 14 16 18
Public
Voluntary/Out-of-pocket

80
Chapter 6Health Service Expenditure
Figure 6.5Health Expenditure by Type of Care as a % of Total Health Expenditure, EU15, 2017
Source: Eurostat
100%
90%
80%
70%
60%
50%
40%
30%
20%
10%
0%
Belg
ium
Ger
man
y
Swed
en
Net
herla
nds
Luxe
mbo
urg
Fran
ce
Irela
nd
Italy
EU15
Ave
rage
Den
mar
k
Uni
ted
King
dom
Spai
n
Finl
and
Aust
ria
Gre
ece
Port
ugal
Other
Preventive Care Governance and Health System and Financing administration
Ancillary Services
Long-Term Care
Medical Goods
Curative and Rehabilitation Care

81
Chapter 7 New Regional Health Areas
7. New Regional Health AreasIn July 2019 Minister for Health, Simon Harris TD, announced the approval by Government of the geographies of six new regional health areas. This represents a major step towards reconfiguring our health service in line with recommendations made in the Oireachtas Committee on the Future of Healthcare Sláintecare Report (2017). Ultimately, it is envisaged that the HSE will evolve into a leaner national centre with responsibility for national planning, strategy and standard setting, complemented by the establishment of six new regional health structures in the six regions with responsibility for the planning and delivery of services in those regions. Detailed proposals to support this reconfiguration are under development and will be subject to further consideration by Government in 2020.
The establishment of Regional Health Areas with clearly defined population catchments will enable a fundamental shift towards a population health approach to planning, resourcing and delivering integrated health and social care services based on population need. Population profiling to describe and understand regional populations, health status, health service activity and resources commenced between the Department of Health and HSE in 2019. Some initial findings are presented in this section.
Population size and age structure are key determinants of health and social care need in the
six new regional health areas. As shown in Figure 7.1, the six regional health areas vary in size: regional health area A has the largest population (1.11 million) and regional health area E has the smallest population (0.39 million). Older people are a key focus in the planning and delivery of integrated care and Figure 2 maps the population aged 65 and older across the six regional health areas.
Population pyramids in Figures 7.3a-f summarise and display the age structure of each regional health area. While the regional health areas share some common features, each is unique and this will have implications that will need to be reflected in population-based planning for integrated care. In addition to understanding population, the profiling of health status at national and regional level through a range of health information systems will inform population-based planning and delivery of integrated care.
Census 2016 afforded an opportunity to analyse the percentage of those in the population with a disability and who are from disadvantaged areas. The results of this regional analysis are presented in Figures 7.4 and 7.6 respectively. Figure 7.5 for the first time presents the regions according to the percentage of population holding a medical card.
Figures 7.7a-c profile mortality rates by regional health area and illustrate the scale and nature of
health needs. Major causes of death are presented in these figures to illustrate the variation across regions of mortality rates due to circulatory diseases, respiratory diseases and non-respiratory cancers respectively.
This section provides initial data from the current profiling exercise, with further development of regional statistical analysis continuing during 2020.

82
Chapter 7 New Regional Health Areas
Figure 7.1 Figure 7.2Population breakdown by RHA, 2018 Percentage of Population aged over 65 by RHA, 2018
% of Total Population 65+
Area A Area B Area C Area D Area E
11.73 - 12.22
12.23 - 15.37
15.87
Area F
719,98415% 1,107,498
23%
1,020,08721%
917,40419%
699,60014%
392,4268%
Source: Department of Health
Notes: (i) Data from 2018 is provisional(ii) Population per RHA is estimated
Source: Department of Health
Notes: (i) Data from 2018 is provisional(ii) Population per RHA is estimated
Area F
Area D
Area C
Area B
Area E
Area A

83
Chapter 7 New Regional Health Areas
Figure 7.3a Figure 7.3bPopulation Distribution by Age Group for Area A, 2018 Population Distribution by Age Group for Area B, 2018
85+80-8475-7970-7465-6960-6455-5950-5445-4940-4435-3930-3425-2920-2415-1910-14
5-90-4
85+80-8475-7970-7465-6960-6455-5950-5445-4940-4435-3930-3425-2920-2415-1910-14
5-90-4
60,000 40,000 20,000 0 20,000 40,000 60,000 60,000 40,000 20,000 0 20,000 40,000 60,000
Male Female Male FemaleSource: Department of Health
Notes: (i) Data from 2018 is provisional(ii) Population per RHA is estimated
Source: Department of Health
Notes: (i) Data from 2018 is provisional(ii) Population per RHA is estimated

84
Chapter 7 New Regional Health Areas
Figure 7.3cPopulation Distribution by Age Group for Area C, 2018
Figure 7.3dPopulation Distribution by Age Group for Area D, 2018
85+80-8475-7970-7465-6960-6455-5950-5445-4940-4435-3930-3425-2920-2415-1910-14
5-90-4
85+80-8475-7970-7465-6960-6455-5950-5445-4940-4435-3930-3425-2920-2415-1910-14
5-90-4
60,000 40,000 20,000 0 20,000 40,000 60,000 60,000 40,000 20,000 0 20,000 40,000 60,000
Male Female Male FemaleSource: Department of Health
Notes: (i) Data from 2018 is provisional(ii) Population per RHA is estimated
Source: Department of Health
Notes: (i) Data from 2018 is provisional(ii) Population per RHA is estimated

85
Chapter 7 New Regional Health Areas
Figure 7.3e Figure 7.3fPopulation Distribution by Age Group for Area E, 2018 Population Distribution by Age Group for Area F, 2018
85+80-8475-7970-7465-6960-6455-5950-5445-4940-4435-3930-3425-2920-2415-1910-14
5-90-4
85+80-8475-7970-7465-6960-6455-5950-5445-4940-4435-3930-3425-2920-2415-1910-14
5-90-4
60,000 40,000 20,000 0 20,000 40,000 60,000 60,000 40,000 20,000 0 20,000 40,000 60,000
Male Female Male FemaleSource: Department of Health
Notes: (i) Data from 2018 is provisional(ii) Population per RHA is estimated
Source: Department of Health
Notes: (i) Data from 2018 is provisional(ii) Population per RHA is estimated

86
Chapter 7 New Regional Health Areas
Figure 7.4 Figure 7.5Percentage of Population with a Disability by RHA, 2016
% of Total Population with a Disability
Percentage of Population with a Medical Card by RHA, 2018
% of Total Population with Medial Card
12.79
12.80 - 13.81
14.21
32 - 34
34 - 39
43
Area F
Area D
Area C
Area B
Area E
Area A Area F
Area D
Area C
Area B
Area E
Area A
Source: HSE Health Intelligence Unit Source: Department of Health
Notes: (i) Data from 2018 is provisional(ii) Population per RHA is estimated

87
Chapter 7 New Regional Health Areas
Figure 7.6Percentage of Population considered very/extremely disadvantaged by RHA, 2016
% of Total Population Considered very/extremely disadvantaged
5.93 - 7.12
8.43
8.44 - 8.73
Area F
Area D
Area C
Area B
Area E
Area A
Figure 7.7aAge-Standardised Mortality Rate from Circulatory Diseases by RHA, 2017
Age Standardised Mortality Rate per 100,000 population
261.05
261.05 - 291.25
291.25 - 322.84
Area F
Area D
Area C
Area B
Area E
Area A
Source: HSE Health Intelligence Unit Source: Department of Health
Notes:1. Figures above are estimated. 2. The rates above are age-standardised to the European standard
population and are presented as rates per 100,000 population.

88
Chapter 7 New Regional Health Areas
Figure 7.7b Figure 7.7cAge-standardised Mortality Rate from Repiratory Diseases by RHA , 2017
Age Standardised Mortality Rate per 100,000 population
Age-Standardised Mortality Rate from Cancers by RHA, 2017
Age Standardised Mortality Rate per 100,000 population
173.49 - 187.98
205.15
239.02
178.41
178.41 - 224.53
257.37
Area F
Area D
Area C
Area B
Area E
Area AArea F
Area D
Area C
Area B
Area E
Area A
Source: Department of Health
Notes:1. Figures above are estimated. 2. The rates above are age-standardised to the European standard
population and are presented as rates per 100,000 population.3. Including cancer of the trachea, bronchus and lung
Source: Department of Health
Notes:1. Figures above are estimated. 2. The rates above are age-standardised to the European standard
population and are presented as rates per 100,000 population.3. Excluding cancer of the trachea , bronchus and lung

Statistics & Analytics Services, Department of Health, Block 1, Miesian Plaza, 50-58 Lower Baggot Street, Dublin, Ireland. D02 XW14
Ph: +353 6354000
This document is available for download at www.gov.ie/en/organisation/department-of-health
Le ceannach díreach óFOILSEACHÁIN RIALTAIS,52 FAICHE STIABHNA, BAILE ÁTHA CLIATH 2(Teil: 076 1106 834 nó Riomhphost: [email protected] ) nó trí aon díoltóir leabhar.
To be purchased fromGOVERNMENT PUBLICATIONS,52 ST. STEPHEN’S GREEN, DUBLIN 2.(Tel: 076 1106 834 or Email: [email protected]) or through any bookseller.
€5.00 | © Government of Ireland 2019.