health insurance premium rates february 5, 2020
TRANSCRIPT

1
Health Insurance Premium Rates
February 5, 2020Gorman Actuarial, Inc.

2
AGENDA
Gorman Actuarial, Inc.
Health Insurance Data
Health Insurance Premiums
Health Insurance Base Rates
Risk Pools for Rating
Merging Individual and Small Group Risk Pools
Risk Adjustment in the Merged market
Membership

3
Health Insurance Data

4
The data that will be presented throughout this project will come from multiple data sources.
Gorman Actuarial, Inc.
Data by insurance carrier
Publicly available collected by CHIA or MA DOI
May not be the most up to date – but it will provide directional
information
More recent data will not be shown by insurance carrier
Data collected through MA DOI special examination authority and
will be kept confidential
Data shown will be aggregated by subsegments of the market

5
Health Insurance Premiums

6
There is a range of choices in the market for individuals and small employers in the market.
Gorman Actuarial, Inc.
Website requested age and zip
code of each family member.
Approximately 130 health
insurance quotes were provided
Monthly Quotes
Insurers represented:
Health New England (HNE)
Fallon
Tufts Health Plan
AllWays
Harvard Pilgrim Health Care
Quotes from Small Business Service Bureau, Inc. Website
Gorman Actuarial: Sole Proprietor, Family of 4
162%

7
The rates will vary based on the plan design(product) chosen.
Gorman Actuarial, Inc.Quotes from Small Business Service Bureau, Inc. Website
Monthly rates vary
based on the health
insurer chosen and
the plan benefits (i.e.,
member cost sharing)

8
The choices individuals and employers make impact the premium they pay.
Gorman Actuarial, Inc.
Individual Choices (Individual Market or Sole Proprietor)
Health Insurer
Plan Design (e.g., Deductible vs. No Deductible)
Number of family members covered
Employer Group
Employer chooses health insurer and plan design for employees
Employee is typically expected to contribute to cost of premium
Health Connector for Business, through the “horizontal employee choice”
model, allows each employee to choose an insurer within the metallic tier
selected by the employer

9
The employer pays a portion of the premium rate on behalf of the employee: employer contribution.
Gorman Actuarial, Inc.
Monthly
Health
Insurance
Premium
Rate
Employee Portion
Employer Portion Employers contribute some
portion of the monthly premium
The contribution can be a fixed
monthly dollar amount or a
percent

10
Insurers are allowed to adjust each customer’s rate for allowable rating factors .
Gorman Actuarial, Inc.
“Base Rate”
Group Size
Geography
Age
Group Purchasing
Cooperative
MA prescribes a 2 to 1 band
The ACA prescribes a 3 to 1 band
Defined regions: Each insurer establishes their own
surcharges and discounts: MA prescribes a 1.5 to 1
Allowed in MA only. Each insurer establishes
surcharges and discounts. Used to be 0.95 to 1.10
but phasing out over time
Allowed in MA only. Each insurer establishes
discount up to 3%
A base rate is
multiplied by
relevant rating
factors to calculate
a premium
Benefit Factor Adjustment varies based on plan choice by the consumer
ACA= Affordable Care Act
11
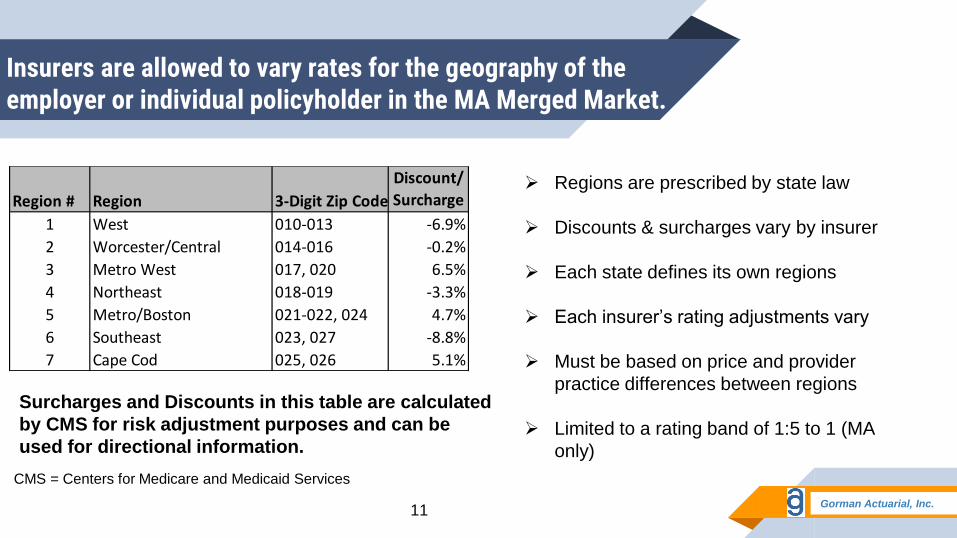
Insurers are allowed to vary rates for the geography of the employer or individual policyholder in the MA Merged Market.
Gorman Actuarial, Inc.
Regions are prescribed by state law
Discounts & surcharges vary by insurer
Each state defines its own regions
Each insurer’s rating adjustments vary
Must be based on price and provider
practice differences between regions
Limited to a rating band of 1:5 to 1 (MA
only)
Region # Region 3-Digit Zip Code
Discount/
Surcharge
1 West 010-013 -6.9%
2 Worcester/Central 014-016 -0.2%
3 Metro West 017, 020 6.5%
4 Northeast 018-019 -3.3%
5 Metro/Boston 021-022, 024 4.7%
6 Southeast 023, 027 -8.8%
7 Cape Cod 025, 026 5.1%
Surcharges and Discounts in this table are calculated
by CMS for risk adjustment purposes and can be
used for directional information.
CMS = Centers for Medicare and Medicaid Services

12
Insurers are allowed to vary rates for the group size of the employer or individual policyholder in the MA Merged Market.
Gorman Actuarial, Inc.
Prior to the ACA, rating band was
0.95 to 1.10, meaning highest rate
can be ~15% higher than lowest
rate due to group size.
The ACA does not allow group size
rating and these adjustments are
being phased out over time
As they are phased out, smaller
groups will experience a decrease
in rates and larger groups will
experience an increase
Source: MA DOI/Connector Information Request
& Individual Market

13
Health Insurance Base Rates

14
Health insurance base rates are made up of projected claims, administrative costs and contribution to reserve (“CTR”).
Gorman Actuarial, Inc.
Massachusetts Individual and Small Group Market Minimal Allowable Share by Law
Federal Individual and Small Group MarketMinimal Allowable Shares by Law
Projected claims* Projected claims*
Administrative Costs
CTR (“Rainy Day”)
Administrative Costs + CTR (“Rainy Day”)
* Projected claims include other adjustments allowed in the medical loss ratio (MLR) calculation

15
Base rates are developed by analyzing and projecting health care expenditures.
Gorman Actuarial, Inc.
Insurer
Medical & Pharmacy
Expenditures (Claims)
Patients receiving health care services
Em
plo
ye
rs &
in
div
idu
als
pa
y p
rem
ium
Patients may pay cost sharing

16
Claims expenditures can be grouped into various medical services.
Gorman Actuarial, Inc.
Insurance Company XYZ insures 100,000
members
Source: CHIA’s 2019 Annual Report Coverage Dataset
Service Category CY 2019 Claims
Claims Per
Member
Per Month
(PMPM)
Hospital Inpatient $101,111,727 $84.26
Hospital Outpatient $94,881,191 $79.07
Physician $82,430,495 $68.69
Pharmacy $85,682,803 $71.40
Other Professional $38,251,082 $31.88
All Other $97,642,702 $81.37
Total $500,000,000 $416.67
Member Months 1,200,000
Illustrative

17
There are many different measurements of financial data.
Gorman Actuarial, Inc.
Allowed Claims PMPM $500.00
This represents total health care benefit expenditures. It will include health
care benefits paid for by the insurer and health care benefits paid for by the
member in the form of member cost sharing. It will not include out-of-pocket
expenses that the insurer does not know about. For example, OTC drugs
spending.
Member Cost Sharing PMPM $100.00
This represents what the member pays in copays, deductibles, and coinsurance
amounts. Generally the higher the cost sharing PMPM, the higher the member
cost sharing (higher deductible plans).
Incurred & Paid Claims PMPM $400.00
This is equal to Allowed Claims - Cost Sharing and is the insurer liability and
insurer costs. When insurers analyze profits and their financial standing, they
will look at this number. When insurers want to understand health care cost
trends, or compare one population to another on an apples to apples basis,
they will analyze allowed claims.
Paid to Allowed Ratio 80%
This is the ratio of incurred & Paid Claims to Allowed Claims and represents
what percent of health care benefits are paid for by the insurer. The higher the
ratio, the "richer" the benefits.
Total Medical Expense (TME)

18
Each insurers’ claims PMPMs are different as their insured populations, products, and provider networks are diverse.
Gorman Actuarial, Inc.
54K 69K 272K 75K 21K 8K 26K 87K 149K
HPHC: Harvard Pilgrim Health Care
AllWays: (formerly Neighborhood Health Plan)
BCBSMA: Blue Cross & Blue Shield of MA
Tufts: Tufts Health Plan
Fallon
United
HNE: Health New England
BMCHP: Boston Medical Center Health Plan
THPP: Tuft Health Public Plan (formerly
Network Health)
Source: CHIA’s 2019 Annual Report Coverage Dataset:
Excludes Connecticare
Average 2018 Membership

19
Many factors are considered when projecting future medical claims.
Gorman Actuarial, Inc.
2018 Claims
PMPMAdjustments
2020 Projected
Claims PMPM
Two Year Lag
Medical &
Pharmacy
Trends
Population
ChangesBenefit
Changes
Risk
Adjustment

20
Since 2013, average annual health claims trends for ~2.6 M Massachusetts residents have increased 3.6% annually.
Gorman Actuarial, Inc.Source: CHIA Annual Report TME Databook
TME trend for Full Claims Population including all market segments
TME PMPM = Total Medical Expenditures (TME)
Per Member Per Month: Also known as Allowed
Claims PMPM
Claims trend has 4 major
categories:
Unit Price Trend
Utilization Trend
Provider Mix Trend
Mix of Services

21
There are many market dynamics that influence the composition of the Individual and Small Group Markets.
Gorman Actuarial, Inc.
Repeal of the Individual Mandate (outside of MA)
Increasing popularity of self-insured products among the small group market
Increasing visibility of emerging products
Association Health Plans (AHPs)
Professional Employment Organizations (PEOs)
Short Term Duration Products
Health Sharing Ministries
Insurers that enter or exit the market

22
There are many other considerations when insurers are setting their health insurance premiums.
Gorman Actuarial, Inc.
When individuals have the ability to make choices about their health care
coverage, selection occurs.
Individual Market: the individual makes the choice
Group Market:
Small employers: Typically the business owner makes the choice – the
smaller the employer the greater potential for anti-selection
Larger employers – HR makes the choice
Higher risk individuals and higher utilizers of health care will choose insurers and
products that best suit their needs.
Limited Network vs. Full Network
High Deductible Plan (“Bronze”) vs. Low Deductible Plan (“Platinum”)

23
Risk Pools for Rating
24
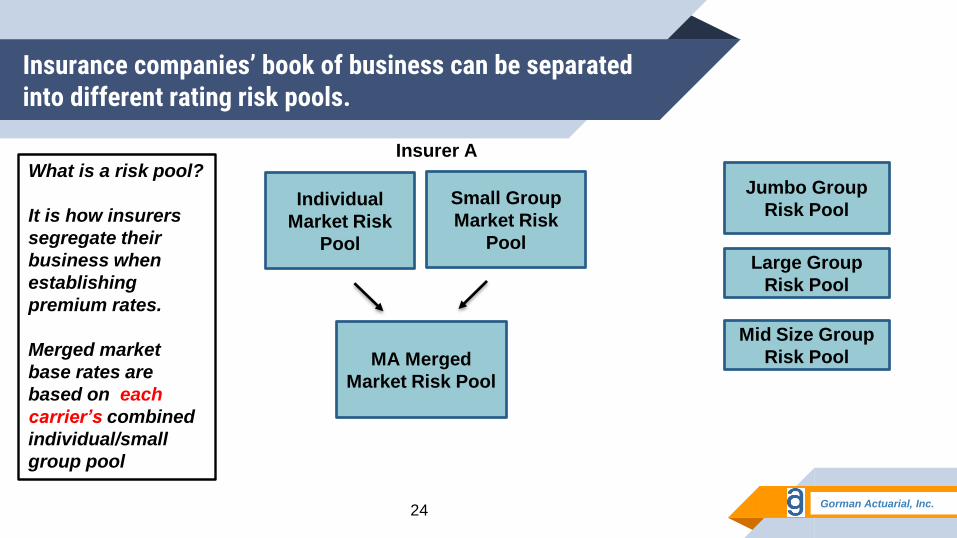
Insurance companies’ book of business can be separated into different rating risk pools.
Gorman Actuarial, Inc.
Individual
Market Risk
Pool
Small Group
Market Risk
Pool
Jumbo Group
Risk Pool
Mid Size Group
Risk Pool
Large Group
Risk Pool
MA Merged
Market Risk Pool
What is a risk pool?
It is how insurers
segregate their
business when
establishing
premium rates.
Merged market
base rates are
based on each
carrier’s combined
individual/small
group pool
Insurer A

25
Insurer claims costs by risk pool may vary significantly.
Gorman Actuarial, Inc.
Morbidity: If one risk pool has a higher concentration of high risk patients
compared to another, the premium rates will be higher
Utilization: If one risk pool uses more health care services compared to
another, the premium rates will be higher
Providers: If one risk pool uses more expensive providers compared to
another, the premium rates will be higher

26
Merging Individual and Small Group Risk Pools

27
Massachusetts has historically implemented policies to focus on the individual and small group markets.
Gorman Actuarial, Inc.
Chapter 58 of the Acts of 2006
Merged IND and SG markets into a single risk pool - 2007
Individual Mandate
Goals
Broaden risk pool & strengthen stability
Improve affordability in the individual market
Many changes since Chapter 58, including:
Establishment of annual open enrollment period for individuals
Enhanced eligibility verification requirements for individuals
Implementation of Affordable Care Act (ACA)

28
The definition and composition of the Individual Market was very different from 2006 to 2014 vs. 2014 and beyond.
Gorman Actuarial, Inc.
Commonwealth Care
0 to 300 FPL~2006 to 2014
• Separate rating pool
• Enrollment only
open to MCOs:
BMCHP, Network
Health, Fallon, NHP
• Subsequently
CeltiCare and HNE
• Provider
reimbursement
~Medicaid +
• Premiums were
subsidized by the
state and benefits
were comprehensive
(AVs high 90s)
ConnectorCare
0 to 300 FPL
Individual Market 300 to 400
FPL
Individual Market 400+ FPL
Small Group Market
~2014 and beyond• Due to the ACA,
ConnectorCare
combined with the rest
of the Merged Market
• Risk Adjustment
applies across the
entire Merged Market
• ConnectorCare
premiums and
benefits subsidized by
state and federal
government (APTC &
CSR)
• BMCHP
• THPP (Network Health)
• AllWays (NHP)
• Fallon
• HNE
• BCBSMA
• HPHC
• THP
• United
• BMCHP
• THPP (Network Health)
• AllWays (NHP)
• Fallon
• HNE
• ConnectiCare
FPL= federal poverty level
$12,490

29
The Connector serves all segments within the merged market.
Gorman Actuarial, Inc.
Individual Market
ConnectorCare up to 300% FPL
Federal premium tax subsidies and state subsidies
Cost sharing reduction subsidies
Many plan options have a narrower or regional network that does not include all
Academic Medical Centers
300% to 400% FPL
Non-Subsidized Individual Market
Small Group Market

30
The subsidized individual market consists of many subpopulations with different premiums and benefits.
Gorman Actuarial, Inc.
ConnectorCare
~0 to 100FPL
ConnectorCare
~200-300FPL
ConnectorCare
~100-200FPL
Subsidized 300 to
400FPL
State
AV
0.997
Federal CSR
AV 0.94
Federal
CSR
AV 0.94
Federal
CSR AV
0.87
State
AV
0.953
State
AV
0.953
Buys a 0.70 AV Plan w/Cost Sharing Reduction (CSR)
Federal
CSR AV
0.73
State
AV
0.923
State
AV
0.923
State Premium Subsidies
Federal Premium Subsidies (Advanced Premium Tax Credits “APTC”)
Federal payment of CSR ended in
2017 and shortfall has been built
into premiums and APTC
0.86 to 0.92 AV Platinum
0.76 to 0.82 AV Gold
0.66 to 0.72 AV Silver
0.56 to 0.65 AV Bronze NO
CSR
30

31Gorman Actuarial, Inc.
Source: CHIA’s 2019 Annual Report Coverage Dataset
There is a wide spread in claims PMPMs within the Individual Market with the highest 2.6 times the lowest
Doesn’t participate
in ConnectorCare
Predominantly
select network
8.6K 24K 29K 9.6K 6K 10K 86K 133K

32
The Small Group Market has less variation than the Individual Market.
Gorman Actuarial, Inc.
Source: CHIA’s 2019 Annual Report Coverage Dataset
Predominantly
select network
11K 45K 66K 248K 8K 40K 20K 15K
0.4K

33
Risk Adjustment in the Merged Market:Spreading Risk Among Insurance Carriers

34
Many factors are considered when projecting future medical claims.
Gorman Actuarial, Inc.
2018 Claims
PMPMAdjustments
2020 Projected
Claims PMPM
Two Year Lag
Medical &
Pharmacy
Trends
Population
ChangesBenefit
Changes
Risk
Adjustment

35
Risk adjustment tries to create equity in the market by shifting funds from insurers with lower risk members to insurers with higher risk members.
Gorman Actuarial, Inc.
The ACA introduced the risk adjustment program to the individual and
small group markets. Massachusetts applies this program to the merged
market.
Risk adjustment shifts funds from insurers that enroll healthier members
to insurers that enroll less healthy members.
Examples of insurance practices that may result in attracting better risk:
Insurers that offer only narrow network plans
Insurers that only offer high deductible/high cost-sharing plans
Insurers that only market to larger employer groups

36
Risk adjustment is applied to each risk pool, in states where the individual and small group risk pools are separate.
Insurer A
Individual
Mkt
High Risk
Insurer B
Individual
Mkt
Low Risk
Insurer A
Small Group
Mkt
Low Risk
Insurer B
Small Group
Mkt
High Risk
Gorman Actuarial, Inc.
Risk
Adjustment
Fund
Risk
Adjustment
Fund
37
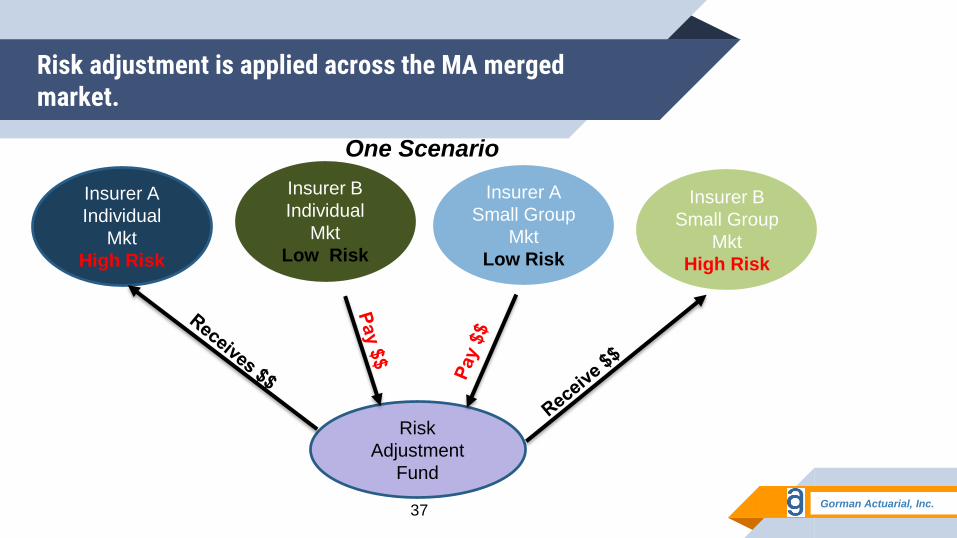
Risk adjustment is applied across the MA merged market.
Insurer A
Individual
Mkt
High Risk
Insurer B
Individual
Mkt
Low Risk
Insurer A
Small Group
Mkt
Low Risk
Insurer B
Small Group
Mkt
High Risk
Gorman Actuarial, Inc.
Risk
Adjustment
Fund
One Scenario

38
2018 risk adjustment resulted in large transfers for some insurers in the Merged Market.
Negative red indicates payment, positive black indicates receivable
2018 Risk Adjustment results released
summer of 2019
Insurers must predict risk adjustment
transfers in summer of 2017 when
developing 2018 rates.
Volatile transfer payments can make
predictions challenging
An expected payment would increase the
insurer’s proposed rates and an expected
receivable would decrease the proposed
rates
Insurer RA Transfer
AllWays $55,007,378
BCBSMA $12,500,608
BMCHP ($37,948,809)
Connecticare $527,550
Fallon $1,236,839
HNE ($3,348,914)
HPHC $33,116,998
THP $5,187,094
THPP ($62,005,322)
United ($4,273,421)
Gorman Actuarial, Inc.

39
In 2018, the largest payers of risk adjustment funds were health plans with large ConnectorCare enrollment.
AllWays HPHC THPP BMCHP
2018 Merged Market Membership
Received $55M Received $33M Paid $62M Paid $38M
Gorman Actuarial, Inc.

40
There has been considerable volatility in risk adjustment transfers over the past 5 years.
Gorman Actuarial, Inc.
PY 2018(1) PY 2017(1) PY 2016(2) PY 2015(2) PY 2014(5)
AllWays $55,007,378 $56,321,259 $54,771,043 $5,353,042 $27,858,047
BCBSMA $12,500,608 $3,284,539 $33,826,090 $81,741,193 $50,714,401
BMCHP $37,948,809 $35,993,129 $18,139,498 $18,620,484 $5,152,402
Celticare $0 $199,701 $1,880,633 $2,366,108 $481,601
Connecticare $527,550 $664,697 $306,568 $249,965 $1,246,444
Fallon $1,236,839 $4,441,782 $369,941 $3,890,227 $11,107,357
HNE $3,348,914 $423,603 $6,552,130 $3,206,399 $2,692,451
HPHC $33,116,998 $28,012,262 $16,497,354 $10,852,737 $2,182,465
Minuteman $0 $10,888,138 $9,619,224 $5,976,150 $2,857,045
THP $5,187,094 $16,623,471 $21,203,852 $1,277,729 $8,201,309
THPP $62,005,322 $61,974,969 $55,423,070 $39,440,273 $3,696,957
United $4,273,421 $1,115,078 $1,752,449 $1,214,162 $1,640,940
Total $0 $0 $0 $0 $0

41
Membership

42
Since 2007, small group membership has declined and individual membership has increased.
Many policy changes
over the years
ConnectorCare joined
the Individual Market
in 2015
Sole Prop reporting
has been shifting to
Individual from SG
Total Merged Market
Dropped 103K
MA Merged Market Membership
795K
46K
424K
316K
Source: DOI Annual Merged Market Membership Reports
+270K
-371K
Gorman Actuarial, Inc.

43
Over the past 3 years, small group membership continues to decline and individual membership is increasing.
Source: DOI Annual Merged Market Membership Reports
Gorman Actuarial, Inc.
2016 2017 2018
Small Group 485,699 446,056 423,562
Individual Market 285,377 302,623 315,534
Total 771,076 748,679 739,096
• From 2016 – 2018, small
group membership
declined by 62,000 while
individual market
increased by 30,000
• Overall, merged market
declined by 32,000
members