health locus of control, risk perception,...
TRANSCRIPT

HEALTH LOCUS OF CONTROL,
RISK PERCEPTION, AND HEALTH BEHAVIOR IN
AFRICAN AMERICANS
by
Vera Cherepakho
B.S. Biological Sciences, California Polytechnic State University
San Luis Obispo, 2006
Submitted to the Graduate Faculty of
Graduate School of Public Health in partial fulfillment
Of the requirements for the degree of
Master of Science
University of Pittsburgh
2008

ii
UNIVERSITY OF PITTSBURGH
GRADUATE SCHOOL OF PUBLIC HEALTH
This thesis was presented
by
Vera Cherepakho
It was defended on
March 31st, 2008
and approved by
Thesis Director: Stephen B. Thomas, PhD, Philip Hallen Professor of Community Health and Social Justice, Behavioral and Community Health Sciences, Graduate School of Public Health,
University of Pittsburgh
Angela F. Ford, PhD, Associate Director, Center for Minority Health, Graduate School of Public Health, University of Pittsburgh
Elizabeth A. Gettig, MS, Associate Professor, Department of Human Genetics, Graduate School
of Public Health, University of Pittsburgh
Robin E. Grubs, PhD, CGC, Assistant Professor, Department of Human Genetics, Graduate School of Public Health, University of Pittsburgh
John W. Wilson, PhD, Assistant Professor, Department of Biostatistics, Graduate School of
Public Health, University of Pittsburgh

iii
Copyright © by Vera Cherepakho
2008

iv
HEALTH LOCUS OF CONTROL, RISK PERCEPTION, AND HEALTH BEHAVIOR IN
AFRICAN AMERICANS
Vera Cherepakho, M.S.
University of Pittsburgh, 2008
PURPOSE: The multidimensional health locus of control (MHLC) measures the degree to
which an individual feels they are in control of their own health. In order to better tailor
interventions to the psychosocial needs of Healthy Black Family Project (HBFP) participants, we
explored relationships between MHLC, risk perception, and participation in health behaviors.
METHODS: Risk perception analysis was assessed in 87 participants using Fisher’s exact tests
to search for relationships between MHLC scores and risk perception accuracy for diabetes,
cardiovascular disease, and cancer (breast, ovarian and colon). Health behavior was assessed in
68 participants. Outcome measures included physical activity level, information seeking
behavior and enrollment in the Minority Research Recruitment Database. Change in physical
activity was assessed using the Transtheoretical model. Wilson’s model was used to assess
changes in information seeking behavior. Fisher’s exact tests were used to test for relationships
among MHLC and the outcome measures.
RESULTS: Individuals at high risk for diabetes were more likely to underestimate their risk if
they scored low on powerful others (p= 0.011). Individuals at moderate risk for cardiovascular

v
disease were more likely to overestimate their risk if they scored high on powerful others
(p=0.005). Women at low risk for ovarian cancer were more likely to overestimate their risk if
they were externals (p= 0.04). Overall, the majority of individuals maintained or increased their
level of physical activity, and information seeking and enrolled in the database regardless of their
health locus of control.
CONCLUSIONS: These findings highlight diabetes, cardiovascular disease, and ovarian cancer
as areas in which participants would benefit from risk education tailored to their locus of control.
Maximizing the role of community members, improving patient doctor communication, and the
family health history initiative may be appropriate approaches to improve risk awareness. The
pattern of behavior change observed in this study may be preliminary evidence that the HBFP is
effective at promoting positive health behavior change in individuals regardless of their health
locus of control.
PUBLIC HEALTH SIGNIFICANCE: Community health outreach programs can use MHLC
to explore how to better tailor interventions to their target population. The HBFP may serve as a
model for future health promotion efforts.

vi
TABLE OF CONTENTS
ACKNOWLEDGEMENTS ..................................................................................................... XII
1.0 INTRODUCTION ............................................................................................... 1
1.1 HEALTH DISPARITIES IN THE US............................................................... 2
1.2 MULTIDIMENSIONAL HEALTH LOCUS OF CONTROL........................ 9
1.2.1 DEFINITION OF MHLC................................................................................... 9
1.2.2 DEVELOPMENT OF MHLC ................................................................... 11
1.3 THE IMPORTANCE OF ACCURATE RISK PERCEPTION.................... 19
1.4 MEASURES OF HEALTH BEHAVIOR........................................................ 20
1.4.1 THE TRANSTHEORETICAL MODEL.................................................. 21
1.4.2 WILSON’S MODEL OF INFORMATION SEEKING BEHAVIOR ... 22
1.4.3 MINORITY RESEARCH RECRUITMENT DATABASE.................... 24
2.0 SPECIFIC AIMS OF STUDY .................................................................................. 26
3.0 METHODS ................................................................................................................. 27
3.1 HEALTHY BLACK FAMILY PROJECT ..................................................... 27
3.2 FAMILY HEALTH HISTORY INITIATIVE................................................ 28
3.3 MINORITY RESEARCH RECRUITMENT DATABASE........................... 29
3.4 ASSESSING MHLC, RISK PERCEPTION, AND HEALTH BEHAVIOR 30
3.4.1 PROCEDURE ............................................................................................. 30

vii
3.4.2 QUESTIONNAIRES .................................................................................. 31
3.4.3 PEDIGREE ANALYSIS ............................................................................ 35
3.4.4 DATA ANALYSIS...................................................................................... 36
4.0 RESULTS ................................................................................................................... 40
4.1 PARTICIPANT CHARACTERISTICS.......................................................... 40
4.2 RISK PERCEPTION ACCURACY ................................................................ 46
4.3 MHLC AND RISK PERCEPTION ................................................................. 49
4.3.1 DIABETES .................................................................................................. 50
4.3.2 CARDIOVASCULAR DISEASE (CVD).................................................. 52
4.3.3 COLON CANCER...................................................................................... 55
4.3.4 OVARIAN CANCER ................................................................................. 56
4.3.5 BREAST CANCER .................................................................................... 57
4.4 MHLC AND HEALTH BEHAVIOR ANALYSIS ......................................... 59
4.4.1 PHYSICAL ACTIVITY............................................................................. 59
4.4.2 INFORMATION SEEKING...................................................................... 63
4.4.3 MINORITY RESEARCH RECRUITMENT DATABASE.................... 68
5.0 DISCUSSION ............................................................................................................. 70
5.1 RISK PERCEPTION ANALYSIS ................................................................... 70
5.2 HEALTH BEHAVIOR ANALYSIS ................................................................ 77
5.3 STUDY LIMITATIONS ................................................................................... 80
5.4 FUTURE PLANS............................................................................................... 82
6.0 CONCLUSION........................................................................................................... 84
APPENDIX A: RISK PERCEPTION ANALYSIS DATA TABLES .................................... 87

viii
APPENDIX B: IRB APPROVAL FORM ................................................................................ 92
APPENDIX C: MHLC AND SCORING INSTRUCTIONS .................................................. 94
APPENDIX D : PRE SURVEY QUESTIONNAIRE .............................................................. 97
APPENDIX E : POST SURVEY QUESTIONNAIRE.......................................................... 106
APPENDIX F: FOLLOW UP SURVEY QUESTIONNAIRE ............................................. 115
BIBLIOGRAPHY..................................................................................................................... 125

ix
LIST OF TABLES
Table 1. Characteristics of Study Participants .............................................................................. 41
Table 2. Participants' Access to Care............................................................................................ 43
Table 3. Participants' level of concern for developing chronic disease and family history.......... 44
Table 4. Participants' objective risk stratification based on Scheuner et al. criteria..................... 45
Table 5. Participants' risk perception for chronic disease............................................................. 46
Table 6. Risk perception accuracy ................................................................................................ 47
Table 7. Risk perception analysis: summary of statistically significant results ........................... 49
Table 8. Number of participants who maintained or progressed through the stages of physical
activity behavior change and their MHLC subscale classification............................................... 60
Table 9. Number of participants who maintained or increased their level of information seeking
behavior and their MHLC subscale classification ........................................................................ 64
Table 10. Frequency of information seeking behavior and MHLC subscale scores .................... 65
Table 11. Willingness to enroll in Minority Research Recruitment Database and MHLC subscale
scores............................................................................................................................................. 69
Table 12. Diabetes risk perception and comparison of MHLC subscale scores........................... 88
Table 13. CVD risk perception and comparison of MHLC subscale scores ................................ 89
Table 14. Colon cancer risk perception and comparison of MHLC subscale scores ................... 90

x
Table 15. Breast cancer risk perception and comparison of MHLC subscale scores ................... 90
Table 16. Ovarian cancer risk perception and comparison of MHLC subscale scores ................ 91

xi
LIST OF FIGURES
Figure 1. Causes of health disparities ............................................................................................. 5
Figure 2. Multidimensional Health Locus of Control................................................................... 10
Figure 3. Wilson's Model of Information Behavior...................................................................... 24
Figure 4. Health Empowerment Zone.......................................................................................... 28
Figure 5. Scheuner et al. (1997) Risk Stratification Criteria ........................................................ 36

xii
ACKNOWLEDGEMENTS
I would like to thank Dr. Thomas and Dr. Ford for first giving me the opportunity to
work for the Center for Minority Health and the Healthy Black Family Project, and for their
guidance and help throughout my work at the center. It has been an incredibly valuable
experience to work with the members of the HBFP and one that I will carry with me into my
genetic counseling career and into my life. I would like to thank all of the HBFP participants
who have opened up to me about their lives, and their families, and have taught me many
important lessons along the way of what it means to be human. I would also like to thank Mr.
Henry Espy, who shared with me stories about his life, poems, and lessons and always greeted
me with a smile every time I walked through the doors of the Kingsley Center. Through my
experience with the HBFP and the Kingsley Association I have truly learned what it means to be
a community and I will keep this memory with me throughout my life.
I would like to thank Maya Gist and Tatyana Maxenkova for all of their help and patience
with working out the kinks in our data retrieval process. Thanks to Melissa Watson for working
alongside me and thanks to Kim Bylsma and Chris Lauricella who have been a great help to us
since they joined the CMH in August 2007. I know that they will continue to do great work in
the following year.
Thank you to Dr. Wilson who taught me how to do all of the statistical analysis on the
project and always made time to work with me and answer all of my questions. Thank you to

xiii
Robin and Betsy for sharing their experiences with us and teaching us how to listen between the
words.
I would like to thank my classmates for being a big support to me throughout the last two
years. It was a wonderful experience to be able to share in the excitement, the professional
development, and, even, the stress of becoming a new genetic counselor.
Last, but definitely not least, I would like to thank my parents who have always given my
sister and I everything and always taken nothing for themselves. They are the strongest people I
know and have always given me their unconditional love and support, even when we are 2,800
miles apart. I hope that one day I can give back a fraction of what they have given me.

1
1.0 INTRODUCTION
This research was conducted through the Center for Minority Health (CMH) at the Graduate
School of Public Health at the University of Pittsburgh. The CMH was founded in 1994 and has
been under the leadership of Dr. Stephen Thomas since 2000. The CMH is a leader in the
national Healthy People 2010 Campaign to eliminate racial and ethnic health disparities by the
year 2010. The CMH is focused on seven main areas of health disparities: cancer screening and
management, cardiovascular disease, diabetes, HIV and AIDS, infant mortality, immunization,
and mental health. The CMH runs the Healthy Black Family Project (HBFP), headquartered in
the East Liberty neighborhood of Pittsburgh, Pennsylvania. The HBFP is a community-based
outreach intervention project aimed at educating and empowering its members in order to
decrease their risk for common diseases such as hypertension, and diabetes. The aim of the
HBFP is to empower individuals to be in control of their health by providing them with avenues
by which they can lead healthier lives. The HBFP has implemented programs to help individuals
to increase their level of physical activity, increase their level of information seeking behavior,
improve their nutrition, decrease stress level, decrease exposure to tobacco smoke and increase
participation in the medical research.
In order to be most effective, a community based intervention must be tailored to the
needs of the targeted community. This study set out to explore the psychosocial needs of HBFP
participants, primarily their health locus of control. The Multidimensional Health Locus of
Control (MHLC) scale is used to measure the degree to which an individual feels that their own
actions determine their health, or conversely, to which degree external factors such as health

2
professionals, luck, chance and fate are in control of their health. A better understanding of
health locus of control of the community population can facilitate the development of better
tailored outreach efforts, and in turn maximize the success of the HBFP as an intervention. The
following is a literature review to provide a basis for this research and includes information
about racial and ethnic health disparities, the importance of accurate risk perception, and
background on the multidimensional health locus of control and its applications. In addition, this
review outlines the transtheoretical model of behavior change, Wilson’s model of information
seeking behavior, and how these models can be used as outcome measures to search for
relationships between health locus of control and health behavior.
1.1 HEALTH DISPARITIES IN THE US
Recent advances in medical care have allowed for better prevention methods, earlier
detection, and reduced morbidity and mortality from common chronic conditions such as
hypertension, diabetes, cardiovascular disease (CVD), and cancer. Despite recent medical
advances African Americans continue to carry a disproportionate burden of common chronic
disease (Center for Disease Control and Prevention (CDC), 2005; Graham et al. 2006).
African Americans constitute 13.4% (40.2 million individuals) of the U.S. population
(U.S. Department of Health and Human Services (UDHHS), 2007). In 1999, the average life
expectancy for African Americans was 73.1 years, compared to a life expectancy of 77.8 years
for Caucasians (CDC, 2003). In 2003, African Americans had the highest age- adjusted death
rate for CVD, cancer, and diabetes (CDC, 2003). Obesity is a major risk factor for CVD, stroke,
and diabetes. African Americans are more likely to be overweight or obese than Caucasian

3
individuals. In the US in the year 2000, 22% of African American children compared to 12% of
Caucasian children, and 40% of African American adults compared to 29% of Caucasian adults
were classified as overweight or obese. African American women are 1.7 times as likely as
Caucasian women to be obese (CDC, 2006).
In 2002, African Americans had three times as many years of potential life lost, when
compared to Caucasians for both stroke and diabetes (CDC, 2005). Hypertension is a major risk
factor for heart disease, stroke, peripheral vascular disease, and end stage renal disease
(CDC, 2005). Stroke is third most common leading cause of death for both African Americans
and Caucasians. During 1999-2002, African Americans aged 20-74 had higher age adjusted rates
of hypertension per 100,000 than Caucasian individuals (36.8 vs. 23.9 for males; 39.4 versus
23.3 for females) (CDC, 2005, Graham et al. 2006). African Americans are 1.5 times as likely to
have hypertension as Caucasians (CDC, 2006). It is estimated that 40.5% of African Americans
are living with hypertension; however, approximately 25% of African Americans remain
undiagnosed (Graham et al. 2006). African Americans are 50% more likely experience a stroke,
and African American males are 60% more likely to die from a stroke than their Caucasian
counterparts. African American stroke survivors are more likely to become disabled and have
lower quality of life (USDHHS, 2007). In 2004, African American males were 30% more likely
to die from CVD than Caucasian individuals (CDC, 2006).
Diabetes increases the risk for cardiovascular disease, obesity, hypertension, and
dyslipidemia. Individuals with diabetes are at risk for vision loss, kidney damage, and lower limb
amputations (Graham et al. 2006). It is estimated that 18 million Americans have diabetes. The
prevalence of diabetes in African Americans aged 20 and older is 11.4% (Graham et al 2006).
They are 1.8 times as likely to have been diagnosed with diabetes and to have complications

4
from diabetes as their Caucasian counterparts. In 2002, African American men with diabetes
were more than twice as likely to be started on dialysis, 1.8 times as likely to be hospitalized, and
2.2 times as likely to die from complications of diabetes as Caucasian men (USDHHS, 2007).
Most notably, studies have shown that 44% of African Americans with diabetes remain
undiagnosed (Graham et al. 2006).
The health disparities gap between African Americans and Caucasians in death rates from
all cancers widened from 1975 until the early 1990s. Although, this gap has somewhat narrowed,
it still remains bigger than it was prior to 1975 (Ward et al. 2004). Death rates from colorectal
cancer, prostate cancer, and breast cancer are responsible for the majority of this disparity (Ward
et al. 2004). Overall, an African American male is 1.4 times more likely to die from cancer and
an African American female is 1.2 times more likely to die from cancer than their Caucasian
counterparts (Ward et al. 2004). African American men are 1.4 times as likely to have lung and
prostate cancer, 2.4 times as likely to die from prostate cancer, and twice as likely to have
stomach cancer compared to Caucasian men (CDC, 2006).
Although, African American women are 10% less likely to be diagnosed with breast
cancer, they are a staggering 36% more likely to die from it compared to Caucasian women
(CDC, 2006). African American women are 2.3 times as likely to be diagnosed with stomach
cancer, and 2.2 times as likely to die from stomach cancer as Caucasian women (CDC, 2006). It
is estimated that 40% of the difference in survival between African American and Caucasian
women with breast cancer is explained by the more advanced stage of disease at which African
American women are diagnosed (Barroso et al. 2000).
There are multiple factors responsible for the health disparities experienced by the
African American population. These factors are summarized in Figure 1 and include

5
socioeconomic status (education, employment and income), lifestyle behaviors (physical activity
and diet), social environment (educational and economic opportunities, racial discrimination, and
social support systems), access to health care (such as preventative screening services), and
doctor patient communication (CDC, 2005; Matthews, 2002).
Socioeconomic Status
Lifestyle factors:Exercise
DietPreventative behaviors
Patient-doctor communicationAccess to care
Social environment:Racial discriminationEconomic opportunity
Educational opportunitySocial environment
Cultural factors
Socioeconomic Status
Lifestyle factors:Exercise
DietPreventative behaviors
Patient-doctor communicationAccess to care
Social environment:Racial discriminationEconomic opportunity
Educational opportunitySocial environment
Cultural factors
Figure 1. Causes of health disparities
Socioeconomic status (SES) has long been noted to be a cause of health disparities. Both
income and wealth are significant predictors of the likelihood to develop a chronic condition;
however, SES plays an even greater role in the functional ability of an individual once they have
already been diagnosed with a chronic condition. Kington & Smith (1997) looked at the SES and
racial and ethnic differences of a sample of 9744 men and women aged 51 to 61. The findings of

6
this study showed that SES did not play a large role in the prevalence of disease; however, SES
played a significant role in the functional health status of individuals once they had been
diagnosed with hypertension, diabetes, CVD, and arthritis. SES is associated with smoking, lack
of physical activity, and poor diet, all of which are factors that may increase the complications of
chronic disease (Kington, R.S. and Smith, J.P. 1997).
Lower SES is related to access to health care. Individuals who are of lower SES are less
likely to get the necessary treatment, and are less likely to get treatment at earlier stages of the
disease. Within SES, there may be structural barriers such as lack of health insurance, lack of
financial support, geographical distance to treatment facilities, and access to transportation that
prevent individuals from getting the care they need (Ward et al. 2004). According to Ashton et
al. (2003) African Americans use health services at lower rates than Caucasians. Disparities in
health care service use are in part caused by limited access to care. In general, when compared to
Caucasians, African Americans have lower incomes, less education, lower rates of health
insurance coverage, and greater dependence on public health care programs (Ashton et al. 2003).
All of these factors interfere with readily available access to services.
Disparities in early detection of cancer are seen in the rate of uptake of recommended
screening tests and likelihood to be diagnosed with cancer at a later stage (Ward et al. 2004).
African American women are consistently less likely to have a mammogram, and colorectal
screening when compared to Caucasian women. Sixty-eight percent of African American
women reported having a mammogram within the last two years compared to 72% of Caucasian
women. Approximately 15% of African American women have had a Fecal Occult Blood Test
compared to 18.3% of Caucasian women. Similarly, 27% of African American women
have had an endoscopy compared to 31.3 of Caucasian women (Ward et al. 2004).
African American women are more likely to be diagnosed with late stage cancers and less likely

7
to survive the cancer, than Caucasian women despite the fact that the incidences of all cancers
are higher in white women (Ward et al. 2004). The poorer survival rates have been attributed
to access to cancer treatment rather than tumor characteristics. African American women with
Stage I and II breast cancer were less likely to be treated with surgery than whites even if they
have the same insurance and income level. African Americans with cervical cancer are more
likely to go undiagnosed and receive no treatment. Caucasians are more likely to receive
aggressive treatment for colorectal cancer (Ward et al. 2004).
In addition to SES, and limited access to care health disparities are due to problems with
patient doctor communication (Ashton et al. 2003). Even though African Americans may have
the same access to care, diagnosis, and level of illness severity; they are less likely to use
services that require a doctor’s order (e.g. invasive procedures, surgical procedures, and
hospitalization). The significance of this finding is that some disparities are present not as a
result of poor access to care, but rather as a result of the health care interaction that takes place
after an individual gets to the doctor’s office (Ashton et al. 2003). A previous study found the
presence of a subconscious referral bias when doctors were presented with videotapes of 4
patients whose clinical characteristics were held constant, but gender and race varied. The study
found that doctors are somewhat less likely to refer African American women for cardiac
catheterization (Schulman et al. 1999).
Another hypothesis that supports that the health care interaction is a contributing factor to
health disparities is the communication hypothesis. This hypothesis states that in order for an
individual to make informed health care decisions there should be interactive dialogue present
between the doctor and patient (Ashton et al. 2003). Such dialogue may be more problematic

8
when the doctor and patient are of different ethnic and cultural backgrounds. Ashton et al. (2003)
hypothesizes that doctors tend to have poorer interpersonal skills with minority patients leading
them to provide less information, and utilize a less participatory decision making style in their
counseling. A 1988 meta-analysis of the influence of race and ethnicity on doctor-patient
communication found that African Americans and Latinos receive poorer care during the
physician visit than do Caucasians (Hall et al. 1988). African Americans rated their level of
participation during physician visits to be lower than did Caucasian individuals (Kaplan et al.
1995). This research suggests that one step in eliminating health disparities is to improve
patient-doctor communication, and facilitate higher levels of patient participation in discussions
between minorities and their health professionals.
Lack of information seeking behavior is another factor that widens the health disparities
gap. African Americans are less likely to participate in information seeking behaviors (Matthews
et al. 2002). Health information seeking behavior involves searching for information about health
conditions. Health information seeking behaviors include performing internet searches, reading
about health information in books, brochures or magazines, and asking the doctor for more
information about health conditions. Health information seeking is an important feature of
making well-informed medical decisions. Studies show that individuals who are better informed
regarding their illness are better able to maintain a sense of control and cope with the uncertainty
of the illness and its treatments (Matthews et al. 2002). Well-informed patients are more likely to
be compliant when it comes to following their treatment and management plan, and tend to
recover from an illness more quickly and thoroughly than those who are poorly informed
(Matthews et al. 2002).

9
Given the compelling evidence for health disparities in the African American population
and the causes of these disparities, it is imperative that public health interventions be tailored to
individuals to address these causes in order to close the health disparities gap. Exploring the
health locus of control of African Americans can shed light on how to best tailor interventions to
the psychosocial needs of the participant in order to encourage physical activity, facilitate
information seeking behavior, improve risk perception, and build culturally sensitive
communication between medical professionals and patients.
1.2 MULTIDIMENSIONAL HEALTH LOCUS OF CONTROL
1.2.1 DEFINITION OF MHLC
The Multidimensional Health Locus of Control (MHLC) scale is designed to assess the
degree to which an individual feels that their actions or other external factors out of their control
are responsible for their health status (Figure 2). The MHLC has been used as a predictor of
health behavior to explore how to best tailor interventions to target populations. The MHLC
consists of three different subscales each of which assesses the three specific factors known to
determine health behavior: internality, powerful others, and chance. Internality is the degree to
which an individual feels they are in control of their own health or how their personal decisions
and actions determine their health status. The Chance subscale is designed to assess the degree to
which individuals feel that chance occurrences determine their health status. The Powerful

10
Others scale is designed to assess the degree to which an individual feels that health
professionals, family members, religious figures, and friends influence their health status
(Wallston, Wallston & DeVellis, 1978).
MULTIDIMENSIONAL HEALTH LOCUS OF CONTROL (MHLC)Definition: Health locus of control is the degree to which an individual feels that their health is within their own control or within the control of external factors such as chance, luck, and other people.
•Externals: Individuals who feel that their health is the result of outside factors (i.e. health professionals, God, chance events).
•Internals: Individuals who feel that their health is the result of their own actions(i.e. diet, exercise).
Three Dimensions of Health Locus of Control:•Internality scale: The degree to which an individual feels their health is the result of their actions.
“If I get sick it’s my own behavior that determines how soon I get well again.”
•Chance scale: The degree to which an individual feels their health is the result of fate, luck, and chance events.
“If it’s meant to be I will stay healthy.”
•Powerful others scale: The degree to which an individual feels their health is controlled by health professionals, religion, and family members.
“Whenever I don’t feel well, I should consult a medically trained health professional.”
Figure 2. Multidimensional Health Locus of Control

11
1.2.2 DEVELOPMENT OF MHLC
The theoretical framework of the MHLC is rooted in Rotter’s Social Learning Theory
and Rotter’s Locus of Control Theory (Wallston, Wallston, DeVellis, 1978). In order to better
understand the theoretical framework of the MHLC, it is important to review Rotter’s Social
Learning Theory and Rotter’s Locus of Control Theory.
Rotter’s Social Learning Theory
Rotter’s Social Learning Theory (SLT) states that an individual’s behavior is a function
of their behavior potential, their expectations, and the reinforcement value of that behavior
(Means, 2007). Behavior potential is the likelihood that an individual will perform a particular
behavior in a given situation. For any situation there are a variety of behaviors an individual
could engage in, and each behavior has its own specific potential or probability of occurrence.
Expectancy is the degree to which an individual feels a particular behavior will lead to a
particular outcome. In other words, how strongly does this individual believe that the behavior
they engage in will lead to what they expect to happen? Reinforcement value is how much the
individual desires a particular outcome. In other words, the reinforcement value is a direct
measure of the benefit of the outcome for the individual. SLT is summarized by the following
equation:
BP= f (E x RV)
Where BP is behavior potential, E is expectancy and RV is reinforcement value.
For example, if an outcome has a low reinforcement value (something that the individual
does not strongly desire to happen), and the individual has a low expectancy (they do not
strongly expect that this behavior will lead to the desired outcome) the likelihood that this

12
individual chooses to engage in this behavior is low, or the behavior potential is low. Conversely,
if an outcome has a high reinforcement value (something that the individual strongly desires to
happen), and the individual has a high expectancy that this particular behavior really will lead to
the desired outcome, then the likelihood that this individual chooses to engage in this behavior is
high, or the behavior potential is high.
Rotter’s Locus of Control Theory
Rotter defined locus of control (LOC) as people’s general, cross situational beliefs about
what determines whether or not they get reinforced in life (Means, 2007). Individuals with an
internal locus of control believe that the outcome of a situation is within their own personal
control more than it is in the control of external factors. Hence, an individual with an internal
locus of control is more likely to have a higher expectancy that their particular behavior will lead
to a particular outcome. Individuals with an external locus of control believe that external factors
play a greater role in the outcome of a situation than internal factors such as their own decisions
and actions. Therefore, individuals with an external locus of control are more likely to have a
lower expectancy that their behavior will lead to a particular outcome. In other words, an
individual’s behavior outcome could be predicted based on their locus of control, since the
degree to which an individual feels that they have control of a situation is related to their
expectancy that a particular behavior will lead to a particular outcome.
Rotter believed that SLT could operate on two specific levels. The first level is situation
specific. The second level is broader in context, in that an individual’s behavior potential could
be generalized across situations. Rotter stated that an individual’s Locus of Control (LOC)
operated on the latter, broader level, context and could be generalized across situations (Means,
2007).

13
An individual’s locus of control (LOC) can be classified along a spectrum of internality
and externality. In 1966, Rotter developed the I-E (Internality- Externality) Scale. The I-E scale
is a cross-situational scale designed to assess internal vs. external locus of control orientation and
has been used in multiple studies worldwide as a predictor of behavior (Means, 2007).
The Health Locus of Control Scale
By the 1970s, Rotter’s I-E Scale became widely used as a predictor of behavior in
medicine. The Health Locus of Control Scale was developed in 1976 by Kenneth Wallston and
Barbara Wallston in order to increase the predictability of LOC in health related situations
(Wallston, 1992). It was based on Rotter’s belief that health behaviors were closely intertwined
with an individual’s personal experience in a given situation and that an individual’s health locus
of control beliefs are not as stable as an individual’s generalized LOC beliefs (Wallston,
Wallston, Kaplan, & Maides, 1976). Wallston felt that Rotter’s I-E scale might not have been the
most appropriate measure of LOC since it was designed as a generalized expectancy construct.
The HLC was designed to assess internality and externality in a health situation specific manner.
The HLC construct differs from the LOC construct in that the LOC construct is thought to be a
stable personality trait generalized across various situations, whereas the HLC construct is a
situation and experience dependent state that can change for an individual with new experiences
and in new situations (Wallston, Wallston, Kaplan, & Maides, 1976).
The original HLC scale was an 11 item Likert scale of five internally worded, and six
externally worded items. It was scored such that high scores represented an external belief that
one’s health status was due to fate, luck, and chance and low scores represented an internal
orientation in which one stays or becomes healthy or sick as a result of his or her behavior.
Wallston and Wallston showed that the one-dimensional HLC scale in conjunction with a

14
measure of health value (a measure of how important health status is to an individual) was a
better predictor of health related behaviors and outcomes, than the generalized Rotter’s I-E scale
(Wallston, Wallston et al. 1976; Wallston, Maides, and Wallston 1976; Wallston, 1992).
Multidimensional Health Locus of Control
In 1978, Wallston developed the Multidimensional Health Locus of Control in response
to his own findings with the HLC scale consisting of two dimensions, and Levenson’s findings
which showed that studying internality, fate and chance, and powerful others separately could
further improve the scales as predictors of health outcomes (Wallston, Wallston, and De Vellis
1978). Since its development, the MHLC has been widely used in numerous studies and overall
validity is dependent on the subscale being utilized, the theoretical context in which it is used,
and the statistical analysis conducted to evaluate the data. The MHLC scale is an effective
measure that addresses the multidimensional nature of human behavior and has the potential to
provide researchers with valuable insights for designing health programs to tailor to these
different dimensions, and in turn maximize the impact of such programs (Wallston, 1976;
Wallston, 2005).
Since its development, the MHLC has been evaluated in numerous studies of health
behavior. Earlier studies conducted in the late 1970s and 1980s showed contradictory results of
the MHLC as a predictor of health behavior. Some studies supported that the MHLC was a
valuable predictor of health behavior while others did not. Since the 1970s and 1980s the MHLC
scales have been assessed in a great diversity of studies. There is now a more substantial body of
evidence that the MHLC subscales are a useful predictor of health behavior when studied in
those populations who place a high value on their health. For the purposes of the current study

15
this review will focus on some large scale general health behavior studies as well as the disease
specific studies relevant to our analysis.
MHLC and Health Behavior
Norman et al. (1998) performed a large scale analysis of MHLC, health value, and
likelihood to participate in health behaviors in 11,632 individuals from the UK. Individuals
scoring high on the internality scale were more likely to participate in a higher number of health
behaviors. Those who believed that chance and fate played a large role in their health status were
less likely to engage in preventative health behaviors. A strong belief in powerful others was
found to be related to performance of fewer health behaviors reflecting the belief in the ability of
the medical professional to cure illness and protect health.
Bronson et al. (1981) as cited in Wallston & Wallston (1982) found that those individuals
scoring high on the internality scale were higher on measures of health behavior, knowledge
about health problems, and health plans than low scorers. Fischberg (1979) found a non-
statistically significant correlation that internal women were more likely to practice self breast
exams than external women. Dishman et al. (1980) showed that internal individuals were more
likely to stay in a physical activity program than persons who were external. Grady (1981) as
cited in Wallston & Wallston (1982) found that women who agreed to participate in her breast
self examination study had higher powerful others and internality scores than those who refused
to participate, possibly supporting that those who believe that health can be controlled by
powerful others are more likely to participate in health education programs. Kaplan and Cowles
(1978) found that internals reduced their cigarette consumption and were more likely to maintain
the reduction than externals.

16
MHLC and Information Seeking
Wallston, Allston, and Maides (1976) found that among college students asked to pretend they
had been diagnosed with hypertension, internals were more willing to read a greater volume of
hypertension brochures than externals. Toner and Manuck (1979) surveyed individuals
undergoing blood pressure screening. After having undergone the screening subjects were
allowed to choose from 23 hypertension pamphlets. Internals chose significantly more pamphlets
than externals. Sproles (1977) found that among renal dialysis patients, internals were better
informed about their condition, were interested in learning more information, and were more
willing to attend patient education classes than externals. DeVellis et al. (1980) conducted a
nationwide survey of individuals with epilepsy and found that the best single predictor of
information seeking behavior was a high powerful others score. Hashimoto and Fukuhara (2004)
surveyed 3395 Japanese individuals and found that those who scored low on the powerful others
scale were more likely to be active information seekers. The contradictory results of these two
studies may be attributed to cultural differences, study population differences, and temporal
differences. Hashimoto and Fukuhara (2004) studied a non patient population whereas DeVellis
et al. (1980) studied patients with epilepsy. Individuals who have a clinical diagnosis of epilepsy
may have different information needs than the general population. Cultural differences between
Japanese and Americans may influence information seeking behavior. Lastly, the contradictory
results of these two studies may be due to temporal differences. Personal access to health
information resources was quite limited in the early 1980s when compared to the 21st century, as
this was before the advent of the internet.

17
MHLC and Adherence to Management Recommendations
Levin and Schulz (1980) found that renal dialysis patients were more likely to follow the
recommended diet if they scored high on internality. Goldstein (1980) found that diabetics were
more likely to adhere to management recommendations if they scored high on internality and
powerful others scales. Hatz (1978) found that high powerful others renal dialysis patients were
less likely to gain weight between treatments. Marci (1980) found that high powerful others
individuals had a smaller time delay in the time between experiencing chest pain and contacting
a health professional.
MHLC and Disease Specific Studies
Burish et al. (1984) concluded that following relaxation training and/or biofeedback,
chemotherapy patients with a high external health locus of control experienced less distress and
anxiety, lower pulse rates, lower blood pressure, and were less depressed after treatment,
suggesting that an external health locus of control maybe advantageous in situations where little
personal control is possible.
Soler-Vila, Kasl, and Jones (2003) studied psychosocial factors as predictors of breast
cancer prognosis in African American and white women and found that MHLC was unrelated to
survival prognosis. Nemcek (1989) found that women who strongly believed that health
professionals controlled their health were less likely to adhere to recommended guidelines for
breast self examination.
Barroso et al. (2000) compared breast cancer beliefs of Caucasian and African American
women. African American women were more likely to believe in chance and to depend on
powerful others. Perceived susceptibility to cancer, doubts about the value of early diagnosis,
and beliefs about the severity of the diagnosis were all significantly related to high powerful

18
others scores in African American women. African American high powerful others scorers
believed that early diagnosis lead to longer time to worry about illness, and that all women could
be cured. African American women who scored high on the chance scale were more likely to
believe that all women diagnosed with breast cancer will die. Barroso et al. (2000) concluded
that African American women were more likely to be external in their health beliefs due to
stronger religious beliefs.
Sturmer et al. (2006) performed a prospective cohort analysis of MHLC and chronic
disease development in a German study population of men and women aged 40-65. The findings
revealed that individuals with a high internal locus of control had a decreased risk of myocardial
infarction, most likely related to willingness to participate in preventative health behaviors.
Hayes et al. modified the MHLC into a Diabetes Locus of Control scale and administered the
measure to African American patients with type 2 diabetes. The resulting findings showed that
those individuals who strongly believed chance determined their health status were more likely
to have poor glycemic control over a period of 6 months.
Collectively, health locus of control studies have shown that individuals who tend to be
more internal in their health beliefs are more likely to participate in preventative health behaviors
than those individuals who are external in their health beliefs.
Most studies of MHLC in African Americans have been in patient populations in
individuals who have already been diagnosed with a particular health condition. This study will
evaluate MHLC, risk perception and health behavior in African Americans in a community
setting in order to improve community based prevention efforts.

19
1.3 THE IMPORTANCE OF ACCURATE RISK PERCEPTION
An individual’s risk perception is an important contributor to behavior change. Empirical
observations from blood pressure screenings, follow up appointments, and medical check ups of
hypertension control, smoking reduction, dieting, and flu vaccination have shown that there is a
strong relationship between perceived risk and likelihood to participate in a preventative
behavior (Graham, 2006). Graham et al. (2006) states that frameworks of behavior change such
as the Health Belief Model, Protection and Motivation Theory, and the Precautionary Adoption
Process, concur that perceived vulnerability is the major driving force for protective behaviors.
Keeping the importance of accurate risk perception in mind, studies have shown that
most individuals tend to inaccurately estimate their risk as a result of “perceived invulnerability”
(Graham et al. 2006). In general individuals estimate their risk to be lower than that of the
average person like themselves (Graham et al. 2006). The danger of inaccurate risk perception
lies in its effects on preventative behavior. Individuals who underestimate their risk are likely to
put off seeking care, less likely to follow medical recommendations, and less likely to engage in
preventative behaviors. Individuals are more likely to disregard symptoms and warnings as they
regard these warnings to be more applicable to other individuals (Graham et al 2006). On the
other side of the spectrum, individuals who overestimate their risk may experience undue burden
and excess anxiety. This may lead to avoidance behaviors, in turn interfering with proper
adherence to medical recommendations, less frequent visits to the doctor, and putting off seeking
care until later stages of disease (Graham et al. 2006). In order to design culturally appropriate
community interventions public health professionals must take into account community attitudes
and cultural as well as psychosocial factors that determine how an individual chooses to perceive
their risk. MHLC scales can be used to study how external and internal locus of control affects

20
risk perception and may have important implications for how to better tailor risk awareness and
education efforts towards the participants of the HBFP.
1.4 MEASURES OF HEALTH BEHAVIOR
In order to determine if a community based intervention project is effective it is important
to assess if the target population is improving in the direction of the goals of the intervention. A
successful intervention is one in which participants are meeting the goals the intervention aims to
accomplish. A previous study used MHLC to evaluate how to better tailor community oriented
interventions to patients who had already been diagnosed with diabetes and heart disease
(Plescia, 2004). Researchers used the Community Oriented Primary Care model to apply public
health techniques in a primary care setting. The goal of the project was to train lay health
advisors within the community as “catalysts to promote healthy diet patterns, increased exercise
and smoking avoidance and cessation (Plescia, 2004).” MHLC and the Transtheoretical Model of
Behavior Change were used to assess how health promotion can be tailored to the needs of the
community. The findings of the study revealed that participants 65 years and older with diabetes
and hypertension scored higher on powerful others scale than their counterparts. Powerful others
were defined as physicians and ministers. These findings were presented to lay health advisors
who in turn increased efforts to create partnerships with local churches in for purposes of health
promotion.
The goals of the HBFP are to increase and help maintain physical activity, improve risk
perception, encourage information seeking behavior, and increase the participation of African

21
Americans in medical research. The following section is a review of the Transtheoretical Model
of Behavior Change, Wilson’s model of information seeking behavior, and the Center for
Minority Health’s Research Recruitment Database, and how these models, and rate of enrollment
in research can be used to explore how the HBFP can better tailor its interventions to external
and internal individuals.
1.4.1 THE TRANSTHEORETICAL MODEL
The transtheoretical model of behavior change (TTM) attempts to explain how and when
people are likely to change their exercise behavior. TTM was originally used to better understand
addictive behaviors and was later explored as a framework for exercise behavior change. The
TTM has been successfully used to study physical activity behavior change (Marshall and
Biddle, 2001). The model treats behavior change as something fluid and changing as opposed to
an “all or nothing” behavior (Marshall and Biddle, 2001). It is based on empirical evidence that
individuals progress through several stages of change when attempting to change their exercise
behaviors and become more physically active. There are five stages that individuals move
through as they work towards a more physically active lifestyle. These five stages are: pre-
contemplation, contemplation, preparation, action and maintenance. In the pre-contemplation
stage individuals have no intention of becoming physically active. In the contemplation stage
individuals are thinking about becoming physically active within the next 6 months. In the
preparation stage individuals have moved to making plans and small changes in behavior in
order to become physically active but have not met the criteria of actually being physically
active. In the action stage, individuals have met the criteria to become physically active, but have

22
not been active for an extended period of time. In the maintenance stage individuals have
become physically active and have maintained their level of physical activity for at least 6
months. Traditionally it has been thought that individuals move through the stages of change in a
linear fashion, however recent work has shown evidence that individuals may regress and
progress through the stages of change in a cyclical fashion (Marshall and Biddle, 2001). Marshall
and Biddle’s meta- analysis of TTM looked at 71 published studies that support the use of TTM
as a valid measure of physical activity behavior change.
Recent work at the CMH has assessed the effectiveness of the family health history
session to encourage physical activity behavior change using TTM (Dudley, 2006). Individuals
did not progress through the stages of exercise behavior change following the family history
session; however, individuals who had an annual income of less than $20,000, who perceived
themselves to be obese, who intended to increase their level of physical activity, who had a
moderate risk for any disease, and who perceived themselves to be at high risk for any disease
were more likely to progress through the stages of changes than other individuals (Dudley,
2006). The current study will build on previous research to evaluate whether or not likelihood to
progress through the stages of exercise behavior change is related to health locus of control.
1.4.2 WILSON’S MODEL OF INFORMATION SEEKING BEHAVIOR
Wilson’s 1981 Model of Information Behavior is a theoretical framework that
hypothesizes that information needs arise out of the needs perceived by the information seeker.
When an individual has a need for information he/she utilizes informal and formal resources in
order to satisfy this need. If the individual is not successful at completely satisfying the need for
information he then has to repeat the search process (Wilson, 1999).
23
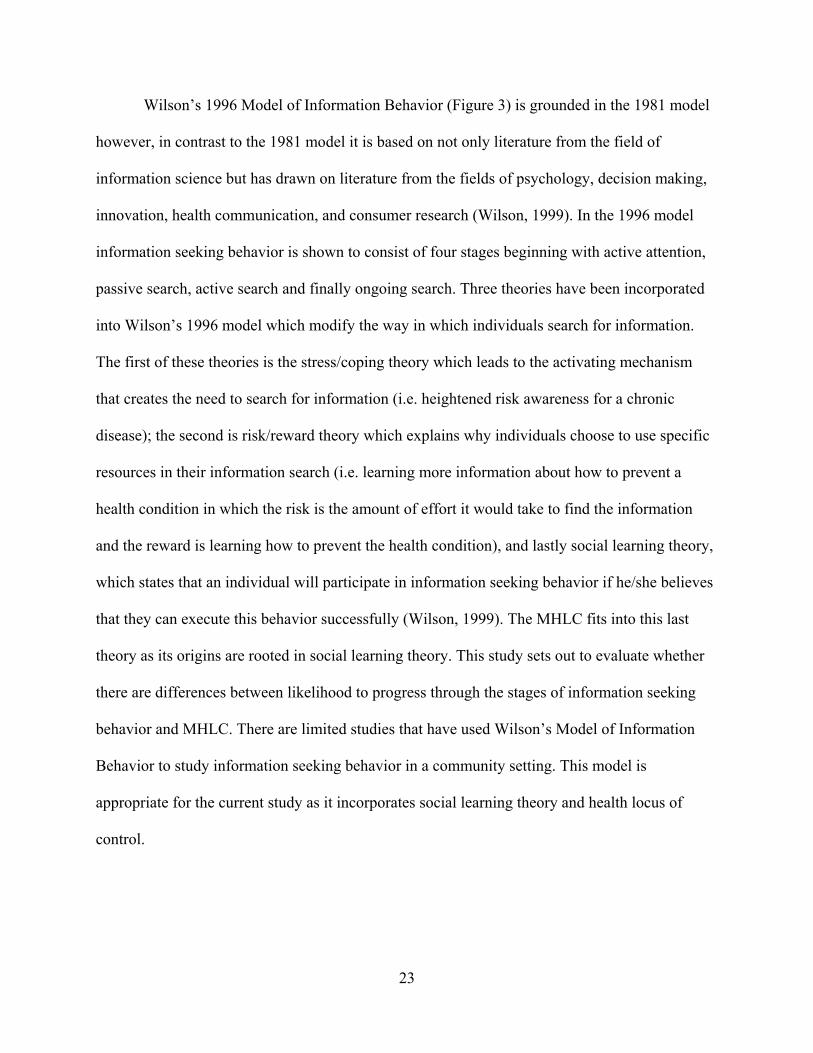
Wilson’s 1996 Model of Information Behavior (Figure 3) is grounded in the 1981 model
however, in contrast to the 1981 model it is based on not only literature from the field of
information science but has drawn on literature from the fields of psychology, decision making,
innovation, health communication, and consumer research (Wilson, 1999). In the 1996 model
information seeking behavior is shown to consist of four stages beginning with active attention,
passive search, active search and finally ongoing search. Three theories have been incorporated
into Wilson’s 1996 model which modify the way in which individuals search for information.
The first of these theories is the stress/coping theory which leads to the activating mechanism
that creates the need to search for information (i.e. heightened risk awareness for a chronic
disease); the second is risk/reward theory which explains why individuals choose to use specific
resources in their information search (i.e. learning more information about how to prevent a
health condition in which the risk is the amount of effort it would take to find the information
and the reward is learning how to prevent the health condition), and lastly social learning theory,
which states that an individual will participate in information seeking behavior if he/she believes
that they can execute this behavior successfully (Wilson, 1999). The MHLC fits into this last
theory as its origins are rooted in social learning theory. This study sets out to evaluate whether
there are differences between likelihood to progress through the stages of information seeking
behavior and MHLC. There are limited studies that have used Wilson’s Model of Information
Behavior to study information seeking behavior in a community setting. This model is
appropriate for the current study as it incorporates social learning theory and health locus of
control.

24
Figure 3. Wilson's Model of Information Behavior
1.4.3 MINORITY RESEARCH RECRUITMENT DATABASE
Current research has shown that African Americans are underrepresented in clinical
research studies making the relevance of research results to African Americans of uncertain
significance. It is imperative that efforts be put forth to increase African American participation
in research studies in order to bridge the health disparities gap. Current literature has shown
evidence that most African Americans have never been asked to participate in a research study
(Thomas et al. 2001). The Minority Research Recruitment Database was designed to increase
enrollment of African Americans in medical research studies in the Pittsburgh area.
There are several barriers to African American enrollment in medical research studies.
These barriers can be broken down into 1) the historically rooted barriers experienced by the

25
African American community, and 2) the barriers perceived by the medical community that
prevent them from informing African Americans of studies in the first place. The best known
example of mistrust of the medical community is the Tuskegee syphilis experiment (Outlaw,
Bourjolly, & Berg, 2000). Other examples include fear of medical treatment, distrust of
researchers, and distrust of the government (Mabunda Temple as cited by Outlaw, Bourjolly, &
Berg, 2000). The barriers perceived by the health professional that prevent them from informing
the participant in the first place include: the concern that clinical trials will be too complex for
the patient to understand, the patient may have trouble seeing the value of research, and the
patient’s fear of the health system (Outlaw, Bourjolly, & Berg, 2000).Another interesting barrier
perceived by researchers is that African Americans are “hard to reach” (Thomas et al. 2001).
The Minority Research Recruitment Database was created by the CMH in order to
increase participation of African Americans in research studies. Previous CMH thesis work
assessed the factors that determined whether or not individuals chose to enroll in the CMH
Minority Research Recruitment Database. Approximately 80% of individuals enrolled in the
database and 20% declined enrollment when offered the opportunity (Vogel, 2005). The rate of
enrollment has stayed consistent with Vogel’s 2005 findings with approximately 80% of
individuals enrolling in the database. This study will focus on whether or not MHLC is related to
willingness to enroll in the Minority Research Recruitment Database.

26
2.0 SPECIFIC AIMS OF STUDY
The research programs conducted by the CMH were started in order to assess African
Americans’ response to the family health history. This study is funded by a grant to Stephen B.
Thomas from the National Institutes of Health: National Center on Minority Health and Health
Disparities Export (NCMHD) which designated the CMH as a Center of Excellence in
Partnership, Outreach, Research, and Training (EXPORT). The study received approval by the
University of Pittsburgh’s Institutional Review Board (IRB) in May 2004, with subsequent
renewal in 2005, 2006 and 2007 (Appendix B) and modification in September 2007. Upon the
expiration of this grant in September of 2007, the study became funded as the CMH Research
Center of Excellence on Minority and Health Disparities @ UPITT also funded by NCHMD.
The specific aims of the study are: 1. To determine how knowledge of family health history
influences the accuracy of individual risk perception; 2. To determine how knowledge of family
health history influences African Americans willingness to participate in clinical research
studies; 3. To determine how knowledge of family health history influences “information
seeking” behavior; and 4. To determine how the process of completing a family health history
affects an individual’s level of physical activity. The first two aims and the fourth aim of this
study have been addressed by the research of three former genetic counseling students (Murphy,
V. 2005; Vogel, K. 2005; Dudley, R. 2006). This thesis will address all four aims of the study.
27
3.0 METHODS
3.1 HEALTHY BLACK FAMILY PROJECT
The Healthy Black Family Project (HBFP), situated within the Center for Minority
Health (CMH), is a multi-disciplinary community demonstration project dedicated to bridging
the health disparities gap in the African American community of Pittsburgh, Pennsylvania. The
Healthy Black Family Project has implemented interventions targeted at improving physical
activity levels, nutrition, mental wellness, smoking cessation, family health history awareness,
stress management, and self management of chronic disease within the context of a community-
oriented, socially supportive environment.
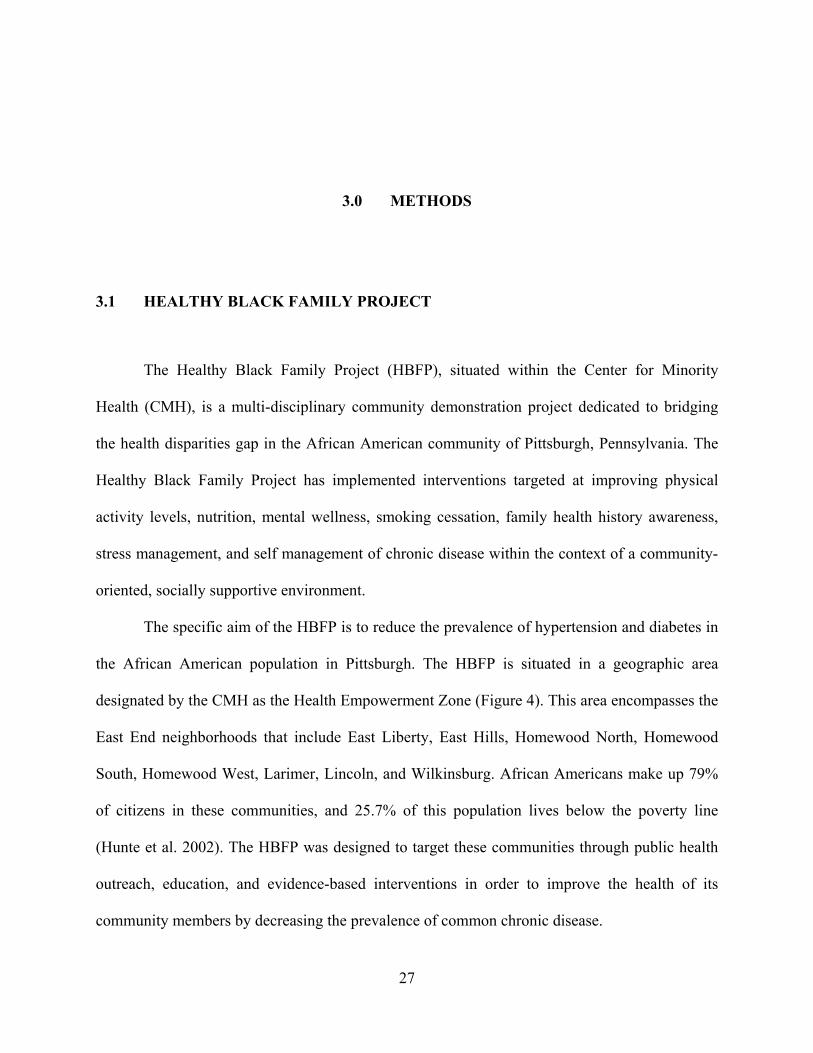
The specific aim of the HBFP is to reduce the prevalence of hypertension and diabetes in
the African American population in Pittsburgh. The HBFP is situated in a geographic area
designated by the CMH as the Health Empowerment Zone (Figure 4). This area encompasses the
East End neighborhoods that include East Liberty, East Hills, Homewood North, Homewood
South, Homewood West, Larimer, Lincoln, and Wilkinsburg. African Americans make up 79%
of citizens in these communities, and 25.7% of this population lives below the poverty line
(Hunte et al. 2002). The HBFP was designed to target these communities through public health
outreach, education, and evidence-based interventions in order to improve the health of its
community members by decreasing the prevalence of common chronic disease.

28
.
Zip Code Neighborhood
15147 Penn Hills
15206 Lincoln, Lemington, Belmar, East Liberty,
Larimer, Garfield
15207 Glen Hills
15208 Point Breeze North, Homewood South,
Homewood South, Homewood West
15213 Terrace Village, Upper Hill
15219 Crawford Roberts, Terrace Village, Middle
Hill, Bedford Dwellings, Upper Hill
15221 Homewood North, East Hills, Wilkinsburg,
15224 Garfield
Figure 4. Health Empowerment Zone
3.2 FAMILY HEALTH HISTORY INITIATIVE
The Family Health History Initiative is one part of the HBFP designed to raise awareness
about risks for common disease and educate individuals as to how they can reduce these risks.
The self reported family health history is an accurate measure used to identify individuals who
may be at increased risk for developing chronic diseases such as hypertension, diabetes, CVD,

29
and cancer (Scheuner et al. 1997). Graduate genetic counseling students offer the family health
history session to all HBFP participants by calling each participant and providing a brief
overview of the family health history session. If the participant is interested they set up an
appointment with the student to meet at a mutually agreed upon location such as the Kingsley
Community Center. During the session the student interviews the participant about their family
health history and constructs a diagram of the family tree known as a pedigree. Once the
pedigree is complete the participant is provided with a risk assessment, based on Schuener et al.
(1997) criteria, for high blood pressure, diabetes, Alzheimer’s disease, cardiovascular disease,
breast cancer, colon cancer, ovarian cancer, prostate cancer, and lung cancer. Participants are
then counseled about how they can decrease their risk for these chronic conditions through diet,
exercise, and regular health screenings. At the close of the session the participant is provided
with a hand drawn copy of the pedigree. After the completion of the family health history
session a resource packet is mailed to the participant’s home. The contents of the packet include
a computer generated pedigree (produced using Progeny software), a certificate of appreciation,
and targeted health information.
3.3 MINORITY RESEARCH RECRUITMENT DATABASE
At the completion of the family health history, the participants were informed about the
Minority Research Recruitment Database. Interested individuals sign an informed consent to
have their family health history entered into the database. The database is occasionally queried
for individuals who would qualify for clinical research studies in the Pittsburgh medical

30
community based on their family history. Information is then sent to the homes of eligible
individuals at which time they can decide as to whether or not they would like to contact the
investigators and enroll in the study. Participant information is never disclosed to investigators.
The participant has the right to withdraw their family history from the database at any time.
3.4 ASSESSING MHLC, RISK PERCEPTION, AND HEALTH BEHAVIOR
3.4.1 PROCEDURE
Every participant who completed a family health history session was given the option to
participate in our research study. At the beginning of each session, the participant was informed
that the study consisted of two 10-15 minute surveys and a third follow up survey conducted via
telephone. It was explained that the surveys include questions to better understand if the family
health history session can improve risk perception for chronic disease, MHLC, and opinions on
medical research. If the participant was interested then informed consent was obtained which
included a discussion of the specific aims, structure, benefits, and risks of the study.
Once the participant signed the informed consent document, the pre-survey (Appendix D)
was administered. The pre-survey consists of questions about demographics, risk perception,
physical activity habits, and the MHLC scale. After completion of the pre survey, the student
went onto interview the participant about their family health history. Information was gathered
for three generations. The participant was asked about their children, siblings, parents, aunts,
uncles, and grandparents. Age, health status, any standing diagnoses and age of diagnosis were

31
recorded on the pedigree. If the family member was deceased, age of death and cause were
documented in the pedigree. After construction of the pedigree, the student provided a risk
assessment for high blood pressure, diabetes, cardiovascular disease, Alzheimer’s disease, and
several types of cancer (breast, ovarian, colon, prostate, and lung). Once the risk assessment was
complete, and the participant’s questions were answered, the post session survey (Appendix E)
was administered. The post session survey asks questions regarding risk perception, intent to
change physical activity habits, opinions on medical research, and information seeking behavior.
Upon completion of the survey the participant was given the opportunity to enroll in the minority
research recruitment database. Those individuals that were interested were provided informed
consent regarding the specific aims, structure, risks, and benefits of enrollment (Appendix).
Lastly, the students asked the participant for permission to contact them in approximately one
month for a brief five minute follow up phone survey (Appendix F). The follow up survey
consists of questions about the participant’s experience with the family history session, changes
in family history, information sharing and seeking behaviors, changes in physical activity level,
and other lifestyle changes.
3.4.2 QUESTIONNAIRES
Pre- survey questionnaire
Section 1: General Information
Section 1 includes demographic information, their knowledge of genetics, and the
respondent’s assessment of their weight and health status. In addition, Section 1 asks the
participant whether they have a primary care physician and health insurance coverage.

32
Section 2: Physical Activity Habits
Section 2 provides the participant with the national recommendation on physical activity
obtained from the Center for Disease Control (CDC, 2005) and participants stage themselves by
level of physical activity or intent to become physically active. This question was based on the
Transtheoretical Model of Behavior Change and asked the participants to stage themselves by
level of physical activity or intention to begin physical activity. When an individual said that
they were physically active they were asked if they were active for more than six months or less
than six months. Individuals who indicated that they were not physically active were queried
about any plans to start in the next 30 days, in the next 6 months, or if they were not planning on
becoming physically active at this time. Those who said they were not physically active were
asked if they had increased their physical activity, but not enough to fit the definition. Section 2
asks about exercise frequency, and duration.
Section 3: Risk Perception
Section 3 included questions that determine participants’ perception about how much
smoking, diet, exercise and family history contribute to an individual’s risk for disease.
Participants rated their level of concerns for developing any of the most common chronic
conditions, and are asked to list any relatives who have had any of these conditions. The rest of
the questions in this section assessed the participants perception of risk for common chronic
diseases for a woman the same age as them, a man the same age as them, and finally for
themselves.

33
Section 4: Multidimensional Health Locus of Control
In section 4, participants completed the 18 item MHLC scale. The MHLC scale is
designed to assess the degree to which an individual feels that they are in control of their own
health. The MHLC gives individuals a series of 18 statements and asks them to rate how strongly
they agree or disagree with these statements. The MHLC is made up of three different subscales
that are designed to assess the three different dimensions of health locus of control that are
internality, chance, and powerful others. Once the participant has completed the MHLC their
score is calculated and health locus of control can be assessed in these three dimensions.
Post-survey questionnaire
Section 1: Physical Activity Habits
Section 1 determines whether participants think they will increase their level of physical
activity as a result of the family health history session.
Section 2: Risk Perception and Health Value Index
Section 2 asks the participant how often (always, sometimes or never) smoking, diet, lack
of exercise, and family history contributes to disease risk. This question was used to construct a
health value index for each participant. In this section participants indicate their risk perception
is for the common chronic diseases based on their family history and how their risk compares to
the average individual’s (of the same age) risk to develop these same conditions.
Section 3: Opinions on Research
In section 3, participants rated the importance of medical research, whether they had ever
participated or been offered the chance to participate in research, and what their general attitudes
were towards medical research. Participants were queried about the benefits of medical research

34
to scientists, community, family and friends, and themselves. Participants were asked if they
would be interested in having their name in a research recruitment database and what their
expectations were of such a database. If the participant marked that they were not interested, they
were asked for their primary reasons for not wanting to be part of the database.
Section 4: Information Seeking Behavior
In section 4, participants were asked if they had plans to share their family history with
their doctor and their family. Participants rated how comfortable they were discussing health
concerns with family members and their doctor and about any barriers that stood in the way of
these discussions. Each participant was asked where they searched for health information, and
how frequently they searched for health information. Lastly, participants staged themselves in
terms of their level of information seeking behavior (based on Wilson’s model). The four levels
were as follows: passive attention, passive search, active search, and ongoing search. Participants
chose the statement that most closely resembled their level of information seeking behavior from
the following options: 1. I am aware of health conditions that run in my family and I do not need
to do any more research on these conditions (passive attention). 2. I am aware of the health
conditions that run in my family and I read about these conditions when the information is
provided for me (passive search). 3. I have done some of my own research on health conditions
that concern me (active search). 4. I actively keep up with current research on health conditions
that concern me (ongoing search). Participants indicated the frequency of their information
seeking behavior (based on a 6 point Likert scale with the options of very frequently, frequently,
occasionally, rarely, very rarely, or never).

35
Follow up survey questionnaire
The follow up survey was designed to assess participants’ attitudes towards the family
history session and whether or not they had made any lifestyle changes as a result of the family
history session. Genetic counseling students conducted the follow up survey by phone. The
follow up period ranged from 1 month to 3 months depending on how long it took to get a hold
of each individual. Individuals were once again asked to stage their level of physical activity
(based on the Transtheoretical model), and their level of information seeking behavior (based on
Wilson’s model).
3.4.3 PEDIGREE ANALYSIS
The Scheuner et al. criteria (Figure 5) were used to analyze each pedigree and determine
the individual’s risk for common chronic conditions. Each individual was told that they were low
risk, moderate risk, or high risk for hypertension, adult onset diabetes, breast cancer, ovarian
cancer, colon cancer, prostate cancer, lung cancer, cardiovascular disease, and Alzheimer’s
disease. Scheuner’s definition of premature onset was used for cardiovascular disease, diabetes,
and cancer. The definition for premature onset Alzheimer’s disease, diagnosed at age 65 or
younger, was established by the Alzheimer’s disease association. The definition for premature
onset hypertension was established as age 50 or younger based on previous work at the CMH.
Each pedigree was analyzed by one genetic counseling student. When questions arose, the other
three genetic counseling students were consulted in order to establish a consensus.

36
High Risk Moderate Risk Average Risk
1. Premature disease in a 1st degree relative.
2. Premature disease in a 2nd degree relative (coronary artery disease).
3. Two affected 1st degree relatives. 4. A 1st degree relative with
late/unknown onset of disease and an affected 2nd degree relative with premature disease from the same lineage.
5. Two 2nd degree maternal or paternal relatives with at least one having premature onset of disease.
6. Three or more affected maternal or paternal relatives.
7. The presence of a “moderate risk” family history on both sides of the pedigree.
1. A 1st degree relative with late or unknown disease onset.
2. Two 2nd degree relatives from the same lineage with late or unknown disease onset.
1. No affected relatives.
2. Only one affected 2nd degree relative from one or both sides of the pedigree.
3. No known family history.
4. Adopted individual with unknown family history.
Note: Premature coronary artery disease: 55 or younger in males; 65 or younger in females. Premature stroke, diabetes, colon cancer, and prostate cancer: 50 or younger Premature breast, ovarian, and endometrial cancer: 50 or younger or premenopausal
(Reprinted with permission of Wiley-Liss, Inc. a subsidiary of John Wiley & Sons, Inc.)
Figure 5. Scheuner et al. (1997) Risk Stratification Criteria
3.4.4 DATA ANALYSIS
Pre-survey, post- survey and follow-up survey data were entered into online versions of
each respective survey and retrieved through Perseus Survey Solutions Version 6 ®. Once in
Perseus the data were exported into excel data sheets and then analyzed using STATA Version
7® Statistical Software.
First, the health value index was assessed for the study group. The health value index
consisted of 4 questions asking how often (never, sometimes, or always) smoking, diet, exercise,

37
and family history contributed to disease risk. 1 point was assigned for each “never” response, 2
points were assigned for each “sometimes” response and 3 points were assigned for each
“always” response. Individuals with a score of 8 or higher were classified into the high health
value group and individuals with a score of 8 or lower were classified into the low health value
group.
Second, a score was calculated for each participant for the internality, chance, and
powerful others subscale (Appendix C: Scoring directions). The median score was then
calculated for each subscale. A median split approach was used to split individuals into two
categories for each respective subscale. For example, individuals scoring above or equal to the
median score on the internality scale were classified as internals (high internals), whereas
individuals scoring below the median were classified as externals (low internals). Individuals
scoring above or equal to the median score on the chance scale were classified as high chance
(those whose HLC was dependent on chance events), and individuals scoring below the median
were classified as low chance (those whose HLC was minimally dependent on chance events).
Individuals scoring above or equal to the median on the powerful others subscale were classified
as high powerful others (those that felt health professionals and family members play a
significant role in their health status), whereas individuals scoring below the median were
classified as low powerful others (those who do not feel that health professionals and family
members play a significant role in the determination of their health status).
Once a subscale score was determined for each participant, MHLC was assessed in
conjunction with 1) a risk perception analysis for diabetes, CVD, colon cancer, breast cancer,
and ovarian cancer and 2) health behavior analysis for three different outcome measures. These
three outcome measures are as follows: level of physical activity, level and frequency of

38
information seeking behavior, and enrollment status in the CMH Minority Research Recruitment
Database.
Risk Perception Analysis
Risk perception was assessed by comparing each participant’s objective risk for each
condition to their perceived risk for that particular condition. The objective risk for
cardiovascular disease, diabetes, hypertension, colon cancer, breast cancer, prostate cancer, and
ovarian cancer was determined by carefully reviewing the pedigree using the Scheuner et al.
criteria. Individuals were either classified as high risk (greater than 50% chance to develop
condition), moderate risk (between 10-50% risk to develop condition) and low risk (less than
10% chance to develop condition). Information regarding individual risk perception for each
condition was obtained from the pre-survey questionnaire (filled out prior to the family history
session) that asked individuals to list their risk as low, moderate, or high for each respective
condition. This data was retrieved from Perseus Survey Solutions and exported to excel
spreadsheets. For each individual, accuracy of risk perception was determined for each disease.
Individuals were classified as having accurately estimated, overestimated, or underestimated for
each disease. Individuals who did not know their perceived risk for a particular health condition
or had been previously diagnosed with a particular health condition were excluded from the
analysis. Gender was also used as exclusion criteria for respective conditions.
Excel spreadsheets were created with each individual’s risk perception accuracy,
objective risk, and subscale classification (external vs. internal, low chance vs. high chance, low
powerful others vs. high powerful others). A separate analysis was carried out for each disease
for all three subscales. Within each disease analysis, individuals were stratified into high,

39
moderate, and low objective risk categories. Fisher’s exact tests were performed to check for
differences between individuals who correctly vs. incorrectly estimated and their MHLC scores
(external vs. internal, high chance vs. low chance, and high powerful others vs. low powerful
others). For example, in the diabetes analysis individuals were first stratified into high,
moderate, and low objective risk categories. Within each objective risk category three Fisher’s
exact tests were performed, one test for each subscale of the MHLC. Since each disease sample
was split into three risk categories a bonferroni correction was performed (alpha=0.05/3=0.017).
A risk perception analysis was not carried out for prostate cancer and hypertension due to the
small sample sizes (prostate cancer n=12; hypertension n= 27) after exclusion criteria were
applied.
Health Behavior Analysis
Physical activity level or intention to be physically active was assessed at time of pre
survey during the initial family history session and again on the follow up survey. Level and
frequency of information seeking behavior was assessed at time of post survey during the initial
family history session and again on the follow up survey. Individuals were given the opportunity
to enroll in the database at the initial session. Fisher’s exact tests were used to search for
differences between internals and externals (across all three MHLC subscales) and likelihood to
maintain or increase physical activity, likelihood to maintain or increase level and frequency of
information seeking behavior, and likelihood to enroll in minority research recruitment database.
Alpha was set at 0.05.

40
4.0 RESULTS
4.1 PARTICIPANT CHARACTERISTICS
The data reported here are from the 87 participants recruited from the Center for
Minority Health Healthy Black Family Project. All personal characteristics were self
reported. Table 1 presents the participants’ socio-demographic characteristics, general health,
knowledge on genetics, and scores on health value index.

41
Table 1. Characteristics of Study Participants
Participant characteristics (n=87) n (% of participants) Sex Male 12(14%) Female 75(86%) Ethnicity African American Only 72(83%) Multiracial (African American and other) 14(16%) Caucasian 1(1%) Age <50 30(34%) >50 57(66%) Education Grades 9 through 11(some high school) 1(1%) Grades 12 or GED (high school graduate) 18(21%) College 1 to 3 years (some college) 37(43%) College 4 or more years (college graduate) 20(23%) Graduate level (MS, PhD) 8(9%) Income Less than $10,000 14(16%) Between $10,000 and $20,000 14(16%) Between $20,001 and $35,000 20(23%) Between $35,001 and $50,000 17(20%) Between $50,001 and $75,000 9(10%) Greater than $75,000 2(2%) General Health Good/Very Good/ Excellent 65(75%) Fair/Poor 19(22%) Self described weight Underweight 2(2%) Healthy weight 14(16%) Overweight 56(64%) Obese 13(15%) Smoker Yes 9 (10%) No 75 (86%) Knowledge of Genetics Good/Very Good/ Excellent 36 (41%) Fair/Poor 48(55%)
Health Value Index Score High health value (index score >8) 78(90%) Low health value (index score <8) 9(10%)
Note: Percentages in some categories may not add up to 100 due to some participants leaving questions unanswered.

42
Of all participants, 86 individuals described their race as African American, one
individual described their race as Caucasian, and 16% of individuals described themselves as
multi racial. The median age for all participants was 55, with an age range of 25 to 84. 66%
of individuals were above the age of 50 and 34% were below the age of 50. The sample was
mostly female (86%). Of the 87 participants, the majority had some college education (78%).
The annual household income for the greater portion (75%) of the sample was less than
$50,000. 75% of participants rated their general health as good, very good, or excellent.
More than half (55%) of participants rated their knowledge of genetics as poor or fair, with
only 1% of individuals rating their knowledge on genetics as excellent. The majority of the
sample (90%) scored high on the health value index indicating that our study population is
one that believes smoking, lack of exercise, poor diet, and family history contribute to
disease risk at least some of the time.
Table 2 summarizes participants’ insurance status and access to health professionals.
The majority of participants (91%) have health insurance. Of the 87 participants 63% have
one physician they consider their primary care doctor and 35% of participants have more
than one primary care physician. Overall, 95% of participants are under the care of at least
one primary care physician. 9% of participants have been in a situation where they needed to
see a doctor but could not because of the cost. Participants were asked if they had ever been
concerned about developing hypertension, CVD, cancer, or Alzheimer’s disease. The
majority (82%) of participants have talked to their doctor about concerns for developing a
disease. Diseases individuals have discussed with their doctor include diabetes, high blood
pressure, cardiovascular disease, bone cancer, lung cancer, colon cancer, throat cancer,
pancreatic cancer, prostate cancer, Alzheimer’s disease, and stroke.

43
Table 2. Participants' Access to Care
Participant’s Insurance and Health Provider Status n(% of participants)
Health insurance Yes 79(91%) No 6(7%) Have primary physician Yes, only one 55(63%) Yes, more than one 26(35%) No 4 (5%) Did not see a doctor due to cost Yes 8(9%) No 76(87%) Talked to doctor about concern for developing a disease
Yes 71(82%) No 14(16%)
Note: Percentages may not add up to 100, as some questions were left unanswered.
Table 3 summarizes participants’ concerns for developing diabetes, hypertension,
cardiovascular disease, and cancer and whether or not they have a first degree relative (FDR)
or second degree relative (SDR) who has had the condition. Most participants (82%) have
been concerned about developing one of the aforementioned diseases at some point in their
lifetime. The majority of participants (81%) are moderately to very greatly concerned about
their risk for developing these common chronic diseases. Within the concerned group 40% of
participants are moderately concerned and 41% of participants are greatly to very greatly
concerned about developing one of the common chronic diseases at some point in their
lifetime. Of the 87 participants 78% have at least one FDR or SDR that has been diagnosed
with the condition they are concerned about.

44
Table 3. Participants' level of concern for developing chronic disease and family history
Participant characteristics n(% of participants) Have you ever been concerned about developing above disease? Yes 71(82%) No 14(16%) Level of concern 1(low)- 5(high) 1 2(3%) 2 13(16%) 3 32(40%) 4 13(16%) 5 20(25%) FDR or SDR with condition? Yes 68(78%) No 13(15%) Don’t know 4(5%)
Note: Percentages may not add up to 100 since some questions were left unanswered.
Table 4 summarizes the 87 participants’ objective risk for hypertension (HTN), adult
onset diabetes mellitus (AODM), cardiovascular disease (CVD), colon cancer, breast cancer,
and ovarian cancer. Individuals were stratified into low, moderate, or high risk categories
using Scheuner criteria to evaluate family history. Participants in this study were collectively
at increased risk for diabetes, hypertension and cardiovascular disease. A large proportion
(66%) of the study population has already been diagnosed with hypertension.

45
Table 4. Participants' objective risk stratification based on Scheuner et al. criteria
Disease High risk n( %)
Moderate risk n(%)
Low risk n (%)
Already have it n( %)
AODM 34(39%) 7(8%) 31(36%) 15(17%) CVD 35(40%) 19(22%) 29(33%) 4(5%) HTN 19(22%) 4(5%) 7 (8%) 57(66%)
Colon cancer 2(2%) 8(9%) 76(88%) 1(1%) Breast cancer 9(10%) 1(1%) 76(88%) 1(1%)
Ovarian cancer 1(1%) 1 (1%) 72(96%) 1(1%)

46
4.2 RISK PERCEPTION ACCURACY
Table 5. Participants' risk perception for chronic disease
Disease High n (%) Moderate n( %) Low n (%) DK n (%) AH n (%)
AODM 27(31%) 23(26%) 17(20%) 5(15%) 6(17%)
CVD 32 (37%) 28(32%) 15(17%) 8(4%) 9 (5%)
HTN 10 (12%) 9(10%) 8(9%) 3(3%) 57(66%)
Colon cancer 12(14%) 22(25%) 39(45%) 13(1%) 14(1%)
Breast cancer 6(7%) 36(42%) 32 (37%) 12(1%) 14(1%)
Ovarian cancer 6(8%) 21(24%) 36 (41%) 11 (1%) 13 (1%)
Table 5 summarizes participants risk perception for diabetes, cardiovascular disease,
hypertension, colon cancer, breast cancer, and ovarian cancer. The majority of participants (57%)
perceived themselves to be at increased risk for diabetes and cardiovascular disease (57%, and
69%, respectively). Of those who perceived themselves to be at increased risk for diabetes 31%
perceived to be in the high risk category and 26% perceived their risk to be moderately
increased. Of those who perceived themselves to be at increased risk for cardiovascular disease,
37% perceived their risk to be high and 32% perceived their risk to be moderately increased.
66% of the study population has been diagnosed with hypertension. Of the 27 individuals in our
study who did not have a diagnosis of hypertension 12% perceived their risk to be high, 10%
perceived their risk to be moderately increased, and 9% felt that they were at low risk. The
majority of participants perceived their risk for colon cancer to be low (45%) or moderate (25%)

47
and 14% of participants believed their risk for colon cancer to be high. The majority of women
felt their risk for ovarian cancer was low (41%), followed by 24% who felt their risk was
moderate, and only 8% who believed their risk to be high. The majority of participants felt that
their risk for breast cancer was increased with 42% of women feeling that they were at moderate
risk and 7% placing themselves in the high risk category. 37% of women felt their risk for breast
cancer was low.
Table 6. Risk perception accuracy
Disease Correct n(%)
Overestimate n (%)
Underestimate n (%)
Don’t know n (%)
Already haven (%)
AODM 26 (30%) 22 (25%) 18 (21%) 6 (7%) 15 (17%)
CVD 32 (37%) 25 (29%) 18 (21%) 8 (9%) 4 (5%)
HTN 14 (16%) 3 (3%) 10 (11%) 2(3%) 58 (67%)
Colon cancer 42 (48%) 30 (35%) 1 (1%) 13 (15%) 1 (1%)
Breast cancer 34 (39%) 33 (38%) 6 (7%) 13 (15%) 1 (1%)
Ovarian cancer
35 (40%) 27 (31%) 1 (1%) 11 (13%) 1(1%)
Participants’ risk perception accuracy is summarized in Table 6. Overall, the participants
were most accurate at estimating their risk for cancer. 48% of individuals correctly estimated
their risk for colon cancer, followed by 35% who overestimated their risk, and only 1% who
underestimated their risk. 40% of participants correctly estimated their risk for ovarian and breast
cancer. Individuals were more likely to overestimate their risk for both breast (38% of

48
participants) and ovarian cancer (31% of participants), than to underestimate their risk (7% for
breast cancer and 1% for ovarian cancer). Individuals were more likely to correctly estimate
their risk for diabetes and cardiovascular disease (31% and 37%, respectively). 21% of
individuals underestimated their risk for both diabetes and cardiovascular disease. 24% of
individuals overestimated their risk for diabetes and 29% of individuals overestimated their risk
for cardiovascular disease. Since 57 individuals had already been diagnosed with hypertension,
a small portion of individuals were able to participate in the risk perception study leaving 16% of
individuals who correctly estimated their risk, 3% who overestimated their risk and 11% who
underestimated their risk. Overall, a significant number of individuals inaccurately estimated
their risk for disease or did not know their risk: diabetes (53%), cardiovascular disease (59%),
colon cancer (51%), breast cancer (60%) and ovarian cancer (45%).

49
4.3 MHLC AND RISK PERCEPTION
The statistically significant findings of the risk perception analysis are summarized in Table
7 below. All findings are summarized textually in their respective MHLC disease specific risk
perception analysis and tabulated in Appendix A (Tables 12-16).
Table 7. Risk perception analysis: summary of statistically significant results
Disease Accurate Overestimate Underestimate p-value n (%) n(%) n(%) Ovarian Cancer Internality Scale Low risk p=0.040 Internals 13(43%) 17(57%) n/a Externals 22(71%) 9(29%) n/a Conclusion: Individuals at low risk for ovarian cancer were more likely to overestimate their risk for ovarian cancer if they were internal (scored high on the internality scale) than if they were external (scored low on the internality scale). Diabetes Powerful Others Scale High risk High po 10(77%) n/a 3(23%) p=0.011 Low po 5(28%) n/a 13(72%) Conclusion: Individuals at high risk for diabetes were more likely to underestimate their risk if they scored low on the powerful others scale than if they scored high on the powerful others scale. Cardiovascular Disease Powerful Others Scale Moderate p=0.005 High po 0 6 (100%) 0 Low po 6(55%) 2 (18%) 3(27%) Conclusion: Individuals at moderate risk for CVD were more likely to overestimate their risk for CVD if they scored high on powerful others scale than if they scored low.
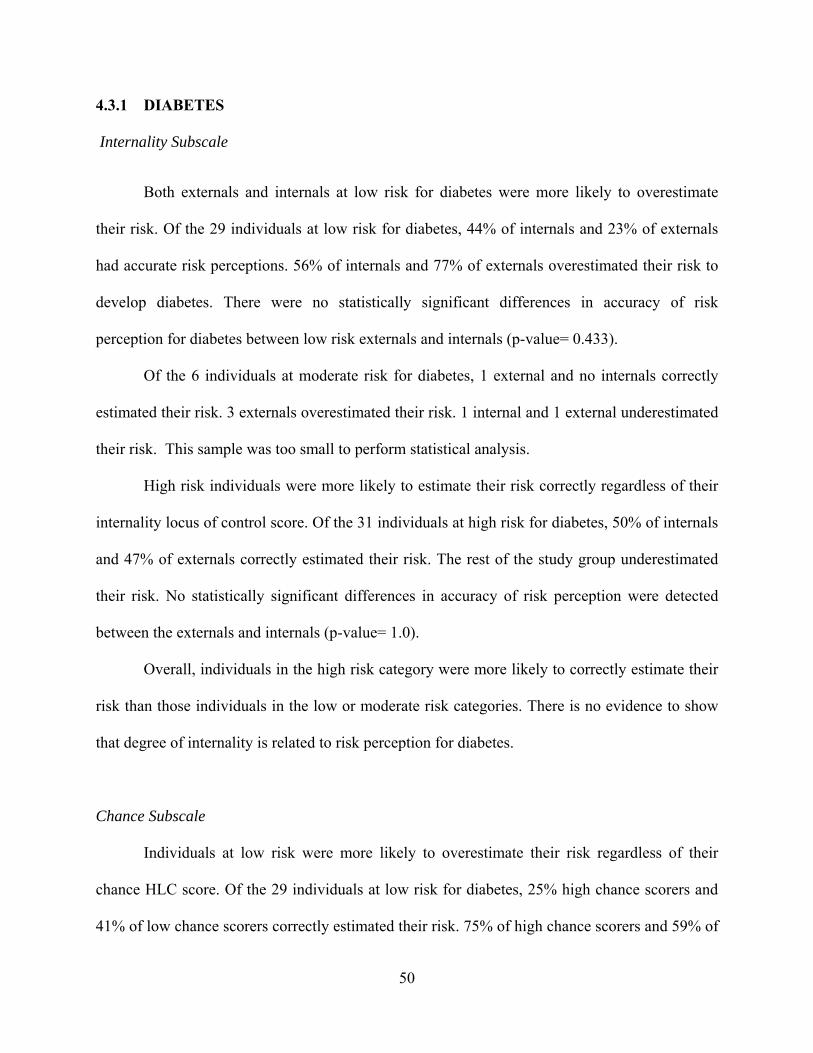
50
4.3.1 DIABETES
Internality Subscale
Both externals and internals at low risk for diabetes were more likely to overestimate
their risk. Of the 29 individuals at low risk for diabetes, 44% of internals and 23% of externals
had accurate risk perceptions. 56% of internals and 77% of externals overestimated their risk to
develop diabetes. There were no statistically significant differences in accuracy of risk
perception for diabetes between low risk externals and internals (p-value= 0.433).
Of the 6 individuals at moderate risk for diabetes, 1 external and no internals correctly
estimated their risk. 3 externals overestimated their risk. 1 internal and 1 external underestimated
their risk. This sample was too small to perform statistical analysis.
High risk individuals were more likely to estimate their risk correctly regardless of their
internality locus of control score. Of the 31 individuals at high risk for diabetes, 50% of internals
and 47% of externals correctly estimated their risk. The rest of the study group underestimated
their risk. No statistically significant differences in accuracy of risk perception were detected
between the externals and internals (p-value= 1.0).
Overall, individuals in the high risk category were more likely to correctly estimate their
risk than those individuals in the low or moderate risk categories. There is no evidence to show
that degree of internality is related to risk perception for diabetes.
Chance Subscale
Individuals at low risk were more likely to overestimate their risk regardless of their
chance HLC score. Of the 29 individuals at low risk for diabetes, 25% high chance scorers and
41% of low chance scorers correctly estimated their risk. 75% of high chance scorers and 59% of
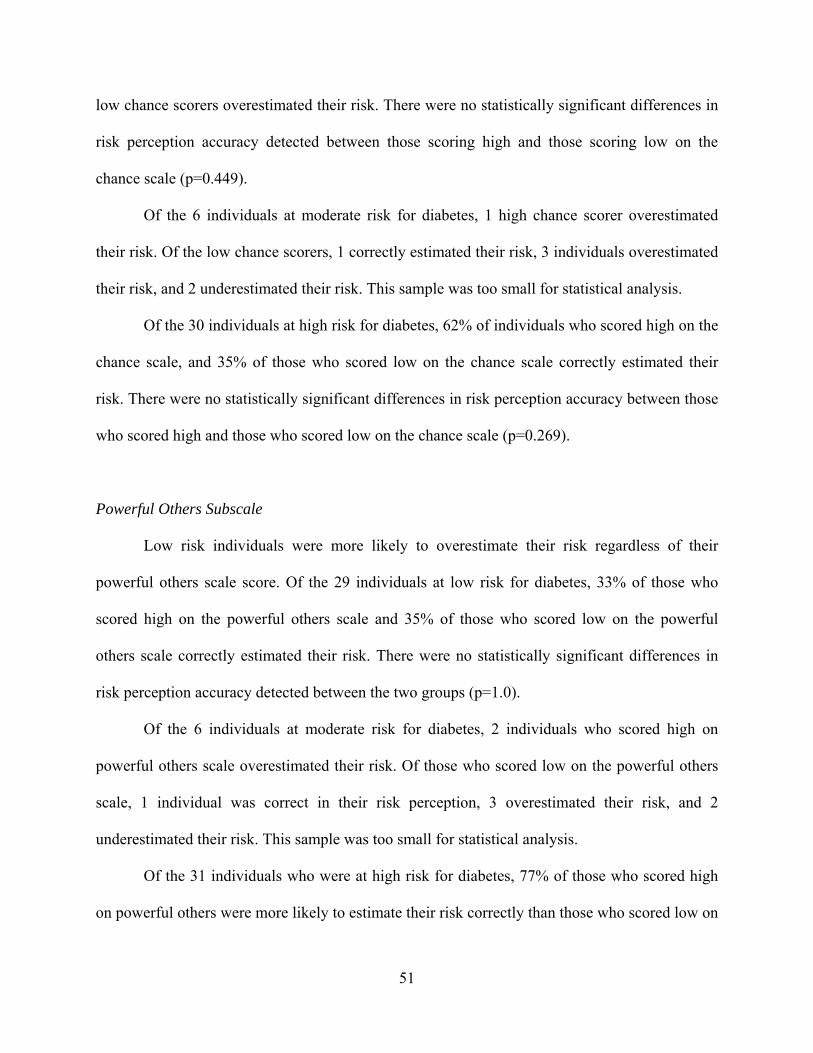
51
low chance scorers overestimated their risk. There were no statistically significant differences in
risk perception accuracy detected between those scoring high and those scoring low on the
chance scale (p=0.449).
Of the 6 individuals at moderate risk for diabetes, 1 high chance scorer overestimated
their risk. Of the low chance scorers, 1 correctly estimated their risk, 3 individuals overestimated
their risk, and 2 underestimated their risk. This sample was too small for statistical analysis.
Of the 30 individuals at high risk for diabetes, 62% of individuals who scored high on the
chance scale, and 35% of those who scored low on the chance scale correctly estimated their
risk. There were no statistically significant differences in risk perception accuracy between those
who scored high and those who scored low on the chance scale (p=0.269).
Powerful Others Subscale
Low risk individuals were more likely to overestimate their risk regardless of their
powerful others scale score. Of the 29 individuals at low risk for diabetes, 33% of those who
scored high on the powerful others scale and 35% of those who scored low on the powerful
others scale correctly estimated their risk. There were no statistically significant differences in
risk perception accuracy detected between the two groups (p=1.0).
Of the 6 individuals at moderate risk for diabetes, 2 individuals who scored high on
powerful others scale overestimated their risk. Of those who scored low on the powerful others
scale, 1 individual was correct in their risk perception, 3 overestimated their risk, and 2
underestimated their risk. This sample was too small for statistical analysis.
Of the 31 individuals who were at high risk for diabetes, 77% of those who scored high
on powerful others were more likely to estimate their risk correctly than those who scored low on

52
powerful others of which only 28% accurately estimated their risk. 23% of those who scored
high on powerful others underestimated their risk compared to 73% of those who scored low on
powerful others who underestimated their risk. In summary, those who scored low on powerful
others were more likely to underestimate their risk for diabetes. This difference was statistically
significant with a p-value=0.011 at an alpha of 0.017.
4.3.2 CARDIOVASCULAR DISEASE (CVD)
Of the 87 study participants, 4 had already been diagnosed with cardiovascular disease. 8
individuals did not know their perceived risk for CVD. The final risk perception analysis was
performed on a sample of 75 participants.
Internality Scale
Low risk individuals collectively overestimated their risk regardless of their internality
score. Of the 25 participants in the low risk category for cardiovascular disease, 30% of internals
correctly estimated their risk compared to 40% of externals. 70% of internals overestimated their
risk compared to 60% of externals. There were no statistically significant differences in risk
perception for CVD noted between externals and internals (p-value= 0.691).
Moderate risk individuals collectively overestimated their risk regardless of their
internality score. Of the 17 participants in the moderate risk category, 33% of internals and 40%
of externals correctly estimated their risk for CVD. 50% of internals overestimated their risk as
did 40% of externals. 3 individuals underestimated their risk for CVD, one of who was an
external. There were no statistically significant differences in risk perception for CVD detected
in the moderate risk category (p-value=1.000).

53
The majority of high risk internals and externals correctly estimated their risk. Of the 33
individuals who were high risk for CVD, 53% of internals and 56% of externals accurately
estimated their risk. Comparably, 47% of internals and 44% of externals underestimated their
risk. No significant differences were detected between externals and internals at high risk for
diabetes (p-value=1.000).
Chance Subscale
High and low chance scorers were both more likely to overestimate their risk. Of the 25
individuals in the low risk category for CVD, there were no statistically significant differences in
risk perception accuracy detected between those scoring low on the chance scale and those
scoring high on the chance scale. 38% of those who scored high on the chance scale and 35% of
those who scored low on the chance scale correctly predicted their risk for CVD (p-value=1.0).
The rest of the individuals overestimated their risk (63% of internals and 65% of externals).
Of the 17 individuals at moderate risk for CVD, 4 (57%) of the high chance scorers
correctly predicted their risk compared to 2 (20%) low chance scorers. 3 low chance scorers and
5 high chance scorers overestimated their risk, and 3 low chance scorers underestimated their
risk. There were no statistically significant differences in accuracy of risk perception for CVD
detected between high chance scorers and low chance scorers (p-value=0.196).
Of the 32 individuals at high risk for CVD, 44% of high chance scorers and 63% of low
chance scorers correctly predicted their risk. There were no statistically significant differences
detected between low chance scorers and high chance scorers (p-value=0.479).

54
Powerful others scale
Of the 25 participants at low risk for CVD, those who scored low on powerful others
correctly estimated their risk, whereas those who scored high on powerful others were more
likely to incorrectly estimate their risk. 77% of individuals who scored high on powerful others
overestimated their risk for CVD, compared to 50% of individuals who scored low on powerful
others (p-value=0.226). This difference was not statistically significant.
Of the 17 individuals at moderate risk for CVD, those who scored low on the powerful
others scale were more likely to correctly estimate their risk than those who scored high on the
powerful others scale. 55% of those who scored low on powerful others correctly estimated their
risk compared to 0% of individuals who scored high on powerful others. All of those individuals
who scored high on powerful others overestimated their risk for CVD (p-value= 0.005). In
summary, this analysis detected a statistically significant difference that shows that those
individuals who score low on powerful others are more likely to correctly estimate their risk for
CVD than those individuals who score high on powerful others. Although the cell sizes in this
study sample are small the chance of making a Type I error is a 0.5%. This means that there is a
0.5% chance that this result could have been observed by chance which means that there is a
99.5% chance that this result is statistically significant.

55
4.3.3 COLON CANCER
Out of the study participants, 2 had been previously diagnosed with colon cancer, and 12
did not know their perceived risk. Data was analyzed on a total of 73 participants’ risk
perceptions for colon cancer. Of the 73 participants, 66 were at low risk, 5 were at moderate risk
and 2 were at high risk for colon cancer. Statistical analysis was only carried out on the low risk
group, since the other two risk category sample size were too small for analysis.
Internality Scale
The majority of low risk individuals correctly estimated their risk regardless of their
internality score. Data was analyzed on 66 participants for the internality scale. 56% of internals
compared to 60% of externals correctly estimated their risk for colon cancer. 44% of internals
and 40% of externals overestimated their risk for colon cancer. There were no statistically
significant differences in risk perception accuracy for colon cancer between externals and
internals (p-value=0. 81).
Chance scale
Data was analyzed on 65 participants for the chance subscale; because one participant did
not completely fill out the chance section of the questionnaire. 61% of internals and 54% of
externals correctly estimated their risk for colon cancer. No statistically significant differences in
risk perception for colon cancer were detected between those individuals who scored low on the
chance scale and those who scored high on the chance scale (p=0.622).

56
Powerful others scale
Of the 66 participants at low risk for colon cancer, low powerful others scorers correctly
estimated their risk more frequently than high powerful others scorers. 44% of those scoring high
on powerful others and 67% of those scoring low on powerful others correctly estimated their
risk for colon cancer. No statistically significant differences in risk perception for colon cancer
were detected between those individuals who scored low on the chance scale and those who
scored high on the chance scale (p=0.083).
4.3.4 OVARIAN CANCER
Of the 87 participants, 75 were women. After excluding those women who had had a
total abdominal hysterectomy and those women who did not know their risk perception for
ovarian cancer the sample size was 63 women, of which 61 were in the low risk category. For
this reason, data analysis was carried out on only those women who were at low risk for ovarian
cancer.
Internality Scale
Of the 61 women in the study sample, 71% of externals correctly estimated their risk for
ovarian cancer compared to 43% of internals. 57% of women with an internal locus of control
overestimated their risk for ovarian cancer compared to 29% of women with an external locus of
control. These results were statistically significant at a p-value of 0.040. The bonferonni
correction was not necessary in this sample, since the sample size was not truly split amongst
three groups. An alpha=0.05 was used.

57
Chance Scale
56% of low chance scorers and 57% of high chance scorers accurately predicted their risk
for ovarian cancer. There were no statistically significant differences in risk perception accuracy
for ovarian cancer between low chance and high chance scorers (p-value=0.588).
Powerful Others Scale
Of the 61 women low risk women in the study sample, 67% of low powerful others
correctly estimated their risk for ovarian cancer compared to 44% of high powerful others. 56%
of those who scored high on powerful others overestimated their risk for ovarian cancer
compared to 32% of those who scored low on powerful others. No statistically significant
differences in accuracy of risk perception for ovarian cancer were detected (p-value=0.117).
4.3.5 BREAST CANCER
Of the 87 participants in our study in our study, breast cancer risk perception was
analyzed on 63 individuals after the sample was filtered through the exclusion criteria.
Internality Scale
Of the 63 individuals who were at low risk for breast cancer, 42% of internals and 53%
of externals accurately predicted their risk. Externals were more likely to accurately predict their
risk than internals, but this difference was not statistically significant(p-value=0.453).
1 individual was at moderate risk for breast cancer and correctly predicted their risk. 9
individuals were at high risk for breast cancer. Of these individuals 2 externals and 1 internal

58
correctly estimated their risk, while 4 internals and 2 externals underestimated their risk. There
were no statistically significant differences between these two groups (p-value= 0.524).
Chance Subscale
Of the 63 individuals who completed the chance subscale, 47% of high chance scorers
and 46% of low chance scorers correctly estimated their risk. There were no statistically
significant differences between these two groups (p=1.0)
Powerful others
50% of those who scored high on powerful others and 46% of those who scored low on
powerful others correctly estimated their risk for breast cancer. No statistically significant
differences were present between these two groups (p-value=0.802).

59
4.4 MHLC AND HEALTH BEHAVIOR ANALYSIS
A total of 68 individuals completed both the pre- session survey and the 1-3 months follow up
survey and were included in the Health Behavior analysis.
4.4.1 PHYSICAL ACTIVITY
Individuals were split up into two groups for analytical purposes. Group 1 consisted of 46
individuals who were physically active at the time of the family history session (individuals who
fit the definition of physical activity for more than 6 months or less than 6 months). Group 2
consisted of 22 individuals who were not physically active at the time of the family history
session (these were individuals who were contemplating becoming active in either the next 30
days, or the next 6 months in addition to those individuals who were in the pre-contemplation
stage and did not have any plans for becoming physically active at the time of the family history
session). Data for group 1 was analyzed to determine if locus of control was related to physical
activity level maintenance. Data for group 2 was analyzed to determine if locus of control was
related to moving through the stages of change of the transtheoretical model, and in turn
increasing physical activity behavior change by advancing through one or more stages. Table 8 is
a summary of the findings of the MHLC and Physical Activity analysis. There were no
statistically significant differences detected across all three MHLC subscales and likelihood to
progress through stages of physical activity change.

60
Table 8. Number of participants who maintained or progressed through the stages of physical activity behavior change and their MHLC subscale classification Number of participants p-value n (%) Internality Scale Group 1 Internals 17 (81%) p= 0.325 Externals 17 (64%) Group 2 Internals 8(100%) p=0.273 Externals 4(19%)
Chance Scale Group 1 Low chance scorers 17 (19%) p= 0.243 High chance scorers 14(64%) Group 2 Low chance scorers 19 (81%) p= 1.000 High chance scorers 14(64%)
Powerful Others Scale
Group 1 Low powerful others scorers 7(54%) High powerful others scorers 15(68%) p=0.480 Group 2 Low powerful others scorers 9(82%) High powerful others scorers 10(91%) p=1.000
Note: Group 1 consisted of individuals who were physically active at start of study. Group 2 consisted of individuals who were not physically active at start of study.

61
Of those 46 individuals (68% of study population) who were physically active at the start
of the study, 33 (72%) maintained their level of physical activity, whereas 13 (28%) decreased
their level of physical activity.
Of those 22 individuals (32%) who were not physically active at the start of the study
86% progressed through the stages of change in working towards increasing their level of
physical activity by at least one stage. 6 individuals moved from the pre-contemplation stage to
the contemplation stage of becoming physically active within the next 6 months, 10 individuals
moved up to or stayed at stage 3 (preparing to become physically active in the next 30 days), and
3 individuals became physically active.
Internality Scale and Physical Activity
Within the physically active group, 17 (81%) of internals maintained their physical
activity compared to 17 (64%) of externals. 9 (36%) of externals decreased in their level of
physical activity compared to 4(19%) of internals. There was no statistically significant
difference detected in maintenance of physical activity between external and internal individuals
(p=0.325).
Of those individuals who were not physically active to begin with, 8 were internal in their
locus of control and 14 were external in their locus of control. 100% of internals (n=8) compared
to 79% of externals (n=11) moved through at least one stage of the transtheoretical model. The
majority of individuals who were not physically active to begin with progressed through the
stages of changes towards a more physically active lifestyle; however, no statistically significant
difference was detected between individuals with an external locus of control and individuals
with an internal locus of control (p=0.273).

62
Chance Scale and Physical Activity
Of those individuals in the physically active group, 79% (n=19) of individuals who
scored low on the chance scale and 64% (n=14) of individuals who scored high on the chance
scale maintained their level of physical activity. There was no statistically significant difference
in physical activity maintenance between high and low chance scorers (p=0.243).
81% (n=9) of those who scored low on the chance scale and 91% (n=10) of those who
scored high on the chance scale progressed through the stages of change and towards increasing
their level of physical activity. There was no statistically significant difference between
progressing through the stages of change and chance subscale scores (p=1.000).
Powerful Others Scale and Physical Activity
Within the physically active group, 54% (n=7) of individuals who scored low on the
powerful others scale compared to 68% (n=15) of individuals who scored high on the powerful
others scale maintained their level of physical activity. Powerful others score did not play a
statistically significant role in likelihood to maintain physical activity (p=0.480).
Within the non- physically active group, 82% (n=9) of low powerful others and 91%
(n=10) of high powerful others individuals progressed through the stages of change. Powerful
others score did not play a statistically significant role in likelihood to advance through the
stages of physical activity behavior change (p-value=1.0).

63
4.4.2 INFORMATION SEEKING
Likelihood to increase level of information seeking behavior was assessed in 66
individuals who were split up into two groups for analytical purposes. Two individuals were not
included in this analysis due to not having answered all questions pertinent to the information
seeking analysis. The 1st group consisted of individuals who were active or ongoing information
seekers. The 2nd group consisted of individuals who were passive searchers or passively attentive
to health information. 36 individuals were in the high information seeking group at the start of
the study. Of these 36 individuals, 23 maintained their level of information seeking behavior
through the duration of the study, whereas 13 individuals decreased into being passive searchers
or being passively attentive to health information.
Of the 31 individuals who were either passive searchers or passively attentive to health
information, 25 (82%) increased in their level of information seeking behavior, while 6(19%) did
not. Table 9 summarizes the number of participants who maintained or increased their level of
information seeking behavior and their MHLC subscale scores.
Frequency of information seeking behavior was assessed in 67 individuals by splitting the
participants into two groups. The high frequency group consisted of 33 individuals who searched
for information either frequently or very frequently. The low frequency group consisted of 34
individuals who searched for information occasionally, rarely, very rarely, or never. 26 (79%)
individuals in the high frequency group maintained their level of information seeking behavior
throughout the duration of the study. 32 (94%) of individuals in the low frequency group
increased their level of information seeking behavior by the end of the study. Table 10 is a
summary of those participants who maintained or increased the frequency of their information
seeking behavior and their MHLC subscale scores.

64
Table 9. Number of participants who maintained or increased their level of information seeking behavior and their MHLC subscale classification Number of participants p-value n (%) Internality Scale Group 1 Internals 10 (59%) p= 0.730 Externals 13 (68%) Group 2 Internals 14(78%) p=1.000 Externals 11(85%)
Chance Scale Group 1 Low chance scorers 10(65%) p= 0.575 High chance scorers 13(63%) Group 2 Low chance scorers 14 (78%) p= 1.000 High chance scorers 11(85%)
Powerful Others Scale
Group 1 Low powerful others scorers 10(50%) High powerful others scorers 13(85%) p=0.083 Group 2 Low powerful others scorers 11(85%) High powerful others scorers 14(78%) p=1.000
Note: Group 1 consists of individuals who were in the active or ongoing search at start time of study. Group 2 consists of individuals who were in passive search or passive attention stage at start time of study.

65
Table 10. Frequency of information seeking behavior and MHLC subscale scores
Number of participants p-value n (%) Internality Scale Group 1 Internals 14 (88%) p= 0.398 Externals 12 (71%) Group 2 Internals 19(100%) p=0.513 Externals 134(91%)
Chance Scale Group 1 Low chance scorers 13 (93%) p= 0.195 High chance scorers 13(68%) Group 2 Low chance scorers 18(95%) p= 1.000 High chance scorers 18(95%)
Powerful Others Scale
Group 1 Low powerful others scorers 14(78%) High powerful others scorers 12(80%) p=1.000 Group 2 Low powerful others scorers 19(95%) High powerful others scorers 13(95%) p=1.000
Note: Group 1 refers to those individuals who were either very frequent or frequent searchers of information. Group 2 refers to those individuals who occasionally, rarely, very rarely or never searched for information.

66
Internality Scale and Information Seeking Behavior
Of the 34 individuals in the high information seeking behavior group, 68% (n=13) of
externals and 59% (n=10) of internals maintained their level of information seeking behavior.
Internality scale was not a statistically significant predictor of likelihood to increase information
seeking behavior (p-value=0.730).
Of the 33 individuals in the high frequency information seeking group, 88% of externals
and 71% of internals maintained their frequency of information seeking behavior. Of the 34
individuals in the low frequency information seeking group, 91% of externals and 100% of
internals increased their frequency of information seeking. Internality scores were not
statistically significant predictors of frequency of information seeking behavior (p-value for high
frequency group= 0.398, p-value for low frequency group=0.513).
Chance Scale and Information Seeking Behavior
Of the 36 individuals who were active information seekers, 65% (n=13) of low chance
scorers and 63% (n=10) of high chance scorers maintained their level of information seeking
behavior (p=0.575).
Of the 31 individuals, who were not active information seekers, 78% (n=14) of those who
scored low on the chance scale and 85% (n=11) of those who scored high on the chance scale
increased their level of information seeking behavior. Chance scores were not a statistically
significant predictor of likelihood to increase information seeking behavior (p=1.0).
Of the 33 individuals in the high frequency information seeking group, 68% (n=13) of
externals and 93% (n=13) of internals maintained their frequency of information seeking
behavior. Of the 38 individuals in the low frequency information seeking group, 95% (n=18) of

67
externals and 95% (n=18) of internals increased their frequency of information seeking. Chance
scores were not statistically significant predictors of frequency of information seeking behavior
(p-value for high frequency group= 0.195, p-value for low frequency group=1.0).
Powerful Others Scale and Information Seeking Behavior
Of the 36 individuals who were in the high information seeking behavior group, 50%
(n=10) of those who scored low on powerful others, and 81% (n=13) of those who scored high
on powerful others maintained their level of information seeking behavior. Powerful others score
was not a statistically significant predictor of likelihood to maintain level of information seeking
behavior (p=0.083).
Of the 31 individuals who were in the low information seeking behavior group, 78%
(n=14) of those who scored low on powerful others and 85% (n=11) of those who scored high on
powerful others increased in their level of information seeking behavior. There was no
statistically significant difference detected individuals with high and low powerful others score
(p=1.00).
Of the 33 individuals in the high frequency information seeking group, 78% (n=14) of
low powerful others and 80% (n=12) of high powerful others maintained their frequency of
information seeking behavior. Of the 34 individuals in the low frequency information seeking
group, 95% (n=19) of low powerful others and 93% (n=13) of high powerful others increased
their frequency of information seeking. Internality scores were not statistically significant
predictors of frequency of information seeking behavior (p-value for high frequency group= 1.0,
p-value for low frequency group=1.0).

68
4.4.3 MINORITY RESEARCH RECRUITMENT DATABASE
A total of 68 participants were offered the chance to enroll in the Minority Research Recruitment
Database. 54 (79%) individuals enrolled in the database, and 14(21%) individuals declined
enrollment. Table 11 is a summary of willingness to enroll in the database and MHLC subscale
classifications.
Internality Scale and Database Enrollment
81% (n=30) of externals and 77% (n=24) of internals chose to enroll in the database. Internality
score was not a statistically significant predictor of enrollment in the research database (p-
value=0.77).
Chance Scale and Database Enrollment
74% (n=25) of low chance scorers and 85% (n=29) of high chance scorers chose to enroll in the
database. Chance scores were not a statistically significant predictor of enrollment in the research
database (p-value=0.369).
Powerful Others Scale and Database Enrollment
71% (n=27) of individuals who scored low on the powerful others scale and 90% (n=27) of
individuals who score high on the powerful others scale chose to enroll in the database. Powerful
others subscale score was not a statistically significant predictor of willingness to enroll in the
Minority Research Recruitment Database p-value of 0.073.

69
Table 11. Willingness to enroll in Minority Research Recruitment Database and MHLC subscale scores Number of participants p-value n (%) Internality Scale Internals 24 (77%) p= 0.770 Externals 30 (81%) Chance Scale Low chance scorers 25 (74%) p= 0.369 High chance scorers 29(85%) Powerful Others Scale Low powerful others scorers 27(71%) High powerful others scorers 27 (90%) p=0.073

70
5.0 DISCUSSION
These data have implications for how to best tailor health intervention efforts to the psychosocial
needs of the African American community. This study explored the different dimensions of
health locus of control and what role, if any, health locus of control plays in the accuracy of risk
perception and health behavior. We used the MHLC scales to evaluate how to improve the
effectiveness of the HBFP in promoting physical activity, information seeking behavior, and
enrollment in clinical research. The targeted population in this study was African American
because they share a greater proportion of the burden of chronic disease than the Caucasian
population (Graham et al. 2006). We were interested in determining areas of risk education in
need of better tailored interventions. We were interested in evaluating the effectiveness of our
current interventions at reaching individuals with differing loci of control, and determining how
we could improve our outreach efforts to tailor to the psychosocial needs of our participants.
5.1 RISK PERCEPTION ANALYSIS
Overall, greater than 50% of participants inaccurately estimated or did not know their risk
for one or more of the diseases in our study, except for ovarian cancer in which 45% of
participants inaccurately estimated their risk. This finding suggests that individuals in our study
are inaccurately estimating their risk regardless of their health locus of control. Furthermore,

71
better tailored risk awareness education interventions, aimed at both externals and internals, are
necessary to improve risk perception for diabetes, cardiovascular disease, colon cancer, breast
cancer, and ovarian cancer in our study population.
The risk perception analysis findings highlight how interventions can best be tailored to
participants’ health locus of control in the areas of cardiovascular disease, diabetes, and ovarian
cancer, as there were statistically significant differences noted between external and internal
individuals.
DIABETES AND POWERFUL OTHERS
Individuals at high risk for diabetes were more likely to underestimate their risk if they
were less responsive to the opinions of health professionals regarding their health status. This
finding may be explained by the medical distrust present in the African American community as
a result of past historical events such as the Tuskegee Syphilis Trial (Outlaw, Bourjolly, & Berg,
2000). Access to medical care did not seem to be a significant problem in our study sample
group since 91% reported that they had health insurance and 98% reported that they had at least
one primary care physician. Although, access to medical care is not a significant in our study
sample, it is a significant contributor to health disparities in the African American population.
This finding suggests that in order to increase risk awareness for diabetes in individuals who are
less responsive to health professionals we should explore interventions that involve other
community members. HBFP participants report that “word of mouth” is one of the more
common ways that they receive information about health conditions they find concerning. For
the past six years the CMH has worked with local barbershops and beauty salons to train barbers
and stylists to be lay health advocates and convey health messages to community members. The
HBFP should continue to train barbers and stylists as lay health advocates in order to relay health

72
messages through the community to better educate community members about diabetes. This
intervention takes advantage of “the word of mouth” information medium commonly reported to
be used by HBFP participants. A possible individual targeted intervention could be to increase
family health history sessions within the barbershop and salon setting. The effectiveness of this
intervention can be evaluated by studying risk perception accuracy and MHLC.
Plescia et al. (2004) used the findings of a strong powerful others HLC in his African
American study population to educate lay health advisors, who then went on to use these
findings by involving ministers and forming partnerships with local churches in order to promote
health behavior change. The Witness Project used African American breast cancer survivors to
provide information and insight about the importance of early detection and breast self exams to
rural African American women in Arkansas. Breast cancer survivors shared their stories and
taught self breast exams to women during regularly scheduled church and community services
(Barroso et al. 2000). Educating individuals within the community to relay information about
diabetes risk, in addition to the use of more targeted one-on-one approaches such as the family
health history session is a multi level outreach plan designed to educate both the community and
the individual about diabetes.
CVD AND POWERFUL OTHERS
Individuals at moderate risk for cardiovascular disease were more likely to overestimate
their risk when they highly valued the opinion of health professionals than those individuals who
did not highly value the opinion of health professionals. This finding suggests that individuals
are more aware of their increased risk for cardiovascular disease; however, health professionals
should still work with these individuals to improve the accuracy of that perception. Efforts
should be made by health professionals to decrease burden and anxiety without compromising

73
accurate risk awareness. Individuals may have feelings of excess burden and anxiety as a result
of their increased risk perception. Studies have shown that individuals with increased anxiety
may exhibit avoidance behaviors when it comes to preventative screening, diet and exercise
(Graham et al. 2006).
One possible explanation for individuals who score high on powerful others and
overestimate their risk for cardiovascular disease is poor communication with their health
professional. Ashton et al. (2003) suggested that one way health disparities emerge is through
doctor-patient interactions due to differences in communication styles when the health
professional and patient are of different racial and cultural backgrounds. Studies have shown that
physician visits with African Americans tend to be less participatory than those with Caucasian
patients (Ashton et al. 2003). A patient’s communication behavior can influence the
communication of the doctor and vice versa. Four randomized trials have shown that coaching
patients in verbal behavior techniques to increase their participation during the physician visit
can increase communication behavior and improve health outcomes (Ashton et al. 2003). Ashton
and his group have been providing a series of community group forums titled “How to Talk With
Your Doctor and Get Your Doctor to Talk With You!” In addition to educating patients, Ashton
suggests that doctors need to provide openings and prompts to help the patient do four things: 1.
provide a health narrative 2.ask questions, 3. express concerns, and 4. be assertive.
Individuals who tend to score higher on the powerful others scale feel that health
professionals are in control of their health and there is little they can do to improve their health
status. For this reason we can speculate that high powerful others patients may not be as
inquisitive about their risk for heart disease; therefore, may be less likely to ask questions of the
health professional. Efforts must be made to empower individuals with the right questions to ask

74
to clarify their disease risk. This can be done by providing handouts through the HBFP mailings
directly to participants’ homes. Information on how to communicate with the physician can be
included in the HBFP monthly newsletter. The HBFP has been providing participants with Ask
Me 3 Literature to teach participants the right questions to ask their doctor. The family health
history intervention is an excellent medium by which individuals can clarify their disease risk
and learn how to facilitate dialogue with their physician about health concerns. Lastly, efforts
should be made to improve patient doctor communication by utilizing verbal behavior coaching
techniques to increase patient participation, providing health forums, and educating physicians
on how to best communicate information about prevention and self-management to patients of
different racial and cultural backgrounds than their own.
OVARIAN CANCER AND INTERNALITY
Women at low risk for ovarian cancer were more likely to correctly estimate their risk if
they were external than if they were internal. Women who were classified as internal
overestimated their risk. Ovarian cancer is a rare disease that is generally not well understood by
the public. It is difficult to detect until its later stages, which in most cases means it has already
metastasized. There is no effective ovarian screening available to the general public. The
lifetime risk for a woman to develop ovarian cancer is less than 2% (ACS, 2008). Women who
are at high risk for ovarian cancer based on family history may choose to have the CA-125 blood
test and transvaginal ultrasound on an annual basis. This screening approach has a false positive
rate of 50%. Some high risk women may choose to have a prophylactic bilateral salpingo-
oophorectomy to remove both ovaries and decrease their risk for ovarian cancer by 95% (ACS,
2008). The negative aspect of the bilateral salpingo-oophorectomy is that it is an invasive

75
procedure and that the removal of the ovaries may increase the risk for heart disease and
osteoporosis in women who have the surgery when they are pre-menopausal.
Because there is no effective general population screening for ovarian cancer at this time,
doctor-patient discussion about ovarian cancer is limited to only those individuals who are high
risk due to a family history. There has been little public health education regarding ovarian
cancer (CDC, 2006). Individuals who are internal are more likely to engage in preventative
behaviors because they feel that they have more control over their future health (Norman et al.
1998). We can speculate that women who are internal are more likely to practice self breast
exams, get annual mammograms to reduce their risk for breast cancer, and get colonoscopies to
reduce their risk for colon cancer. When it comes to ovarian cancer, there may be nothing
women can do to feel in control of their risk. Since there is little education in the medical and
public health settings, and no effective screening for ovarian cancer, women who are internal
may feel like there is little that they themselves can do to reduce their risk for disease. It would
then follow that internal women will actually perceive their risk for ovarian cancer to be higher
than their actual objective risk. External women may be assessing their risk more correctly than
internal women since they are probably more comfortable with the idea that there is little they
can do to reduce their risk for ovarian cancer.
Although, it is true that there is no effective prevention strategy for ovarian cancer, our
findings emphasize the importance of counseling and educating women regarding their risk to
reduce feelings of burden and anxiety. The HBFP family health history initiative provides
participants with the opportunity to sit down with a genetic counseling student and receive one-
on-one counseling regarding cancer risks, including ovarian cancer risk.

76
Furthermore, these findings highlight the importance of community-based outreach
education for not only ovarian cancer, but cancer in general. Conversations with HBFP
participants during the family health history session have revealed that individuals tend to
overestimate their family health history risk for cancer when there are multiple cases in the
family, regardless of the fact that these cases are most likely sporadic, and unrelated.
Furthermore there is literature that supports that individuals tend to overestimate their risk for
cancer when there are multiple cases present in the family history (Vernon, 1999). As noted
earlier, individuals who tend to overestimate their risk for cancer may feel a heightened sense of
anxiety and undue burden. Studies have shown that elevated levels of anxiety may interfere with
adhering to recommended screenings and prevention behaviors and lead to avoidance behavior in
these individuals (Graham et al. 2006). It is equally important to work with individuals who are
overestimating their risk as it is to work with individuals who are unaware of their risk towards a
more accurate risk perception. All individuals should be educated about cancer and have a
realistic understanding of their risk, as well as what can and cannot be done to reduce their risk.
For example, women should be counseled about the high false positive rate of ovarian screening
and why it is reserved for high risk women. The family health history initiative is an excellent
setting for individuals to discuss their risk for cancer. During the family health history session
the genetic counseling student can delineate which families are in fact at high risk for a
hereditary cancer syndrome, which families have a clustering of cancer most likely occurring by
chance, and those families in which the cancer is most likely due to environmental causes (i.e.
lung cancer and cervical cancer). The student is trained to educate the participant about their
cancer risk, appropriate screening and prevention strategies, and refer those who are at high risk

77
for hereditary cancer to genetic counseling. In addition to the family health history, the HBFP
has created monthly cancer forums to educate individuals about cancer risk, and prevention.
Previous work has shown the effectiveness of the family health history session at
improving risk perception accuracy for colon cancer and heart disease (Murphy, 2005). Further
evaluation is warranted to determine if the effectiveness of the family health history session in
improving risk perception for individuals with both and external and internal locus of control. It
is the hope of the Healthy Black Family Project that the family health history initiative may serve
as an effective tool for improving risk perception not only in the Healthy Black Family Project
community here in Pittsburgh, but may one day be used as a model intervention in other
community settings nationwide.
The findings of the MHLC and risk perception analysis emphasize the importance of
tailoring outreach approaches to health locus of control. These findings suggest that bringing
health professionals into the community to facilitate dialogue about disease risk, improving
communication between health providers and their patients, working within the community to
encourage health screening and prevention behaviors, and using the family health history
initiative to improve risk perception accuracy are all important avenues to further explore in
health promotion efforts in the areas of cardiovascular disease, diabetes, and ovarian cancer.
5.2 HEALTH BEHAVIOR ANALYSIS
The Health Behavior analysis reveals that individuals are maintaining or working towards
increasing their level of physical activity, becoming more active information seekers, and
enrolling in the research recruitment database regardless of their health locus of control.

78
Our findings show that there were no statistically significant differences between
externals and internals across all three subscales of the health locus of control and likelihood to
maintain or work towards increasing their level of physical activity. The majority of our sample,
46 of 69 individuals or 68%, was physically active for at least 30 days to begin with. The
majority (72%) of these individuals maintained their level of physical activity regardless of
whether their degree of internality, regardless of their beliefs about the role that fate, luck,
chance and health professionals played in their overall well being. The remaining 22 individuals
who were not physically active at the start of our study showed similar results. The majority of
these participants moved in the direction of working towards increasing their level of physical
activity regardless of their degree of internality, their beliefs about chance, and their value of the
opinion of health professionals.
Our study similarly found no statistically significant differences between individuals
across all three subscales of the MHLC and their likelihood to increase level of information
seeking behavior, to increase frequency of information seeking behavior, and to enroll in the
Minority Research Recruitment database.
Health locus of control has been shown to be a predictor of health behavior in several
large scale studies. Norman et al. (1998) utilized the MHLC to study participation in health
behaviors in 11,632 individuals from the UK. The health behaviors studied were exercise, diet,
smoking, and alcohol consumption. The results of the study revealed that a strong belief that
one’s health is under one’s control was correlated with performance of a greater number of
health behaviors. This result supports prior findings that individuals who score high on the
internality scale are more likely to engage in health behaviors. In order to study likelihood to
participate in health information seeking behavior, Hashimoto and Fukuhara (2004) administered

79
the MHLC to 3395 randomly selected Japanese individuals. The findings of their study revealed
that individuals were more likely to participate in health information seeking if they scored low
on powerful others scale. In other words, individuals who are less dependent on powerful others
were more likely to participate in health information seeking. The results of our study indicate
that the majority of HBFP participants participate in health promoting behaviors regardless of
their health locus of control scores. One possible explanation for the pattern of behavior change
observed in our study is that the HBFP is an effective intervention in that it reaches out to the
diverse psychosocial needs of its community population. The Healthy Black Family Project has
been able to engage individuals who feel that they have little control over their health, as well as
those individuals who feel that the greater part of their health lies within their own hands.
Another possible explanation for the pattern of behavior change occurring regardless of health
locus of control is that our study is limited by a sample size that is too small to detect differences
between external and internal individuals. However, the finding that the majority of the
participants in this study increased their level of participation in health promoting behaviors
despite their health locus of control score provides preliminary evidence that the HBFP has been
successful at targeting individuals with diverse psychosocial needs. Further exploration is
necessary to clarify whether or not the HBFP is reaching out to both external and internal
individuals.
Obesity and chronic diseases such as diabetes, hypertension, cardiovascular disease, and
cancer are, now more than ever, on the rise in the American population with African Americans
carrying the greater portion of the disease burden (Graham et al, 2006). Prevention through
education is the first line of defense against chronic disease. It is the goal of public health
professionals to decrease the burden of chronic disease. Psychosocial barriers often stand in the

80
way of participation in preventative behaviors such as physical activity, information seeking, and
enrollment in clinical research. These psychosocial barriers include feelings of helplessness, lack
of control, mistrust of health professionals, and sometimes, too much trust in health professionals
(the belief that health professionals can cure all illnesses).
From a public health perspective our study is relevant because our findings suggest that
the HBFP breaks through psychosocial barriers, allowing individuals to work to improve their
health behaviors regardless of their health locus of control. Furthermore, our study is relevant
because it supports that the HBFP can be used as an effective model for community based
outreach intervention projects nationwide to decrease the burden of chronic disease in minority
populations by educating individuals about their risk, and empowering them with ways to reduce
the risk. The Healthy Black Family project has utilized different approaches for disseminating
information to individuals with differing levels of health information seeking behaviors,
maximizing the role of health professionals in community outreach, and targeting minority
involvement in clinical research. Community health outreach programs should implement
tailored interventions in order to transcend psychosocial barriers and encourage individuals with
differing loci of control to participate in physical activity, information seeking, and medical
research.
5.3 STUDY LIMITATIONS
The health behavior analysis may have been limited by the sample size of 68 participants.
It is necessary to perform this analysis on a larger sample size to ensure relationships between

81
MHLC, outcome measures, and risk perception are detected. An adequate sample size would be
125 individuals.
This study had several limitations. One of the limitations is that the study population is
not diverse primarily including African Americans. However, this study set out to oversample
African Americans as all of the participants of this study were recruited through the Healthy
Black Family Project. The implications of the findings of this study are limited to the African
American population.
Additionally, this study is limited by sample bias. Since all of the participants were
recruited through the Healthy Black Family Project individuals in this study may be highly
motivated individuals set on increasing their levels of physical activity, information seeking
behavior, and participating in medical research.
In addition to the above form of sample bias, there may be another form of sample bias
since only individuals who completed a family health history session were recruited for the
purpose of this study. Although, genetic counseling students emphasize that knowledge of family
health history is not a prerequisite for participation in the family health history session, those
individuals who have little knowledge of their family health history may have opted not to
participate. Those individuals who already know their family health history may have opted not
to participate. Since these individuals may not have participated in the family health history
session it is quite possible that the risk perception analysis may have been skewed to individuals
that have moderate knowledge of family history.
Another limitation of this study is that physical activity behaviors and information
seeking behaviors were all based on self report. Therefore, it is difficult to know whether or not
82
individuals actually did increase their level of physical activity and information seeking
behavior.
Family health history information was self reported and was not verified by death
certificates or medical record therefore participants may have chosen to leave out certain
information about their family health history. Self-reported information may have resulted in
altered results of the Scheuner criteria-based risk assessment for the risk perception analysis.
Level of activity in the Healthy Black Family Project was not documented. Individuals
were considered active if they were a member of the HBFP and had participated in the family
health history session.
This study was limited by a short term follow up time period of 1 to 3 months. It would
be useful to assess the impact of the HBFP on physical activity and information seeking
behaviors at the 1 year time point to determine if individuals maintained or worked to increase
their level of physical activity and information seeking behaviors.
Lastly, there was no direct measure of self-efficacy in this study. Self-efficacy is the
belief in one’s ability to perform a particular behavior. For future studies of MHLC it may be
beneficial to include a measure of self-efficacy.
5.4 FUTURE PLANS
This study highlighted the areas of diabetes, cardiovascular disease, and ovarian cancer as
those that would benefit from approaches tailored to locus of control for risk awareness

83
education. Future work should use the MHLC to evaluate the effectiveness of the family health
history intervention at improving the accuracy of risk perception for diabetes, cardiovascular
disease, and ovarian cancer. This work will help determine the effectiveness of the family health
history intervention in educating individuals with differing loci of control about their disease
risk.
Further work can be done to explore whether MHLC is related to objective risk and an
individual’s likelihood to participate in screening health behaviors such as mammography,
colonoscopy, and prostate cancer screening. This study can be further expanded to look at
changes in diet, smoking cessation, and other health behaviors.

84
6.0 CONCLUSION
This study evaluated the MHLC in an African American, community based public
health outreach intervention program. This study has important clinical and public health
implications. We set out to explore the psychosocial needs of the Healthy Black Family Project
participants and how our project could best address those needs. We did this by using the MHLC
to study differences in risk perception accuracy so that we could highlight which disease areas
were in need of better tailored risk education approaches. We also used the MHLC to study
physical activity, information seeking behaviors, and enrollment in medical research among our
participants to determine how the HBFP can become more successful at targeting individuals
with differing loci of control.
Risk perception analysis was performed on a total of 87 participants who completed the
MHLC and family health history session. Out of our initial study population of 87 participants 68
also completed the follow up survey 1 to 3 months after the initial family health history session.
Participants were asked about their level of physical activity and information seeking behavior at
follow up. The outcome measure analysis was performed on the 68 individuals who completed
both the initial family history session and the follow up.
Each individual’s MHLC questionnaire was scored on three different scales: internality,
chance, and powerful others. Individuals were classified as high internals vs. low internals, high
chance vs. low chance, and high powerful others vs. low powerful others. Internals are those

85
individuals who feel that their health is the result of their own actions. High chance scorers are
those individuals who feel that their health is the result of chance, luck, and fate. High powerful
others scores are those individuals who feel that health professionals, and family members play a
large role in their health status.
Based on Scheuner et al. (1997) risk criteria we identified individuals at low, moderate,
and high risk for a series of multifactorial chronic diseases. We then compared their risk
perception to their objective risk to determine accuracy. Once accuracy was determined we
checked for differences on MHLC subscale scores. We identified the areas of diabetes,
cardiovascular disease, and ovarian cancer as areas in which participants would benefit from risk
education tailored to their locus of control. We suggest that approaches to improve risk
perception accuracy be tailored to address individuals with differing loci of control by:
1. Maximizing the role of powerful others; 2. Improving communication between health
professionals and their patients; 3. Maximizing the role of community members; 4. Using the
family health history intervention as a way to counsel individuals to decrease undue burden and
anxiety, without compromising accurate risk perception in individuals who tend to overestimate
their risk.
MHLC scores were used to search for relationships between health locus of control and
health behaviors such as physical activity, information seeking, and enrollment in research. We
found that individuals maintained or were working to increase their level of physical activity,
increased their level and frequency of information seeking behavior, and enrolled in the research
recruitment database regardless of their internality, beliefs in chance, fate, and luck, and the
value they placed on the role of powerful others in their health status. We believe that the pattern
of behavior change observed in this exploratory study may preliminary evidence that the HBFP

86
is effective at promoting positive health behavior change in both external and internal
individuals. We recommend that the MHLC and Health Behavior analysis be continued for
further exploration of HBFP outreach efforts.
The goal of any public health promotion campaign is to improve the overall health and
quality of life of its targeted population. There is great psychosocial diversity within a population
and it is important to understand this diversity in order for outreach efforts to truly reach out to
all kinds of individuals. There are many psychosocial barriers that stand in the way of making
changes to health behavior. Individuals may feel helpless and unlucky when it comes to control
of their health. These individuals may often be missed by health programs that are targeted to
more proactive individuals. Health Locus of Control is thought to be a state, not a trait, and can
be influenced by life experiences and well designed health programs. The Healthy Black Family
Project is tailored to a diverse group of individuals and is able to reach out to those who may be
missed by other health programs. The MHLC is a useful measure to assess the effectiveness of
health programs to reach out to individuals with differing loci of control and can help shed light
on how to maximize the effectiveness of health programs by tailoring them to the individuals
whose health we aim to improve.

87
APPENDIX A
RISK PERCEPTION ANALYSIS
DATA TABLES

88
Table 12. Diabetes risk perception and comparison of MHLC subscale scores
Scale Accurate Overestimate Underestimate p-value n (%) n(%) n(%) Internality Low risk p=0.433 Internals 7(44%) 9(56%) n/a Externals 3(23%) 10(77%) n/a Moderate risk p= n/a Internals 0 0 1 Externals 1 3 1 High risk p= 1.000 Internals 8(50%) n/a 8 (50%) Externals 7(47%) n/a 8(53%) Chance Low risk p=0.449 High chance 3(25%) 9(75%) n/a Low chance 7(41%) 10(59%) n/a Moderate risk p=n/a High chance 0 1 0 Low chance 1 2 2 High risk High chance 8(62%) n/a 5(39%) p=0.269 Low chance 6(35%) n/a 11(65%) Powerful Others Low risk p=1.000 High po 5(33%) 10(67%) n/a Low po 5(36%) 9(64%) n/a Moderate risk p=n/a High po 0 2 0 Low po 1 1 2 High risk High po 10(77%) n/a 3(23%) p=0.011 Low po 5(28%) n/a 13(72%)

89
Table 13. CVD risk perception and comparison of MHLC subscale scores
Scale Accurate Overestimate Underestimate p-value n (%) n(%) n(%) Internality Low risk p=0.691 Internals 3(30%) 7(70%) n/a Externals 6(40%) 9(60%) n/a Moderate risk p= 1.000 Internals 4(33%) 6(50%) 2(17%) Externals 2(40%) 2(40%) 1(20%) High risk p= 1.000 Internals 8(53%) n/a 7 (47%) Externals 10(56%) n/a 8(44%) Chance Low risk p=1.000 High chance 3(38%) 5(63%) n/a Low chance 6(35%) 11(65%) n/a Moderate risk p=0.196 High chance 4(57%) 3(43%) 0 Low chance 2(20%) 5(50%) 3(30%) High risk High chance 7(44%) n/a 9(56%) p=0.479 Low chance 10(63%) n/a 6(38%) Powerful Others Low risk p=0.226 High po 3(23%) 10(77%) n/a Low po 6(50%) 6(50%) n/a Moderate risk p=0.005 High po 0 6 (100%) 0 Low po 6(55%) 2(18%) 3 (27%) High risk High po 9(56%) n/a 7(44%) p=1.000 Low po 9(53%) n/a 8(47%)

90
Table 14. Colon cancer risk perception and comparison of MHLC subscale scores
Scale Accurate Overestimate Underestimate p-value n (%) n(%) n(%) Internality Low risk p=0.808 Internals 19(56%) 15(49%) n/a Externals 19(60%) 13(40%) n/a Chance Low risk p=0.622 High chance 17(61%) 11(39%) n/a Low chance 20(54%) 17(46%) n/a Powerful Others Low risk p=0.083 High po 12(44%) 15(56%) n/a Low po 26(67%) 13(33%) n/a
Table 15. Breast cancer risk perception and comparison of MHLC subscale scores
Scale Accurate Overestimate Underestimate p-value n (%) n(%) n(%) Internality Low risk p=0.453 Internals 13(42%) 18(58%) n/a Externals 17(53%) 15(47%) n/a Moderate risk Sample size too small for analysis High risk Sample size too small for analysis Chance Low risk p=0.794 High chance 12(46%) 14(54%) n/a Low chance 17(47%) 19(56%) n/a Powerful Others Low risk p=0.802 High po 13(50%) 13(50%) n/a Low po 17(46%) 20(54%) n/a

91
Table 16. Ovarian cancer risk perception and comparison of MHLC subscale scores
Scale Accurate Overestimate Underestimate p-value n (%) n(%) n(%) Internality Low risk p=0.040 Internals 13(43%) 17(57%) n/a Externals 22(71%) 9(29%) n/a Moderate risk Sample size too small for analysis High risk Sample size too small for analysis Chance Low risk p=1.000 High chance 12(57%) 9(43%) n/a Low chance 22(56%) 17(44%) n/a Powerful Others Low risk p=0.117 High po 12(44%) 15(56%) n/a Low po 23(68%) 11(33%) n/a

92
APPENDIX B
IRB APPROVAL LETTER

93

94
APPENDIX C
MULTIDIMENSIONAL HEALTH LOCUS OF CONTROL AND SCORING
INSTRUCTIONS

95
Form A Instructions: Each item below is a belief statement about your medical condition with which you may agree or disagree. Beside each statement is a scale which ranges from strongly disagree (1) to strongly agree (6). For each item we would like you to circle the number that represents the extent to which you agree or disagree with that statement. The more you agree with a statement, the higher will be the number you circle. The more you disagree with a statement, the lower will be the number you circle. Please make sure that you answer EVERY ITEM and that you circle ONLY ONE number per item. This is a measure of your personal beliefs; obviously, there are no right or wrong answers.
1=STRONGLY DISAGREE (SD) 2=MODERATELY DISAGREE (MD) 3=SLIGHTLY DISAGREE (D)
4=SLIGHTLY AGREE (A) 5=MODERATELY AGREE (MA) 6=STRONGLY AGREE (SA)
SD MD D A MA SA
1 If I get sick, it is my own behavior which determines how soon I get well again. 1 2 3 4 5 6
2 No matter what I do, if I am going to get sick, I will get sick. 1 2 3 4 5 6
3 Having regular contact with my physician is the best way for me to avoid illness. 1 2 3 4 5 6
4 Most things that affect my health happen to me by accident. 1 2 3 4 5 6 5 Whenever I don't feel well, I should consult a medically trained professional. 1 2 3 4 5 6 6 I am in control of my health. 1 2 3 4 5 6 7 My family has a lot to do with my becoming sick or staying healthy. 1 2 3 4 5 6 8 When I get sick, I am to blame. 1 2 3 4 5 6 9 Luck plays a big part in determining how soon I will recover from an illness. 1 2 3 4 5 6 10 Health professionals control my health. 1 2 3 4 5 6 11 My good health is largely a matter of good fortune. 1 2 3 4 5 6 12 The main thing which affects my health is what I myself do. 1 2 3 4 5 6 13 If I take care of myself, I can avoid illness. 1 2 3 4 5 6
14 Whenever I recover from an illness, it's usually because other people (for example, doctors, nurses, family, friends) have been taking good care of me. 1 2 3 4 5 6
15 No matter what I do, I 'm likely to get sick. 1 2 3 4 5 6 16 If it's meant to be, I will stay healthy. 1 2 3 4 5 6 17 If I take the right actions, I can stay healthy. 1 2 3 4 5 6 18 Regarding my health, I can only do what my doctor tells me to do. 1 2 3 4 5 6

96
SCORING INSTRUCTIONS FOR THE MHLC SCALES
SUBSCALE FORM(s) POSSIBLE RANGE ITEMS Internal A, B, C 6 - 36 1, 6, 8, 12, 13, 17 Chance A, B, C 6 - 36 2, 4, 9, 11, 15, 16 Powerful Others A, B 6 - 36 3, 5, 7, 10, 14, 18

97
APPENDIX D
PRE SURVEY QUESTIONNAIRE
An important aim of genetic counseling is to provide risk information so that individuals and families can make better informed decisions about their health and that of their families. The purpose of this survey is to explore your perceptions of risk for developing certain health conditions. We want to understand whether family health histories (i.e., sharing information about diseases in your family) can help provide you with a more accurate assessment of your risk for developing particular health conditions.
If there is a question that you do not feel comfortable answering, you can skip it and continue on. Please answer the following questions to the best of your ability. DO NOT PROVIDE ANY NAMES OF FAMILY MEMBERS. The survey should take approximately 10 minutes. We would like to thank you in advance for your willingness to participate in this survey. Section 1: General Information
1) What is your age? __ __ age in years 2) What is your gender?
1 - Male 2 - Female
3) Are you Hispanic or Latino?

98
1 - Yes 2 - No 3 - Don’t know
3a) Which one or more of the following would you say is your race? (Check all that
apply)
1 - White 2 - Black or African American 3 - Asian 4 - Native Hawaiian or Other Pacific Islander 5 - American Indian, Alaska Native 6 - Other [specify] __________________________
4) What was the total household income from all sources last year?
1 - Less than $10,000 2 - Between $10,000 and $20,000 3 - Between $20,001 and $35,000 4 - Between $35,001 and $50,000 5 - Between $50,001 and $75,000 6 - Greater than $75,000
5) What is the highest grade or year of school you completed?
1 - Grades 8 or less (Elementary) 2 - Grades 9 through 11 (Some high school) 3 - Grade 12 or GED (High school graduate) 4 - College 1 year to 3 years (Some college or technical school) 5 - College 4 years or more (College graduate or post-graduate) 6 - Graduate level (Masters or PhD)
6) How would you rate your knowledge on genetics?
1 - Excellent 2 - Very good 3 - Good 4 - Fair 5 - Poor
7) How would you describe your general health?

99
1 - Excellent 2 - Very good 3 - Good 4 - Fair 5 - Poor 8) Do you smoke?
1 - Yes 2 - No
9) How would you describe your weight?
1 - Underweight 2 - Healthy weight 3 - Overweight 4 - Obese
10) Do you have one person you think of as your personal doctor or health care provider?
1 - Yes, only one 2 – Yes, more than one 3 - No 4 - Don’t know / Not sure
11) Was there a time in the past 12 months when you needed to see a doctor but could not
because of the cost? 1 - Yes 2 - No 3 - Don’t know / Not sure
12) Do you have any kind of health care coverage, including health insurance, prepaid
plans such as HMOs, or government plans such as Medicare? 1 - Yes 2 - No 3 - Don’t know / Not sure

100
Section 2: Physical Activity Habits Definition of Physical Activity: The national recommendation for physical activity is
engaging in moderate physical activity (walking briskly, mowing the lawn, dancing, bicycling) for 30 minutes a day 5 or more days a week OR engaging in vigorous physical activity (jogging, high-impact aerobics, swimming) for 20-30 minutes a day 3 or more days a week.
11) Based on this definition, are you physically active? 1 - Yes, I have been for more than 6 months
2 - Yes, I have been for less than 6 months 3 - No, but I am planning on starting in the next 30 days 4 - No, but I am thinking about starting in the next 6 months 5 - No, and I don’t plan to start in the next 6 months
12A) If you answered YES to question 11, how often do you exercise on average? 1 - One time/week 2 - Two to three times/week 3 - Four or more times/week 12B) If you answered YES to question 11, what is the length of your workouts on
average? 1 - 30 minutes or less 2 - 30 – 45 minutes 3 - 45 minutes or more
12C) If you answered NO to question 11, do you get some physical activity but not
enough to fit the definition? 1 - Yes 2 - No

101
Section 3: Risk Perception 13) In your opinion, how often do you believe each of the following factors increases (or
contributes to) an individual’s chance or risk for developing a disease? (Please respond for each item listed)
1=Never 2= Sometimes 3=Always 4=Don’t know / Not sure
Smoking _______ Having a poor diet _______ Lack of exercise _______ Family history (other family members with a disease) _______ 14) What do you think the chances are of a healthy woman the same age as you to
develop the following health conditions sometime in her life? (Please respond for each condition listed)
1=Low (<10%) 2=Moderate (10-50%) 3=High (>50%) 4=Don’t know / Not sure
Breast cancer _______ Ovarian cancer _______ Colon cancer _______ Heart disease _______ Lung cancer _______ Diabetes _______ Alzheimer’s disease _______ High Blood Pressure _______

102
15) What do you think the chances are of a healthy man the same age as you to develop the following health conditions sometime in his life? (Please respond for each condition listed)
(Please respond for each condition listed)
1=Low (<10%) 2=Moderate (10-50%) 3=High (>50%)
4=Don’t know / Not sure Breast cancer _______ Colon cancer _______ Prostate cancer _______ Heart disease _______ Lung cancer _______ Diabetes _______ Alzheimer’s disease _______ High Blood Pressure _______ 16) Have you ever been concerned about your chances for developing any of these health
conditions? 1 - Yes 2 - No 16a) If yes, which condition(s)? ____________________________________ 17) On a scale from 1 (not concerned) – 5 (extremely concerned), how would you rate
your concern about developing any of the above health condition(s)? _______ 18) Do you have a blood relative (mother, father, sister, brother, uncle, aunt,
grandmother, grandfather) who had or has a health condition that you are concerned about developing sometime in your life?
1 - Yes 2 - No 3 - Don’t know / Not sure
18a) If YES, who had the condition and what was it? *DO NOT INCLUDE NAMES OF FAMILY MEMBERS, ONLY THE
RELATIONSHIP TO YOU ______________________________________________________________________________ ______________________________________________________________________________
________________________________________________________________________

103
19) Have you ever talked to a health provider about your concern for developing that particular health condition?
1 - Yes 2 - No 3 - Don’t know / Not sure
19a) If yes, which condition (s)? _______________________________________________
20) At this time, what do you think your chances are of developing any of the following health conditions sometime in your life? (Please respond for each condition listed)
1=Low (<10%) 2=Moderate (10-50%) 3=High (>50%) 4=Don’t know / Not sure 5=I already have the condition
Breast cancer ______ Ovarian cancer (Females Only) ______ Colon cancer ______ Prostate cancer (Males Only) ______ Heart disease ______ Lung cancer ______ Diabetes ______ Alzheimer’s disease ______ High Blood Pressure ______

104
21) At this time, what do you think your chances are of developing any of the following health conditions someday, compared with most individuals your age?
(Please respond for each condition listed)
ML=Much lower SL=Somewhat lower S=Same SH=Somewhat higher MH=Much higher DK=Don’t know / Not sure AH=I already have the condition
Breast cancer _______ Ovarian cancer (Females Only) _______ Colon cancer _______ Prostate cancer (Males Only) _______ Heart disease _______ Lung cancer _______ Diabetes _______ Alzheimer’s disease _______ High Blood Pressure _______

105
Section 4: Multidimensional Health Locus of Control
Form A Instructions: Each item below is a belief statement about your medical condition with which you may agree or disagree. Beside each statement is a scale which ranges from strongly disagree (1) to strongly agree (6). For each item we would like you to circle the number that represents the extent to which you agree or disagree with that statement. The more you agree with a statement, the higher will be the number you circle. The more you disagree with a statement, the lower will be the number you circle. Please make sure that you answer EVERY ITEM and that you circle ONLY ONE number per item. This is a measure of your personal beliefs; obviously, there are no right or wrong answers.
1=STRONGLY DISAGREE (SD) 2=MODERATELY DISAGREE (MD) 3=SLIGHTLY DISAGREE (D)
4=SLIGHTLY AGREE (A) 5=MODERATELY AGREE (MA) 6=STRONGLY AGREE (SA)
SD MD D A MA SA
1 If I get sick, it is my own behavior which determines how soon I get well again. 1 2 3 4 5 6
2 No matter what I do, if I am going to get sick, I will get sick. 1 2 3 4 5 6
3 Having regular contact with my physician is the best way for me to avoid illness. 1 2 3 4 5 6
4 Most things that affect my health happen to me by accident. 1 2 3 4 5 6 5 Whenever I don't feel well, I should consult a medically trained professional. 1 2 3 4 5 6 6 I am in control of my health. 1 2 3 4 5 6 7 My family has a lot to do with my becoming sick or staying healthy. 1 2 3 4 5 6 8 When I get sick, I am to blame. 1 2 3 4 5 6 9 Luck plays a big part in determining how soon I will recover from an illness. 1 2 3 4 5 6 10 Health professionals control my health. 1 2 3 4 5 6 11 My good health is largely a matter of good fortune. 1 2 3 4 5 6 12 The main thing which affects my health is what I myself do. 1 2 3 4 5 6 13 If I take care of myself, I can avoid illness. 1 2 3 4 5 6
14 Whenever I recover from an illness, it's usually because other people (for example, doctors, nurses, family, friends) have been taking good care of me. 1 2 3 4 5 6
15 No matter what I do, I 'm likely to get sick. 1 2 3 4 5 6 16 If it's meant to be, I will stay healthy. 1 2 3 4 5 6 17 If I take the right actions, I can stay healthy. 1 2 3 4 5 6 18 Regarding my health, I can only do what my doctor tells me to do. 1 2 3 4 5 6

106
APPENDIX E
POST SURVEY QUESTIONNAIRE
We hope that you enjoyed having your family health history done. We would like to ask you a few more questions about risk to see if the family health history
session changed your ideas about what conditions you might be at risk for. In addition, this post-session survey is looking at your opinions regarding participating in research.
If there is a question that you do not feel comfortable answering, you can skip it and continue on. Please answer the following questions to the best of your ability. DO NOT PROVIDE ANY NAMES OF FAMILY MEMBERS. The survey should take approximately 10 minutes. We would like to thank you in advance for your willingness to participate in this survey.
Section 1: Physical Activity Habits
1) Based on our discussion, do you think that you will increase your physical activity? 1 - Yes 2 - No Section 2: Risk Perception
2) In your opinion, how often do you believe each of the following factors increases (or contributes to) an individual’s chance or risk for developing a disease?

107
(Please respond for each item listed)
1=Never 2= Sometimes 3=Always 4=Don’t know / Not sure
Smoking _______ Having a poor diet _______ Lack of exercise _______ Family history (other family members with a disease) _______

108
3) Based on your family health history, what do you think your chances are of developing any of the following health conditions sometime in your life?
(Please respond for each condition listed)
1=Low (<10%) 2=Moderate (10-50%) 3=High (>50%) 4=Don’t know / Not sure 5=I already have the condition
Breast cancer ______ Ovarian cancer (Females Only) ______ Colon cancer ______ Prostate cancer (Males Only) ______ Heart disease ______ Lung cancer ______ Diabetes ______ Alzheimer’s disease ______ High Blood Pressure ______ 4) Based on your family health history, what do you think your chances are of
developing any of the following health conditions someday, compared with most individuals your age?
(Please respond for each condition listed)
ML=Much lower SL=Somewhat lower S=Same SH=Somewhat higher MH=Much higher DK=Don’t know / Not sure AH=I already have the condition
Breast cancer _______ Ovarian cancer (Females Only) _______ Colon cancer _______ Prostate cancer (Males Only) _______ Heart disease _______ Lung cancer _______ Diabetes _______ Alzheimer’s disease _______ High Blood Pressure _______

109
Section 3: Opinions on Research
5) How important do you feel that medical research is? 1 - Very important 2 - Somewhat important 3 - Not very important 4 - Not important at all 5 - Don’t know
6) Have you ever participated as a subject in any medical research studies?
1 - Yes 2 - No 3 - Don’t know
7) Have you ever been offered the chance to participate in a medical research study, but decided not to participate?
1 - Yes 2 - No 3 - Don’t know
8) If you were to describe your general attitude towards medical research involving people, would you say that you feel …?
1 - Very favorable 2 - Somewhat favorable 3 - Somewhat unfavorable 4 - Very unfavorable 5 - Neither favorable nor unfavorable 6 - Don’t know
9) Would the offer of free medical care make you more likely or less likely to agree to participate in research?
1 - More likely 2 - Less likely 3 - No effect 4 - Don’t know

110
10) Would the offer of $500 make you more likely or less likely to agree to participate in research?
1 - More likely 2 - Less likely 3 - Have no effect 4 - Don’t know
11) Would the offer of free medicine make you more likely or less likely to agree to participate in research?
1 - More likely 2 - Less likely 3 - Have no effect 4 - Don’t know
12) How much do you think scientists benefit from medical research?
1 - A great deal 2 - A moderate amount 3 - Only a little 4 - Not at all 5 - Depends
13) How much do you think your community benefits from medical research?
1 - A great deal 2 - A moderate amount 3 - Only a little 4 - Not at all 5 - Depends
14) How much do you think your family and friends benefit from medical research?
1 - A great deal 2 - A moderate amount 3 - Only a little 4 - Not at all 5 - Depends

111
15) How much do you think you benefit from medical research? 1 - A great deal 2 - A moderate amount 3 - Only a little 4 - Not at all 5 - Depends
16) Do you have an interest in having your name in a database that would allow you to receive information about clinical research studies related to your family health history? NOTE: Answering YES to this question DOES NOT enter you into any database nor does it sign you up to receive any information.
1 - Yes 2 - No
16a) If you answered YES, what are your expectations? (Please circle all that apply)
1 - I expect to receive information about all of the latest research studies. 2 - I expect to receive information about studies that I am eligible for. 3 - I expect to be rewarded for participating in research (paid, free health care, etc.) 4 - I expect to get the best health care available. 5 - Other:_________________________________________________________
16b) If you answered NO, what are your primary reasons? (Please circle all that apply)
1 - I am not interested in participating in research. 2 - I am not interested in anything tied to my family/my genetics. 3 - I do not want to be part of a database. 4 - I do not want to disclose my contact information. 5 - Other:_______________________________________________________
17) How would you describe your experience with having your family health history taken? (Please circle all that apply)
1 - Enjoyable 2 - Informative 3 - Uncomfortable/Unpleasant 4 - Neutral/No opinion

112
Section 4: Information Seeking Behavior 18) Do you think that you will share the Family Health History with your doctor?
1 - Yes 2 - No
19) Do you think that you will share the Family Health History with your family?
1 - Yes 2 - No
20) I am comfortable when it comes to talking to my doctor about health concerns. 1 - Agree Strongly 2 - Agree Moderately 3 - Agree Slightly 4 - Disagree Slightly 5 - Disagree Moderately 6 - Disagree Strongly 21) What are the barriers, if there are any, which stand in the way of you talking to your
doctor about health concerns? (Circle all that apply)
1 - Not enough time during the appointment 2 - I am never sure which questions to ask 3 - I do not want to talk to my doctor about my health concerns 4 - I am afraid I would not understand the information 5 - I don’t feel there are any barriers 6 - Other________________________________________
22) If there are barriers which stand in the way of talking to your doctor about health
concerns, what do you think would help you get past those barriers?

113
23) I am comfortable discussing family history and health concerns with my family
members 1 - Agree Strongly
2 - Agree Moderately 3 - Agree Slightly 4 - Disagree Slightly 5 - Disagree Moderately 6 - Disagree Strongly 24) What are the barriers, if there are any, which stand in the way of you talking to your
family about health concerns? (Circle all that apply)
1 - Fear of health conditions 2 - My family does not discuss health concerns 3 - Difficult to find the time to talk 4 - Other_____________________
25) If there are barriers which stand in the way of talking to your family about health
concerns, what do you think would help you get past those barriers? 26) Where do you seek information regarding health conditions you are concerned about?
1 - Doctor 2 - Library 3 - Internet 4 - Family and friends 5 - Community health fair 6 - Other______________

114
27) Circle the statement that most closely resembles your information seeking behavior. 1 - I am aware of the health conditions that run in my family, but I do not feel the need to do any more research on these conditions. 2 - I am aware of the health conditions that run in my family and I read about these conditions when the information is provided for me. 3 - I have done some of my own research on health conditions that I am concerned about. 4 - I actively keep up with current research on health conditions that I am concerned about.
28) How frequently do you research health conditions that you are concerned about?
1 - Very Frequently 2 - Frequently 3 - Occasionally 4 - Rarely 5 - Very Rarely 6 - Never
Thank you for taking the time to answer these few questions. Your participation is greatly appreciated.

115
APPENDIX F
FOLLOW UP SURVEY QUESTIONNAIRE

116
Date: __________________ Person Making Phone Call: _______________________________ INTERVIEWER: ASK TO SPEAK WITH THE INDIVIDUAL WHO GAVE US HIS
OR HER NAME AND TELEPHONE NUMBER. IF YOU ARE TOLD THAT THE PERSON IS NOT HOME, SCHEDULE A CALL-BACK. WHEN YOU ARE SPEAKING WITH THE INDIVIDUAL, READ…
Hi, my name is ___________ and I am calling from the Center for Minority Health at the
University of Pittsburgh. About a month ago, you completed a survey and had your family health history (family tree) completed at ______________. As you may recall, you agreed to let us contact you for a follow-up questionnaire. I just have a couple of brief questions to ask you. It should take about five minutes. Is it okay to proceed with the questions?
□ Yes □ No – end interview
If Yes → Proceed to Question 1
If No → Thank you for your time. Have a great day.
1) After having your family health history drawn out, which statement best describes how
you felt? (Circle all that apply) 1 - More Informed 2 - More Concerned 3 - Same as before 4 - Confused 5 - Worried 2) Did you tell any one that you had your family health history drawn out?
1 - Yes If Yes → Proceed to Question 2a and 2b 2 - No If No → Proceed to Question 3 2a) Who did you tell about your family health history? 2b) What did you tell them?

117
3) Has anything about your family health history changed since we met?
1 - Yes If Yes → Proceed to Question 3a 2 - No If No → Proceed to Question 4 3a) What has changed about your family health history? 4) Have you contacted any other relatives or researched old records to learn more about
your family history? 1 - Yes 2 - No 5) Have you added to or updated any part of your family health history?
1 - Yes If Yes → Proceed to Question 5a 2 - No If No → Proceed to Question 6 5a) What part of your family health history have you added to or updated? 6) Did you look over the materials/information we sent you with your family health
history?
1 - Yes If Yes → Proceed to Question 6a 2 - No If No → Proceed to Question 7 6a) Did you find the materials/information sent to you helpful? 1 - Yes → Proceed to Question 6b
2 - No → Proceed to Question 7
118
6b) Would you like any additional information? 1 - Yes 2 - No 7) Have you seen a health care professional since you had your family health history
done?
1 - Yes If Yes → Proceed to Question 7a 2 - No If No → Proceed to Question 8 7a) Did you show your family health history to the health care professional?
1 - Yes If Yes → Proceed to Question 7b 2 - No If No → Proceed to Question 8 7b) What did he or she say about it?
(After response proceed to Question 7c) 7c) Did the health care professional put your family health history in your medical file? 1 - Yes 2 - No

119
8) In regards to the following statement: “Having my family health history drawn out has
made me more comfortable in talking my doctor about health concerns,” would you say that you agree strongly, agree moderately, agree slightly, disagree slightly, disagree moderately, or disagree strongly? (Select only one response)
1 - Agree Strongly
2 - Agree Moderately 3 - Agree Slightly 4 - Disagree Slightly 5 - Disagree Moderately 6 - Disagree Strongly 9) In regards to the following statement: “Having my family health history drawn out has
made me more comfortable in talking to my family about health concerns,” would you say that you agree strongly, agree moderately, agree slightly, disagree slightly, disagree moderately, or disagree strongly? (Select only one response)
1 - Agree Strongly 2 - Agree Moderately 3 - Agree Slightly 4 - Disagree Slightly 5 - Disagree Moderately 6 - Disagree Strongly 10) Do you have any plans to show your family health history to your family in the next
six months? 1 - Yes 2 - No

120
11) Do you plan to show your family health history to a health care professional (i.e., doctor, nurse, pharmacist, physician assistant, or genetic counselor) in the next six months?
1 - Yes 2 - No 12) During our meeting, you answered a question about your physical activity; I am
going to read that question to you again to see if your answer has changed. I am going to read you the definition of Physical Activity. The national recommendation
for physical activity is engaging in moderate physical activity (walking briskly, mowing the lawn, dancing, bicycling) for 30 minutes a day 5 or more days a week OR engaging in vigorous physical activity (jogging, high-impact aerobics, swimming) for 20-30 minutes a day 3 or more days a week.
Based on this definition, which of these statements best describes your level of being
physically active? (Select only one response) 1 - Yes, I have been physically active for more than 6 months 2 - Yes, I have been physically active for less than 6 months 3 - No, I have not been physically active, but I am planning on starting in the next 30
days 4 - No, I have not been physically active, but I am thinking about starting in the next 6
months 5 - No, I have not been physically active and I don’t plan to start in the next 6 months
If Answered 3, 4, or 5 → Proceed to Question 12a
If Answered 1 or 2 → Proceed to Question 12b 12a) Have you increased your physical activity, but not enough to fit the
definition? 1 - Yes → Proceed to Question 12b 2 - No → Proceed to Question 12b

121
12b) Did having the family health history drawn out play a role in increasing your
physical activity?
1 - Yes → Proceed to Question 12c 2 - No → Proceed to Question 12c 12c) Do you attend fitness classes at the Kingsley?
1 - Yes → Proceed to Question 12d 2 - No → Proceed to Question 13 12d) What do you feel are the benefits of participating in the fitness classes
offered at Kingsley? Would you say… (Circle all that apply) 1 - Improving current health 2 - Preventing future health problems (i.e. diabetes, hypertension) 3 - Weight Management 4 - Stress Relief 5 - More Energy 6 - Other_________________________________________ 13) What kind of physical activity, if any, do you engage in? (Circle all that apply) 1 - Walking 2 - Jogging 3 - Aerobics 4 - Bicycling 5 - Housework/yardwork 6 - Swimming 7 - None 8 - Other___________________________

122
14) Have you made any other lifestyle changes since we did your family health history? (Circle all that apply) 1 - Improved Diet 2 - Smoking cessation 3 - Talking to doctor about health concerns 4 - Increased health screening (mammogram, colonoscopy, PSA) 5 - Joined a support group 6 - Other_____________ 7 - None If Answered 7 (No changes) → Proceed to Question 14a If Answered 1 thru 6 → Proceed to Question 15 14a) Do you want to or are you planning on making any changes? 1 - Yes → Proceed to Question 14b
2 - No → Proceed to Question 15 14b) Are there any barriers that prevent you from making changes? 1 - Yes → Proceed to Question 14c
2 - No → Proceed to Question 15 14c) What are the barriers that prevent you from making changes?
(After response proceed to Question 14d)

123
14d) Is there anything that would help you make the changes you want? (ie: classes,supportgroups)
15) In regards to the following statement: “Having my family health history drawn out
motivated me to increase my knowledge about health conditions that run in my family,” would you say that you agree strongly, agree moderately, agree slightly, disagree slightly, disagree moderately, or disagree strongly? (Select only one response)
1 - Agree Strongly 2 - Agree Moderately 3 - Agree Slightly 4 - Disagree Slightly 5 - Disagree Moderately 6 - Disagree Strongly
If Answered 1, 2, or 3 → Proceed to Question 15a If Answered 4, 5, or 6 → Proceed to Question 16
15a) How have you increased your knowledge/understanding? (talked to doctor, family, friends, internet, library, etc.) (After response proceed to Question 15b)

124
15b) Which of the following statements most closely resembles your information seeking behavior: (Select only one response)
1 - I am aware of the health conditions that run in my family, but I do not feel the need to do any more research on these conditions. 2 - I am aware of the health conditions that run in my family and I read about these conditions when the information is provided for me. 3 - I have done some of my own research on health conditions that I am concerned about. 4 - I actively keep up with current research on health conditions that I am concerned
about. 16) In regards to the following statement: “How frequently do you research or look for information about health conditions that concern you,” would you say that you look very frequently, frequently, occasionally, rarely, very rarely, or never? (Select only one response) 1 - Very Frequently
2 - Frequently 3 - Occasionally 4 - Rarely 5 - Very Rarely 6 - Never
Thank you for taking the time to answer these few questions. Your participation is greatly appreciated.

125
BIBLIOGRAPHY
American Cancer Society (2008). Detailed Guide: Ovarian Cancer. Retrieved March 7th, 2008 from the world wide web: www.cancer.org
Ashton et al. (2003). Racial and ethnic health disparities in the use of health services. Bias, preferences or poor communication? Journal of General Internal Medicine, 18, p146-152.
Burish, T.G. et al. (1984). Health locus of control and chronic disease: An external orientation may be advantageous. Journal of Social and Clinical Psychology, 2, p326-332.
Centers for Disease Control and Prevention (2004b). Health disparities experiences by Black or African Americans---United States. Morbidity Mortality Weekly Report, 54(1), p1-3.
Centers for Disease Control and Prevention (2005) http://www.cdc.gov/nccdphp/dnpa/physical/
Centers for Disease Control and Prevention (2006) Identifying Public Health Opportunities to Reduce the Burden of Ovarian Cancer. Workshop Summary retrieved from www.cdc.gov
Centers for Disease Control and Prevention Office of Minority Health and Health Disparities (2007). Highlights in minority health and health disparities. Retrieved 10 December 2007, from the world wide web: www.cdc.gov/omhd/Highlights/2007/HFeb07.htm
Chaplin, W.F. et al. (2001). A structural evulation of the expanded multidimensional health locus of control scale with a diverse sample of Caucasian/ European, Native, and Black Canadian women. Journal of Health Psychology, 6(4), p 447-455.
DeVellis, R.F., Devellis, B.M., Wallston, K.A. & Wallston, B.S. (1980) Epilepsy and learned helplessness. Basic and Applied Psychology, t, p241-253
Dishman, R.K., Ickes, W., & Morgan, W.P. (1980) Self-motivation and adherence to habitual physical activity; Journal of Applied Social Psychology, 10, 115-132.
Fischberg, E.B. (1979) Frequency of breast self-examination and health locus of control in women who do and do not participate in consciousness raising. Unpublished master’s thesis. Pace University.
Goldstein. L. (1980) Relationship of health locus of control and individual diabetic management. Unpublished master’s thesis. Pace University.

126
Graham, G.N. et al. (2006). Perceived versus actual risk for hypertension and diabetes in the African American community. Health Promotion Practice, 7(1), p34-36.
Hall, J.A., Roter, D.L., Katz, N.R., (1988) Meta-analysis of correlates of provider behavior in medical encounters. Medical Care. 26,657-675.
Hatz, P.S. (1978) The relationship of life satisfaction and locus of control in patients undergoing chronic hemodialysis. Unpublished master’s thesis. University of Illinois.
Hayes, R.P. et al. (2000). Diabetes in urban African Americans: Assessment of diabetes-specific locus of control in patients with type 2 diabetes. The Diabetes Educator, 26(1)p 121-128.
Hashimoto, H. & Fukuhara, S. (2004). The influence of locus of control on preferences for information and decision making. Patient Education and Counseling, 55, p236-204.
Hunte, H. et al. (2002). The health status of African Americans in Allegheny County: A Black paper for the urban league of Pittsburgh. University of Pittsburgh, p1-20.
Kaplan, G.D. & Cowles, A. Health locus of control and health value in prediction of smoking reduction. Health Education Monographs, 1978, 6, 129-137.
Kaplan SH, Greenfield S, Gandek B, Rogers W.H.. Ware, J.E. (1995) Patient and visit characteristics related to physicians’ participatory decision-making style. Results from the Medical Outcomes Study. Medical Care, 33, p1176-1187.
Key, M.K. (1975) Psychosocial and education factors surrounding compliance behavior of hypertensives. Unpublished doctoral dissertation. George Peabody College for Teachers.
Levin, A. & Shulz, M.A.(1980) Multidimensional health locus of control and compliance in low and high participation hemodialysis. Unpublished master’s thesis, University of Wisconsin, Madison.
Marci, L.M. (1980)The relationship of personality type and health locus of control to delay in seeking medical care for chest pain. Unpublished master’s thesis. St. Louis University.
McCusker, J. & Morrow, G. (1979) The relationship of health locus of control to preventative health behaviors and health beliefs. Patient Counseling and Health Education, 1, 146-150.
Kington, R.S. & Smith, J.P. (1997). Socioeconomic status and racial and ethnic differences in functional status associated with chronic diseases. American Journal of Public Health, 87(5), p805-810.
Marshall, S.J. & Biddle, S.J.H. (2001). The transtheoretical model of behavior change: A meta analysis of applications to physical activity and exercise. Annals of Behavioral Medicine, 23(4), p 229-246.
Matthews, A.K. (2002). Factors influencing medical information seeking among African American cancer patients. Journal of Health Communication, 7, p205-219.

127
Means, J. (2007) The Social Learning Theory of Julian B. Rotter. Retrieved December 10, 2007 from the World Wide Web: http://psych.fullerton.edu/jmearns/rotter.htm
Murphy, V.S. (2005). Exploring the influence of family health histories on risk perception among African Americans: A Quantitative Analysis. Master’s Thesis. Graduate School of Public Health at the University of Pittsburgh.
Nemcek, M.A. (1989). Factors influencing black women’s breast self-examination practice. Cancer Nursing, 12(6), p339-343.
Norman, P., Bennett, P., Smith, C., & Murphy, S. (1998). Health locus of control and health behaviour. Journal of Health Psychology, 3, p171-180.
Outlaw, F.H., Bourjolly, J.N., & Berg, F.K. (2000) A study on recruitment of black Americans into clinical trials through a cultural competencies. Cancer Nursing, 23 (6), 449-451
Plescia, M., & Groblewski, M. (2004). A community- oriented primary care demonstration project: Refining interventions for cardiovascular disease and diabetes. Annals of Family Medicine, 2(2), p103-109.
Scheuner, M.T. et al. (1997) Family History: A Comprehensive Genetic Risk Assessment Method for Chronic Conditions of Adulthood. American Journal of Medical Genetics, 71(3): 312-324.
Schulman et al. (1999). The effect of race and sex on physicians’ recommendations for cardiac catheterization. New England Journal of Medicine, 340, p618-626
Sporles, K.J. (1977) Health locus of control and knowledge of hemodyalisis and health maintenance in patients with chronic renal failure. Unpublished master’s thesis, Virginia Commonwealth University.
Smith, R.A.P., Woodward, N.J., Wallston, B.S., Wallston, K.A., Rye, P. & Zylstra, M. (1988). Health care implications of desire and expectancy for control in elderly adults. Journals of Gerontology, 43, p1-7.
Soler- Vila, H., Kasi, S.V., & Jones, B.A. (1998). Prognostic significance of psychosocial factors in African-American and White breast cancer patients. A population based study. Cancer, 98(6), p1299-1308.
Stein, M., Smith, M., & Wallston, K. A. (1984). Cross-cultural issues in health locus of control beliefs. Psychological Studies, 29, 112-116.
Sturmer, T., Hasselbach, P., & Amelang, M. (2006). Personality, lifestyle, and risk of cardiovascular disease and cancer: follow-up of population based cohort. British Medical Journal, 332, p1359-1366.
Thomas, S. B. (2001). The color line: race matters in the elimination of health disparities. American Journal of Public Health, 91(7), p1046-1048.

128
Thomas, S.B. et al. (2001) Willingness to participate in medical research: The influence of gender, race, and socioeconomic factors. Atlanta. p 1-10.
Toner, J.B. & Manuck, S.B. Health locus of control and health related information seeking at a hypertension screening. Social Science and Medicine, 1979, 13(a), 823
Vernon, S.W. (1999) Risk Perception and Risk Communication for Cancer Screenings: A Review. Journal of the National Cancer Institute Monographs, 25, p101-119
Vogel, K.J. (2005) Development of a Minority Research Recruitment Database: Assessing factors associated with willingness of African Americans to enroll. Master’s thesis. Graduate School of Public Health at the University of Pittsburgh.
Wallston, B. S., Wallston, K. A., Kaplan, G. D., & Maides, S. A. (1976). The development and validation of the health related locus of control (HLC) scale. Journal of Consulting and Clinical Psychology, 44, 580-585.
Wallston, K. A., Maides, S. A., & Wallston, B. S. (1976). Health related information seeking as a function of health related locus of control and health value. Journal of Research in Personality, 10, 215-222.
Wallston, B. S. & Wallston, K. A. (1978). Locus of control and health: A Review of the literature. Health Education Monographs, 6, 107-117.
Wallston, K. A., Wallston, B. S. & DeVellis, R. (1978). Development of the multidimensional health locus of control (MHLC) scales. Health Education Monographs, 6, 160-170.
Wallston, K.A. & Wallston, B.S. (1982). Who is responsible for your health: The construct of health locus of control. In G. Sanders & J Suls (Eds.) Social Psychology of of Health and Illness. Hillsdale, N.J.: Lawrence Erlbaum & Associates, 65-95.
Wallston, K. A., Smith, R. A., King, J. E., Forsberg, P. R., Wallston, B. S., & Nagy, V. T. (1983). Expectancies about control over health: Relationship to desire for control of health care. Personality and Social Psychology Bulletin, 9, 377-385.
Wallston, K. A., Wallston, B. S., Smith, S., & Dobbins, C. (1987). Perceived control and health. Current Psychological Research and Reviews,6, 5-25.
Wallston, K.A. (1989). Assessment of control in health care settings. Chapter in A. Steptoe & A. Appels (Eds.) Stress, personal control and health. Chicester, England: Wiley.
Wallston, K.A. (1991). The importance of placing measures of health locus of control beliefs in a theoretical context. Health Education Research, Theory & Practice, 6, 215-252.
Smith, M.S. & Wallston, K.A. (1992). How to measure the value of health. Health Education Research, Theory, & Practice, 7, 129-135.

129
Wallston, K.A. (1992). Hocus-pocus, the focus isn't strictly on locus: Rotter's social learing theory modified for health. Cognitive Therapy and Research, 16(2), 183-199.
Wallston, K.A. (1997). Perceived control and health behavior. In A. Baum, C. McManus, S. Newman, J. Weinman, and R. West (Eds). Cambridge Handbook of Psychology, Health and medicine (Vol. 1). Cambridge, England: Cambridge University Press
Wallston, K.A. (2001). Conceptualization and operationalization of perceived control. In A. Baum, T. Revenson, and J.E. Singer (Eds.) The Handbook of Health Psychology. Mahwah, NJ: Erlbaum. 49-58.
Wallston, K.A. (2004). Control and Health. In Norman Anderson (Ed.) Encyclopedia of Health & Behavior, Volume One. Thousand Oaks, CA:Sage. 217-220.
Wallston, K.A. (2004). Multidimensionjal Health Locus of Control Scale. In A.J. Christensen, R. Martin, and J. Smyth (Eds.) Encyclopedia of Health Psychology. New York: Kluwer Academic/Plenum. 171-172.
Wallston, K.A. (2005) Overview of the special issue on research with the Multidimendional Health Locus of Control (MHLC) Scales. Journal of Health Psychology, 10, 619-621.
Wallston, K.A. (2005). The validity of the Multidimensional Helath Locus of Control Scales. Journal o f Health Psychology, 10, 623-631.
Ward, E. (2004). Cancer disparities by race/ethnicity and socioeconomic status. CA A Cancer Journal for Clinicians, 54, p78-93.
Wilson, T.D. (1999). Models in information behavior research. The Journal of Documentation, 55(3), p249-270.
United States Department of Health & Human Services. The Office of Minority Health. African American Profiles. Retrieved on December 10th, 2007 from the world wide web: http://www.omhrc.gov/templates/browse.aspx?lvl=2&lvlID=51