health of the u.s. nonprofit sector
TRANSCRIPT

Health of the US Nonprofit Sector
independentsectororg
OCTOBER 2020
Contents
1 Snapshot Health of the US Nonprofit Sector
2 Introduction
4 2020 Sector Health Indicators
5 FINANCIAL RESOURCES
11 HUMAN CAPITAL
15 GOVERNANCE AND TRUST
20 PUBLIC POLICY AND ADVOCACY
25 Action amp Research Next Steps
25 TRANSLATING METRICS TO ACTION
31 LONG-TERM PROGRESS ON NONPROFIT RESEARCH
33 Development of the Report
35 Sources
37 Endnotes
Snapshot Health of the US Nonprofit Sector
Nonprofits make up 55 of Gross Domestic Product (GDP)
Nonprofits make up 7 of total workforce and 10 of private workforce
Voters contacted by nonprofits turn out at rates 11 percentage points higher than comparable voters
7 of nonprofits are estimated to close due to the pandemic and almost 1 million nonprofit jobs have been lost
59 of US public trust nonprofits to do what is right
In 2019 Americans gave $450 billion to charity but the number of donors continued a downward trend declining by 3
VALUE OF SECTOR
HUMAN CAPITAL
PUBLIC POLICY amp ADVOCACY
FINANCIAL RESOURCES
GOVERNANCE amp TRUST
COVID-19 IMPACT
1HEALTH OF THE US NONPROFIT SECTOR
Sn
ap
sh
ot
Introduction
The US nonprofit sector is the underpinning of our society In 2020 we have seen this in extraordinary
and extraordinarily painful ways Nonprofits provide a significant portion of the nationrsquos health care higher education human services arts and culture conservation and other vital services Nonprofits also have been the primary catalyst for major social change over the past 150 years At a time when the sector is both more critical and more vulnerable than in recent memory it is essential that communities and their leaders understand the current health of the nonprofit sector
A clearer understanding of that ldquostate of healthrdquo is important in order for policymakers donors and nonprofit leaders to plan for and respond to major shifts in nonprofit operations and environment Although this report has been in development for more than two years the COVID-19 pandemic as well as the accompanying economic crisis and racial equity movements shined a spotlight on why it is crucial to understand nonprofit health Policymakers and sector leaders are eager to better understand how nonprofits are weathering these economic racial justice and public health crises in order to determine how to best support their ability to serve their communities The ability to assess trends across all corners of the sector is fundamental to equipping nonprofits to correct systemic inequities and rebuild our nation
The Independent Sector ldquoHealth of the US Nonprofit Sector Annual Reviewrdquo is a
new and developing resource that conveys important information on the current health of the US nonprofit sector across multiple dimensions and in a single accessible format Most information on the health and well-being of nonprofits is found across multiple single-issue reports which makes it difficult to get a complete picture of overall sector health This annual review presents a broad set of measures side-by-side so stakeholders and key decisionmakers can see the most accurate snapshot of the state of civil society
While there are many ways to assess the health of a system as large and complex as the sector we have chosen initially to focus on four categories of health indicators Financial Resources Human Capital Governance and Trust and Public Policy and Advocacy The first three categories assess the internal health of nonprofit institutions looking across a range of measures of organizational assets and management practices The fourth category public policy and advocacy aims to assess the environment in which nonprofits do their work and the extent to which nonprofits advocate to shape that environment
ldquoThe [nonprofit] sector enhances our creativity enlivens our communities nurtures individual responsibility stirs life at the grassroots and reminds us that we were born freerdquo
ndash JOHN GARDNER
2HEALTH OF THE US NONPROFIT SECTOR
Intro
du
ctio
n
For each of these four health categories the first section of the report aims to
Convey what we currently know regarding the sectorrsquos health by way of available data
Identify what we dont know and opportunities to collect better data measuring sector health
Establish an initial set of baseline health indicators that can be built upon in future reports
Shed light on systemic inequities at play in our sector and build accountability to the communities that nonprofits serve and
Highlight the potential impacts of COVID-19 on the sector
A second section of the report discusses various responses and actions the sector might take in light of existing data and how we would hope to improve the health of the sector over time Utilizing the organizationrsquos 40 years of collective experience engaging expert practitioners and academics Independent Sector uses the current data to make an initial set of recommendations to improve research and analysis in the future Data in this 2020 report suggests there is essential work for nonprofit leaders to do in the years ahead to stabilize nonprofit finances further diversify the nonprofit workforce and leadership strengthen public trust in the nonprofit sector and increase advocacy and civic engagement In future years we look forward to improving both the data inputs and the processes by which we engage sector leaders in interpreting data
More information about the data cited and structure of the report can be found in the
Development of the Report section
3HEALTH OF THE US NONPROFIT SECTOR
Intro
du
ctio
n
Across all four categories of health indicators that we have chosen for this report ndash Financial Resources
Human Capital Governance and Trust and Public Policy and Advocacy ndash the overall health of the sector appears mixed and it is important to note that to date there are no mutually agreed upon benchmarks for what constitutes good fair or poor
ldquohealthrdquo However we can draw some initial conclusions First some annual research on the sector like 2019 charitable giving data may now conflict with information being gathered during the pandemic Second data confirms many nonprofits are fighting for survival in 2020 Data shows significant
declines in the health of organizationsrsquo finances and human capital following the spread of COVID-19 A potential silver lining is that preliminary research also suggests that nonprofit action during the crisis could increase public trust in nonprofits awareness of systemic inequity and the short-term rate of nonprofit advocacy
Before delving into indicators examining the collective health of nonprofits it would be helpful to first describe the size and scope of the sector In 2019 1729101 nonprofits (across Section 501(c)) are registered with the IRS1 and 75 of 501(c)(3) public charities are small with annual revenue under $100K2
27
19
14
10
9
Human services
Religion-related
Education
Public societal benefit
Arts culture amp humanities
Top Public Charity Subject Areas by Number of Organizations4
Types of Nonprofits3
ensp501(c)(3) public charities
ensp501(c)(3) private foundations
enspAll other 501(c)s
There are more than 30 other types of 501(c) nonprofits in the US including social welfare groups business associations veteransrsquo organizations labor unions and federal credit unions
72+7+21727
21
2020 Sector Health Indicators
4HEALTH OF THE US NONPROFIT SECTOR
20
20
Se
cto
r He
alth
Ind
ica
tors
Financial ResourcesThe financial health of nonprofits which often is tied to the state of the economy is the most prominent indicator of nonprofit well-being Sector leaders policymakers and donors seek information on nonprofit finances as a proxy for organization capacity and to gauge the need for policy or philanthropic intervention In 2020 economic and financial health became an existential crisis for many nonprofits Over the past decade the topline figures on nonprofit finances have remained steady However underneath the foundation of nonprofit finances has been shifting particularly in the erosion of the number of households donating to charity The COVID-19 pandemic intensified underlying financial challenges in three notable ways
Nonprofit revenue typically follows the economy which saw the worst drop on record between April and June of 20205
Social distancing and event cancellations upended many nonprofit revenue streams including fundraisers and conferences
Increasing community need demanded nonprofits provide essential services with significantly fewer resources while also protecting the safety of employees volunteers and constituents on the frontlines
Nonprofits as a share of the US Gross Domestic Product7
Change from 2018-20198
US nonprofit economic contribution in 20196
55+7+113+76255
113
762
7
+13
enspNonprofits
enspHouseholds
enspGovernment
enspBusiness
Gross output of all nonprofits10
$12 trillion
The nonprofit sectorrsquos contribution to the US economy increased from 49 of GDP in 2000 to 55 of GDP in 2009 ndash a 12 rise ndash and has held relatively steady around 55 since 20099
US GDP
+26Health nonprofits
+04Social Service nonprofits
+09Education nonprofits
+16Recreation nonprofits
ndash02Religious nonprofits
+01Civic and Social nonprofits
All changes from 2018-2019 in this section are real (inflation-adjusted)
+22
5HEALTH OF THE US NONPROFIT SECTOR
Fin
an
cia
l Re
so
urc
es
DEMAND11
Percent of nonprofits saying they cannot meet demand for their services
FINANCIAL HEALTH
In 2017 nonprofit respondents achieved12
enspOperating surplus
enspBreak-even financials
enspOperating deficit
EARNED REVENUES18
Nonprofit receipts from sales of goods and services to households
2019 $11 trillion +3 since 2018
Share of receipt by nonprofit type Change since 2018
Health Services 780 +35
Education Services 95 +03
Social Services 57 +07
57+4357Figure rises to 65 among nonprofits that serve low-income communities
50+26+2450
26
24
In 2017 69 of nonprofit respondents had 3 months or more of cash on hand13 but the number falls to 23 among organizations led by Black leaders14
Several studies have found disparities in financial well-being across different types of organizations particularly for organizations led by people of color
Ȅ White-led nonprofit budgets were 24 larger than budgets of organizations led by people of color15
Ȅ Unrestricted assets of organizations led by people of color were 76 smaller than those led by whites16
Ȅ 13 of all philanthropic dollars are granted to Latinx communities between 1999-2009 while those same communities now represent 18 of the US population17
Nonprofit receipts include charges to households made by nonprofits for health education human arts and other services Includes membership dues and fees but excludes unrelated sales secondary sales and sales to businesses or government
6HEALTH OF THE US NONPROFIT SECTOR
Fin
an
cia
l Re
so
urc
es
PHILANTHROPIC REVENUES
Charitable giving in 2019 appears to be positive due to a notable increase over 2018 when the rate of giving dropped significantly as a result of the Tax Cuts and Jobs Act
Charitable giving adjusted for inflation
GOVERNMENT FUNDING 2018
Nonprofit survey respondents projected government revenue would26
Share of receipt by nonprofit type Change since 2018
Giving by individuals $3097 B +28
Giving by foundations $757 B +07
Giving by bequest $432 B ndash16
Giving by corporations $211 B +114
Share of receipt by nonprofit type Change since 2018
Religion +05
Education +101
Human services +31
Foundations +06
Health +49
Public-society benefit ndash111
International affairs ndash22
Arts culture humanities +106
Environment and animals +94
26 20 34Decline Increase Remain the same
2019 $4496 B +24 since 2018
Still $1 billion less than 201719
Adjusted for inflation charitable giving in 2019 totaled $44964 billion an increase of 24 but still $1 billion less than 2017
Ȅ If giving had kept pace with GDP growth since 2017 the sector would have received an additional $24 billion in giving20
Ȅ The SampP 500 grew significantly in 2019 but giving only grew slightly Based on historical experience giving should have kept pace with the SampP 500 and grown more in 201921
The number of donors continued a downward trend declining 3 in 201922 The number of households giving to charity has declined almost 14 percentage points between 2002-2016 particularly among households donating small and mid-sized gifts23
Who received (adjusted for inflation percent change compared to 2018)24
Who gave (adjusted for inflation percent change compared to 2018)25
51 of nonprofits surveyed reported in 2018 that governments paid their grants on time27 Although the survey isnrsquot a representative sample the finding is consistent with a 2013 representative survey of nonprofit contractors in which 55 of respondents say late payments are not a problem28
7HEALTH OF THE US NONPROFIT SECTOR
Fin
an
cia
l Re
so
urc
es
The Impact of COVID-19 on Financial Resources
Changes in the US economy significantly impact both nonprofit revenue as well as demand for nonprofit services As of May 30 2020 48 of survey respondents reported not working for pay in the past week29 and 25 reported worrying that their food would run out before they would get money to buy more30 An additional 22 reported that the food that they bought didnrsquot last and they didnrsquot have the money to get more31
Approximately 3-8 of respondents reported applying for or receiving assistance from different types of nonprofits during the COVID-19 crisis32
Forty percent of nonprofits serving immigrant communities reported cash as the first or second most pressing need among immigrant families followed by food (38 ) employment (37) and housing (31)34 Despite urgent need over 50 of nonprofits surveyed report immigrant families afraid to access pandemic services and support
The sector will not fully understand the financial impact of COVID-19 on nonprofits until 2021 or later In the meantime there is a small amount of data convenience sample surveys and anecdotal data that may reflect many nonprofitsrsquo current reality
A median estimate predicts 7 of nonprofits will close due to COVID-1935 During and following the 2008 recession closure rates were highest for international public societal benefit religious and mutualmembership benefit organizations In 2008 the lowest closure rates were among human services and environmental public charities36
NONPROFIT ECONOMIC DATA
OVERALL REVENUE
Over 80 of nonprofits surveyed estimate revenues will be lower than expected in 202038 39 40
Nonprofits serving immigrant communities reported limited funding to support increased client needs as the single greatest challenge
EARNED REVENUE
Among large and mid-sized nonprofits that reported a decline in revenue in 2020 the largest number reported declines in earned revenue (83) followed by individual giving (53) and philanthropic grants (33) Earned income appears to have taken the biggest hit during COVID-19 placing greater emphasis on other revenue streams such as charitable giving to fill budget gaps41
Survey respondents reporting they have used different types of nonprofit assistance during COVID May 202033
Appliedreceived assistance from
White Black Hispanic Asian Other Race Male Female
Church 2 6 5 4 1 2 4
Community organization 1 6 2 1 0 2 4
Unionother association 1 4 1 4 0 2 2
Food pantry 7 10 7 9 5 5 9
Gross output of nonprofits
COVID-19 Impact (Q2 2019 compared to Q2 2020)37
All nonprofits ndash67
Health nonprofits ndash59
Social Service nonprofits +10
Education nonprofits ndash66
Religious nonprofits +12
Recreation nonprofits ndash443
Civic and Social nonprofits ndash288
8HEALTH OF THE US NONPROFIT SECTOR
Fin
an
cia
l Re
so
urc
es
PHILANTHROPY
After an initial decline due to COVID new data indicates overall giving rose the second quarter in 2020
Fundraising Effectiveness Project shows individual giving increased by 75 in the second quarter of 2020 compared to the same time in 201942
There is conflicting information about the number of individuals donating to charity in 2020 Fundraising Effectiveness Project finds the total number of donors increased by 72 in the second quarter of 2020 compared to 201943 Meanwhile a May 2020 Gallup poll finds the number of donors hit a historic 19-year low surpassing the prior low from the Great Recession Era44 The Gallup also shows charitable activity is down the most among low- and middle-income donors which is consistent with previous research findings from Indiana University45
More donors gave to the same organization which they have previously given46 Donorsrsquo preference for organizations they know may signal that not all corners of the sector will see increases in giving For example organizations historically less reliant on individual giving may find it difficult to capitalize on Americansrsquo surge in generosity to fill funding shortfalls from other revenue streams (ie organizations led by people of color)
It remains unclear if the recent spike in giving will be enough to supplement the net drop in overall revenue largely due to decreasing earned income Some organizations are viewing it as a temporary upswing in the midst of longer-term flat or declining giving trends Over the past two decades giving often correlated with economic growth or decline47 Therefore it is possible charitable giving to many charities may be dependent on the recovery of the GDP which currently is down 31 percent48
GOVERNMENT REVENUE
It is unclear how COVID-19 will exactly impact government funding to nonprofits but state and local governments are requesting federal funding to help with declining revenues and increasing need These requests may indicate direct and indirect funding needs related to nonprofits and the communities they serve
VARYING IMPACT
Early evidence suggests that small nonprofits may be hardest hit by COVID-19 and struggle to access assistance49 This is consistent with historical data that showed large nonprofits ended up gaining ground while small nonprofits lost ground during and after the 2008 recession50
Organizations led by people of color have smaller organization budgets on average compared to organizations led by white people From a financial standpoint negative financial impacts from COVID-19 also may disproportionately affect organizations led by people of color51
9HEALTH OF THE US NONPROFIT SECTOR
Fin
an
cia
l Re
so
urc
es
DATA RECOMMENDATIONS FOR FINANCIAL RESOURCES
1 The sector needs to create a representative annual survey of nonprofits that includes a
single question of whether government funding has increased decreased or remained the same in the past year There is less need to collect responses specifically for local state and federal levels because nonprofit respondents may not know the original source of their government funding
2 An annual analysis of Form 990 data on government grants and contracts would
provide a more accurate measure of government funding to nonprofits but the form will need to be revised in order to do this type of analysis
3 Annual nationally representative research and analysis of sector finances
disaggregated by organization size geography and leader demographics will help identify important variations or disparities across nonprofits
10HEALTH OF THE US NONPROFIT SECTOR
Fin
an
cia
l Re
so
urc
es
PAID WORKERS
Nonprofits compared to overall workforce June 202052
Includes nonagricultural wage and salary workers and excludes military family and self-employed workers
Since April 2015 the nonprofit workforce has become more female
Nonprofit workers worked an average of 38 hours each week in June 2020
Human CapitalThe charitable sectorrsquos human capital
ldquoresourcerdquo contains both the paid and voluntary workforce Human capital data simultaneously demonstrates nonprofitsrsquo contribution to the economy as employers as well as provides indication of organizationsrsquo capacity to fulfill their missions
The general health of nonprofit human capital was trending in a net positive direction in 2019 until the global pandemic For decades the nonprofit sector served as an important source of jobs for Americans and family income of the nonprofit workforce is on the rise The workforce also has grown more diverse in recent years although the sector lags the overall workforce in racial and ethnic diversity The exception lies in volunteerism where it remains unclear whether declining numbers of volunteers over the past decade was beginning to improve Unfortunately early data shows COVID-19 hurt the health of both nonprofit employment and volunteerism losing 8 of nonprofit jobs and a 12-percentage point decline in volunteerism rates
Overall53 Change since June 2019
Nonprofits 7
None
Businesses 776
ndash07
Government 154 +04
RaceEthnicity54 Change since June 2019
Overall workforce
White 6838
ndash03 605
Black 1176
ndash04 122
Hispanic 102
ndash02 1828
AsianPacific Islander 59 +12 65
American Indian 05
ndash02 07
Gender55 Change since June 2019
Overall workforce
Female 6562
ndash08 482
Male 3438 +08 518
11HEALTH OF THE US NONPROFIT SECTOR
Hu
ma
n C
ap
ital
NONPROFITS COMPARED TO PRIVATE WORKFORCE
Percent of private workforce employed by nonprofits
Nonprofits paid over $670 B in wages in 201758
The nonprofit sector saw significant growth over 2007-2017 increasing the total workforce by 186 (compared to the 62 for-profit growth rate)59
Income Ȅ While nonprofits may pay lower wages than the
average for-profit in the general economy this disparity is far smaller than is frequently assumed60
Ȅ In fields in which nonprofits operate they actually pay wages that on average are higher than for-profit firms in the same fields61 This data may illustrate it is possible for nonprofits to effectively compete against businesses for talent while also providing critical services
Ȅ Only three of the major fields in which nonprofits operate do for-profit firms pay higher average weekly wages than nonprofits bull Professional amp technical servicesbull Arts amp recreationbull Management of companies62
Number of Employees Percent of Nonprofit Orgs
Fewer than 5 employees 39
5-9 employees 17
10-19 employees 14
20-49 employees 13
50-99 employees 6
100-249 employees 6
250-499 employees 2
500-999 employees 1
1000+ employees 1
Nonprofits by size of workforce 201756
NONPROFIT WORKFORCE EQUITY amp DISPARITY
Board composition appears to play a significant role in both the racial and gender diversity of nonprofit leaders
Racial disparities Ȅ 75 of respondents report that their organizationrsquos leadership team is more than half white63
Ȅ 45 of respondents reported working for organizations in which both the board and senior leadership are less than 25 people of color These organizations also showed the greatest gap between whites and people of color in terms of their employee experience64
Gender disparities Ȅ The gender pay gap among nonprofit leaders has more to do with the lack of female CEOs in larger organizations than with high-ranking male nonprofit executives out-earning their female peers when they are in charge of organizations of approximately the same size65
bull Female leaders make up only 35 of organizations with budgets greater than $10 million even though women make up the vast majority of their staffs
bull Boards are more likely to hire female leaders if some of their members are women but other variables also impact the likelihood of women being hired
Study analyzed 350 human service organizations with budgets over $10M
Family Income Change since June 2019
Overall workforce
Less than $400000 135
ndash57 183
$40000-$74999 247 +05 264
$75000-$149000 366 +29 351
$150000 and Over 252 +33 203
Family income from nonprofit employment June 2020
10+90102
125 million paid workers in 201757 Estimates of nonprofit percent of private workforce vary from 6-10 depending on data source
12HEALTH OF THE US NONPROFIT SECTOR
Hu
ma
n C
ap
ital
The Impact of COVID-19 on Human Capital
PAID WORKERS
Nonprofit Jobs Lost March-August 202069
976616 The biggest hit to employment in the sector is
part-time employment
There does not appear to be disproportionate declines in jobs based on race or income
Younger nonprofit employees tended to be affected worse than others
VOLUNTEERS
Nonprofits report a significant decline in their volunteer base Individuals report volunteerism rates have declined 12 percentage points compared to the same time last year70
53 of nonprofits surveyed reported heavy cancellations by volunteers in May 2020 71
45 of nonprofits surveyed are adapting to the COVID-19 environment by offering more virtual volunteer opportunities72
VOLUNTEERS
ADULT VOLUNTEERING RATE 2017
The US Corporation for National and Community Service reports that the rate of adults volunteering went up significantly from 2015 to 2017 suggesting a reversal in the general decline in volunteering between early 2000s to 2015 However some experts have questioned the comparability of the 2017 results because of changes in survey methodology and whether this turnaround has truly occurred
774 M 69 B $167 BAmericans
volunteered66
hours served67 in estimated economic value68
BY THE NUMBERS 2017
Estimated nonprofit job losses MarchndashAugust 202069
Nonprofit field Jobs lost March-August Share of nonprofit jobs lost
All fields 976616
Health Care 310766 318
Educational Services 211755 217
Social Assistance 182166 187
Arts Entertainment Recreation 134961 138
Other Services 100300 103
Other Fields 25541 26
Professional amp Technical Services 11155 11
Includes Construction Manufacturing Wholesale Retail Trade Transportation and Warehousing Information Finance and Insurance and Accommodation and food services
13HEALTH OF THE US NONPROFIT SECTOR
Hu
ma
n C
ap
ital
DATA RECOMMENDATIONS FOR HUMAN CAPITAL
1 The nonprofit sector is dependent on the Bureau of Labor Statistics (BLS) to access
more timely up-to-date information on nonprofit employment BLS has made clear they may be inclined to release data on a more regular basis if there is a clear demand which likely would be voiced by nonprofit advocates
2 A publicly available analysis of nonprofit sector compensation and any accompanying
pay gaps is needed to track progress in closing the gap and hold sector leaders accountable
3 American Indian and Alaska Native populations are frequently excluded from
regularly reported national data sets as well as the sector-specific data included in this report More work is needed to measure and understand the unique experience of American Indians and Alaska Natives in the US nonprofit sector
4 Recent changes in the methodology of the survey on volunteer behavior at the
US Corporation for National and Community Service have made it difficult for the sector to fully understand changing trends in volunteerism The research needs to be prioritized within CNCS and Congress needs to provide sufficient funding to increase the quality of the research design to consistently capture a more complete picture of the state of volunteerism in America The sector would benefit from the inclusion of researchersrsquo questions about the demographics of nonprofit boards and executive staff as a part of a nationally representative panel survey of nonprofits
14HEALTH OF THE US NONPROFIT SECTOR
Hu
ma
n C
ap
ital
PUBLIC TRUST
Percent of the public in the United States that trusts nonprofits to do what is right7374
Trust is concentrated among urbanites with high incomes and levels of education75
Rural Americans and those with lower incomes and educational attainment are more likely to express skepticism about nonprofits75
Respondents who are confident in the ability of nonprofits to strengthen American society75 Respondents who believe the sector is headed in the right direction in their effort to do that work76 Respondents who trust philanthropic institutions but personal familiarity with philanthropy may be a key driver77
A high level of trust leads to more giving and volunteering but positive engagement with nonprofits also reinforces trust78 Specifically 70 of respondents cite trust as essential before making charitable gifts79
The current snapshot indicates that the sector may need to fortify the publicrsquos perception to continue supporting nonprofitsrsquo important roles in their communities Research shows nonprofits can strengthen trust by conveying integrity and clarity of purpose80
Governance amp TrustPublic trust is the currency upon which nonprofits conduct their work The extent the public believes nonprofits lead ethically and transparently impacts whether individuals will invest in or utilize services from nonprofits It also impacts the extent to which nonprofits can legitimately represent and are accountable to the communities they serve Although the public generally trusts nonprofits to do what is right the sector needs to make notable strides in order for nonprofit governance and trust to be deemed healthy Specifically data highlights opportunities to improve nonprofit transparency and accountability board diversity equity and community participation in decision-making
59+4159
81
47
36
15HEALTH OF THE US NONPROFIT SECTOR
Go
ve
rna
nc
e amp
Trus
t
BOARD OF DIRECTORSLEADERSHIP
Research shows the demographic composition of board members influences the health and well-being of staff and equitable pursuit of nonprofit missions Including communities served in nonprofit decision-making also may be an indicator of fair equitable governance According to BoardSource ldquoblind spots created by a lack of racial and ethnic diversity are particularly concerning as they may result in strategies and plans that ineffectively address societal challenges inequities or even reinforce themrdquo81
In a 2020 BoardSource survey of foundation and public charity CEOs and board chairs diversity in the sector has only improved slightly since their first survey on this issue in 199482
57 of respondents in the Race to Lead Revisited report less than 25 of their board are people of color83
Race amp Ethnicity CEO Board Member Chair86
WhiteCaucasianEuropean 87 78 83
BlackAfrican AmericanAfrican 5 10 6
HispanicLatinx 3 5 5
AsianPacific Islander 2 4 2
Multi-RacialMulti-Ethnic 3 1 2
Native AmericanIndigenous 03 1 04
Other raceethnicity 1 2 1
Gender CEO Board Member Chair
Female 74 53 53
Male 26 47 47
Non-Binary 03 01 01
Not Transgender (Cisgender) 993 99 996
Transgender 03 01 01
Disability Status CEO Board Member Chair
Without disability 95 95 97
With disability 5 5 3
Sexual Orientation CEO Board Member Chair
Heterosexual or Straight 90 94 94
Gay Lesbian Bisexual 9 6 6
Other 1 01 01
Does your board represent the demographics of the population served by your organization CEO Board Member Chair
Yes 38 NA 29
No 62 NA 71
Board composition 201985
Board members of color84 14+86+w22+78+w1994 2020
14 22Diversity on nonprofit boards still falls short of reflecting the overall diversity of the United States
16HEALTH OF THE US NONPROFIT SECTOR
Go
ve
rna
nc
e amp
Trus
t
RACIAL EQUITY
One best practice to support equity and inclusion across board leadership staff and the communities nonprofits serve is to formally incorporate equity into organizationsrsquo operations Nonrepresentative surveys of nonprofits indicate that 63-74 of organizations engage in diversity equity and inclusion activities8788
Board activities supporting diversity equity and inclusion CEO responses89
enspNot at all or only a small extent enspTo some or a great extent
33+6733
57 37+6338
63 56+445644
Different experiences for people of color
When comparing survey responses in 2016 and 2019 the Race to Lead Revisited report shows awareness of racial inequities is higher but discrepancies between the experience of people of color and white nonprofit employees has grown or remained the same90
enspEmployees of Color enspWhite Employees
The Board has committed to understanding the diversity of the community the organization serves
The Board has discussed community needs in a way that acknowledges any disparities between different demographic groups among the people it serves
The Board has committed to raising its awareness and understanding of the relevance of racial inequity to the organizationrsquos mission
Commitment to DEI Policies
Average Responses on a Scale of 1-1091
Leadership consistently demonstrates a commitment to DEI
My organization takes a public stand on the root causes of inequity
White Run Organizations Board amp Leaders gt75 White47
64
53
62
POC-Led Organizations Board amp Leaders gt50 POC80
81
82
82
All Other Compositions of Board amp Leaders 68
76
69
75
17HEALTH OF THE US NONPROFIT SECTOR
Go
ve
rna
nc
e amp
Trus
t
The Impact of COVID-19 on Governance amp Trust
Surveys of corporate leaders on governance found the most pressing concerns include92
Nonprofit leaders appear to be aligned with their corporate counterparts around governance opportunities which include97
Nonprofit leaders expressed particular concern about
COVID-19 COMPARISON TO BROADER TRUST BAROMETER
Because of the timing of data collection the nonprofit and philanthropy surveys are snapshots of the state of trust in the sector before the full impact of the pandemic was felt by most Americans
Edelman Intelligence fielded a Spring global survey comparing global levels of trust in mid-April which showed record high levels of trust across all institutions including nonprofits
It remains unclear whether these trust gains are a sustainable rise or a ldquotrust bubblerdquo The pandemic has put a spotlight on social inequities and there is overwhelming sentiment that something must be done to distribute our countryrsquos wealth and prosperity more fairly History tells us that large trust increases are quickly lost unless institutions show the public they deserve the faith thatrsquos been placed in them
Shaping realistic post-crisis strategies
Fulfilling programmatic activities as planned93
The COVID-19 crisis may help them find more efficient
ways to work online
Getting up to speed on crisis risk dimensions
Maintaining a financially stable organization94
They may find new or expanded ways to fundraise
Balancing governance and management
Reaching the people or animals the
organization serves95
They may find more efficient ways to pursue their mission
Overseeing the financial health of the organization
Accelerating digital transformation
60
923
77
46
894
57
45
45
56
45
32
19 of nonprofits surveyed that serve immigrant communities report technology as a particular barrier to reaching constituents96
18HEALTH OF THE US NONPROFIT SECTOR
Go
ve
rna
nc
e amp
Trus
t
DATA RECOMMENDATIONS FOR GOVERNANCE amp TRUST
1 Because public trust is a community-level indicator of the health of nonprofit
governance the sector needs a sustained annual assessment of the US publicrsquos views on the trustworthiness of nonprofits
2 Staff satisfaction equity initiatives and other measures of nonprofit health are
determined by organization leadership and board governance Therefore the sector would benefit from a nationally representative survey of nonprofit organizations and their board members
3 More detailed information about the integration of community voice and
participatory decision-making also is necessary to better understand the current health of not only nonprofit governance but also human capital and advocacy
4 American Indian and Alaska Native populations are frequently excluded from
regularly reported national data sets as well as the sector-specific data included in this report More work is needed to measure and understand the unique experience of American Indians and Alaska Natives in the US nonprofit sector
19HEALTH OF THE US NONPROFIT SECTOR
Go
ve
rna
nc
e amp
Trus
t
NONPROFIT PARTICIPATION IN PUBLIC POLICY OR ADVOCACY
In 2019 41 of nonprofit chief executives report that public policyadvocacy is a part of their organizationrsquos strategy to some or a great extent98
59 of CEOs report that public policyadvocacy is a part of their organizationrsquos strategy to a small extent or not at all99
UNDERSTANDING OF POLICY IMPACT ON MISSION AND COMMUNITIES
In 2017 Federal government policies and positions made100
enspHarder enspEasier enspSame
This data indicates a disconnect between the impact of public policy on the environment in which nonprofits operate and a recognition of an impact on nonprofitsrsquo ability to deliver on mission
Because mission is one of the most frequently cited reasons why nonprofits choose to engage in advocacy this gap may indicate that many nonprofits still do not see a direct benefit from engaging in advocacy
Research shows ldquononprofits might choose to avoid advocacy because they do not view it as a key part of their missionrdquo101
Sector leaders may need to engage in more policy education or place an intensive focus on community participation as a means to closing this gap
Public Policy amp AdvocacyPublic policy defines what it means to be and operate as a nonprofit and is a key determinant of an organizationrsquos ability to deliver its mission Public policy and advocacy also are critical to addressing the systemic inequities and structural racism that impact the ecosystems in which all nonprofits operate Therefore the state of the public policy and advocacy
ldquoenvironmentrdquo in which we operate gives us critical insight into our overall health
Data from 2019 indicates that nonprofit public policy environment and advocacy are not as healthy or active as the sector needs to be in order to strengthen nonprofit capacity and impact For the majority of nonprofits public policy and advocacy play a small or non-existent role in their organizationrsquos overall strategy Nonprofit leaders may not connect how policy changes impact their organizationrsquos mission Policymakers also are falling short in terms of oversight of nonprofits jeopardizing the publicrsquos trust in the sector
As the challenges posed by COVID-19 threatened to overwhelm many nonprofit leaders a large cross-section of the sector successfully advocated for policies to help their organizations and their constituents weather the crisis Communities also are observing in 2020 a surge in civic activism by individuals which may provide new advocacy opportunities Given the magnitude of challenges facing nonprofits the sector may need to significantly increase our collective participation in policy and advocacy in order to rebuild resilient equitable communities
4
51+5+445244
5
67+2+3167
31
2 41+4+554155
58+3+395839
3
Funding environment
Challenges facing clients Ability to deliver on mission
Policy environment
20HEALTH OF THE US NONPROFIT SECTOR
Pu
blic
Po
licy
amp A
dv
oc
ac
y
ADVOCACY
Advocacy is the act of ensuring community voices are included in decisions that impact them This type of civic participation strengthens the quality of corporate and government decisions so it behooves the sector to maximize the number of volunteers donors and staff engaged in advocacy
ADVOCACY OVERVIEW
Return on investment in nonprofit advocacy102
On average 5 of people subscribed to communications alerts take three or more actions a year103
An average of 031 of nonprofit followers on Facebook will engage in advocacy per post104
ADVOCACY DRIVERS
The extent to which nonprofits engage in advocacy is directly dependent on other determinants of health outlined in this report financial resources human capital and governance
A wide range of research demonstrates nonprofit participation in advocacy is dependent upon available resources which is one reason why the level of a nonprofitrsquos advocacy is dependent upon organization budget size105
ldquoA more direct role for members and citizens in the governance and operations of nonprofits [ie community participation] would produce more involvement by these organizations and their volunteers in advocacyrdquo106
BOARD POLICY amp ADVOCACY ENGAGEMENT
Organizations with higher revenues tend to have boards that are more engaged with policymakers and advocacy107
VOTING PARTICIPATION
Voting is the most direct form of advocacy Ȅ Voters contacted by nonprofits turn out at rates 11
percentage points higher than comparable voters112
Ȅ Among nonprofits participating in voter engagement 79 cite advancing the mission of their organization as a motivating factor and 73 report empowering their clients as a motivating factor113
23 timesmore likely to be non-white (+13-16 percentage point increase in voter turnout)
19 timesmore likely to have less than $30K in household income (+14 percentage point increase in voter turnout)
26 timesmore likely to be under 25 years old (+15-20 percentage point increase in voter turnout)
New voters engaged by nonprofits are114
Board understands to some or a great extent how public policy impacts the
organizationrsquos mission108
Board monitors to some or a great extent the impact of public policy on the
organizationrsquos mission or resources109
Board works to some or a great extent with organization staff on advocacy to
educate policymakers110
Board works to some or a great extent with organization staff to educate
policymakers on behalf of the sector111
44
31
28
17
$115 to $1 $266 Breturn on investment total benefits for
communities and taxpayers
21HEALTH OF THE US NONPROFIT SECTOR
Pu
blic
Po
licy
amp A
dv
oc
ac
y
NONPROFIT OVERSIGHT
Because public trust is the currency of the nonprofit sector it is critically important that there is sufficient oversight of the sector to guard against waste fraud or other wrong-doing that could undermine the publicrsquos trust Unfortunately government entities responsible for nonprofit oversight have seen their resources steadily decline for many years undermining their ability to oversee a rapidly growing sector
IRS appropriations have fallen by 20 in inflation-adjusted dollars since 2010 resulting in the elimination of 22 of its staff115
Increasing IRS funding could result in $61ndash$103 billion in revenues115
The amount of funding and staff allocated to oversight has declined by about 30 since 2010115
22HEALTH OF THE US NONPROFIT SECTOR
Pu
blic
Po
licy
amp A
dv
oc
ac
y
The Impact of COVID-19 on Public Policy amp Advocacy
As a direct result of sector advocacy nonprofits were included for the first time in emergency SBA programs with a particular focus on Paycheck Protection Program (PPP)
Nonprofits received 37 of all loans made under the PPP program116
Nonprofits received a larger share of high-dollar loans than all other entity types117 Nonprofits fared better than other types of institutions when securing loans over $350000
Approximately 40 of eligible nonprofits received a PPP loan but the success rate varied across states119
63 of eligible nonprofit jobs were protected by PPP loans120
Disparities exist across population and organization size121
Ȅ While larger nonprofits were successful in PPP smaller nonprofits may not have applied for loans or have not been successful with applications so far
Ȅ 34 of nonprofits serving immigrant communities report immigrant families avoiding the PPP program due to fear of the public charge rule and immigration enforcement
Sector advocacy also resulted in Congress passing a temporary universal charitable deduction for non-itemizers to encourage more giving during the COVID crisis
The incentive was capped at gifts of $300 or less weakening the effectiveness of the policy to drive more resources to nonprofits Research indicates that the effects of the policy will be de minimus as designed Other action will be needed to stimulate more giving Even before the passage of the 2017 tax law raising the standard deduction non-itemizing households donated an average donation greater than $1000 The marginal tax subsidy for these households remains zero under this new tax policy122
2019 research shows incentivizing more giving through tax policy requires Congress to significantly increase or eliminate the cap on the incentive123
Without more government resources and changes to state voting processes COVID-19 is estimated to have a negative impact on voter participation particularly among marginalized and at-risk populations124
16 states and DC have made a change in their election processes due to the pandemic125
Nonprofits may be needed to help voters navigate last-minute changes to voting procedures in their states and communities
63+3763
Eligible nonprofit jobs projected by PPP loans
181680 nonprofit PPP loans
41 million nonprofit jobs118
protected
23HEALTH OF THE US NONPROFIT SECTOR
Pu
blic
Po
licy
amp A
dv
oc
ac
y
DATA RECOMMENDATIONS FOR PUBLIC POLICY amp ADVOCACY
1 To better understand the health of nonprofit advocacy and influence on the
policy process the sector needs a nationally representative survey of nonprofits to collect an annual measure of advocacy participation nonpartisan civic engagement and perhaps determine whether barriers identified 20 years ago persist
2 Infrastructure practitioners can partner with researchers to identify evidence-
based practices to increase advocacy participation rates or clarify data gaps that need to be addressed on this issue
3 IRS funding is not a sufficient proxy for the health of nonprofit oversight The
sector would benefit from practitioners and researchers working together to identify a data development agenda to assess sector oversight on a regular basis
4 In future analysis of the PPP program a better measure would be to compare
how many nonprofits applied for the program versus received a loan This analysis would require the SBA to privately release additional data to researchers
5 It would be incredibly helpful to determine through COVID impact research the extent
to which changes in revenue correlate with advocacy and policy engagement It also would be helpful to understand the role coalitions may play during this time as a means of sharing advocacy costs across nonprofits
24HEALTH OF THE US NONPROFIT SECTOR
Pu
blic
Po
licy
amp A
dv
oc
ac
y
This first annual report reflects our best understanding of the health and well-being of the US nonprofit sector at this
time Although limitations in available data and no mutually agreed upon ldquohealthrdquo benchmarks highlight the need for improved health metrics in the future they cannot be the cause for inaction In fact a significant amount of data is available to begin informing decision-making across the sector Therefore the second half of the report is divided into two sections
Translating Metrics into Action The first section includes initial recommendations for how the sector may begin translating findings in this report into immediate action
Long-term Progress on Nonprofit Research The second section outlines next steps to improve the collection and dissemination of data on nonprofit health in the future
Translating Metrics to Action
These recommendations are based upon what Independent Sector sees in the available data and believes they are telling us about how we can improve our health ldquotrendlinesrdquo through research practice and policy
We look forward to these recommendations forming the basis of sector-wide conversations in the months to come
FINANCIAL RESOURCES
Increase Flexible Funding Across COVID-19 research it is clear that nonprofits of all sizes are struggling financially reporting overall revenue declines with varying levels of losses across earned revenue charitable giving and other forms of nonprofit financing To the greatest extent possible it is critical for all funders (donors foundations and government) to significantly increase flexible funding to nonprofits to help them not only regain their financial footing but also adapt operations to protect the health of their employees volunteers and constituents
Advocate for Policies to Increase Giving amp Grants Prior to COVID data showed over a 10-year decline in the number of households donating to nonprofits particularly among households that donate small and mid-sized gifts This decline may impact nonprofit mission advocacy and even the type of organizations created in the future The pandemic made giving more volatile with many nonprofits experiencing a rollercoaster of giving drops and climbs over the first half of 2020 Although giving increases are encouraging it remains unclear whether this positive trend
Action amp Research Next Steps
25HEALTH OF THE US NONPROFIT SECTOR
Ac
tion
amp R
es
ea
rch
Ne
xt S
tep
s
will continue for the duration of the COVID and economic crises Historically giving correlates with GDP which indicates that charitable giving may face strong headwinds throughout into 2021 Many nonprofits still face dire overall financial challenges particularly in earned income which means the sector requires more assistance in order to restore financial health across all types of organizations Specifically nonprofits need policymakers to enact meaningful tax incentives that make it affordable for many more households to give regardless of income This private support needs to be complemented by robust government funding of programs and initiatives that allow nonprofits to continue to effectively serve their communities
Clarify Form 990 Collection of Financial Data It always has been difficult to fully understand some measures of nonprofit finances such as government funding due to how the revenue is reported on Form 990s Government grants contracts and reimbursements often are combined with other forms of revenue on Form 990s making it difficult for researchers to easily identify the full role government revenue plays for nonprofits Clarifying existing reporting practices for Form 990s may improve the sectorrsquos understanding of some measures of financial health Nonprofits and researchers can advocate for the IRS to modify Form 990 to collect clearer more accurate data on earned income and government grants and contracts
Create Common Core Financial Metrics for Research This first report pieces together financial data across a wide range of research Collaboration between researchers and practitioners to identify the best annual measures to track the overall financial well-being of nonprofit institutions could create efficiencies and even new learnings if collected alongside other organization characteristics and activities
Establish Methodology to Capture Impact of Financial Changes In order to improve nonprofit financial health the sector needs to understand how financial changes impact human resources governance service provision and advocacy Often research on nonprofit finances is limited to descriptive financial measures that are not connected to data on operations Without more regular research exploring correlations between finance and mission it is difficult to accurately communicate the ldquoso whatrdquo element of nonprofit finance research findings It would be incredibly helpful for future research of nonprofit finances to capture how different types of revenue flow through the sector and the extent revenue shifts the impact of other aspects of nonprofit operations and activities
Develop a Shared Understanding of Equitable Financing Aggregated financial resource data provide a general description of the state of nonprofit revenue However it remains difficult to apply an equity analysis to these metrics without a shared understanding across nonprofits and researchers of what equitable financial resourcing of the sector looks like and how it may be measured A collaborative process to develop shared benchmarks and measures for equitable financing of nonprofits will significantly help nonprofits and other stakeholders better understand how to improve equity in this area
Inclusion of Diverse Communities by Mainstream Providers Although data indicates that nonprofits provided services to diverse communities during the pandemic research indicates that mainstream providers like food banks clinics and schools still could improve their outreach and provision of culturally competent services Specifically translation of COVID-19 information into multiple languages avoiding collection of Social Security numbers and partnering with organizations that already have trust in specific communities may improve the reluctance of some populations to take advantage of nonprofit services
26HEALTH OF THE US NONPROFIT SECTOR
Ac
tion
amp R
es
ea
rch
Ne
xt S
tep
s
HUMAN CAPITAL
Advocate for Government Investment in Nonprofit Jobs Data shows the sector has experienced significant job loss during the pandemic For many organizations in the sector ndash especially among direct service providers ndash demand for service is increasing against the backdrop of depleted staffing Although policymakers may consider more stimulus programs and investments in infrastructure to spur job retention and growth nonprofit employers often are not considered during the development of these policies Nonprofits have an opportunity to advocate for a broad spectrum of government investments to help restore the lost jobs beginning with structuring any legislation designed to assist employers to support nonprofit organizations
Share Innovations Across Sectors that Support Staff During Pandemic Data on nonprofit layoffs furloughs and teleworking combined with broader trends like closed schools and daycares indicate nonprofit staff may be stretched thin and under a great deal of stress during the pandemic Many of these problems span sectors so there is an opportunity for nonprofits to engage in structured peer-learning with for-profit and government employers to more quickly identify innovative approaches to support their staff such as a pilot program considered by businesses to re-allocate unused professional development or travel funding into grants for employees to secure in-home child or dependent care support
Create Consensus on Sector Benchmarks for Workforce Diversity Although there is data on the diversity of the sector it is difficult to gauge exactly how to improve the demographics of nonprofit staff without mutually agreed upon benchmarks Currently there is not a shared understanding of whether the nonprofit workforce should equal diversity of other sectors correlate with the
demographics of the US population reflect the communities nonprofits serve andor vary by subsector or geography Collectively the sector could benefit from engaging in a collaborative process to establish goals or benchmarks for nonprofit employee diversity
Promote Evidence-Based Practices to Close Diversity amp Pay Gaps Data indicates that although the nonprofit workforce is becoming more diverse nonprofit diversity lags behind businesses and pay gaps within the sector exist Some research indicates that increasing board and executive diversity may close some pay gaps and lead to higher job satisfaction rates across the workforce Nonprofit leaders would benefit from working with researchers to understand existing data to promote concrete sector-wide practices that improve equity-based metrics in their own organizations as well as the broader nonprofit workforce
Advocate for Timely Release of Workforce Data The pandemic highlights the critical importance of timely data on the current status of the nonprofit workforce The Bureau of Labor Statistics (BLS) has committed to release nonprofit employment and wage data on a 5-year cycle (with the next release scheduled for 2024) BLS has made clear it would consider more regular releases of these data if there were enough demand Nonprofit advocacy calling on BLS to release more timely nonprofit workforce data may be the most efficient low-cost way to improve our collective understanding of nonprofit employment
Advocate for Government Funding to Improve Volunteer Capacity Data on the impact of COVID-19 shows that the pandemic drastically reduced both the staff and volunteer capacity of nonprofits at a time when many organizations struggled to continue providing essential services to their communities Findings also indicate that
27HEALTH OF THE US NONPROFIT SECTOR
Ac
tion
amp R
es
ea
rch
Ne
xt S
tep
s
nonprofits are trying to determine how to pivot more traditional face-to-face volunteer opportunities to a virtual format Public policies to improve training and technical assistance to nonprofits for volunteer management and the establishment of a national digital volunteerism platform could better support volunteerism in times of crisis with particular emphasis on building capacity for more virtual volunteer opportunities
Advocate to Improve National Research on Volunteerism The US Corporation for National and Community Service (CNCS) currently is responsible for collecting national
data on volunteerism rates in the US The scope and methodology of this research recently have changed making it more difficult to gain a clear picture of the health of volunteerism over time Nonprofits have an opportunity to advocate for improvements to CNCS volunteerism research to ensure it provides policymakers and the sector with actionable data An example of an improvement is the regular release of disaggregated data to identify potential inequities in volunteer engagement across organization size volunteer demographics geography and communities served
GOVERNANCE amp TRUST
Protect Public Trust of Nonprofits Prior to COVID-19 data showed that the publicrsquos trust in nonprofits was strong but there was skepticism about whether the sector was heading in the right direction Seeing nonprofits at work during the pandemic appears to temporarily have increased the publicrsquos trust in the sector Historic data shows that large increases in trust are quickly lost unless institutions show the public that they deserve the newfound faith placed in them The sector will need to collectively identify the actions necessary to sustain record high levels of public trust rather than allowing the ldquotrust bubblerdquo to burst
Leverage Collective Urgency to Advance Equity Although the majority of nonprofits surveyed report their organization has a diversity equity and inclusion initiative the sector may need to improve efforts to advance more equitable systems and be transparent about them in order to preserve public trust The pandemic placed a spotlight on social inequities and structural racism generating overwhelming buy-in across the sector that now is the time to take action The sector has
an opportunity to seize upon this collective sense of urgency by promoting easy-to-deploy toolkits and practices to help nonprofits jump start their equity work It also is important to complement these efforts with building awareness resources and capacity to address long-term structural change
Improve Quality amp Depth of Equity Metrics Although surveys ask nonprofits if they have equity initiatives they are not surveying a representative sample of nonprofits Therefore it is difficult to confidently extrapolate the findings to the entire sector In addition responses to this question could include a wide range of activities so it is difficult to get a sense of exactly what areas nonprofits are working to change in order to monitor whether we are making progress Therefore it would be helpful for future research to include questions about specific activities to better understand how equity is included in nonprofit work Specifically it would be helpful to understand the extent to which nonprofits integrate community voice into their governance and decision-making processes
28HEALTH OF THE US NONPROFIT SECTOR
Ac
tion
amp R
es
ea
rch
Ne
xt S
tep
s
Identify Targets for Board Diversity Given the data showing board composition impact on nonprofit governance and staffing it would be helpful for the sector to engage in a dialogue about recommended targets or benchmarks for board demographics and under what circumstances they should be applied
Evaluate More Complete Measure of ldquoHealthyrdquo Governance Researchers can help nonprofits consider what additional data points are needed to understand about nonprofit governancedecision-making to ensure it is supporting the health of the whole
Improve Digital Access Nonprofits reported concerns about their ability to continue providing services and transitioning to virtual service provision proved difficult if the communities they served lacked access to internet or technology Expanding broadband access will reduce inequity and enable more households to access nonprofit and government services as the pandemic continues
PUBLIC POLICY amp ADVOCACY
Improve Research on Nonprofit Advocacy National comprehensive research on nonprofit advocacy participation has not been conducted in over 20 years so it is difficult to gauge whether many of the efforts of the last two decades to overcome barriers to advocacy have succeeded or if new barriers may have emerged In order to understand the extent to which nonprofits are engaging in advocacy as well as drivers behind their engagement the sector needs much more regular research on nonprofit advocacy In particular the sector would benefit from an annual measure of nonprofit advocacy engagement from a representative sample of organizations
Promote Policy Literacy amp Relevance Although data shows nonprofits understand public policy can impact their constituents funding and policy environment they do not believe these environmental changes impact their ability to deliver on mission A disconnect between changing policy environment and mission may prevent more nonprofits from engaging in advocacy Nonprofits may need more education to understand exactly how public policy impacts their work Specifically the pandemic may provide an extreme case study to draw a clear connection for many nonprofits between public policy and their operations
Identify Organization Structures to Increase Advocacy ldquoIn order for non-profits to be a positive force for democracy they need to align their mission governance resources and relationship to the community in ways that support more advocacy and community engagementrdquo126 In other words the sector would benefit from working with researchers to identify evidence-based practices such as representative governance and community participation These practices may help nonprofit leaders and staff connect policy to nonprofit mission in order to increase the relevance and prioritization of advocacy by nonprofits
Understand Intersection between Equity amp Nonprofit Advocacy Most data on nonprofit equity initiatives focus on operations It is unclear the extent to which nonprofits integrate equity into the development of their policy agendas and advocacy Nationally representative research on this topic would improve sector-wide understanding of the scope of nonprofit activity to promote equity and potentially identify best practices to share with organizations seeking guidance
29HEALTH OF THE US NONPROFIT SECTOR
Ac
tion
amp R
es
ea
rch
Ne
xt S
tep
s
Establish Advocacy as Norm Over half of CEOs report public policy and advocacy playing little or no role in organization strategy Public policy literally defines all nonprofit organizations and it is a characteristic of highly effective organizations Therefore it is appropriate for significantly more organizations to prioritize policy and advocacy as a part of their work It could be helpful for educators and nonprofit leaders to determine how to establish advocacy as a core competency of nonprofit management and governance rather than an activity pursued only if there are excess resources
Increase Funding for Nonprofit Regulators The Internal Revenue Service (IRS) is one of two key entities responsible for enforcing laws to protect the publicrsquos trust in nonprofits Unfortunately data shows funding in the IRS has been declining for years hindering the agencyrsquos capacity to provide adequate oversight of the sector Although the sector can accomplish a great deal through shared standards and self-regulation nonprofits also need state and federal regulators to have enough resources to enforce laws that guard against fraud and abuse because scandal often negatively impacts public trust in the entire sector
Improve Research on the State of Nonprofit Oversight Currently it is difficult to easily assess the state of nonprofit oversight across self-regulatory state and federal entities Nonprofits struggle to get a complete picture of how well the full nonprofit regulatory framework balances guarding against abuse without impeding nonprofit missions More comprehensive research measures on the status of the nonprofit regulatory framework would dramatically improve the sectorrsquos ability to diagnose and improve the health of the system A comprehensive overview of knowledge on nonprofit regulation is needed
to document existing research and data gaps Next the sector would benefit from developing streamlined annual measures or indices to track the regulatory environment that shapes nonprofit work
Increase Voter Participation Voting is the most direct form of advocacy and the primary way to ensure elected officials prioritize a particular cause or population Nonprofits can increase their capacity to influence policymakers and advance their mission by encouraging their stakeholders to vote Data shows that nonprofits are among the most successful institutions at encouraging voter participation particularly among non-white young and low-income voters If more nonprofits engaged in nonpartisan voter engagement of employees volunteers and constituents candidates would better understand the need to collaborate with nonprofits once elected Voter engagement by nonprofits is particularly important this year as many would-be voters try to navigate changes to election procedures due to COVID-19 such as early voting absentee voting or changing polling places
Advocate for Nonprofits in Future Pandemic Bills Despite nonprofits providing essential community services and employing 10 of the private workforce policymakers tend to overlook the needs of nonprofits when designing COVID-19 relief legislation Concerted advocacy by thousands of nonprofits forced policymakers to modify policy proposals to support nonprofit organizations but they need constant reminders from nonprofits to keep our needs top-of-mind as they develop new legislation Nonprofits may want to continue their successful collective advocacy to ensure the sectorrsquos needs continue to be addressed in future public health and economic relief or long-term recovery legislation
30HEALTH OF THE US NONPROFIT SECTOR
Ac
tion
amp R
es
ea
rch
Ne
xt S
tep
s
Long-term Progress on Nonprofit Research
This first annual report reflects our best understanding of the health and well-being of the US nonprofit sector today
Independent Sector looks forward to improving and evolving this report over time by partnering with funders practitioners researchers and government officials to
Improve the quality and timeliness of data that informs our understanding of the sectorrsquos health
Engage members of Independent Sector and other stakeholders to make sense of what the data is telling us and jointly identify the highest priority opportunities for the sector to take action through policy and practice
IMPROVING DATA QUALITY amp TIMELINESS
Independent Sector aims to work with all institutions seeking to produce regular research on the state of nonprofits to develop the collective funding and infrastructure needed to improve the frequency and quality of sector health data in the future Specifically this report highlights nonprofit survey data that would be even more valuable if it were from a random sample of respondents that looked like the broader nonprofit sector
It is important for researchers particularly practitioner organizations to request funders cover the real costs associated with an annual survey of a nationally representative sample of nonprofits At the same time Independent Sector will work with the research community and prospective funders to build new research infrastructure that may lower the aggregate cost of fielding these types of surveys One particularly exciting example of such research infrastructure is currently underway in the build out of an annual panel survey from a nationally representative sample of nonprofits
Independent Sector also believes it is essential that academic and practitioner researchers establish shared principles when collecting national sector-wide nonprofit data Among those principles should be a shared commitment whenever possible that nonprofit research include the collection and analysis of disaggregated data to identify potential inequities across types of institutions donors volunteers or communities served
Although our understanding of the state of the nonprofit sector will be dramatically improved with regular representative data 2020 demonstrates the critical value of nonprofit surveys using convenience samples The ever-changing crisis of a global pandemic made it difficult to know at any point in time how the nonprofit sector was coping Policymakers advocates funders and donors were seeking quick real-time data to make critical decisions on how to best support the sector Thankfully many practitioner organizations were able to field a series of convenience sample surveys to shed light on nonprofit needs It is possible to look across these surveys to get a general sense of the direction of key indicators like organization revenue employment volunteerism service provision and demand for services This type of flexible timely and relatively inexpensive research will continue to serve a critical role in our ongoing understanding of nonprofits particularly in a rapidly changing environment
ldquoIf we want to have a deep understanding of our sectorrsquos health that can lead to policy and other actions that improve our health we must have a shared understanding of the value of data a uniform and ongoing commitment to gathering those data and a robust and sustained response from philanthropy to support the sectorrsquos efforts to put data-driven insights into actionrdquo
ndash DAN CARDINALI PRESIDENT AND CEO INDEPENDENT SECTOR
31HEALTH OF THE US NONPROFIT SECTOR
Ac
tion
amp R
es
ea
rch
Ne
xt S
tep
s
The federal government is an essential data source for nonprofits and our sector should regularly and energetically advocate for improved collection reporting of nonprofit data Some of the most compelling data included in this report is from government sources In fact in the future Independent Sector anticipates releasing quarterly reports of select nonprofit data from existing government sources in addition to a comprehensive annual
report Calling on the federal government to more frequently release nonprofit data allows researchers to produce more timely useful reports Requesting small changes to how government collects nonprofit data also may notably improve the value of the data for research purposes such as revising Form 990s and tagging data from nonprofit organizations within larger government databases
ENGAGING IS MEMBERS amp OTHER STAKEHOLDERS IN LEARNING
Data can raise as many questions as it answers which is why it is important to engage peers The academic community integrates peer feedback and review into multiple stages of research development to improve the ability of research to advance learning across a community In the same spirit Independent Sector seeks to create regular engagement opportunities with our members and other nonprofits to process what we can learn from current data on nonprofit health how we can improve future reports and how we might best take action on what we are learning In the near term Independent Sector will conduct a series of member and partner convenings to discuss this initial reportrsquos findings how we might set realistic benchmarks against which future health data might be
measured and other improvements In the longer term and as we anticipate the release of our 2021 and subsequent health reports we will establish more structured mechanisms by which we can gain the sectorrsquos insights on accumulated data and reflect those insights and recommendations into future reports
In sum Independent Sector is committing not only to producing a data-infused report of increasing quality but to using that report as an agile and responsive mechanism to engage the sector as we work together to improve our shared health so we can accelerate the advancement of organizational missions
We look forward to doing this work with you
32HEALTH OF THE US NONPROFIT SECTOR
Ac
tion
amp R
es
ea
rch
Ne
xt S
tep
s
Development of the Report
Independent Sector tested the need and developed the content framework of this document through interviews and feedback sessions with more than 150 sector leaders and stakeholders as well as an extensive review of government and other data sources that might provide relevant information about the sectorrsquos health The report includes new analyses as well as the most up-do-date data available from existing research presented side-by-side to provide as comprehensive a picture as possible of the state of the nonprofit sector
About the Data Cited
This report includes new analyses of 2020 government data from the US Bureau of Economic Analysis on nonprofit institutions that serve households All other data is pulled from a wide range of existing research on nonprofit institutions
Although numerous variables impact nonprofitsrsquo capacity to advance their missions this report focuses on annual national measures of the inputs assets and activities of nonprofit institutions Data intended to serve as a baseline for nonprofit health in this initial report is pulled from a wide range of research spanning academic studies to annual reports produced by sector infrastructure organizations Where possible each section includes disaggregated data across organization size and budget demographic data of staff leadership and board members and the communities served by nonprofits Disaggregated data aids our understanding of which groups communities or institutions face the greatest challenges associated with a given health metric
These groups should be targeted when advancing solutions to increase the sectorrsquos health Unfortunately disaggregated data is not available for every indicator due to research limitations as well as a lack of consensus on the most accurate equity measures for nonprofit institutions
Not all of the data used for this report is available annually at this time We made the decision to use older data to illustrate the type of data the sector will need to invest in collecting to better understand health in the future Similarly some of the data cited both in the baseline health measures and most of the COVID-19 measures are from convenience sample surveys (non-probability data) that collect data from a population close at hand This type of research methodology may result in findings that are skewed because it is not clear whether the findings represent the full sector However looking at findings from a series of convenience sample surveys can still provide value if alignment across studies indicates the direction in which data may be trending When possible the report cites multiple sources of non-probability data to illustrate such potential trends
It is important to note that sector impact measures are not included here This is not an oversight Clear data-driven metrics on the collective impact of our sector have been a goal of researchers and practitioners alike for decades That work ndash and even debates about the best way to approach impact assessment ndash continues to evolve Therefore this report focuses on the ldquoinputsrdquo that create a healthy sector capable of achieving long-term impact It remains a challenge for the sector to come to some shared view of impact measures but it is not included in this report at this time
33HEALTH OF THE US NONPROFIT SECTOR
De
ve
lop
me
nt o
f the
Re
po
rt
In sum there are large holes in our knowledge of the sectorrsquos health because there are disparities in the type frequency and quality of data we have to measure our health A critical goal of this report is to call out those data gaps and begin a conversation within the sector about how best to close them Closing these knowledge gaps is a long-standing strategic aim of Independent Sector and this report will help us further focus these efforts
Acknowledgments
We have received tremendous intellectual and moral support for this project from two leading academics in our sector both having served as Visiting Scholars at Independent Sector First we thank Alan Abramson a professor of Government and Politics and Director of the Center for Nonprofit Management Philanthropy and Policy at George Mason University for his contribution to the research and thought partnership that led to the publication of this report Second we thank Lewis Faulk associate professor of Public Administration and Policy in the School of Public Affairs at American University for his analysis of new data and guidance in the development of the first draft We also acknowledge the team at Project Evident who provided crucial expertise and support
during the development testing and subsequent iterations of this report as well as more than 160 nonprofit leaders researchers government staff and others who provided input
Most importantly we are incredibly grateful to all of the institutions that produce research cited in this report We hope this publication highlights the critical importance of their work in telling the story of the sectorrsquos health and well-being Independent Sector looks forward to using this report as a vehicle for strengthening the bonds and collaboration among the research practitioner and funder communities ndash all in service to the sector and the populations we serve
Independent Sector also acknowledges the following staff members for their contributions
Dan Cardinali President and CEO Jeffrey Moore Chief Strategy Officer Kristina Gawrgy Campbell Vice President
of Communications and Marketing Allison Grayson Director Policy
Development and Analysis (Lead Author) Marie LeBlanc Director of Design Nancy Barry Executive Assistant
Design by Shannon Ryan Made with Relish
34HEALTH OF THE US NONPROFIT SECTOR
De
ve
lop
me
nt o
f the
Re
po
rt
SourcesFinancial Resources
TOTAL RESOURCES AND EARNED REVENUES
Data for these sections are drawn from the US Bureau of Economic Analysis (BEA) Figures were calculated from tables released August 27 2020 which can be accessed at httpsappsbeagoviTableiTablecfmreqid=19ampstep=2reqid=19ampstep=2ampisuri=1amp1921=survey
Gross value added by nonprofits change from 2018-2019 ndash Table 136 ldquoReal Gross Value Added by Sector Chained Dollarsrdquo
Gross value added by sector as a share of GDP ndash Table 135 ldquoGross Value Added by Sectorrdquo
Gross output of nonprofits earned revenues ndash Table 246U ldquoReal Personal Consumption Expenditures by Type of Product Chained Dollarsrdquo
For data on the nonprofit sector BEA generally reports on ldquoNonprofit Institutions Serving Householdsrdquo (NPISH) which it describes as including tax-exempt health recreation arts education social services religious grant-making social advocacy civic and social legal services and professional labor and political and similar organizations NPISH does not include organizations like chambers of commerce and other business associations which mainly serve businesses NPISH also does not include tax-exempt entities like cooperatives credit unions and mutual financial institutions which sell goods and services in the same way as for-profit businesses BEA includes these business-serving and business-like organizations in the business sector even if they are tax-exempt entities According to BEA ldquoBecause NPISHs produce services that are not generally sold at market prices the value of these services is measured as the costs incurred in producing themrdquo See the following
US Bureau of Economic Analysis NIPA Handbook Concepts and Methods of the National Income and Product Accounts available at httpswwwbeagovresourcesmethodologiesnipa-handbook
Charles Ian Mead Clinton P McCully and Marshall B Reinsdorf ldquoIncome and Outlays of Households and of Nonprofit Institutions Serving Householdsrdquo Survey of Current Business (April 2003) pp 13-14 available at httpsappsbeagovscbpdf200304April0403householdpdf
Human Capital
PAID WORKERS
Figures in this section are calculated from Current Population Survey (CPS) data publicly available through IPUMS-CPS which is accessible at httpscpsipumsorgcps
CPS is hosted by the US Census Bureau and the US Bureau of Labor Statistics and collects information monthly from a probability selected sample of about 60000 US households Households are in the survey for four consecutive months out for eight months and then return for another four months before leaving the sample permanently One person generally responds for all eligible members of the household (see httpswwwcensusgovprograms-surveyscpstechnical-documentationmethodologyhtml)
35HEALTH OF THE US NONPROFIT SECTOR
So
urc
es
In recent years an alternative source of information on nonprofit employment has been available through a collaboration of the US Bureau of Labor Statistics and the Center for Civil Society Studies at Johns Hopkins University and their analysis of data from the Quarterly Census of Employment and Wages (QCEW) The most recent report from this collaboration indicates that in 2017 nonprofit establishments in the US employed 125million paid workers which accounts for 10 of the total private workforce (see httpccssjhuedu2020-nonprofit-employment-report)
In contrast to the CPS which surveys a sample of 60000 households the QCEW draws on quarterly reports submitted by almost 10 million US establishments With the differences in the ways that the CPS and QCEW collect data it is perhaps not surprising that they report somewhat different estimates of nonprofit employment In particular it appears that the CPS figures for nonprofit employment are lower perhaps by a couple of percentage points than the QCEW figures For example in 2017 the April CPS had nonprofit employment as 82 of private workers while the BLSQCEW put nonprofit employment at 102 of private employment in 2017 Note that the 7 figure on page X shows nonprofit employment as a percentage of nonprofit business and government workers and not just as a percentage of private mdash that is nonprofit and business mdash workers
For a detailed comparison of the CPS and QCEW see httpswwwblsgovcewpublicationsemployment-and-wages-annual-averages2019homehtm
For BLSQCEW data on nonprofit employment for 2013 - 2017 see httpswwwblsgovbdmnonprofitsnonprofitshtm
36HEALTH OF THE US NONPROFIT SECTOR
So
urc
es
Endnotes 1 ldquoKey Facts on US Nonprofits and Foundationsrdquo April 2020 Candid
httpswwwissuelaborgresources3638136381pdf 2 ldquoKey Facts on US Nonprofits and Foundationsrdquo April 2020 Candid
httpswwwissuelaborgresources3638136381pdf 3 ldquoKey Facts on US Nonprofits and Foundationsrdquo April 2020 Candid
httpswwwissuelaborgresources3638136381pdf 4 ldquoKey Facts on US Nonprofits and Foundationsrdquo April 2020 Candid
httpswwwissuelaborgresources3638136381pdf 5 US Bureau of Economic Analysis 6 US Bureau of Economic Analysis (BEA) Nonprofit sector refers to ldquoNonprofit
Institutions Serving Householdsrdquo or NPISH as defined by BEA See ldquoSources and Notesrdquo for more information
7 US Bureau of Economic Analysis (BEA) Nonprofit sector refers to ldquoNonprofit Institutions Serving Householdsrdquo or NPISH as defined by BEA See ldquoSources and Notesrdquo for more information
8 US Bureau of Economic Analysis (BEA) Nonprofit sector refers to ldquoNonprofit Institutions Serving Householdsrdquo or NPISH as defined by BEA See ldquoSources and Notesrdquo for more information
9 US Bureau of Economic Analysis (BEA) Nonprofit sector refers to ldquoNonprofit Institutions Serving Householdsrdquo or NPISH as defined by BEA See ldquoSources and Notesrdquo for more information
10 US Bureau of Economic Analysis (BEA) Nonprofit sector refers to ldquoNonprofit Institutions Serving Householdsrdquo or NPISH as defined by BEA See ldquoSources and Notesrdquo for more information
11 ldquoState of the Nonprofit Sector Surveyrdquo 2018 Nonprofit Finance Fund httpsnfforgsurveydata
12 ldquoState of the Nonprofit Sector Surveyrdquo 2018 Nonprofit Finance Fund httpsnfforgsurveydata
13 ldquoState of the Nonprofit Sector Surveyrdquo 2018 Nonprofit Finance Fund httpsnfforgsurveydata
14 ldquoThe Case for Funding Black-Led Social Changerdquo ABFE December 2019 httpwwwblacksocialchangeorgwp-contentuploads202005BSCFN_BLSCO_Reportpdf
15 ldquoRacial Equity and Philanthropy Disparities in Funding for Leaders of Color Leave Impact on the Tablerdquo The Bridgespan Group May 4 2020 httpswwwbridgespanorginsightslibraryphilanthropydisparities-nonprofit-funding-for-leaders-of-color
16 ldquoRacial Equity and Philanthropy Disparities in Funding for Leaders of Color Leave Impact on the Tablerdquo The Bridgespan Group May 4 2020 httpswwwbridgespanorginsightslibraryphilanthropydisparities-nonprofit-funding-for-leaders-of-color
17 Latinx Funders Dashboard Candid httpslatinxfundersorg_ga=22363900811564048031596424440-7650958491588897342
18 Bureau of Economic Analysis 19 ldquoGiving USA 2020rdquo 2020 Giving USA httpsgivingusaorggiving-usa-2020-
charitable-giving-showed-solid-growth-climbing-to-449-64-billion-in-2019-one-of-the-highest-years-for-giving-on-record
20 ldquoAssessing Giving USA 2020 Billions in Giving are Missingrdquo 2020 White Paper Charitable Giving Coalition
21 ldquoAssessing Giving USA 2020 Billions in Giving are Missingrdquo 2020 White Paper Charitable Giving Coalition
22 ldquoFundraising Effectiveness Project Quarterly Fundraising Reportrdquo 4th Quarter 2019 httpsdrivegooglecomfiled1p2j3lGRB9Lj0udhhdz3lUV3-WhJw2PM9view
23 Rooney Patrick M ldquoWhere Have All The Donors Gone The continued decline of the small donor and the growth of megadonorsrdquo December 4 2019 Nonprofit Quarterly httpsnonprofitquarterlyorgwhere-have-all-the-donors-gone-the-continued-decline-of-the-small-donor-and-the-growth-of-megadonors
24 ldquoGiving USA 2020rdquo 2020 Giving USA httpsgivingusaorggiving-usa-2020-charitable-giving-showed-solid-growth-climbing-to-449-64-billion-in-2019-one-of-the-highest-years-for-giving-on-record
25 ldquoGiving USA 2020rdquo 2020 Giving USA httpsgivingusaorggiving-usa-2020-charitable-giving-showed-solid-growth-climbing-to-449-64-billion-in-2019-one-of-the-highest-years-for-giving-on-record
26 ldquoState of the Nonprofit Sector Surveyrdquo 2018 Nonprofit Finance Fund httpsnfforgsurveydata
27 ldquoState of the Nonprofit Sector Surveyrdquo 2018 Nonprofit Finance Fund httpsnfforgsurveydata
28 Pettijohn Sarah Elizabeth Boris Carol De Vita and Saunji Fyffe 2013 ldquoNonprofit-Government Contracts and Grants Findings from the 2013 National Surveyrdquo httpswwwurbanorgsitesdefaultfilespublication24231412962-Nonprofit-Government-Contracts-and-Grants-Findings-from-the-National-SurveyPDF
29 ldquoCOVID Impact Survey Week 3 National Findingsrdquo May 30 ndash June 8 2020 COVID Impact Survey Data Foundation httpsstatic1squarespacecomstatic5e8769b34812765cff8111f7t5ee11863221ddf08b0284c201591810150212covid_w3_topline_national_webpdf
30 ldquoCOVID Impact Survey Week 3 National Findingsrdquo May 30 ndash June 8 2020 COVID Impact Survey Data Foundation httpsstatic1squarespacecomstatic5e8769b34812765cff8111f7t5ee11863221ddf08b0284c201591810150212covid_w3_topline_national_webpdf
31 ldquoCOVID Impact Survey Week 3 National Findingsrdquo May 30 ndash June 8 2020 COVID Impact Survey Data Foundation httpsstatic1squarespacecomstatic5e8769b34812765cff8111f7t5ee11863221ddf08b0284c201591810150212covid_w3_topline_national_webpdf
32 ldquoCOVID Impact Survey Week 3 National Findingsrdquo May 30 ndash June 8 2020 COVID Impact Survey Data Foundation httpsstatic1squarespacecomstatic5e8769b34812765cff8111f7t5ee11863221ddf08b0284c201591810150212covid_w3_topline_national_webpdf
33 ldquoCOVID Impact Survey Week 3 National Findingsrdquo May 30 ndash June 8 2020 COVID Impact Survey Data Foundation httpsstatic1squarespacecomstatic5e8769b34812765cff8111f7t5ee11863221ddf08b0284c201591810150212covid_w3_topline_national_webpdf
34 Berstein Hamutal Jorge Gonzalez Dulce Gonzalez and Jahnavi Jagannath ldquoImmigrant-Serving Organizationsrsquo Perspectives on the COVID-19 Crisisrdquo August 2020 Urban Institute httpswwwurbanorgsitesdefaultfilespublication102775immigrant-serving-organizations-on-the-covid-19-crisis_0_0pdf
35 Harold Jacob ldquoHow many nonprofits will shut their doorsrdquo July 152020 Candid httpsblogcandidorgposthow-many-nonprofits-will-shut-their-doors
36 McCambridge Ruth and Nathan Dietz ldquoNonprofits in Recession Winners and Losersrdquo March 19 2020 httpsnonprofitquarterlyorgthe-great-recession-nonprofit-winners-and-losers
37 US Bureau of Economic Analysis (BEA) Nonprofit sector refers to ldquoNonprofit Institutions Serving Householdsrdquo or NPISH as defined by BEA See ldquoSources and Notesrdquo for more information
38 ldquoLarge and Mid-Sized Surveyrdquo June 2020 Independent Sector httpsindependentsectororgwp-contentuploads202006COVID19-survey-mid-size-nonprofits-June2020pdf
39 ldquoSpecial Report COVID-19 and the Charitable Sectorrdquo March 2020 BBB Wise Giving Alliance httpswwwgiveorgdocsdefault-sourcedonor-trust-librarywga-covid19-charity-reportpdf
40 Berstein Hamutal Jorge Gonzalez Dulce Gonzalez and Jahnavi Jagannath ldquoImmigrant-Serving Organizationsrsquo Perspectives on the COVID-19 Crisisrdquo August 2020 Urban Institute httpswwwurbanorgsitesdefaultfilespublication102775immigrant-serving-organizations-on-the-covid-19-crisis_0_0pdf
41 ldquoImpact of COVID-19 on Large and Mid-sized Nonprofitsrdquo 2020 Independent Sector httpsindependentsectororgwp-contentuploads202006COVID19-survey-mid-size-nonprofits-June2020pdf
42 ldquo2020 Q2 Reportrdquo Fundraising Effectiveness Project 2020 httpsafpfeporgreports
43 ldquo2020 Q2 Reportrdquo Fundraising Effectiveness Project 2020 httpsafpfeporgreports
44 Jones Jeffrey M ldquoPercentage of Americans Donating to Charity at New Lowrdquo May 14 2020 Gallup httpsnewsgallupcompoll310880percentage-americans-donating-charity-new-lowaspx
45 Jones Jeffrey M ldquoPercentage of Americans Donating to Charity at New Lowrdquo May 14 2020 Gallup httpsnewsgallupcompoll310880percentage-americans-donating-charity-new-lowaspx
46 ldquo2020 Q2 Reportrdquo Fundraising Effectiveness Project 2020 httpsafpfeporgreports
47 ldquoGiving USA 2020rdquo 2020 Giving USA httpsgivingusaorggiving-usa-2020-charitable-giving-showed-solid-growth-climbing-to-449-64-billion-in-2019-one-of-the-highest-years-for-giving-on-record
48 ldquoGross Domestic Product Second Quarter 2020rdquo US Bureau of Economic Analysis September 30 2020 httpswwwbeagovdatagdpgross-domestic-product
49 Williams Jeff ldquoIn the Time of Coronavirus How many eligible nonprofits benefited from the Paycheck Protection Programrdquo July 21 2020 Johnson Center at Grand Valley State University httpsjohnsoncenterorgin-the-time-of-coronavirus-how-many-eligible-nonprofits-benefited-from-the-paycheck-protection-program
50 McCambridge Ruth and Nathan Dietz ldquoNonprofits in Recession Winners and Losersrdquo March 19 2020 httpsnonprofitquarterlyorgthe-great-recession-nonprofit-winners-and-losers
51 ldquoRace to Lead Revisited Obstacles and Opportunities in Addressing the Nonprofit Racial Leadership Gaprdquo July 2020 Building Movement Project httpsbuildingmovementorgwp-contentuploads202007RTL_Revisited_National-Report_Finalpdf
52 Current Population Survey (CPS) conducted by the US Census Bureau and the US Bureau of Labor Statistics
53 Current Population Survey (CPS) conducted by the US Census Bureau and the US Bureau of Labor Statistics
54 Current Population Survey (CPS) conducted by the US Census Bureau and the US Bureau of Labor Statistics
55 Current Population Survey (CPS) conducted by the US Census Bureau and the US Bureau of Labor Statistics
56 ldquoResearch Data on the Nonprofit Sector 2017rdquo Released 2020 US Bureau of Labor Statistics httpswwwblsgovbdmnonprofitsnonprofitshtmNP20Size20Tablexlsxf1
37HEALTH OF THE US NONPROFIT SECTOR
En
dn
ote
s
57 2020 Nonprofit Employment Report June 2020 Johns Hopkins University httpccssjhueduwp-contentuploadsdownloads2020062020-Nonprofit-Employment-Report_FINAL_62020pdf
58 2020 Nonprofit Employment Report June 2020 Johns Hopkins University httpccssjhueduwp-contentuploadsdownloads2020062020-Nonprofit-Employment-Report_FINAL_62020pdf
59 2020 Nonprofit Employment Report June 2020 Johns Hopkins University httpccssjhueduwp-contentuploadsdownloads2020062020-Nonprofit-Employment-Report_FINAL_62020pdf
60 2020 Nonprofit Employment Report June 2020 Johns Hopkins University httpccssjhueduwp-contentuploadsdownloads2020062020-Nonprofit-Employment-Report_FINAL_62020pdf
61 2020 Nonprofit Employment Report June 2020 Johns Hopkins University httpccssjhueduwp-contentuploadsdownloads2020062020-Nonprofit-Employment-Report_FINAL_62020pdf
62 2020 Nonprofit Employment Report June 2020 Johns Hopkins University httpccssjhueduwp-contentuploadsdownloads2020062020-Nonprofit-Employment-Report_FINAL_62020pdf
63 ldquoRace to Lead Revisited Obstacles and Opportunities in Addressing the Nonprofit Racial Leadership Gaprdquo July 2020 Building Movement Project httpsbuildingmovementorgwp-contentuploads202007RTL_Revisited_National-Report_Finalpdf
64 ldquoRace to Lead Revisited Obstacles and Opportunities in Addressing the Nonprofit Racial Leadership Gaprdquo July 2020 Building Movement Project httpsbuildingmovementorgwp-contentuploads202007RTL_Revisited_National-Report_Finalpdf
65 Lee Young-Joo July 2 2019 ldquoMale nonprofit CEOs earn more ndash but the real problem runs deeper than a simple gender pay gaprdquo The Conversation httpstheconversationcommale-nonprofit-ceos-earn-more-but-the-problem-runs-deeper-than-a-simple-gender-pay-gap-119068
66 ldquoVolunteering in Americardquo 2017 Corporation for National and Community Service httpswwwnationalservicegovservevia
67 ldquoVolunteering in Americardquo 2017 Corporation for National and Community Service httpswwwnationalservicegovservevia
68 ldquoVolunteering in Americardquo 2017 Corporation for National and Community Service httpswwwnationalservicegovservevia
69 Newhouse Chelsea ldquoNonprofit Jobs Still Down by Nearly 1 Million Despite a Partial Recoveryrdquo September 4 2020 Johns Hopkins University httpccssjhuedulabor-day-2020-coronavirus
70 ldquoCOVID Impact Survey Week 3 National Findingsrdquo May 30 ndash June 8 2020 COVID Impact Survey Data Foundation httpsstatic1squarespacecomstatic5e8769b34812765cff8111f7t5ee11863221ddf08b0284c201591810150212covid_w3_topline_national_webpdf
71 ldquoCOVID-19 Impact on Volunteeringrdquo March 25 2020 VolunteerMatch httpsinfovolunteermatchorgcovid-19-resource-hub
72 ldquoCOVID-19 Impact on Volunteeringrdquo March 25 2020 VolunteerMatch httpsinfovolunteermatchorgcovid-19-resource-hub
73 ldquoTrust in Civil Society Understanding the factors driving trust in nonprofits and philanthropyrdquo 2020 Independent Sector httpsindependentsectororgwp-contentuploads202006Trust-in-Civil-Society-62420pdf
74 ldquo2019 Donorrsquos Trust Report State of Public Trust in the Charitable Sectorrdquo 2019 BBB Wise Giving Alliance fileCUsersallisongDocumentsPolicy20Symposium2019-donor-trust-reportpdf
75 ldquoTrust in Civil Society Understanding the factors driving trust in nonprofits and philanthropyrdquo 2020 Independent Sector httpsindependentsectororgwp-contentuploads202006Trust-in-Civil-Society-62420pdf
76 ldquoTrust in Civil Society Understanding the factors driving trust in nonprofits and philanthropyrdquo 2020 Independent Sector httpsindependentsectororgwp-contentuploads202006Trust-in-Civil-Society-62420pdf
77 ldquoTrust in Civil Society Understanding the factors driving trust in nonprofits and philanthropyrdquo 2020 Independent Sector httpsindependentsectororgwp-contentuploads202006Trust-in-Civil-Society-62420pdf
78 ldquoTrust in Civil Society Understanding the factors driving trust in nonprofits and philanthropyrdquo 2020 Independent Sector httpsindependentsectororgwp-contentuploads202006Trust-in-Civil-Society-62420pdf
79 ldquo2019 Donorrsquos Trust Report State of Public Trust in the Charitable Sectorrdquo 2019 BBB Wise Giving Alliance fileCUsersallisongDocumentsPolicy20Symposium2019-donor-trust-reportpdf
80 ldquoTrust in Civil Society Understanding the factors driving trust in nonprofits and philanthropyrdquo 2020 Independent Sector httpsindependentsectororgwp-contentuploads202006Trust-in-Civil-Society-62420pdf
81 ldquoLeading with Intent 2017 BoardSource Index of Nonprofit Board Practicesrdquo 2017 Board Source P 12 httpsleadingwithintentorg__hstc=98438528c0a04be535e93b2008d110605aec23f215947523898351594752389835 15952763236642amp__hssc=9843852841595276323664amp__ hsfp=2455080615
82 ldquoLeading with Intent 2020 Index of Nonprofit Board Practicesrdquo 2020 BoardSource
83 ldquoRace to Lead Revisited Obstacles and Opportunities in Addressing the Nonprofit Racial Leadership Gaprdquo July 2020 Building Movement Project httpsbuildingmovementorgwp-contentuploads202007RTL_Revisited_National-Report_Finalpdf
84 ldquoLeading with Intent 2020 Index of Nonprofit Board Practicesrdquo 2020 BoardSource
85 ldquoLeading with Intent 2020 Index of Nonprofit Board Practicesrdquo 2020 BoardSource
86 ldquoLeading with Intent 2020 Index of Nonprofit Board Practicesrdquo 2020 BoardSource
87 ldquoState of the Nonprofit Sector Surveyrdquo 2018 Nonprofit Finance Fund httpsnfforgsurveydata
88 ldquoLeading with Intent 2020 Index of Nonprofit Board Practicesrdquo 2020 BoardSource
89 ldquoLeading with Intent 2020 Index of Nonprofit Board Practicesrdquo 2020 BoardSource
90 ldquoRace to Lead Revisited Obstacles and Opportunities in Addressing the Nonprofit Racial Leadership Gaprdquo July 2020 Building Movement Project httpsbuildingmovementorgwp-contentuploads202007RTL_Revisited_National-Report_Finalpdf
91 ldquoRace to Lead Revisited Obstacles and Opportunities in Addressing the Nonprofit Racial Leadership Gaprdquo July 2020 Building Movement Project httpsbuildingmovementorgwp-contentuploads202007RTL_Revisited_National-Report_Finalpdf
92 ldquoNACD COVID-19 Survey Reveals Top Trends and Governance Challenges Directors Anticipate as We Move to New Normalrdquo June 9 2020 NACD May 2020 COVID-19 Pulse Survey National Association of Corporate Directors httpswwwglobenewswirecomnews-release2020060920457250enNACD-COVID-19-Survey-Reveals-Top-Trends-and-Governance-Challenges-Directors-Anticipate-as-We-Move-to-New-Normalhtml
93 ldquoSpecial Report COVID-19 and the Charitable Sectorrdquo March 2020 BBB Wise Giving Alliance httpswwwgiveorgdocsdefault-sourcedonor-trust-librarywga-covid19-charity-reportpdf
94 ldquoSpecial Report COVID-19 and the Charitable Sectorrdquo March 2020 BBB Wise Giving Alliance httpswwwgiveorgdocsdefault-sourcedonor-trust-librarywga-covid19-charity-reportpdf
95 ldquoSpecial Report COVID-19 and the Charitable Sectorrdquo March 2020 BBB Wise Giving Alliance httpswwwgiveorgdocsdefault-sourcedonor-trust-librarywga-covid19-charity-reportpdf
96 Berstein Hamutal Jorge Gonzalez Dulce Gonzalez and Jahnavi Jagannath ldquoImmigrant-Serving Organizationsrsquo Perspectives on the COVID-19 Crisisrdquo August 2020 Urban Institute httpswwwurbanorgsitesdefaultfilespublication102775immigrant-serving-organizations-on-the-covid-19-crisis_0_0pdf
97 ldquoSpecial Report COVID-19 and the Charitable Sectorrdquo March 2020 BBB Wise Giving Alliance httpswwwgiveorgdocsdefault-sourcedonor-trust-librarywga-covid19-charity-reportpdf
98 ldquoLeading with Intent 2020 Index of Nonprofit Board Practicesrdquo 2020 BoardSource 99 ldquoLeading with Intent 2020 Index of Nonprofit Board Practicesrdquo 2020 BoardSource 100 ldquoState of the Nonprofit Sector Surveyrdquo 2018 Nonprofit Finance Fund httpsnff
orgsurveydata 101 Rathgeb Smith Steven and Robert Pekkanen 2012 ldquoRevisiting advocacy by non-
profit organisationsrdquo Voluntary Sector Review Vol 3 No 1 Pp 40 httpswwwresearchgatenetprofileRobert_Pekkanenpublication256701715_Revisiting_advocacy_by_non-profit_organisationslinks00b49523a225987215000000pdf
102 ldquoGrantmaking for Community Impact Project Increasing philanthropic resources for advocacy organizing and civic engagementrdquo 2011 National Committee for Responsive Philanthropy httpswwwncrporgpublicationsgrantmaking-for-community-impact-project
103 ldquoM+R Benchmarksrdquo 2020 httpsmrbenchmarkscom 104 ldquoM+R Benchmarksrdquo 2020 httpsmrbenchmarkscom 105 Rathgeb Smith Steven and Robert Pekkanen 2012 ldquoRevisiting advocacy by
non-profit organisationsrdquo Voluntary Sector Review Vol 3 No 1 httpswwwresearchgatenetprofileRobert_Pekkanenpublication256701715_Revisiting_advocacy_by_non-profit_organisationslinks00b49523a225987215000000pdf
106 Rathgeb Smith Steven and Robert Pekkanen 2012 ldquoRevisiting advocacy by non-profit organisationsrdquo Voluntary Sector Review Vol 3 No 1 Pp 42 httpswwwresearchgatenetprofileRobert_Pekkanenpublication256701715_Revisiting_advocacy_by_non-profit_organisationslinks00b49523a225987215000000pdf
107 ldquoThe Impact of Diversity Understanding how nonprofit board diversity affects philanthropy leadership and board engagementrdquo 2018 Indiana University Johnson Grossnickle+ Associates BoardSource httpswwwissuelaborgresources3511235112pdf
108 ldquoLeading with Intent 2020 Index of Nonprofit Board Practicesrdquo 2020 BoardSource 109 ldquoLeading with Intent 2020 Index of Nonprofit Board Practicesrdquo 2020 BoardSource 110 ldquoLeading with Intent 2020 Index of Nonprofit Board Practicesrdquo 2020 BoardSource 111 ldquoLeading with Intent 2020 Index of Nonprofit Board Practicesrdquo 2020 BoardSource 112 ldquoEngaging New Voters If nonprofits donrsquot who willrdquo 2019 Nonprofit Vote https
wwwnonprofitvoteorgdocuments201905engaging-new-voters-2018pdf
38HEALTH OF THE US NONPROFIT SECTOR
En
dn
ote
s
113 ldquoEngaging New Voters If nonprofits donrsquot who willrdquo 2019 Nonprofit Vote httpswwwnonprofitvoteorgdocuments201905engaging-new-voters-2018pdf
114 ldquoEngaging New Voters If nonprofits donrsquot who willrdquo 2019 Nonprofit Vote httpswwwnonprofitvoteorgdocuments201905engaging-new-voters-2018pdf
115 ldquoTrends in the Internal Revenue Servicersquos Funding and Enforcementrdquo Congressional Budget Office July 2020 httpswwwcbogovpublication56422
116 Williams Jeff ldquoIn the Time of Coronavirus How many eligible nonprofits benefited from the Paycheck Protection Programrdquo July 21 2020 Johnson Center at Grand Valley State University httpsjohnsoncenterorgin-the-time-of-coronavirus-how-many-eligible-nonprofits-benefited-from-the-paycheck-protection-program
117 Williams Jeff ldquoIn the Time of Coronavirus How many eligible nonprofits benefited from the Paycheck Protection Programrdquo July 21 2020 Johnson Center at Grand Valley State University httpsjohnsoncenterorgin-the-time-of-coronavirus-how-many-eligible-nonprofits-benefited-from-the-paycheck-protection-program
118 Williams Jeff ldquoIn the Time of Coronavirus How many eligible nonprofits benefited from the Paycheck Protection Programrdquo July 21 2020 Johnson Center at Grand Valley State University httpsjohnsoncenterorgin-the-time-of-coronavirus-how-many-eligible-nonprofits-benefited-from-the-paycheck-protection-program
119 Williams Jeff ldquoIn the Time of Coronavirus How many eligible nonprofits benefited from the Paycheck Protection Programrdquo July 21 2020 Johnson Center at Grand Valley State University httpsjohnsoncenterorgin-the-time-of-coronavirus-how-many-eligible-nonprofits-benefited-from-the-paycheck-protection-program
120 Williams Jeff ldquoIn the Time of Coronavirus How many eligible nonprofits benefited from the Paycheck Protection Programrdquo July 21 2020 Johnson Center at Grand Valley State University httpsjohnsoncenterorgin-the-time-of-coronavirus-how-many-eligible-nonprofits-benefited-from-the-paycheck-protection-program
121 Williams Jeff ldquoIn the Time of Coronavirus How many eligible nonprofits benefited from the Paycheck Protection Programrdquo July 21 2020 Johnson Center at Grand Valley State University httpsjohnsoncenterorgin-the-time-of-coronavirus-how-many-eligible-nonprofits-benefited-from-the-paycheck-protection-program
122 Rooney Patrick ldquoGo Big or Go Home Steps Congress Should Take Nowrdquo June 10 2020 Nonprofit Quarterly httpsnonprofitquarterlyorggo-big-or-go-home-steps-congress-should-take-to-increase-charitable-giving
123 ldquoGuidelines for Healthy In-Person Votingrdquo August 12 2020 Brennan Center for Justice httpswwwbrennancenterorgsitesdefaultfiles2020-082020_08_Guide20for20Healthy20In20Person20Voting_Finalv2pdf
124 ldquoAt Least 77 of American voters can cast ballots by mail in the fallrdquo The Washington Post httpswwwwashingtonpostcomgraphics2020politicsvote-by-mail-states
125 ldquoAt Least 77 of American voters can cast ballots by mail in the fallrdquo The Washington Post httpswwwwashingtonpostcomgraphics2020politicsvote-by-mail-states
126 Rathgeb Smith Steven and Robert Pekkanen 2012 ldquoRevisiting advocacy by non-profit organisationsrdquo Voluntary Sector Review Vol 3 No 1 Pp 43 httpswww researchgatenetprofileRobert_Pekkanenpublication256701715_Revisiting_ advocacy_by_non-profit_organisationslinks00b49523a225987215000000pdf
About Independent Sector
Independent Sector is the only national membership organization that brings together a diverse community of changemakers at nonprofits foundations and corporate giving programs working to strengthen civil society and ensure all people in the United States thrive As the vital meeting ground we advance our mission by fostering a sense of belonging catalyzing action and providing policy leadership across the full breadth of the charitable sector
Copyright copy 2020 by Independent Sector All rights reserved
39HEALTH OF THE US NONPROFIT SECTOR
En
dn
ote
s
1602 L Street NW Suite 900
Washington DC 20036
202-467-6100
independentsectororg
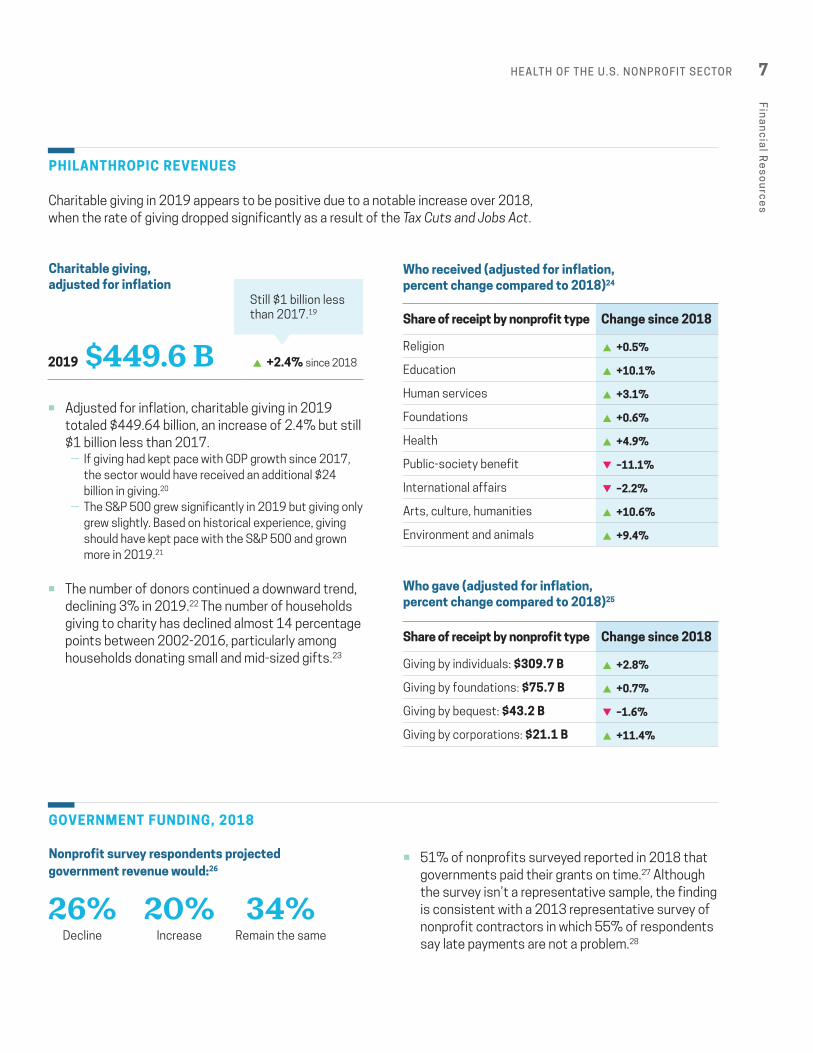

PAID WORKERS
Nonprofits compared to overall workforce June 202052
Includes nonagricultural wage and salary workers and excludes military family and self-employed workers
Since April 2015 the nonprofit workforce has become more female
Nonprofit workers worked an average of 38 hours each week in June 2020
Human CapitalThe charitable sectorrsquos human capital
ldquoresourcerdquo contains both the paid and voluntary workforce Human capital data simultaneously demonstrates nonprofitsrsquo contribution to the economy as employers as well as provides indication of organizationsrsquo capacity to fulfill their missions
The general health of nonprofit human capital was trending in a net positive direction in 2019 until the global pandemic For decades the nonprofit sector served as an important source of jobs for Americans and family income of the nonprofit workforce is on the rise The workforce also has grown more diverse in recent years although the sector lags the overall workforce in racial and ethnic diversity The exception lies in volunteerism where it remains unclear whether declining numbers of volunteers over the past decade was beginning to improve Unfortunately early data shows COVID-19 hurt the health of both nonprofit employment and volunteerism losing 8 of nonprofit jobs and a 12-percentage point decline in volunteerism rates
Overall53 Change since June 2019
Nonprofits 7
None
Businesses 776
ndash07
Government 154 +04
RaceEthnicity54 Change since June 2019
Overall workforce
White 6838
ndash03 605
Black 1176
ndash04 122
Hispanic 102
ndash02 1828
AsianPacific Islander 59 +12 65
American Indian 05
ndash02 07
Gender55 Change since June 2019
Overall workforce
Female 6562
ndash08 482
Male 3438 +08 518
11HEALTH OF THE US NONPROFIT SECTOR
Hu
ma
n C
ap
ital
NONPROFITS COMPARED TO PRIVATE WORKFORCE
Percent of private workforce employed by nonprofits
Nonprofits paid over $670 B in wages in 201758
The nonprofit sector saw significant growth over 2007-2017 increasing the total workforce by 186 (compared to the 62 for-profit growth rate)59
Income Ȅ While nonprofits may pay lower wages than the
average for-profit in the general economy this disparity is far smaller than is frequently assumed60
Ȅ In fields in which nonprofits operate they actually pay wages that on average are higher than for-profit firms in the same fields61 This data may illustrate it is possible for nonprofits to effectively compete against businesses for talent while also providing critical services
Ȅ Only three of the major fields in which nonprofits operate do for-profit firms pay higher average weekly wages than nonprofits bull Professional amp technical servicesbull Arts amp recreationbull Management of companies62
Number of Employees Percent of Nonprofit Orgs
Fewer than 5 employees 39
5-9 employees 17
10-19 employees 14
20-49 employees 13
50-99 employees 6
100-249 employees 6
250-499 employees 2
500-999 employees 1
1000+ employees 1
Nonprofits by size of workforce 201756
NONPROFIT WORKFORCE EQUITY amp DISPARITY
Board composition appears to play a significant role in both the racial and gender diversity of nonprofit leaders
Racial disparities Ȅ 75 of respondents report that their organizationrsquos leadership team is more than half white63
Ȅ 45 of respondents reported working for organizations in which both the board and senior leadership are less than 25 people of color These organizations also showed the greatest gap between whites and people of color in terms of their employee experience64
Gender disparities Ȅ The gender pay gap among nonprofit leaders has more to do with the lack of female CEOs in larger organizations than with high-ranking male nonprofit executives out-earning their female peers when they are in charge of organizations of approximately the same size65
bull Female leaders make up only 35 of organizations with budgets greater than $10 million even though women make up the vast majority of their staffs
bull Boards are more likely to hire female leaders if some of their members are women but other variables also impact the likelihood of women being hired
Study analyzed 350 human service organizations with budgets over $10M
Family Income Change since June 2019
Overall workforce
Less than $400000 135
ndash57 183
$40000-$74999 247 +05 264
$75000-$149000 366 +29 351
$150000 and Over 252 +33 203
Family income from nonprofit employment June 2020
10+90102
125 million paid workers in 201757 Estimates of nonprofit percent of private workforce vary from 6-10 depending on data source
12HEALTH OF THE US NONPROFIT SECTOR
Hu
ma
n C
ap
ital
The Impact of COVID-19 on Human Capital
PAID WORKERS
Nonprofit Jobs Lost March-August 202069
976616 The biggest hit to employment in the sector is
part-time employment
There does not appear to be disproportionate declines in jobs based on race or income
Younger nonprofit employees tended to be affected worse than others
VOLUNTEERS
Nonprofits report a significant decline in their volunteer base Individuals report volunteerism rates have declined 12 percentage points compared to the same time last year70
53 of nonprofits surveyed reported heavy cancellations by volunteers in May 2020 71
45 of nonprofits surveyed are adapting to the COVID-19 environment by offering more virtual volunteer opportunities72
VOLUNTEERS
ADULT VOLUNTEERING RATE 2017
The US Corporation for National and Community Service reports that the rate of adults volunteering went up significantly from 2015 to 2017 suggesting a reversal in the general decline in volunteering between early 2000s to 2015 However some experts have questioned the comparability of the 2017 results because of changes in survey methodology and whether this turnaround has truly occurred
774 M 69 B $167 BAmericans
volunteered66
hours served67 in estimated economic value68
BY THE NUMBERS 2017
Estimated nonprofit job losses MarchndashAugust 202069
Nonprofit field Jobs lost March-August Share of nonprofit jobs lost
All fields 976616
Health Care 310766 318
Educational Services 211755 217
Social Assistance 182166 187
Arts Entertainment Recreation 134961 138
Other Services 100300 103
Other Fields 25541 26
Professional amp Technical Services 11155 11
Includes Construction Manufacturing Wholesale Retail Trade Transportation and Warehousing Information Finance and Insurance and Accommodation and food services
13HEALTH OF THE US NONPROFIT SECTOR
Hu
ma
n C
ap
ital
DATA RECOMMENDATIONS FOR HUMAN CAPITAL
1 The nonprofit sector is dependent on the Bureau of Labor Statistics (BLS) to access
more timely up-to-date information on nonprofit employment BLS has made clear they may be inclined to release data on a more regular basis if there is a clear demand which likely would be voiced by nonprofit advocates
2 A publicly available analysis of nonprofit sector compensation and any accompanying
pay gaps is needed to track progress in closing the gap and hold sector leaders accountable
3 American Indian and Alaska Native populations are frequently excluded from
regularly reported national data sets as well as the sector-specific data included in this report More work is needed to measure and understand the unique experience of American Indians and Alaska Natives in the US nonprofit sector
4 Recent changes in the methodology of the survey on volunteer behavior at the
US Corporation for National and Community Service have made it difficult for the sector to fully understand changing trends in volunteerism The research needs to be prioritized within CNCS and Congress needs to provide sufficient funding to increase the quality of the research design to consistently capture a more complete picture of the state of volunteerism in America The sector would benefit from the inclusion of researchersrsquo questions about the demographics of nonprofit boards and executive staff as a part of a nationally representative panel survey of nonprofits
14HEALTH OF THE US NONPROFIT SECTOR
Hu
ma
n C
ap
ital
PUBLIC TRUST
Percent of the public in the United States that trusts nonprofits to do what is right7374
Trust is concentrated among urbanites with high incomes and levels of education75
Rural Americans and those with lower incomes and educational attainment are more likely to express skepticism about nonprofits75
Respondents who are confident in the ability of nonprofits to strengthen American society75 Respondents who believe the sector is headed in the right direction in their effort to do that work76 Respondents who trust philanthropic institutions but personal familiarity with philanthropy may be a key driver77
A high level of trust leads to more giving and volunteering but positive engagement with nonprofits also reinforces trust78 Specifically 70 of respondents cite trust as essential before making charitable gifts79
The current snapshot indicates that the sector may need to fortify the publicrsquos perception to continue supporting nonprofitsrsquo important roles in their communities Research shows nonprofits can strengthen trust by conveying integrity and clarity of purpose80
Governance amp TrustPublic trust is the currency upon which nonprofits conduct their work The extent the public believes nonprofits lead ethically and transparently impacts whether individuals will invest in or utilize services from nonprofits It also impacts the extent to which nonprofits can legitimately represent and are accountable to the communities they serve Although the public generally trusts nonprofits to do what is right the sector needs to make notable strides in order for nonprofit governance and trust to be deemed healthy Specifically data highlights opportunities to improve nonprofit transparency and accountability board diversity equity and community participation in decision-making
59+4159
81
47
36
15HEALTH OF THE US NONPROFIT SECTOR
Go
ve
rna
nc
e amp
Trus
t
BOARD OF DIRECTORSLEADERSHIP
Research shows the demographic composition of board members influences the health and well-being of staff and equitable pursuit of nonprofit missions Including communities served in nonprofit decision-making also may be an indicator of fair equitable governance According to BoardSource ldquoblind spots created by a lack of racial and ethnic diversity are particularly concerning as they may result in strategies and plans that ineffectively address societal challenges inequities or even reinforce themrdquo81
In a 2020 BoardSource survey of foundation and public charity CEOs and board chairs diversity in the sector has only improved slightly since their first survey on this issue in 199482
57 of respondents in the Race to Lead Revisited report less than 25 of their board are people of color83
Race amp Ethnicity CEO Board Member Chair86
WhiteCaucasianEuropean 87 78 83
BlackAfrican AmericanAfrican 5 10 6
HispanicLatinx 3 5 5
AsianPacific Islander 2 4 2
Multi-RacialMulti-Ethnic 3 1 2
Native AmericanIndigenous 03 1 04
Other raceethnicity 1 2 1
Gender CEO Board Member Chair
Female 74 53 53
Male 26 47 47
Non-Binary 03 01 01
Not Transgender (Cisgender) 993 99 996
Transgender 03 01 01
Disability Status CEO Board Member Chair
Without disability 95 95 97
With disability 5 5 3
Sexual Orientation CEO Board Member Chair
Heterosexual or Straight 90 94 94
Gay Lesbian Bisexual 9 6 6
Other 1 01 01
Does your board represent the demographics of the population served by your organization CEO Board Member Chair
Yes 38 NA 29
No 62 NA 71
Board composition 201985
Board members of color84 14+86+w22+78+w1994 2020
14 22Diversity on nonprofit boards still falls short of reflecting the overall diversity of the United States
16HEALTH OF THE US NONPROFIT SECTOR
Go
ve
rna
nc
e amp
Trus
t
RACIAL EQUITY
One best practice to support equity and inclusion across board leadership staff and the communities nonprofits serve is to formally incorporate equity into organizationsrsquo operations Nonrepresentative surveys of nonprofits indicate that 63-74 of organizations engage in diversity equity and inclusion activities8788
Board activities supporting diversity equity and inclusion CEO responses89
enspNot at all or only a small extent enspTo some or a great extent
33+6733
57 37+6338
63 56+445644
Different experiences for people of color
When comparing survey responses in 2016 and 2019 the Race to Lead Revisited report shows awareness of racial inequities is higher but discrepancies between the experience of people of color and white nonprofit employees has grown or remained the same90
enspEmployees of Color enspWhite Employees
The Board has committed to understanding the diversity of the community the organization serves
The Board has discussed community needs in a way that acknowledges any disparities between different demographic groups among the people it serves
The Board has committed to raising its awareness and understanding of the relevance of racial inequity to the organizationrsquos mission
Commitment to DEI Policies
Average Responses on a Scale of 1-1091
Leadership consistently demonstrates a commitment to DEI
My organization takes a public stand on the root causes of inequity
White Run Organizations Board amp Leaders gt75 White47
64
53
62
POC-Led Organizations Board amp Leaders gt50 POC80
81
82
82
All Other Compositions of Board amp Leaders 68
76
69
75
17HEALTH OF THE US NONPROFIT SECTOR
Go
ve
rna
nc
e amp
Trus
t
The Impact of COVID-19 on Governance amp Trust
Surveys of corporate leaders on governance found the most pressing concerns include92
Nonprofit leaders appear to be aligned with their corporate counterparts around governance opportunities which include97
Nonprofit leaders expressed particular concern about
COVID-19 COMPARISON TO BROADER TRUST BAROMETER
Because of the timing of data collection the nonprofit and philanthropy surveys are snapshots of the state of trust in the sector before the full impact of the pandemic was felt by most Americans
Edelman Intelligence fielded a Spring global survey comparing global levels of trust in mid-April which showed record high levels of trust across all institutions including nonprofits
It remains unclear whether these trust gains are a sustainable rise or a ldquotrust bubblerdquo The pandemic has put a spotlight on social inequities and there is overwhelming sentiment that something must be done to distribute our countryrsquos wealth and prosperity more fairly History tells us that large trust increases are quickly lost unless institutions show the public they deserve the faith thatrsquos been placed in them
Shaping realistic post-crisis strategies
Fulfilling programmatic activities as planned93
The COVID-19 crisis may help them find more efficient
ways to work online
Getting up to speed on crisis risk dimensions
Maintaining a financially stable organization94
They may find new or expanded ways to fundraise
Balancing governance and management
Reaching the people or animals the
organization serves95
They may find more efficient ways to pursue their mission
Overseeing the financial health of the organization
Accelerating digital transformation
60
923
77
46
894
57
45
45
56
45
32
19 of nonprofits surveyed that serve immigrant communities report technology as a particular barrier to reaching constituents96
18HEALTH OF THE US NONPROFIT SECTOR
Go
ve
rna
nc
e amp
Trus
t
DATA RECOMMENDATIONS FOR GOVERNANCE amp TRUST
1 Because public trust is a community-level indicator of the health of nonprofit
governance the sector needs a sustained annual assessment of the US publicrsquos views on the trustworthiness of nonprofits
2 Staff satisfaction equity initiatives and other measures of nonprofit health are
determined by organization leadership and board governance Therefore the sector would benefit from a nationally representative survey of nonprofit organizations and their board members
3 More detailed information about the integration of community voice and
participatory decision-making also is necessary to better understand the current health of not only nonprofit governance but also human capital and advocacy
4 American Indian and Alaska Native populations are frequently excluded from
regularly reported national data sets as well as the sector-specific data included in this report More work is needed to measure and understand the unique experience of American Indians and Alaska Natives in the US nonprofit sector
19HEALTH OF THE US NONPROFIT SECTOR
Go
ve
rna
nc
e amp
Trus
t
NONPROFIT PARTICIPATION IN PUBLIC POLICY OR ADVOCACY
In 2019 41 of nonprofit chief executives report that public policyadvocacy is a part of their organizationrsquos strategy to some or a great extent98
59 of CEOs report that public policyadvocacy is a part of their organizationrsquos strategy to a small extent or not at all99
UNDERSTANDING OF POLICY IMPACT ON MISSION AND COMMUNITIES
In 2017 Federal government policies and positions made100
enspHarder enspEasier enspSame
This data indicates a disconnect between the impact of public policy on the environment in which nonprofits operate and a recognition of an impact on nonprofitsrsquo ability to deliver on mission
Because mission is one of the most frequently cited reasons why nonprofits choose to engage in advocacy this gap may indicate that many nonprofits still do not see a direct benefit from engaging in advocacy
Research shows ldquononprofits might choose to avoid advocacy because they do not view it as a key part of their missionrdquo101
Sector leaders may need to engage in more policy education or place an intensive focus on community participation as a means to closing this gap
Public Policy amp AdvocacyPublic policy defines what it means to be and operate as a nonprofit and is a key determinant of an organizationrsquos ability to deliver its mission Public policy and advocacy also are critical to addressing the systemic inequities and structural racism that impact the ecosystems in which all nonprofits operate Therefore the state of the public policy and advocacy
ldquoenvironmentrdquo in which we operate gives us critical insight into our overall health
Data from 2019 indicates that nonprofit public policy environment and advocacy are not as healthy or active as the sector needs to be in order to strengthen nonprofit capacity and impact For the majority of nonprofits public policy and advocacy play a small or non-existent role in their organizationrsquos overall strategy Nonprofit leaders may not connect how policy changes impact their organizationrsquos mission Policymakers also are falling short in terms of oversight of nonprofits jeopardizing the publicrsquos trust in the sector
As the challenges posed by COVID-19 threatened to overwhelm many nonprofit leaders a large cross-section of the sector successfully advocated for policies to help their organizations and their constituents weather the crisis Communities also are observing in 2020 a surge in civic activism by individuals which may provide new advocacy opportunities Given the magnitude of challenges facing nonprofits the sector may need to significantly increase our collective participation in policy and advocacy in order to rebuild resilient equitable communities
4
51+5+445244
5
67+2+3167
31
2 41+4+554155
58+3+395839
3
Funding environment
Challenges facing clients Ability to deliver on mission
Policy environment
20HEALTH OF THE US NONPROFIT SECTOR
Pu
blic
Po
licy
amp A
dv
oc
ac
y
ADVOCACY
Advocacy is the act of ensuring community voices are included in decisions that impact them This type of civic participation strengthens the quality of corporate and government decisions so it behooves the sector to maximize the number of volunteers donors and staff engaged in advocacy
ADVOCACY OVERVIEW
Return on investment in nonprofit advocacy102
On average 5 of people subscribed to communications alerts take three or more actions a year103
An average of 031 of nonprofit followers on Facebook will engage in advocacy per post104
ADVOCACY DRIVERS
The extent to which nonprofits engage in advocacy is directly dependent on other determinants of health outlined in this report financial resources human capital and governance
A wide range of research demonstrates nonprofit participation in advocacy is dependent upon available resources which is one reason why the level of a nonprofitrsquos advocacy is dependent upon organization budget size105
ldquoA more direct role for members and citizens in the governance and operations of nonprofits [ie community participation] would produce more involvement by these organizations and their volunteers in advocacyrdquo106
BOARD POLICY amp ADVOCACY ENGAGEMENT
Organizations with higher revenues tend to have boards that are more engaged with policymakers and advocacy107
VOTING PARTICIPATION
Voting is the most direct form of advocacy Ȅ Voters contacted by nonprofits turn out at rates 11
percentage points higher than comparable voters112
Ȅ Among nonprofits participating in voter engagement 79 cite advancing the mission of their organization as a motivating factor and 73 report empowering their clients as a motivating factor113
23 timesmore likely to be non-white (+13-16 percentage point increase in voter turnout)
19 timesmore likely to have less than $30K in household income (+14 percentage point increase in voter turnout)
26 timesmore likely to be under 25 years old (+15-20 percentage point increase in voter turnout)
New voters engaged by nonprofits are114
Board understands to some or a great extent how public policy impacts the
organizationrsquos mission108
Board monitors to some or a great extent the impact of public policy on the
organizationrsquos mission or resources109
Board works to some or a great extent with organization staff on advocacy to
educate policymakers110
Board works to some or a great extent with organization staff to educate
policymakers on behalf of the sector111
44
31
28
17
$115 to $1 $266 Breturn on investment total benefits for
communities and taxpayers
21HEALTH OF THE US NONPROFIT SECTOR
Pu
blic
Po
licy
amp A
dv
oc
ac
y
NONPROFIT OVERSIGHT
Because public trust is the currency of the nonprofit sector it is critically important that there is sufficient oversight of the sector to guard against waste fraud or other wrong-doing that could undermine the publicrsquos trust Unfortunately government entities responsible for nonprofit oversight have seen their resources steadily decline for many years undermining their ability to oversee a rapidly growing sector
IRS appropriations have fallen by 20 in inflation-adjusted dollars since 2010 resulting in the elimination of 22 of its staff115
Increasing IRS funding could result in $61ndash$103 billion in revenues115
The amount of funding and staff allocated to oversight has declined by about 30 since 2010115
22HEALTH OF THE US NONPROFIT SECTOR
Pu
blic
Po
licy
amp A
dv
oc
ac
y
The Impact of COVID-19 on Public Policy amp Advocacy
As a direct result of sector advocacy nonprofits were included for the first time in emergency SBA programs with a particular focus on Paycheck Protection Program (PPP)
Nonprofits received 37 of all loans made under the PPP program116
Nonprofits received a larger share of high-dollar loans than all other entity types117 Nonprofits fared better than other types of institutions when securing loans over $350000
Approximately 40 of eligible nonprofits received a PPP loan but the success rate varied across states119
63 of eligible nonprofit jobs were protected by PPP loans120
Disparities exist across population and organization size121
Ȅ While larger nonprofits were successful in PPP smaller nonprofits may not have applied for loans or have not been successful with applications so far
Ȅ 34 of nonprofits serving immigrant communities report immigrant families avoiding the PPP program due to fear of the public charge rule and immigration enforcement
Sector advocacy also resulted in Congress passing a temporary universal charitable deduction for non-itemizers to encourage more giving during the COVID crisis
The incentive was capped at gifts of $300 or less weakening the effectiveness of the policy to drive more resources to nonprofits Research indicates that the effects of the policy will be de minimus as designed Other action will be needed to stimulate more giving Even before the passage of the 2017 tax law raising the standard deduction non-itemizing households donated an average donation greater than $1000 The marginal tax subsidy for these households remains zero under this new tax policy122
2019 research shows incentivizing more giving through tax policy requires Congress to significantly increase or eliminate the cap on the incentive123
Without more government resources and changes to state voting processes COVID-19 is estimated to have a negative impact on voter participation particularly among marginalized and at-risk populations124
16 states and DC have made a change in their election processes due to the pandemic125
Nonprofits may be needed to help voters navigate last-minute changes to voting procedures in their states and communities
63+3763
Eligible nonprofit jobs projected by PPP loans
181680 nonprofit PPP loans
41 million nonprofit jobs118
protected
23HEALTH OF THE US NONPROFIT SECTOR
Pu
blic
Po
licy
amp A
dv
oc
ac
y
DATA RECOMMENDATIONS FOR PUBLIC POLICY amp ADVOCACY
1 To better understand the health of nonprofit advocacy and influence on the
policy process the sector needs a nationally representative survey of nonprofits to collect an annual measure of advocacy participation nonpartisan civic engagement and perhaps determine whether barriers identified 20 years ago persist
2 Infrastructure practitioners can partner with researchers to identify evidence-
based practices to increase advocacy participation rates or clarify data gaps that need to be addressed on this issue
3 IRS funding is not a sufficient proxy for the health of nonprofit oversight The
sector would benefit from practitioners and researchers working together to identify a data development agenda to assess sector oversight on a regular basis
4 In future analysis of the PPP program a better measure would be to compare
how many nonprofits applied for the program versus received a loan This analysis would require the SBA to privately release additional data to researchers
5 It would be incredibly helpful to determine through COVID impact research the extent
to which changes in revenue correlate with advocacy and policy engagement It also would be helpful to understand the role coalitions may play during this time as a means of sharing advocacy costs across nonprofits
24HEALTH OF THE US NONPROFIT SECTOR
Pu
blic
Po
licy
amp A
dv
oc
ac
y
This first annual report reflects our best understanding of the health and well-being of the US nonprofit sector at this
time Although limitations in available data and no mutually agreed upon ldquohealthrdquo benchmarks highlight the need for improved health metrics in the future they cannot be the cause for inaction In fact a significant amount of data is available to begin informing decision-making across the sector Therefore the second half of the report is divided into two sections
Translating Metrics into Action The first section includes initial recommendations for how the sector may begin translating findings in this report into immediate action
Long-term Progress on Nonprofit Research The second section outlines next steps to improve the collection and dissemination of data on nonprofit health in the future
Translating Metrics to Action
These recommendations are based upon what Independent Sector sees in the available data and believes they are telling us about how we can improve our health ldquotrendlinesrdquo through research practice and policy
We look forward to these recommendations forming the basis of sector-wide conversations in the months to come
FINANCIAL RESOURCES
Increase Flexible Funding Across COVID-19 research it is clear that nonprofits of all sizes are struggling financially reporting overall revenue declines with varying levels of losses across earned revenue charitable giving and other forms of nonprofit financing To the greatest extent possible it is critical for all funders (donors foundations and government) to significantly increase flexible funding to nonprofits to help them not only regain their financial footing but also adapt operations to protect the health of their employees volunteers and constituents
Advocate for Policies to Increase Giving amp Grants Prior to COVID data showed over a 10-year decline in the number of households donating to nonprofits particularly among households that donate small and mid-sized gifts This decline may impact nonprofit mission advocacy and even the type of organizations created in the future The pandemic made giving more volatile with many nonprofits experiencing a rollercoaster of giving drops and climbs over the first half of 2020 Although giving increases are encouraging it remains unclear whether this positive trend
Action amp Research Next Steps
25HEALTH OF THE US NONPROFIT SECTOR
Ac
tion
amp R
es
ea
rch
Ne
xt S
tep
s
will continue for the duration of the COVID and economic crises Historically giving correlates with GDP which indicates that charitable giving may face strong headwinds throughout into 2021 Many nonprofits still face dire overall financial challenges particularly in earned income which means the sector requires more assistance in order to restore financial health across all types of organizations Specifically nonprofits need policymakers to enact meaningful tax incentives that make it affordable for many more households to give regardless of income This private support needs to be complemented by robust government funding of programs and initiatives that allow nonprofits to continue to effectively serve their communities
Clarify Form 990 Collection of Financial Data It always has been difficult to fully understand some measures of nonprofit finances such as government funding due to how the revenue is reported on Form 990s Government grants contracts and reimbursements often are combined with other forms of revenue on Form 990s making it difficult for researchers to easily identify the full role government revenue plays for nonprofits Clarifying existing reporting practices for Form 990s may improve the sectorrsquos understanding of some measures of financial health Nonprofits and researchers can advocate for the IRS to modify Form 990 to collect clearer more accurate data on earned income and government grants and contracts
Create Common Core Financial Metrics for Research This first report pieces together financial data across a wide range of research Collaboration between researchers and practitioners to identify the best annual measures to track the overall financial well-being of nonprofit institutions could create efficiencies and even new learnings if collected alongside other organization characteristics and activities
Establish Methodology to Capture Impact of Financial Changes In order to improve nonprofit financial health the sector needs to understand how financial changes impact human resources governance service provision and advocacy Often research on nonprofit finances is limited to descriptive financial measures that are not connected to data on operations Without more regular research exploring correlations between finance and mission it is difficult to accurately communicate the ldquoso whatrdquo element of nonprofit finance research findings It would be incredibly helpful for future research of nonprofit finances to capture how different types of revenue flow through the sector and the extent revenue shifts the impact of other aspects of nonprofit operations and activities
Develop a Shared Understanding of Equitable Financing Aggregated financial resource data provide a general description of the state of nonprofit revenue However it remains difficult to apply an equity analysis to these metrics without a shared understanding across nonprofits and researchers of what equitable financial resourcing of the sector looks like and how it may be measured A collaborative process to develop shared benchmarks and measures for equitable financing of nonprofits will significantly help nonprofits and other stakeholders better understand how to improve equity in this area
Inclusion of Diverse Communities by Mainstream Providers Although data indicates that nonprofits provided services to diverse communities during the pandemic research indicates that mainstream providers like food banks clinics and schools still could improve their outreach and provision of culturally competent services Specifically translation of COVID-19 information into multiple languages avoiding collection of Social Security numbers and partnering with organizations that already have trust in specific communities may improve the reluctance of some populations to take advantage of nonprofit services
26HEALTH OF THE US NONPROFIT SECTOR
Ac
tion
amp R
es
ea
rch
Ne
xt S
tep
s
HUMAN CAPITAL
Advocate for Government Investment in Nonprofit Jobs Data shows the sector has experienced significant job loss during the pandemic For many organizations in the sector ndash especially among direct service providers ndash demand for service is increasing against the backdrop of depleted staffing Although policymakers may consider more stimulus programs and investments in infrastructure to spur job retention and growth nonprofit employers often are not considered during the development of these policies Nonprofits have an opportunity to advocate for a broad spectrum of government investments to help restore the lost jobs beginning with structuring any legislation designed to assist employers to support nonprofit organizations
Share Innovations Across Sectors that Support Staff During Pandemic Data on nonprofit layoffs furloughs and teleworking combined with broader trends like closed schools and daycares indicate nonprofit staff may be stretched thin and under a great deal of stress during the pandemic Many of these problems span sectors so there is an opportunity for nonprofits to engage in structured peer-learning with for-profit and government employers to more quickly identify innovative approaches to support their staff such as a pilot program considered by businesses to re-allocate unused professional development or travel funding into grants for employees to secure in-home child or dependent care support
Create Consensus on Sector Benchmarks for Workforce Diversity Although there is data on the diversity of the sector it is difficult to gauge exactly how to improve the demographics of nonprofit staff without mutually agreed upon benchmarks Currently there is not a shared understanding of whether the nonprofit workforce should equal diversity of other sectors correlate with the
demographics of the US population reflect the communities nonprofits serve andor vary by subsector or geography Collectively the sector could benefit from engaging in a collaborative process to establish goals or benchmarks for nonprofit employee diversity
Promote Evidence-Based Practices to Close Diversity amp Pay Gaps Data indicates that although the nonprofit workforce is becoming more diverse nonprofit diversity lags behind businesses and pay gaps within the sector exist Some research indicates that increasing board and executive diversity may close some pay gaps and lead to higher job satisfaction rates across the workforce Nonprofit leaders would benefit from working with researchers to understand existing data to promote concrete sector-wide practices that improve equity-based metrics in their own organizations as well as the broader nonprofit workforce
Advocate for Timely Release of Workforce Data The pandemic highlights the critical importance of timely data on the current status of the nonprofit workforce The Bureau of Labor Statistics (BLS) has committed to release nonprofit employment and wage data on a 5-year cycle (with the next release scheduled for 2024) BLS has made clear it would consider more regular releases of these data if there were enough demand Nonprofit advocacy calling on BLS to release more timely nonprofit workforce data may be the most efficient low-cost way to improve our collective understanding of nonprofit employment
Advocate for Government Funding to Improve Volunteer Capacity Data on the impact of COVID-19 shows that the pandemic drastically reduced both the staff and volunteer capacity of nonprofits at a time when many organizations struggled to continue providing essential services to their communities Findings also indicate that
27HEALTH OF THE US NONPROFIT SECTOR
Ac
tion
amp R
es
ea
rch
Ne
xt S
tep
s
nonprofits are trying to determine how to pivot more traditional face-to-face volunteer opportunities to a virtual format Public policies to improve training and technical assistance to nonprofits for volunteer management and the establishment of a national digital volunteerism platform could better support volunteerism in times of crisis with particular emphasis on building capacity for more virtual volunteer opportunities
Advocate to Improve National Research on Volunteerism The US Corporation for National and Community Service (CNCS) currently is responsible for collecting national
data on volunteerism rates in the US The scope and methodology of this research recently have changed making it more difficult to gain a clear picture of the health of volunteerism over time Nonprofits have an opportunity to advocate for improvements to CNCS volunteerism research to ensure it provides policymakers and the sector with actionable data An example of an improvement is the regular release of disaggregated data to identify potential inequities in volunteer engagement across organization size volunteer demographics geography and communities served
GOVERNANCE amp TRUST
Protect Public Trust of Nonprofits Prior to COVID-19 data showed that the publicrsquos trust in nonprofits was strong but there was skepticism about whether the sector was heading in the right direction Seeing nonprofits at work during the pandemic appears to temporarily have increased the publicrsquos trust in the sector Historic data shows that large increases in trust are quickly lost unless institutions show the public that they deserve the newfound faith placed in them The sector will need to collectively identify the actions necessary to sustain record high levels of public trust rather than allowing the ldquotrust bubblerdquo to burst
Leverage Collective Urgency to Advance Equity Although the majority of nonprofits surveyed report their organization has a diversity equity and inclusion initiative the sector may need to improve efforts to advance more equitable systems and be transparent about them in order to preserve public trust The pandemic placed a spotlight on social inequities and structural racism generating overwhelming buy-in across the sector that now is the time to take action The sector has
an opportunity to seize upon this collective sense of urgency by promoting easy-to-deploy toolkits and practices to help nonprofits jump start their equity work It also is important to complement these efforts with building awareness resources and capacity to address long-term structural change
Improve Quality amp Depth of Equity Metrics Although surveys ask nonprofits if they have equity initiatives they are not surveying a representative sample of nonprofits Therefore it is difficult to confidently extrapolate the findings to the entire sector In addition responses to this question could include a wide range of activities so it is difficult to get a sense of exactly what areas nonprofits are working to change in order to monitor whether we are making progress Therefore it would be helpful for future research to include questions about specific activities to better understand how equity is included in nonprofit work Specifically it would be helpful to understand the extent to which nonprofits integrate community voice into their governance and decision-making processes
28HEALTH OF THE US NONPROFIT SECTOR
Ac
tion
amp R
es
ea
rch
Ne
xt S
tep
s
Identify Targets for Board Diversity Given the data showing board composition impact on nonprofit governance and staffing it would be helpful for the sector to engage in a dialogue about recommended targets or benchmarks for board demographics and under what circumstances they should be applied
Evaluate More Complete Measure of ldquoHealthyrdquo Governance Researchers can help nonprofits consider what additional data points are needed to understand about nonprofit governancedecision-making to ensure it is supporting the health of the whole
Improve Digital Access Nonprofits reported concerns about their ability to continue providing services and transitioning to virtual service provision proved difficult if the communities they served lacked access to internet or technology Expanding broadband access will reduce inequity and enable more households to access nonprofit and government services as the pandemic continues
PUBLIC POLICY amp ADVOCACY
Improve Research on Nonprofit Advocacy National comprehensive research on nonprofit advocacy participation has not been conducted in over 20 years so it is difficult to gauge whether many of the efforts of the last two decades to overcome barriers to advocacy have succeeded or if new barriers may have emerged In order to understand the extent to which nonprofits are engaging in advocacy as well as drivers behind their engagement the sector needs much more regular research on nonprofit advocacy In particular the sector would benefit from an annual measure of nonprofit advocacy engagement from a representative sample of organizations
Promote Policy Literacy amp Relevance Although data shows nonprofits understand public policy can impact their constituents funding and policy environment they do not believe these environmental changes impact their ability to deliver on mission A disconnect between changing policy environment and mission may prevent more nonprofits from engaging in advocacy Nonprofits may need more education to understand exactly how public policy impacts their work Specifically the pandemic may provide an extreme case study to draw a clear connection for many nonprofits between public policy and their operations
Identify Organization Structures to Increase Advocacy ldquoIn order for non-profits to be a positive force for democracy they need to align their mission governance resources and relationship to the community in ways that support more advocacy and community engagementrdquo126 In other words the sector would benefit from working with researchers to identify evidence-based practices such as representative governance and community participation These practices may help nonprofit leaders and staff connect policy to nonprofit mission in order to increase the relevance and prioritization of advocacy by nonprofits
Understand Intersection between Equity amp Nonprofit Advocacy Most data on nonprofit equity initiatives focus on operations It is unclear the extent to which nonprofits integrate equity into the development of their policy agendas and advocacy Nationally representative research on this topic would improve sector-wide understanding of the scope of nonprofit activity to promote equity and potentially identify best practices to share with organizations seeking guidance
29HEALTH OF THE US NONPROFIT SECTOR
Ac
tion
amp R
es
ea
rch
Ne
xt S
tep
s
Establish Advocacy as Norm Over half of CEOs report public policy and advocacy playing little or no role in organization strategy Public policy literally defines all nonprofit organizations and it is a characteristic of highly effective organizations Therefore it is appropriate for significantly more organizations to prioritize policy and advocacy as a part of their work It could be helpful for educators and nonprofit leaders to determine how to establish advocacy as a core competency of nonprofit management and governance rather than an activity pursued only if there are excess resources
Increase Funding for Nonprofit Regulators The Internal Revenue Service (IRS) is one of two key entities responsible for enforcing laws to protect the publicrsquos trust in nonprofits Unfortunately data shows funding in the IRS has been declining for years hindering the agencyrsquos capacity to provide adequate oversight of the sector Although the sector can accomplish a great deal through shared standards and self-regulation nonprofits also need state and federal regulators to have enough resources to enforce laws that guard against fraud and abuse because scandal often negatively impacts public trust in the entire sector
Improve Research on the State of Nonprofit Oversight Currently it is difficult to easily assess the state of nonprofit oversight across self-regulatory state and federal entities Nonprofits struggle to get a complete picture of how well the full nonprofit regulatory framework balances guarding against abuse without impeding nonprofit missions More comprehensive research measures on the status of the nonprofit regulatory framework would dramatically improve the sectorrsquos ability to diagnose and improve the health of the system A comprehensive overview of knowledge on nonprofit regulation is needed
to document existing research and data gaps Next the sector would benefit from developing streamlined annual measures or indices to track the regulatory environment that shapes nonprofit work
Increase Voter Participation Voting is the most direct form of advocacy and the primary way to ensure elected officials prioritize a particular cause or population Nonprofits can increase their capacity to influence policymakers and advance their mission by encouraging their stakeholders to vote Data shows that nonprofits are among the most successful institutions at encouraging voter participation particularly among non-white young and low-income voters If more nonprofits engaged in nonpartisan voter engagement of employees volunteers and constituents candidates would better understand the need to collaborate with nonprofits once elected Voter engagement by nonprofits is particularly important this year as many would-be voters try to navigate changes to election procedures due to COVID-19 such as early voting absentee voting or changing polling places
Advocate for Nonprofits in Future Pandemic Bills Despite nonprofits providing essential community services and employing 10 of the private workforce policymakers tend to overlook the needs of nonprofits when designing COVID-19 relief legislation Concerted advocacy by thousands of nonprofits forced policymakers to modify policy proposals to support nonprofit organizations but they need constant reminders from nonprofits to keep our needs top-of-mind as they develop new legislation Nonprofits may want to continue their successful collective advocacy to ensure the sectorrsquos needs continue to be addressed in future public health and economic relief or long-term recovery legislation
30HEALTH OF THE US NONPROFIT SECTOR
Ac
tion
amp R
es
ea
rch
Ne
xt S
tep
s
Long-term Progress on Nonprofit Research
This first annual report reflects our best understanding of the health and well-being of the US nonprofit sector today
Independent Sector looks forward to improving and evolving this report over time by partnering with funders practitioners researchers and government officials to
Improve the quality and timeliness of data that informs our understanding of the sectorrsquos health
Engage members of Independent Sector and other stakeholders to make sense of what the data is telling us and jointly identify the highest priority opportunities for the sector to take action through policy and practice
IMPROVING DATA QUALITY amp TIMELINESS
Independent Sector aims to work with all institutions seeking to produce regular research on the state of nonprofits to develop the collective funding and infrastructure needed to improve the frequency and quality of sector health data in the future Specifically this report highlights nonprofit survey data that would be even more valuable if it were from a random sample of respondents that looked like the broader nonprofit sector
It is important for researchers particularly practitioner organizations to request funders cover the real costs associated with an annual survey of a nationally representative sample of nonprofits At the same time Independent Sector will work with the research community and prospective funders to build new research infrastructure that may lower the aggregate cost of fielding these types of surveys One particularly exciting example of such research infrastructure is currently underway in the build out of an annual panel survey from a nationally representative sample of nonprofits
Independent Sector also believes it is essential that academic and practitioner researchers establish shared principles when collecting national sector-wide nonprofit data Among those principles should be a shared commitment whenever possible that nonprofit research include the collection and analysis of disaggregated data to identify potential inequities across types of institutions donors volunteers or communities served
Although our understanding of the state of the nonprofit sector will be dramatically improved with regular representative data 2020 demonstrates the critical value of nonprofit surveys using convenience samples The ever-changing crisis of a global pandemic made it difficult to know at any point in time how the nonprofit sector was coping Policymakers advocates funders and donors were seeking quick real-time data to make critical decisions on how to best support the sector Thankfully many practitioner organizations were able to field a series of convenience sample surveys to shed light on nonprofit needs It is possible to look across these surveys to get a general sense of the direction of key indicators like organization revenue employment volunteerism service provision and demand for services This type of flexible timely and relatively inexpensive research will continue to serve a critical role in our ongoing understanding of nonprofits particularly in a rapidly changing environment
ldquoIf we want to have a deep understanding of our sectorrsquos health that can lead to policy and other actions that improve our health we must have a shared understanding of the value of data a uniform and ongoing commitment to gathering those data and a robust and sustained response from philanthropy to support the sectorrsquos efforts to put data-driven insights into actionrdquo
ndash DAN CARDINALI PRESIDENT AND CEO INDEPENDENT SECTOR
31HEALTH OF THE US NONPROFIT SECTOR
Ac
tion
amp R
es
ea
rch
Ne
xt S
tep
s
The federal government is an essential data source for nonprofits and our sector should regularly and energetically advocate for improved collection reporting of nonprofit data Some of the most compelling data included in this report is from government sources In fact in the future Independent Sector anticipates releasing quarterly reports of select nonprofit data from existing government sources in addition to a comprehensive annual
report Calling on the federal government to more frequently release nonprofit data allows researchers to produce more timely useful reports Requesting small changes to how government collects nonprofit data also may notably improve the value of the data for research purposes such as revising Form 990s and tagging data from nonprofit organizations within larger government databases
ENGAGING IS MEMBERS amp OTHER STAKEHOLDERS IN LEARNING
Data can raise as many questions as it answers which is why it is important to engage peers The academic community integrates peer feedback and review into multiple stages of research development to improve the ability of research to advance learning across a community In the same spirit Independent Sector seeks to create regular engagement opportunities with our members and other nonprofits to process what we can learn from current data on nonprofit health how we can improve future reports and how we might best take action on what we are learning In the near term Independent Sector will conduct a series of member and partner convenings to discuss this initial reportrsquos findings how we might set realistic benchmarks against which future health data might be
measured and other improvements In the longer term and as we anticipate the release of our 2021 and subsequent health reports we will establish more structured mechanisms by which we can gain the sectorrsquos insights on accumulated data and reflect those insights and recommendations into future reports
In sum Independent Sector is committing not only to producing a data-infused report of increasing quality but to using that report as an agile and responsive mechanism to engage the sector as we work together to improve our shared health so we can accelerate the advancement of organizational missions
We look forward to doing this work with you
32HEALTH OF THE US NONPROFIT SECTOR
Ac
tion
amp R
es
ea
rch
Ne
xt S
tep
s
Development of the Report
Independent Sector tested the need and developed the content framework of this document through interviews and feedback sessions with more than 150 sector leaders and stakeholders as well as an extensive review of government and other data sources that might provide relevant information about the sectorrsquos health The report includes new analyses as well as the most up-do-date data available from existing research presented side-by-side to provide as comprehensive a picture as possible of the state of the nonprofit sector
About the Data Cited
This report includes new analyses of 2020 government data from the US Bureau of Economic Analysis on nonprofit institutions that serve households All other data is pulled from a wide range of existing research on nonprofit institutions
Although numerous variables impact nonprofitsrsquo capacity to advance their missions this report focuses on annual national measures of the inputs assets and activities of nonprofit institutions Data intended to serve as a baseline for nonprofit health in this initial report is pulled from a wide range of research spanning academic studies to annual reports produced by sector infrastructure organizations Where possible each section includes disaggregated data across organization size and budget demographic data of staff leadership and board members and the communities served by nonprofits Disaggregated data aids our understanding of which groups communities or institutions face the greatest challenges associated with a given health metric
These groups should be targeted when advancing solutions to increase the sectorrsquos health Unfortunately disaggregated data is not available for every indicator due to research limitations as well as a lack of consensus on the most accurate equity measures for nonprofit institutions
Not all of the data used for this report is available annually at this time We made the decision to use older data to illustrate the type of data the sector will need to invest in collecting to better understand health in the future Similarly some of the data cited both in the baseline health measures and most of the COVID-19 measures are from convenience sample surveys (non-probability data) that collect data from a population close at hand This type of research methodology may result in findings that are skewed because it is not clear whether the findings represent the full sector However looking at findings from a series of convenience sample surveys can still provide value if alignment across studies indicates the direction in which data may be trending When possible the report cites multiple sources of non-probability data to illustrate such potential trends
It is important to note that sector impact measures are not included here This is not an oversight Clear data-driven metrics on the collective impact of our sector have been a goal of researchers and practitioners alike for decades That work ndash and even debates about the best way to approach impact assessment ndash continues to evolve Therefore this report focuses on the ldquoinputsrdquo that create a healthy sector capable of achieving long-term impact It remains a challenge for the sector to come to some shared view of impact measures but it is not included in this report at this time
33HEALTH OF THE US NONPROFIT SECTOR
De
ve
lop
me
nt o
f the
Re
po
rt
In sum there are large holes in our knowledge of the sectorrsquos health because there are disparities in the type frequency and quality of data we have to measure our health A critical goal of this report is to call out those data gaps and begin a conversation within the sector about how best to close them Closing these knowledge gaps is a long-standing strategic aim of Independent Sector and this report will help us further focus these efforts
Acknowledgments
We have received tremendous intellectual and moral support for this project from two leading academics in our sector both having served as Visiting Scholars at Independent Sector First we thank Alan Abramson a professor of Government and Politics and Director of the Center for Nonprofit Management Philanthropy and Policy at George Mason University for his contribution to the research and thought partnership that led to the publication of this report Second we thank Lewis Faulk associate professor of Public Administration and Policy in the School of Public Affairs at American University for his analysis of new data and guidance in the development of the first draft We also acknowledge the team at Project Evident who provided crucial expertise and support
during the development testing and subsequent iterations of this report as well as more than 160 nonprofit leaders researchers government staff and others who provided input
Most importantly we are incredibly grateful to all of the institutions that produce research cited in this report We hope this publication highlights the critical importance of their work in telling the story of the sectorrsquos health and well-being Independent Sector looks forward to using this report as a vehicle for strengthening the bonds and collaboration among the research practitioner and funder communities ndash all in service to the sector and the populations we serve
Independent Sector also acknowledges the following staff members for their contributions
Dan Cardinali President and CEO Jeffrey Moore Chief Strategy Officer Kristina Gawrgy Campbell Vice President
of Communications and Marketing Allison Grayson Director Policy
Development and Analysis (Lead Author) Marie LeBlanc Director of Design Nancy Barry Executive Assistant
Design by Shannon Ryan Made with Relish
34HEALTH OF THE US NONPROFIT SECTOR
De
ve
lop
me
nt o
f the
Re
po
rt
SourcesFinancial Resources
TOTAL RESOURCES AND EARNED REVENUES
Data for these sections are drawn from the US Bureau of Economic Analysis (BEA) Figures were calculated from tables released August 27 2020 which can be accessed at httpsappsbeagoviTableiTablecfmreqid=19ampstep=2reqid=19ampstep=2ampisuri=1amp1921=survey
Gross value added by nonprofits change from 2018-2019 ndash Table 136 ldquoReal Gross Value Added by Sector Chained Dollarsrdquo
Gross value added by sector as a share of GDP ndash Table 135 ldquoGross Value Added by Sectorrdquo
Gross output of nonprofits earned revenues ndash Table 246U ldquoReal Personal Consumption Expenditures by Type of Product Chained Dollarsrdquo
For data on the nonprofit sector BEA generally reports on ldquoNonprofit Institutions Serving Householdsrdquo (NPISH) which it describes as including tax-exempt health recreation arts education social services religious grant-making social advocacy civic and social legal services and professional labor and political and similar organizations NPISH does not include organizations like chambers of commerce and other business associations which mainly serve businesses NPISH also does not include tax-exempt entities like cooperatives credit unions and mutual financial institutions which sell goods and services in the same way as for-profit businesses BEA includes these business-serving and business-like organizations in the business sector even if they are tax-exempt entities According to BEA ldquoBecause NPISHs produce services that are not generally sold at market prices the value of these services is measured as the costs incurred in producing themrdquo See the following
US Bureau of Economic Analysis NIPA Handbook Concepts and Methods of the National Income and Product Accounts available at httpswwwbeagovresourcesmethodologiesnipa-handbook
Charles Ian Mead Clinton P McCully and Marshall B Reinsdorf ldquoIncome and Outlays of Households and of Nonprofit Institutions Serving Householdsrdquo Survey of Current Business (April 2003) pp 13-14 available at httpsappsbeagovscbpdf200304April0403householdpdf
Human Capital
PAID WORKERS
Figures in this section are calculated from Current Population Survey (CPS) data publicly available through IPUMS-CPS which is accessible at httpscpsipumsorgcps
CPS is hosted by the US Census Bureau and the US Bureau of Labor Statistics and collects information monthly from a probability selected sample of about 60000 US households Households are in the survey for four consecutive months out for eight months and then return for another four months before leaving the sample permanently One person generally responds for all eligible members of the household (see httpswwwcensusgovprograms-surveyscpstechnical-documentationmethodologyhtml)
35HEALTH OF THE US NONPROFIT SECTOR
So
urc
es
In recent years an alternative source of information on nonprofit employment has been available through a collaboration of the US Bureau of Labor Statistics and the Center for Civil Society Studies at Johns Hopkins University and their analysis of data from the Quarterly Census of Employment and Wages (QCEW) The most recent report from this collaboration indicates that in 2017 nonprofit establishments in the US employed 125million paid workers which accounts for 10 of the total private workforce (see httpccssjhuedu2020-nonprofit-employment-report)
In contrast to the CPS which surveys a sample of 60000 households the QCEW draws on quarterly reports submitted by almost 10 million US establishments With the differences in the ways that the CPS and QCEW collect data it is perhaps not surprising that they report somewhat different estimates of nonprofit employment In particular it appears that the CPS figures for nonprofit employment are lower perhaps by a couple of percentage points than the QCEW figures For example in 2017 the April CPS had nonprofit employment as 82 of private workers while the BLSQCEW put nonprofit employment at 102 of private employment in 2017 Note that the 7 figure on page X shows nonprofit employment as a percentage of nonprofit business and government workers and not just as a percentage of private mdash that is nonprofit and business mdash workers
For a detailed comparison of the CPS and QCEW see httpswwwblsgovcewpublicationsemployment-and-wages-annual-averages2019homehtm
For BLSQCEW data on nonprofit employment for 2013 - 2017 see httpswwwblsgovbdmnonprofitsnonprofitshtm
36HEALTH OF THE US NONPROFIT SECTOR
So
urc
es
Endnotes 1 ldquoKey Facts on US Nonprofits and Foundationsrdquo April 2020 Candid
httpswwwissuelaborgresources3638136381pdf 2 ldquoKey Facts on US Nonprofits and Foundationsrdquo April 2020 Candid
httpswwwissuelaborgresources3638136381pdf 3 ldquoKey Facts on US Nonprofits and Foundationsrdquo April 2020 Candid
httpswwwissuelaborgresources3638136381pdf 4 ldquoKey Facts on US Nonprofits and Foundationsrdquo April 2020 Candid
httpswwwissuelaborgresources3638136381pdf 5 US Bureau of Economic Analysis 6 US Bureau of Economic Analysis (BEA) Nonprofit sector refers to ldquoNonprofit
Institutions Serving Householdsrdquo or NPISH as defined by BEA See ldquoSources and Notesrdquo for more information
7 US Bureau of Economic Analysis (BEA) Nonprofit sector refers to ldquoNonprofit Institutions Serving Householdsrdquo or NPISH as defined by BEA See ldquoSources and Notesrdquo for more information
8 US Bureau of Economic Analysis (BEA) Nonprofit sector refers to ldquoNonprofit Institutions Serving Householdsrdquo or NPISH as defined by BEA See ldquoSources and Notesrdquo for more information
9 US Bureau of Economic Analysis (BEA) Nonprofit sector refers to ldquoNonprofit Institutions Serving Householdsrdquo or NPISH as defined by BEA See ldquoSources and Notesrdquo for more information
10 US Bureau of Economic Analysis (BEA) Nonprofit sector refers to ldquoNonprofit Institutions Serving Householdsrdquo or NPISH as defined by BEA See ldquoSources and Notesrdquo for more information
11 ldquoState of the Nonprofit Sector Surveyrdquo 2018 Nonprofit Finance Fund httpsnfforgsurveydata
12 ldquoState of the Nonprofit Sector Surveyrdquo 2018 Nonprofit Finance Fund httpsnfforgsurveydata
13 ldquoState of the Nonprofit Sector Surveyrdquo 2018 Nonprofit Finance Fund httpsnfforgsurveydata
14 ldquoThe Case for Funding Black-Led Social Changerdquo ABFE December 2019 httpwwwblacksocialchangeorgwp-contentuploads202005BSCFN_BLSCO_Reportpdf
15 ldquoRacial Equity and Philanthropy Disparities in Funding for Leaders of Color Leave Impact on the Tablerdquo The Bridgespan Group May 4 2020 httpswwwbridgespanorginsightslibraryphilanthropydisparities-nonprofit-funding-for-leaders-of-color
16 ldquoRacial Equity and Philanthropy Disparities in Funding for Leaders of Color Leave Impact on the Tablerdquo The Bridgespan Group May 4 2020 httpswwwbridgespanorginsightslibraryphilanthropydisparities-nonprofit-funding-for-leaders-of-color
17 Latinx Funders Dashboard Candid httpslatinxfundersorg_ga=22363900811564048031596424440-7650958491588897342
18 Bureau of Economic Analysis 19 ldquoGiving USA 2020rdquo 2020 Giving USA httpsgivingusaorggiving-usa-2020-
charitable-giving-showed-solid-growth-climbing-to-449-64-billion-in-2019-one-of-the-highest-years-for-giving-on-record
20 ldquoAssessing Giving USA 2020 Billions in Giving are Missingrdquo 2020 White Paper Charitable Giving Coalition
21 ldquoAssessing Giving USA 2020 Billions in Giving are Missingrdquo 2020 White Paper Charitable Giving Coalition
22 ldquoFundraising Effectiveness Project Quarterly Fundraising Reportrdquo 4th Quarter 2019 httpsdrivegooglecomfiled1p2j3lGRB9Lj0udhhdz3lUV3-WhJw2PM9view
23 Rooney Patrick M ldquoWhere Have All The Donors Gone The continued decline of the small donor and the growth of megadonorsrdquo December 4 2019 Nonprofit Quarterly httpsnonprofitquarterlyorgwhere-have-all-the-donors-gone-the-continued-decline-of-the-small-donor-and-the-growth-of-megadonors
24 ldquoGiving USA 2020rdquo 2020 Giving USA httpsgivingusaorggiving-usa-2020-charitable-giving-showed-solid-growth-climbing-to-449-64-billion-in-2019-one-of-the-highest-years-for-giving-on-record
25 ldquoGiving USA 2020rdquo 2020 Giving USA httpsgivingusaorggiving-usa-2020-charitable-giving-showed-solid-growth-climbing-to-449-64-billion-in-2019-one-of-the-highest-years-for-giving-on-record
26 ldquoState of the Nonprofit Sector Surveyrdquo 2018 Nonprofit Finance Fund httpsnfforgsurveydata
27 ldquoState of the Nonprofit Sector Surveyrdquo 2018 Nonprofit Finance Fund httpsnfforgsurveydata
28 Pettijohn Sarah Elizabeth Boris Carol De Vita and Saunji Fyffe 2013 ldquoNonprofit-Government Contracts and Grants Findings from the 2013 National Surveyrdquo httpswwwurbanorgsitesdefaultfilespublication24231412962-Nonprofit-Government-Contracts-and-Grants-Findings-from-the-National-SurveyPDF
29 ldquoCOVID Impact Survey Week 3 National Findingsrdquo May 30 ndash June 8 2020 COVID Impact Survey Data Foundation httpsstatic1squarespacecomstatic5e8769b34812765cff8111f7t5ee11863221ddf08b0284c201591810150212covid_w3_topline_national_webpdf
30 ldquoCOVID Impact Survey Week 3 National Findingsrdquo May 30 ndash June 8 2020 COVID Impact Survey Data Foundation httpsstatic1squarespacecomstatic5e8769b34812765cff8111f7t5ee11863221ddf08b0284c201591810150212covid_w3_topline_national_webpdf
31 ldquoCOVID Impact Survey Week 3 National Findingsrdquo May 30 ndash June 8 2020 COVID Impact Survey Data Foundation httpsstatic1squarespacecomstatic5e8769b34812765cff8111f7t5ee11863221ddf08b0284c201591810150212covid_w3_topline_national_webpdf
32 ldquoCOVID Impact Survey Week 3 National Findingsrdquo May 30 ndash June 8 2020 COVID Impact Survey Data Foundation httpsstatic1squarespacecomstatic5e8769b34812765cff8111f7t5ee11863221ddf08b0284c201591810150212covid_w3_topline_national_webpdf
33 ldquoCOVID Impact Survey Week 3 National Findingsrdquo May 30 ndash June 8 2020 COVID Impact Survey Data Foundation httpsstatic1squarespacecomstatic5e8769b34812765cff8111f7t5ee11863221ddf08b0284c201591810150212covid_w3_topline_national_webpdf
34 Berstein Hamutal Jorge Gonzalez Dulce Gonzalez and Jahnavi Jagannath ldquoImmigrant-Serving Organizationsrsquo Perspectives on the COVID-19 Crisisrdquo August 2020 Urban Institute httpswwwurbanorgsitesdefaultfilespublication102775immigrant-serving-organizations-on-the-covid-19-crisis_0_0pdf
35 Harold Jacob ldquoHow many nonprofits will shut their doorsrdquo July 152020 Candid httpsblogcandidorgposthow-many-nonprofits-will-shut-their-doors
36 McCambridge Ruth and Nathan Dietz ldquoNonprofits in Recession Winners and Losersrdquo March 19 2020 httpsnonprofitquarterlyorgthe-great-recession-nonprofit-winners-and-losers
37 US Bureau of Economic Analysis (BEA) Nonprofit sector refers to ldquoNonprofit Institutions Serving Householdsrdquo or NPISH as defined by BEA See ldquoSources and Notesrdquo for more information
38 ldquoLarge and Mid-Sized Surveyrdquo June 2020 Independent Sector httpsindependentsectororgwp-contentuploads202006COVID19-survey-mid-size-nonprofits-June2020pdf
39 ldquoSpecial Report COVID-19 and the Charitable Sectorrdquo March 2020 BBB Wise Giving Alliance httpswwwgiveorgdocsdefault-sourcedonor-trust-librarywga-covid19-charity-reportpdf
40 Berstein Hamutal Jorge Gonzalez Dulce Gonzalez and Jahnavi Jagannath ldquoImmigrant-Serving Organizationsrsquo Perspectives on the COVID-19 Crisisrdquo August 2020 Urban Institute httpswwwurbanorgsitesdefaultfilespublication102775immigrant-serving-organizations-on-the-covid-19-crisis_0_0pdf
41 ldquoImpact of COVID-19 on Large and Mid-sized Nonprofitsrdquo 2020 Independent Sector httpsindependentsectororgwp-contentuploads202006COVID19-survey-mid-size-nonprofits-June2020pdf
42 ldquo2020 Q2 Reportrdquo Fundraising Effectiveness Project 2020 httpsafpfeporgreports
43 ldquo2020 Q2 Reportrdquo Fundraising Effectiveness Project 2020 httpsafpfeporgreports
44 Jones Jeffrey M ldquoPercentage of Americans Donating to Charity at New Lowrdquo May 14 2020 Gallup httpsnewsgallupcompoll310880percentage-americans-donating-charity-new-lowaspx
45 Jones Jeffrey M ldquoPercentage of Americans Donating to Charity at New Lowrdquo May 14 2020 Gallup httpsnewsgallupcompoll310880percentage-americans-donating-charity-new-lowaspx
46 ldquo2020 Q2 Reportrdquo Fundraising Effectiveness Project 2020 httpsafpfeporgreports
47 ldquoGiving USA 2020rdquo 2020 Giving USA httpsgivingusaorggiving-usa-2020-charitable-giving-showed-solid-growth-climbing-to-449-64-billion-in-2019-one-of-the-highest-years-for-giving-on-record
48 ldquoGross Domestic Product Second Quarter 2020rdquo US Bureau of Economic Analysis September 30 2020 httpswwwbeagovdatagdpgross-domestic-product
49 Williams Jeff ldquoIn the Time of Coronavirus How many eligible nonprofits benefited from the Paycheck Protection Programrdquo July 21 2020 Johnson Center at Grand Valley State University httpsjohnsoncenterorgin-the-time-of-coronavirus-how-many-eligible-nonprofits-benefited-from-the-paycheck-protection-program
50 McCambridge Ruth and Nathan Dietz ldquoNonprofits in Recession Winners and Losersrdquo March 19 2020 httpsnonprofitquarterlyorgthe-great-recession-nonprofit-winners-and-losers
51 ldquoRace to Lead Revisited Obstacles and Opportunities in Addressing the Nonprofit Racial Leadership Gaprdquo July 2020 Building Movement Project httpsbuildingmovementorgwp-contentuploads202007RTL_Revisited_National-Report_Finalpdf
52 Current Population Survey (CPS) conducted by the US Census Bureau and the US Bureau of Labor Statistics
53 Current Population Survey (CPS) conducted by the US Census Bureau and the US Bureau of Labor Statistics
54 Current Population Survey (CPS) conducted by the US Census Bureau and the US Bureau of Labor Statistics
55 Current Population Survey (CPS) conducted by the US Census Bureau and the US Bureau of Labor Statistics
56 ldquoResearch Data on the Nonprofit Sector 2017rdquo Released 2020 US Bureau of Labor Statistics httpswwwblsgovbdmnonprofitsnonprofitshtmNP20Size20Tablexlsxf1
37HEALTH OF THE US NONPROFIT SECTOR
En
dn
ote
s
57 2020 Nonprofit Employment Report June 2020 Johns Hopkins University httpccssjhueduwp-contentuploadsdownloads2020062020-Nonprofit-Employment-Report_FINAL_62020pdf
58 2020 Nonprofit Employment Report June 2020 Johns Hopkins University httpccssjhueduwp-contentuploadsdownloads2020062020-Nonprofit-Employment-Report_FINAL_62020pdf
59 2020 Nonprofit Employment Report June 2020 Johns Hopkins University httpccssjhueduwp-contentuploadsdownloads2020062020-Nonprofit-Employment-Report_FINAL_62020pdf
60 2020 Nonprofit Employment Report June 2020 Johns Hopkins University httpccssjhueduwp-contentuploadsdownloads2020062020-Nonprofit-Employment-Report_FINAL_62020pdf
61 2020 Nonprofit Employment Report June 2020 Johns Hopkins University httpccssjhueduwp-contentuploadsdownloads2020062020-Nonprofit-Employment-Report_FINAL_62020pdf
62 2020 Nonprofit Employment Report June 2020 Johns Hopkins University httpccssjhueduwp-contentuploadsdownloads2020062020-Nonprofit-Employment-Report_FINAL_62020pdf
63 ldquoRace to Lead Revisited Obstacles and Opportunities in Addressing the Nonprofit Racial Leadership Gaprdquo July 2020 Building Movement Project httpsbuildingmovementorgwp-contentuploads202007RTL_Revisited_National-Report_Finalpdf
64 ldquoRace to Lead Revisited Obstacles and Opportunities in Addressing the Nonprofit Racial Leadership Gaprdquo July 2020 Building Movement Project httpsbuildingmovementorgwp-contentuploads202007RTL_Revisited_National-Report_Finalpdf
65 Lee Young-Joo July 2 2019 ldquoMale nonprofit CEOs earn more ndash but the real problem runs deeper than a simple gender pay gaprdquo The Conversation httpstheconversationcommale-nonprofit-ceos-earn-more-but-the-problem-runs-deeper-than-a-simple-gender-pay-gap-119068
66 ldquoVolunteering in Americardquo 2017 Corporation for National and Community Service httpswwwnationalservicegovservevia
67 ldquoVolunteering in Americardquo 2017 Corporation for National and Community Service httpswwwnationalservicegovservevia
68 ldquoVolunteering in Americardquo 2017 Corporation for National and Community Service httpswwwnationalservicegovservevia
69 Newhouse Chelsea ldquoNonprofit Jobs Still Down by Nearly 1 Million Despite a Partial Recoveryrdquo September 4 2020 Johns Hopkins University httpccssjhuedulabor-day-2020-coronavirus
70 ldquoCOVID Impact Survey Week 3 National Findingsrdquo May 30 ndash June 8 2020 COVID Impact Survey Data Foundation httpsstatic1squarespacecomstatic5e8769b34812765cff8111f7t5ee11863221ddf08b0284c201591810150212covid_w3_topline_national_webpdf
71 ldquoCOVID-19 Impact on Volunteeringrdquo March 25 2020 VolunteerMatch httpsinfovolunteermatchorgcovid-19-resource-hub
72 ldquoCOVID-19 Impact on Volunteeringrdquo March 25 2020 VolunteerMatch httpsinfovolunteermatchorgcovid-19-resource-hub
73 ldquoTrust in Civil Society Understanding the factors driving trust in nonprofits and philanthropyrdquo 2020 Independent Sector httpsindependentsectororgwp-contentuploads202006Trust-in-Civil-Society-62420pdf
74 ldquo2019 Donorrsquos Trust Report State of Public Trust in the Charitable Sectorrdquo 2019 BBB Wise Giving Alliance fileCUsersallisongDocumentsPolicy20Symposium2019-donor-trust-reportpdf
75 ldquoTrust in Civil Society Understanding the factors driving trust in nonprofits and philanthropyrdquo 2020 Independent Sector httpsindependentsectororgwp-contentuploads202006Trust-in-Civil-Society-62420pdf
76 ldquoTrust in Civil Society Understanding the factors driving trust in nonprofits and philanthropyrdquo 2020 Independent Sector httpsindependentsectororgwp-contentuploads202006Trust-in-Civil-Society-62420pdf
77 ldquoTrust in Civil Society Understanding the factors driving trust in nonprofits and philanthropyrdquo 2020 Independent Sector httpsindependentsectororgwp-contentuploads202006Trust-in-Civil-Society-62420pdf
78 ldquoTrust in Civil Society Understanding the factors driving trust in nonprofits and philanthropyrdquo 2020 Independent Sector httpsindependentsectororgwp-contentuploads202006Trust-in-Civil-Society-62420pdf
79 ldquo2019 Donorrsquos Trust Report State of Public Trust in the Charitable Sectorrdquo 2019 BBB Wise Giving Alliance fileCUsersallisongDocumentsPolicy20Symposium2019-donor-trust-reportpdf
80 ldquoTrust in Civil Society Understanding the factors driving trust in nonprofits and philanthropyrdquo 2020 Independent Sector httpsindependentsectororgwp-contentuploads202006Trust-in-Civil-Society-62420pdf
81 ldquoLeading with Intent 2017 BoardSource Index of Nonprofit Board Practicesrdquo 2017 Board Source P 12 httpsleadingwithintentorg__hstc=98438528c0a04be535e93b2008d110605aec23f215947523898351594752389835 15952763236642amp__hssc=9843852841595276323664amp__ hsfp=2455080615
82 ldquoLeading with Intent 2020 Index of Nonprofit Board Practicesrdquo 2020 BoardSource
83 ldquoRace to Lead Revisited Obstacles and Opportunities in Addressing the Nonprofit Racial Leadership Gaprdquo July 2020 Building Movement Project httpsbuildingmovementorgwp-contentuploads202007RTL_Revisited_National-Report_Finalpdf
84 ldquoLeading with Intent 2020 Index of Nonprofit Board Practicesrdquo 2020 BoardSource
85 ldquoLeading with Intent 2020 Index of Nonprofit Board Practicesrdquo 2020 BoardSource
86 ldquoLeading with Intent 2020 Index of Nonprofit Board Practicesrdquo 2020 BoardSource
87 ldquoState of the Nonprofit Sector Surveyrdquo 2018 Nonprofit Finance Fund httpsnfforgsurveydata
88 ldquoLeading with Intent 2020 Index of Nonprofit Board Practicesrdquo 2020 BoardSource
89 ldquoLeading with Intent 2020 Index of Nonprofit Board Practicesrdquo 2020 BoardSource
90 ldquoRace to Lead Revisited Obstacles and Opportunities in Addressing the Nonprofit Racial Leadership Gaprdquo July 2020 Building Movement Project httpsbuildingmovementorgwp-contentuploads202007RTL_Revisited_National-Report_Finalpdf
91 ldquoRace to Lead Revisited Obstacles and Opportunities in Addressing the Nonprofit Racial Leadership Gaprdquo July 2020 Building Movement Project httpsbuildingmovementorgwp-contentuploads202007RTL_Revisited_National-Report_Finalpdf
92 ldquoNACD COVID-19 Survey Reveals Top Trends and Governance Challenges Directors Anticipate as We Move to New Normalrdquo June 9 2020 NACD May 2020 COVID-19 Pulse Survey National Association of Corporate Directors httpswwwglobenewswirecomnews-release2020060920457250enNACD-COVID-19-Survey-Reveals-Top-Trends-and-Governance-Challenges-Directors-Anticipate-as-We-Move-to-New-Normalhtml
93 ldquoSpecial Report COVID-19 and the Charitable Sectorrdquo March 2020 BBB Wise Giving Alliance httpswwwgiveorgdocsdefault-sourcedonor-trust-librarywga-covid19-charity-reportpdf
94 ldquoSpecial Report COVID-19 and the Charitable Sectorrdquo March 2020 BBB Wise Giving Alliance httpswwwgiveorgdocsdefault-sourcedonor-trust-librarywga-covid19-charity-reportpdf
95 ldquoSpecial Report COVID-19 and the Charitable Sectorrdquo March 2020 BBB Wise Giving Alliance httpswwwgiveorgdocsdefault-sourcedonor-trust-librarywga-covid19-charity-reportpdf
96 Berstein Hamutal Jorge Gonzalez Dulce Gonzalez and Jahnavi Jagannath ldquoImmigrant-Serving Organizationsrsquo Perspectives on the COVID-19 Crisisrdquo August 2020 Urban Institute httpswwwurbanorgsitesdefaultfilespublication102775immigrant-serving-organizations-on-the-covid-19-crisis_0_0pdf
97 ldquoSpecial Report COVID-19 and the Charitable Sectorrdquo March 2020 BBB Wise Giving Alliance httpswwwgiveorgdocsdefault-sourcedonor-trust-librarywga-covid19-charity-reportpdf
98 ldquoLeading with Intent 2020 Index of Nonprofit Board Practicesrdquo 2020 BoardSource 99 ldquoLeading with Intent 2020 Index of Nonprofit Board Practicesrdquo 2020 BoardSource 100 ldquoState of the Nonprofit Sector Surveyrdquo 2018 Nonprofit Finance Fund httpsnff
orgsurveydata 101 Rathgeb Smith Steven and Robert Pekkanen 2012 ldquoRevisiting advocacy by non-
profit organisationsrdquo Voluntary Sector Review Vol 3 No 1 Pp 40 httpswwwresearchgatenetprofileRobert_Pekkanenpublication256701715_Revisiting_advocacy_by_non-profit_organisationslinks00b49523a225987215000000pdf
102 ldquoGrantmaking for Community Impact Project Increasing philanthropic resources for advocacy organizing and civic engagementrdquo 2011 National Committee for Responsive Philanthropy httpswwwncrporgpublicationsgrantmaking-for-community-impact-project
103 ldquoM+R Benchmarksrdquo 2020 httpsmrbenchmarkscom 104 ldquoM+R Benchmarksrdquo 2020 httpsmrbenchmarkscom 105 Rathgeb Smith Steven and Robert Pekkanen 2012 ldquoRevisiting advocacy by
non-profit organisationsrdquo Voluntary Sector Review Vol 3 No 1 httpswwwresearchgatenetprofileRobert_Pekkanenpublication256701715_Revisiting_advocacy_by_non-profit_organisationslinks00b49523a225987215000000pdf
106 Rathgeb Smith Steven and Robert Pekkanen 2012 ldquoRevisiting advocacy by non-profit organisationsrdquo Voluntary Sector Review Vol 3 No 1 Pp 42 httpswwwresearchgatenetprofileRobert_Pekkanenpublication256701715_Revisiting_advocacy_by_non-profit_organisationslinks00b49523a225987215000000pdf
107 ldquoThe Impact of Diversity Understanding how nonprofit board diversity affects philanthropy leadership and board engagementrdquo 2018 Indiana University Johnson Grossnickle+ Associates BoardSource httpswwwissuelaborgresources3511235112pdf
108 ldquoLeading with Intent 2020 Index of Nonprofit Board Practicesrdquo 2020 BoardSource 109 ldquoLeading with Intent 2020 Index of Nonprofit Board Practicesrdquo 2020 BoardSource 110 ldquoLeading with Intent 2020 Index of Nonprofit Board Practicesrdquo 2020 BoardSource 111 ldquoLeading with Intent 2020 Index of Nonprofit Board Practicesrdquo 2020 BoardSource 112 ldquoEngaging New Voters If nonprofits donrsquot who willrdquo 2019 Nonprofit Vote https
wwwnonprofitvoteorgdocuments201905engaging-new-voters-2018pdf
38HEALTH OF THE US NONPROFIT SECTOR
En
dn
ote
s
113 ldquoEngaging New Voters If nonprofits donrsquot who willrdquo 2019 Nonprofit Vote httpswwwnonprofitvoteorgdocuments201905engaging-new-voters-2018pdf
114 ldquoEngaging New Voters If nonprofits donrsquot who willrdquo 2019 Nonprofit Vote httpswwwnonprofitvoteorgdocuments201905engaging-new-voters-2018pdf
115 ldquoTrends in the Internal Revenue Servicersquos Funding and Enforcementrdquo Congressional Budget Office July 2020 httpswwwcbogovpublication56422
116 Williams Jeff ldquoIn the Time of Coronavirus How many eligible nonprofits benefited from the Paycheck Protection Programrdquo July 21 2020 Johnson Center at Grand Valley State University httpsjohnsoncenterorgin-the-time-of-coronavirus-how-many-eligible-nonprofits-benefited-from-the-paycheck-protection-program
117 Williams Jeff ldquoIn the Time of Coronavirus How many eligible nonprofits benefited from the Paycheck Protection Programrdquo July 21 2020 Johnson Center at Grand Valley State University httpsjohnsoncenterorgin-the-time-of-coronavirus-how-many-eligible-nonprofits-benefited-from-the-paycheck-protection-program
118 Williams Jeff ldquoIn the Time of Coronavirus How many eligible nonprofits benefited from the Paycheck Protection Programrdquo July 21 2020 Johnson Center at Grand Valley State University httpsjohnsoncenterorgin-the-time-of-coronavirus-how-many-eligible-nonprofits-benefited-from-the-paycheck-protection-program
119 Williams Jeff ldquoIn the Time of Coronavirus How many eligible nonprofits benefited from the Paycheck Protection Programrdquo July 21 2020 Johnson Center at Grand Valley State University httpsjohnsoncenterorgin-the-time-of-coronavirus-how-many-eligible-nonprofits-benefited-from-the-paycheck-protection-program
120 Williams Jeff ldquoIn the Time of Coronavirus How many eligible nonprofits benefited from the Paycheck Protection Programrdquo July 21 2020 Johnson Center at Grand Valley State University httpsjohnsoncenterorgin-the-time-of-coronavirus-how-many-eligible-nonprofits-benefited-from-the-paycheck-protection-program
121 Williams Jeff ldquoIn the Time of Coronavirus How many eligible nonprofits benefited from the Paycheck Protection Programrdquo July 21 2020 Johnson Center at Grand Valley State University httpsjohnsoncenterorgin-the-time-of-coronavirus-how-many-eligible-nonprofits-benefited-from-the-paycheck-protection-program
122 Rooney Patrick ldquoGo Big or Go Home Steps Congress Should Take Nowrdquo June 10 2020 Nonprofit Quarterly httpsnonprofitquarterlyorggo-big-or-go-home-steps-congress-should-take-to-increase-charitable-giving
123 ldquoGuidelines for Healthy In-Person Votingrdquo August 12 2020 Brennan Center for Justice httpswwwbrennancenterorgsitesdefaultfiles2020-082020_08_Guide20for20Healthy20In20Person20Voting_Finalv2pdf
124 ldquoAt Least 77 of American voters can cast ballots by mail in the fallrdquo The Washington Post httpswwwwashingtonpostcomgraphics2020politicsvote-by-mail-states
125 ldquoAt Least 77 of American voters can cast ballots by mail in the fallrdquo The Washington Post httpswwwwashingtonpostcomgraphics2020politicsvote-by-mail-states
126 Rathgeb Smith Steven and Robert Pekkanen 2012 ldquoRevisiting advocacy by non-profit organisationsrdquo Voluntary Sector Review Vol 3 No 1 Pp 43 httpswww researchgatenetprofileRobert_Pekkanenpublication256701715_Revisiting_ advocacy_by_non-profit_organisationslinks00b49523a225987215000000pdf
About Independent Sector
Independent Sector is the only national membership organization that brings together a diverse community of changemakers at nonprofits foundations and corporate giving programs working to strengthen civil society and ensure all people in the United States thrive As the vital meeting ground we advance our mission by fostering a sense of belonging catalyzing action and providing policy leadership across the full breadth of the charitable sector
Copyright copy 2020 by Independent Sector All rights reserved
39HEALTH OF THE US NONPROFIT SECTOR
En
dn
ote
s
1602 L Street NW Suite 900
Washington DC 20036
202-467-6100
independentsectororg
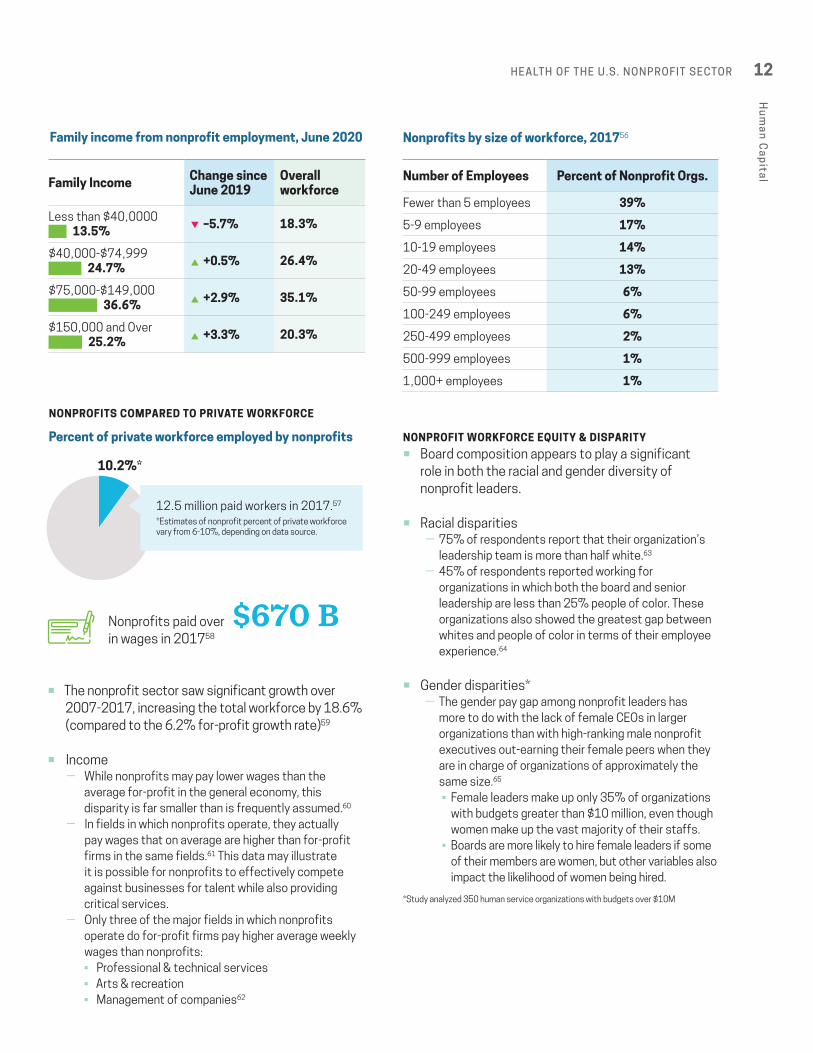
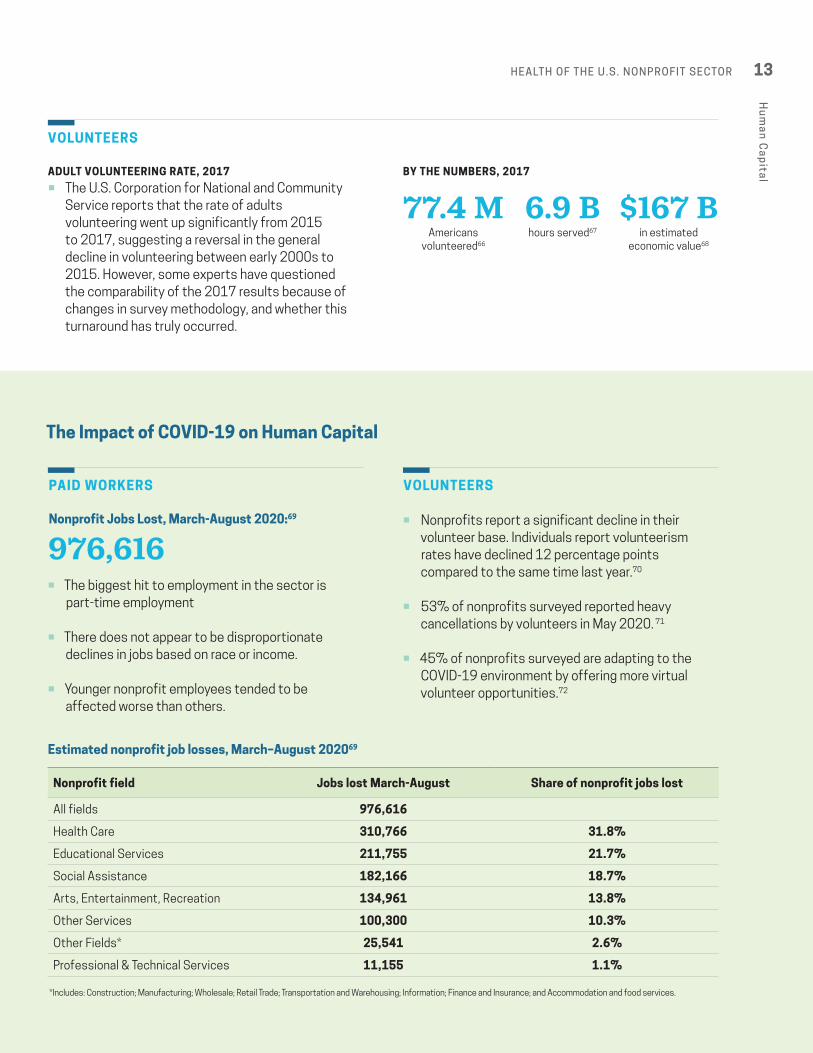