health risk assessment (hra) workshop: participant … acknowledgements workgroup members: brian...
TRANSCRIPT

1
Health Risk Assessment (HRA) Workshop:
Participant Tool
2
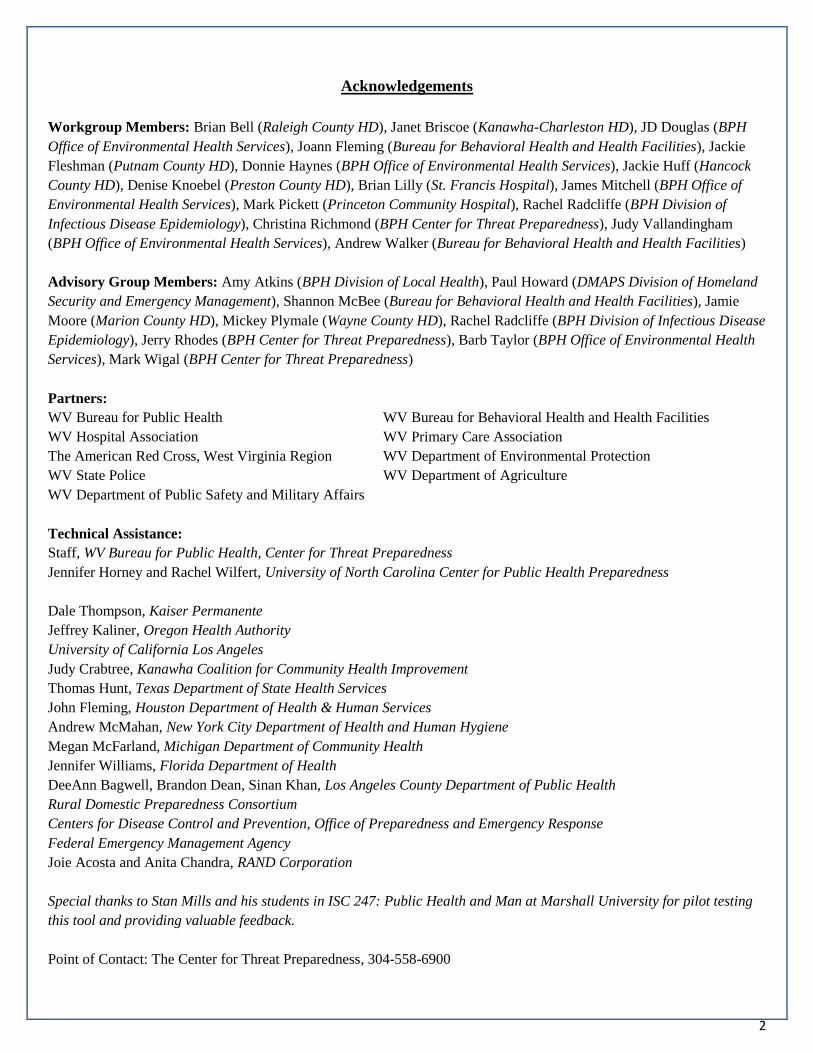
Acknowledgements
Workgroup Members: Brian Bell (Raleigh County HD), Janet Briscoe (Kanawha-Charleston HD), JD Douglas (BPH
Office of Environmental Health Services), Joann Fleming (Bureau for Behavioral Health and Health Facilities), Jackie
Fleshman (Putnam County HD), Donnie Haynes (BPH Office of Environmental Health Services), Jackie Huff (Hancock
County HD), Denise Knoebel (Preston County HD), Brian Lilly (St. Francis Hospital), James Mitchell (BPH Office of
Environmental Health Services), Mark Pickett (Princeton Community Hospital), Rachel Radcliffe (BPH Division of
Infectious Disease Epidemiology), Christina Richmond (BPH Center for Threat Preparedness), Judy Vallandingham
(BPH Office of Environmental Health Services), Andrew Walker (Bureau for Behavioral Health and Health Facilities)
Advisory Group Members: Amy Atkins (BPH Division of Local Health), Paul Howard (DMAPS Division of Homeland
Security and Emergency Management), Shannon McBee (Bureau for Behavioral Health and Health Facilities), Jamie
Moore (Marion County HD), Mickey Plymale (Wayne County HD), Rachel Radcliffe (BPH Division of Infectious Disease
Epidemiology), Jerry Rhodes (BPH Center for Threat Preparedness), Barb Taylor (BPH Office of Environmental Health
Services), Mark Wigal (BPH Center for Threat Preparedness)
Partners:
WV Bureau for Public Health WV Bureau for Behavioral Health and Health Facilities
WV Hospital Association WV Primary Care Association
The American Red Cross, West Virginia Region WV Department of Environmental Protection
WV State Police WV Department of Agriculture
WV Department of Public Safety and Military Affairs
Technical Assistance:
Staff, WV Bureau for Public Health, Center for Threat Preparedness
Jennifer Horney and Rachel Wilfert, University of North Carolina Center for Public Health Preparedness
Dale Thompson, Kaiser Permanente
Jeffrey Kaliner, Oregon Health Authority
University of California Los Angeles
Judy Crabtree, Kanawha Coalition for Community Health Improvement
Thomas Hunt, Texas Department of State Health Services
John Fleming, Houston Department of Health & Human Services
Andrew McMahan, New York City Department of Health and Human Hygiene
Megan McFarland, Michigan Department of Community Health
Jennifer Williams, Florida Department of Health
DeeAnn Bagwell, Brandon Dean, Sinan Khan, Los Angeles County Department of Public Health
Rural Domestic Preparedness Consortium
Centers for Disease Control and Prevention, Office of Preparedness and Emergency Response
Federal Emergency Management Agency
Joie Acosta and Anita Chandra, RAND Corporation
Special thanks to Stan Mills and his students in ISC 247: Public Health and Man at Marshall University for pilot testing
this tool and providing valuable feedback.
Point of Contact: The Center for Threat Preparedness, 304-558-6900
3
PART I Hazard Identification and Ranking

4
PART I: PARTICIPANT COVER SHEET
**Please return your completed worksheet to the form checker**
Sector (circle one): Public Health Hospital Behavioral Health
Primary Care Other
County:
Name:
Agency/Organization:

5
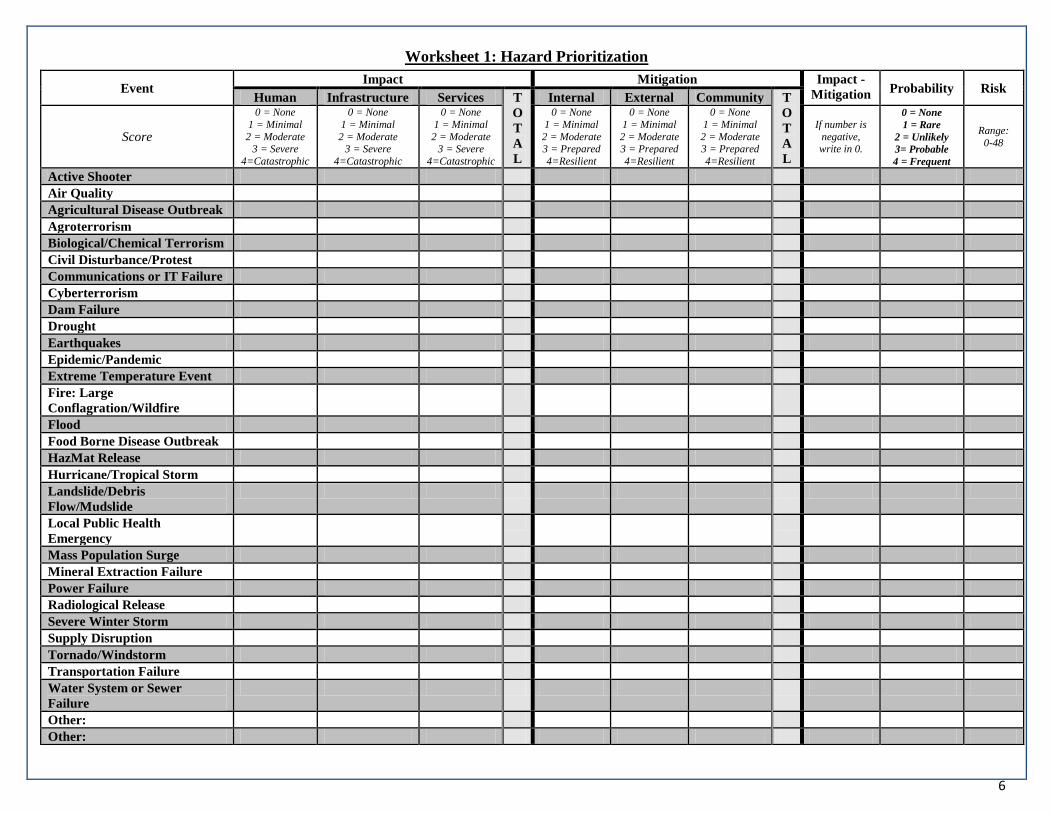
Part 1: Instructions
This is an individual activity, to be completed by you.
1) Using both the scale and hazard definitions (found in Attachments 1 and 2), please fill-out the impact, mitigation and probability boxes for each of the
listed hazards. We encourage you to use your experience as a professional, your knowledge as a community member, and any plans, reports or other
documents that you have brought with you that document the hazards in your county.
2) When you have put a number in each box, use the following equation to add-up the relative threat for each hazard:
Risk = Probability X (Impact-Mitigation)
Example: For this example, the equation would be: Risk = ((3 + 4 + 4) – (1 + 1 + 0)) X 3 = (11 – 2) X 3 = 9 X 3 = 27
3) Impact guidance: if you cannot decide between two numbers, choose the higher number. For example, for the hazard “active shooter,” if you can’t decide
between a 3 and a 4 for human impact, put a 4.
4) Mitigation guidance: if you cannot decide between two numbers, choose the lower number. For example, for the hazard “hurricane,” if you can’t decide
between a 2 and a 3 for external mitigation, put a 2. For “Internal Mitigation” answer for your agency.
5) Note: When all participants have returned their completed forms to the form checker, the form checker or another staff person will use an Excel tool to
identify the hazard that the group, as a whole, prioritized. This will be the hazard with the highest average risk and will be used to complete Part II:
Impact.
Event Impact Mitigation Impact -
Mitigation
Probab-
ility
Risk Human Infrastructure Services T
O
T
A
L
Internal External Community T
O
T
A
L
Score
0 = None 1 = Minimal
2 = Moderate
3 = Severe 4=Catastrophic
0 = None 1 = Minimal
2 = Moderate
3 = Severe 4=Catastrophic
0 = None 1 = Minimal
2 = Moderate
3 = Severe 4=Catastrophic
0 = None 1 = Minimal
2 = Moderate
3 = Prepared 4=Resilient
0 = None 1 = Minimal
2 = Moderate
3 = Prepared 4=Resilient
0 = None 1 = Minimal
2 = Moderate
3 = Prepared 4=Resilient
If number is negative,
write in 0.
0 = None
1 = Rare
2 = Unlikely
3= Probable
4 = Frequent
Range: 0-48
Tsunami 3 4 4 11 1 1 0 2 9 3 27
6
Worksheet 1: Hazard Prioritization
Event Impact Mitigation Impact -
Mitigation Probability Risk
Human Infrastructure Services T
O
T
A
L
Internal External Community T
O
T
A
L
Score
0 = None
1 = Minimal
2 = Moderate 3 = Severe
4=Catastrophic
0 = None
1 = Minimal
2 = Moderate 3 = Severe
4=Catastrophic
0 = None
1 = Minimal
2 = Moderate 3 = Severe
4=Catastrophic
0 = None
1 = Minimal
2 = Moderate 3 = Prepared
4=Resilient
0 = None
1 = Minimal
2 = Moderate 3 = Prepared
4=Resilient
0 = None
1 = Minimal
2 = Moderate 3 = Prepared
4=Resilient
If number is
negative, write in 0.
0 = None
1 = Rare
2 = Unlikely
3= Probable
4 = Frequent
Range:
0-48
Active Shooter
Air Quality
Agricultural Disease Outbreak
Agroterrorism
Biological/Chemical Terrorism
Civil Disturbance/Protest
Communications or IT Failure
Cyberterrorism
Dam Failure
Drought
Earthquakes
Epidemic/Pandemic
Extreme Temperature Event
Fire: Large
Conflagration/Wildfire
Flood
Food Borne Disease Outbreak
HazMat Release
Hurricane/Tropical Storm
Landslide/Debris
Flow/Mudslide
Local Public Health
Emergency
Mass Population Surge
Mineral Extraction Failure
Power Failure
Radiological Release
Severe Winter Storm
Supply Disruption
Tornado/Windstorm
Transportation Failure
Water System or Sewer
Failure
Other:
Other:

7
Attachment 1: Scale Definitions for Hazard Prioritization (Worksheet 1)
Probability
For probability, consider the following:
Known risks including existing
hazards such as chemical plants,
transportation lines, etc.
Historical data such as traditional
springtime flooding, weather
patterns, etc.
Future threat potential including any
new construction of hazard sites,
new groups in the area that have the
potential to cause civil unrest, etc.
0 - None Zero or near zero probability the hazard will occur.
1 - Rare May occur only in exceptional circumstances; may occur once every 26 years or
more.
2 - Unlikely Is not expected to occur; and/or very few recorded incidents; and/or no recent
incidents in associated organizations, facilities, or communities; and/or little
opportunity, reason, or means to occur; may occur once every 8-25 years.
3 - Probable Will probably occur in most circumstances; and/or regular recorded incidents;
and/or considerable opportunity, reason, or means to occur; may occur once
every 2-7 years.
4 - Frequent Is expected to occur in most circumstances; and /or high level of recorded
incidents and/or strong likelihood the event will recur; and or great opportunity,
reason, or means to occur; may occur one or more times annually.
Human Impact
For human impact, consider the
following:
The potential for death, injury or
disease
The impact on at-risk individuals
The impact on households from loss
of essential services and utilities
The impact on mental and
behavioral health and substance use
Note: if the impact could fit under more
than one number (i.e. “1-some injuries
reported and 4 – very high impact on at-
risk individuals”) record the higher
number
0 - None Zero or near zero impact on the health of the population – no injuries or fatalities;
at-risk individuals not impacted.
1- Minimal Low impact on health of population or some injuries reported as a direct result of
the hazard or minimal impact on at-risk individuals; adequately handled by
agency using existing resources.
2 - Moderate Moderate impact on health of population or increase in injuries and some severe
injuries reported as a direct result of the hazard or moderate impact on at-risk
individuals; stretches capacity of existing resources; draws upon resources
provided by mutual aid within the county.
3 - Severe High impact on health of population or multiple injuries and some fatalities as a
direct result of the hazard or high impact on at-risk individuals; needs far exceed
capacity of local authority and must call on surrounding counties for aid.
4 –
Catastrophic Very high impact on health of population or multiple severe injuries and fatalities
as a direct result of the hazard or very high impact on at-risk individuals;
available resources are overwhelmed, requiring state or federal assistance.
Health
Infrastructure
Impact
For health infrastructure impact,
consider the following:
0- None Zero or near zero impact on health infrastructure.
1- Minimal Low impact; some stress to infrastructure; > 75% of structures, utilities and
communications in place; adequately handled by agency using existing
resources.

8
The type of hazard
The expected impact of the hazard to
health infrastructure overall
including hospital, primary care,
public health and behavioral health
buildings, utilities and
communications
2 – Moderate Moderate impact; 50-74% of structures, utilities and communications in place;
stretches capacity of existing resources; draws upon resources provided by
mutual aid within the county.
3 – Severe Severe impact; 25-49% of structures, utilities and communications in place;
needs far exceed capacity of local authority and must call on surrounding
counties for aid.
4 –
Catastrophic Structures, utilities and communications destroyed; available resources are
overwhelmed, requiring state or federal assistance.
Health Services
Impact
For health services impact, consider the
following:
Time to recover essential health
services
Whether this event would
necessitate surge
Whether health systems staff would
be available to work this event
Whether transportation to health
facilities would be possible in a
reasonable timeframe
Whether facilities have sufficient
supplies on-hand to self-sustain for
72 hours
Public demand for health services
following the event
0 - None Zero or near zero impact; non-essential services impacted for less than 24 hours.
1- Minimal Low impact; essential services are impacted 12-24 hours; adequately handled by
agency using existing resources.
2 - Moderate Moderate impact; essential services impacted 25-72 hours, requiring resources
provided by mutual aid within the county.
3 - Severe High impact; essential services are unavailable for 73 hours-1 week, requiring aid
from surrounding counties.
4 –
Catastrophic Essential services are impacted for greater than 1 week requiring state and/or
federal aid and assistance.
Internal
Mitigation –
Health Systems
For internal mitigation, consider the
following:
To what extent your health agency
has developed, reviewed, exercised
and implemented their plans
To what extent staff in county health
agencies are trained in incident
command
0 – None No planning has been done to address this hazard; no staff training has been
conducted on incident command.
1 – Minimal Planning has been developed but not shared or tested with essential personnel;
only 25% of personnel have been trained in their respective roles for incident
command.
2 – Moderate Plans have been developed and shared with essential personnel but have not been
tested in the last year; only 50% of personnel have been trained in their
respective roles for incident command.
3 – Prepared Plans have been developed and shared with essential personnel and exercised in
the last 5 years; plans have also been reviewed with non-essential personnel; 75%
of personnel have been trained in their respective roles for incident command.

9
4 – Resilient Plans have been developed, shared and exercised with essential and non-essential
personnel in the last year; used in a real event in the last five years; 100% of
personnel have been trained in their respective roles for incident command.
External
Mitigation –
Health Partners
For external mitigation, consider the
following:
To what extent have agencies in
your county met, trained, exercised
and responded to this event
To what extent agencies in your
county have shared plans and built
partnerships through MOUs and
other methods
0 – None No Memorandums of Understanding (MOUs) have been developed with external
partners to address this hazard.
1 – Minimal Partners have met to discuss MOUs but the MOUs have not been reviewed
together to determine potential gaps in response and/or competing contracts.
2 – Moderate MOUs have been developed and reviewed by relevant partners in the last 12
months.
3 – Prepared MOUs have been developed and reviewed by partners in the last 12 months and
exercised in the last 5 years.
4 – Resilient MOUs have been developed and reviewed by partners in the last 12 months and
activated in a real event in the last 5 years.
Community
Mitigation
For community mitigation, consider the
following:
How active is the volunteer base
in your county
How educated is your
community on preparedness
activities such as maintaining
adequate food and water
supplies
In past disasters, how effective
has your county been in
sheltering all populations
Has work been done to locate
and identify at-risk individuals
What work has been done to
educate the public on each
hazard, respectively
0 – None No active volunteer base; no education conducted on preparedness; no
community planning for at-risk individuals.
1 – Minimal Volunteer numbers are inadequate for agency response to hazard; limited
outreach on community preparedness; limited knowledge of and contact with at-
risk individuals.
2 – Moderate Volunteer numbers are inadequate for agency response and are shared among
multiple agencies but have been used in an exercise or event; outreach on
community preparedness has been conducted in the last 5 years; agency has
general knowledge but no documented lists of at-risk individuals.
3 – Prepared Volunteer numbers are adequate for response, have been used in an exercise and
are dedicated to my agency; my agency has conducted outreach on community
preparedness in the last 12 months; my agency has lists facilities serving at-risk
populations in my county but only general knowledge of at-risk individuals.
4 – Resilient Volunteer numbers are adequate for response and have been used in my agency’s
response in the last 5 years for an event; my agency conducts outreach on
community preparedness more than once a year; my agency has developed and is
promoting a registry for at-risk individuals and has a notification list of facilities
serving at-risk individuals.

10
Attachment 2: Hazard Definitions for Hazard Prioritization (Worksheet 1)
Hazard List Definition
Active Shooter An individual actively engaged in killing or attempting to kill people in a confined and populated area; in most cases, active
shooters use firearm(s) with no pattern or method to their selection of victims.
Air Quality Poor air quality occurs when the air contains gases, dust, fumes or odor in amounts that could be harmful to the health of humans
and animals. May include ozone/pollution advisories.
Agricultural Disease
Outbreak
Naturally occurring biological disease in some component of agriculture (crops and/or animals) in such a way as to adversely
impact the agriculture industry, the economy, or the consuming public.
Agroterrorism
Agroterrorism is the deliberate introduction or threatened use of biological, chemical, or radiological agents, either against
livestock/crops or into the food chain, for the purpose of undermining and/or generating fear over the safety of food, causing
economic losses, and/or undermining social stability. It may also take the form of hoaxes and threats intended to create public fear
of such events. Agroterrorism affects the animal or plant food chain that it attacks and the public confidence in the product.
Biological or Chemical
Terrorism
The intentional use of chemicals, microorganisms or toxins derived from organic or inorganic organisms to cause death or disease
in humans, animals, or plants on which we depend.
Civil Disturbance/Protest/
Demonstration Any incident intended to disrupt community affairs and requiring police intervention to maintain public safety.
Communications /
Information Technology
(IT) Failure
May range from temporary or short-term disruption to total communications or information technology systems failure, including
messaging systems, Internet, telephones, portable microwave, amateur radios, point-to-point private lines, satellite, and high-
frequency radio.
Cyberterrorism The intentional disruption of the Internet or the systems needed to operate critical infrastructure, including: information systems,
technology, programmable electronic devices, networks, hardware, software and data.
Dam Failure The systematic failure of dam structure leading to an uncontrolled release of water resulting in a flood that exceeds the 100-year
flood plain.
Drought
A condition of moisture deficit sufficient to have an adverse effect on vegetation, animals, and people over a sizeable area. Also a
period of abnormally dry weather that persists long enough to produce a serious hydrologic imbalance (for example, crop damage,
water supply shortage, etc.). The severity of the drought depends upon the degree of moisture deficiency, the duration, and the size
of the affected area.
Earthquake The sudden motion or trembling in the earth caused by an abrupt release of slowly accumulating strain which results in ground
shaking, surface faulting, or ground failures.
Epidemic/Pandemic An outbreak of a novel virus causing sudden, pervasive illness that can severely affect even otherwise healthy individuals in all age
groups.
Extreme Temperature
Event
Extreme cold is defined as a drop in temperature to within 5 degrees of the local record. The absolute temperature that qualifies for
this designation will vary by region. Extreme heat is defined as a combination of very high temperatures and exceptionally humid
conditions that are severe enough to cause a health risk to a portion of the local population that cannot find shelter.
Fires – Large-Scale
Conflagration or Wildfire
Fires larger than a single family dwelling that cause a public health or major medical emergency. Examples may include fires in
high-rise buildings, commercial buildings, bulk storage structures (non-hazardous material), manufacturing buildings, and
conflagration fires (fires that spread from building to building). Any free burning uncontainable wildland fire not prescribed for the
area, which consumes the natural fuels and spreads in response to its environment.
Flood The accumulation of water within a water body and the overflow of excess water into adjacent floodplain lands.

11
Food Borne Disease
Outbreak
Any illness that is related to food ingestion; gastrointestinal tract symptoms are the most common clinical manifestations of
foodborne illnesses. An outbreak occurs when two or more cases are caused by the same organism within a reasonably close
period of time. (Unless it is Botulism, in which case a single case would be considered an outbreak).
Hazardous Materials
Release
The uncontrolled release of materials capable of posing a risk to health, safety, and property. Generally, such materials are classed
as explosives and blasting agents, flammable and noncombustible gases, combustible liquids, flammable liquids and solids,
oxidizers, poisons, etiological agents, radioactive materials, corrosive materials, and other materials including hazardous wastes.
Hurricane/Tropical Storm A tropical cyclone (hurricane) is defined as a low-pressure area of closed circulation winds that originates over tropical waters.
Tropical storm: when sustained wind speeds exceed 39 mph. Hurricane: when sustained wind speeds exceed 74 mph.
Landslide/Debris
Flow/Mudslide
A landslide is the downward and outward movement of slope-forming materials, such as rocks, soil, and artificial fill. Landslides
are generally caused by triggering events (e.g., earthquakes, heavy rains, or floods), that may destabilize or weaken an earthen
slope and cause it to fail.
Local Public Health
Emergency
The occurrence of a public health incident in a community or region of cases of an illness, specific health-related behavior, or other
health-related events clearly in excess of normal expectancy.
Mass Population Surge The population of an area is increased due to the migration/relocation of another community.
Mineral Extraction
Failure
Any explosion, collapse, fire, or flood in an area involving the extraction of minerals from the earth that results in a significant loss
of life. Extraction can include coal, rock, oil, gas and other minerals.
Power Failure Any interruption or loss of electrical service due to disruption of power generation or transmission caused by accident, sabotage,
natural hazards, equipment failure, or fuel shortage.
Radiological Release
The unintentional or intentional release of radioactive material to the environment. Includes any type of device or method used to
disperse radioactive material, including conventional explosive materials (i.e., a dirty bomb) and improvised nuclear weapons or
any occurrence at a fixed nuclear power facility in sufficient quantity to constitute a threat to the health and safety of the offsite
population.
Severe Winter Storm
Severe winter storm is defined as extreme cold and/or heavy concentrations of snowfall or ice. For purposes of this analysis, and
uniformity of measuring, applicants should consider the frequency and severity of damages caused by a cold snap within 5 degrees
of the local record, or ice and/or snow accumulations that cause large scale power outages longer than 48 hours.
Supply Disruption Includes disruptions of food and/or water and/or pharmaceutical supply chain in production, warehousing, transportation and
demand from natural and man-made events with repercussions on commerce and the public wellbeing and safety.
Tornado/Windstorm
A violently rotating storm of small diameter; the most violent weather phenomenon. It is produced in a very severe thunderstorm
and appears as a funnel cloud extending from the base of a cumulonimbus to the ground. For this analysis, and for uniformity of
measuring, applicants should consider the frequency and severity of damages caused by tornadoes in your area. A windstorm is
when high wind speeds may pose a hazard or are life-threatening; non-tornadic winds greater than or equal to 40 mph lasting for
one hour or longer, or winds greater than or equal to 58 mph for any duration. Excludes dust storms.
Transportation Failure
The disruption of the movement of people, products or supplies through a given area due to the loss of transportation mainframes
including highways, railways or airports. This can be the result of natural or unnatural events such as plane crashes or train
derailment.
Water System or Sewer
Failure
Water supply contamination can be caused by naturally occurring events, a failure of the community water system, construction
damage and infrastructure failure that may result in a rapid onset of interruption. Other incremental interruptions may be due to
longer-term events such as drought or acute loss of one source of supply. Boil water orders may be required to ensure destruction of
all harmful bacteria and other microbes, to ensure the safety of water for drinking, cooking, and making ice. A wastewater
collection system or sanitary sewer system is defined as the network of pipes and pumping systems used to convey sanitary flow to
a wastewater treatment facility for treatment prior to discharge into the environment. A wastewater collection system is designed to
convey only sanitary flow, whereas a combined system is designed to convey sanitary and storm water flows.
12
PART II Impact Discussion and Planning Tool

13
PART II: PUBLIC HEALTH AND OTHER PARTICIPANT
COVER SHEET
Note: Public health will fill-out this worksheet as a group with agencies that do not fall under the hospital, primary care or behavioral health sectors.
**Please return your completed worksheet to the form checker**
Sectors: Public Health and Other
County:
Name (s) of Agency Representative(s):
Agencies/Organizations Contributing:
14
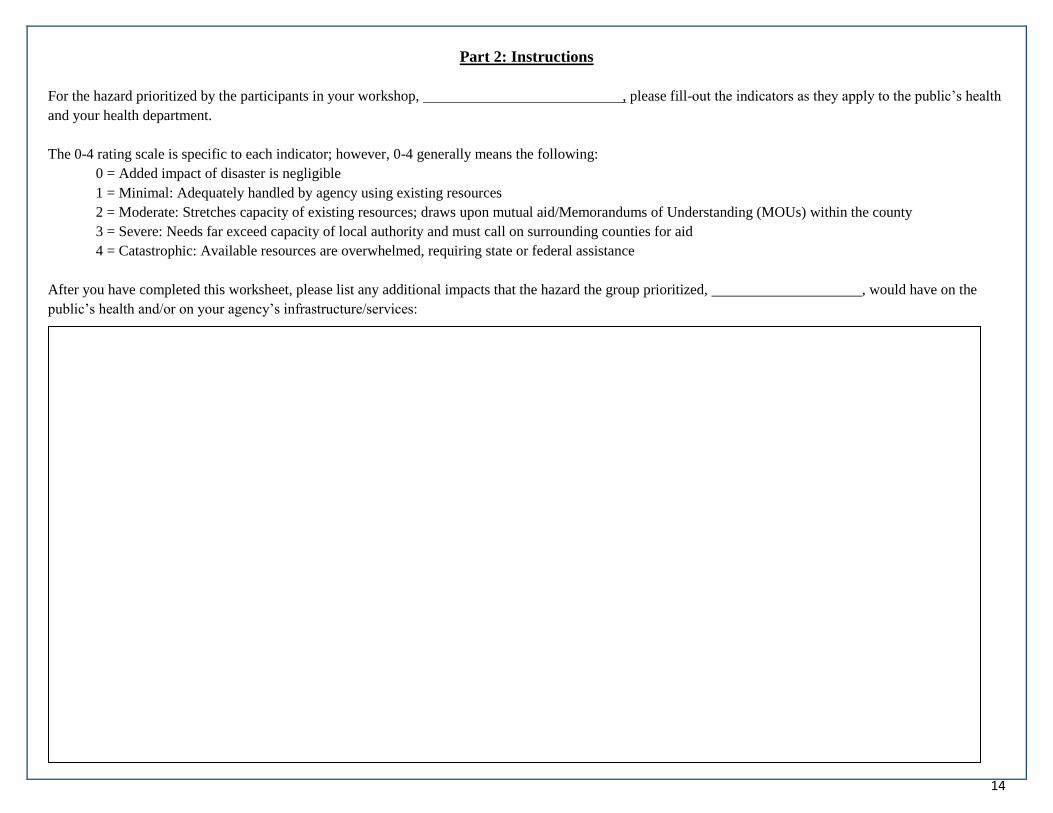
Part 2: Instructions
For the hazard prioritized by the participants in your workshop, , please fill-out the indicators as they apply to the public’s health
and your health department.
The 0-4 rating scale is specific to each indicator; however, 0-4 generally means the following:
0 = Added impact of disaster is negligible
1 = Minimal: Adequately handled by agency using existing resources
2 = Moderate: Stretches capacity of existing resources; draws upon mutual aid/Memorandums of Understanding (MOUs) within the county
3 = Severe: Needs far exceed capacity of local authority and must call on surrounding counties for aid
4 = Catastrophic: Available resources are overwhelmed, requiring state or federal assistance
After you have completed this worksheet, please list any additional impacts that the hazard the group prioritized, , would have on the
public’s health and/or on your agency’s infrastructure/services:

15
Public Health/Summary Indicators HUMAN IMPACT
Indicator Rating Scale (please check one only)
Water quality
The availability of potable
drinking water for residents
impacted by the hazard event.
[ ] 0 = No impact
[ ] 1 = Few households are without potable water service
[ ] 2 = Multiple households are without potable water service
[ ] 3 = Multiple households are without potable water service, and bottled water is scarce
[ ] 4 = Most households are without potable water service, and bottled water is scarce
Food security
The availability of a safe and
nutritious food supply for
residents impacted by the
hazard event.
[ ] 0 = No impact
[ ] 1 = Few households lack a safe and adequate food supply
[ ] 2 = Multiple households lack a safe and adequate food supply
[ ] 3 = Multiple households lack a safe and adequate food supply with some malnutrition
[ ] 4 = Multiple households lack a safe and adequate food supply with severe malnutrition
Infectious disease
The number of residents that
can be impacted by infectious
disease as a result of the hazard
event.
[ ] 0 = No impact
[ ] 1 = At-risk individuals impacted
[ ] 2 = Low potential for multiple illness & death
[ ] 3 = Medium potential for multiple illness & death
[ ] 4 = High potential for multiple illness & death
Fatalities
Fatalities that occur as a direct
result of the hazard event.
[ ] 0 = No impact
[ ] 1 = Fatalities are adequately handled by agency using existing resources
[ ] 2 = Fatalities stretch the capacity of existing resources; utilizes MOUs within the county
[ ] 3 = Fatalities exceed capacity of local authority; must call on surrounding counties for aid
[ ] 4 = Available resources are overwhelmed requiring significant state and/or federal resources
Impact on those with chronic
disease
The impact of the hazard on
individuals living with chronic
disease.
[ ] 0 = No impact
[ ] 1 = Few chronic disease-related injuries from the event
[ ] 2 = Multiple minor injuries or possible major injury
[ ] 3 = Multiple major injuries or possible death
[ ] 4 = Multiple major injuries and deaths
Mass Care
The ability to provide feeding
centers, basic first aid, bulk
distribution of needed items,
and related services to persons
affected by the hazard event.
[ ] 0 = No impact
[ ] 1 = Mass care adequately handled by agency using existing resources
[ ] 2 = Mass care stretches capacity of existing resources; utilizes MOUs within the county
[ ] 3 = Mass care exceeds capacity of local authority; must call on surrounding counties for aid
[ ] 4 = Mass care needs overwhelm county, requiring significant state and/or federal resources
Sheltering
Temporary housing for people
affected by the hazard event
including at-risk individuals.
Someone whose housing lacks
[ ] 0 = No impact
[ ] 1 = Sheltering and mass care adequately handled by agency using existing resources
[ ] 2 = Sheltering and mass care stretch capacity of existing resources; utilizes MOUs within the county
[ ] 3 = Sheltering and mass care exceed capacity of local authority; must call on surrounding counties for aid
[ ] 4 = Sheltering and mass care needs overwhelm county, requiring significant state and/or federal resources

16
heat in winter qualifies.
Family assistance center
Family assistance typically
involves a range of services
provided by local, state, and
federal agencies as well as
nonprofits and private
organizations.
[ ] 0 = No impact
[ ] 1 = Family assistance needs adequately handled by agency using existing resources
[ ] 2 = Family assistance needs stretch capacity of existing resources; utilizes MOUs within the county
[ ] 3 = Family assistance needs exceed capacity of local authority; must call on surrounding counties for aid
[ ] 4 = Family assistance needs overwhelm county, requiring significant state and/or federal resources
Community resources,
linkages, and assistance
The ability of local residents to
know who, where and how to
seek assistance after the hazard
event.
[ ] 0 = No impact
[ ] 1 = >75% of survivors know where and how to seek help
[ ] 2 = 50-75% of survivors know where and how to seek help
[ ] 3 = 25-49% of survivors know where and how to seek help
[ ] 4 = Survivors are unfamiliar with available resources/assistance
At-risk individuals
Individuals who may have
greater difficulty accessing the
public health and medical
services they require following
a disaster or emergency.
[ ] 0 = No impact
[ ] 1 = Outreach to at-risk individuals adequately handled by agency using existing resources
[ ] 2 = Outreach to at-risk individuals stretches capacity of existing resources; utilizes MOUs within the county
[ ] 3 = Outreach to at-risk individuals exceeds capacity of local authority; must call on surrounding counties for aid
[ ] 4 = Outreach to at-risk individuals overwhelms county, requiring significant state and/or federal resources
INFRASTRUCTURE IMPACT
Infrastructure Impact – Public Health
Public health facilities
The percentage of public health
facilities and structures which
remain operable and open to
patients during the hazard
event.
[ ] 0 = No impact
[ ] 1 = >75% of facilities and structures in place
[ ] 2 = 50%-75% of facilities and structures in place
[ ] 3 = 25%-49% of facilities and structures in place
[ ] 4 = Facilities and structures not in place/destroyed
Public health communications
The percentage of
communication systems that are
operable during and after the
hazard event.
[ ] 0 = No impact
[ ] 1 = >75% of communications systems in place
[ ] 2 = 50%-75% of communications systems in place
[ ] 3 = 25%-49% of communications systems in place
[ ] 4 = Communications systems not in place/destroyed
Services Impact – Public Health
Public health services
The percentage of public health
services that are operational
during an event.
[ ] 0 = No impact
[ ] 1 = >75% of normal public health services are operational
[ ] 2 = 50%-75% of normal public health services are operational
[ ] 3 = 25%-49% of normal public health services are operational
[ ] 4 = Essential services are near or at complete cessation

17
Public health personnel
The percentage of public health
personnel that are available to
work during the hazard event.
[ ] 0 = No impact
[ ] 1 = >75% of personnel will be available to work an event
[ ] 2 = 50%-75% of public health personnel will be available to work an event
[ ] 3 = 25%-49% of public health personnel will be available to work an event
[ ] 4 = No public health personnel will be available to work an event
Public health surge
The change in demand for
public health services that is
directly related to the hazard
event.
[ ] 0 = No impact
[ ] 1 = Public health surge is minimal, adequately handled using existing resources
[ ] 2 = Public health surge is moderate, utilizes MOUs within the county
[ ] 3 = Public health surge is severe, must call on surrounding counties for aid
[ ] 4 = Public health surge is catastrophic requiring significant state and/or federal resources
Time to resume essential
public health services
The amount of time needed
after the hazard event to restore
essential services.
[ ] 0 = No impact
[ ] 1 = 12-24 hours; adequately handled using existing resources
[ ] 2 = 25-72 hours; utilizes MOUs within the county
[ ] 3 = 73 hours – 1 week; must call on surrounding counties for aid to restore essential services
[ ] 4 = Greater than 1 week; requires significant state and/or federal resources to restore essential services
Services Impact – Other
Pharmacy/dispensing
The percentage of
pharmacy/dispensing facilities,
systems and structures that
remain operable and open to
patients during the hazard
event.
[ ] 0 = No impact
[ ] 1 = >75% of systems in place
[ ] 2 = 50%-75% of systems in place; utilizes MOUs within the county
[ ] 3 = 25%-49% of systems in place; must call on surrounding counties for aid
[ ] 4 = Dispensing systems near or at complete cessation; requires significant state and/or federal resources,
including the Strategic National Stockpile
Emergency transport
The number of emergency
transport requests by residents
in the county that are above
baseline for the area.
[ ] 0 = No impact
[ ] 1 = Demand for emergency medical services is adequately handled using existing resources
[ ] 2 = Demand for emergency medical services is moderate, utilizes MOUs within the county
[ ] 3 = Demand for emergency medical services is severe, must call on surrounding counties for aid
[ ] 4 = Demand for emergency medical services is catastrophic requiring significant state and/or federal resources

18
Sector: Hospital
County:
Name (s) of Agency Representative(s):
Agency/Organization:
PART II: HOSPITAL PARTICIPANT COVER SHEET
Note: For this activity you will be split into groups according to agency. Each agency represented in this workshop should fill-out a separate impact worksheet. If
more than one representative from your agency is present at this workshop, please return a single worksheet for your agency to the form checker.
**Please return your completed worksheet to the form checker**

19
Part 2: Instructions
For the hazard prioritized by the participants in your workshop, , please fill-out the indicators as they apply to your hospital.
The 0-4 rating scale is specific to each indicator; however, 0-4 generally means the following:
0 = Added impact of disaster is negligible
1 = Minimal: Adequately handled by agency using existing resources
2 = Moderate: Stretches capacity of existing resources; draws upon mutual aid/Memorandums of Understanding (MOUs) within the county
3 = Severe: Needs far exceed capacity of local authority and must call on surrounding counties for aid
4 = Catastrophic: Available resources are overwhelmed, requiring state or federal assistance
After you have completed this worksheet, please list any additional impacts that the hazard you prioritized, , would have on the public’s
health and/or on your agency’s infrastructure/services:

20
Hospital Indicators Human Impact -- Hospitals
ER visits
The number of ER visits by
residents in the community that
are above baseline for the area.
[ ] 0 = No impact
[ ] 1 = Visits increase but are adequately handled by agency using existing resources
[ ] 2 = Visits stretch capacity of existing resources
[ ] 3 = Visits far exceed capacity of hospital – surge plans implemented
[ ] 4 = ER overwhelmed, requiring significant state and/or federal resources
Hospital outpatient visits
The number of outpatient
appointments that are
maintained during the hazard
event.
[ ] 0 = No impact
[ ] 1 = >75% of appointments kept
[ ] 2 = 50%-75% of appointments kept
[ ] 3 = 25%-49% of appointments kept
[ ] 4 = Impossible for patients to keep appointments due to incident
Hospital inpatients
The number of patients that are
admitted to the hospital as a
result of the hazard.
[ ] 0 = No impact
[ ] 1 = Demand for hospital beds is increased but is less than hospital capacity
[ ] 2 = Demand for hospital beds is equal to capacity; local MOUs implemented
[ ] 3 = Demand for hospital beds exceeds capacity requiring help from surrounding counties
[ ] 4 = Demand for hospital beds far exceeds capacity requiring significant state and/or federal resources
Infrastructure Impact -- Hospitals
Hospital facilities
The percentage of hospital
facilities and structures that
remain operable and open to
patients during the hazard
event.
[ ] 0 = No impact
[ ] 1 = >75% of facilities and structures in place
[ ] 2 = 50%-75% of facilities and structures in place
[ ] 3 = 25%-49% of facilities and structures in place
[ ] 4 = Facilities and structures in place not in place/destroyed
Communications
The percentage of
communication systems that are
operable during and after the
hazard event.
[ ] 0 = No impact
[ ] 1 = >75% of communications systems in place
[ ] 2 = 50%-75% of communications systems in place
[ ] 3 = 25%-49% of communications systems in place
[ ] 4 = Communications systems not in place/destroyed
Utilities
The percentage of utilities
(water, sewer, electric, gas, etc.)
that are operable during and
after the hazard event.
[ ] 0 = No impact
[ ] 1 = >75% of utilities in place
[ ] 2 = 50%-75% of utilities in place
[ ] 3 = 25%-49% of utilities in place
[ ] 4 = Utilities not in place/destroyed
Services Impact – Hospitals
Capacity
The percentage of hospital
services that are operational
during a hazard event.
[ ] 0 = No impact
[ ] 1 = >75% of capabilities in place
[ ] 2 = 50%-75% of capabilities in place
[ ] 3 = 25%-49% of capabilities in place
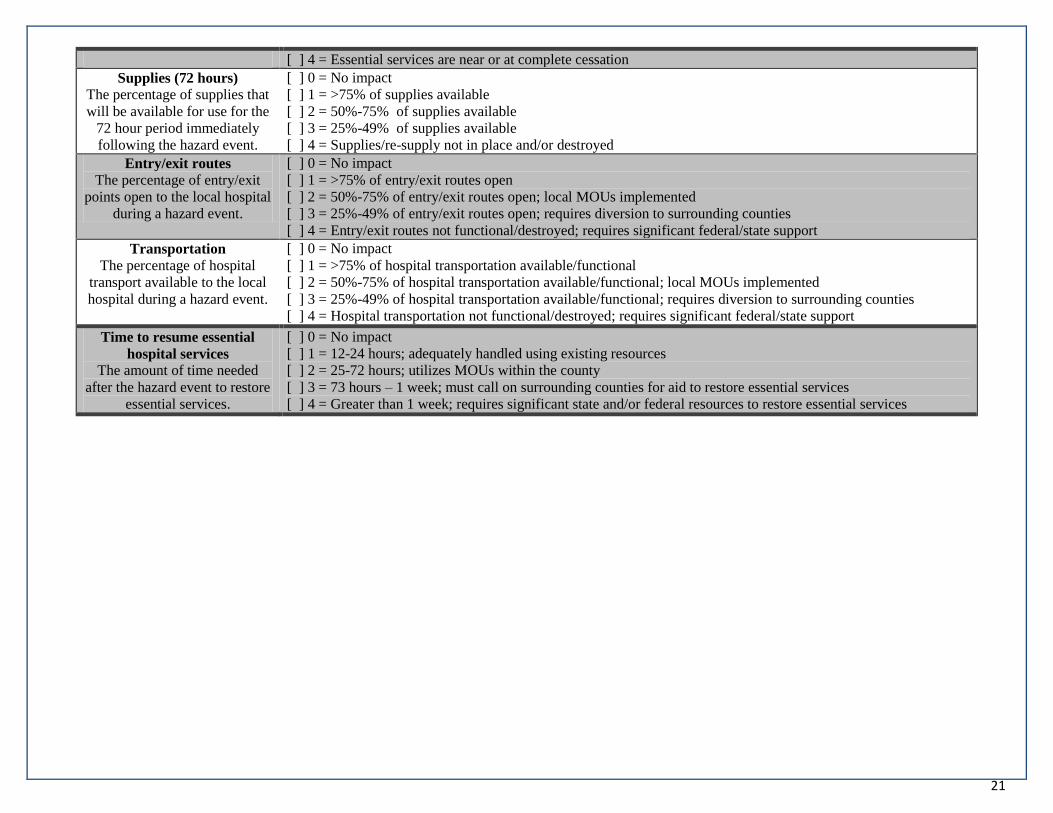
21
[ ] 4 = Essential services are near or at complete cessation
Supplies (72 hours)
The percentage of supplies that
will be available for use for the
72 hour period immediately
following the hazard event.
[ ] 0 = No impact
[ ] 1 = >75% of supplies available
[ ] 2 = 50%-75% of supplies available
[ ] 3 = 25%-49% of supplies available
[ ] 4 = Supplies/re-supply not in place and/or destroyed
Entry/exit routes
The percentage of entry/exit
points open to the local hospital
during a hazard event.
[ ] 0 = No impact
[ ] 1 = >75% of entry/exit routes open
[ ] 2 = 50%-75% of entry/exit routes open; local MOUs implemented
[ ] 3 = 25%-49% of entry/exit routes open; requires diversion to surrounding counties
[ ] 4 = Entry/exit routes not functional/destroyed; requires significant federal/state support
Transportation
The percentage of hospital
transport available to the local
hospital during a hazard event.
[ ] 0 = No impact
[ ] 1 = >75% of hospital transportation available/functional
[ ] 2 = 50%-75% of hospital transportation available/functional; local MOUs implemented
[ ] 3 = 25%-49% of hospital transportation available/functional; requires diversion to surrounding counties
[ ] 4 = Hospital transportation not functional/destroyed; requires significant federal/state support
Time to resume essential
hospital services
The amount of time needed
after the hazard event to restore
essential services.
[ ] 0 = No impact
[ ] 1 = 12-24 hours; adequately handled using existing resources
[ ] 2 = 25-72 hours; utilizes MOUs within the county
[ ] 3 = 73 hours – 1 week; must call on surrounding counties for aid to restore essential services
[ ] 4 = Greater than 1 week; requires significant state and/or federal resources to restore essential services

22
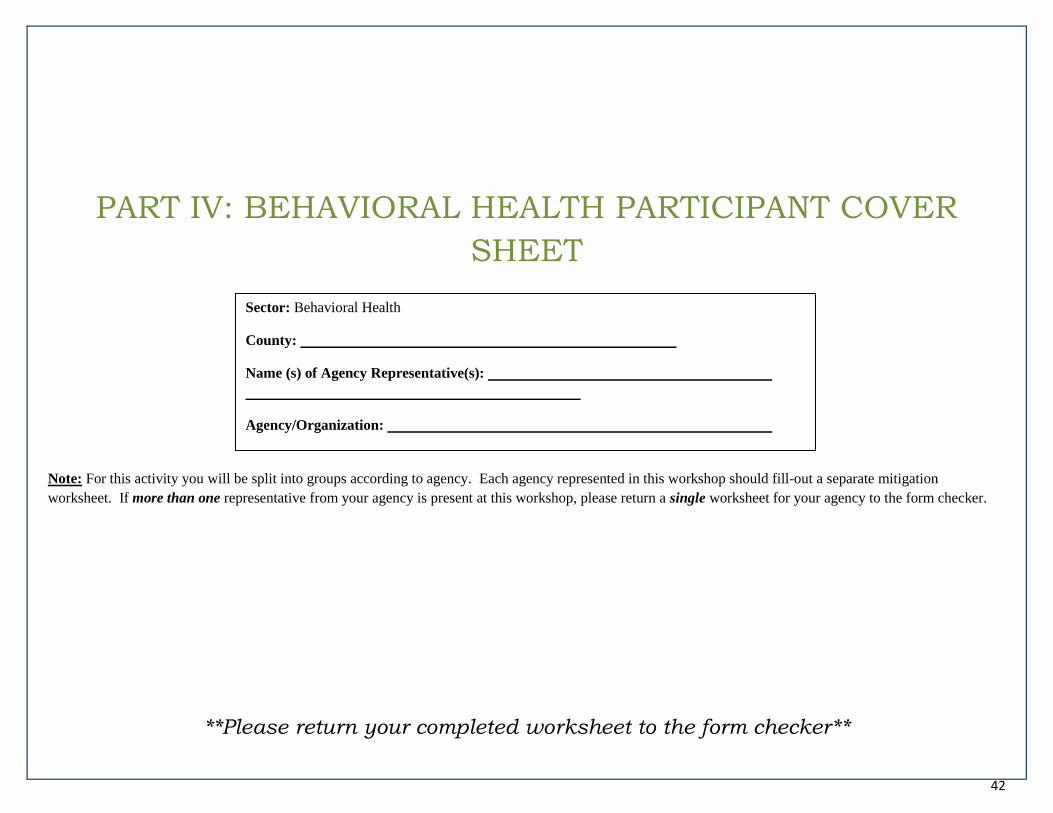
Sector: Behavioral Health
County:
Name (s) of Agency Representative(s):
Agency/Organization:
PART II: BEHAVIORAL HEALTH PARTICIPANT COVER
SHEET
Note: For this activity you will be split into groups according to agency. Each agency represented in this workshop should fill-out a separate impact worksheet. If
more than one representative from your agency is present at this workshop, please return a single worksheet for your agency to the form checker.
**Please return your completed worksheet to the form checker**
23
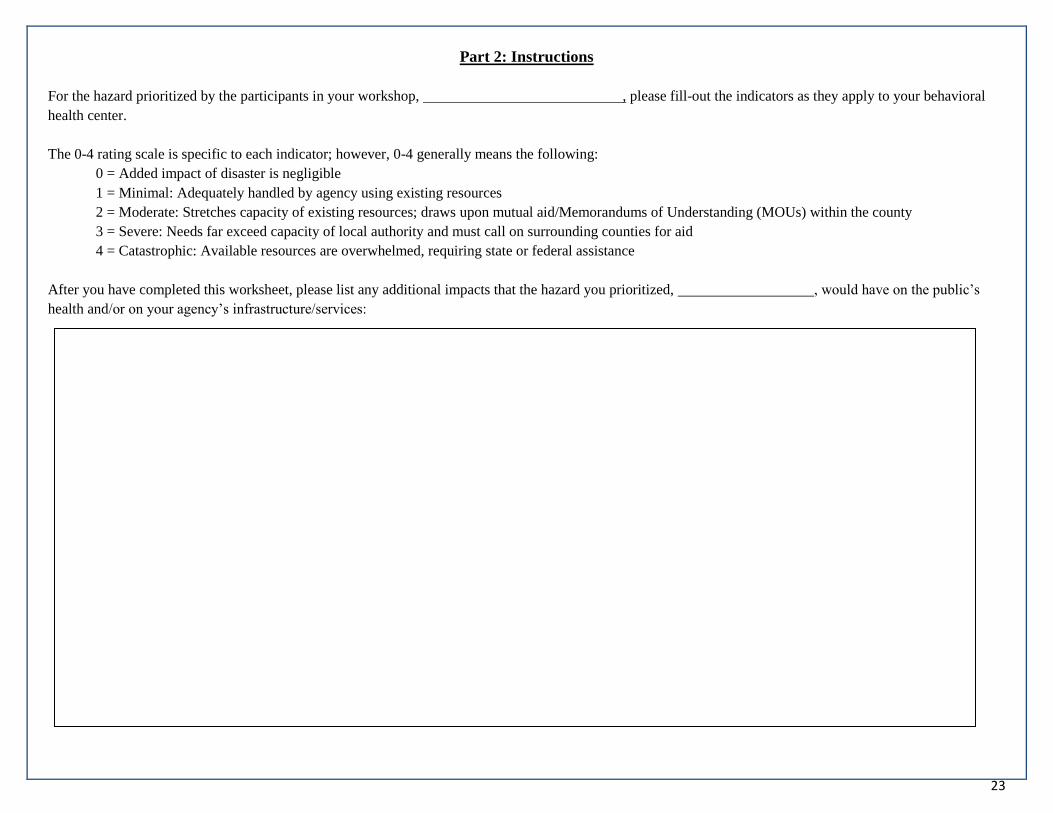
Part 2: Instructions
For the hazard prioritized by the participants in your workshop, , please fill-out the indicators as they apply to your behavioral
health center.
The 0-4 rating scale is specific to each indicator; however, 0-4 generally means the following:
0 = Added impact of disaster is negligible
1 = Minimal: Adequately handled by agency using existing resources
2 = Moderate: Stretches capacity of existing resources; draws upon mutual aid/Memorandums of Understanding (MOUs) within the county
3 = Severe: Needs far exceed capacity of local authority and must call on surrounding counties for aid
4 = Catastrophic: Available resources are overwhelmed, requiring state or federal assistance
After you have completed this worksheet, please list any additional impacts that the hazard you prioritized, , would have on the public’s
health and/or on your agency’s infrastructure/services:
24
Behavioral Health Indicators Human Impact – Behavioral Health
Emotional impact – short-term
The percentage of people impacted by
the hazard event who experience short-
term emotional reactions such as fear,
anxiety and depression. Emotional
impact is a mental state that arises
spontaneously rather than through a
conscious effort and is often
accompanied by physiological changes.
[ ] 0 = No impact
[ ] 1 = <25% of survivors will experience short-term reactions
[ ] 2 = 25-49% of survivors will experience short-term reactions
[ ] 3 = 50-75% of survivors will experience short-term reactions
[ ] 4 = >75% of survivors will experience short-term reactions
Emotional impact – long-term
The percentage of people impacted by
the hazard event who experience long-
term emotional reactions such as fear,
anxiety and depression. Emotional
impact is a mental state that arises
spontaneously rather than through a
conscious effort and is often
accompanied by physiological changes.
[ ] 0 = No impact
[ ] 1 = <10% of survivors will experience long-term reactions
[ ] 2 = 10-25% of survivors will experience long-term reactions
[ ] 3 = 26-50% of survivors will experience long-term reactions
[ ] 4 = >50% of survivors will experience long-term reactions
Infrastructure Impact – Behavioral Health
Behavioral health facilities
The percentage of behavioral health
facilities that remain operable and
open to patients during the hazard
event.
[ ] 0 = No impact
[ ] 1 = >75% of structures and systems in place
[ ] 2 = 50%-75% of structures and systems in place
[ ] 3 = 25%-49% of structures and systems in place
[ ] 4 = Structures and systems not in place/destroyed
Behavioral health communications
The percentage of communication
systems that are operable during and after
the hazard event.
[ ] 0 = No impact
[ ] 1 = >75% of communications systems in place
[ ] 2 = 50%-75% of communications systems in place
[ ] 3 = 25%-49% of communications systems in place
[ ] 4 = Communications systems not in place/destroyed
Behavioral health utilities
The percentage of utilities (water, sewer,
electric, gas, etc.) that are operable
during the hazard event.
[ ] 0 = No impact
[ ] 1 = >75% of utilities in place
[ ] 2 = 50%-75% of utilities in place
[ ] 3 = 25%-49% of utilities in place
[ ] 4 = Utilities not in place/destroyed
Services Impact – Behavioral Health

25
Behavioral health services
The percentage of behavioral health
services that are operational during the
hazard event.
[ ] 0 = No impact
[ ] 1 = >75% of services in place
[ ] 2 = 50%-75% of services in place
[ ] 3 = 25%-49% of services in place
[ ] 4 = Essential services are near or at complete cessation
Behavioral health personnel
The percentage of behavioral health
personnel that is available to work during
the hazard event.
[ ] 0 = No impact
[ ] 1 = >75% of personnel will be available to work the hazard event
[ ] 2 = 50%-75% of personnel will be available to work the hazard event
[ ] 3 = 25%-49% of personnel will be available to work the hazard event
[ ] 4 = No personnel will be available to work the hazard event
Time to resume essential behavioral
health services
The amount of time needed after the
hazard event to restore essential services.
[ ] 0 = No impact
[ ] 1 = 12-24 hours; adequately handled using existing resources
[ ] 2 = 25-72 hours; utilizes MOUs within the county
[ ] 3 = 73 hours – 1 week; must call on surrounding counties for aid to restore essential services
[ ] 4 = Greater than 1 week; requires significant state and/or federal resources to restore essential services

26
Sector: Primary Care/Health Center
County:
Name (s) of Agency Representative(s):
Agency/Organization:
PART II: PRIMARY CARE PARTICIPANT COVER SHEET
Note: For this activity you will be split into groups according to agency. Each agency represented in this workshop should fill-out a separate impact worksheet. If
more than one representative from your agency is present at this workshop, please return a single worksheet for your agency to the form checker.
**Please return your completed worksheet to the form checker**
27
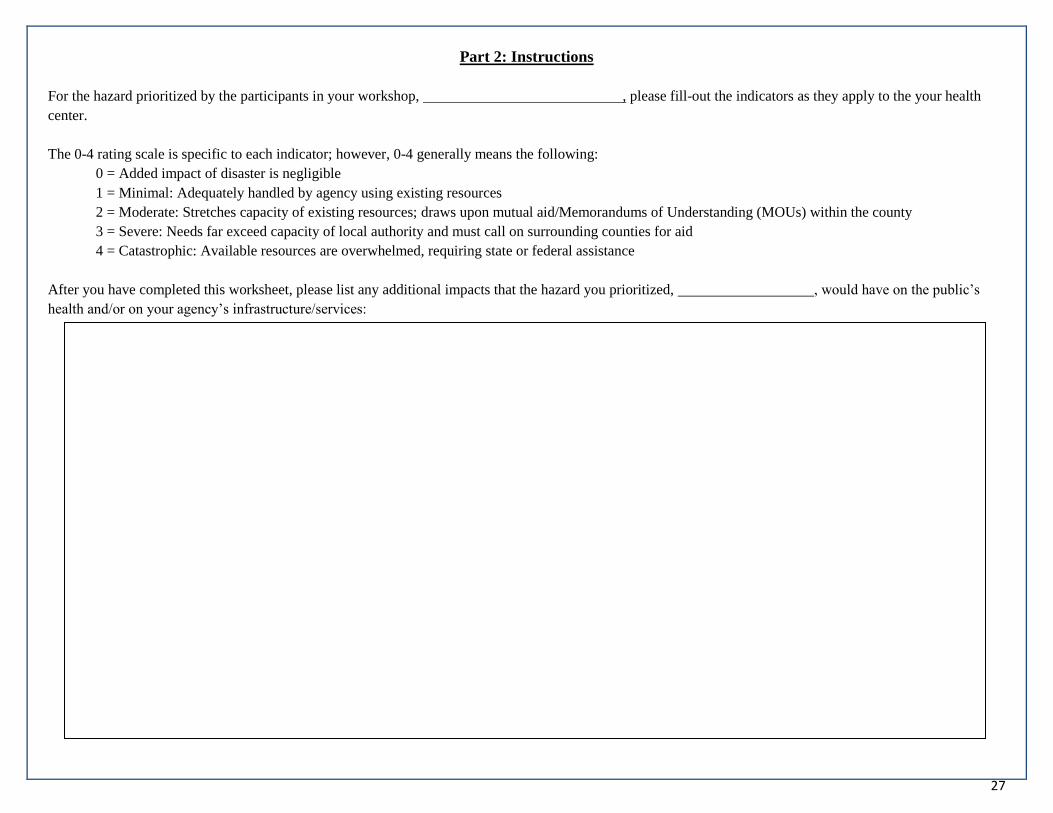
Part 2: Instructions
For the hazard prioritized by the participants in your workshop, , please fill-out the indicators as they apply to the your health
center.
The 0-4 rating scale is specific to each indicator; however, 0-4 generally means the following:
0 = Added impact of disaster is negligible
1 = Minimal: Adequately handled by agency using existing resources
2 = Moderate: Stretches capacity of existing resources; draws upon mutual aid/Memorandums of Understanding (MOUs) within the county
3 = Severe: Needs far exceed capacity of local authority and must call on surrounding counties for aid
4 = Catastrophic: Available resources are overwhelmed, requiring state or federal assistance
After you have completed this worksheet, please list any additional impacts that the hazard you prioritized, , would have on the public’s
health and/or on your agency’s infrastructure/services:

28
Primary Care/Health Center Indicators Human Impact – Primary Care/Health Centers
Primary care clinical visits
The percentage of patients who maintain
their primary care appointments during
and immediately after the hazard event.
[ ] 0 = No impact
[ ] 1 = >75% of appointments kept
[ ] 2 = 50%-75% of appointments kept
[ ] 3 = 25%-49% of appointments kept
[ ] 4 = Impossible for patients to keep appointments due to the hazard event
Infrastructure Impact – Primary Care/Health Centers
Health center facilities
The percentage of health facilities,
systems and structures which
remain operable and open to
patients during the hazard event.
[ ] 0 = No impact
[ ] 1 = >75% of structures and systems in place
[ ] 2 = 50%-75% of structures and systems in place
[ ] 3 = 25%-49% of structures and systems in place
[ ] 4 = Structures and systems not in place/destroyed
Communications
The percentage of communication
systems that are operable during and
after the hazard event.
[ ] 0 = No impact
[ ] 1 = >75% of communications systems in place
[ ] 2 = 50%-75% of communications systems in place
[ ] 3 = 25%-49% of communications systems in place
[ ] 4 = Communications systems not in place/destroyed
Utilities
The percentage of utilities (water,
sewer, electric, gas, etc.) that are
operable during the hazard event.
[ ] 0 = No impact
[ ] 1 = >75% of utilities in place
[ ] 2 = 50%-75% of utilities in place
[ ] 3 = 25%-49% of utilities in place
[ ] 4 = Utilities not in place/destroyed
Services Impact – Primary Care/Health Centers
Capacity
The percentage of primary care services
which are operational during the hazard
event.
[ ] 0 = No impact
[ ] 1 = >75% of capabilities in place
[ ] 2 = 50%-75% of capabilities in place
[ ] 3 = 25%-49% of capabilities in place
[ ] 4 = Essential services are near or at complete cessation
Supplies (72 hours)
The percentage of supplies that will be
available for use for the 72 hour period
immediately following the hazard event.
[ ] 0 = No impact
[ ] 1 = >75% of supplies available
[ ] 2 = 50%-75% of supplies available
[ ] 3 = 25%-49% of supplies available
[ ] 4 = Supplies/re-supply not in place and/or destroyed
Time to resume essential primary
care services
The amount of time needed after the
hazard event to restore essential
services.
[ ] 0 = No impact
[ ] 1 = 12-24 hours; adequately handled using existing resources
[ ] 2 = 25-72 hours; utilizes MOUs within the county
[ ] 3 = 73 hours – 1 week; must call on surrounding counties for aid to restore essential services
[ ] 4 = Greater than 1 week; requires significant state and/or federal resources to restore essential services

29
PART III Community Mitigation Planning Tool

30
PART III: INSTRUCTIONS
Note: This is a group activity. Please decide as a group what box to check for each of the following community mitigation indicators. Because this is a group
activity, you do not need to fill-out the worksheet. The group’s answers will be recorded by the workshop’s note-taker.

31
Mitigation – Community
The following questions relate to your county/community as a whole.
1. Please use the space below to list additional resources your county has in place that could reduce disaster losses in the future:
2. In the past five years, has your county held exercises and/or formed coalitions involving agencies/advocates representing any of the following populations:
Question Yes No Coalition (s) Year (s) of
coalition
Exercise Year (s) of
exercise
2a. Older adults
2b. Children
2c. Persons with disabilities
2d. Persons with chronic conditions
2e. Persons with limited English
2f. Ethnic minorities
2g. Incarcerated persons
2h. Persons with behavioral health needs
2i. Transient populations (i.e. migrant workers,
temporary workers, university students,
homeless)
2j. The private sector
2k. Faith communities
2l. Other:
3. Does your county have an at-risk individuals (special populations) registry (please circle)? Yes No

32
4. Please check the box to indicate the status of your county plans:
Other:
Participants
are not aware
of this plan.
0: My
county has
no plan.
1: My county
has a written
plan.
2: My county has a
written plan, and it
has been reviewed
in the past 12
months.
3: My county has a written
plan, which has been
reviewed in the past 12
months and exercised in the
last 5 years.
4: My county has a written
plan, which has been
reviewed in the past 12
months and used in a real
event in the last 5 years.
Pet sheltering
Large animal sheltering
Donations management
(Annex of Emergency
Operations Plan)
Volunteer management
(Annex of Emergency
Operations Plan)
Fatality management
(Annex of Emergency
Operations Plan)
5. In the past five years, has your county:
Question Event (if applicable) Year (s) Yes No
5a. Opened a family assistance center?
5b. Opened a shelter?

33
PART IV Agency Mitigation Planning Tool
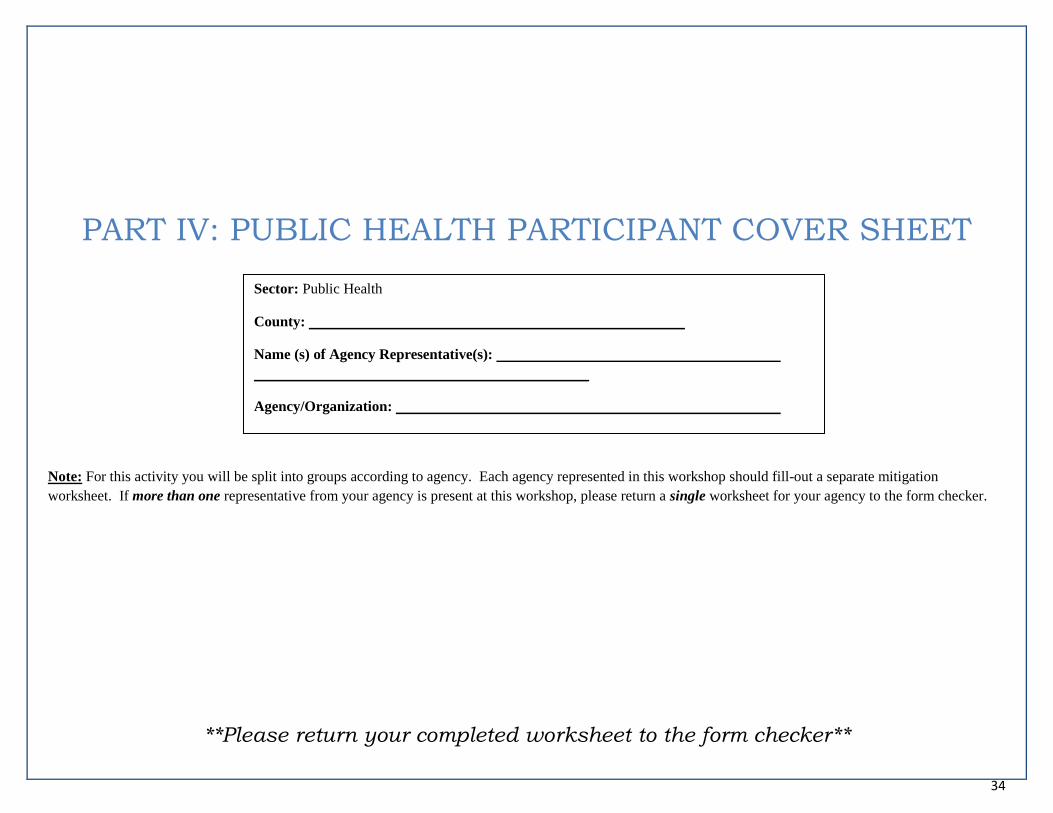
34
Sector: Public Health
County:
Name (s) of Agency Representative(s):
Agency/Organization:
PART IV: PUBLIC HEALTH PARTICIPANT COVER SHEET
Note: For this activity you will be split into groups according to agency. Each agency represented in this workshop should fill-out a separate mitigation
worksheet. If more than one representative from your agency is present at this workshop, please return a single worksheet for your agency to the form checker.
**Please return your completed worksheet to the form checker**

35
Mitigation -- Public Health
1. Please check the box to indicate the status of your public health plans:
0: My
agency has
no plan.
1: My agency
has a written
plan.
2: My agency has a
written plan, and it has
been reviewed in the
past 12 months.
3: My agency has a written
plan, which has been reviewed
in the past 12 months and
exercised in the last 5 years.
4: My agency has a written
plan, which has been reviewed
in the past 12 months and used
in a real event in the last 5
years.
All Hazards Plan
Annex specific to the top
hazard identified in this
workshop
Strategic National Stockpile
(SNS) Plan
Pan Flu Plan
Smallpox Plan
Continuity of Operations
(COOP) Plan
Crisis and Emergency Risk
Communications (CERC) Plan
2. Rate the level of Incident Command System (ICS) Training your public health staff have completed:
[ ] 0: No staff have completed ICS training.
[ ] 1: 1-25% of staff have completed ICS training for their respective roles.
[ ] 2: 26-50% of staff have completed ICS training for their respective roles.
[ ] 3: 51-75% of staff have completed ICS training for their respective roles.
[ ] 4: 76-100% of staff have completed ICS training for their respective roles.
3. Prior to this workshop, please check the box to indicate the partnerships public health had with the following groups:
0: My agency does
not meet or
communicate with
this group.
1: My agency
has met or
talked with this
group.
2: My agency has a
written understanding
with this group, which
has been reviewed in
the past 12 months.
3: My agency has a written
understanding, which has been
reviewed in the past 12 months
and exercised in the last 5
years.
4: My agency has a written
understanding, which has been
reviewed in the past 12 months
and activated in a real event in
the last 5 years.
Regional
Epidemiologist
Regional
Environmental Health
Local Primary Care

36
Centers/Health Centers
Local Emergency
Management
Authority/Office of
Emergency Services
City/County/State Law
Enforcement
Local Fire Department
Local Emergency
Medical Services
Local Hospitals
Local Pharmacies
Local Behavioral
Health Centers
Local
Schools/Colleges/
Universities
Local Public Service
Districts
County/City Solid
Waste Authority
Local Funeral
Homes/Mortuary
Services
Local Emergency
Planning Committee
(LEPC)
Local long-term care
facilities
American Red Cross,
WV Region
Other:
Other:
4. In the past five years, has public health:
Question Event (if applicable) Year (s) Yes No
4a. Required additional staffing for an event?
4b. Implemented Memorandums of Understanding
(MOUs) with partners?
4c. Been a partner in shelter set-up and/or management?
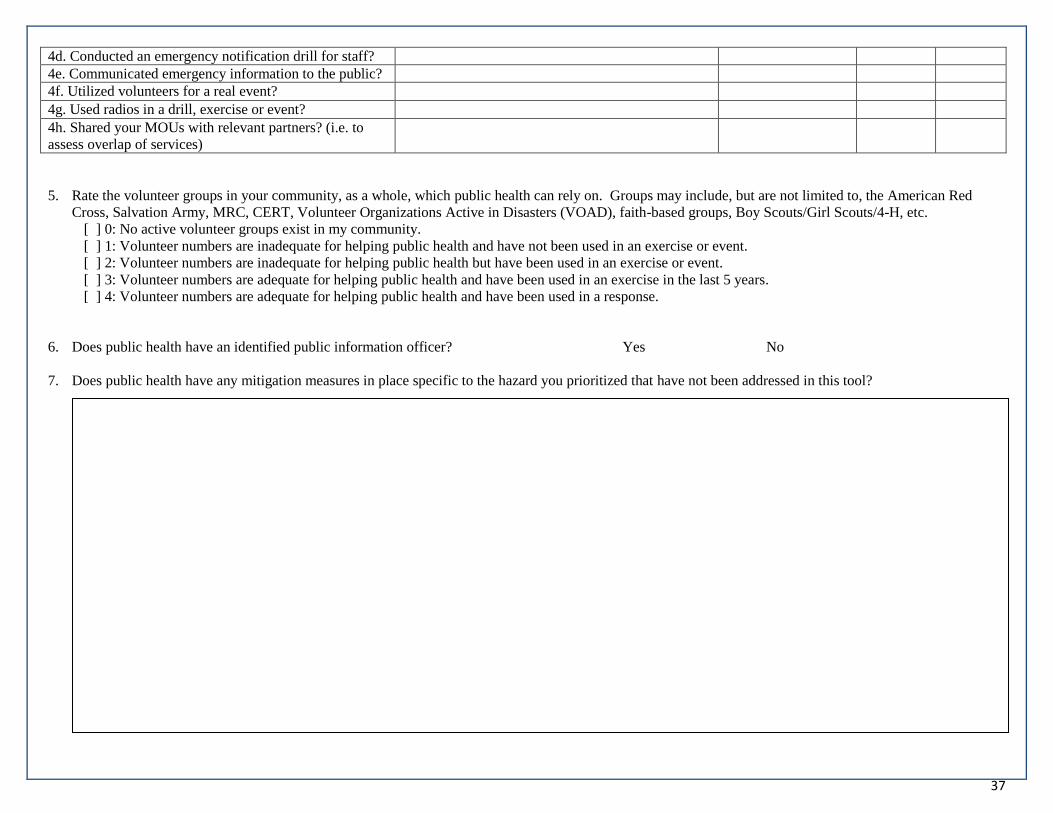
37
4d. Conducted an emergency notification drill for staff?
4e. Communicated emergency information to the public?
4f. Utilized volunteers for a real event?
4g. Used radios in a drill, exercise or event?
4h. Shared your MOUs with relevant partners? (i.e. to
assess overlap of services)
5. Rate the volunteer groups in your community, as a whole, which public health can rely on. Groups may include, but are not limited to, the American Red
Cross, Salvation Army, MRC, CERT, Volunteer Organizations Active in Disasters (VOAD), faith-based groups, Boy Scouts/Girl Scouts/4-H, etc.
[ ] 0: No active volunteer groups exist in my community.
[ ] 1: Volunteer numbers are inadequate for helping public health and have not been used in an exercise or event.
[ ] 2: Volunteer numbers are inadequate for helping public health but have been used in an exercise or event.
[ ] 3: Volunteer numbers are adequate for helping public health and have been used in an exercise in the last 5 years.
[ ] 4: Volunteer numbers are adequate for helping public health and have been used in a response.
6. Does public health have an identified public information officer? Yes No
7. Does public health have any mitigation measures in place specific to the hazard you prioritized that have not been addressed in this tool?
38
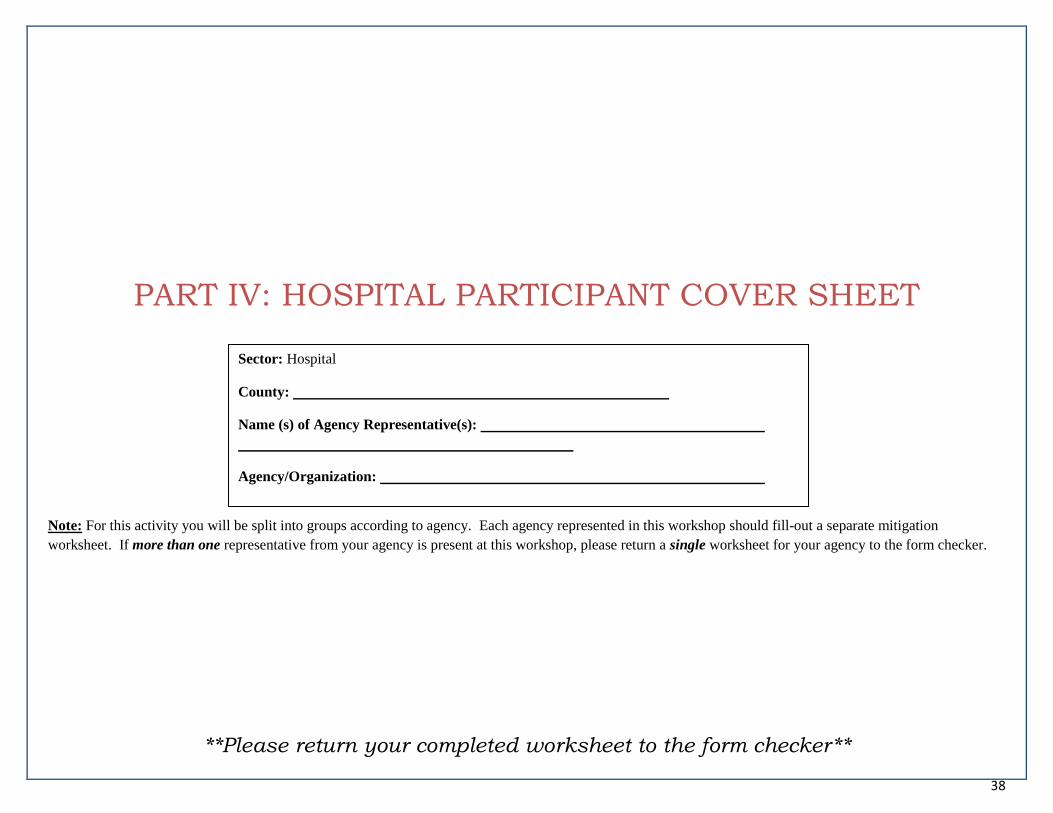
Sector: Hospital
County:
Name (s) of Agency Representative(s):
Agency/Organization:
PART IV: HOSPITAL PARTICIPANT COVER SHEET
Note: For this activity you will be split into groups according to agency. Each agency represented in this workshop should fill-out a separate mitigation
worksheet. If more than one representative from your agency is present at this workshop, please return a single worksheet for your agency to the form checker.
**Please return your completed worksheet to the form checker**

39
Mitigation – Hospitals
The next set of questions is focused on your hospital.
1. Please check the box to indicate the status of the following plans specific to your hospital:
0: My
agency has
no plan.
1: My agency
has a written
plan.
2: My agency has a
written plan, and it
has been reviewed in
the past 12 months.
3: My agency has a written
plan, which has been reviewed
in the past 12 months and
exercised in the last 5 years.
4: My agency has a written
plan, which has been reviewed
in the past 12 months and used
in a real event in the last 5
years.
Emergency Operations Plan
Annex specific to the top
hazard identified in this
workshop
Emergency Management Plan
Individual “Code Response”
Policy
Patient Evacuation Plans
Plans for Drills and Exercises
for Various Event Responses
2. Rate the level of Hospital Incident Command System (HICS) Training your hospital staff members have completed.
[ ] NA: No agency representative is present at this workshop.
[ ] 0: No staff have completed HICS training.
[ ] 1: 1-25% of staff have completed HICS training for their respective roles.
[ ] 2: 26-50% of staff have completed HICS training for their respective roles.
[ ] 3: 51-75% of staff have completed HICS training for their respective roles.
[ ] 4: 76-100% of staff have completed HICS training for their respective roles.
3. Prior to this workshop, please check the box to indicate the partnerships your hospital had with the following groups:
0: My agency
does not meet or
communicate
with this group.
1: My agency
has met or
talked with
this group.
2: My agency has a
written understanding
with this group,
which has been
reviewed in the past
12 months.
3: My agency has a written
understanding, which has been
reviewed in the past 12
months and exercised in the
last 5 years.
4: My agency has a written
understanding, which has been
reviewed in the past 12 months and
activated in a real event in the last 5
years.
WVHA Disaster
Taskforce

40
Local Emergency
Management
Authority/Office of
Emergency Services
City/County/State Law
Enforcement
Local Fire Department
Local Emergency
Medical Services (EMS)
County Health
Department
Local Pharmacies
Local Behavioral Health
Centers
Local Emergency
Planning Committee
(LEPC)
WV REDI
Other:
Other:
4. In the past five years, has your hospital:
Question Event (if applicable) Year (s) Yes No
4a. Required additional staffing for an event?
4b. Implemented Memorandums of Understanding
(MOUs) with partners?
4c. Been a partner in shelter set-up and/or management?
4d. Conducted an emergency notification drill for staff?
4e. Communicated emergency information to the public?
4f. Utilized volunteers for a real event?
4g. Used radios in a drill, exercise or event?
4h. Shared your MOUs with relevant partners? (i.e. to
assess overlap of services)
5. Rate the volunteer groups in your community, as a whole, which your hospital can rely on. Groups may include, but are not limited to, the American Red
Cross, Salvation Army, MRC, CERT, Volunteer Organizations Active in Disasters (VOAD), faith-based groups, Boy Scouts/Girl Scouts/4-H, etc.
[ ] NA: My hospital does not rely on/engage volunteers in response
[ ] 0: No active volunteer groups exist in my community.

41
[ ] 1: Volunteer numbers are inadequate for helping my hospital and have not been used in an exercise or event.
[ ] 2: Volunteer numbers are inadequate for helping my hospital but have been used in an exercise or event.
[ ] 3: Volunteer numbers are adequate for helping my hospital and have been used in an exercise in the last 5 years.
[ ] 4: Volunteer numbers are adequate for my hospital and have been used in a response.
6. Does your hospital have an identified public information officer? Yes No
7. Does your hospital have any mitigation measures in place specific to the hazard you prioritized that have not been addressed in this tool?
42
Sector: Behavioral Health
County:
Name (s) of Agency Representative(s):
Agency/Organization:
PART IV: BEHAVIORAL HEALTH PARTICIPANT COVER
SHEET
Note: For this activity you will be split into groups according to agency. Each agency represented in this workshop should fill-out a separate mitigation
worksheet. If more than one representative from your agency is present at this workshop, please return a single worksheet for your agency to the form checker.
**Please return your completed worksheet to the form checker**

43
Mitigation – Behavioral Health
8. Please check the box to indicate the status of the following plans specific to your behavioral health center:
0: My
agency has
no plan.
1: My agency
has a written
plan.
2: My agency has a
written plan, and it has
been reviewed in the
past 12 months.
3: My agency has a written plan,
which has been reviewed in the
past 12 months and exercised in
the last 5 years.
4: My agency has a written plan,
which has been reviewed in the
past 12 months and used in a
real event in the last 5 years.
Continuity of Operations
(COOP) Plan
Crisis and Emergency Risk
Communications (CERC) Plan
Patient Evacuation Plan (for
state psychiatric hospitals)
9. Rate the level of Incident Command System (ICS) Training your behavioral health staff have completed:
[ ] 0: No staff have completed ICS training.
[ ] 1: 1-25% of staff have completed ICS training for their respective roles.
[ ] 2: 26-50% of staff have completed ICS training for their respective roles.
[ ] 3: 51-75% of staff have completed ICS training for their respective roles.
[ ] 4: 76-100% of staff have completed ICS training for their respective roles.
10. Prior to this workshop, please check the box to indicate the partnerships your behavioral health center had with the following groups:
0: My agency
does not meet or
communicate with
this group.
1: My agency
has met or
talked with
this group.
2: My agency has a
written understanding
with this group, which
has been reviewed in the
past 12 months.
3: My agency has a written
understanding, which has
been reviewed in the past 12
months and exercised in the
last 5 years.
4: My agency has a written
understanding, which has been
reviewed in the past 12 months and
activated in a real event in the last
5 years.
Local Emergency
Management
Authority/Office of
Emergency Services
City/County/State Law
Enforcement
Local Fire Department
Local Emergency Medical
Services (EMS)
Local Hospitals
County Health
Department

44
Local Pharmacies
Private Behavioral Health
Partners
Local Behavioral Health
Coalitions
Other:
Other:
11. In the past five years, has your behavioral health agency:
Question Event (if applicable) Year (s) Yes No
4a. Required additional staffing for an event?
4b. Implemented Memorandums of Understanding
(MOUs) with partners?
4c. Been a partner in shelter set-up and/or management?
4d. Conducted an emergency notification drill for staff?
4e. Communicated emergency information to the public?
4f. Utilized volunteers for a real event?
4g. Used radios in a drill, exercise or event?
4h. Shared your MOUs with relevant partners? (i.e. to
assess overlap of services)
12. Rate the volunteer groups in your community, as a whole, which behavioral health can rely on. Groups may include, but are not limited to, the American Red
Cross, Salvation Army, MRC, CERT, Volunteer Organizations Active in Disasters (VOAD), faith-based groups, Boy Scouts/Girl Scouts/4-H, etc.
[ ] NA: My behavioral health center does not rely on/engage volunteers in response
[ ] 0: No active volunteer groups exist in my community.
[ ] 1: Volunteer numbers are inadequate for helping behavioral health and have not been used in an exercise or event.
[ ] 2: Volunteer numbers are inadequate for helping behavioral health but have been used in an exercise or event.
[ ] 3: Volunteer numbers are adequate for helping behavioral health and have been used in an exercise in the last 5 years.
[ ] 4: Volunteer numbers are adequate for behavioral health and have been used in a response.
13. Please check the box to indicate the status of the following behavioral health teams within your community:
0: No such team
exists within my
community.
1: A plan exists to
form this team
within my
community.
2: An informal
team has been
formed within my
community.
3: A formal team has been
created in my community
and members have been
trained.
4: The formal team exists,
members have been trained, and
the team is active in my
community.
Community Assessment
Teams
Crisis Intervention Teams
45
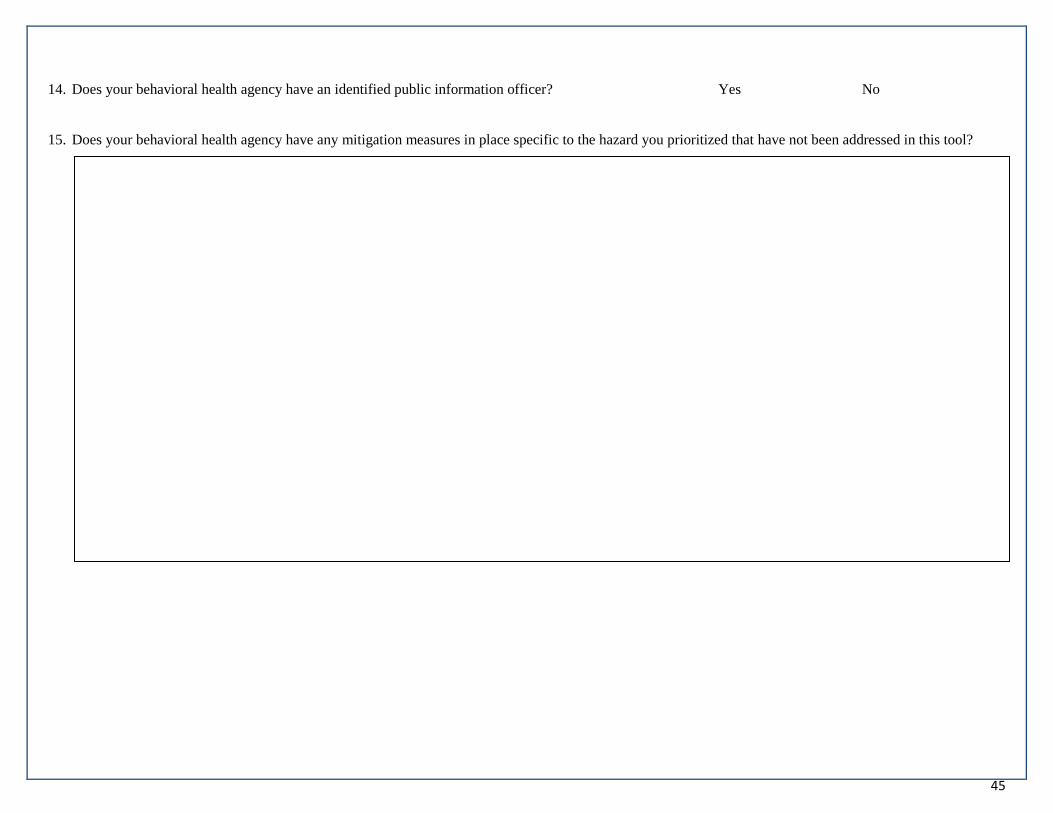
14. Does your behavioral health agency have an identified public information officer? Yes No
15. Does your behavioral health agency have any mitigation measures in place specific to the hazard you prioritized that have not been addressed in this tool?
46
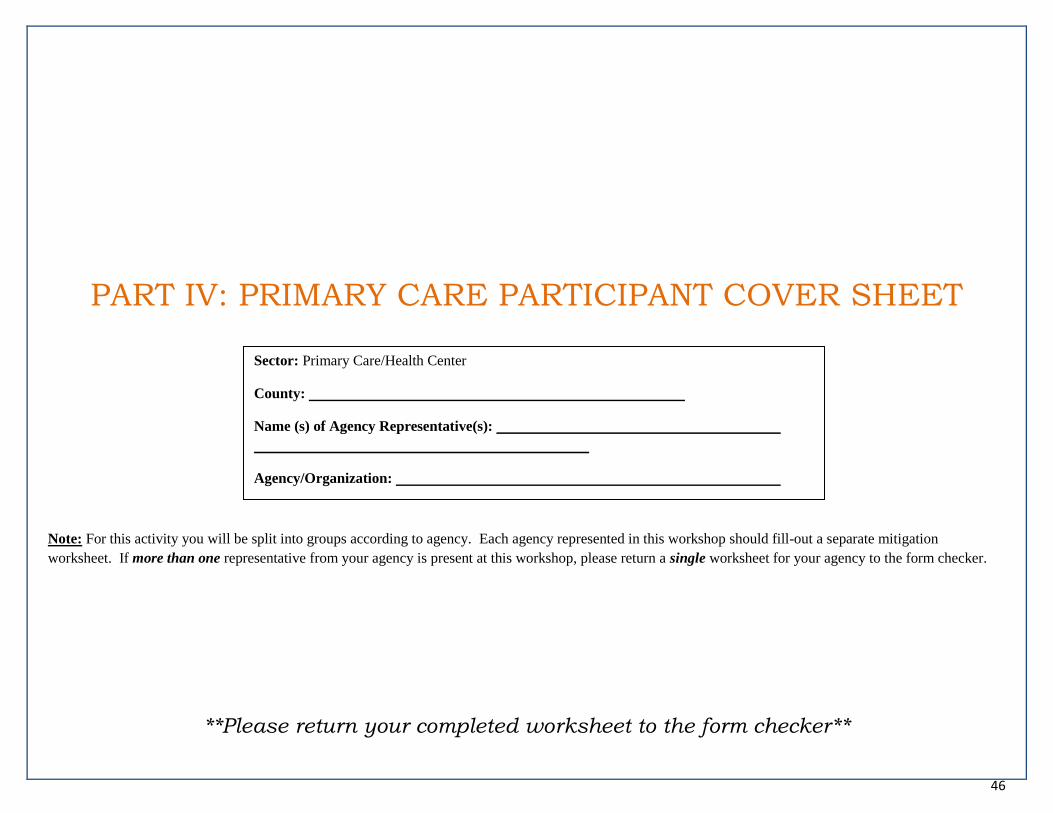
Sector: Primary Care/Health Center
County:
Name (s) of Agency Representative(s):
Agency/Organization:
PART IV: PRIMARY CARE PARTICIPANT COVER SHEET
Note: For this activity you will be split into groups according to agency. Each agency represented in this workshop should fill-out a separate mitigation
worksheet. If more than one representative from your agency is present at this workshop, please return a single worksheet for your agency to the form checker.
**Please return your completed worksheet to the form checker**

47
Mitigation – Primary Care/Health Center
The next set of questions is focused on primary care centers in your county. The term “primary care center” may include: Federally Qualified Health Centers,
Federally Qualified Health Center lookalikes, community health centers, free clinics, rural health centers, etc.
1. Please check the box to indicate the status of the following plans specific to your health center:
0: My agency
has no plan.
1: My agency
has a written
plan.
2: My agency has a
written plan, and it has
been reviewed in the
past 12 months.
3: My agency has a written
plan, which has been reviewed
in the past 12 months and
exercised in the last 5 years.
4: My agency has a written
plan, which has been reviewed
in the past 12 months and used
in a real event in the last 5
years.
Emergency Operations Plan
Annex specific to the top
hazard identified in this
workshop
Emergency Management Plan
Individual “Code Response”
Policy
Patient Evacuation Plans
Plans for Drills and Exercises
for Various Event Responses
2. Rate the level of Incident Command System (ICS) Training your health center staff members have completed.
[ ] NA: No agency representative is present at this workshop
[ ] 0: No staff have completed ICS training.
[ ] 1: 1-25% of staff have completed ICS training for their respective roles.
[ ] 2: 26-50% of staff have completed ICS training for their respective roles.
[ ] 3: 51-75% of staff have completed ICS training for their respective roles.
[ ] 4: 76-100% of staff have completed ICS training for their respective roles.

48
3. Prior to this workshop, please check the box to indicate the partnerships your health center had with the following groups:
0: My agency
does not meet or
communicate with
this group.
1: My agency
has met or
talked with this
group.
2: My agency has a
written understanding
with this group,
which has been
reviewed in the past
12 months.
3: My agency has a written
understanding, which has been
reviewed in the past 12 months
and exercised in the last 5
years.
4: My agency has a written
understanding, which has been
reviewed in the past 12 months
and activated in a real event in the
last 5 years.
Local Emergency
Management
Authority/Office of
Emergency Services
City/County/State Law
Enforcement
Local fire department
Local Emergency Medical
Services (EMS)
County Health Department
Local Hospital
Local Pharmacies
Local Behavioral Health
Centers
Local Emergency Planning
Committee (LEPC)
Other:
Other:
4. In the past five years, has your health center:
Question Event (if applicable) Year (s) Yes No
4a. Required additional staffing for an event?
4b. Implemented Memorandums of Understanding
(MOUs) with partners?
4c. Been a partner in shelter set-up and/or management?
4d. Conducted an emergency notification drill for staff?
4e. Communicated emergency information to the public?
4f. Utilized volunteers for a real event?
4g. Used radios in a drill, exercise or event?
4h. Shared your MOUs with relevant partners? (i.e. to
assess overlap of services)

49
5. Rate the volunteer groups in your community, as a whole, which your health center can rely on. Groups may include, but are not limited to, the American Red
Cross, Salvation Army, MRC, CERT, Volunteer Organizations Active in Disasters (VOAD), faith-based groups, Boy Scouts/Girl Scouts/4-H, etc.
[ ] NA: My health center does not rely on/engage volunteers in response
[ ] 0: No active volunteer groups exist in my community.
[ ] 1: Volunteer numbers are inadequate for helping my health center and have not been used in an exercise or event.
[ ] 2: Volunteer numbers are inadequate for helping my health center but have been used in an exercise or event.
[ ] 3: Volunteer numbers are adequate for helping my health center and have been used in an exercise in the last 5 years.
[ ] 4: Volunteer numbers are adequate for my health center and have been used in a response.
6. Does your health center have an identified public information officer? Yes No
7. Does your health center have any mitigation measures in place specific to the hazard you prioritized that have not been addressed in this tool?

50
Sector: Other
County:
Name (s) of Agency Representative(s):
Agency/Organization:
PART IV: OTHER AGENCY PARTICIPANT COVER SHEET
Note: For this activity you will be split into groups according to agency. Each agency represented in this workshop should fill-out a separate mitigation
worksheet. If more than one representative from your agency is present at this workshop, please return a single worksheet for your agency to the form checker.
**Please return your completed worksheet to the form checker**
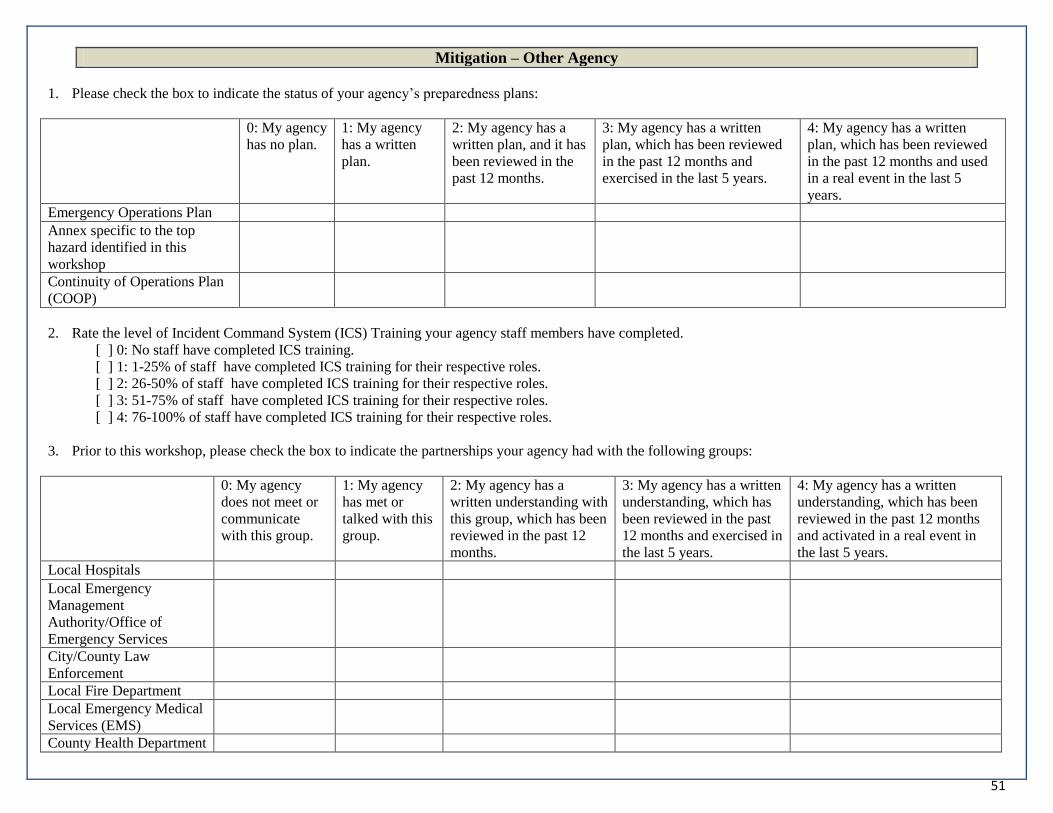
51
Mitigation – Other Agency
1. Please check the box to indicate the status of your agency’s preparedness plans:
0: My agency
has no plan.
1: My agency
has a written
plan.
2: My agency has a
written plan, and it has
been reviewed in the
past 12 months.
3: My agency has a written
plan, which has been reviewed
in the past 12 months and
exercised in the last 5 years.
4: My agency has a written
plan, which has been reviewed
in the past 12 months and used
in a real event in the last 5
years.
Emergency Operations Plan
Annex specific to the top
hazard identified in this
workshop
Continuity of Operations Plan
(COOP)
2. Rate the level of Incident Command System (ICS) Training your agency staff members have completed.
[ ] 0: No staff have completed ICS training.
[ ] 1: 1-25% of staff have completed ICS training for their respective roles.
[ ] 2: 26-50% of staff have completed ICS training for their respective roles.
[ ] 3: 51-75% of staff have completed ICS training for their respective roles.
[ ] 4: 76-100% of staff have completed ICS training for their respective roles.
3. Prior to this workshop, please check the box to indicate the partnerships your agency had with the following groups:
0: My agency
does not meet or
communicate
with this group.
1: My agency
has met or
talked with this
group.
2: My agency has a
written understanding with
this group, which has been
reviewed in the past 12
months.
3: My agency has a written
understanding, which has
been reviewed in the past
12 months and exercised in
the last 5 years.
4: My agency has a written
understanding, which has been
reviewed in the past 12 months
and activated in a real event in
the last 5 years.
Local Hospitals
Local Emergency
Management
Authority/Office of
Emergency Services
City/County Law
Enforcement
Local Fire Department
Local Emergency Medical
Services (EMS)
County Health Department
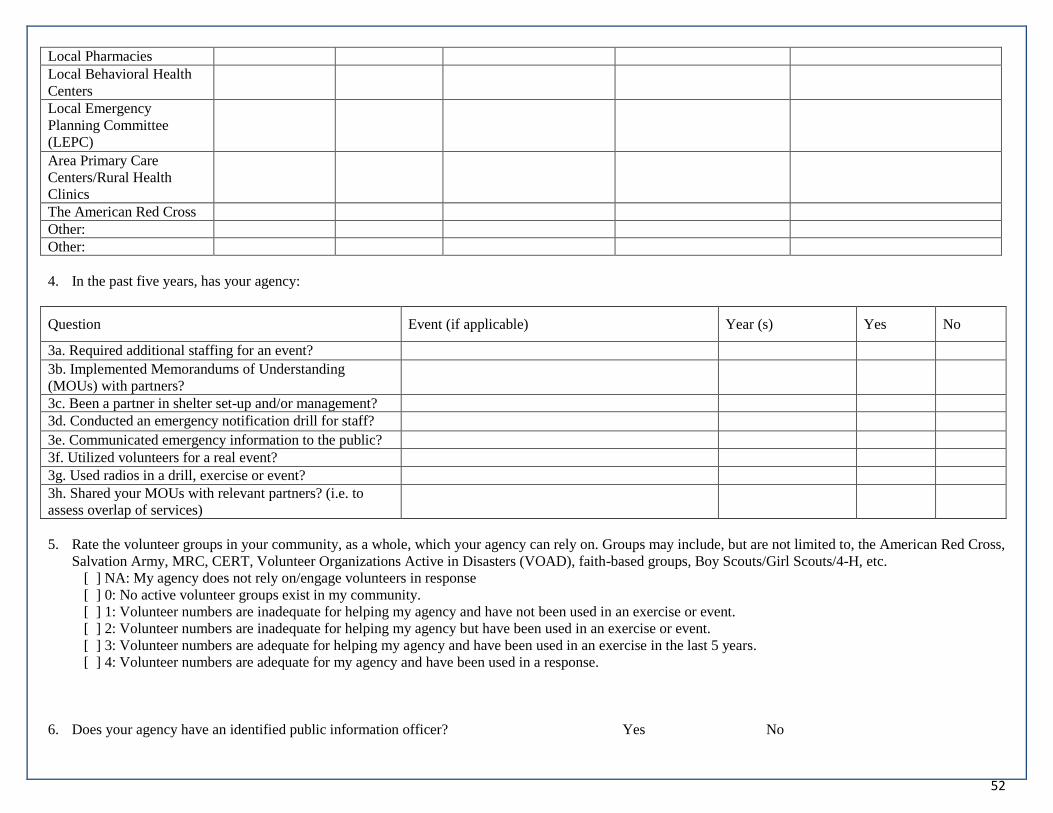
52
Local Pharmacies
Local Behavioral Health
Centers
Local Emergency
Planning Committee
(LEPC)
Area Primary Care
Centers/Rural Health
Clinics
The American Red Cross
Other:
Other:
4. In the past five years, has your agency:
Question Event (if applicable) Year (s) Yes No
3a. Required additional staffing for an event?
3b. Implemented Memorandums of Understanding
(MOUs) with partners?
3c. Been a partner in shelter set-up and/or management?
3d. Conducted an emergency notification drill for staff?
3e. Communicated emergency information to the public?
3f. Utilized volunteers for a real event?
3g. Used radios in a drill, exercise or event?
3h. Shared your MOUs with relevant partners? (i.e. to
assess overlap of services)
5. Rate the volunteer groups in your community, as a whole, which your agency can rely on. Groups may include, but are not limited to, the American Red Cross,
Salvation Army, MRC, CERT, Volunteer Organizations Active in Disasters (VOAD), faith-based groups, Boy Scouts/Girl Scouts/4-H, etc.
[ ] NA: My agency does not rely on/engage volunteers in response
[ ] 0: No active volunteer groups exist in my community.
[ ] 1: Volunteer numbers are inadequate for helping my agency and have not been used in an exercise or event.
[ ] 2: Volunteer numbers are inadequate for helping my agency but have been used in an exercise or event.
[ ] 3: Volunteer numbers are adequate for helping my agency and have been used in an exercise in the last 5 years.
[ ] 4: Volunteer numbers are adequate for my agency and have been used in a response.
6. Does your agency have an identified public information officer? Yes No

53
7. Does your agency have any mitigation measures in place specific to the hazard you prioritized that have not been addressed in this tool?

54
APPENDIX: TERMINOLOGY AND DEFINITIONS
**Please use this appendix for reference throughout the assessment workshop**

55
Terminology and Definitions
At-risk individuals: Individuals who may have greater difficulty accessing the public health and medical services they require following a disaster or emergency.
At-risk individuals have needs in one or more of the following functional areas: communication, medical care, maintaining independence, supervision, and
transportation. At-risk groups may include children, senior citizens, and pregnant women as well as people who have disabilities, live in institutionalized settings,
are from diverse cultures, have limited English proficiency or are non-English speaking, are transportation disadvantaged, have chronic medical disorders, or have
pharmacological dependency. At-risk individuals were formerly referred to as “special needs” or “vulnerable” populations.1
Behavioral Health Center: Includes any office/center whose primary mission is to provide behavioral health care. Behavioral health is defined as the blending of
substance (alcohol, drugs, and tobacco) abuse and mental health disorders prevention and treatment for the purpose of providing comprehensive services.
Community Resilience: The ongoing and developing capacity of the community to account for its vulnerabilities and develop capabilities that aid that community
in (1) preventing, withstanding, and mitigating the stress of a health incident; (2) recovering in a way that restores the community to a state of self-sufficiency and
at least the same level of health and social functioning after the health incident; and (3) using knowledge from a past response to strengthen the community’s
ability to withstand the next health incident.2
Hazard: Source of danger.
Health: State of physical, mental and social wellbeing and not merely the absence of disease or infirmity; condition of being sound in body, mind or spirit.
Hospital: Includes urban, rural and behavioral health hospitals.
Mitigation: The strategies and resources used by agencies, individuals and communities to eliminate or reduce the frequency, magnitude or severity of a hazard
event.
Other agency: Includes any agencies that have the potential to participate in or assist with local public health emergencies or disaster response.
Primary Care Center: Includes any office/center whose primary mission is to provide primary care. The term “primary care center” may include: Federally
Qualified Health Centers, Federally Qualified Health Center lookalikes, free clinics, rural health centers, etc.
Risk: Expected loss; probability of the hazard occurring multiplied by the impact of the hazard minus the measures in place to mitigate the hazard’s impact.
Vulnerability: Open to attack, damage or being wounded. “Vulnerability is the pre-event, inherent characteristics or qualities of a social system that create
potential harm. Vulnerability is a function of exposure (who or what is at risk) and sensitivity to the system (the degree to which people and places can be
harmed)”.3
1 Assistant Secretary for Preparedness and Response (ASPR) (April 23, 2012). At-Risk Individuals. In Public Health Emergency. Retrieved April 30, 2012 from
http://www.studygs.net/citation.htm.
2 Chandra A, Acosta J, Stern S, Uscher-Pines L, Williams MV, Yeung D, Garnett J, and Meredith LS, Building Community Resilience to Disasters: A Way Forward to Enhance
National Health Security, Santa Monica, California: RAND Corporation, TR-915-DHHS, 2010 (http://www.rand.org/pubs/technical_reports/TR915.html).
3 Cutter, Susan L., Lindsey Barnes, Melissa Berry, Christopher Burton, Elijah Evans, Eric Tate, and Jennifer Webb. 2008. A place-based model for understanding community
resilience to natural disasters. Global Environmental Change, 18(4), 598-606.